Multidata Study to Evaluate the Impact of Submarine Outfall in a Beach Sedimentary Dynamic: The Case of Samil Beach (Galicia, Spain)


Abstract
:1. Introduction
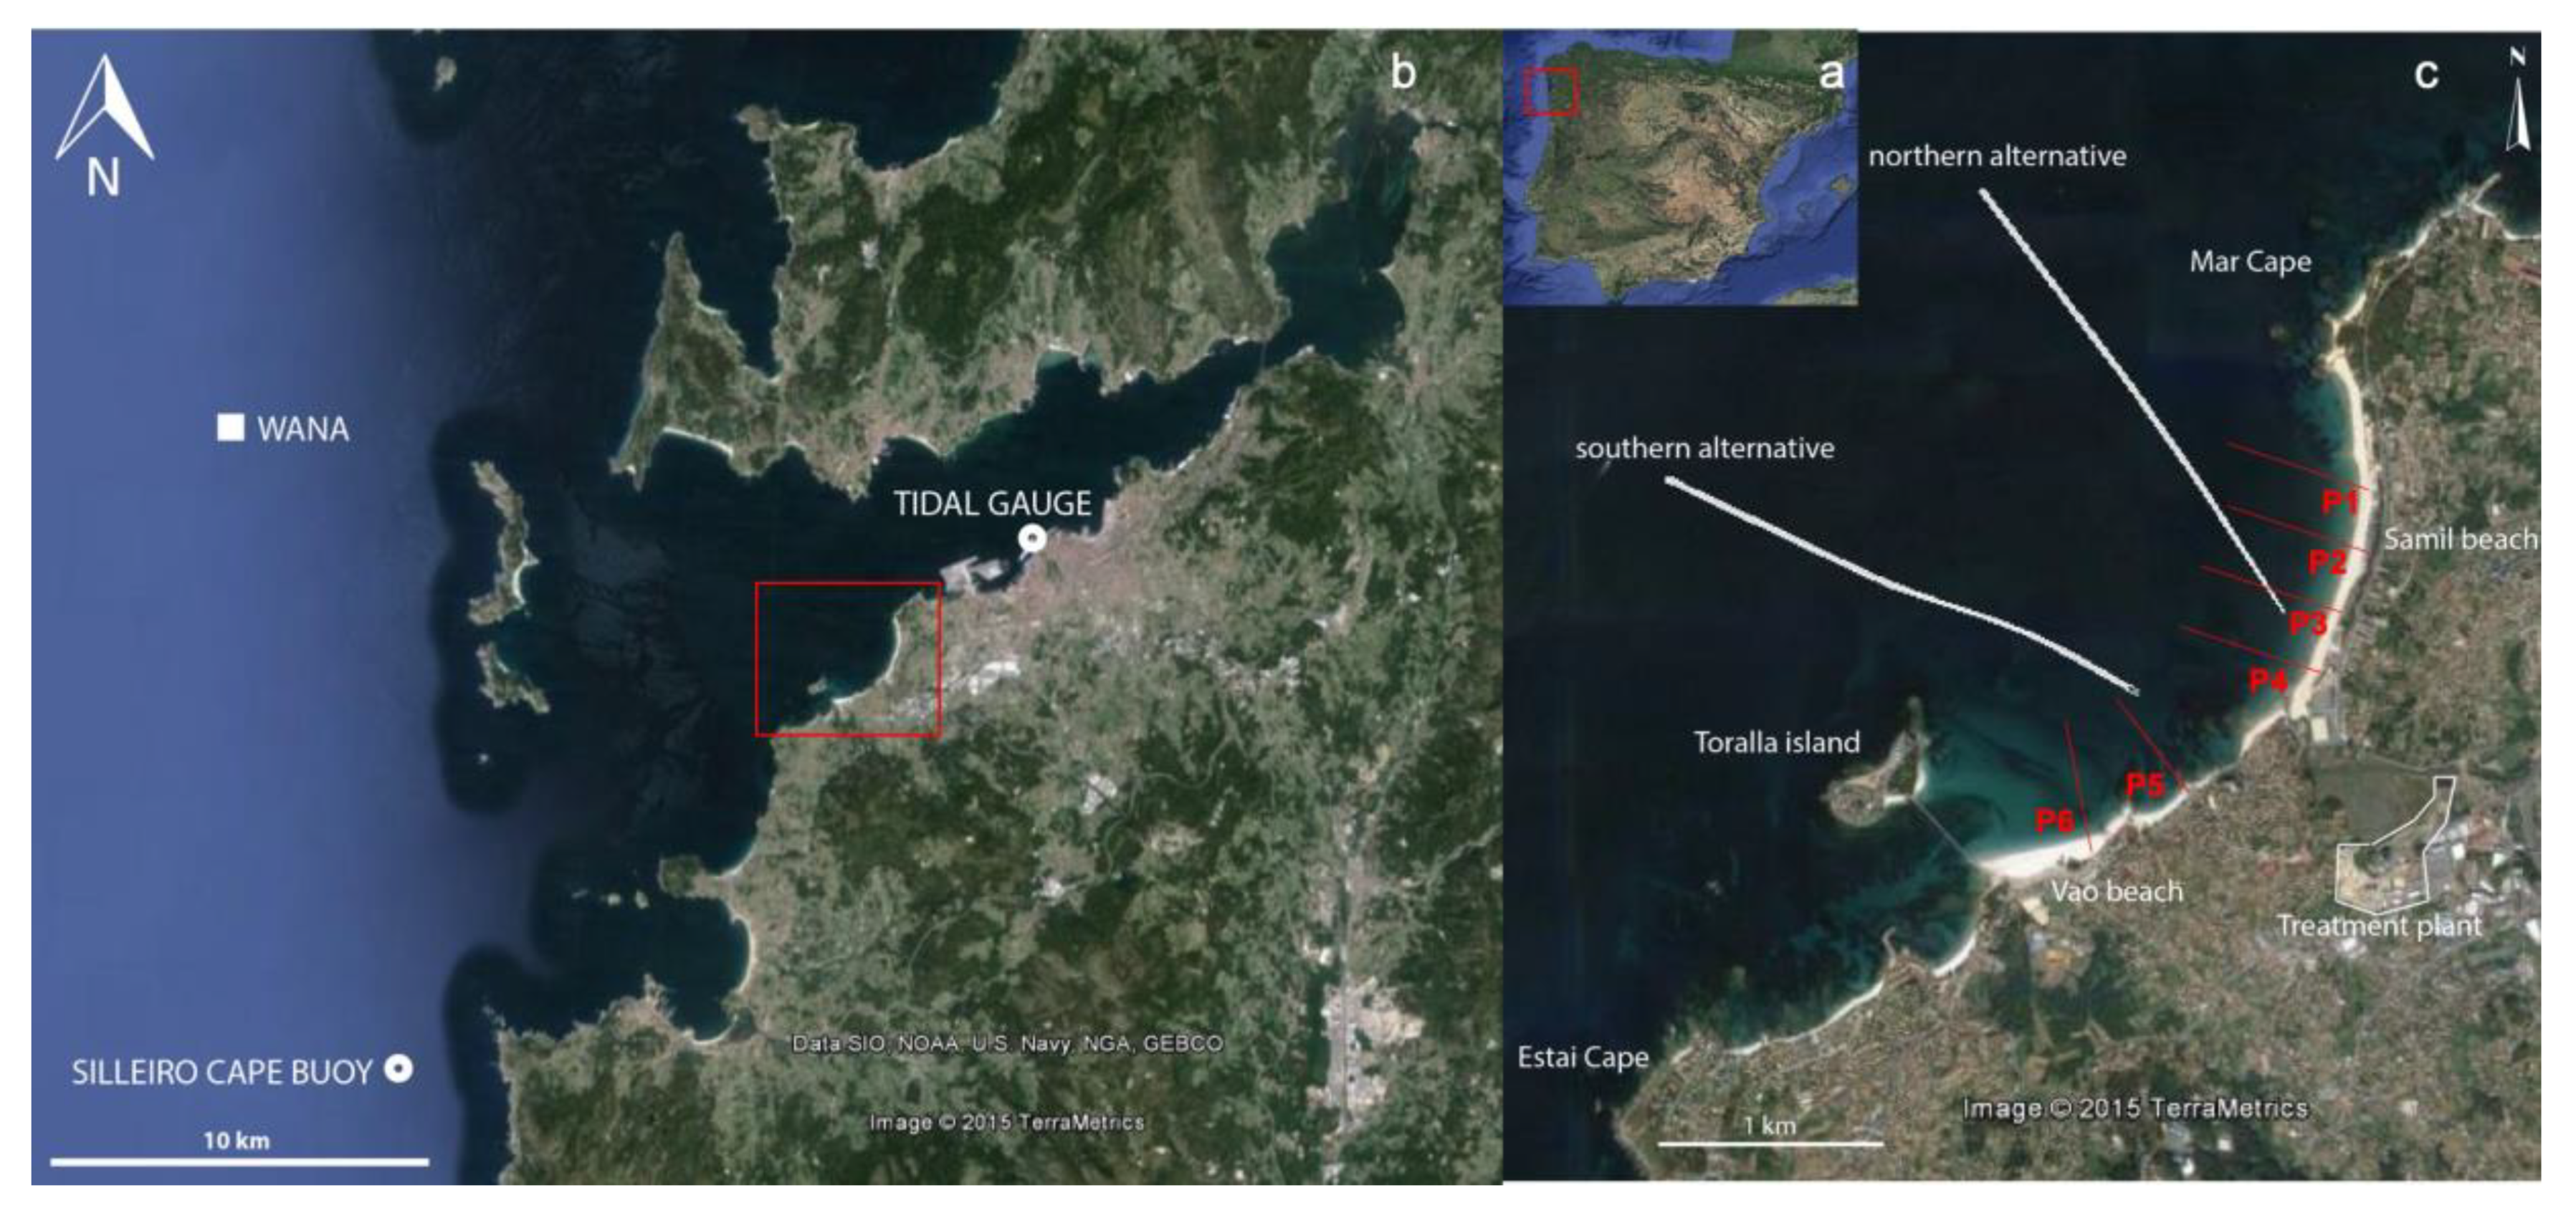
2. Study Area
Characteristics and Alternative Routes of the Submarine Pipeline
3. Methodology
3.1. Field Work
3.2. Laboratory Work
3.3. Database
3.4. Numerical Simulations
3.5. Birkermeier (1985) Equation of Closure Depth
4. Results
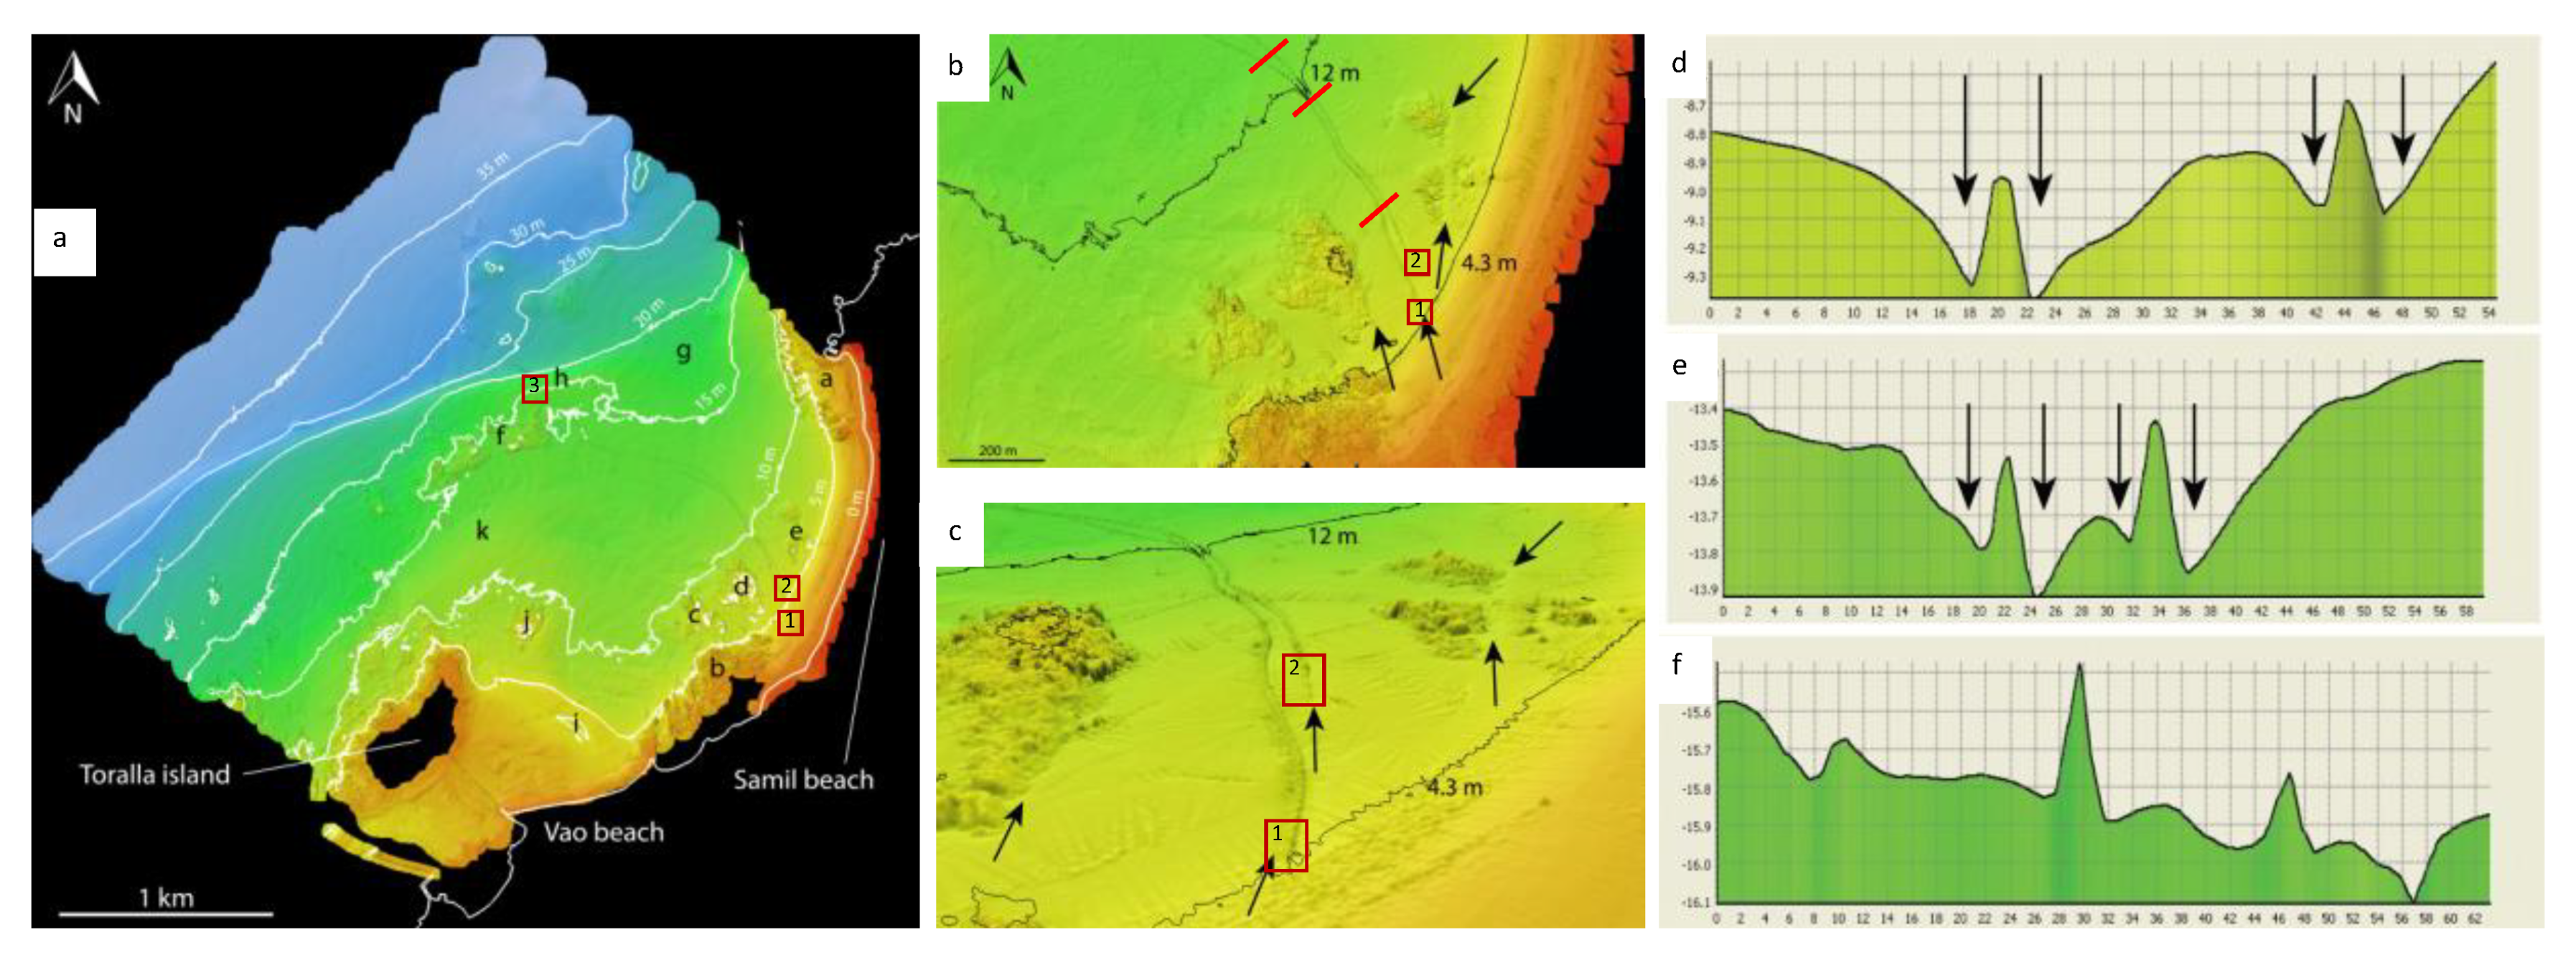
4.1. Bathymetry
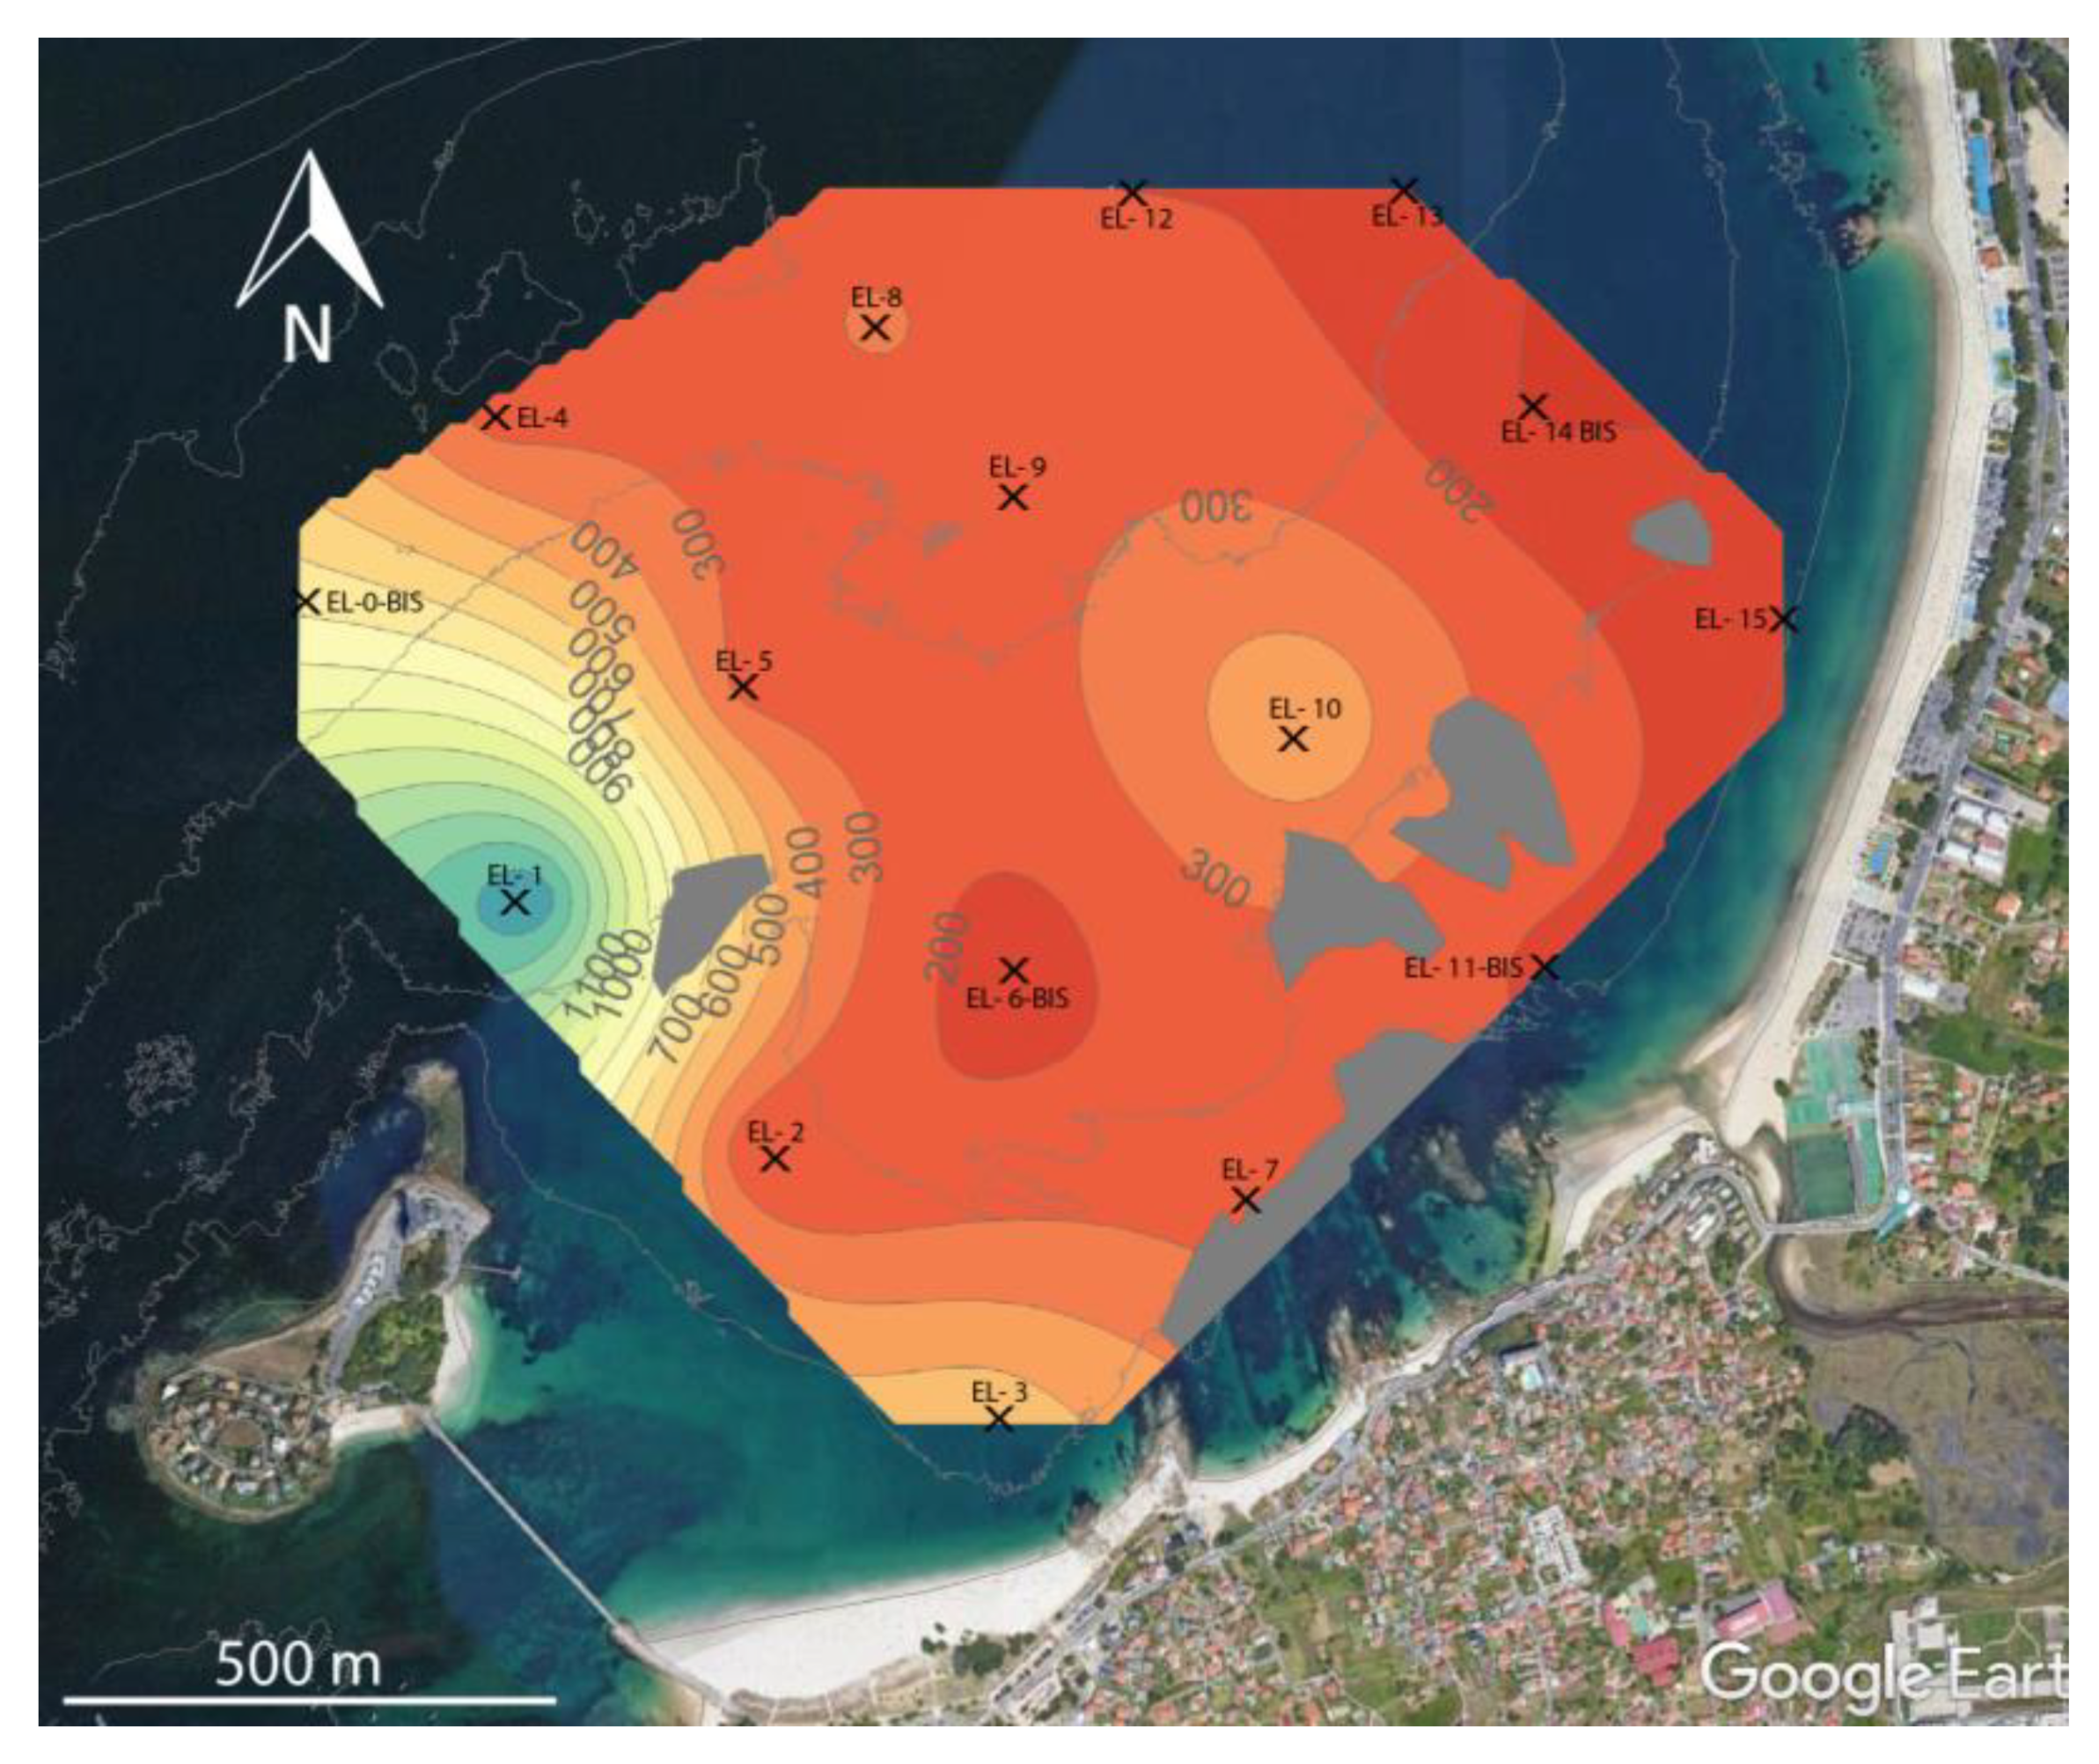
4.2. Surficial Grain Size Distribution
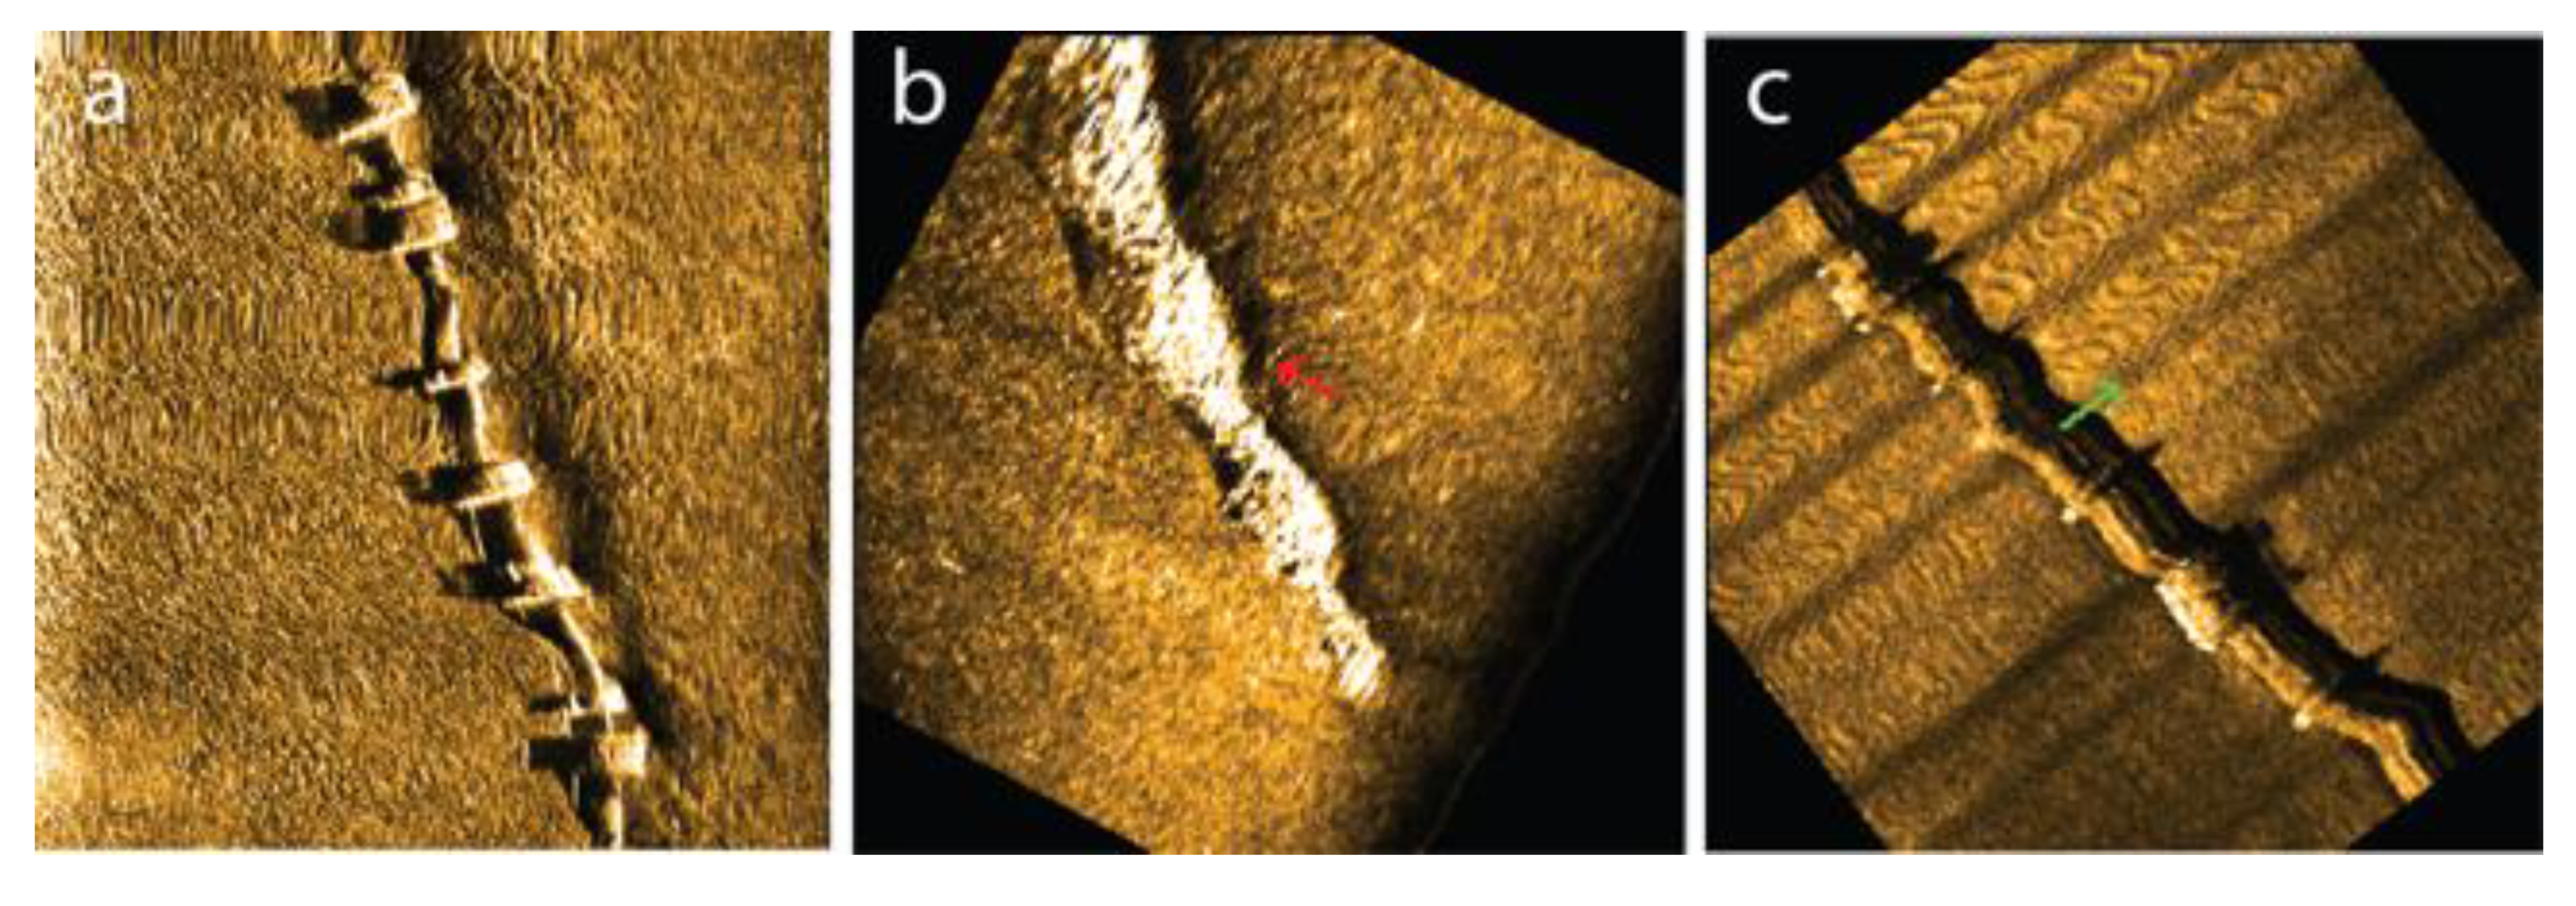
4.3. Side Scan Sonar (SSS)
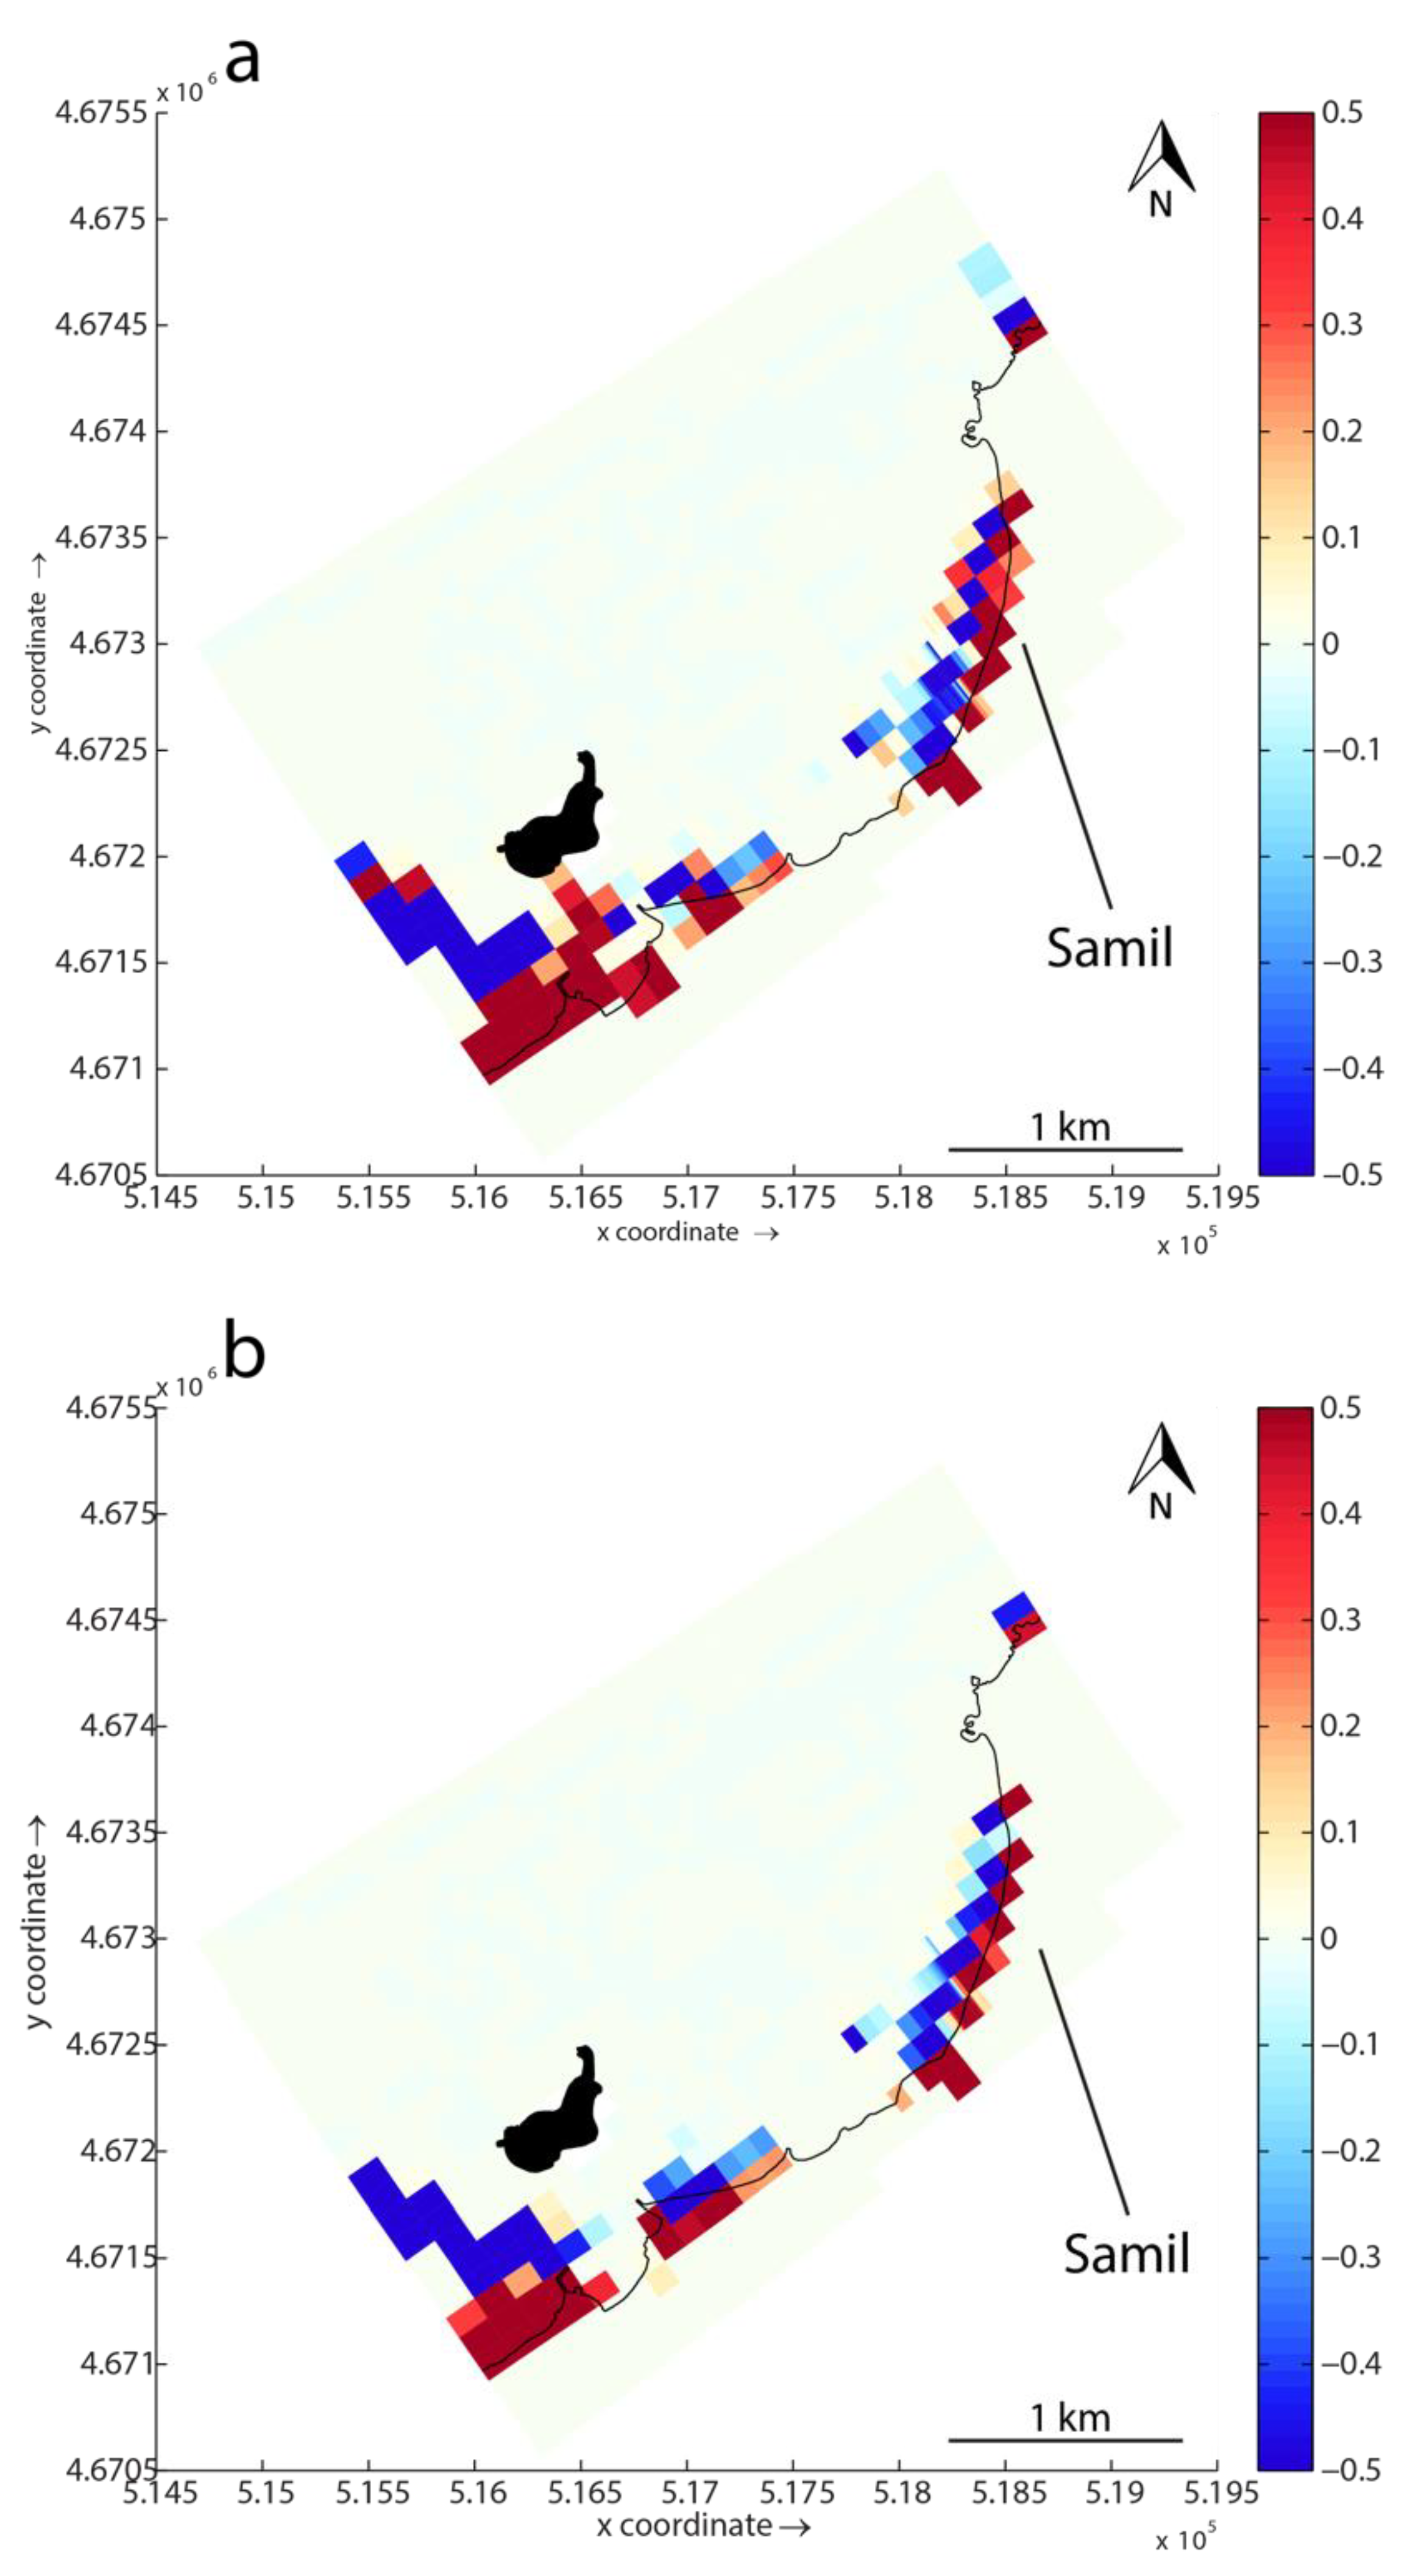
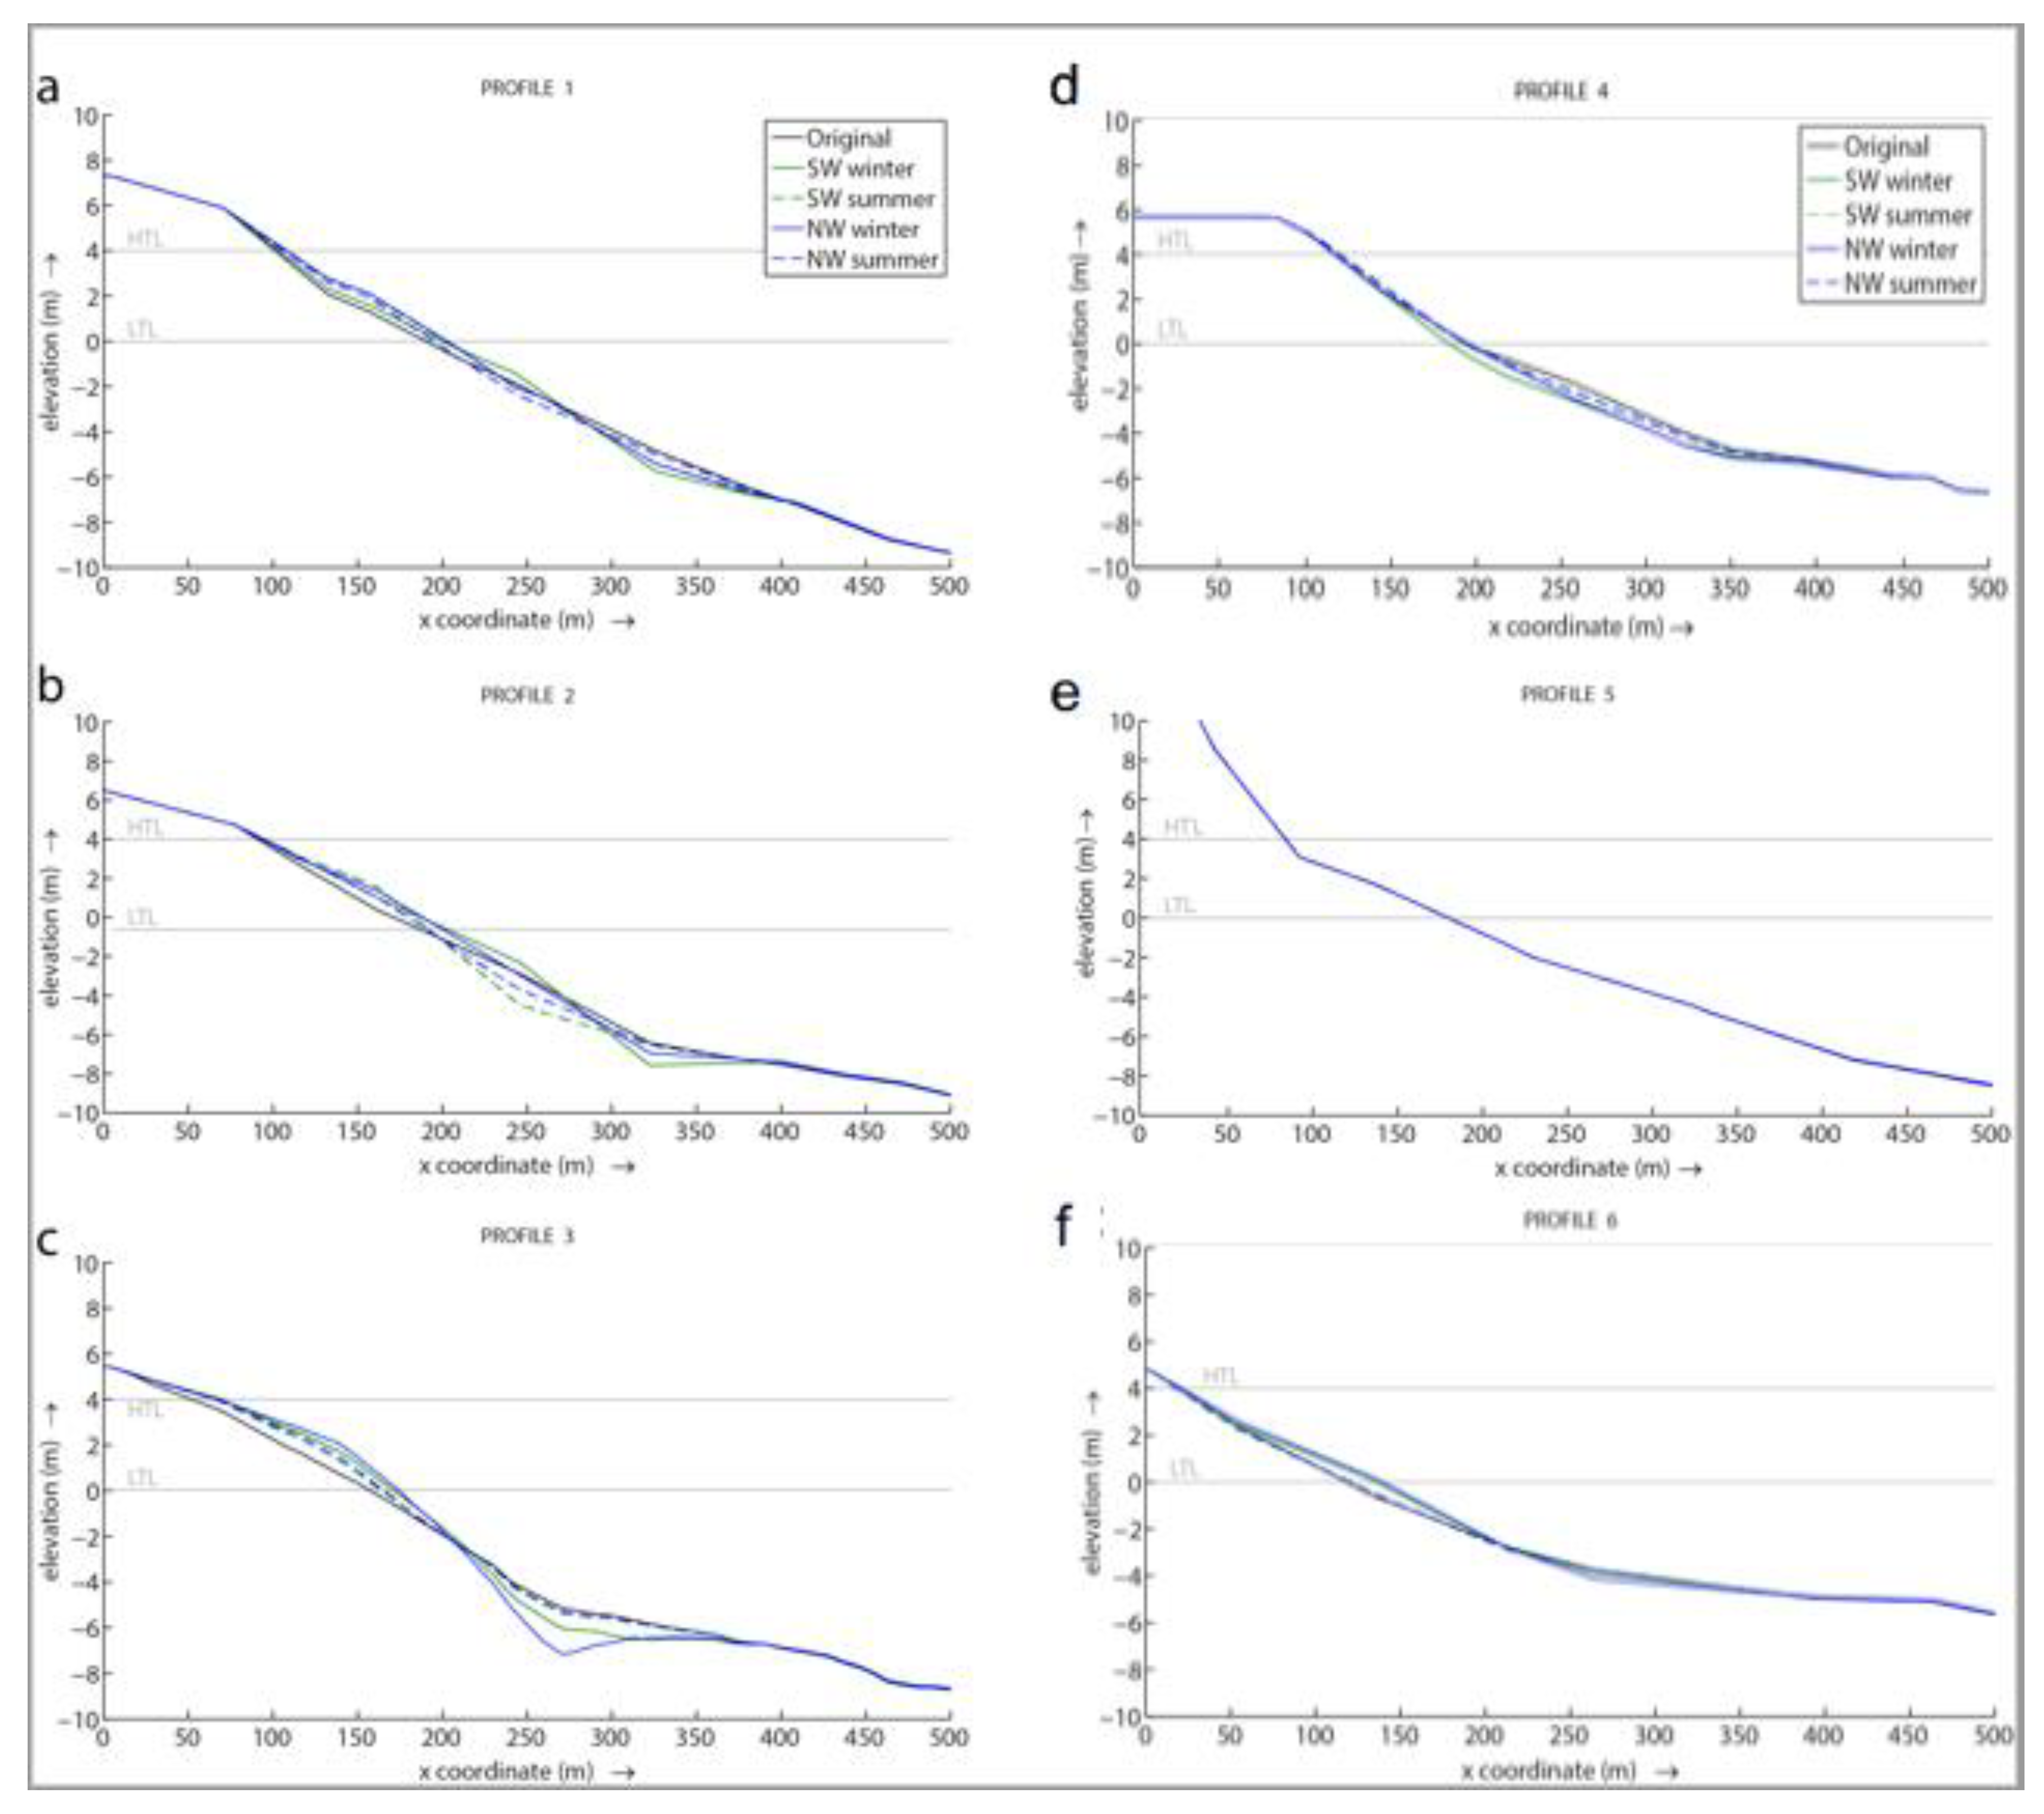
4.4. Seasonal Dynamics of Samil Beach
4.5. Modelling of the Different Route Alternatives
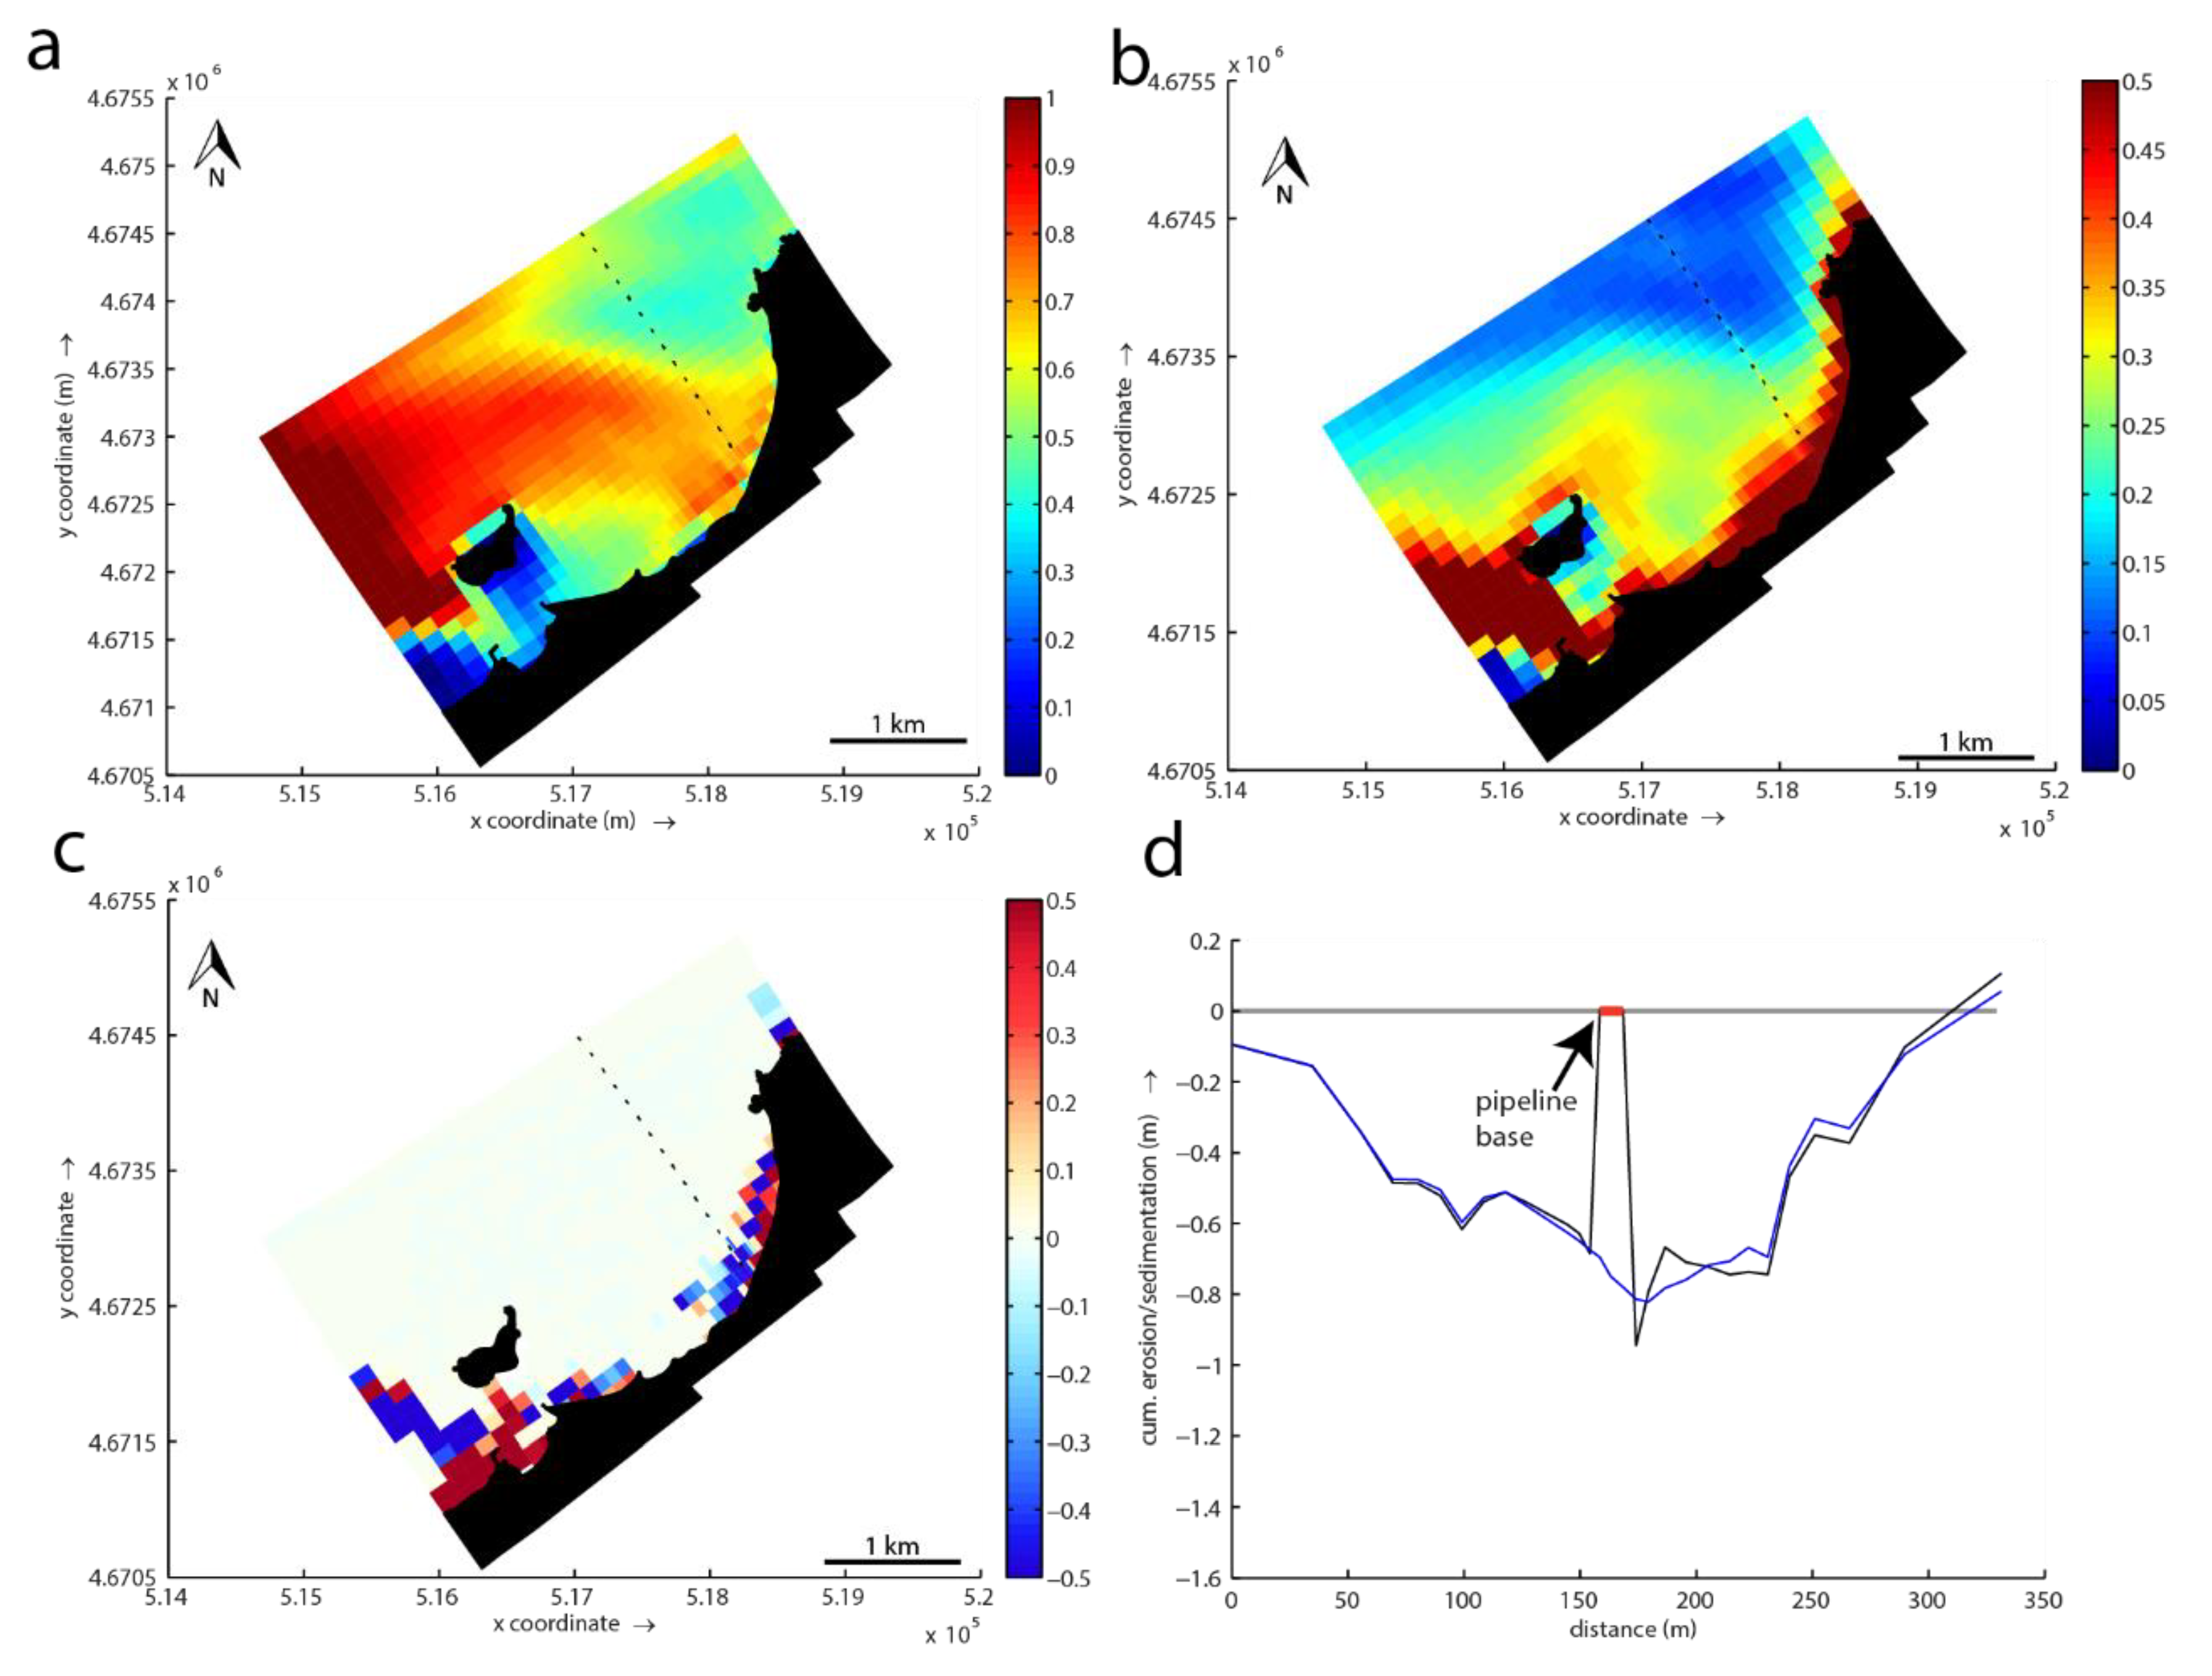
4.5.1. Southern Route Alternative
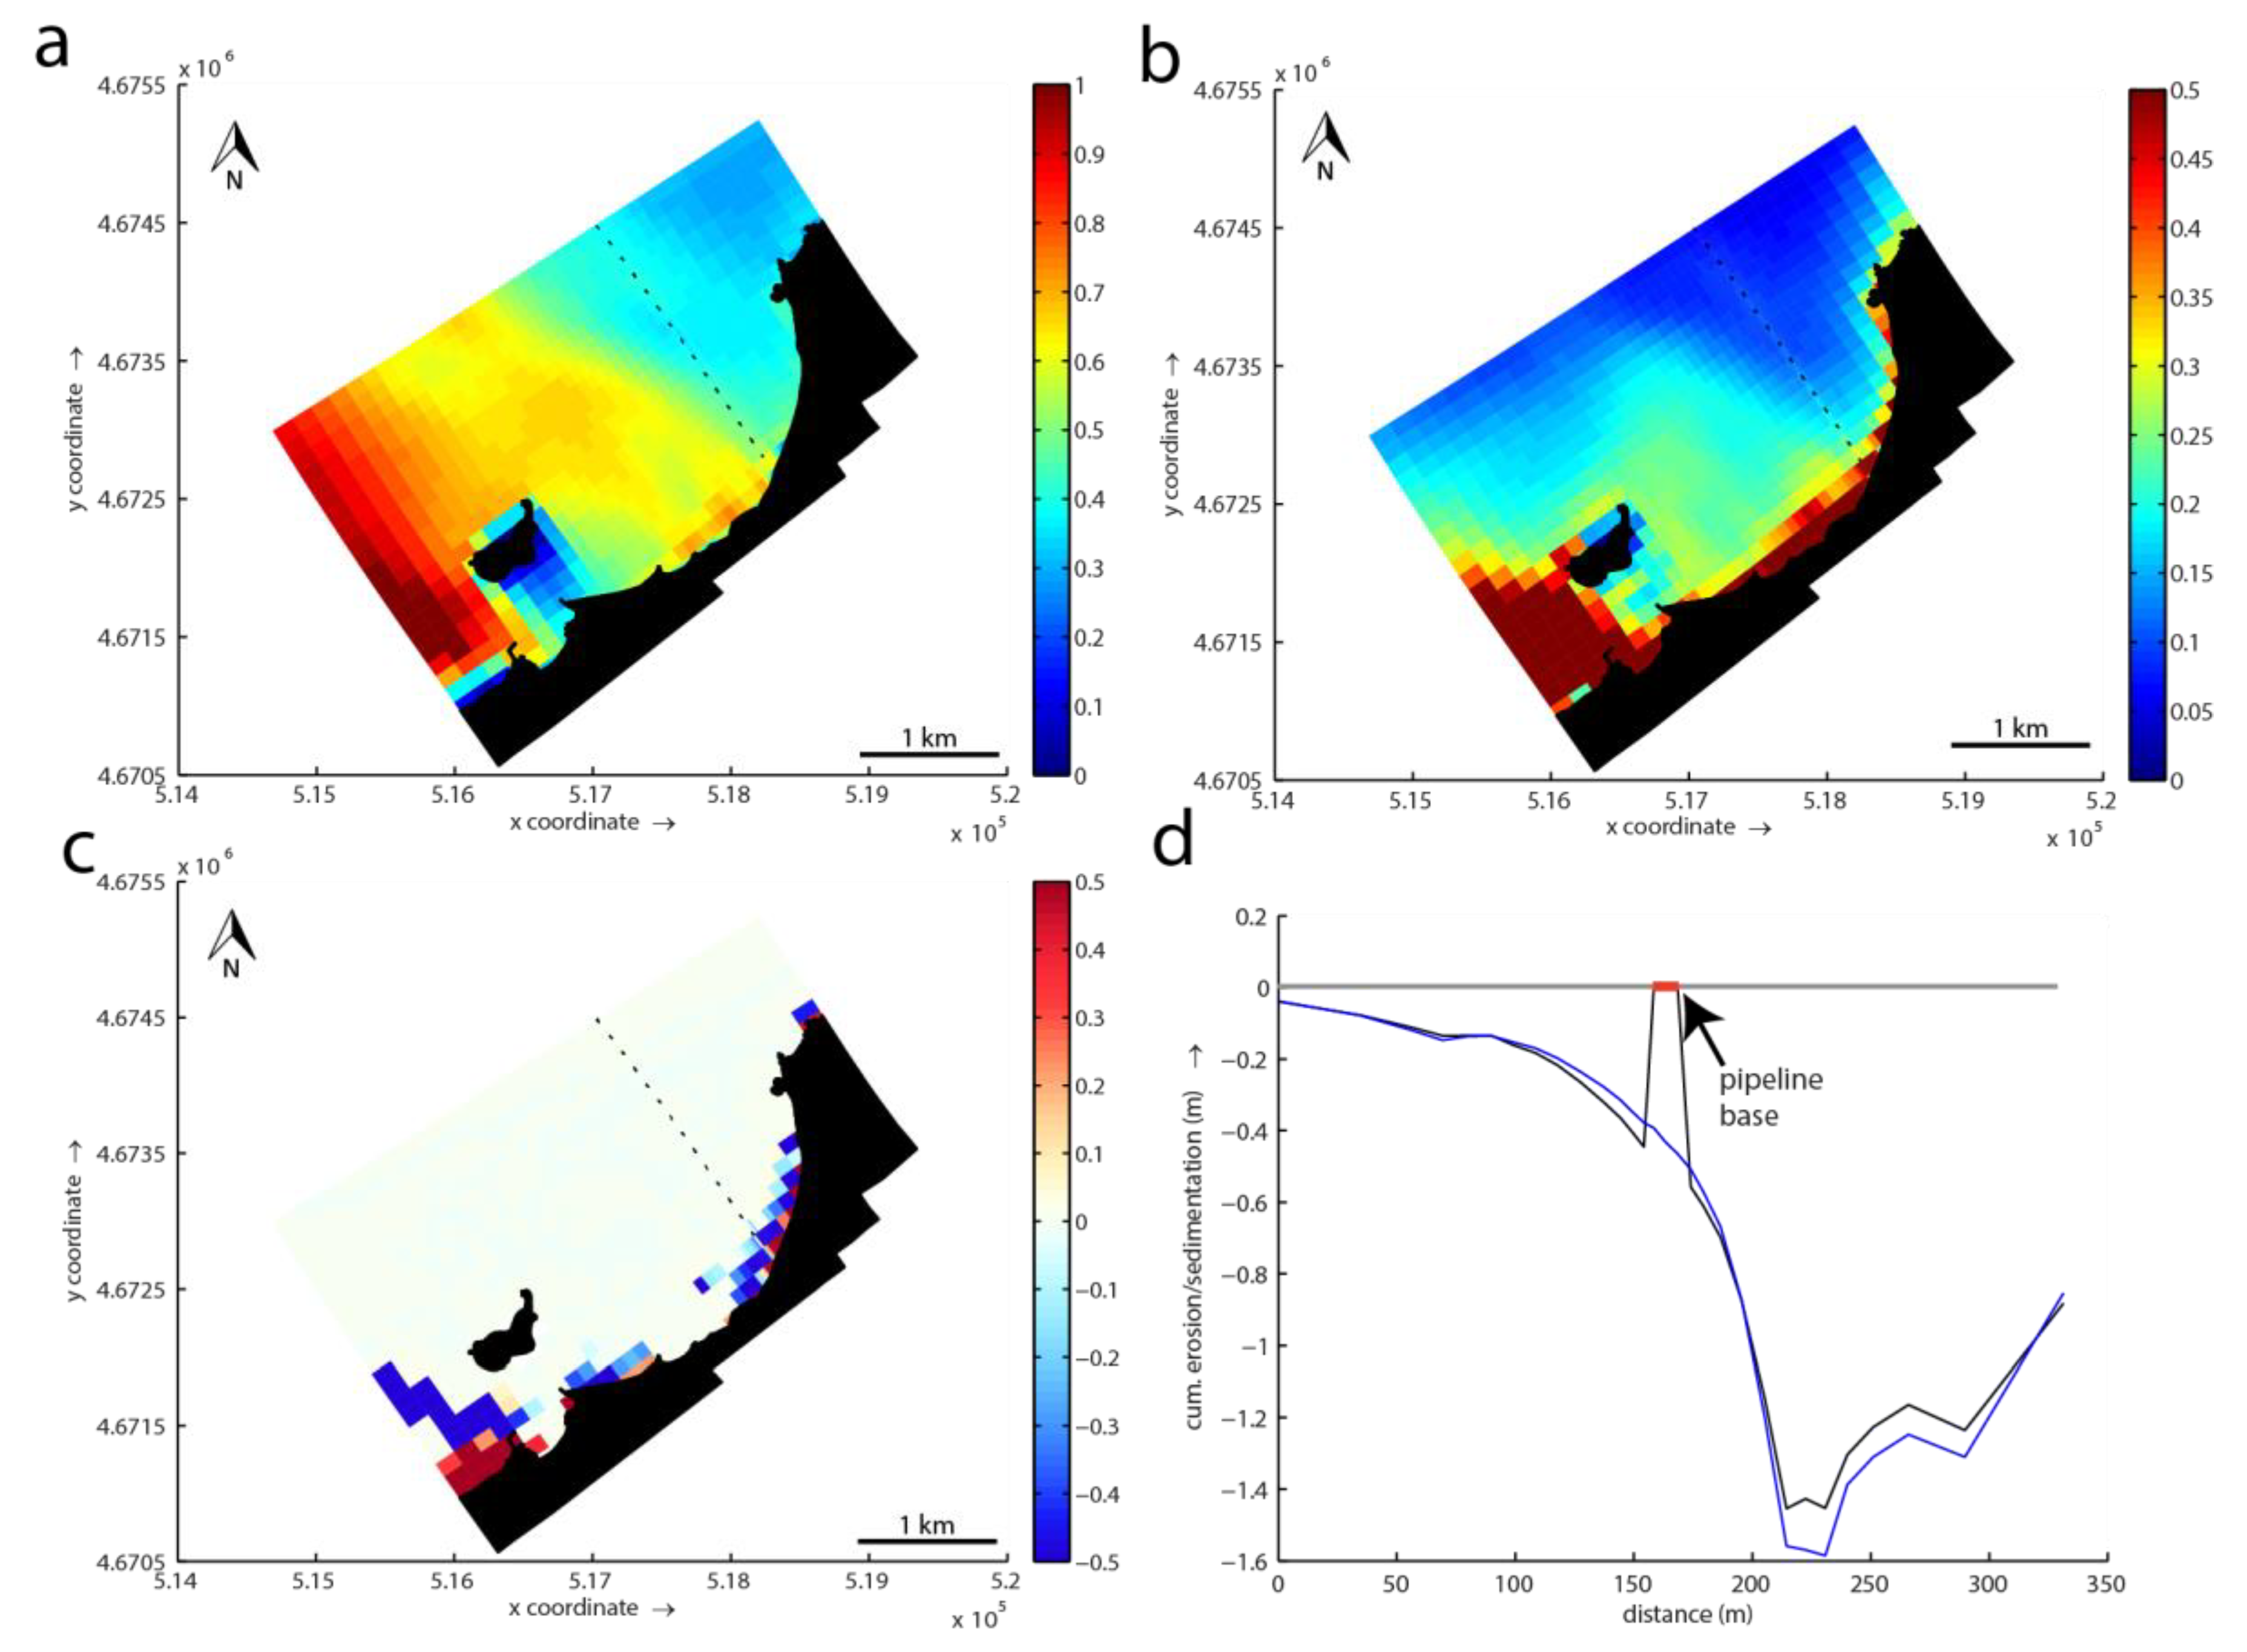
4.5.2. Northern Route Alternative
5. Discussion
5.1. Effect of the Pipeline Route Alternatives on the Beach and Alternative Selection
5.2. Pipeline Emerging Depth in the Northern Route
6. Conclusions
Author Contributions
Funding
Conflicts of Interest
References
- Brown, A.; McLachlan, A. Sandy shore ecosystems and the threats facing them: Some predictions for the year 2025. Environ. Conserv. 2002, 29, 62–77. [Google Scholar] [CrossRef] [Green Version]
- Merkens, J.-L.; Reimann, L.; Hinkel, J.; Vafeidis, A.T. Gridded population projections for the coastal zone under the Shared Socioeconomic Pathways. Glob. Planet. Chang. 2016, 145, 57–66. [Google Scholar] [CrossRef] [Green Version]
- Gracia, A.; Rangel-Buitrago, N.; Oakley, J.A.; Williams, A.T. Use of ecosystems in coastal erosion management. Ocean Coast. Manag. 2018, 156, 277–289. [Google Scholar] [CrossRef]
- Rizzeto, F. Effects of climate change on the morphological stability of Mediterranean coasts: Consequences for Tourism. In Climate Change Management; Springer: Basel, Switzerland, 2020; pp. 761–775. [Google Scholar]
- Marchand, M.; Sanchez-Arcilla, A.; Ferreira, M.; Gault, J.; Jiménez, J.A.; Markovice, M.; Mulder, J.; VanRijn, L.; Stănicăf, A.; Suliszg, W.; et al. Concepts and science for coastal erosion management—An introduction to the Conscience framework. Ocean Coast. Manag. 2011, 54, 859–866. [Google Scholar] [CrossRef]
- Thorne, K.M.; Elliot-Fisk, D.L.; Freeman, C.M.; Bui, T.D.; Powelson, K.W.; Janousek, C.N.; Buffington, K.J.; Takekawa, J.Y. Are coastal managers ready for climate hange? A case study from estuaries along the Pacific coast of the United States. Ocean Coast. Manag. 2017, 143, 38–50. [Google Scholar] [CrossRef]
- Siders, A.; Keenan, J.M. Variables shaping coastal adaptation decisions to armor, nourish, and retreat in North Carolina. Ocean Coast. Manag. 2020, 183, 105023. [Google Scholar] [CrossRef]
- Cooper, J.A.G.; O’Connor, M.C.; McIvor, S. Coastal defences versus coastal ecosystems: A regional appraisal. Mar. Policy 2020, 111, 102332. [Google Scholar] [CrossRef]
- Ranasinghe, R.; Turner, I.L. Shoreline response to submerged structures: A review. Coast. Eng. 2006, 53, 65–79. [Google Scholar] [CrossRef]
- Schoonees, T.; Gijón Mancheño, A.; Scheres, B.; Bouma, T.J.; Silva, R.; Schlurmann, T.; Schüttrumpf, H. Hard Structures for Coastal Protection, Towards Greener Designs. Estuaries Coasts 2019, 42, 1709–1729. [Google Scholar] [CrossRef]
- Molina, R.; Anfuso, G.; Manno, G.; Gracia, J. The Mediterranean Coast of Andalusia (Spain): Medium-Term Evolution and Impacts of Coastal Structures. Sustainability 2019, 11, 3539. [Google Scholar] [CrossRef] [Green Version]
- Nemes, D.D.; Criado-Sudau, F.F.; Gallo, N.M. Beach Morphodynamic Response to a Submerged Reef. Water 2019, 11, 340. [Google Scholar] [CrossRef] [Green Version]
- Torres-Freyermuth, A.; Medellín, G.; Mendoza, E.T.; Ojeda, E.; Salles, P. Morphodynamic Response to Low-Crested Detached. Breakwaters on a Sea Breeze-Dominated Coast. Water 2019, 11, 635. [Google Scholar] [CrossRef] [Green Version]
- Ming, D.; Chiew, Y.-M. Shoreline changes behind detached breakwater. J. Waterw. Port Coast. Ocean Eng. 2000, 126, 63–70. [Google Scholar] [CrossRef]
- Ruiz-Martínez, G.; Mariño-Tapia, I.; Mendoza Baldwin, E.G.; Silva, R.; Enríquez Ortiz, C.E. Identifying Coastal Defence Schemes through Morphodynamic Numerical Simulations along the Northern Coast of Yucatan, Mexico. J. Coast. Res. 2016, 32, 651–669. [Google Scholar]
- Bouvier, C.; Castelle, B.; Balouin, Y. Modeling the Impact of the Implementation of a Submerged Structure on Surf Zone Sandbar Dynamics. J. Mar. Sci. Eng. 2019, 7, 117. [Google Scholar] [CrossRef] [Green Version]
- Klonaris, G.T.; Metallinos, A.S.; Memos, C.D.; Galani, K.A. Experimental and numerical investigation of bed morphology in the lee of porous submerged breakwaters. Coast. Eng. 2020, 155, 103591. [Google Scholar] [CrossRef]
- Bernabeu, A.M.; Lersundi-Kanpistegi, A.V.; Vilas, F. Gradation from oceanic to estuarine beaches in a ria environment: A case study in the Ria de Vigo. Estuar. Coast. Shelf Sci. 2012, 102–103, 60–69. [Google Scholar] [CrossRef]
- Vilas, F.; Bernabeu, A.M.; Méndez, G. Sediment distribution pattern in the Rias Baixas (NW Spain): Main facies and hydrodynamic implications. J. Mar. Syst. 2005, 54, 261–276. [Google Scholar] [CrossRef]
- Castro, M.; Gómez-Gesteira, M.; Prego, R.; Taboada, J.J.; Montero, P.; Herbello, P.; Pérez-Villar, V. Wind and tidal influence on water circulation in a Galician ria (NW Spain). Estuar. Coast. Shelf Sci. 2000, 51, 161–176. [Google Scholar] [CrossRef]
- Huthnance, J.M.; Van Aken, H.M.; White, M.; Barton, E.D.; Le Cann, B.; Coelho, E.F.; Fanjul, E.A.; Miller, P.; Vitorino, J. Ocean margin exchange—Water flux estimates. J. Mar. Syst. 2002, 32, 107–137. [Google Scholar] [CrossRef]
- Ruiz-Villarreal, M.; Montero, P.; Taboada, J.J.; Prego, R.; Leitao, P.C.; Pérez-Villar, V. Hydrodynamic model study of the Ria de Pontevedra under estuarine conditions. Estuar. Coast. Shelf Sci. 2002, 54, 101–113. [Google Scholar] [CrossRef]
- Pérez-Arlucea, M.; Mendez, G.; Clemente, F.; Nombela, M.; Rubio, B.; Filgueira, M. Hydrology, sediment yield, erosion and sedimentation rates, in the estuarine environment of the Ria de Vigo, Galicia, Spain. J. Mar. Syst. 2005, 54, 209–226. [Google Scholar] [CrossRef]
- Del Estado, P. Recomendaciones para Obras Marítimas (ROM) 0.3–91, 1991: Oleaje; Anejo, I., Ed.; Clima marítimo en el litoral español. Puertos del Estado; Ministerio de Transportes, Movilidad y Agenda Urbana: Madrid, Spain, 1991.
- Rey, D.; Mohamed, K.J.; Bernabeu, A.; Rubio, B.; Vilas, F. Early diagenesis of magnetic minerals in marine transitional environments: Geochemical signatures of hydrodynamic forcing. Mar. Geol. 2005, 215, 215–236. [Google Scholar] [CrossRef]
- Varela, R.A.; Rosón, G. A general study of the Spanish North Atlantic boundaries: An interdisciplinary approach. J. Mar. Syst. 2005, 54, 1. [Google Scholar] [CrossRef]
- Lorente, P.; Sotillo, M.G.; Aouf, L.; Amo-Baladrón, A.; Barrera, E.; Dalphinet, A.; Toledano, S.; Rainaud, R.; De Alfonso, M.; Piedracoba, S.; et al. Extreme wave height events in NW Spain: A combined multi-sensor and model approach. Remote Sens. 2018, 10, 1. [Google Scholar] [CrossRef] [Green Version]
- Blott, S.J.; Pye, K. GRADISTAT: A grain size distribution and statistics package for the analysis of unconsolidated sediments. Earth Surf. Proc. Landf. 2001, 26, 1237–1248. [Google Scholar] [CrossRef]
- Folk, R.L. The distribution between grain size and mineral composition in sedimentary rock nomenclature. J. Geol. 1954, 62, 344–359. [Google Scholar] [CrossRef]
- Folk, R.L.; Ward, W.C. Brazos River bar: A study in the significance of grain size parameters. J. Sedimentol. Petrol. 1957, 27, 3–26. [Google Scholar] [CrossRef]
- Booij, N.; Ris, R.C.; Holthuijsen, L.H. A third-generation wave model for coastal regions 1. Model description and validation. J. Geophys. Res. 1999, 104, 7649–7666. [Google Scholar] [CrossRef] [Green Version]
- Birkemeier, W. Field Data on Seaward Limit of Profile Change. J. Waterw. Port Coast. Ocean Eng. 1985, 111, 598–602. [Google Scholar] [CrossRef] [Green Version]
- Vila-Concejo, A.; Alejo, I.; Vilas, F. Monitoring of a beach with a strong anthropogenic impact by means of topographic survey and bathymetric surveys, Samil Beach, Spain. Shore Beach 2002, 70, 3–10. [Google Scholar]


| Cases | Direction (°) | Hs (m) | Tp (s) | F. Direction % | F. Seasonal % |
|---|---|---|---|---|---|
| SW winter | 225 | 2.5 | 14 | 7.5 | 2.5 |
| SW summer | 225 | 1.5 | 10 | 7.5 | 10.5 |
| NW winter | 315 | 2.5 | 14 | 50.6 | 2.5 |
| NW summer | 315 | 1.5 | 10 | 50.6 | 10.5 |
| Open Sea | Studied Area | Propagation Coefficient | ||
|---|---|---|---|---|
| H (m) | Direction | H (m) | Direction | |
| Winter Conditions | ||||
| 2.5 | 315° (NW) | 0.5–0.8 | 310° | 20–32% |
| 2.5 | 225° (SW) | 0.8–1.0 | 300° | 32–40% |
| Summer Conditions | ||||
| 1.5 | 315° (NW) | 0.3–0.5 | 20–33% | |
| 1.5 | 225° (SW) | 0.4–0.6 | 26–40% | |
| Data Type | Closure Depth (m) |
|---|---|
| Scientific literature | 8–12 |
| Birkemeier (1985) equation | 11.9 (10.36–12.47) |
| Multibeam echosounder bathymetry | 12 |
| Side Scan Sonar | 12 |
| Delft3D model | 7.4 |
© 2020 by the authors. Licensee MDPI, Basel, Switzerland. This article is an open access article distributed under the terms and conditions of the Creative Commons Attribution (CC BY) license (http://creativecommons.org/licenses/by/4.0/).
Share and Cite
Lersundi-Kanpistegi, A.; Bernabeu, A.M.; Rey, D.; Díaz, R. Multidata Study to Evaluate the Impact of Submarine Outfall in a Beach Sedimentary Dynamic: The Case of Samil Beach (Galicia, Spain). J. Mar. Sci. Eng. 2020, 8, 461. https://doi.org/10.3390/jmse8060461
Lersundi-Kanpistegi A, Bernabeu AM, Rey D, Díaz R. Multidata Study to Evaluate the Impact of Submarine Outfall in a Beach Sedimentary Dynamic: The Case of Samil Beach (Galicia, Spain). Journal of Marine Science and Engineering. 2020; 8(6):461. https://doi.org/10.3390/jmse8060461
Chicago/Turabian StyleLersundi-Kanpistegi, Aimar, Ana M. Bernabeu, Daniel Rey, and Rafael Díaz. 2020. "Multidata Study to Evaluate the Impact of Submarine Outfall in a Beach Sedimentary Dynamic: The Case of Samil Beach (Galicia, Spain)" Journal of Marine Science and Engineering 8, no. 6: 461. https://doi.org/10.3390/jmse8060461