Article

Effects of Ocean Acidification and Summer Thermal Stress on the Physiology and Growth of the Atlantic Surfclam (Spisula solidissima)

1
Haskin Shellfish Research Laboratory, Department of Marine and Coastal Sciences, Rutgers, The State University of New Jersey, 6959 Miller Avenue, Port Norris, NJ 08349, USA
2
Marine Science & Conservation, Duke University, Durham, NC 27708, USA
3
NOAA Fisheries Service, Northeast Fisheries Science Center, 212 Rogers Avenue, Milford, CT 06460, USA
*
Author to whom correspondence should be addressed.
J. Mar. Sci. Eng. 2024, 12(4), 673; https://doi.org/10.3390/jmse12040673
Submission received: 14 March 2024 / Revised: 11 April 2024 / Accepted: 15 April 2024 / Published: 18 April 2024
(This article belongs to the Special Issue Impacts of Climate Change on Shellfisheries)

Abstract

:
This study examines the physiological response of the Atlantic surfclam (Spisula solidissima) to ocean acidification in warm summer temperatures. Working with ambient seawater, this experiment manipulated pH conditions while maintaining natural diel fluctuations and seasonal shifts in temperature. One-year-old surfclams were exposed to one of three pH conditions (ambient (control): 7.8 ± 0.07, medium: 7.51 ± 0.10, or low: 7.20 ± 0.10) in flow-through conditions for six weeks, and feeding and digestive physiology was measured after one day, two weeks, and six weeks. After six weeks of exposure to medium and low pH treatments, growth was not clearly affected, and, contrastingly, feeding and digestive physiology displayed variable responses to pH over time. Seemingly, low pH reduced feeding and absorption rates compared to both the medium treatment and ambient (control) condition; however, this response was clearer after two weeks compared to one day. At six weeks, suppressed physiological rates across both pH treatments and the ambient condition suggest thermal stress from high ambient water temperatures experienced the week prior (24–26 °C) dominated over any changes from low pH. Results from this study provide important information about reduced energy acquisition in surfclams in acidified environments and highlight the need for conducting multistressor experiments that consider the combined effects of temperature and pH stress.

1. Introduction

The Atlantic surfclam (Spisula solidissima) (hereafter, surfclam) is a widely distributed species along the Atlantic coast of North America, from the Gulf of St. Lawrence to Cape Hatteras, North Carolina [1,2]. Surfclams support recreational fisheries in Atlantic Canada and Maine and large commercial fisheries throughout the Mid-Atlantic region of the United States [3]. In 2022, over 20 thousand metric tons of surfclams were landed in the United States. Federal management of the surfclam fishery since 1977 in the United States has provided detailed datasets describing surfclam populations and distributions, and it has been observed that surfclam populations are shifting, moving both northward and offshore into deeper, cooler waters [4,5]. Although temperature and food availability are understood to be major drivers of the distribution of marine bivalves, other water quality parameters, including those related to carbonate chemistry, play roles in the growth, survival, and, ultimately, the distribution of this commercially important species.
Ocean acidification (OA) is the process by which atmospheric CO2 is absorbed by oceans, thus altering the carbonate chemistry of water [6]. As more CO2 is absorbed, concentrations of ρCO2 and HCO3 increase, while pH and the saturation state of calcium carbonate minerals (Ω), including calcite and aragonite, decrease. Ocean acidification varies spatially and may be influenced by spatial differences in ocean chemistry, temperature, salinity, and interactions with atmospheric ρCO2 [7]. Generally, in the Mid- to North-Atlantic regions of the United States, ρCO2 concentrations increase on a northward gradient along surfclam habitats [8]. Carbonate chemistry often also varies with depth, and it is influenced by primary productivity, mixing events, and freshwater input [9]. The complex shifts in carbonate chemistry have nuanced effects on marine bivalves, which may be specific to species, biological processes, and life history.
As calcifying organisms rely on calcium carbonate polymorphs (aragonite, in the case of the surfclam) for shell formation, much of the initial research on the effects of OA on marine bivalves was focused on relationships with shell formation and dissolution, particularly at vulnerable larval life stages [10,11]. Generally, bivalve larvae are more vulnerable to the effects of OA in terms of shell formation and shell deformities than adult conspecifics. Ωaragonite saturation states below 1.5 have been suggested as a general threshold below which shell formation is affected in bivalve larvae [12]; however, success at lower saturation states has been observed (e.g., [11]). Beyond the direct relationship between altered carbonate chemistry and shell calcification, the effects of OA on bivalves have been explored in terms of energetic processes, specifically energy acquisition (feeding and absorption) and expenditure (metabolic rate and excretion), and overall scope for growth [13,14,15,16,17]. The effects of OA on these different physiological rates and processes vary between species, experimental treatments, and experiment duration. Generally, prolonged exposure to lowered pH/increased ρCO2 causes reductions in the overall energy budget through either decreased feeding and absorption or increased metabolic rate. However, in some cases, little to no effect is observed, even across months of exposure [14,18]. Due to the highly variable responses of bivalves to OA in terms of physiological energetics, there remain many unknowns about potential effects to species across their natural ranges.
The Atlantic surfclam makes a good model organism for OA experiments as a widely distributed species, with research supported by the management of commercial fisheries and recent studies examining genetic responses to environmental stress (e.g., [19]). Recently, the first studies on the effects of OA on surfclams were published [15,20], and this work builds upon those efforts. Although OA laboratory experiments often target single ρCO2 and pH levels, here, we aim to maintain constant pH offsets from ambient conditions. Working with natural seawater, this experiment is designed to manipulate pH while maintaining natural fluctuations and seasonal shifts in salinity, temperature, oxygen, and diet composition. For this experiment, we exposed one-year-old surfclams to three pH conditions (ambient (control): 7.8 ± 0.07, medium: 7.51 ± 0.10, or low: 7.20 ± 0.10) in flow-through natural seawater for six weeks. During this time, surfclam physiology and growth were measured after one day, two weeks, and six weeks. We hypothesized that decreases in pH would affect feeding and digestive physiology and resulting overall growth rates. Additionally, we predicted that acclimation to pH treatments would occur, and that the physiological response would be reduced over time. This research contributes to the knowledge of how the physiology and overall growth of benthic marine organisms will respond to changes in carbonate chemistry driven by OA.

2. Materials and Methods

2.1. Animal Husbandry

Juvenile Atlantic surfclams (Spisula solidissima) were shipped from the Downeast Institute (Beals, Maine) to the New Jersey Aquaculture Innovation Center (Cape May, NJ, USA) on 28 September 2022. Surfclams were spawned at the Downeast Institute in the spring of 2022 using wild surfclams collected from Deer Isle, Maine. When the surfclams arrived, they were held in recirculating, treated seawater tanks with the water temperature chilled to match that of their holding temperature in Maine (15 °C). The water temperature was increased 1 °C/day until ambient temperature was reached (18 °C). At that time, surfclams were transferred into ambient flow-through raceway tanks of raw seawater and held on 1000 μm upweller screens. Seawater was pumped directly from the Cape May canal. Upwellers were rinsed with raw seawater daily to avoid excess biofouling and sediment buildup. Surfclams were maintained in upwellers until June 2023, when the experiment began.

2.2. Experimental Design

Ninety surfclams with similar shell lengths (32.49 ± 1.70 mm) were randomly selected and assigned into one of three pH treatments: ambient (control), medium, and low (n = 30 surfclams/treatment). Assigned surfclams were placed in their respective experimental treatment from June 6 (experiment start) to 19 July 2023 (experiment end). Unfiltered seawater was pumped directly from the Cape May canal to the experimental system into a single common cylindrical header tank (300 L), which flowed into three smaller cylindrical header tanks (200 L each). Each of these three smaller header tanks was used to establish different experimental pH treatments. No manipulation was applied to the ambient condition. For the medium and low pH treatments, food-grade CO2 (99% purity, Kean Gas) was delivered to these header tanks to maintain the pH levels. Delivery of CO2 was achieved using Nalgene tubing from the compressed gas and bubbling in CO2 directly to the header tanks using air stones. Variable pH levels, consistently offset from ambient pH, were achieved between the header tanks using gas flow meters. From each of the small header tanks, water flowed through rectangular plexiglass tanks (vol: 75.5 L), with each containing three polycarbonate vinyl plastic (PCV) upwellers (1 mm mesh size) and each containing 10 clams. Flow-rates through each upweller were maintained at 1.5–2 L min−1. During the experiment, surfclams were fed only on natural diets in ambient seawater, and no manipulation of temperature or salinity was applied to the treatments.

2.3. Environmental Monitoring

Water quality (temperature, salinity, oxygen concentration, and pH) was recorded every 15 min in the medium pH treatment header tank using a YSI Exo Sonde 3 (YSI, Yellow Springs, OH, USA. It was assumed that beyond pH, all other water quality parameters were the same in each header tank. To confirm this, and to measure the pH of the control and low pH treatments, the same YSI was also used once daily to take measurements of water quality in all experimental tanks containing surfclams. Once per week, 300 mL water samples were collected from each experimental tank and fixed with 0.3 mL of mercury chloride for carbonate chemistry analysis (dissolved inorganic carbon (DIC), total alkalinity, and total pH). Samples were preserved in 300 mL glass bottles until analysis was performed at the NOAA Milford Laboratory. Dissolved inorganic carbon was analyzed using an Apollo SciTech DIC Analyzer (Apollo SciTech, LLC, Newark, DE, USA). To validate the precision of DIC measurements, an international inter-laboratory procedure was used following [15], where samples containing high and low CO2 test samples (n = 3) were analyzed and recorded within 0.5% of predetermined value [21]. Colorimetric analysis was used to determine total pH at 200 °C using purple indicator dye (metacresol, Sigma-Aldrich, St. Louise, MS, USA). Samples were prepared with a tris-buffer and analyzed using a UV-VIS spectrophotometer (Cary100, Agilent, Santa Clara, CA, USA). Open-cell titration was used to determine total alkalinity [22] on a Mettler Toledo T-5 (Metrohm, Riverview, FL, USA). Certified hydrochloric acid (∼0.1 mol kg−1, ∼0.6 mol kg−1 NaCl; Dickson Lab) was used for the titration and certified reference materials to check their accuracy. CRM Batch 191 (n = 3) and 157 (n = 18) were used, and they had an accuracy of ±5 μmol kg−1 of the reported value. Dissolved inorganic carbon and total alkalinity were used to calculate ρCO2, Ωaragonite, and Ωcalcite using COS2SYS [23]. Within COS2SYS, the following parameters were used: K1 and K2 from [24], K hydrogen sulfate from [25], and total Boron from [26].

2.4. Surfclam Physiology and Growth Measurements

Physiological feeding measurements were taken on a subset of surfclams at three timepoints after the experiment began: one day, two weeks, and six weeks (n = 9 clams/pH treatment). Feeding and digestion measurements (Table 1, adapted from [15]) were taken using the biodeposition method [15,27,28]. This method follows the inorganic matter through the diet, pseudofeces, and feces of individual clams to calculate filtration, rejection, ingestion, absorption, and egestion rates (Table 1). Biodeposition methods followed [29], whereby seawater corresponding to each experimental pH treatment was pumped into a header tank (30.5 cm × 66 cm × 14.5 cm). From this header tank, water flowed through holes drilled in the sides to 18 individual PVC chambers (18.5 cm × 5.7 cm × 5.7 cm), with baffles inserted towards the header tank to ensure laminar flow and avoid recirculation within the chambers. Each chamber contained one surfclam, positioned with siphons towards the inflow of the chamber. Following ref. [15], prior to being placed in the chamber, surfclams were towel-dried, and a small piece of Velcro was glued to one side of the shell, which was then placed on a corresponding piece of Velcro in the individual chamber. This was performed to avoid clam movement that would disturb pseudofeces and feces. After being handled, all experimental animals were given ~1 h to acclimate to the individual chambers or until >50% of all individuals were open and siphons were visible. Flow through each chamber was set to 12 L h−1, and flow rates were measured before and after each experiment.
On each day that clam physiology was measured, descriptions of the available diet were characterized as total particulate matter (TPM, mg L−1), particulate organic matter (POM, mg L−1), and percentage of the TPM composed of organic material. To determine when to begin collecting feces and pseudofeces in each experiment, gut transit time (time between ingestion and egestion) was measured prior to the day that biodeposition experiments were conducted [15]. Gut transit time determines how long the diet is characterized prior to beginning the collection of feces and pseudofeces to ensure that the organic and inorganic material being compared between diet and feces is from the same time. In this experiment, all gut transit times were comparable to [15] (~30 min–1.5 h). Prior to beginning the collection of feces and pseudofeces, all chambers were emptied of feces and pseudofeces, which were discarded. When the collection of feces and pseudofeces began, these samples were immediately removed from the individual chambers with a pipette and collected separately into falcon tubes. Experiments were ended after 1–2 h based on the rate of feces production to ensure enough material was collected for weight measurements. Diet water samples, feces, and pseudofeces were each individually filtered onto Whatman GF/C filters (24 mm) (preburned, rinsed, and weighed) and rinsed with isotonic ammonium formate (0.5 M) to dissolve and remove any salts. All filters were dried at 60 °C until stable weights were achieved and then weighed on a microbalance. After weighing, filters were burned at 450 °C for four hours and then re-weighed. The difference between the dried and burned weights is the calculated POM for each diet, feces, and pseudofeces sample [27].
To account for variations in size between individual clams, all physiological rates were weight-standardized to the average dry tissue weight of all experimental clams (0.408 g) (Ws), where
Y w = Y e W s W e b
where Yw is the standardized physiological rate, Ye is the experimentally measured physiological rate, We is the weight of the clam being standardized, and b is the allometric scaling coefficient, here used as 0.76 [15].
All clams used for physiological measurements described above were subsequently sacrificed after each experiment for biometric analyses of shell length (mm), shell thickness (mm), and dry tissue weight (mg, dried at 60 °C until stable weights were achieved). Shell thickness was measured with digital calipers along the growing edge of the shell. Shell strength was measured as the amount of force required to break the shell (Newtons, N) [35,36]. Shells were first prepared by removing all soft tissue and then dried. All shell strength measurements were taken on the right valve, unless the right shell was cracked in the dissection process, in which case the left valve was used. To determine shell strength, shells were crushed using an Instron 3400 (Series Single Column Table Model) at a rate of 2.54 mm min−1 in the middle of the shell, with the convex side facing upwards. The force required to make the first damage to the shell (the force at which the resistance to pressure first dropped) was recorded as the breaking force. Shell strength in surfclams has been previously found to be significantly positively correlated with both shell weight and thickness [36]; therefore, all shell strength measurements were standardized by shell thickness (mm).

2.5. Statistical Analyses

All statistical analyses were performed in Rstudio (version 4.2.2.). Diet characteristics between each experiment date were compared using a one-way analysis of variance (ANOVA). Environmental parameters, including carbonate chemistry, were also compared using a one-way ANOVA between each experimental pH treatment. This analysis was conducted to examine any potential differences between temperature, salinity, and oxygen between tanks during the experiment, and to observe if the carbonate chemistry was statistically different between each pH treatment.
Two-way ANOVAs were computed for each growth and physiology response variable, with pH treatment and experiment time as interactive independent variables. If the interaction term was significant (p < 0.05), the interaction term was left in, and post hoc analysis was conducted with a Bonferroni corrected Tukey test to determine differences within the levels of each treatment. Where interaction terms were not significant, models were changed to additive between the independent variables. All statistically compared data were tested for the assumptions of normality and homogeneity of variance with Shapiro–Wilk and Levene’s tests, respectively. If data did not meet these assumptions, data were log-transformed for further parametric statistical analyses. All presented data are untransformed. Average values were reported as mean ± standard deviation, and significance was reported at p < 0.05.

3. Results

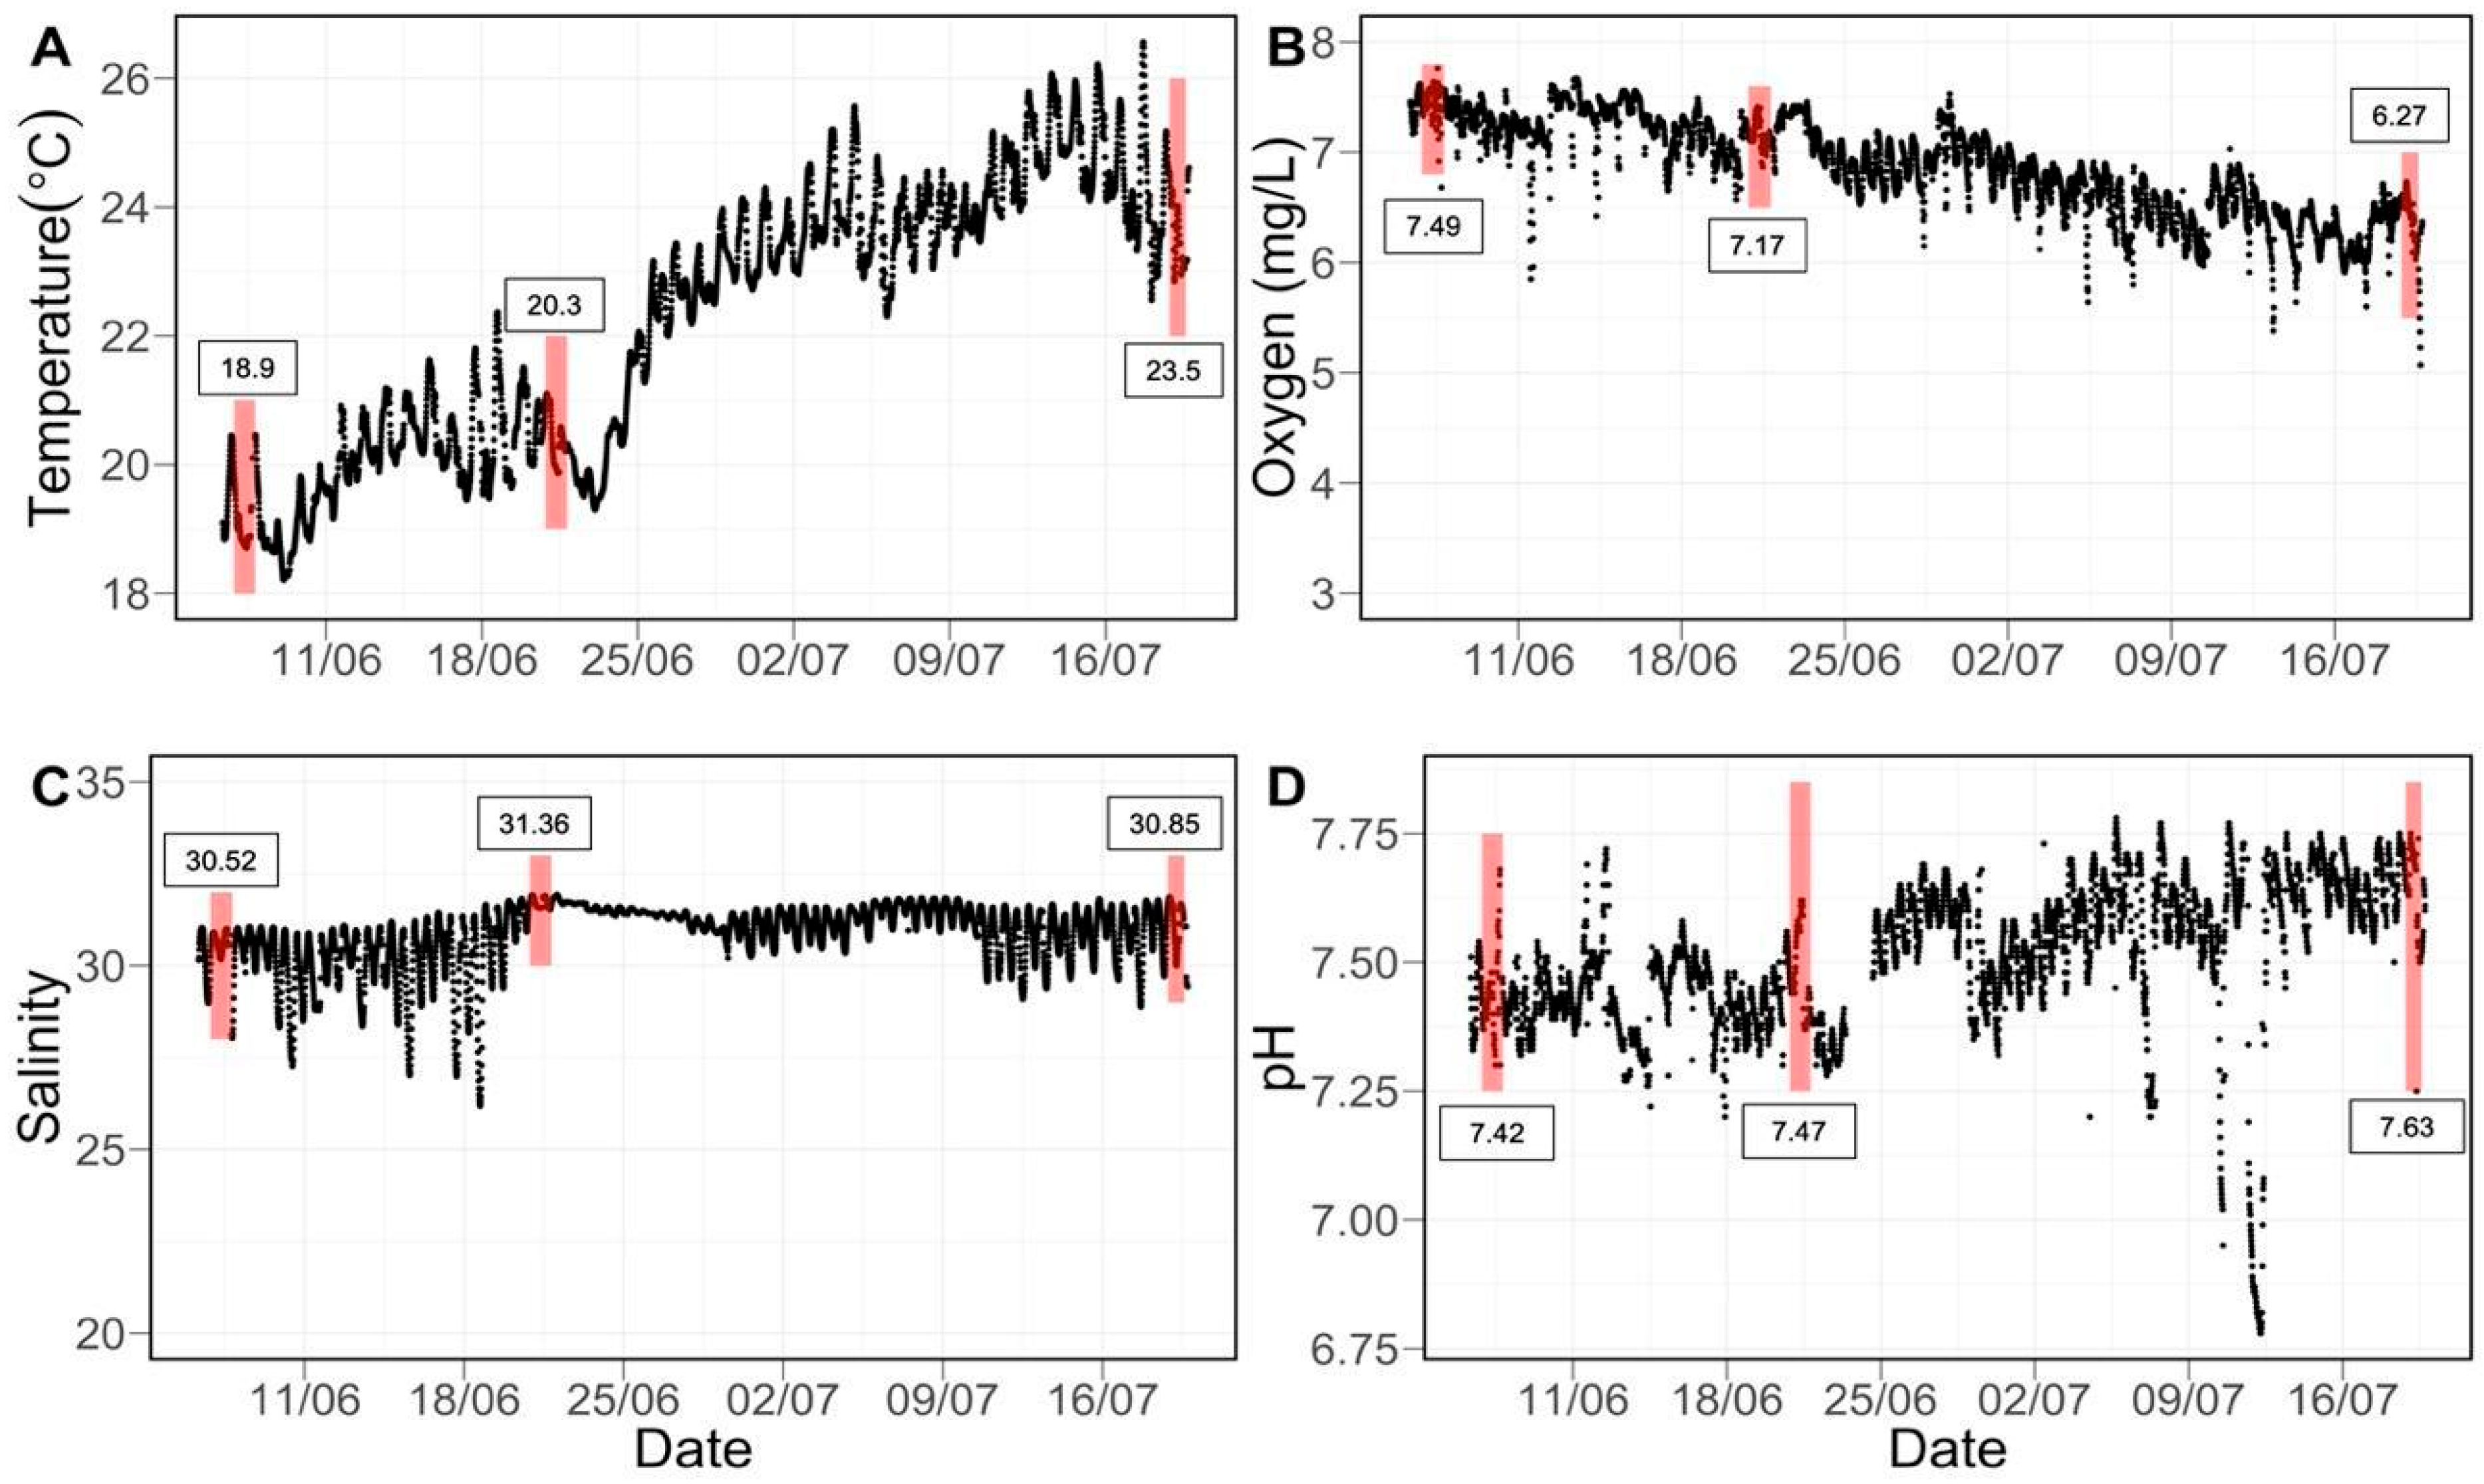
3.1. Water Quality and Experimental Conditions

The ambient water temperature increased with time during the experiment (mean = 22.23 ± 2.07 °C), with the lowest temperatures being observed in the middle of June (18.2 °C, June 9) and the highest temperatures in mid-July (26.6 °C, July 17) (Figure 1A). As temperatures increased, oxygen concentration (mean = 6.87 ± 0.44 mg L−1) declined, with the lowest concentrations recorded at the end of the experiment (5.07 mg L−1, July 19). However, hypoxic conditions were never reached (<2 mg L−1) (Figure 1B). Salinity fluctuated across the experiment, with periodic low levels observed early in the experiment (e.g., 26.2 mg L−1, June 18), but, on average, it remained high (30.83 ± 1.22) (Figure 1C). pH fluctuated across the experiment, generally increasing slightly with time (Figure 1D). Ambient food availability was generally similar between the first two experiments (one day and two weeks); no significant differences were observed in TPM or percent organic material (p = 0.55, 0.16, respectively, Table 2). Particulate organic material decreased slightly after two weeks (p = 0.024, Table 2). At the six-week-measurement TPM, POM deceased significantly compared to the two-week timepoint, and the percent organic material significantly increased (p < 0.001 for all, Table 2).
Between experimental treatments, no significant differences were observed between daily measurements of temperature (p = 0.99), oxygen (p = 0.87), and salinity (p = 0.99) (Table 3). Regarding carbonate chemistry measurements, pH and Ωaragonite were significantly different between each pH treatment, with the highest values in the ambient condition and the lowest values in the low pH treatment (p < 0.001 for both, Table 3). Similarly, ρCO2 varied significantly between each pH treatment, with the lowest values in the ambient condition and the highest values in the low pH treatment (p < 0.001, Table 3). The dissolved inorganic carbon concentration was significantly lower in the ambient condition compared to the low pH treatment (p < 0.001), but not the medium treatment (p = 0.059, Table 3). No significant differences were observed in total alkalinity between any treatments (p = 0.99).

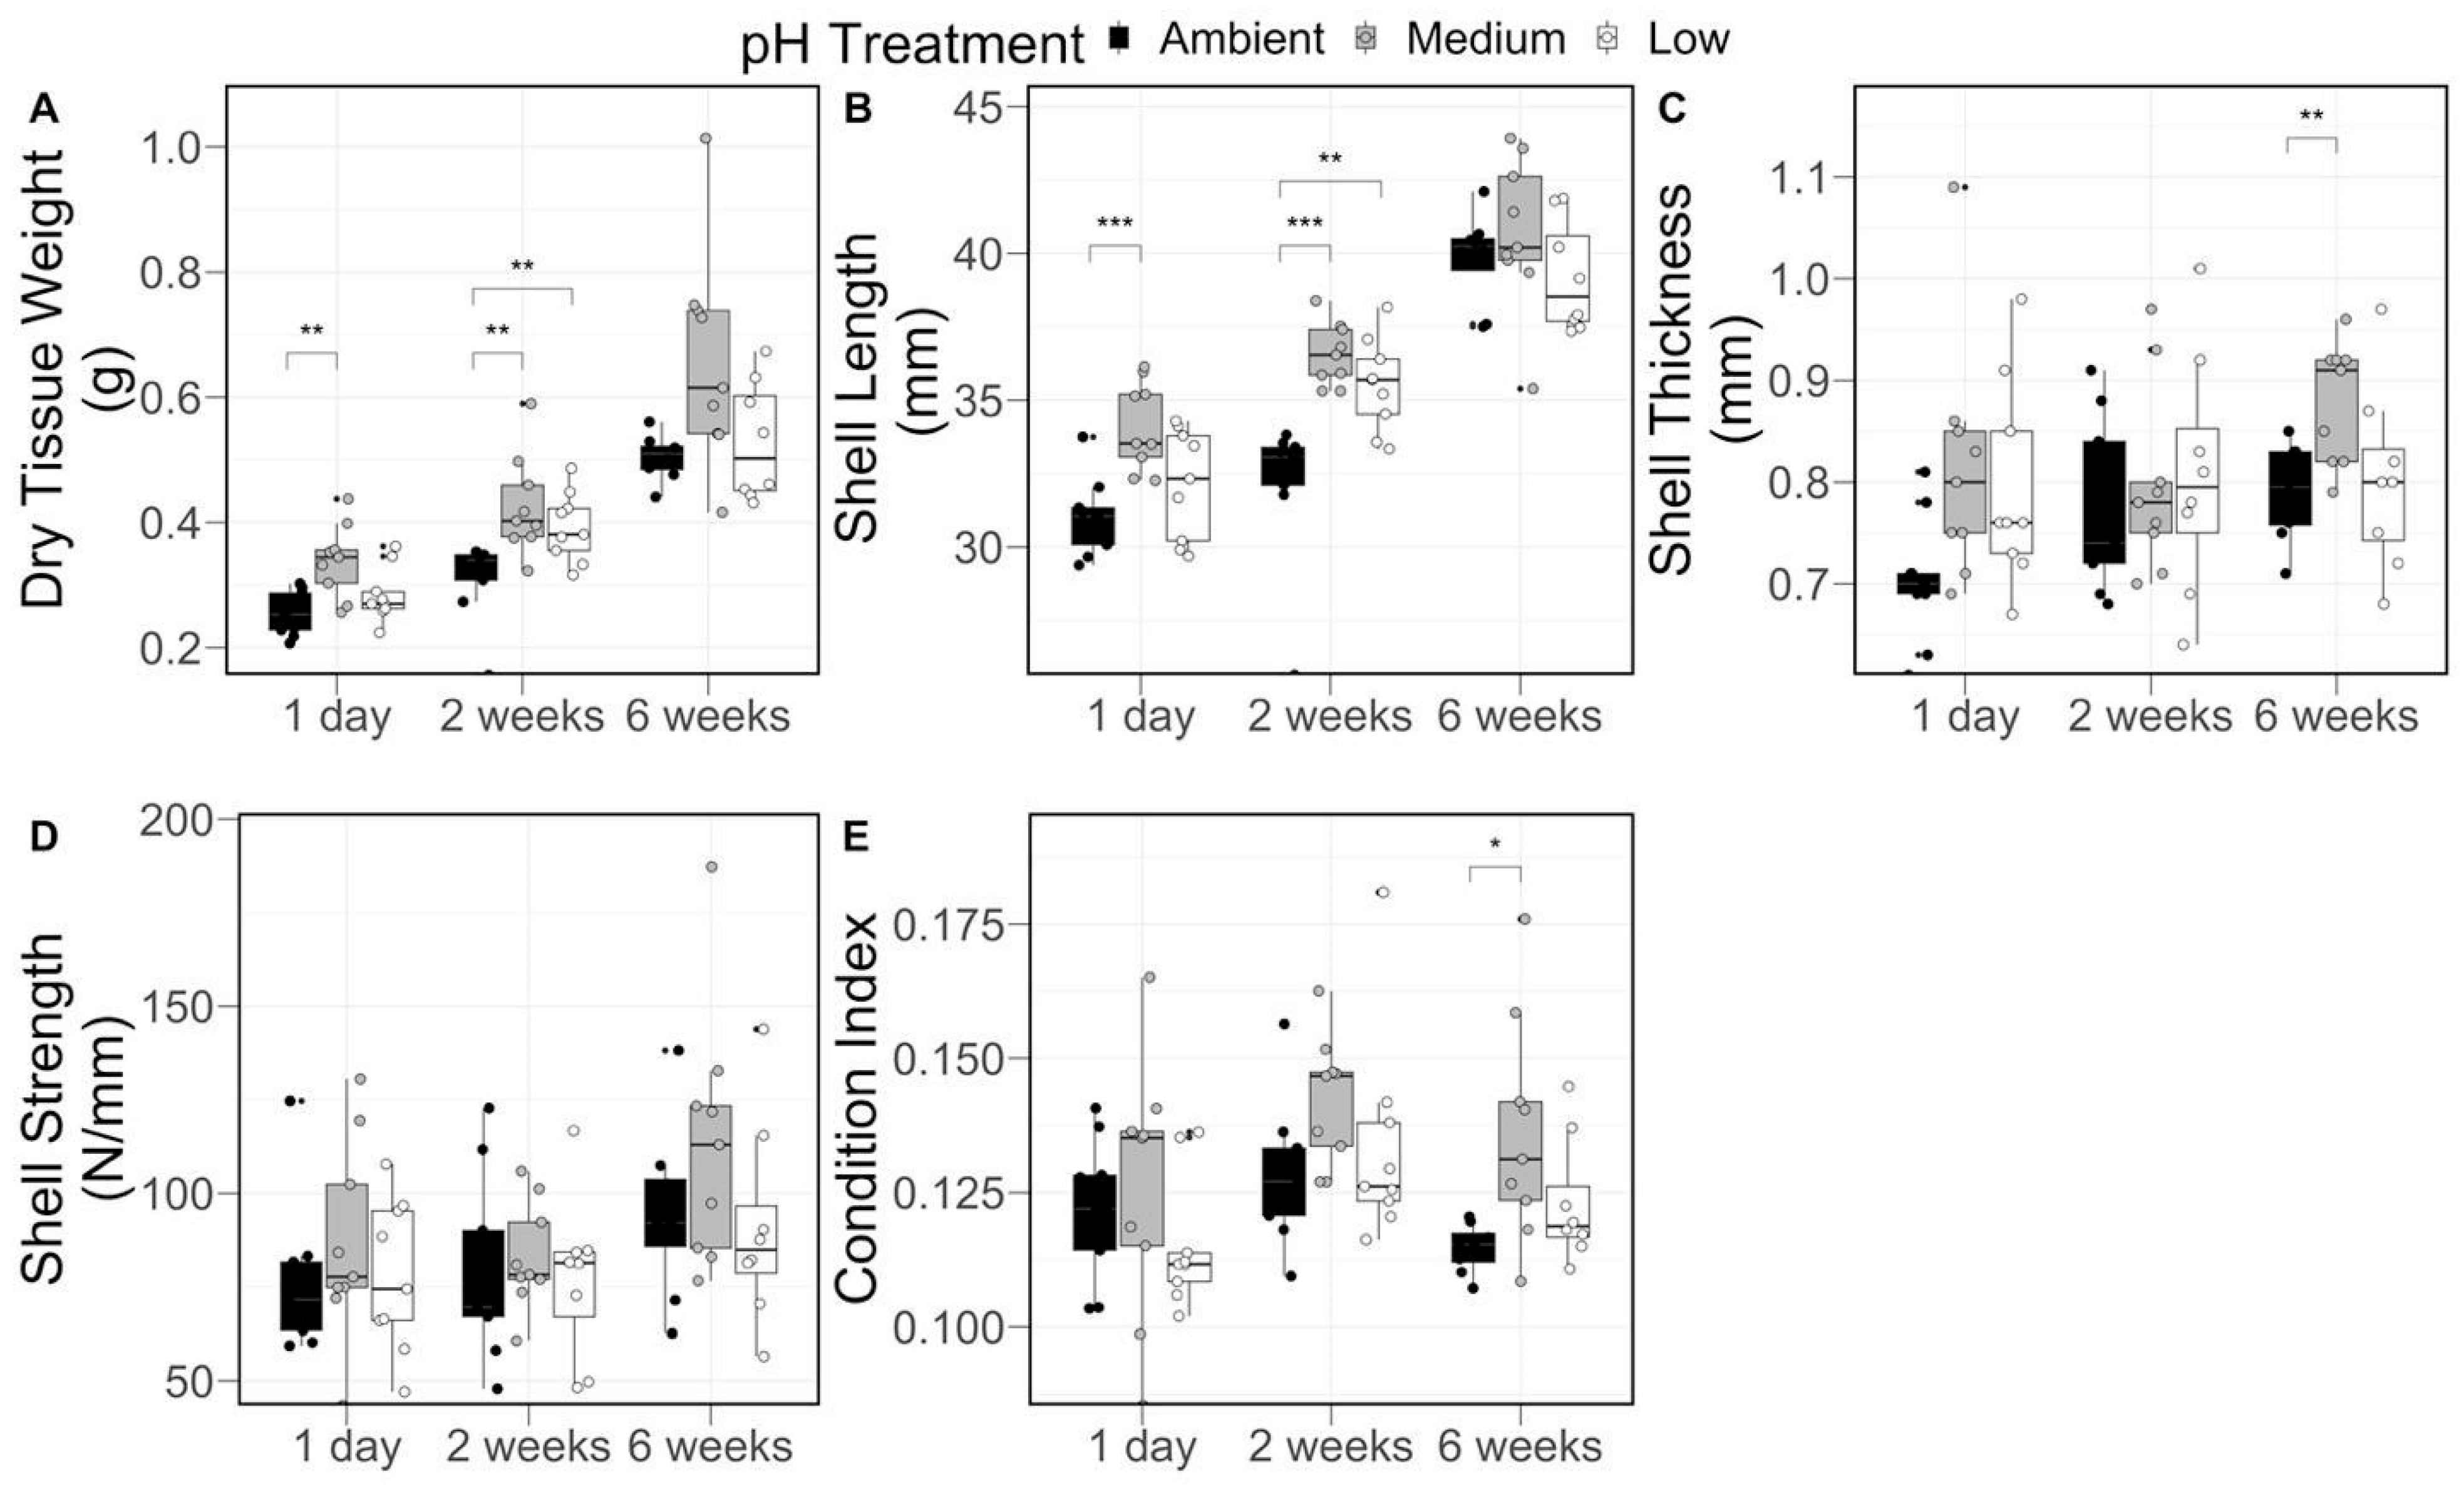
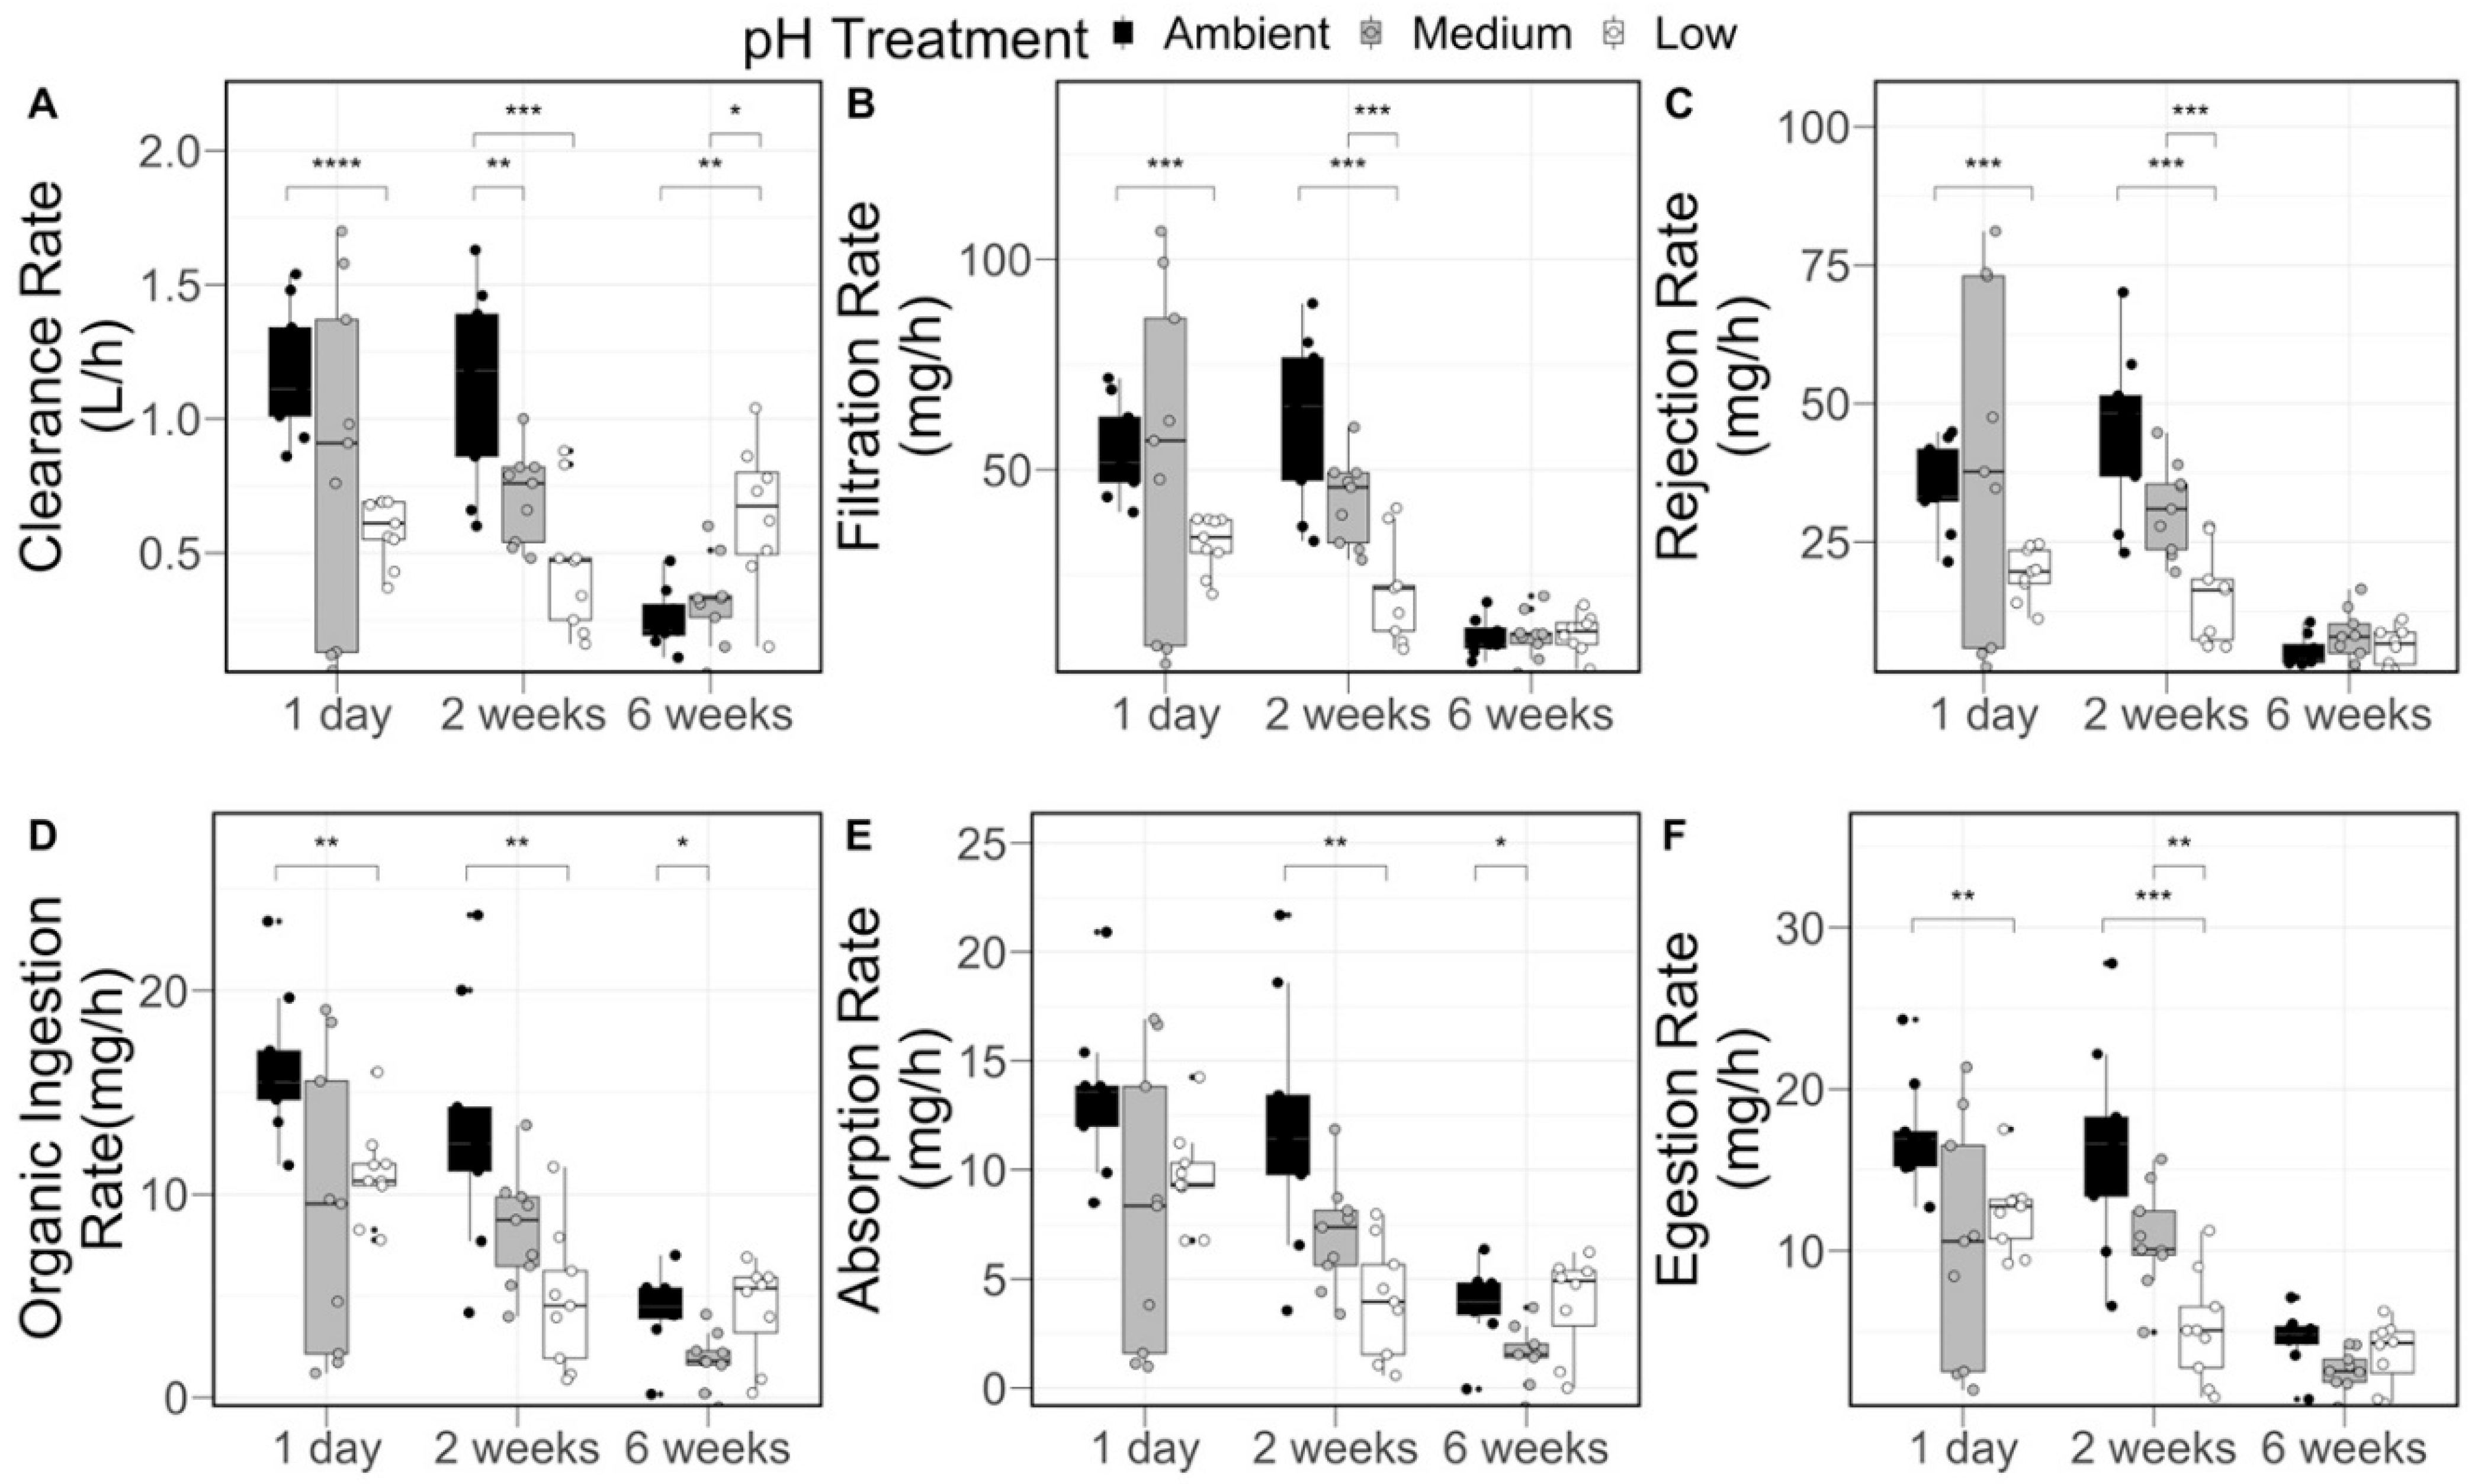
3.2. Clam Growth and Physiology

Between each observation point during the experiment (one day, two weeks, six weeks), clams in all pH treatments grew in terms of tissue dry weight (mg) and shell length (mm) (Figure 2A,B, Table 4). Contrastingly, between one day and six weeks of exposure, no significant differences were observed within each pH treatment for shell thickness, shell strength, or condition index (Figure 2C–E, Table 4). Generally, no clear effect of pH on shell thickness, shell strength, or condition index was observed (Figure 2, Table 4). However, at the beginning of the experiment (one day), and after two weeks, clams in the ambient condition were significantly lighter in terms of dry mass compared to clams in the medium (p = 0.003) and medium (p = 0.004) and low (p = 0.01) pH treatments, respectively (Figure 2A). Additionally, clams in the medium pH treatment had significantly thicker (p = 0.004)—but not stronger (p = 0.2)—shells after six weeks compared to the ambient condition (Figure 2C,D). Clams in the medium treatment also had a significantly higher condition after 6 weeks compared to the ambient condition (p = 0.016, Figure 2E).
Feeding and digestive rates were generally higher in the ambient condition and medium pH treatment compared to the low pH treatment within each sampling time (Figure 3, Table 5). After one day of acclimation, clearance, filtration, rejection, organic ingestion, and egestion rates were significantly lower in the low pH treatment compared to the ambient condition, and high levels of interindividual variability were observed in the medium pH treatment (Figure 3, Table 5). For absorption rates, no significant differences were observed between pH treatments after one day (Figure 3E, Table 5). After two weeks of exposure, clearance, filtration, rejection, and egestion rates were significantly higher in the ambient condition compared to both the medium and low treatments (Figure 3, Table 5). Also, after two weeks, organic ingestion (p = 0.002) and absorption rates (p < 0.01) were significantly higher in the ambient condition than the low pH treatment, but not the medium pH treatment (Figure 3D,E, Table 5). After six weeks of exposure, the clearance rate was significantly higher in the low pH treatment compared to both the medium treatment (p = 0.015) and ambient condition (p < 0.01) (Figure 3A, Table 5). The organic ingestion rate and absorption rate displayed similar trends after six weeks of exposure, where the medium pH treatment was significantly lower than the ambient condition (p = 0.013, 0.016, respectively, Figure 3D,E, Table 5). No significant differences were observed between pH treatments in any other physiological rates after six weeks of exposure. Within the ambient and medium pH treatment, all feeding and digestion rates were lower after six weeks compared to one day of exposure (Figure 3, Table 5). For the low pH treatment, egestion, organic ingestion, and absorption rates were lower after six weeks compared to one day of exposure (Figure 3, Table 5).

4. Discussion

As ectothermic, calcifying organisms, bivalves are understood to respond to both ocean acidification and warming. This study contributes to our understanding of the temporal physiological response of the Atlantic surfclam to ocean acidification in warm summer temperatures. After six weeks of exposure to medium (7.51 ± 0.11) and low (7.20 ± 0.10) pH treatments, growth in terms of shell length or tissue weight and shell strength were not clearly affected by the reduced pH. Contrastingly, feeding and digestive physiology displayed variable responses to pH over time. Seemingly, low pH reduced feeding and absorption rates compared to the medium treatment and ambient condition; however, this response is clearer after two weeks compared to one day. At six weeks, generally suppressed physiological rates across all pH treatments suggest that clams were experiencing thermal stress from high ambient water temperatures (24–26 °C). Sublethal effects of lowered pH on marine bivalves have recently been observed to be variable both between and within species. By taking growth and physiological rate measurements over time, this study aimed to observe any acclimation or physiological stress during a six-week period. Results from this study provide important information about reduced energy acquisition in surfclams in acidified environments and highlight the need for conducting multistressor experiments that consider the combined effects of temperature and pH stress.

4.1. Effects of Ocean Acidification and Warming on Bivalve Physiology

Understanding how OA drives changes in whole organism energetics provides information about energy available for growth and, ultimately, survival. In this study, clearance rate and associated feeding/selection processes were significantly reduced by both medium and low pH exposure after two weeks, a similar result to that observed by [15], who also worked with the Atlantic surfclam (high ρCO2 treatment = 2163 μatm, compared to 2274 (medium) and 4293 (low) μatm in this study). These comparable findings suggest that a reduction in feeding and digestive processes may be a consistent response for this species to OA. A reduction in clearance rate in response to lowered pH/elevated ρCO2 has been observed in other clam [13,15] and bivalve species [14,16,37]; however, the clearance rate has also increased in response to OA, hypothesized to be a compensatory mechanism to increase energy acquisition in response to deceased absorption efficiency and increased metabolic rate [38]. Interestingly, after one day of exposure to medium and low pH treatments, clams in this study had high and low interindividual variability in clearance rate, respectively. It is possible that the more extreme pH stress of the low treatment elicited a consistent physiological response after just one day, whereas in the medium pH treatment more time was needed to observe a response in all individuals. Increased selection efficiency (the selective ingestion of organic material before ingestion) in conjunction with a reduced clearance rate in response to OA in the surfclam are proposed to be a mechanism to maintain energy intake [15]. A reduced clearance rate may be the result of by a reduction in gill ciliary movement at reduced pH, as recently observed in the mussel Mytilus edulis [39], although, to our knowledge, this has not yet been examined in the surfclam. In the present study, absorption efficiency was significantly reduced in medium and low pH treatments compared to ambient conditions after 2 weeks. Although no clear mechanism has been found to facilitate changes in digestion and absorption, after 35 days of exposure to experimentally lowered pH, ref. [40] observed no significant changes in antioxidant or digestive enzyme activity in the digestive gland of the razor clam Sinonovacula constricta; however, damage was observed in the digestive gland through histological analysis. Reduction in energy acquisition processes, without compensatory changes in energy expenditure (e.g., metabolic rate, excretion) are expected to result in long-term reduced growth.
In this study, despite decreased feeding rates and absorption efficiencies observed after two weeks, no clear effect of OA on whole animal growth (shell length, tissue weight) was observed, even after six weeks of exposure. It is possible that surfclams in this study employed other compensatory mechanisms to maintain similar growth rates (e.g., lowered metabolic rates). For the Manila clam, significant reductions in condition index in response to lowered pH were only observed after 70 days (pH: 8.0 to 7.4, T = 20 °C) [13]; however, six weeks of exposure to decreased pH treatments has resulted in significantly decreased growth rates in the oyster Crassostrea gigas [16]. These findings suggest that our experiment time of six weeks was possibly not long enough to observe differences in tissue weight or shell length in surfclams. Furthermore, high temperatures during the second half of this experiment likely suppressed growth in all experimental treatments due to thermal stress, thus masking any effects of pH on growth at six weeks. A high level of tolerance to reduced pH has been observed in other clam species; for example, no significant reduction in growth (shell length, dry weight) was observed over 35 days in razor clams (ambient pH 8.1 reduced to 7.5, Ωaragonite < 1, [40]). Furthermore, in a study with the ocean quahog over four months, no significant effect of pH reduction was observed on shell strength or growth (ambient pH 7.85 reduced to 7.63 [41]). It should be noted that the ambient values of Ωaragonite were relatively low in this study (1.30); however, values were within expected ranges for the region, particularly during upwelling events [42]. Hiebenthal et al. [41] also observed no effect of reduced pH on shell strength after four months, despite exposure to low Ωaragonite (0.3), which is comparable to the low pH treatment in this study. Interestingly, ref. [41] observed greater changes from moderate increases in temperature (7.5–16 °C) compared to acidification on shell growth.
By monitoring both natural environmental variability and physiological rate over time, this study also provides information about physiological responses to ambient fluctuations over time, specifically during warm summer months. For surfclams in the Mid-Atlantic region of the United States, warming ocean temperatures have been identified as a driver of population declines and the movement of populations both northward and offshore [4,5,43]. Hornstein et al. [44] observed that filtration rate, assimilation efficiency, and overall scope for growth decreased in Atlantic surfclams acclimated to 23 °C compared to 19 °C. Here, a significant reduction in most feeding and digestive processes has been observed after six weeks, when temperatures likely exceeded the thermal tolerance of this species (24–26 °C). Although not measured in this study, it is expected that the metabolic rate of clams in this study would have increased at least to 23 °C [44], further increasing energetic demands. Acquafredda et al. [45] in a month-long study observed that juvenile surfclams had the highest growth rates, between 20 and 24 °C, with significant mortality observed at 26 °C. Similarly to the results of this study, these previous findings suggest that there is a breakpoint for the feeding physiology of this species around 23 °C, where physiological rates decline.
For all physiological rates measured in this study, there was a significant interaction observed between the factors of pH treatment and experiment time point (across which temperature was increasing). This suggests that the effects of OA on surfclam physiology may be dependent upon temperature. It has been postulated that ocean acidification may decrease the thermal tolerance of marine organisms as a result of CO2 accumulation in soft tissues [46,47]. Interestingly, the clearance rate of surfclams in the low pH treatment was significantly higher than that of surfclams in the medium and ambient pH treatments at the six-week measurement (23.5 °C). It is possible that this is a passive response due to the physiological gaping response of clams to thermal stress, particularly if surfclams in the low pH treatment were experiencing increased tissue acidosis. However, this hypothesis is not supported by any other feeding physiology measurements being higher in the low pH treatment at the six-week measurement. As infaunal species, surfclams may typically employ an avoidant strategy of burial in sediment in response to low water quality, including high temperature and low pH, as observed in other clam species [16,48]. Future studies on the Atlantic surfclam may consider the inclusion of measuring the burial response to decreased water quality as a response to OA and thermal stress.

4.2. Design of Laboratory Experiments

This laboratory experiment was designed to expose clams to manipulated pH levels while maintaining natural variability in water quality, including temperature, dissolved oxygen, salinity, and food availability. Although controlling for these variables (i.e., using treated seawater, cultured algal diet) would provide an opportunity to isolate the effect of pH over time, this design loses the complexity of natural environments that clams are exposed to. For this experiment measuring feeding and digestive physiology and growth, the use of natural diets is important for observing responses that more closely reflect natural conditions [49]. Diet varied over the course of this experiment, where overall TPM decreased after 6 weeks, and the percentage of organic material in the diet increased. It is expected that these fluctuations in food availability, in terms of both quantity and quality of the diet, will influence filtration rate and pseudofeces production such that the proportion of filtered and rejected material over time produces a consistently high level of organic ingestion rates, as observed in other bivalves, including surfclams [50,51]. As TPM increases, typically, a parabolic relationship is observed where, initially, clearance and filtration rates will increase with increasing diet concentration to some maximum where rates will decrease due to limitations of the digestive system, or to avoid overloading the pallial organs [49,52]. Although a reduction in feeding rate may be expected at the 6-week compared to the 2-week feeding measurements, stable organic ingestion rates would also be expected, which were not observed in this study. Here, clearance, filtration, and organic ingestion rates all decrease at the 6-week timepoint. Overall, TPM loading in this experiment is consistently very high (lowest levels at 6 weeks: 29 mg L−1) and likely does not alone (without accounting for high temperatures) explain the extreme and uniform reductions in clearance and filtration rates observed here.
Although laboratory experiments are often designed with static environmental variables, e.g., targeted values of pH and temperature, this fails to capture diel- and weather-influenced variability in water quality. For the mussel Mytlius edulis, higher degrees of acclimation were observed in feeding rates in organisms held in fluctuating conditions compared to stable and thermally stressful conditions [53]; therefore, acclimating organisms to stable conditions may overestimate physiological response. Physiological and energetic responses of marine organisms to short-term fluctuations in pH likely require different compensatory mechanisms related to acid–base balance and gene expression compared to changes in long-term pH averages [54,55]. In a recent study conducted on the Mediterranean mussel (Mytilus galloprovincialis), the authors observed differential phenotypic plasticity, as measured through gene expression, between two populations of mussels collected from locations with naturally stable vs. fluctuating pH and then exposed to a low pH challenge [56]. This suggests that bivalves either acclimated or adapted to different natural pH regimes in terms of variability, not only average pH, may display different physiological responses to OA experiments.
By taking measurements at three time points, this experiment aimed to capture any acclimation or increased stress of surfclams over time. A similar study examining the combined effects of pH and temperature on the absorption efficiency of the gastropod Nassarius conoidalis observed no significant effects after 2 days but significant decreases in absorption efficiency after 30 days [57]. Working with natural diets also aims to ensure that food limitation is not an added stressor, particularly during productive summer months (June-July), as limited food availability has been observed to have a greater effect than OA on juvenile bivalve growth [58].
Findings in this study highlight the importance of studying multiple environmental stressors simultaneously to best predict the physiological response and effects of climate change on marine bivalves. Although here we capture simultaneous pH and temperature stress, a fully crossed design with differential temperature treatments in combination with OA challenges is required to understand the interactive effect of both stressors. Outputs from a fully crossed design can provide additional information for bioenergetic models using multiple environmental forcing variables [20]. Beyond the energy acquisition processes measured in this experiment (feeding, absorption), future studies should also aim to capture energy expenditure (metabolic rate, excretion) for a more holistic understanding of energy budgets. Furthermore, reductions in energy availability in response to OA have been found to reduce reproductive function after 40 days of exposure to reduced pH (8.0 to 7.4) in the Manila clam (Ruditapes philippinarum) [13] and also possibly decrease reproductive effort in the clam Ruditapes decussatus (pH—0.7 units for 74 days) [18]. Although ocean warming and acidification resulted in a physiological response from surfclams [20], changes in food and oxygen availability are also predicted and will affect surfclams [2,59].

5. Conclusions

Understanding how energy acquisition changes with ocean acidification and warming in bivalves is a primary step to predicting how changing ocean conditions will affect their growth, survival, and distribution. Findings from this study suggest that a moderate pH reduction from ambient (7.81, ρCO2 = 1000 μatm) to 7.51 (ρCO2 = 2270 μatm) significantly reduced feeding activity (clearance, filtration, and rejection rates) after two weeks of acclimation, but not after one day of exposure. Further reductions in pH (7.20, ρCO2 = 4290 μatm) strengthened this trend, and significant reductions in feeding rates were observed both after one day and two weeks of acclimation. Over the six weeks during which this experiment ran, ambient water temperatures increased from 18.9 °C to 23.5 °C, with maximum temperatures above 26 °C before final physiological measurements were taken at the 6-week timepoint. As all physiological rates were lowered at this final sampling, it is possible that warm water temperatures dominated over the effects of OA when they exceeded the thermal tolerance of this species. Despite the 6-week duration of this experiment, and Ωaragonite < 0.4 in the low pH treatment, no consistent trends were observed in the effects of OA on surfclam growth or shell strength. This suggests the possibility of a compensatory mechanism in decreasing energy expenditure in response to lowered energy acquisition, and/or that the duration of this experiment was not long enough to observe effects on whole organism growth. Results from this study provide insight into energy acquisition in surfclams in acidified environments and highlight the need for conducting multistressor experiments that consider the combined effects of temperature and pH stress.

Author Contributions

Conceptualization, L.S., S.L.M. and D.M.; methodology, L.S., S.L.M. and D.M.; formal analysis, M.H., L.S. and S.L.M.; investigation, L.S., M.H., S.L.M. and D.M.; resources, D.M. and S.L.M.; data curation, M.H. and L.S.; writing—original draft preparation, L.S. and M.H.; writing—review and editing, S.L.M. and D.M.; visualization, L.S.; supervision, D.M. and S.L.M.; project administration, D.M.; funding acquisition, D.M. and S.L.M. All authors have read and agreed to the published version of the manuscript.

Funding

Funding for this study was provided by the NOAA Ocean Acidification Program and the NOAA Office of Aquaculture (grant ID NA21OAR4170318). M.H. was supported by the National Science Foundation Grant No. OCE-1831625. L.S. was supported by a National Science and Engineering Research Council of Canada Postdoctoral Fellowship.

Institutional Review Board Statement

Not applicable.

Data Availability Statement

Data are contained within the article.

Acknowledgments

Experiments were performed with the assistance of the staff at the Rutgers Aquaculture Innovation Centre, and the authors would like to thank Sean Towers, Josh Kiernan, Becca Giplin, David Jones, and Mark Baranoski. The authors would also like to thank Genevieve Bernatchez for performing the carbonate chemistry analysis on seawater samples for this experiment. The use of trade names, or commercial products, is solely for the purpose of providing specific information and does not imply endorsement by the National Marine Fisheries Service, National Oceanic and Atmospheric Administration.

Conflicts of Interest

The authors declare no conflicts of interest.

References

  1. Robert, G. Dynamics of an Exploited Population of Bar Clam, Spisula solidissima. In Canadian Manuscript Report of Fisheries and Aquatic Sciences; Department of Fisheries and Oceans Canada: Ottawa, ON, Canada, 1981; Volume 1670, iv + 12 p. [Google Scholar]
  2. Marzec, R.J.; Kim, Y.; Powell, E.N. Geographical Trends in Weight and Condition Index of Surfclams (Spisula solidissima) in the Mid-Atlantic Bight. J. Shellfish Res. 2010, 29, 117–128. [Google Scholar] [CrossRef]
  3. NOAA Fisheries Landings. 2023. Available online: https://www.fisheries.noaa.gov/foss/f?p=215:200 (accessed on 1 March 2023).
  4. Weinberg, J.R. Bathymetric Shift in the Distribution of Atlantic Surfclams: Response to Warmer Ocean Temperature. ICES J. Mar. Sci. 2005, 62, 1444–1453. [Google Scholar] [CrossRef]
  5. Hofmann, E.E.; Powell, E.N.; Klinck, J.M.; Munroe, D.M.; Mann, R.; Haidvogel, D.B.; NarvÁEz, D.A.; Zhang, X.; Kuykendall, K.M. An Overview of Factors Affecting Distribution of the Atlantic Surfclam (Spisula solidissima), a Continental Shelf Biomass Dominant, During a Period of Climate Change. J. Shellfish Res. 2018, 37, 821–831. [Google Scholar] [CrossRef]
  6. Feely, R.; Doney, S.; Cooley, S. Ocean Acidification: Present Conditions and Future Changes in a High-CO2 World. Oceanography 2009, 22, 36–47. [Google Scholar] [CrossRef]
  7. Ma, D.; Gregor, L.; Gruber, N. Four Decades of Trends and Drivers of Global Surface Ocean Acidification. Glob. Biogeochem. Cycles 2023, 37, e2023GB007765. [Google Scholar] [CrossRef]
  8. Wanninkhof, R.; Barbero, L.; Byrne, R.; Cai, W.-J.; Huang, W.-J.; Zhang, J.-Z.; Baringer, M.; Langdon, C. Ocean Acidification along the Gulf Coast and East Coast of the USA. Cont. Shelf Res. 2015, 98, 54–71. [Google Scholar] [CrossRef]
  9. Wright-Fairbanks, E.K.; Miles, T.N.; Cai, W.; Chen, B.; Saba, G.K. Autonomous Observation of Seasonal Carbonate Chemistry Dynamics in the Mid-Atlantic Bight. JGR Ocean. 2020, 125, e2020JC016505. [Google Scholar] [CrossRef]
  10. Green, M.A.; Waldbusser, G.G.; Reilly, S.L.; Emerson, K.; O’Donnell, S. Death by Dissolution: Sediment Saturation State as a Mortality Factor for Juvenile Bivalves. Limnol Ocean. 2009, 54, 1037–1047. [Google Scholar] [CrossRef]
  11. Ventura, A.; Schulz, S.; Dupont, S. Maintained Larval Growth in Mussel Larvae Exposed to Acidified Under-Saturated Seawater. Sci. Rep. 2016, 6, 23728. [Google Scholar] [CrossRef] [PubMed]
  12. Ekstrom, J.A.; Suatoni, L.; Cooley, S.R.; Pendleton, L.H.; Waldbusser, G.G.; Cinner, J.E.; Ritter, J.; Langdon, C.; Van Hooidonk, R.; Gledhill, D.; et al. Vulnerability and Adaptation of US Shellfisheries to Ocean Acidification. Nat. Clim. Chang. 2015, 5, 207–214. [Google Scholar] [CrossRef]
  13. Xu, X.; Yang, F.; Zhao, L.; Yan, X. Seawater Acidification Affects the Physiological Energetics and Spawning Capacity of the Manila Clam Ruditapes philippinarum during Gonadal Maturation. Comp. Biochem. Phys. A 2016, 196, 20–29. [Google Scholar] [CrossRef]
  14. Navarro, J.M.; Villanueva, P.; Rocha, N.; Torres, R.; Chaparro, O.R.; Benítez, S.; Andrade-Villagrán, P.V.; Alarcón, E. Plastic Response of the Oyster Ostrea chilensis to Temperature and pCO2 within the Present Natural Range of Variability. PLoS ONE 2020, 15, e0234994. [Google Scholar] [CrossRef]
  15. Pousse, E.; Poach, M.E.; Redman, D.H.; Sennefelder, G.; White, L.E.; Lindsay, J.M.; Munroe, D.; Hart, D.; Hennen, D.; Dixon, M.S.; et al. Energetic Response of Atlantic Surfclam Spisula solidissima to Ocean Acidification. Mar. Pollut. Bull. 2020, 161, 111740. [Google Scholar] [CrossRef]
  16. Jiang, W.; Wang, X.; Rastrick, S.P.S.; Wang, J.; Zhang, Y.; Strand, Ø.; Fang, J.; Jiang, Z. Effects of Elevated p CO2 on the Physiological Energetics of Pacific Oyster, Crassostrea gigas. ICES J. Mar. Sci. 2021, fsab139. [Google Scholar] [CrossRef]
  17. Czaja, R.; Holmberg, R.; Pales Espinosa, E.; Hennen, D.; Cerrato, R.; Lwiza, K.; O’Dwyer, J.; Beal, B.; Root, K.; Zuklie, H.; et al. Behavioral and Physiological Effects of Ocean Acidification and Warming on Larvae of a Continental Shelf Bivalve. Mar. Pollut. Bull. 2023, 192, 115048. [Google Scholar] [CrossRef] [PubMed]
  18. Range, P.; Chícharo, M.A.; Ben-Hamadou, R.; Piló, D.; Matias, D.; Joaquim, S.; Oliveira, A.P.; Chícharo, L. Calcification, Growth and Mortality of Juvenile Clams Ruditapes decussatus under Increased pCO2 and Reduced pH: Variable Responses to Ocean Acidification at Local Scales? J. Exp. Mar. Biol. Ecol. 2011, 396, 177–184. [Google Scholar] [CrossRef]
  19. Acquafredda, M.P.; Ximing, G.; Munroe, D.M. Transcriptomic Response of the Atlantic Surfclam (Spisula solidissima) to Acute Heat Stress. Mar. Biotechnol. 2024, 26, 149–168. [Google Scholar] [CrossRef]
  20. Pousse, É.; Munroe, D.; Hart, D.; Hennen, D.; Cameron, L.P.; Rheuban, J.E.; Wang, Z.A.; Wikfors, G.H.; Meseck, S.L. Dynamic Energy Budget Modeling of Atlantic Surfclam, Spisula solidissima, under Future Ocean Acidification and Warming. Mar. Environ. Res. 2022, 177, 105602. [Google Scholar] [CrossRef]
  21. Bockmon, E.E.; Dickson, A.G. An Inter-Laboratory Comparison Assessing the Quality of Seawater Carbon Dioxide Measurements. Mar. Chem. 2015, 171, 36–43. [Google Scholar] [CrossRef]
  22. Dickson, A.G.; Sabine, C.L.; Christian, J.R. Guide to Best Practices for Ocean CO2 Measurements. North Pacific Marine Science Organization: Sidney, BC, Canada, 2007; ISBN 1-897176-07-4. [Google Scholar]
  23. Pierrot, D.; Lewis, E.; Wallace, D. MS Excel Program Developed for CO2 System Calculations; Carbon Dioxide Information Analysis Center, Oak Ridge National Laboratory, U.S. Department of Energy: Oak Ridge, TN, USA, 2006; ORNL/CDIAC-105a.
  24. Lueker, T.J.; Dickson, A.G.; Keeling, C.D. Ocean pCO2 Calculated from Dissolved Inorganic Carbon, Alkalinity, and Equations for K1 and K2: Validation Based on Laboratory Measurements of CO2 in Gas and Seawater at Equilibrium. Mar. Chem. 2000, 70, 105–119. [Google Scholar] [CrossRef]
  25. Dickson, A.G.; Wesolowski, D.J.; Palmer, D.A.; Mesmer, R.E. Dissociation Constant of Bisulfate Ion in Aqueous Sodium Chloride Solutions to 250.Degree.C. J. Phys. Chem. 1990, 94, 7978–7985. [Google Scholar] [CrossRef]
  26. Lee, K.; Kim, T.-W.; Byrne, R.H.; Millero, F.J.; Feely, R.A.; Liu, Y.-M. The Universal Ratio of Boron to Chlorinity for the North Pacific and North Atlantic Oceans. Geochim. Cosmochim. Acta 2010, 74, 1801–1811. [Google Scholar] [CrossRef]
  27. Iglesias, J.I.P.; Urrutia, M.B.; Navarro, E.; Ibarrola, I. Measuring Feeding and Absorption in Suspension-Feeding Bivalves: An Appraisal of the Biodeposition Method. J. Exp. Mar. Biol. Ecol. 1998, 219, 71–86. [Google Scholar] [CrossRef]
  28. Galimany, E.; Rose, J.M.; Dixon, M.S.; Wikfors, G.H. Transplant Experiment to Evaluate the Feeding Behaviour of the Atlantic Ribbed Mussel, Geukensia demissa, Moved to a High Inorganic Seston Area. Mar. Freshw. Res. 2015, 66, 220. [Google Scholar] [CrossRef]
  29. Galimany, E.; Lunt, J.; Domingos, A.; Paul, V.J. Feeding Behavior of the Native Mussel Ischadium recurvum and the Invasive Mussels Mytella charruana and Perna viridis in FL, USA, Across a Salinity Gradient. Estuar. Coasts 2018, 41, 2378–2388. [Google Scholar] [CrossRef]
  30. Galimany, E.; Rose, J.M.; Dixon, M.S.; Wikfors, G.H. Quantifying Feeding Behavior of Ribbed Mussels (Geukensia demissa) in Two Urban Sites (Long Island Sound, USA) with Different Seston Characteristics. Estuar. Coasts 2013, 36, 1265–1273. [Google Scholar] [CrossRef]
  31. Galimany, E.; Lunt, J.; Freeman, C.; Reed, S.; Segura-García, I.; Paul, V. Feeding Behavior of Eastern Oysters Crassostrea virginica and Hard Clams Mercenaria mercenaria in Shallow Estuaries. Mar. Ecol. Prog. Ser. 2017, 567, 125–137. [Google Scholar] [CrossRef]
  32. Coughlan, J. The Estimation of Filtering Rate from the Clearance of Suspensions. Mar. Biol. 1969, 2, 356–358. [Google Scholar] [CrossRef]
  33. Winter, J.E. The Filtration Rate of Mytilus Edulis and Its Dependence on Algal Concentration, Measured by a Continuous Automatic Recording Apparatus. Mar. Biol. 1973, 22, 317–328. [Google Scholar] [CrossRef]
  34. Urrutia, M.; Iglesias, J.; Navarro, E.; Prou, J. Feeding and Absorption in Cerastoderma Edule under Environmental Conditions in the Bay of Marennesoleron (Western France). J. Mar. Biol. Assoc. UK 1996, 76, 431–450. [Google Scholar] [CrossRef]
  35. Roy, K.; Miller, D.J.; Labarbera, M. Taphonomic Bias in Analyses of Drilling Predation: Effects of Gastropod Drill Holes on Bivalve Shell Strength. Palaios 1994, 9, 413–421. [Google Scholar] [CrossRef]
  36. DiRenzi, B.; Munroe, D.; Saba, G.; López, A. Biological Response of Spisula solidissima (Atlantic Surfclams) to Varying Carbonate Chemistry in the Mid-Atlantic Bight. In Proceedings of the OCEANS 2023–MTS/IEEE U.S. Gulf Coast, Biloxi, MS, USA, 25–28 September 2023; pp. 1–7. [Google Scholar]
  37. Navarro, J.M.; Duarte, C.; Manríquez, P.H.; Lardies, M.A.; Torres, R.; Acuña, K.; Vargas, C.A.; Lagos, N.A. Ocean Warming and Elevated Carbon Dioxide: Multiple Stressor Impacts on Juvenile Mussels from Southern Chile. ICES J. Mar. Sci. 2016, 73, 764–771. [Google Scholar] [CrossRef]
  38. Rastrick, S.P.S.; Collier, V.; Graham, H.; Strohmeier, T.; Whiteley, N.M.; Strand, Ø. Feeding Plasticity More than Metabolic Rate Drives the Productivity of Economically Important Filter Feeders in Response to Elevated CO2 and Reduced Salinity. ICES J. Mar. Sci. 2018, 75, 2117–2128. [Google Scholar] [CrossRef]
  39. Meseck, S.L.; Sennefelder, G.; Krisak, M.; Wikfors, G.H. Physiological Feeding Rates and Cilia Suppression in Blue Mussels (Mytilus edulis) with Increased Levels of Dissolved Carbon Dioxide. Ecol. Indic. 2020, 117, 106675. [Google Scholar] [CrossRef]
  40. Liang, J.; Liu, Y.; Zhu, F.; Li, Y.; Liang, S.; Guo, Y. Impact of Ocean Acidification on the Physiology of Digestive Gland of Razor Clams Sinonovacula constricta. Front. Mar. Sci. 2022, 9, 1010350. [Google Scholar] [CrossRef]
  41. Hiebenthal, C.; Philipp, E.E.R.; Eisenhauer, A.; Wahl, M. Effects of Seawater pCO2 and Temperature on Shell Growth, Shell Stability, Condition and Cellular Stress of Western Baltic Sea Mytilus edulis (L.) and Arctica islandica (L.). Mar. Biol. 2013, 160, 2073–2087. [Google Scholar] [CrossRef]
  42. Poach, M.; Munroe, D.; Vasslides, J.; Abrahamsen, I.; Coffey, N. Monitoring Coastal Acidification along the U.S. East Coast: Conerns for Shellfish Production. In Proceedings of the 45th Scientific Symposium of UJNR Aquaculture Panel, Hiroshima, Japan, 16–17 October 2017; Volume 49, pp. 53–64. [Google Scholar]
  43. Hennen, D.R.; Mann, R.; Munroe, D.M.; Powell, E.N. Biological Reference Points for Atlantic Surfclam (Spisula solidissima) in Warming Seas. Fish. Res. 2018, 207, 126–139. [Google Scholar] [CrossRef]
  44. Hornstein, J.; Pales Espinosa, E.; Cerrato, R.M.; Lwiza, K.M.M.; Allam, B. The Influence of Temperature Stress on the Physiology of the Atlantic Surfclam, Sp. Solidissima. Comp. Biochem. Phys. A 2018, 222, 66–73. [Google Scholar] [CrossRef] [PubMed]
  45. Acquafredda, M.P.; Munroe, D.M.; Ragone Calvo, L.M.; De Luca, M. The Effect of Rearing Temperature on the Survival and Growth of Early Juvenile Atlantic Surfclams (Spisula solidissima). Aquac. Rep. 2019, 13, 100176. [Google Scholar] [CrossRef]
  46. Pörtner, H.O.; Farrell, A.P. Physiology and Climate Change. Science 2008, 322, 690–692. [Google Scholar] [CrossRef]
  47. Parker, L.M.; Scanes, E.; O’Connor, W.A.; Coleman, R.A.; Byrne, M.; Pörtner, H.-O.; Ross, P.M. Ocean Acidification Narrows the Acute Thermal and Salinity Tolerance of the Sydney Rock Oyster Saccostrea glomerata. Mar. Pollut. Bull. 2017, 122, 263–271. [Google Scholar] [CrossRef] [PubMed]
  48. Clements, J.C. Elevated Temperature Has Adverse Effects on GABA-Mediated Avoidance Behaviour to Sediment Acidification in a Wide-Ranging Marine Bivalve. Mar. Biol. 2017, 11, 56. [Google Scholar] [CrossRef]
  49. Velasco, L.; Navarro, J. Feeding Physiology of Two Bivalves under Laboratory and Field Conditions in Response to Variable Food Concentrations. Mar. Ecol. Prog. Ser. 2005, 291, 115–124. [Google Scholar] [CrossRef]
  50. Bayne, B.L.; Iglesias, J.I.P.; Hawkins, A.J.S.; Navarro, E.; Heral, M.; Deslous-Paoli, J.M. Feeding Behaviour of the Mussel, Mytilus edulis: Responses to Variations in Quantity and Organic Content of the Seston. J. Mar. Biol. Ass. 1993, 73, 813–829. [Google Scholar] [CrossRef]
  51. Marsden, I.D. Respiration and Feeding of the Surf Clam Paphies Donacina from New Zealand. Hydrobologia 1999, 405, 179–188. [Google Scholar] [CrossRef]
  52. Iglesias, J.I.P.; Navarro, E.; Alvarez Jorna, P.; Armentina, I. Feeding, Particle Selection and Absorption in Cockles Cerastoderma edule (L.) Exposed to Variable Conditions of Food Concentration and Quality. J. Exp. Mar. Biol. Ecol. 1992, 162, 177–198. [Google Scholar] [CrossRef]
  53. Widdows, J. Physiological Adaptation of Mytilus edulis to Cyclic Temperatures. J. Comp. Physiol. B 1976, 105, 115–128. [Google Scholar] [CrossRef]
  54. Small, D.P.; Milazzo, M.; Bertolini, C.; Graham, H.; Hauton, C.; Hall-Spencer, J.M.; Rastrick, S.P.S. Temporal Fluctuations in Seawater pCO2 May Be as Important as Mean Differences When Determining Physiological Sensitivity in Natural Systems. ICES J. Mar. Sci. 2016, 73, 604–612. [Google Scholar] [CrossRef]
  55. Connor, K.; Gracey, A.Y. Cycles of Heat and Aerial-Exposure Induce Changes in the Transcriptome Related to Cell Regulation and Metabolism in Mytilus californianus. Mar. Biol. 2020, 167, 132. [Google Scholar] [CrossRef]
  56. Bitter, M.C.; Kapsenberg, L.; Silliman, K.; Gattuso, J.-P.; Pfister, C.A. Magnitude and Predictability of pH Fluctuations Shape Plastic Responses to Ocean Acidification. Am. Nat. 2021, 197, 486–501. [Google Scholar] [CrossRef]
  57. Zhang, H.; Shin, P.K.S.; Cheung, S.G. Physiological Responses and Scope for Growth upon Medium-Term Exposure to the Combined Effects of Ocean Acidification and Temperature in a Subtidal Scavenger Nassarius conoidalis. Mar. Environ. Res. 2015, 106, 51–60. [Google Scholar] [CrossRef] [PubMed]
  58. Thomsen, J.; Casties, I.; Pansch, C.; Körtzinger, A.; Melzner, F. Food Availability Outweighs Ocean Acidification Effects in Juvenile Mytilus edulis: Laboratory and Field Experiments. Glob. Chang. Biol. 2013, 19, 1017–1027. [Google Scholar] [CrossRef] [PubMed]
  59. Swanson, L.; Sindermann, C.J. Oxygen Depletion and Associated Benthic Mortalities in New York Bight, 1976. NOAA Prof. Pap. 1979, 11, 345. [Google Scholar] [CrossRef]
Figure 1. (A). Continuous monitoring from the medium pH treatment (15 min intervals between 6 June and 19 July 2023) of A. Temperature (°C), (B). Oxygen (mg L−1), (C). Salinity, and (D). pH (medium treatment). Red boxes indicate days on which growth and feeding measurements were taken (1 day, 2 weeks, and 6 weeks after the beginning of the experiment). Numbers next to red boxes are the mean environmental conditions for each experiment day.
Jmse 12 00673 g001
Figure 2. Surfclam growth measurements across all pH treatments (black = ambient, gray = medium, white = low) and experiment times. (A). Dry tissue weight (g). (B). Shell length (mm). (C). Shell thickness (mm). (D). Shell strength (N mm−1). (E). Condition index. Boxplots reflect interquartile range, with the median in the middle. Overlaid circles are raw data points. Asterisks indicate statistically different pH treatments within each experiment time (* p < 0.05, ** p < 0.01, *** p < 0.001). For statistical comparisons across experimental times, see Table 4.
Jmse 12 00673 g002
Figure 3. Surfclam feeding and digestive physiology measurements in response to pH treatments (black = ambient, gray = medium, white = low) over time. (A). Clearance rate (L h−1). (B). Filtration rate (mg h−1). (C). Rejection rate (mg h−1). (D). Organic ingestion rate (mg h−1). (E). Absorption rate (mg h−1). (F). Egestion rate (mg h−1). For definitions of rates, see Table 1. Boxplots reflect interquartile range, with the median in the middle. Overlaid circles are raw data points. Asterisks indicate statistically different pH treatments within each experiment time (* p < 0.05, ** p < 0.01, *** p < 0.001, **** p < 0.0001). For statistical comparisons across experimental times, see Table 5.
Jmse 12 00673 g003
Table 1. Definitions of feeding and digestion physiological rates measured in this experiment following the methods of [15,30]. Adapted from [31].
TermDefinition UnitsReferences
Clearance RateVolume of water cleared of particles, by the bivalve, per unit time L h−1Coughlan 1969 ref. [32]
Filtration RateVolume of water cleared of particles, by the bivalve, per unit time mg h−1Winter 1973 ref. [33]
Rejection Rate Mass of pseudofeces production (rejected material, captured but not ingested) per unit time mg h−1Iglesias et al., 1998 ref. [27]
Organic Ingestion Rate Mass of organic material ingested per unit time mg h−1Iglesias et al., 1998 ref. [27]
Absorption Rate Uptake of nutrients across gut surface per time, often measured as organic ingestion rate minus organic egestion rate mg h−1(Urrutia et al., 1996 ref. [34]
Egestion Rate Mass of feces production per unit time mg h−1Iglesias et al., 1998 ref. [27]
Table 2. Summary of ambient diet availability on each experiment day (mean ± standard deviation). Total particulate matter (TPM (mg L−1)), particulate organic matter (POM (mg L−1)), organic percentage (%organic). Superscripts indicate statistical differences between experiment times for each diet variable (p < 0.05, post hoc testing).
Diet 1 Day2 Weeks6 Weeks
TPM (mg L−1)55.43 ± 22.31 a50.06 ± 15.20 a29.23 ± 14.34 b
POM (mg L−1)7.81 ± 3.00 a6.10 ± 1.97 b4.67 ± 1.22 c
%Organic 14.39 ± 21.3 a12.46 ± 3.12 a17.50 ± 4.50 b
Table 3. Summary of water quality and carbonate chemistry analysis from each experimental treatment (mean ± standard deviation). Measured values are temperature (°C), dissolved oxygen (mg L−1), salinity, pH (seawater scale), dissolved organic carbon (DIC, μmol kg−1), and total alkalinity (μmol kg−1). Values calculated from COS2SYS indicated with asterisk superscript (*) are ρCO2 (μatm) and Ωaragonite. Superscripts indicate statistical differences between pH treatment groups (p < 0.05, post hoc testing).
pH Treatment
Ambient MediumLow
Temperature (°C)22.13 ± 2.0622.07 ± 2.0921.99 ± 2.10
Oxygen (mgL−1)6.92 ± 0.436.92 ± 0.456.99 ± 0.43
Salinity30.66 ± 1.2930.64 ± 1.2830.63 ± 1.27
pH in situ
(seawater scale)
7.81 ± 0.07 a7.51 ± 0.11 b7.20 ± 0.10 c
DIC
(μmol kg−1)
1992.68 ± 70.31 a2097.79 ± 66.61 a,b2178.28 ± 98.04 b
Total alkalinity
(μmol/kg)
2080.79 ± 58.152084.18 ± 54.962085.90 ± 53.64
ρCO2 * (μatm)1002.10 ± 288.35 a2274.74 ± 369.15 b4293.57 ± 1289.67 c
Ω *
Aragonite
1.30 ± 0.27 a0.62 ± 0.09 b0.37 ± 0.11 c
Table 4. Summary (mean ± standard deviation) of growth parameters with statistics for each pH treatment and sampling time (including average temperature on the sampling day). Superscript letters indicate statistically significant groupings (p < 0.05, post hoc testing with Bonferroni correction) within each pH treatment across sampling times. Interaction p-values indicate statistically significant interaction terms between pH treatment and sampling time with respect to each growth measurement.
Growth
Measurement
pH
Treatment
Sampling Time (Temperature °C)Interaction p-Value
1 Day (18.9 °C)2 Weeks (20.3 °C)6 Weeks (23.5 °C)
Dry Tissue Weight (g)Ambient 0.25 ± 0.04 a0.31 ± 0.06 a0.50 ± 0.04 b0.389
Medium 0.34 ± 0.06 a0.43 ± 0.08 a0.66 ± 0.17 b
Low0.28 ± 0.28 a0.39 ± 0.06 a0.53 ± 0.09 b
Shell Length (mm) Ambient 31.03 ± 1.33 a 32.17 ± 2.54 a 39.86 ± 1.56 b0.019
Medium34.13 ± 1.51 a36.56 ± 1.07 a40.69 ± 2.61 b
Low32.16 ± 1.87 a35.53 ± 1.58 b39.19 ± 1.89 c
Shell Thickness (mm) Ambient 0.70 ± 0.060.78 ± 0.090.79 ± 0.050.376
Medium 0.81 ± 0.120.80 ± 0.090.88 ± 0.06
Low0.79 ± 0.100.79 ± 0.120.80 ± 0.09
Shell Strength (N/mm)Ambient 76.70 ± 19.9680.05 ± 24.6794.61 ± 23.030.828
Medium 86.61 ± 26.6983.02 ± 14.24113.37 ± 34.14
Low77.84 ± 20.2161.16 ± 19.2390.96 ± 27.21
Condition Index Ambient 0.12 ± 0.010.13 ± 0.010.11 ± 0.000.480
Medium0.13 ± 0.020.14 ± 0.010.14 ± 0.02
Low0.12 ± 0.010.13 ± 0.020.12 ± 0.01
Table 5. Summary of physiological feeding and digestion rates with statistics for each pH treatment and sampling time (including average temperature on each sampling day). Superscript letters indicate statistically significant groupings (p < 0.05, post hoc testing with Bonferroni correction) within each pH treatment across sampling times. Interaction p-values indicate statistically significant interaction terms between pH treatment and sampling time with respect to each physiological rate.
Physiological RatepH Treatment Sampling Time Interaction p-Value
1 Day (18.9 °C)2 Weeks (20.3 °C)6 Weeks (23.5 °C)
Clearance
Rate (L h−1)
Ambient 1.18 ± 0.24 a1.13 ± 0.36 a0.25 ± 0.12 bp < 0.001
Medium 0.85 ± 0.64 a0.71 ± 0.17 a,b0.32 ± 0.17 b
Low0.59 ± 0.120.45 ± 0.260.64 ± 0.28
Filtration
Rate (mg h−1)
Ambient 54.80 ± 11.14 a62.25 ± 19.75 a10.05 ± 4.55 bp < 0.001
Medium 53.08 ± 39.89 a42.59 ± 10.40 a10.59 ± 5.54 b
Low32.42 ± 6.65 21.14 ± 11.96 11.00 ± 4.73
Rejection
Rate (mg h−1)
Ambient 34.94 ± 7.94 a44.97± 14.77 a5.20 ± 2.86 bp < 0.001
Medium 40.07 ± 31.26 a30.97 ± 8.32 a7.90 ± 4.86 b
Low19.22 ± 4.63 14.99 ± 8.566.07 ± 3.45
Organic Ingestion
Rate (mg h−1)
Ambient 16.24 ± 3.52 a13.24 ± 5.87 a4.29 ± 2.01 bp < 0.05
Medium 9.13 ± 7.19 a8.28 ± 2.84 a1.85 ± 1.38 b
Low10.99 ± 2.40 a4.76 ± 3.39 b4.32 ± 2.47 b
Absorption
Rate (mg h−1)
Ambient 13.42 ± 3.53 a11.93 ± 5.56 a3.80 ± 1.88 bp < 0.05
Medium 8.00 ± 6.56 a7.04 ± 2.53 a1.58 ± 1.35 b
Low9.67 ± 2.27 a4.02 ± 2.65 b3.91 ± 2.31 b
Egestion
Rate (mg h−1)
Ambient 17.22 ± 3.35 a16.30 ± 6.33 a4.54 ± 1.83 bp < 0.01
Medium 10.34 ± 7.45 a10.72 ± 3.22 a2.61 ± 1.23 b
Low12.40 ± 2.49 a5.18 ± 3.39 a,b3.65 ± 2.05 b
Disclaimer/Publisher’s Note: The statements, opinions and data contained in all publications are solely those of the individual author(s) and contributor(s) and not of MDPI and/or the editor(s). MDPI and/or the editor(s) disclaim responsibility for any injury to people or property resulting from any ideas, methods, instructions or products referred to in the content.

