
Assessing the Potential for Energy Efficiency Improvement through Cold Ironing: A Monte Carlo Analysis with Real Port Data
 , ,
, , 
Abstract
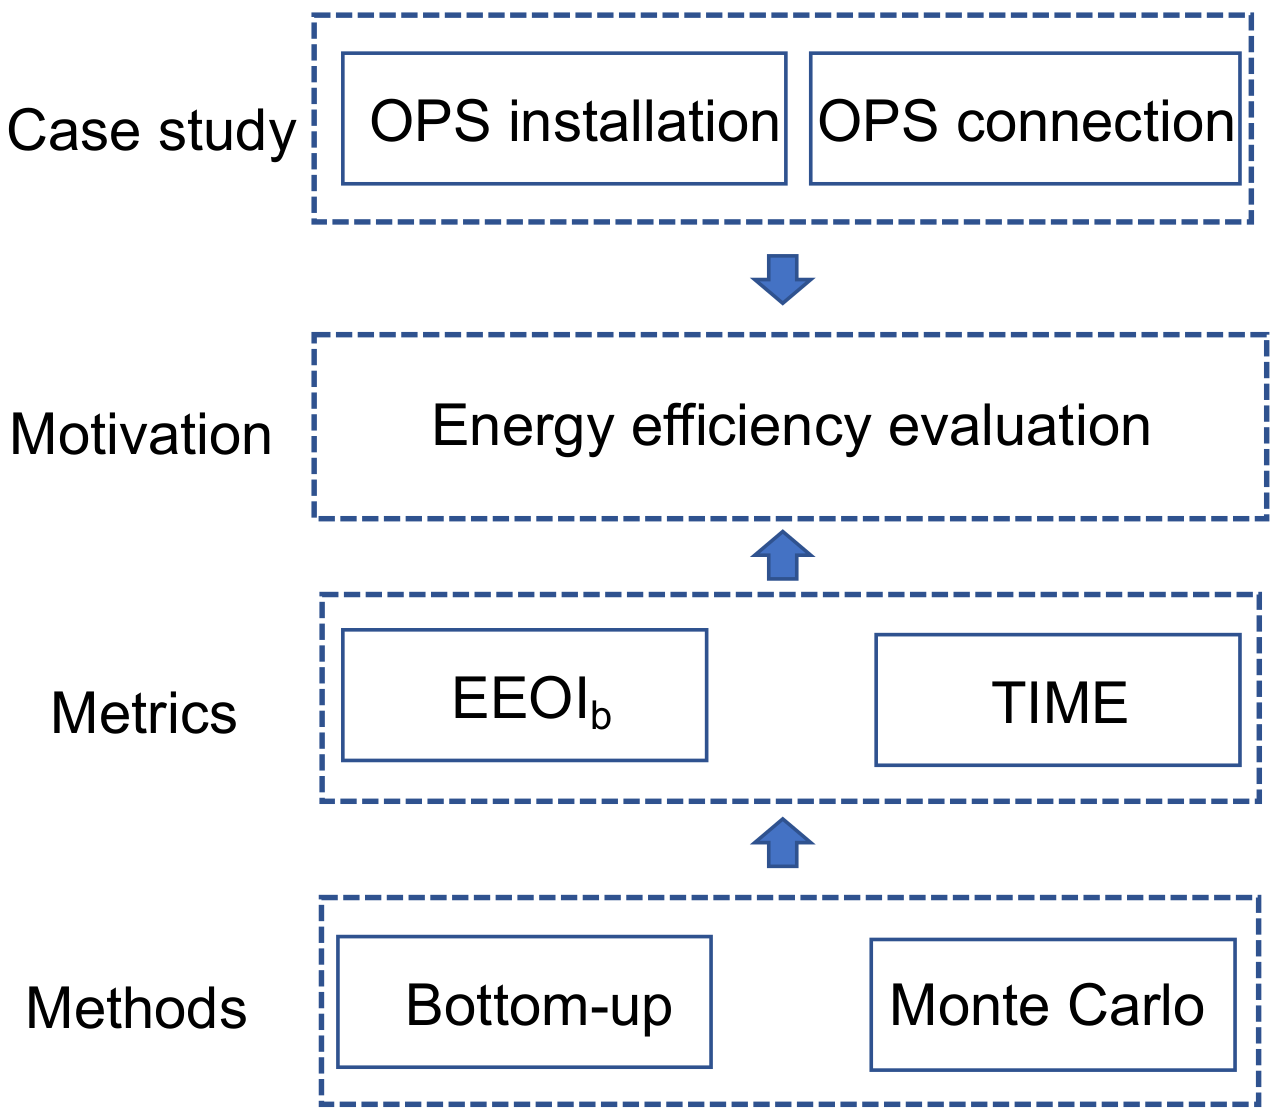
:1. Introduction
2. Literature Review
2.1. Energy Efficiency
2.2. Emissions Evaluation of Ships
2.3. OPS Adoption
2.4. Research Gap
3. Methods
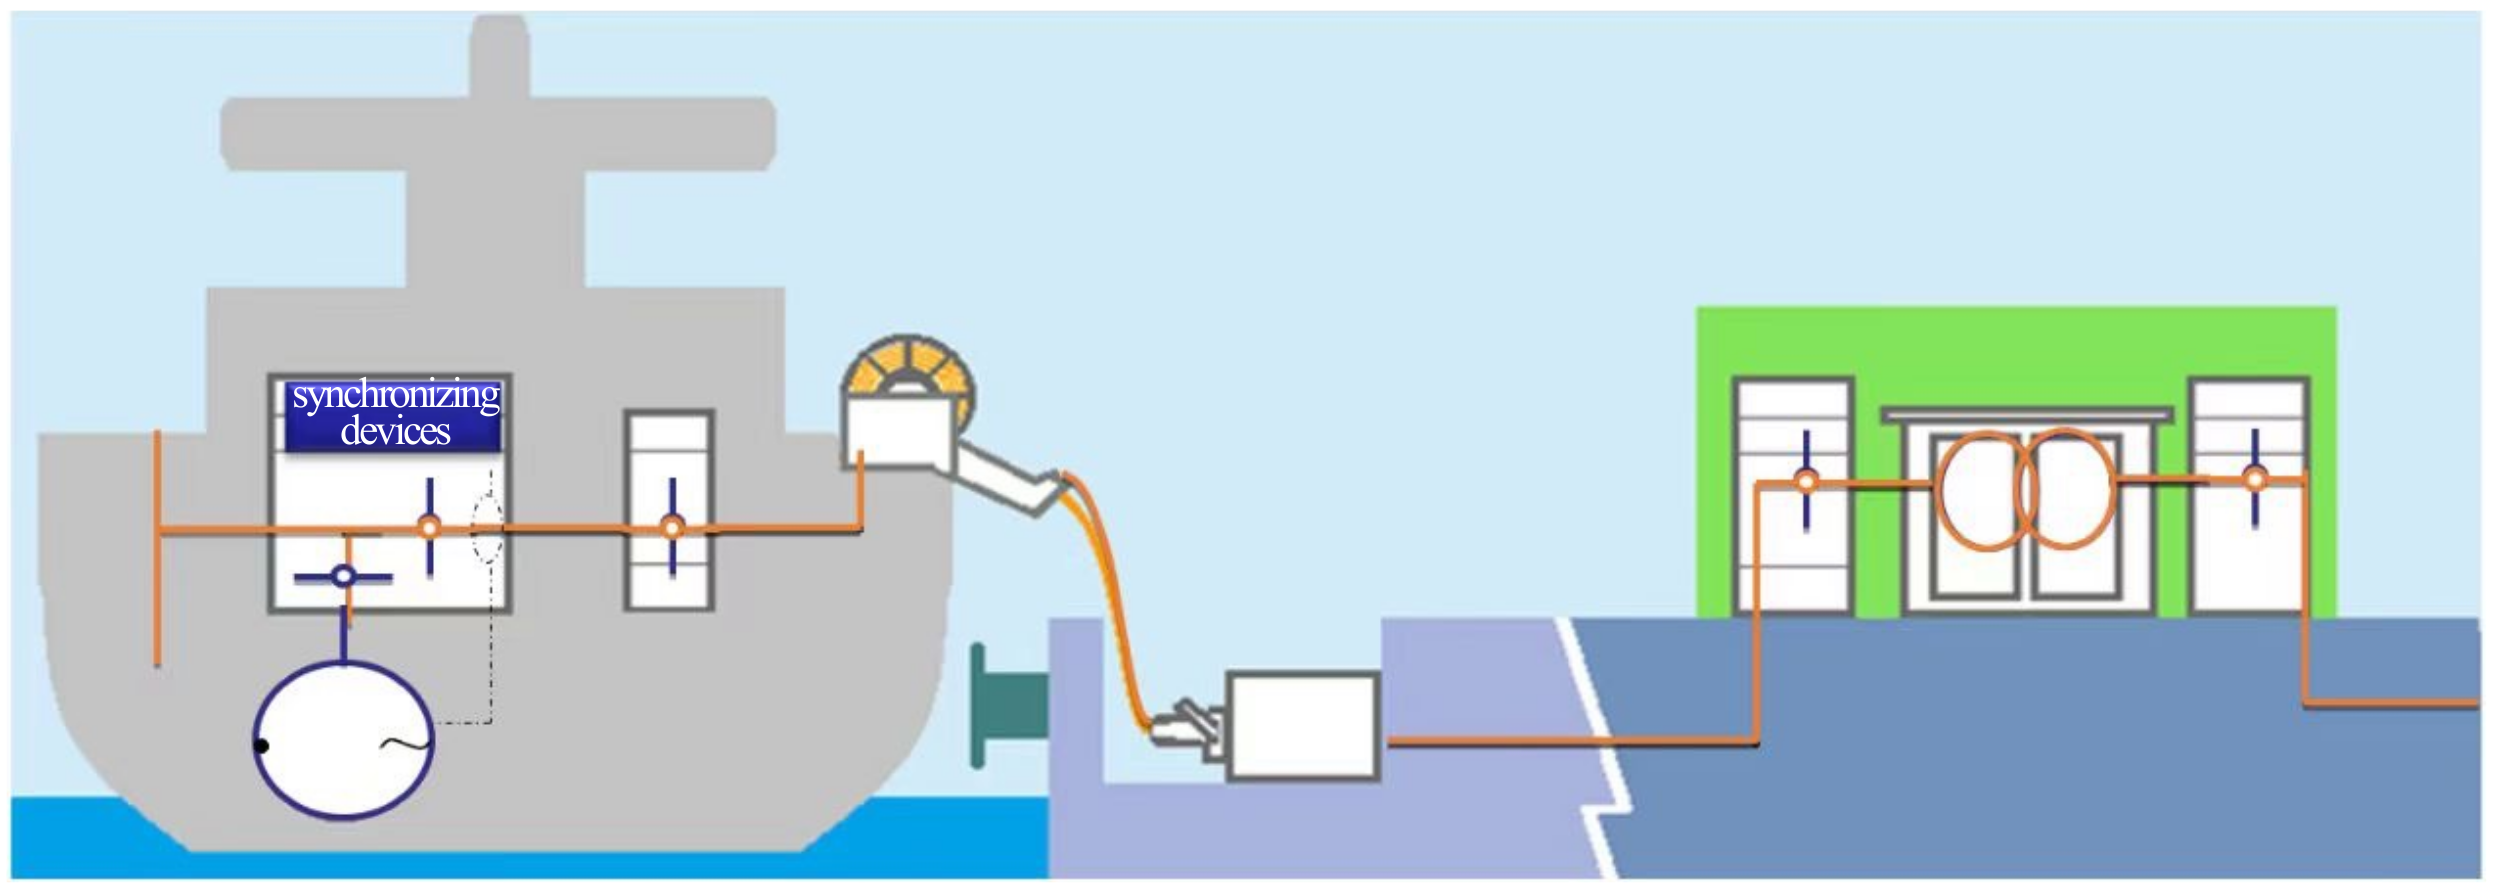
3.1. Cold Ironing
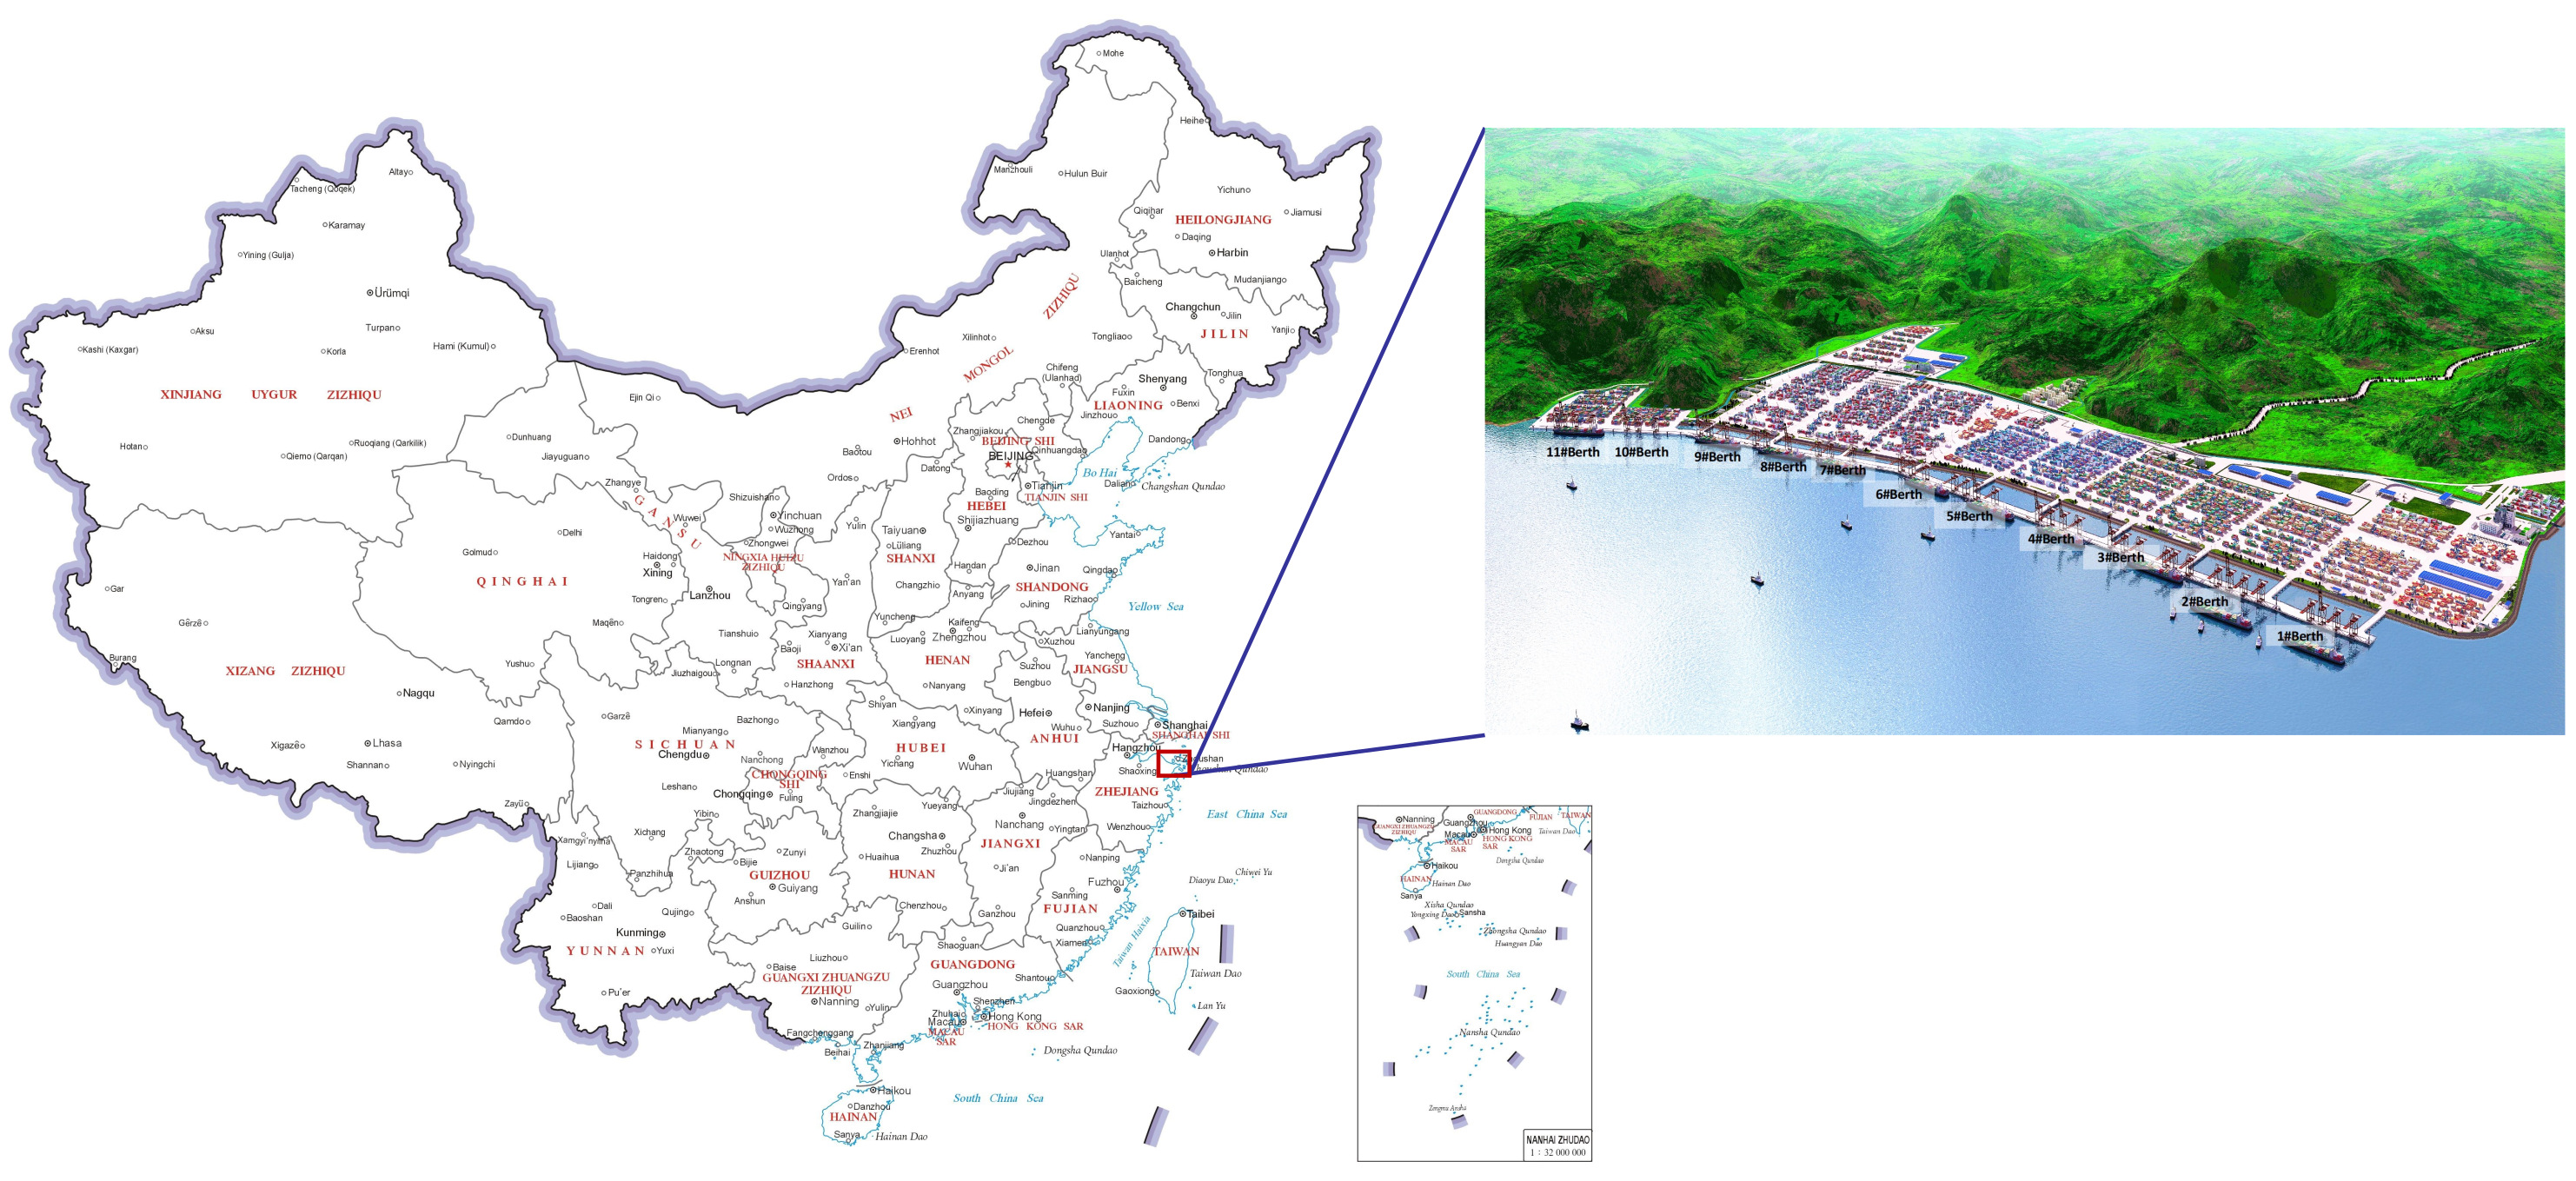
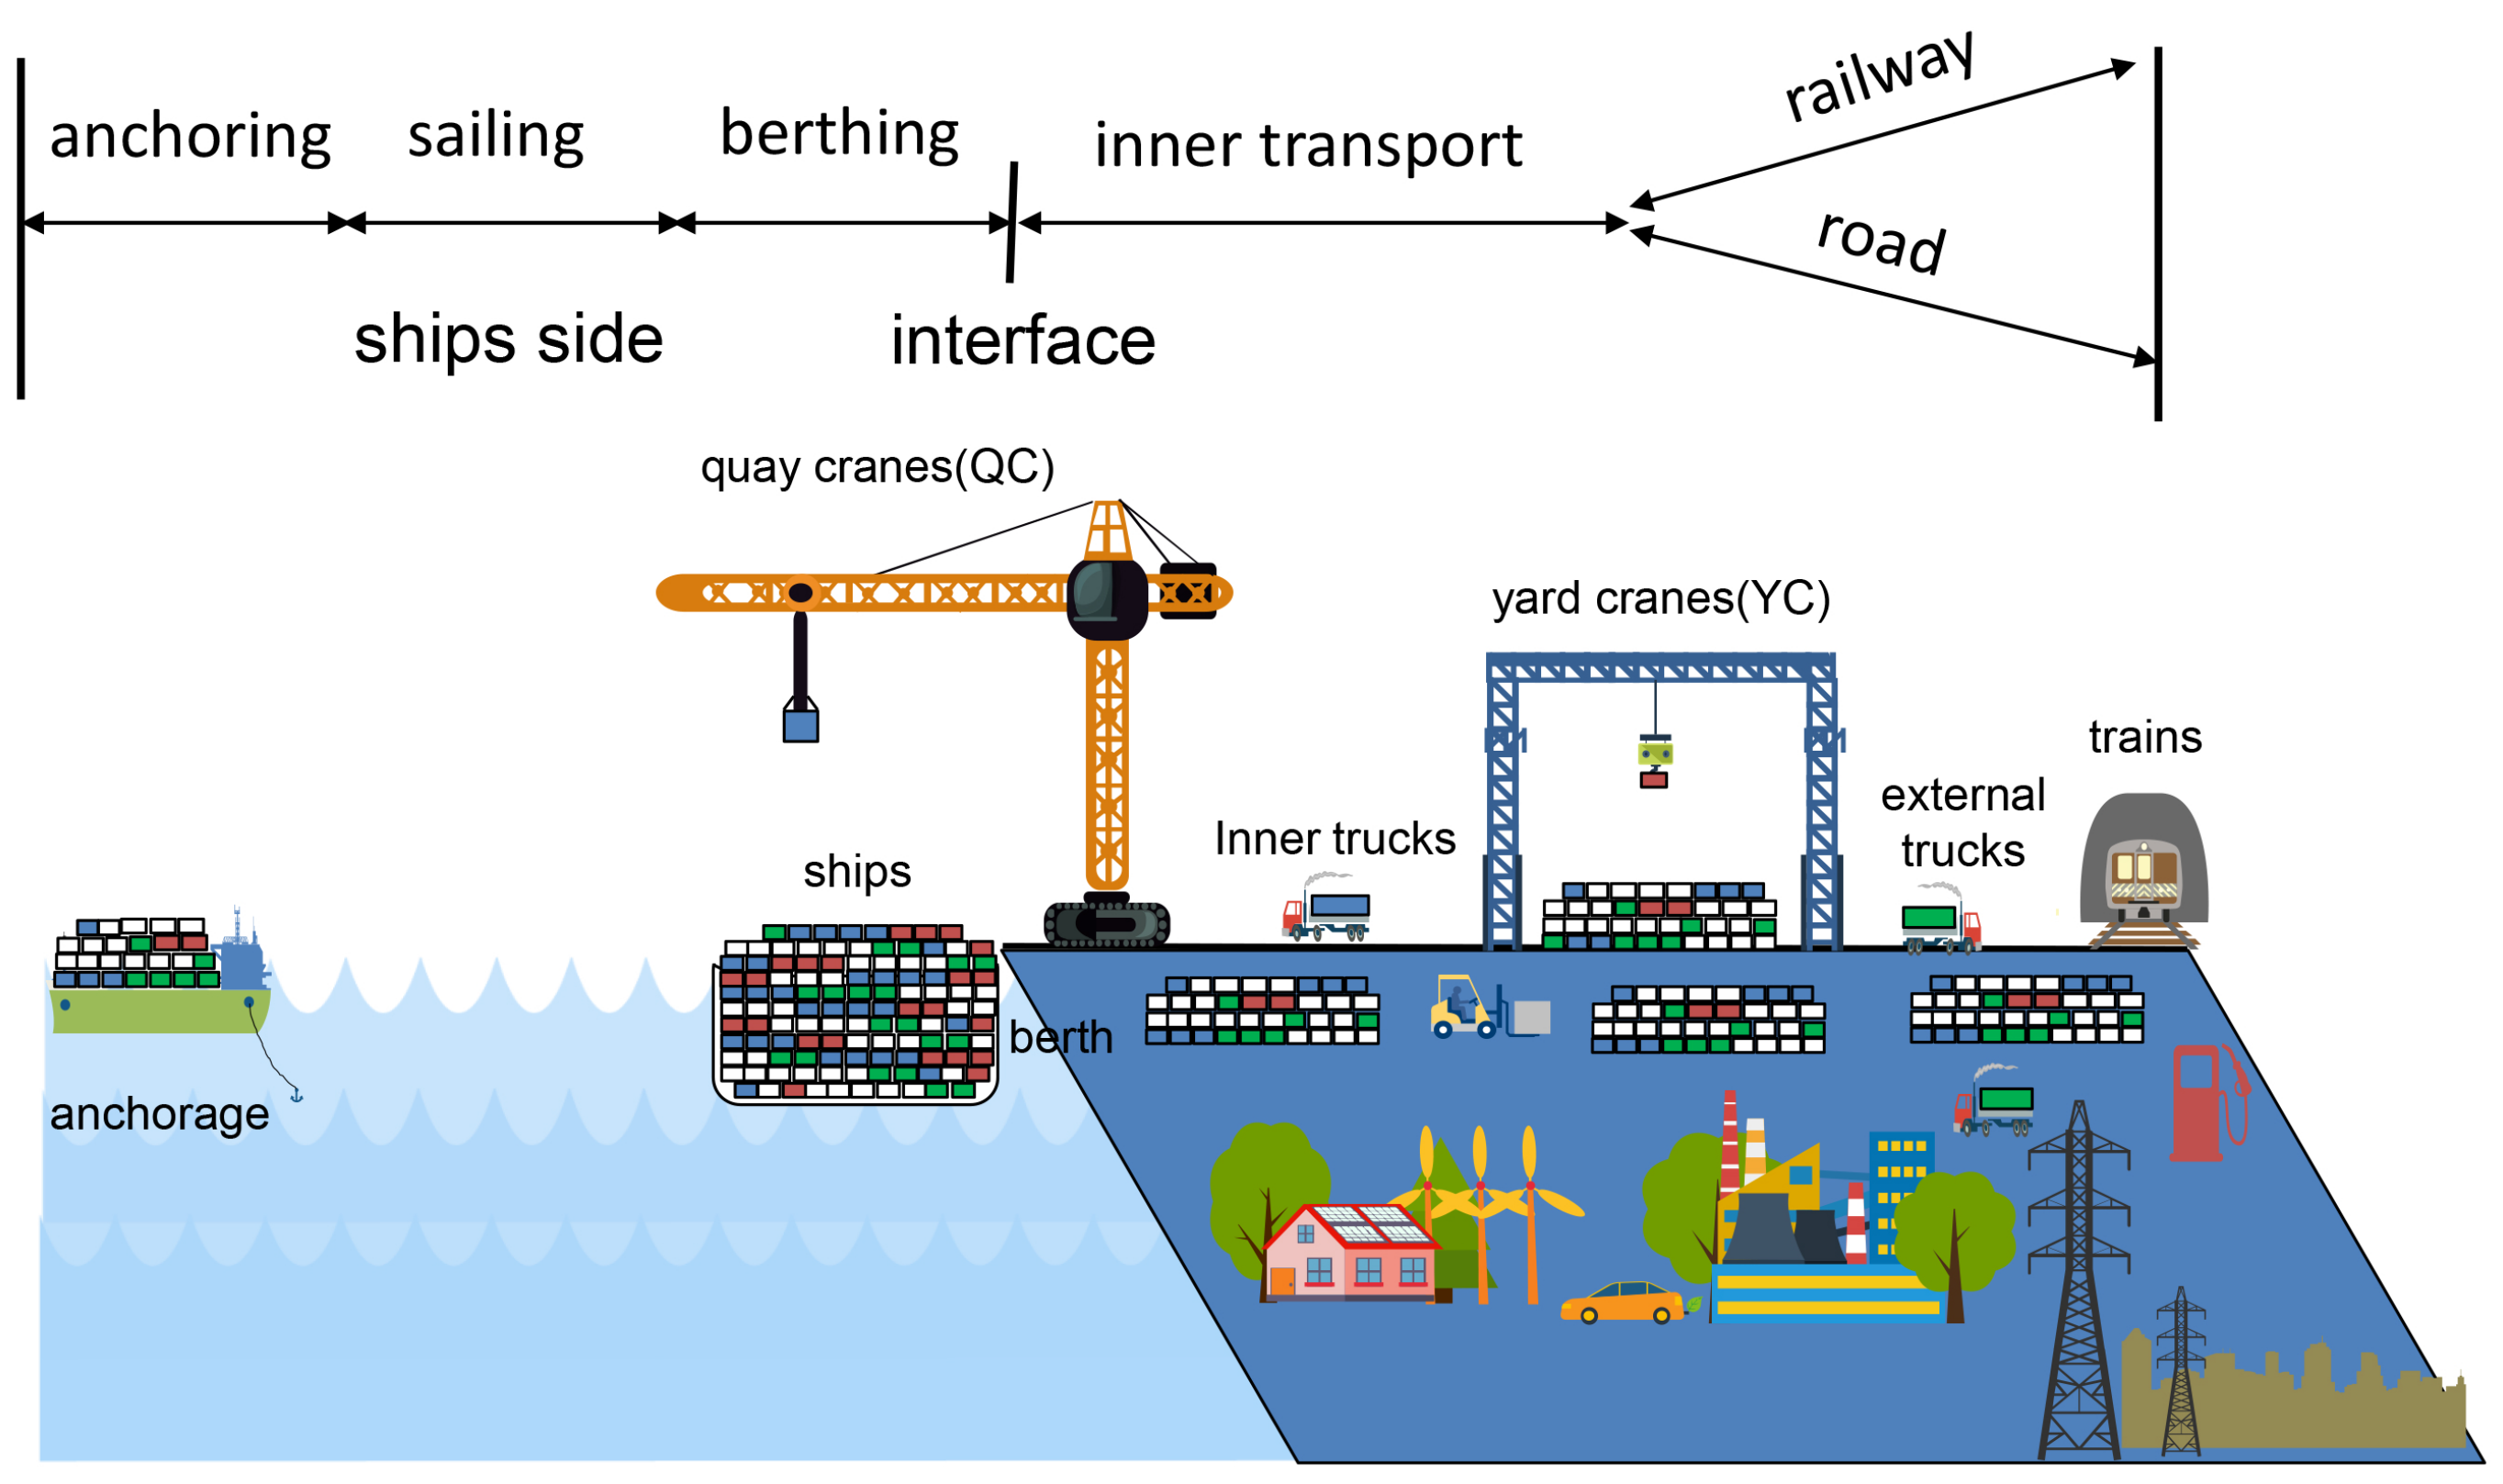
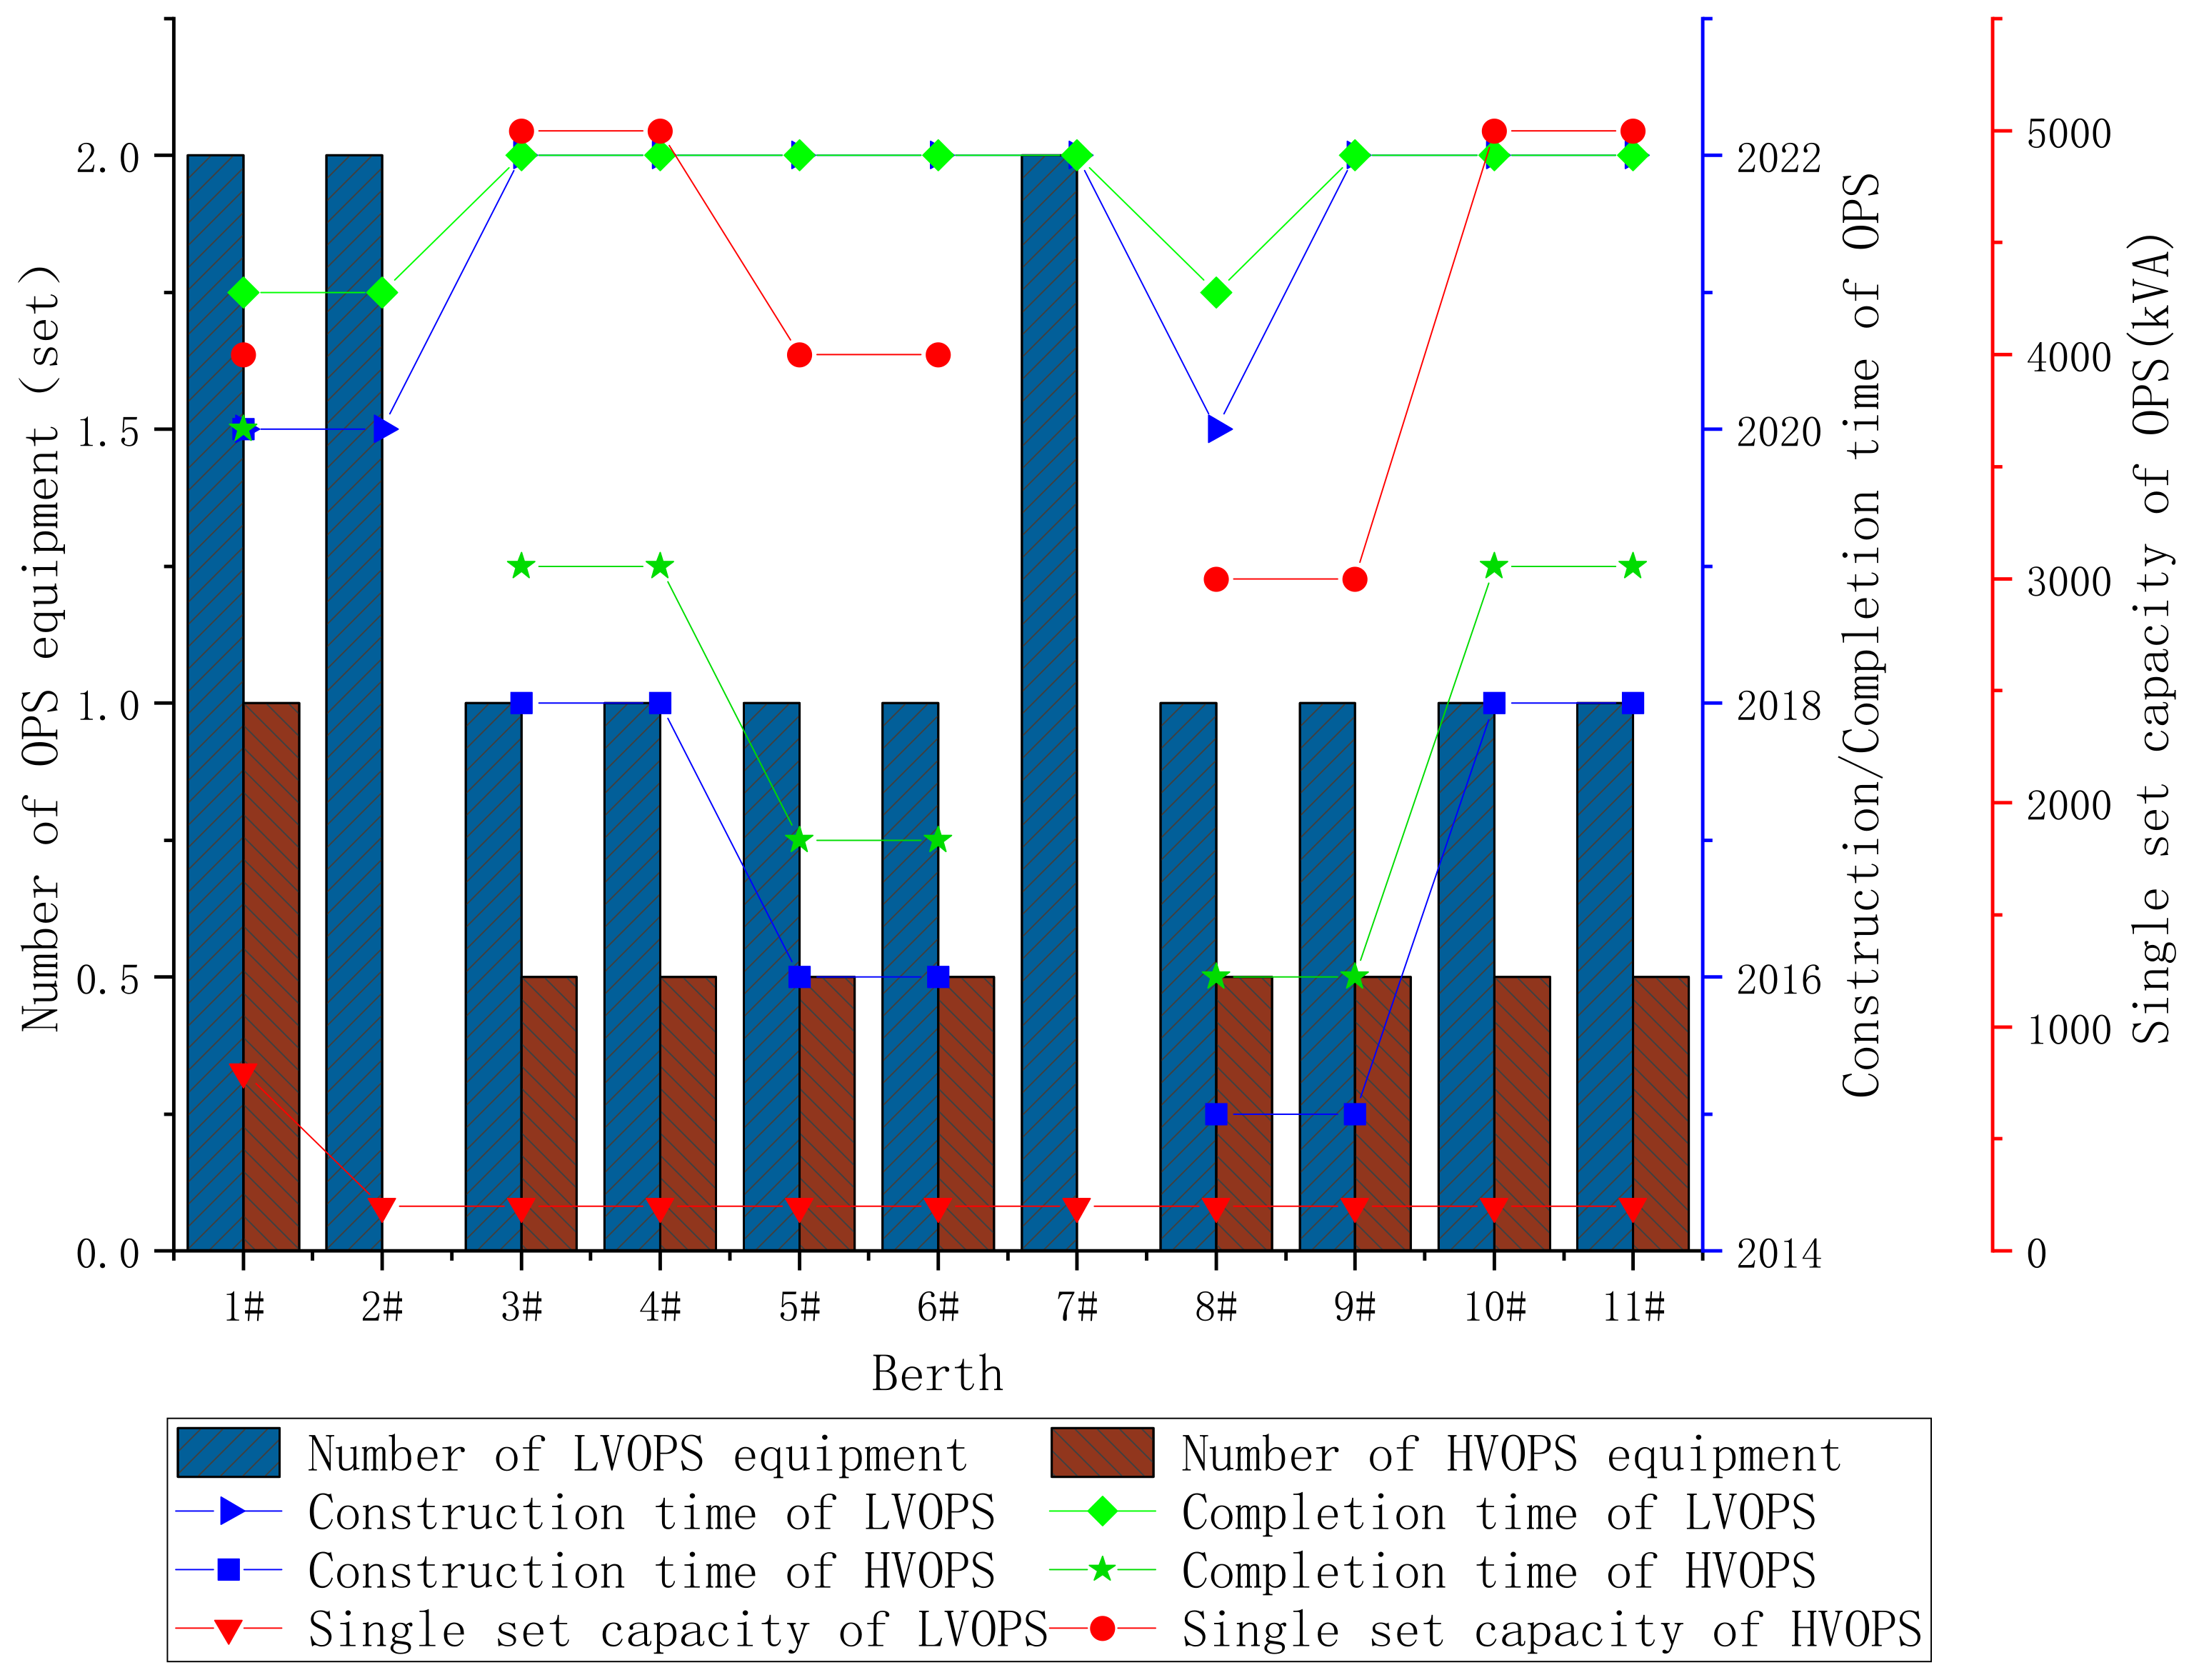
3.2. The Studied Port Area
3.3. Energy Efficiency Index of Berthed Ships
- -
- j: fuel types used;
- -
- i: navigation voyage number;
- -
- : fuel consumption of fuel type i in voyage j;
- -
- : fuel mass to CO mass conversion factor with fuel j;
- -
- : weight of cargo carried on ship;
- -
- : distance of voyage i.
- -
- : energy efficiency operational index of berthed ship i;
- -
- : energy demand of a berthed ship i, kWh;
- -
- : CO emission factor of auxiliary engine, g/kWh.
3.4. Data Resources
4. Results
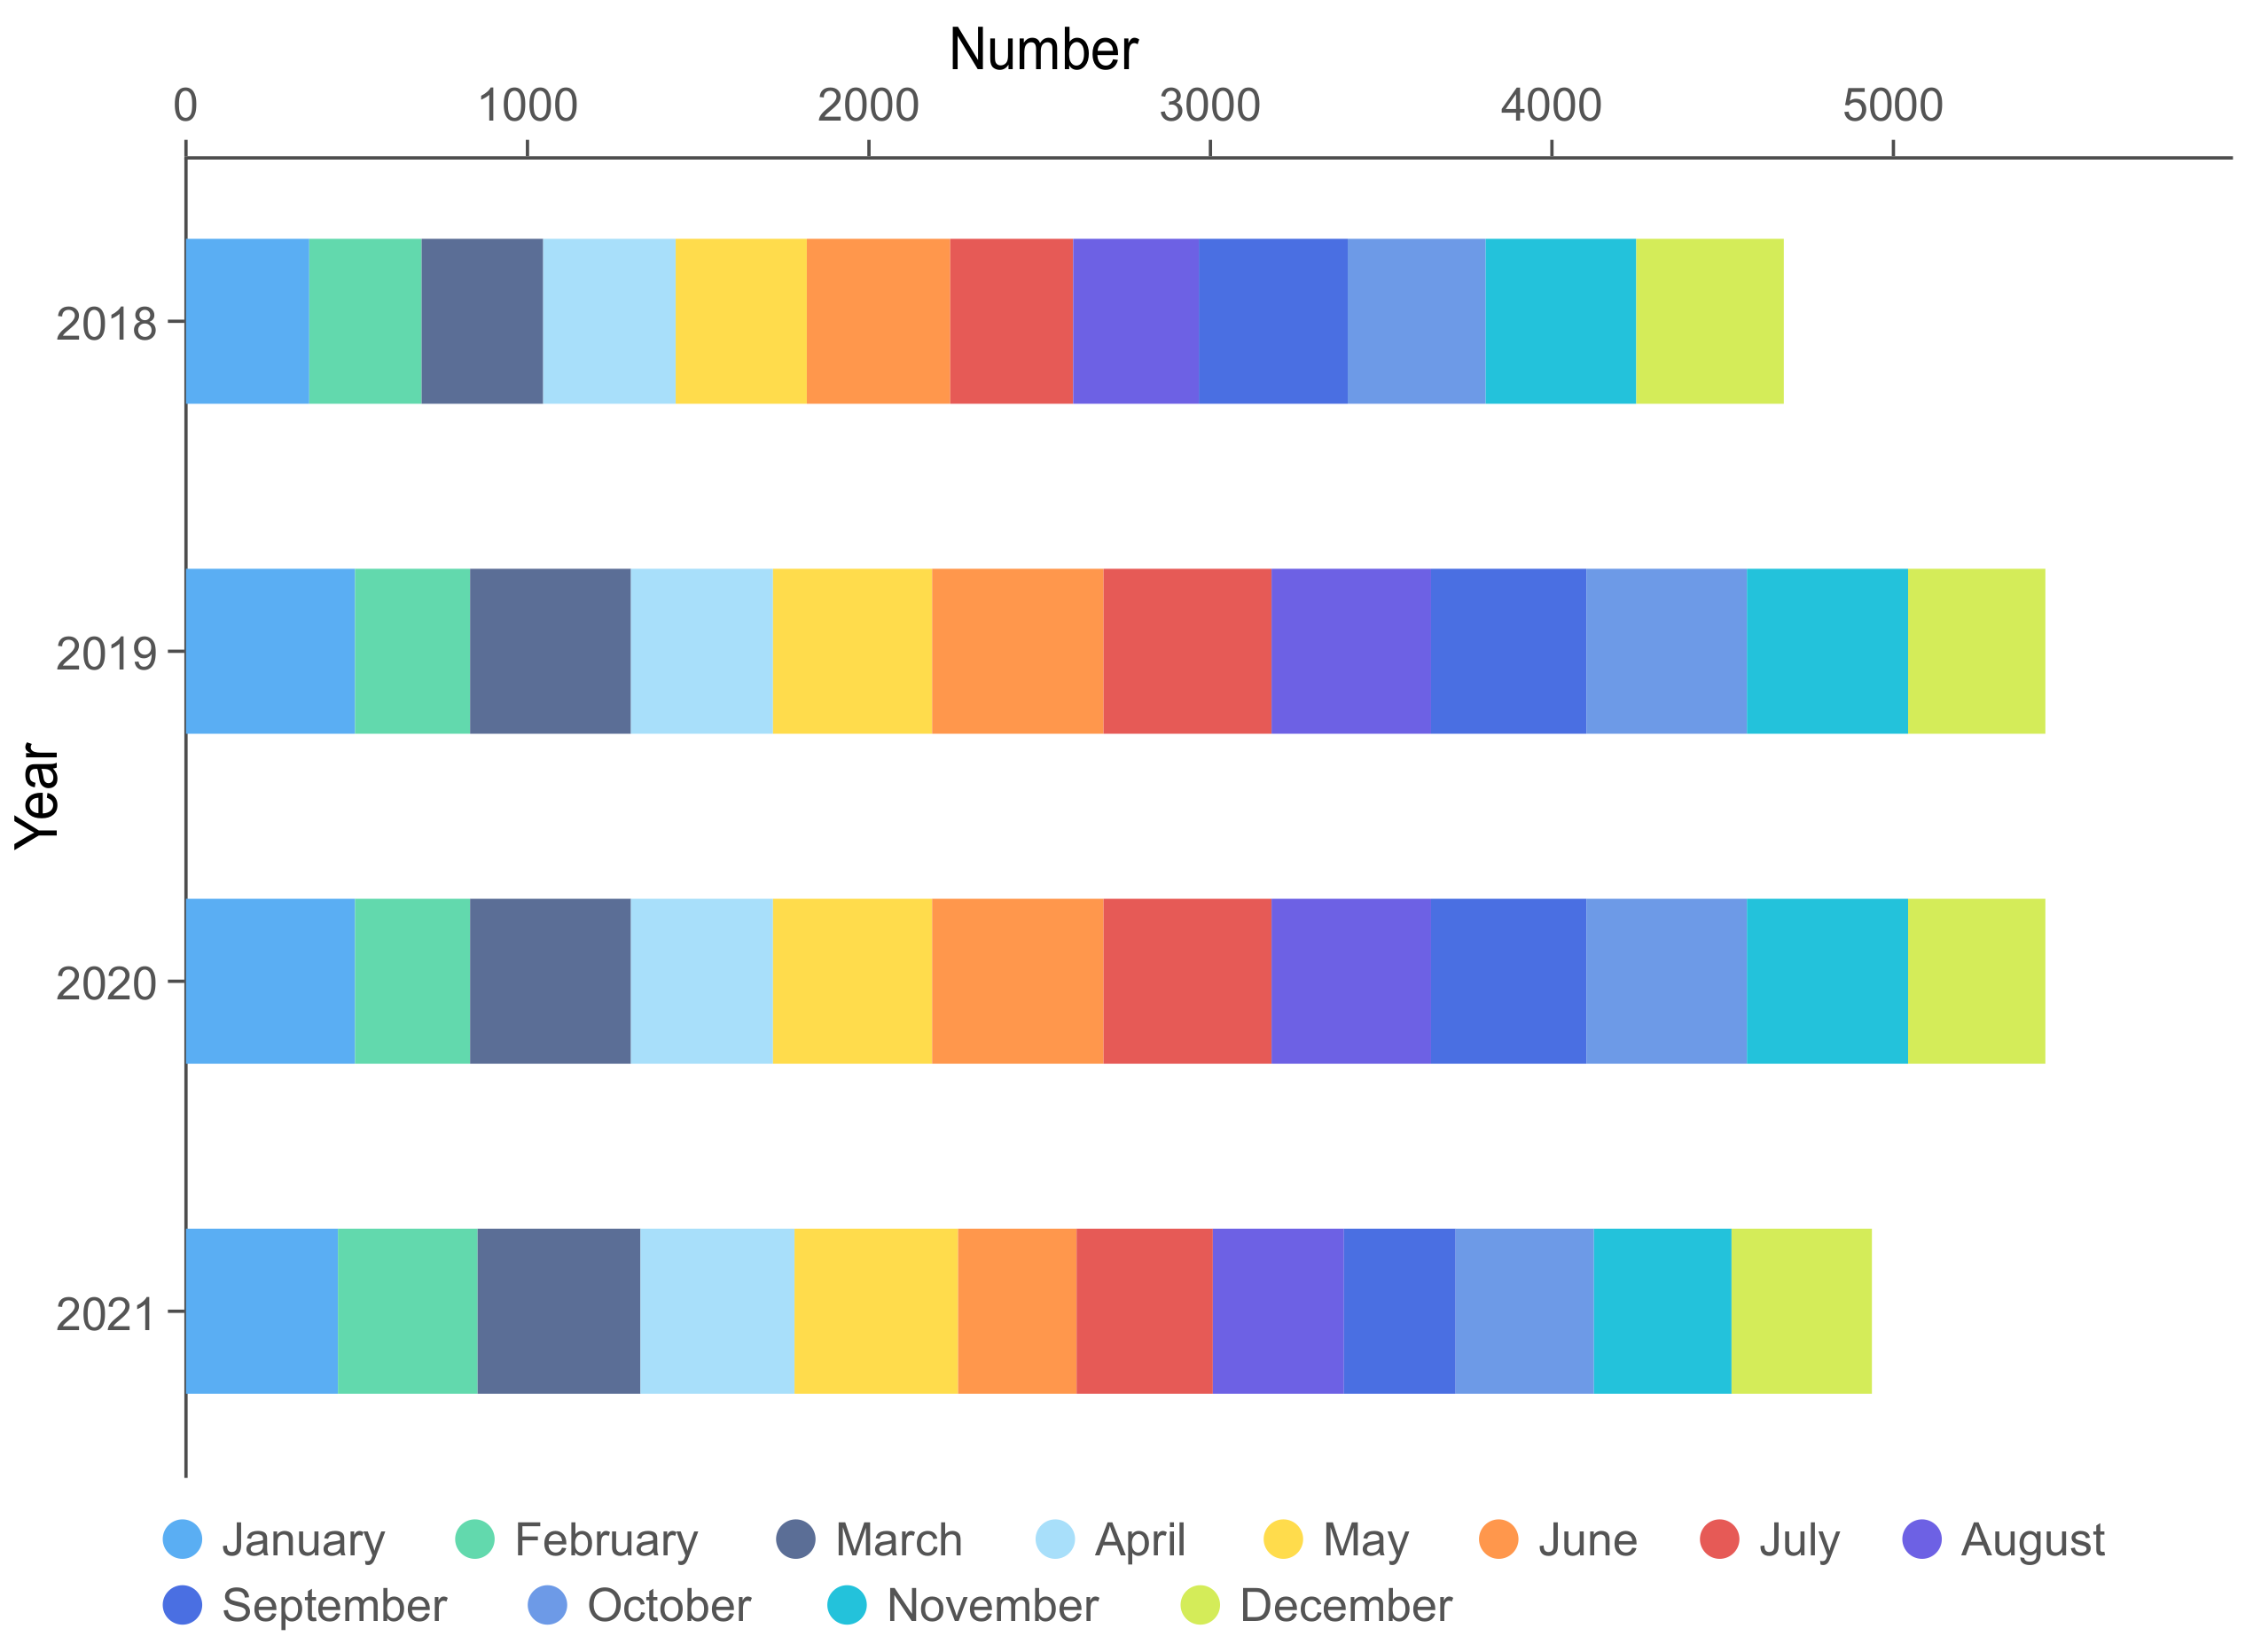
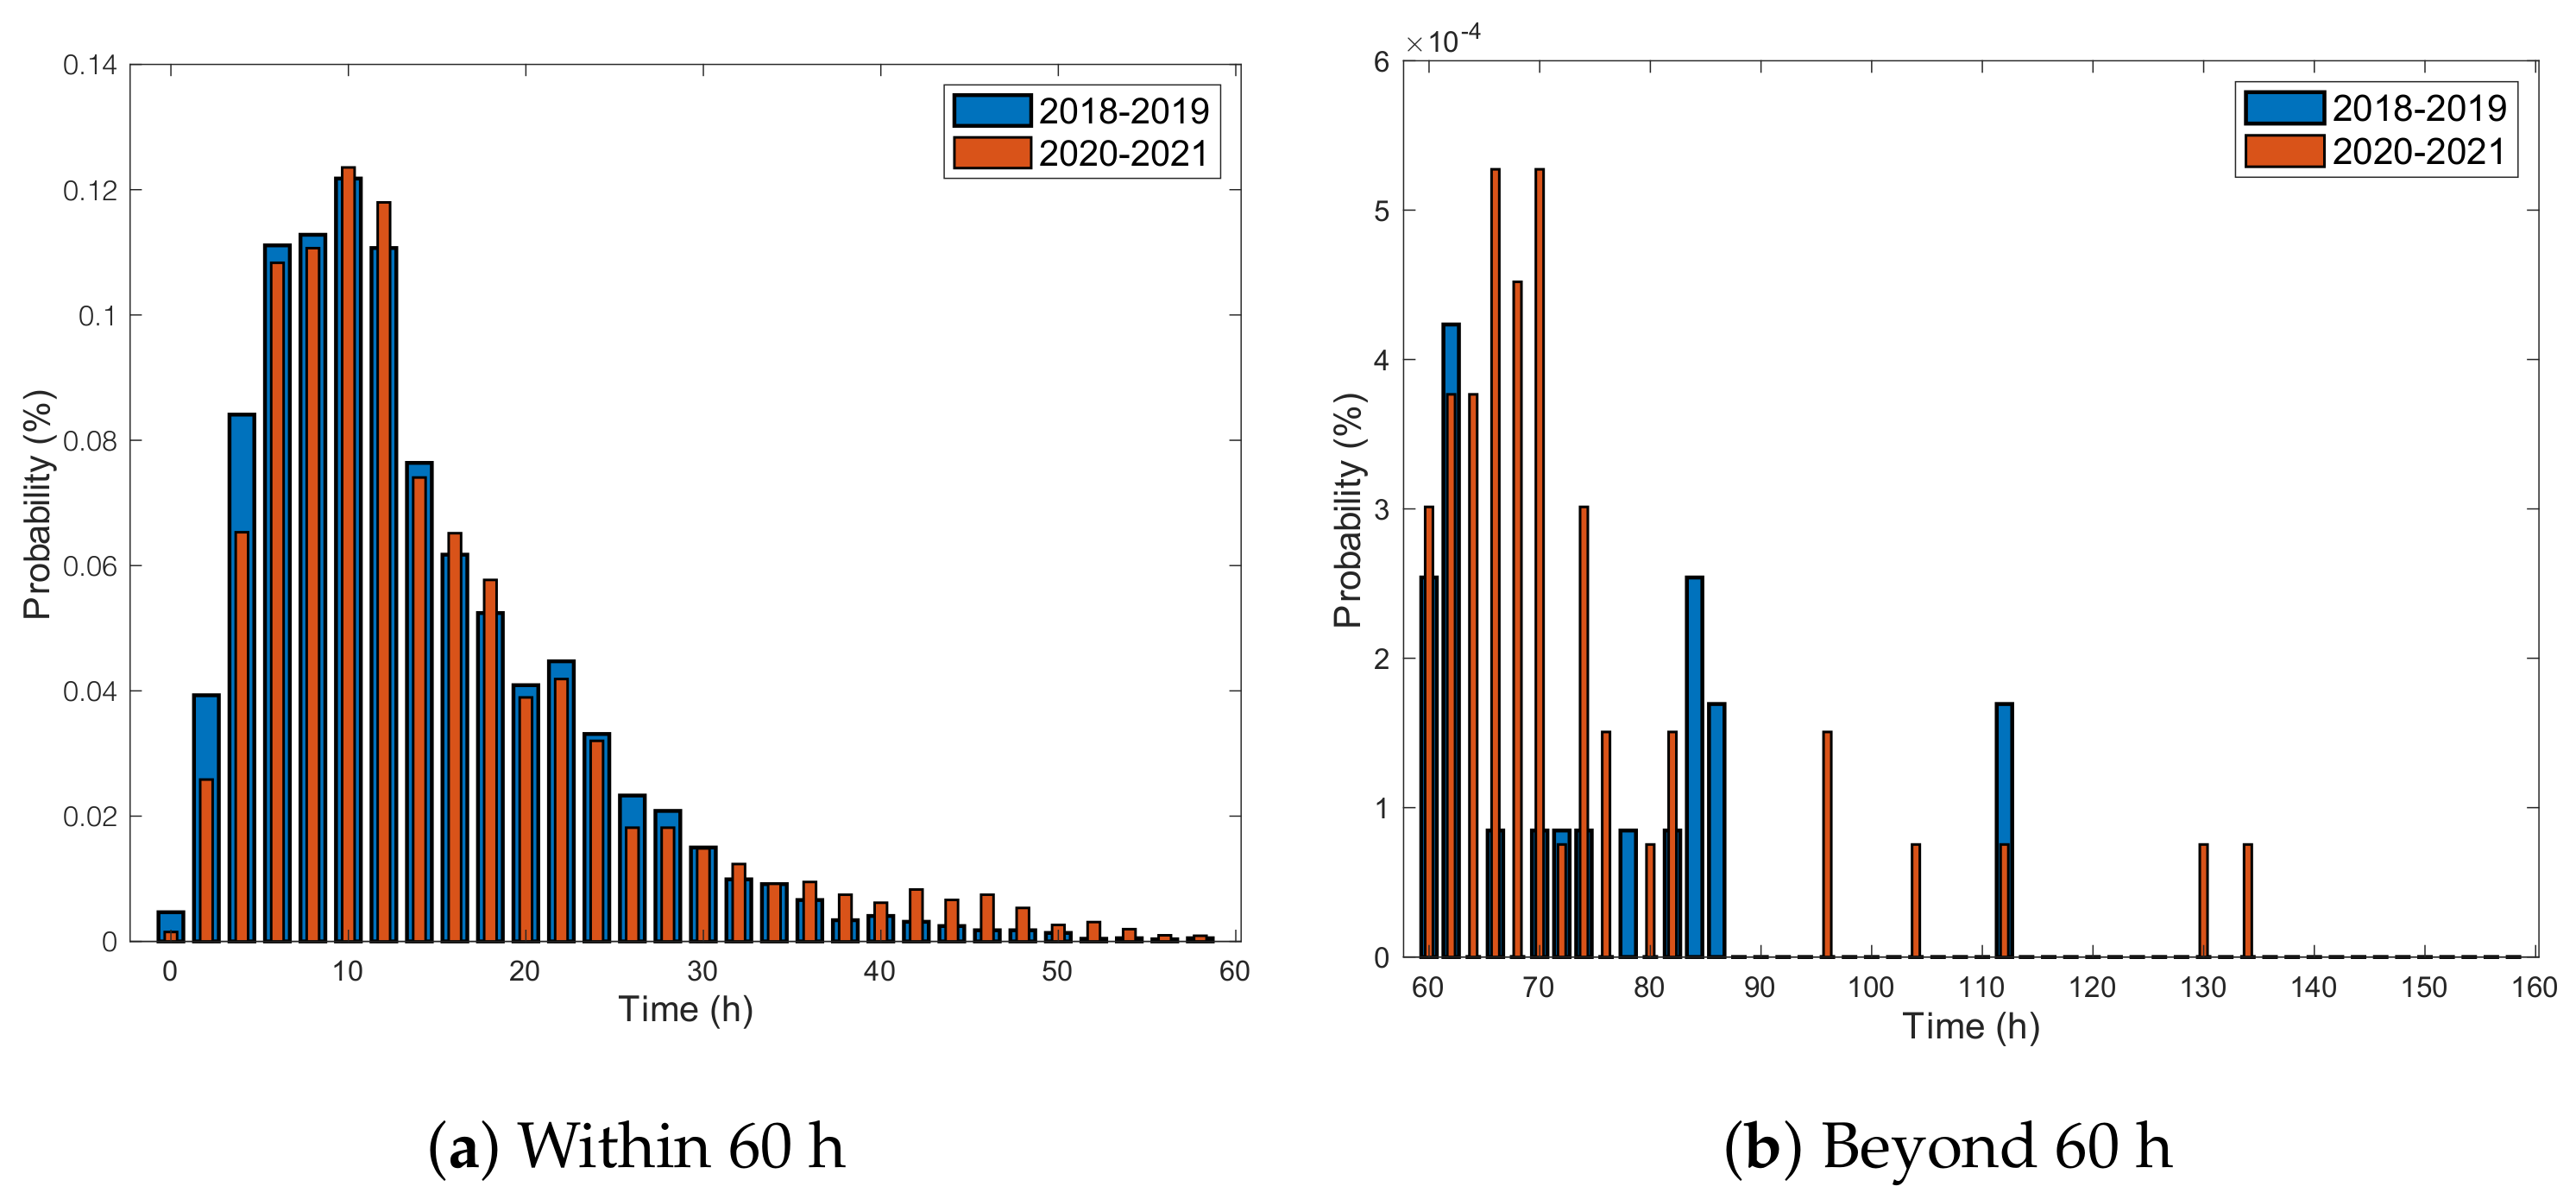
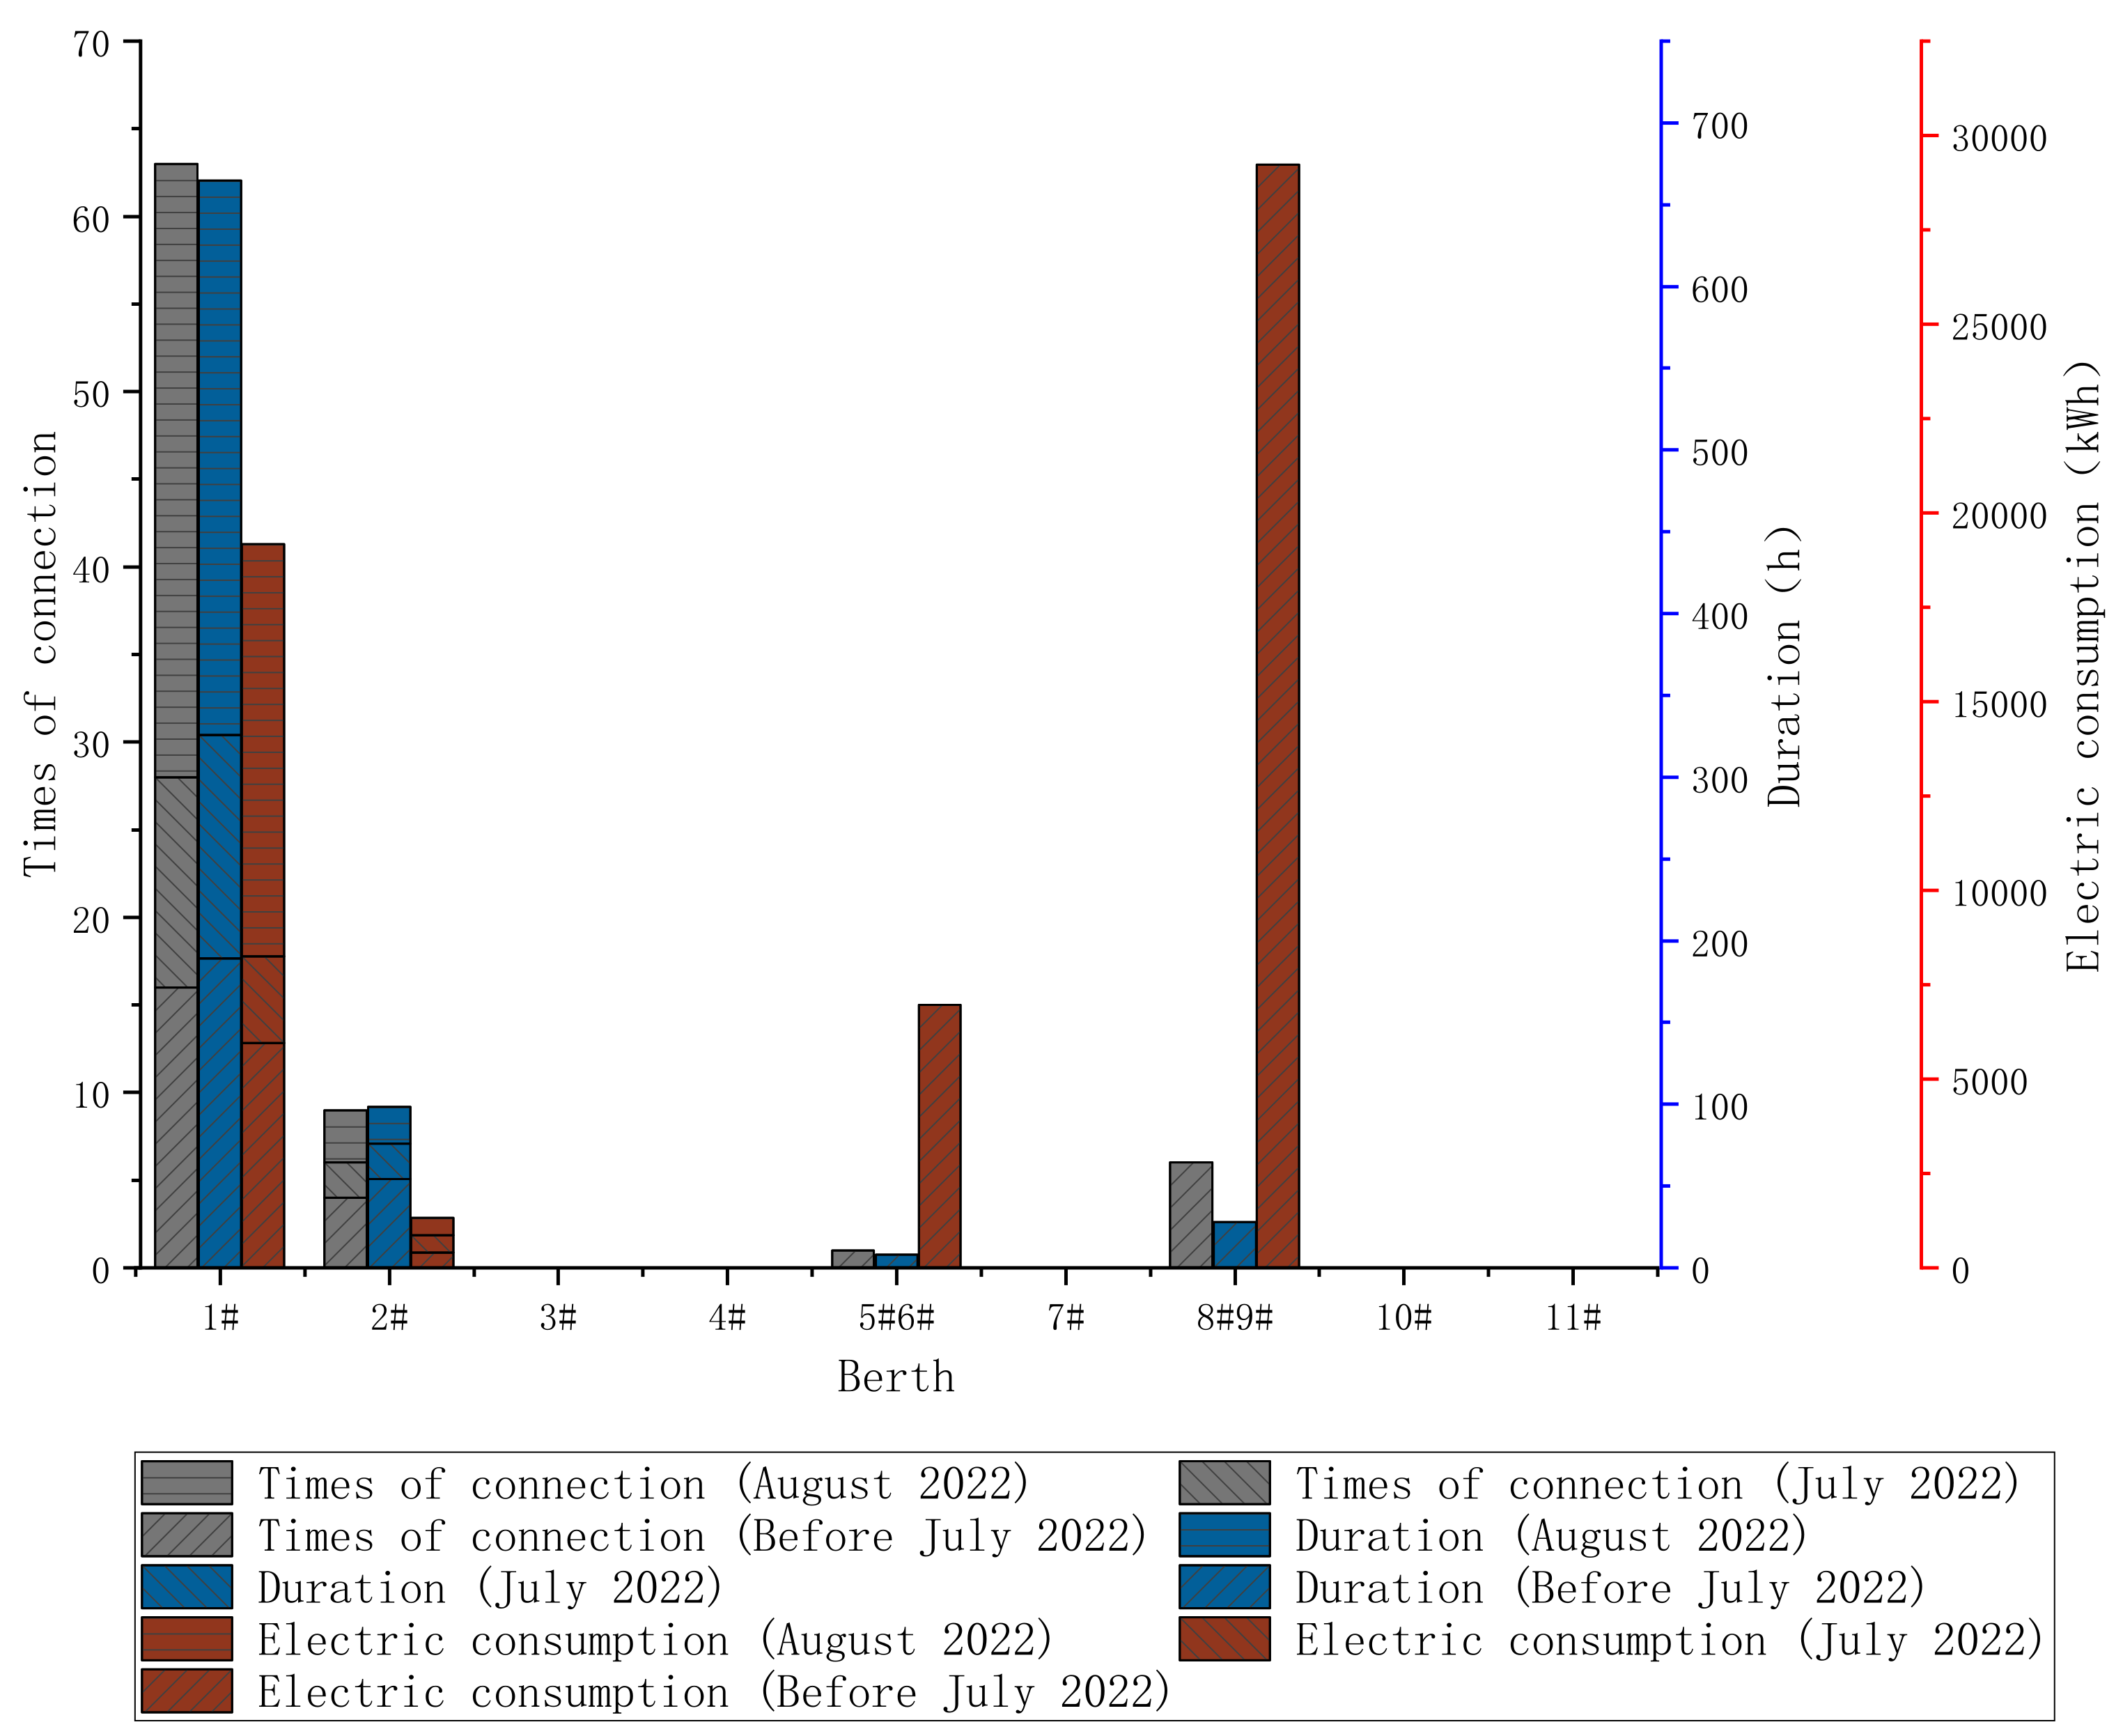
4.1. Analysis of Berthed Ships
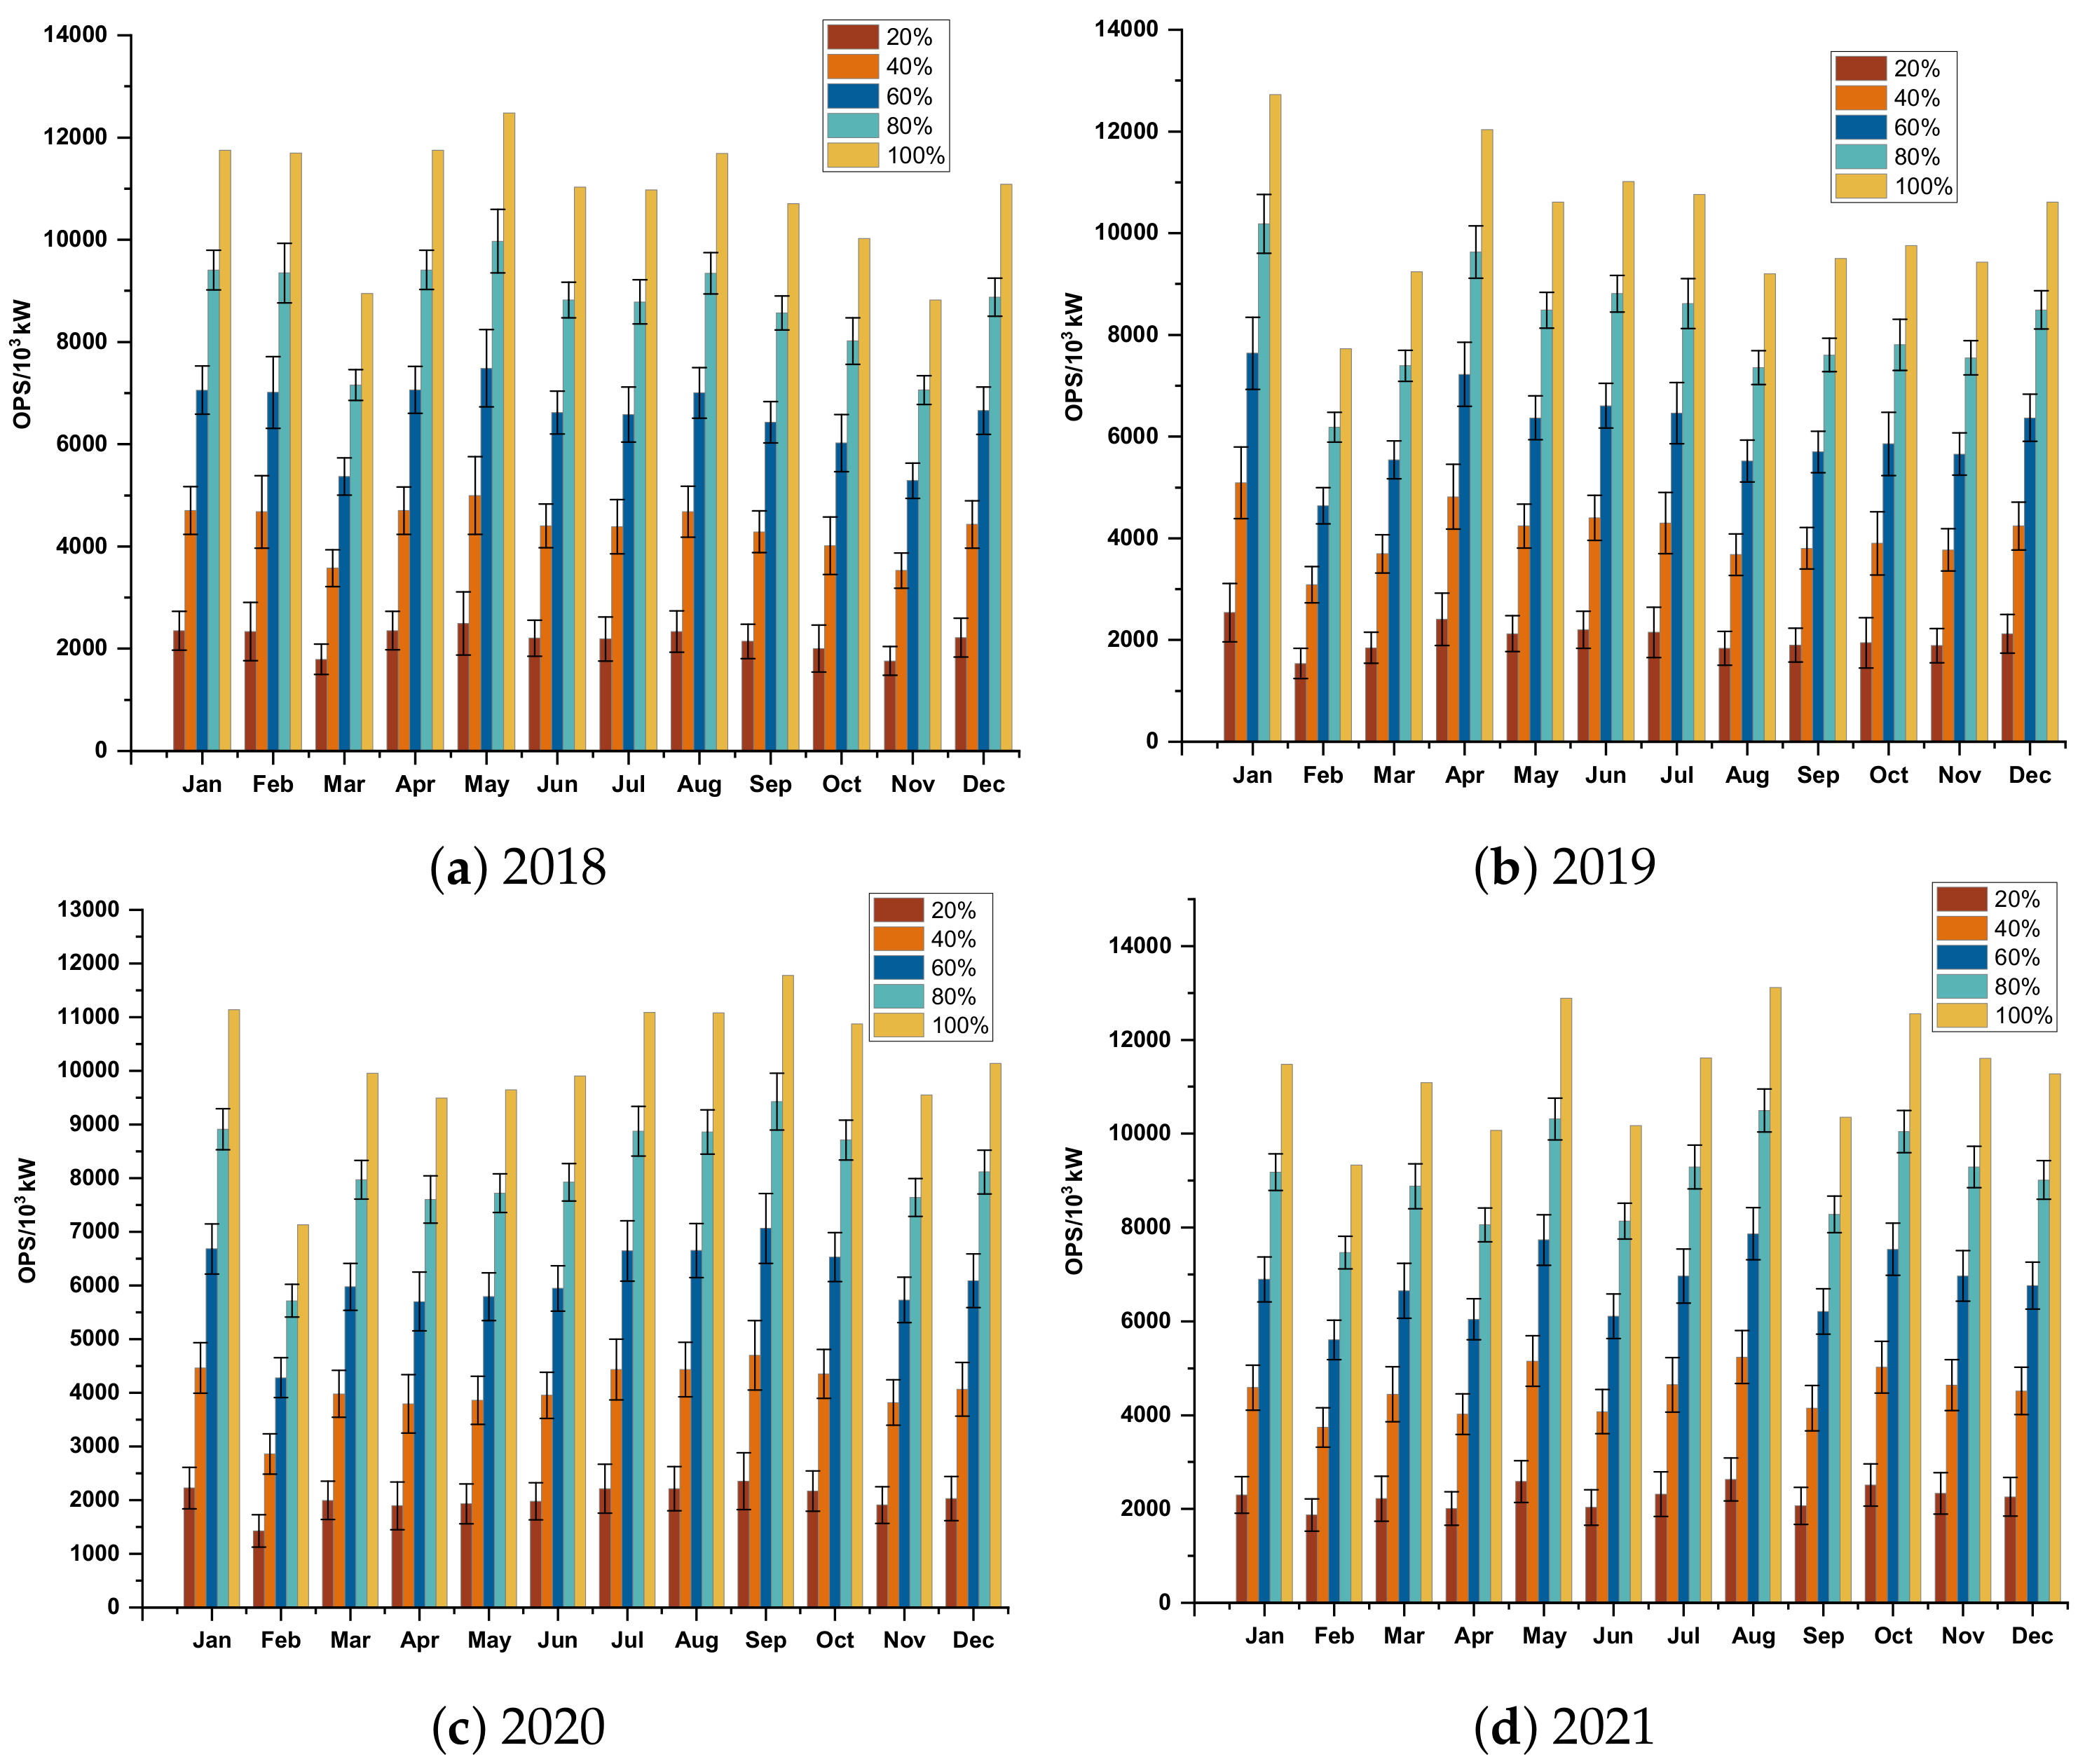
4.2. Analysis of OPS Connection
4.3. Analysis of Energy Efficiency
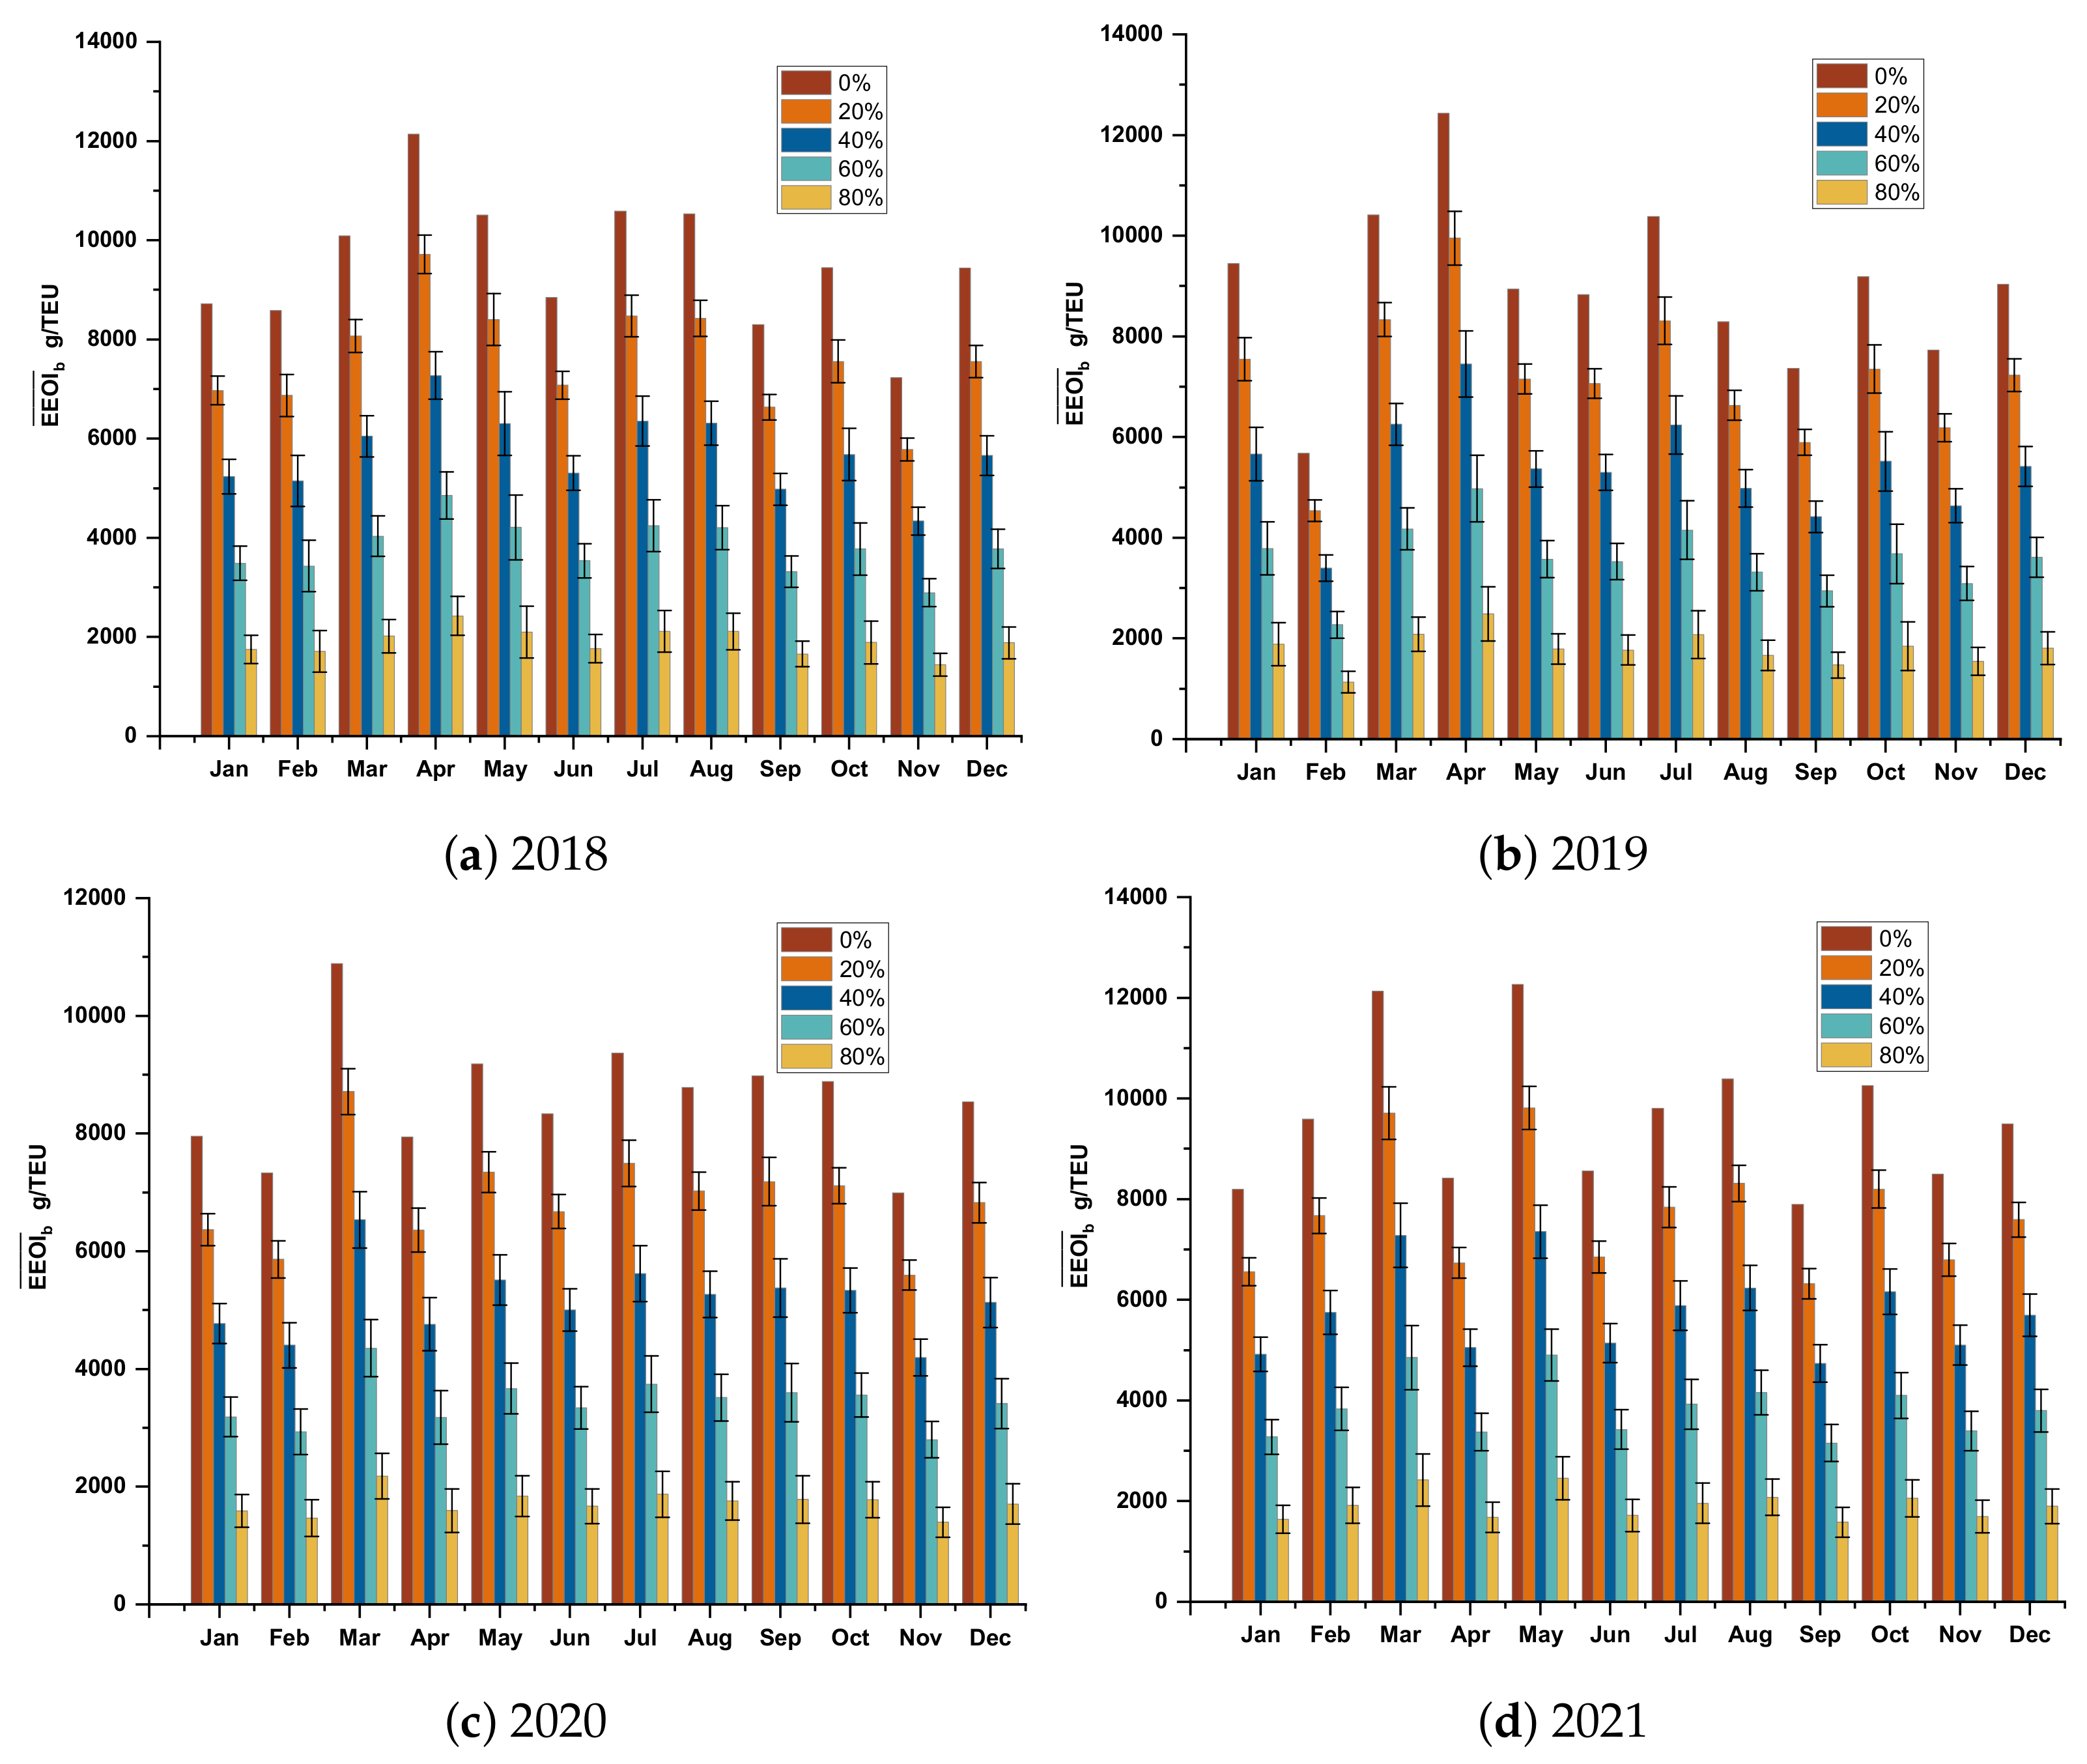
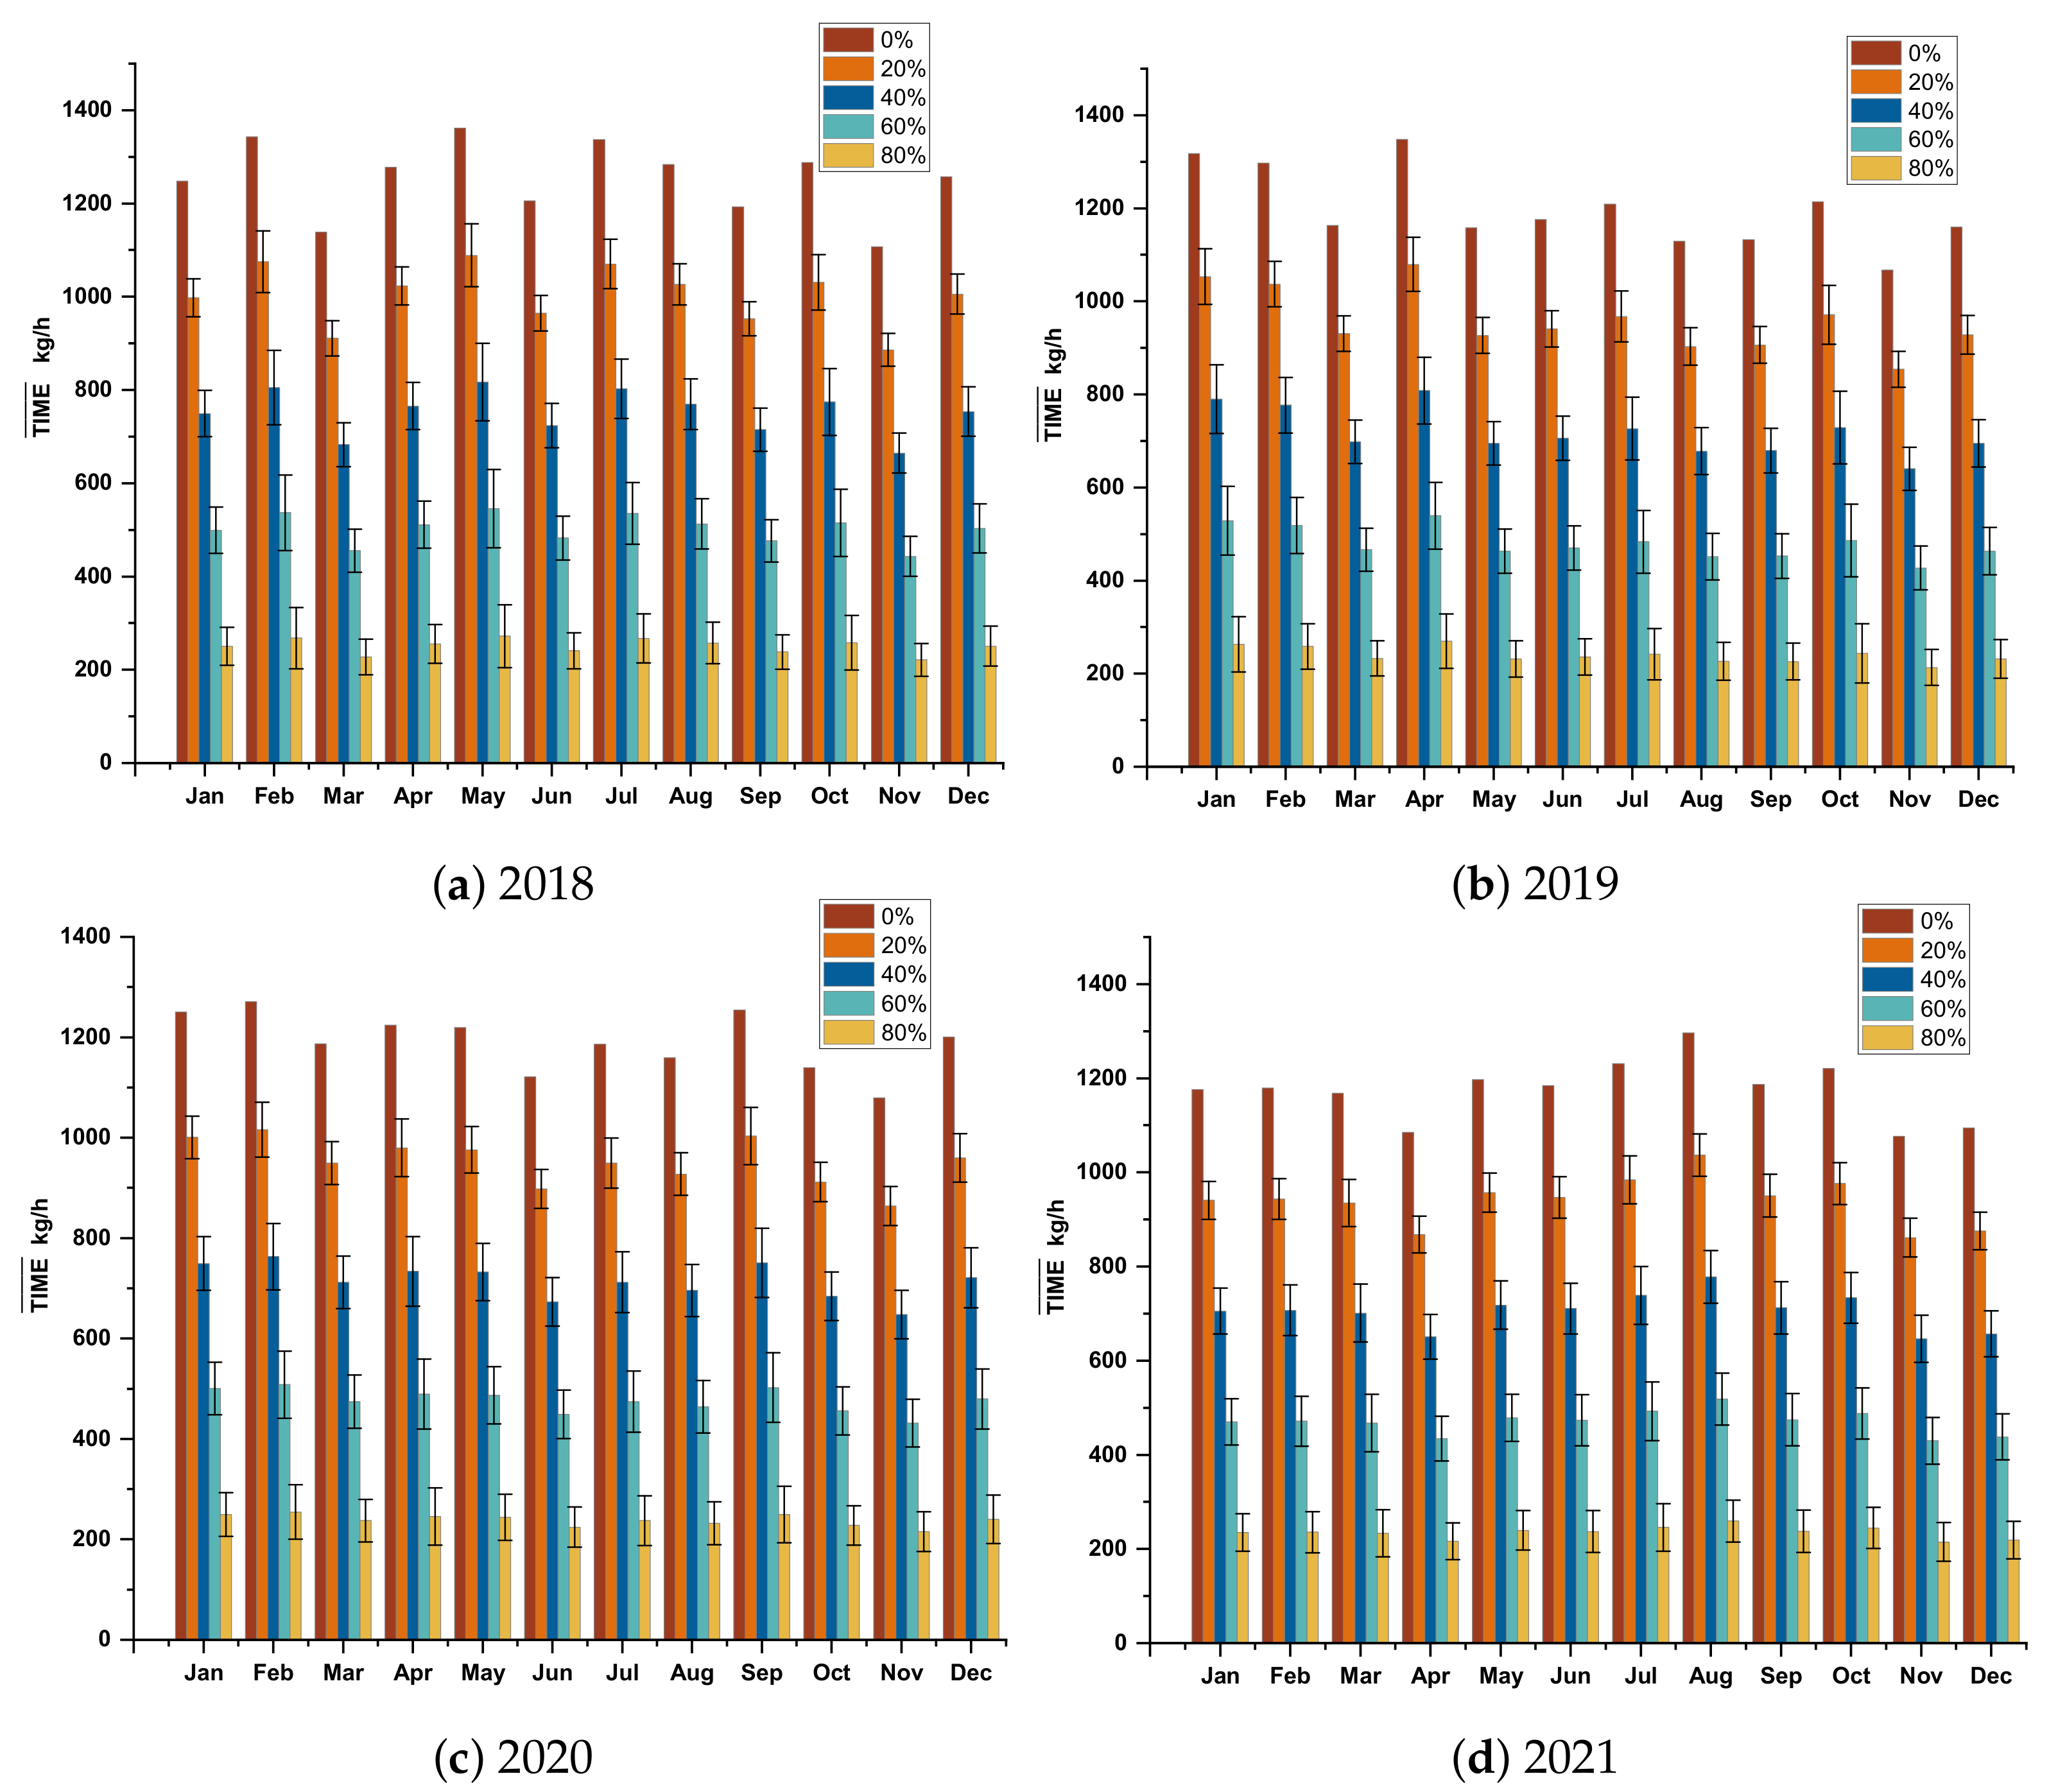
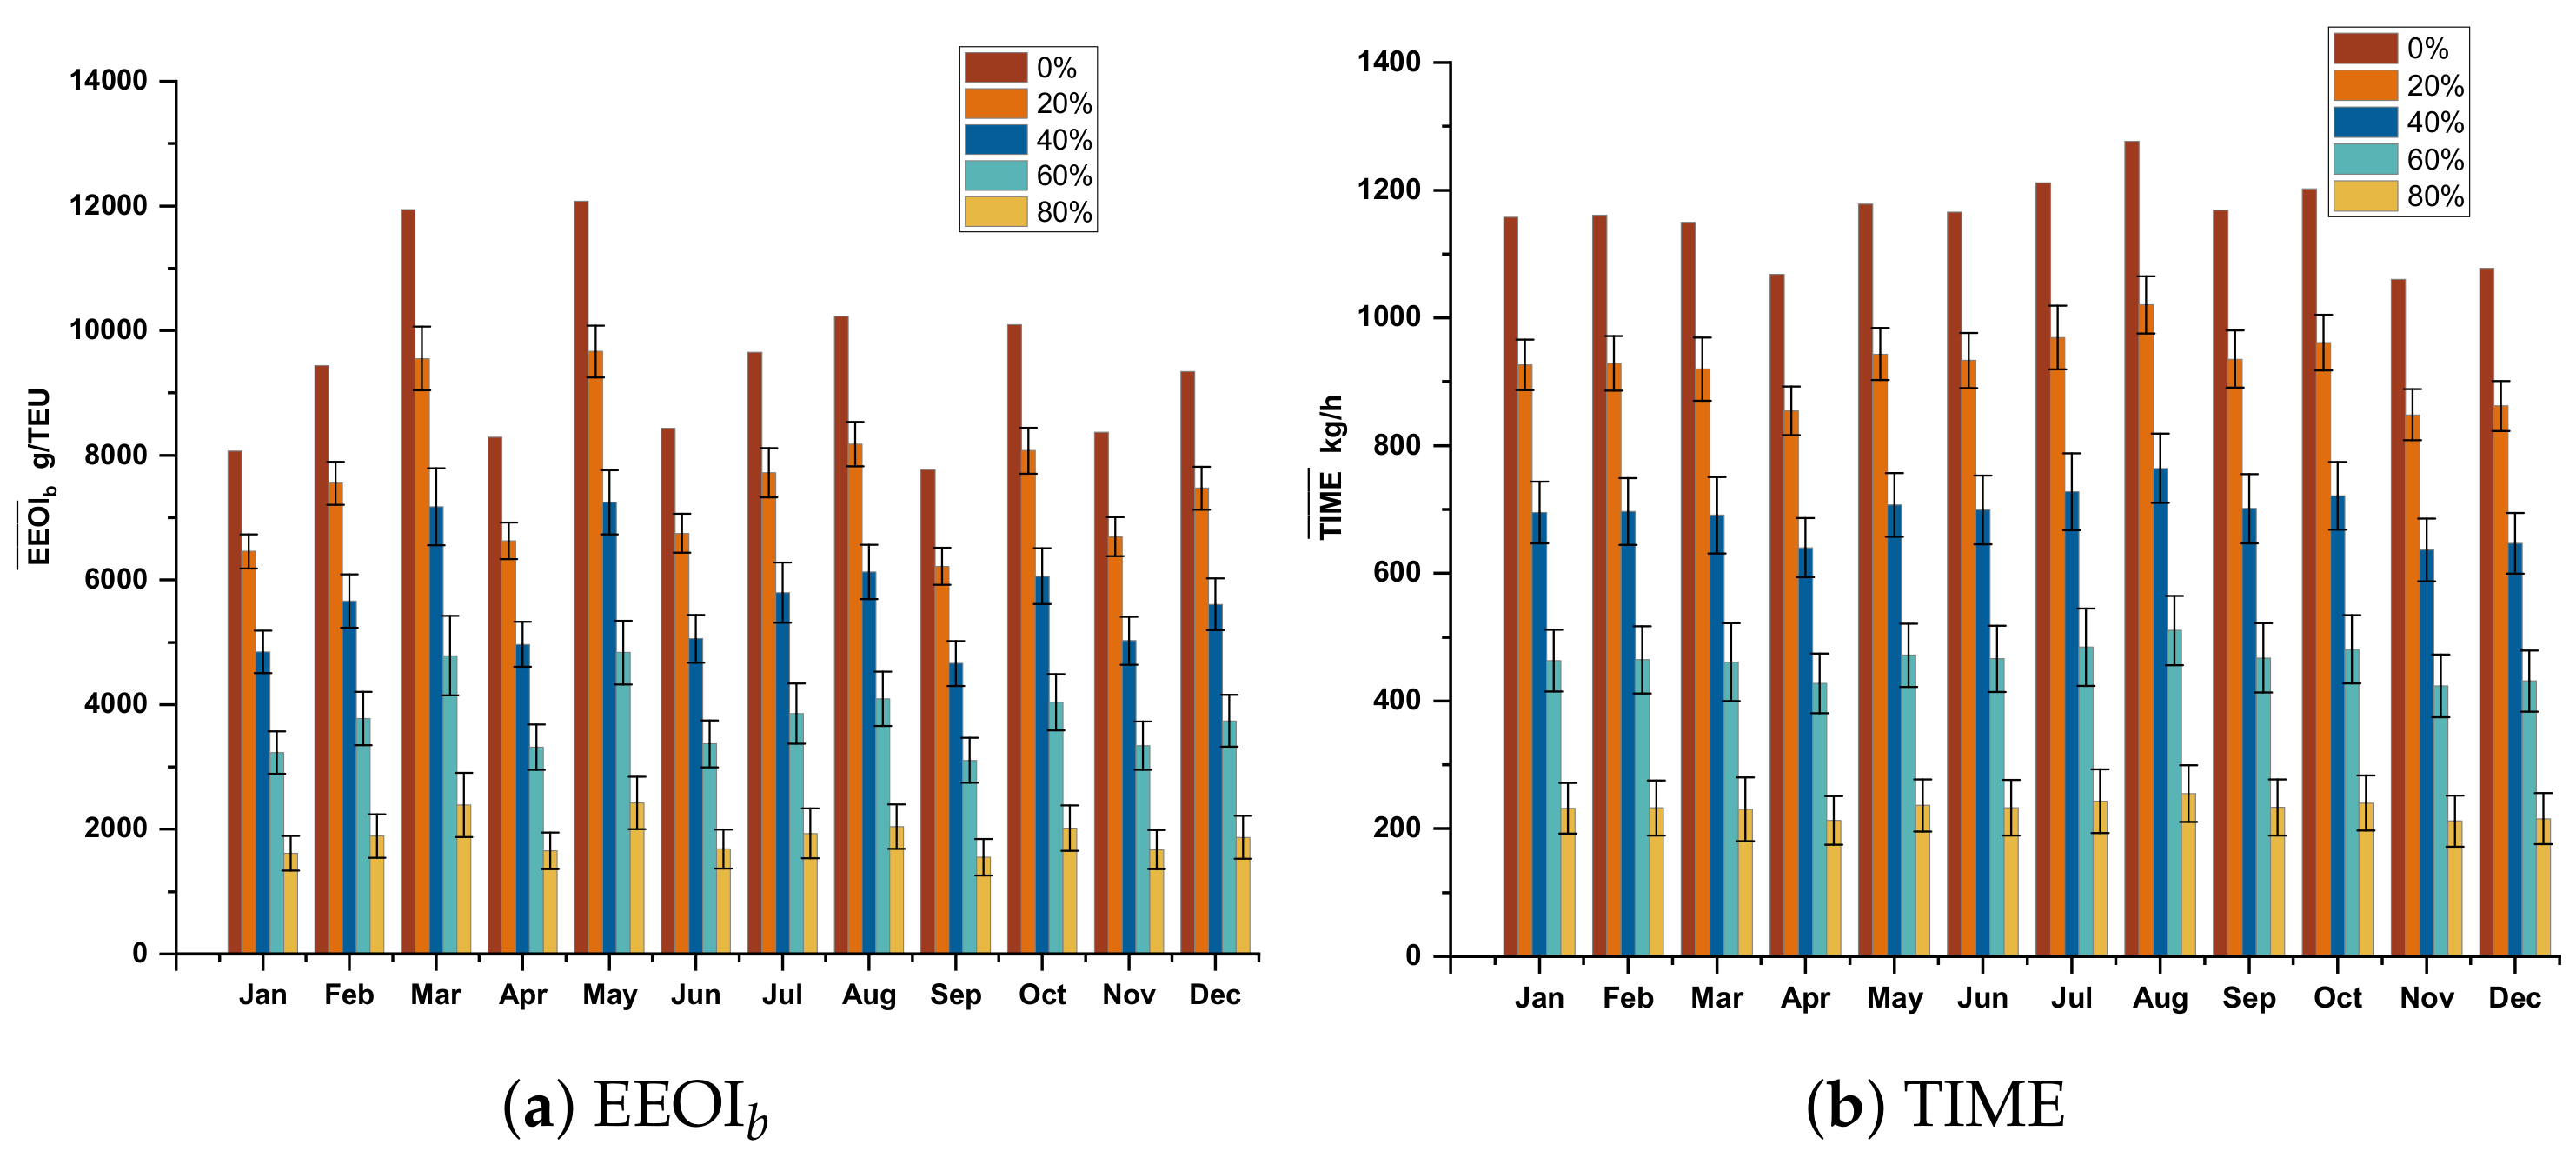
4.3.1. Energy Efficiency without Indirect Emissions
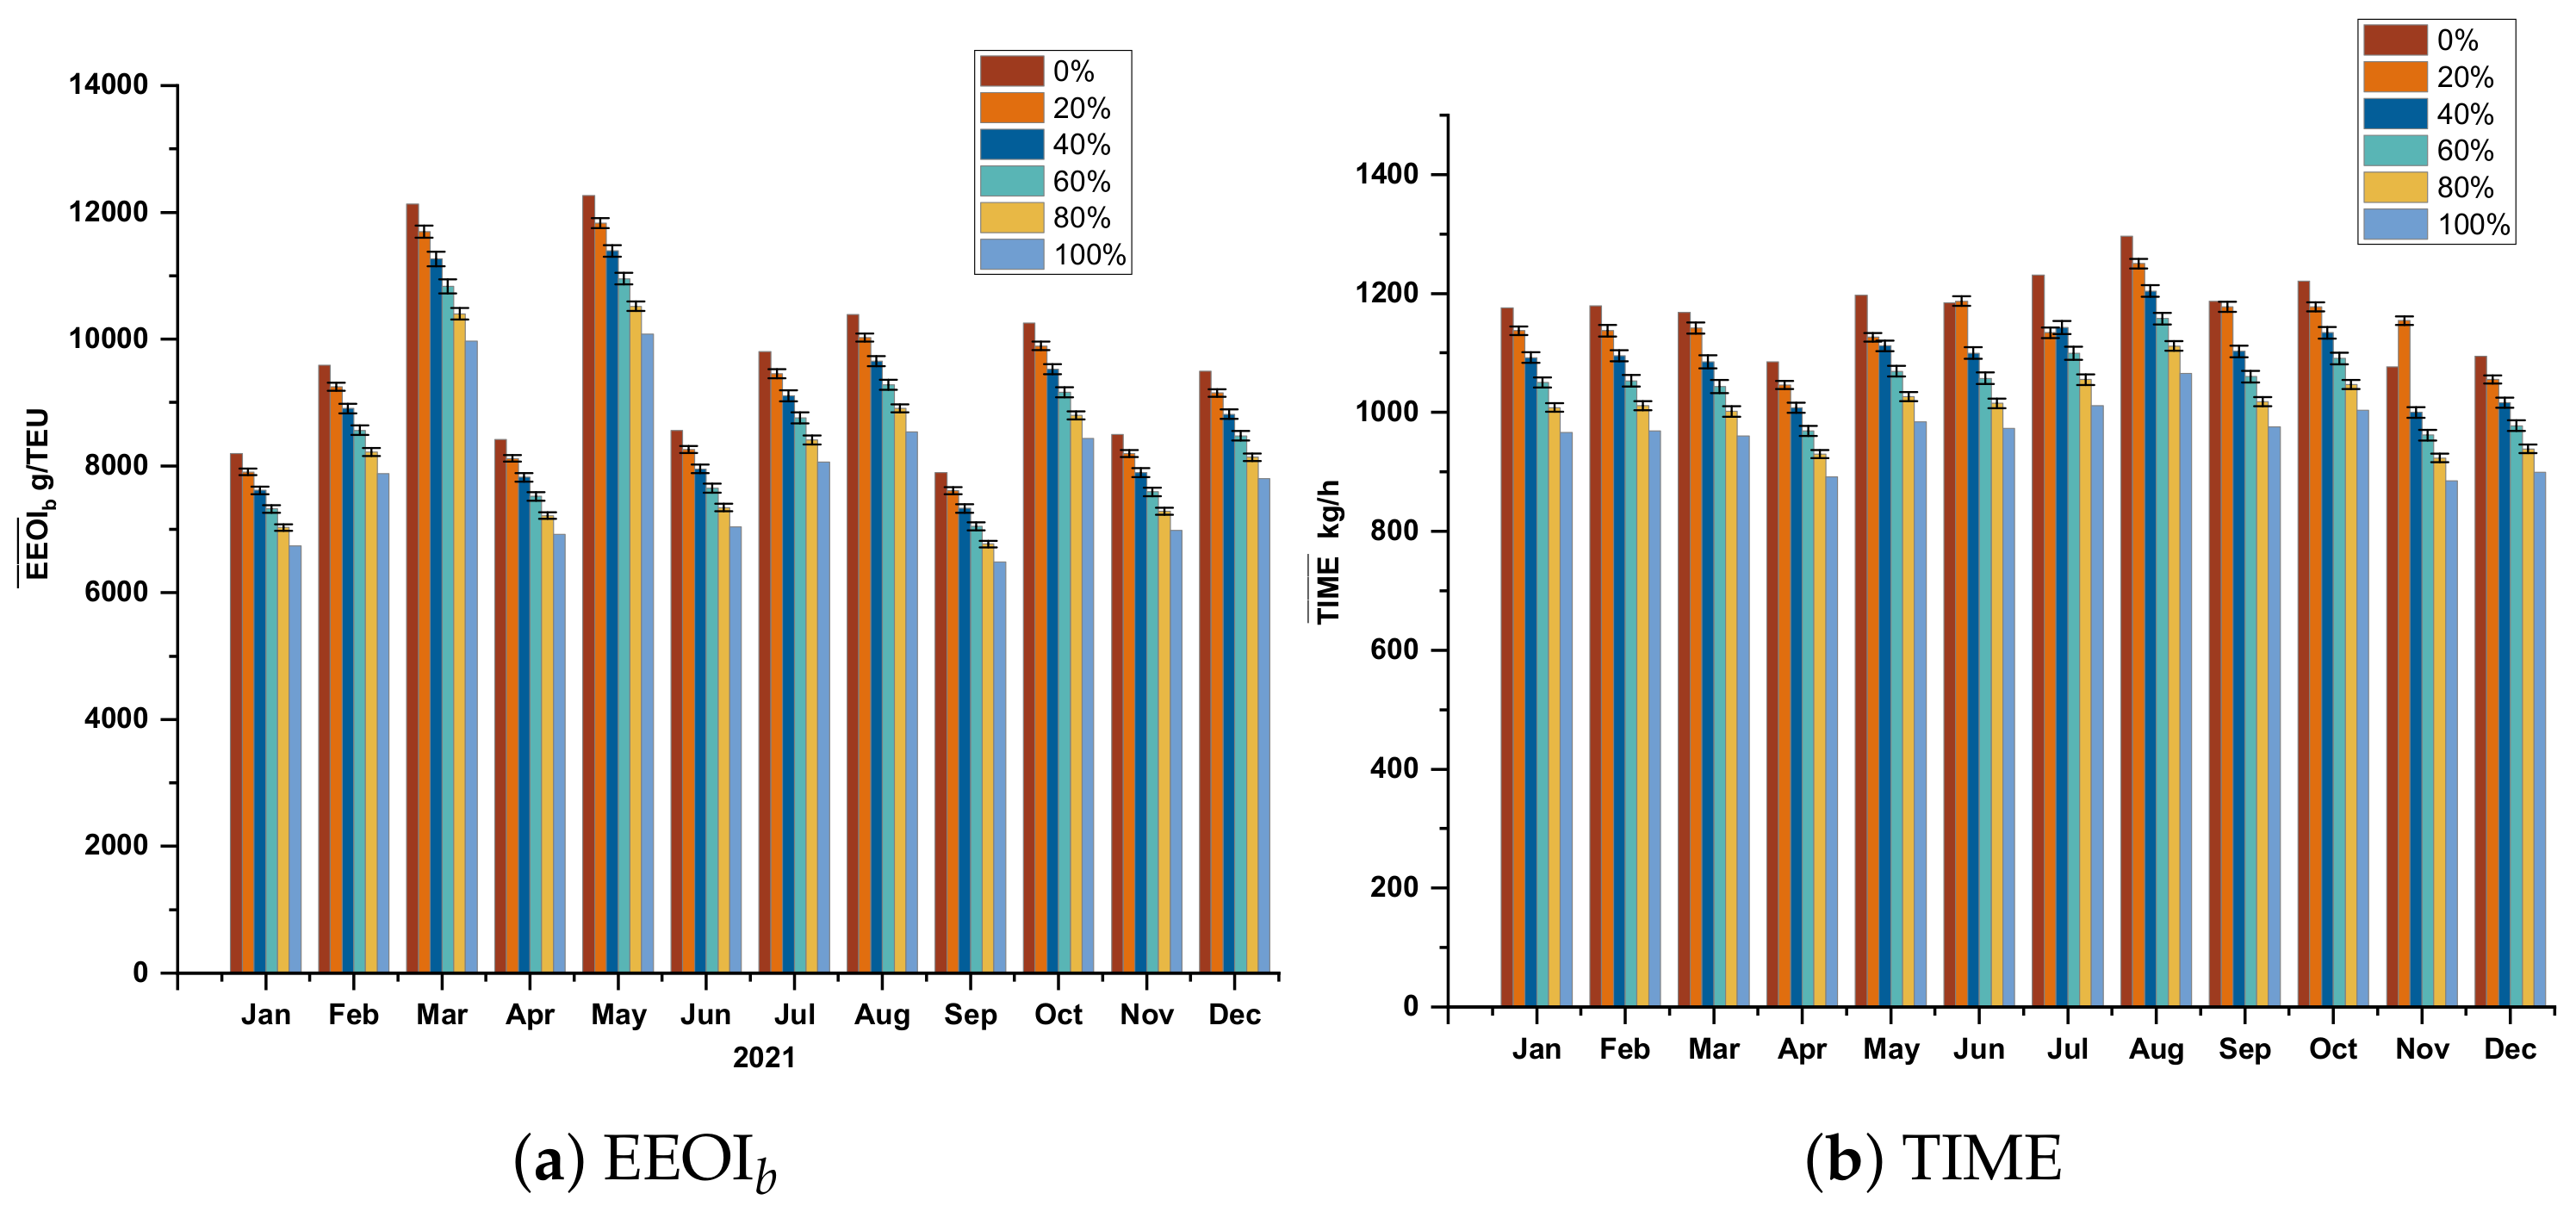
4.3.2. Energy Efficiency Considering Indirect Emissions
4.3.3. Energy Efficiency Considering Low Sulfur Fuel
4.4. Implication Inspiration
5. Conclusions
Author Contributions
Funding
Data Availability Statement
Acknowledgments
Conflicts of Interest
Abbreviations
| GHG | greenhouse gas |
| PM | particulate matter |
| IMO | International Maritime Organization |
| ECA | emissions control area |
| CI | cold ironing |
| OPS | onshore power supply |
| PA | port authority |
| EEDI | energy efficiency design index |
| SEEMP | ship energy efficiency management plan |
| EEOI | energy efficiency operation index |
| EEXI | energy efficiency existing ship index |
| CII | carbon intensity indicator |
| OGS | ocean-going ships |
| EF | emission factor |
| AIS | automatic identification system |
| CPANZP | Chuanshan Port area of Ningbo Zhoushan Port |
| TEU | twenty-feet equivalent unit |
| MCR | maximum continuous rated power |
References
- Wang, K.; Guo, X.; Zhao, J.; Ma, R.; Huang, L.; Tian, F.; Dong, S.; Zhang, P.; Liu, C.; Wang, Z. An integrated collaborative decision-making method for optimizing energy consumption of sail-assisted ships towards low-carbon shipping. Ocean Eng. 2022, 266, 112810. [Google Scholar] [CrossRef]
- Iris, Ç.; Lam, J.S.L. Optimal energy management and operations planning in seaports with smart grid while harnessing renewable energy under uncertainty. Omega 2021, 103, 102445. [Google Scholar] [CrossRef]
- Gutierrez-Romero, J.E.; Esteve-Pérez, J.; Zamora, B. Implementing onshore power supply from renewable energy sources for requirements of ships at berth. Appl. Energy 2019, 255, 113883. [Google Scholar] [CrossRef]
- Huang, L.; Pena, B.; Liu, Y.; Anderlini, E. Machine learning in sustainable ship design and operation: A review. Ocean Eng. 2022, 266, 112907. [Google Scholar] [CrossRef]
- Faber, J.; Hanayama, S.; Zhang, S.; Pereda, P.; Comer, B.; Hauerhof, E.; van der Loeff, W.S.; Smith, T.; Zhang, Y.; Kosaka, H.; et al. Fourth IMO GHG Study; Technical Report; International Maritime Organization (IMO): London, UK, 2020. [Google Scholar]
- Liu, H.; Meng, Z.H.; Lv, Z.F.; Wang, X.T.; Deng, F.Y.; Liu, Y.; Zhang, Y.N.; Shi, M.S.; Zhang, Q.; He, K.B. Emissions and health impacts from global shipping embodied in US–China bilateral trade. Nat. Sustain. 2019, 2, 1027–1033. [Google Scholar] [CrossRef]
- Cames, M.; Graichen, J.; Siemons, A.; Cook, V. Emission Reduction Targets for International Aviation and Shipping; European Parliament: Brussels, Belgium, 2015. [Google Scholar]
- Corbett, J.J.; Winebrake, J.J.; Green, E.H.; Kasibhatla, P.; Eyring, V.; Lauer, A. Mortality from ship emissions: A global assessment. Environ. Sci. Technol. 2007, 41, 8512–8518. [Google Scholar] [CrossRef]
- Nguyen, D.H.; Lin, C.; Cheruiyot, N.K.; Hsu, J.Y.; Cho, M.Y.; Hsu, S.H.; Yeh, C.K. Reduction of NOx and SO2 emissions by shore power adoption. Aerosol Air Qual. Res. 2021, 21, 210100. [Google Scholar] [CrossRef]
- Innes, A.; Monios, J. Identifying the unique challenges of installing cold ironing at small and medium ports—The case of Aberdeen. Transp. Res. Part D Transp. Environ. 2018, 62, 298–313. [Google Scholar] [CrossRef]
- Ministry of Transport of the People’s Republic of China. Implementation Scheme of the Domestic Emission Control Areas for Atmospheric Pollution from Vessels; Ministry of Transport of the People’s Republic of China: Beijing, China, 2018. [Google Scholar]
- Ministry of Transport of the People’s Republic of China. Guidance on Building World-Class Ports by the Ministry of Transport, National Development and Reform Commission, Ministry of Finance, Ministry of Natural Resources, Ministry of Ecology and Environment, Ministry of Emergency Management, General Administration of Customs, State Administration for Market Regulation, and China State Railway Group Co., Ltd.; Ministry of Transport of the People’s Republic of China: Beijing, China, 2019. [Google Scholar]
- Yun, P.; Xiangda, L.; Wenyuan, W.; Ke, L.; Chuan, L. A simulation-based research on carbon emission mitigation strategies for green container terminals. Ocean Eng. 2018, 163, 288–298. [Google Scholar] [CrossRef]
- Tang, D.; Chen, Z.; Xu, C.; Yuan, Y.; Zhong, X.; Yuan, C. Energy consumption and emissions analysis of large container seaports considering the impact of COVID-19: A case study of Ningbo Zhoushan Port. Ocean. Coast. Manag. 2023, 244, 106781. [Google Scholar] [CrossRef]
- Hoang, A.T.; Foley, A.M.; Nižetić, S.; Huang, Z.; Ong, H.C.; Ölçer, A.I.; Nguyen, X.P.; Pham, V.V. Energy-related approach for reduction of CO2 emissions: A strategic review on the port-to-ship pathway. J. Clean. Prod. 2022, 355, 131772. [Google Scholar] [CrossRef]
- Bakar, N.N.A.; Bazmohammadi, N.; Vasquez, J.C.; Guerrero, J.M. Electrification of onshore power systems in maritime transportation towards decarbonization of ports: A review of the cold ironing technology. Renew. Sustain. Energy Rev. 2023, 178, 113243. [Google Scholar] [CrossRef]
- Tan, Z.; Zeng, X.; Wang, T.; Wang, Y.; Chen, J. Capacity investment of shore power berths for a container port: Environmental incentive and infrastructure subsidy policies. Ocean Coast. Manag. 2023, 239, 106582. [Google Scholar] [CrossRef]
- Chen, J.; Zheng, T.; Garg, A.; Xu, L.; Li, S.; Fei, Y. Alternative maritime power application as a green port strategy: Barriers in China. J. Clean. Prod. 2019, 213, 825–837. [Google Scholar] [CrossRef]
- Wang, Y.; Guo, S.; Dai, L.; Zhang, Z.; Hu, H. Shore side electricity subsidy policy efficiency optimization: From the game theory perspective. Ocean Coast. Manag. 2022, 228, 106324. [Google Scholar] [CrossRef]
- Martínez-Moya, J.; Vazquez-Paja, B.; Maldonado, J.A.G. Energy efficiency and CO2 emissions of port container terminal equipment: Evidence from the Port of Valencia. Energy Policy 2019, 131, 312–319. [Google Scholar] [CrossRef]
- Buhaug, Ø.; Corbett, J.; Endresen, Ø.; Eyring, V.; Faber, J.; Hanayama, S.; Lee, D.S.; Lee, D.; Lindstad, H.; Markowska, A.Z.; et al. Second IMO GHG Study; Technical Report; International Maritime Organization (IMO): London, UK, 2009. [Google Scholar]
- Wang, K.; Xue, Y.; Xu, H.; Huang, L.; Ma, R.; Zhang, P.; Jiang, X.; Yuan, Y.; Negenborn, R.R.; Sun, P. Joint energy consumption optimization method for wing-diesel engine-powered hybrid ships towards a more energy-efficient shipping. Energy 2022, 245, 123155. [Google Scholar] [CrossRef]
- Wang, K.; Li, J.; Huang, L.; Ma, R.; Jiang, X.; Yuan, Y.; Mwero, N.A.; Negenborn, R.R.; Sun, P.; Yan, X. A novel method for joint optimization of the sailing route and speed considering multiple environmental factors for more energy efficient shipping. Ocean Eng. 2020, 216, 107591. [Google Scholar] [CrossRef]
- Wang, K.; Wang, J.; Huang, L.; Yuan, Y.; Wu, G.; Xing, H.; Wang, Z.; Wang, Z.; Jiang, X. A comprehensive review on the prediction of ship energy consumption and pollution gas emissions. Ocean Eng. 2022, 266, 112826. [Google Scholar] [CrossRef]
- Duan, M.; Wang, Y.; Fan, A.; Yang, J.; Fan, X. Comprehensive analysis and evaluation of ship energy efficiency practices. Ocean Coast. Manag. 2023, 231, 106397. [Google Scholar] [CrossRef]
- Czermański, E.; Oniszczuk-Jastrząbek, A.; Spangenberg, E.F.; Kozłowski, Ł.; Adamowicz, M.; Jankiewicz, J.; Cirella, G.T. Implementation of the Energy Efficiency Existing Ship Index: An important but costly step towards ocean protection. Mar. Policy 2022, 145, 105259. [Google Scholar]
- Bojić, F.; Gudelj, A.; Bošnjak, R. Port-related shipping gas emissions-A systematic review of research. Appl. Sci. 2022, 12, 3603. [Google Scholar] [CrossRef]
- Lee, H.; Pham, H.T.; Chen, M.; Choo, S. Bottom-up approach ship emission inventory in Port of Incheon based on VTS data. J. Adv. Transp. 2021, 2021, 5568777. [Google Scholar] [CrossRef]
- Cammin, P.; Yu, J.; Heilig, L.; Voß, S. Monitoring of air emissions in maritime ports. Transp. Res. Part D Transp. Environ. 2020, 87, 102479. [Google Scholar] [CrossRef]
- Chen, D.; Wang, X.; Nelson, P.; Li, Y.; Zhao, N.; Zhao, Y.; Lang, J.; Zhou, Y.; Guo, X. Ship emission inventory and its impact on the PM2. 5 air pollution in Qingdao Port, North China. Atmos. Environ. 2017, 166, 351–361. [Google Scholar] [CrossRef]
- Gan, L.; Che, W.; Zhou, M.; Zhou, C.; Zheng, Y.; Zhang, L.; Rangel-Buitrago, N.; Song, L. Ship exhaust emission estimation and analysis using Automatic Identification System data: The west area of Shenzhen port, China, as a case study. Ocean Coast. Manag. 2022, 226, 106245. [Google Scholar] [CrossRef]
- Huang, L.; Wen, Y.; Geng, X.; Zhou, C.; Xiao, C.; Zhang, F. Estimation and spatio-temporal analysis of ship exhaust emission in a port area. Ocean Eng. 2017, 140, 401–411. [Google Scholar] [CrossRef]
- Chen, D.; Zhao, Y.; Nelson, P.; Li, Y.; Wang, X.; Zhou, Y.; Lang, J.; Guo, X. Estimating ship emissions based on AIS data for port of Tianjin, China. Atmos. Environ. 2016, 145, 10–18. [Google Scholar] [CrossRef]
- Liu, H.; Fu, M.; Jin, X.; Shang, Y.; Shindell, D.; Faluvegi, G.; Shindell, C.; He, K. Health and climate impacts of ocean-going vessels in East Asia. Nat. Clim. Chang. 2016, 6, 1037–1041. [Google Scholar] [CrossRef]
- Dai, L.; Hu, H.; Wang, Z. Is Shore Side Electricity greener? An environmental analysis and policy implications. Energy Policy 2020, 137, 111144. [Google Scholar] [CrossRef]
- Zis, T.P. Prospects of cold ironing as an emissions reduction option. Transp. Res. Part A Policy Pract. 2019, 119, 82–95. [Google Scholar] [CrossRef]
- Canepa, M.; Ballini, F.; Dalaklis, D.; Frugone, G.; Sciutto, D. Cold Ironing: Socio-Economic Analysis in the Port of Genoa. Logistics 2023, 7, 28. [Google Scholar] [CrossRef]
- Herrero, A.; Ortega Piris, A.; Diaz-Ruiz-Navamuel, E.; Gutierrez, M.A.; Lopez-Diaz, A.I. Influence of the Implantation of the Onshore Power Supply (OPS) System in Spanish Medium-Sized Ports on the Reduction in CO2 Emissions: The Case of the Port of Santander (Spain). J. Mar. Sci. Eng. 2022, 10, 1446. [Google Scholar] [CrossRef]
- Xu, L.; Di, Z.; Chen, J.; Shi, J.; Yang, C. Evolutionary game analysis on behavior strategies of multiple stakeholders in maritime shore power system. Ocean Coast. Manag. 2021, 202, 105508. [Google Scholar] [CrossRef]
- Chen, J.; Xiong, W.; Xu, L.; Di, Z. Evolutionary game analysis on supply side of the implement shore-to-ship electricity. Ocean Coast. Manag. 2021, 215, 105926. [Google Scholar] [CrossRef]
- Chen, J.; Fei, Y.; Wan, Z. The relationship between the development of global maritime fleets and GHG emission from shipping. J. Environ. Manag. 2019, 242, 31–39. [Google Scholar] [CrossRef]
- Zis, T.; North, R.J.; Angeloudis, P.; Ochieng, W.Y.; Harrison Bell, M.G. Evaluation of cold ironing and speed reduction policies to reduce ship emissions near and at ports. Marit. Econ. Logist. 2014, 16, 371–398. [Google Scholar] [CrossRef]
- Iris, Ç.; Lam, J.S.L. A review of energy efficiency in ports: Operational strategies, technologies and energy management systems. Renew. Sustain. Energy Rev. 2019, 112, 170–182. [Google Scholar] [CrossRef]
- Tran, T.A. A research on the energy efficiency operational indicator EEOI calculation tool on M/V NSU JUSTICE of VINIC transportation company, Vietnam. J. Ocean Eng. Sci. 2017, 2, 55–60. [Google Scholar] [CrossRef]
- Nguyen, P.N.; Woo, S.H.; Kim, H. Ship emissions in hotelling phase and loading/unloading in Southeast Asia ports. Transp. Res. Part D Transp. Environ. 2022, 105, 103223. [Google Scholar] [CrossRef]
- Starcrest Consulting Group, LLC. San Pedro Bay Ports Emissions Inventory Methodology Report; Technical Report; The Port of Los Angeles and The Port of Long Beach: Los Angeles, CA, USA, 2022. [Google Scholar]
- Zhang, S. Reflections on Optimizing and Adjusting Carbon Emission Factors in the Context of the Dual Carbon Initiative. China Power Enterp. Manag. 2022, 22, 62–65. [Google Scholar]
- IMO. Train the Trainer (TTT) Course on Energy Efficient Ship Operation; Technical Report; International Maritime Organization (IMO): London, UK, 2016. [Google Scholar]


| Engine Type | IMO Tier | Model Year Range | CO EF |
|---|---|---|---|
| Using 2.7% Sulfur Fuel | |||
| MSA | Tier 0 | 1999 and older | 707 |
| MSA | Tier I | 2000 to 2011 | 707 |
| MSA | Tier II | 2011 to 2016 | 707 |
| MSA | Tier III | 2016 and newer | 707 |
| HSA | Tier 0 | 1999 and older | 707 |
| HSA | Tier I | 2000 to 2011 | 707 |
| HSA | Tier II | 2011 to 2016 | 707 |
| HSA | Tier III | 2016 and newer | 707 |
| Using 0.1% Sulfur Fuel | |||
| MSA | Tier 0 | 1999 and older | 696 |
| MSA | Tier I | 2000 to 2011 | 696 |
| MSA | Tier II | 2011 to 2016 | 696 |
| MSA | Tier III | 2016 and newer | 696 |
| HSA | Tier 0 | 1999 and older | 696 |
| HSA | Tier I | 2000 to 2011 | 696 |
| HSA | Tier II | 2011 to 2016 | 696 |
| HSA | Tier III | 2016 and newer | 696 |
| Year | EF |
|---|---|
| 2018 | 610 |
| 2019 | 610 |
| 2020 | 610 |
| 2021 | 581 |
| 2022 | 581 |
Disclaimer/Publisher’s Note: The statements, opinions and data contained in all publications are solely those of the individual author(s) and contributor(s) and not of MDPI and/or the editor(s). MDPI and/or the editor(s) disclaim responsibility for any injury to people or property resulting from any ideas, methods, instructions or products referred to in the content. |
© 2023 by the authors. Licensee MDPI, Basel, Switzerland. This article is an open access article distributed under the terms and conditions of the Creative Commons Attribution (CC BY) license (https://creativecommons.org/licenses/by/4.0/).
Share and Cite
Tang, D.; Jiang, T.; Xu, C.; Chen, Z.; Yuan, Y.; Zhao, W.; Guerrero, J.M. Assessing the Potential for Energy Efficiency Improvement through Cold Ironing: A Monte Carlo Analysis with Real Port Data. J. Mar. Sci. Eng. 2023, 11, 1780. https://doi.org/10.3390/jmse11091780
Tang D, Jiang T, Xu C, Chen Z, Yuan Y, Zhao W, Guerrero JM. Assessing the Potential for Energy Efficiency Improvement through Cold Ironing: A Monte Carlo Analysis with Real Port Data. Journal of Marine Science and Engineering. 2023; 11(9):1780. https://doi.org/10.3390/jmse11091780
Chicago/Turabian StyleTang, Daogui, Tao Jiang, Chaoyuan Xu, Zhe Chen, Yupeng Yuan, Wuyou Zhao, and Josep M. Guerrero. 2023. "Assessing the Potential for Energy Efficiency Improvement through Cold Ironing: A Monte Carlo Analysis with Real Port Data" Journal of Marine Science and Engineering 11, no. 9: 1780. https://doi.org/10.3390/jmse11091780