
Experimental Research on the Stiffness Step between the Main Hull and Superstructure of Cruise Ships

1
Green & Smart River-Sea-Going Ship, Cruise and Yacht Research Center, Wuhan University of Technology, Wuhan 430063, China
2
Hubei Province Engineering Research Center on Green & Smart River-Sea-Going Ship, Wuhan 430063, China
3
School of Naval Architecture, Ocean and Energy Power Engineering, Wuhan University of Technology, Wuhan 430063, China
*
Author to whom correspondence should be addressed.
J. Mar. Sci. Eng. 2023, 11(7), 1264; https://doi.org/10.3390/jmse11071264
Submission received: 3 June 2023
/
Revised: 14 June 2023
/
Accepted: 18 June 2023
/
Published: 21 June 2023
(This article belongs to the Special Issue Advanced Analysis of Marine Structures)
Abstract
:The demand for larger passenger capacity and more entertainment facilities has led to the rapid growth of the cruise tourism market. The superstructure of cruise ships is designed to be plumper, with numerous decks and complex structural forms. To control the weight and the center of gravity, the bending stiffness of the superstructure is always designed to be weaker than that of the main hull, resulting in a stiffness step. Currently, there is no satisfactory method to accurately estimate the influence of the stiffness step between the main hull and superstructure on the structural response of cruise ships. In the present research, an experimental analysis is conducted to investigate the stiffness step between the main hull and superstructure of a typical cruise ship. By comparing the longitudinal stress distribution characteristics with and without the stiffness step with the theoretical results, the influence of the stiffness step on the longitudinal strength is investigated. Furthermore, the maximum stress and the bending efficiency of the superstructure are also discussed. The present research is of reference significance for the structural safety and reliability design of cruise ships.
1. Introduction
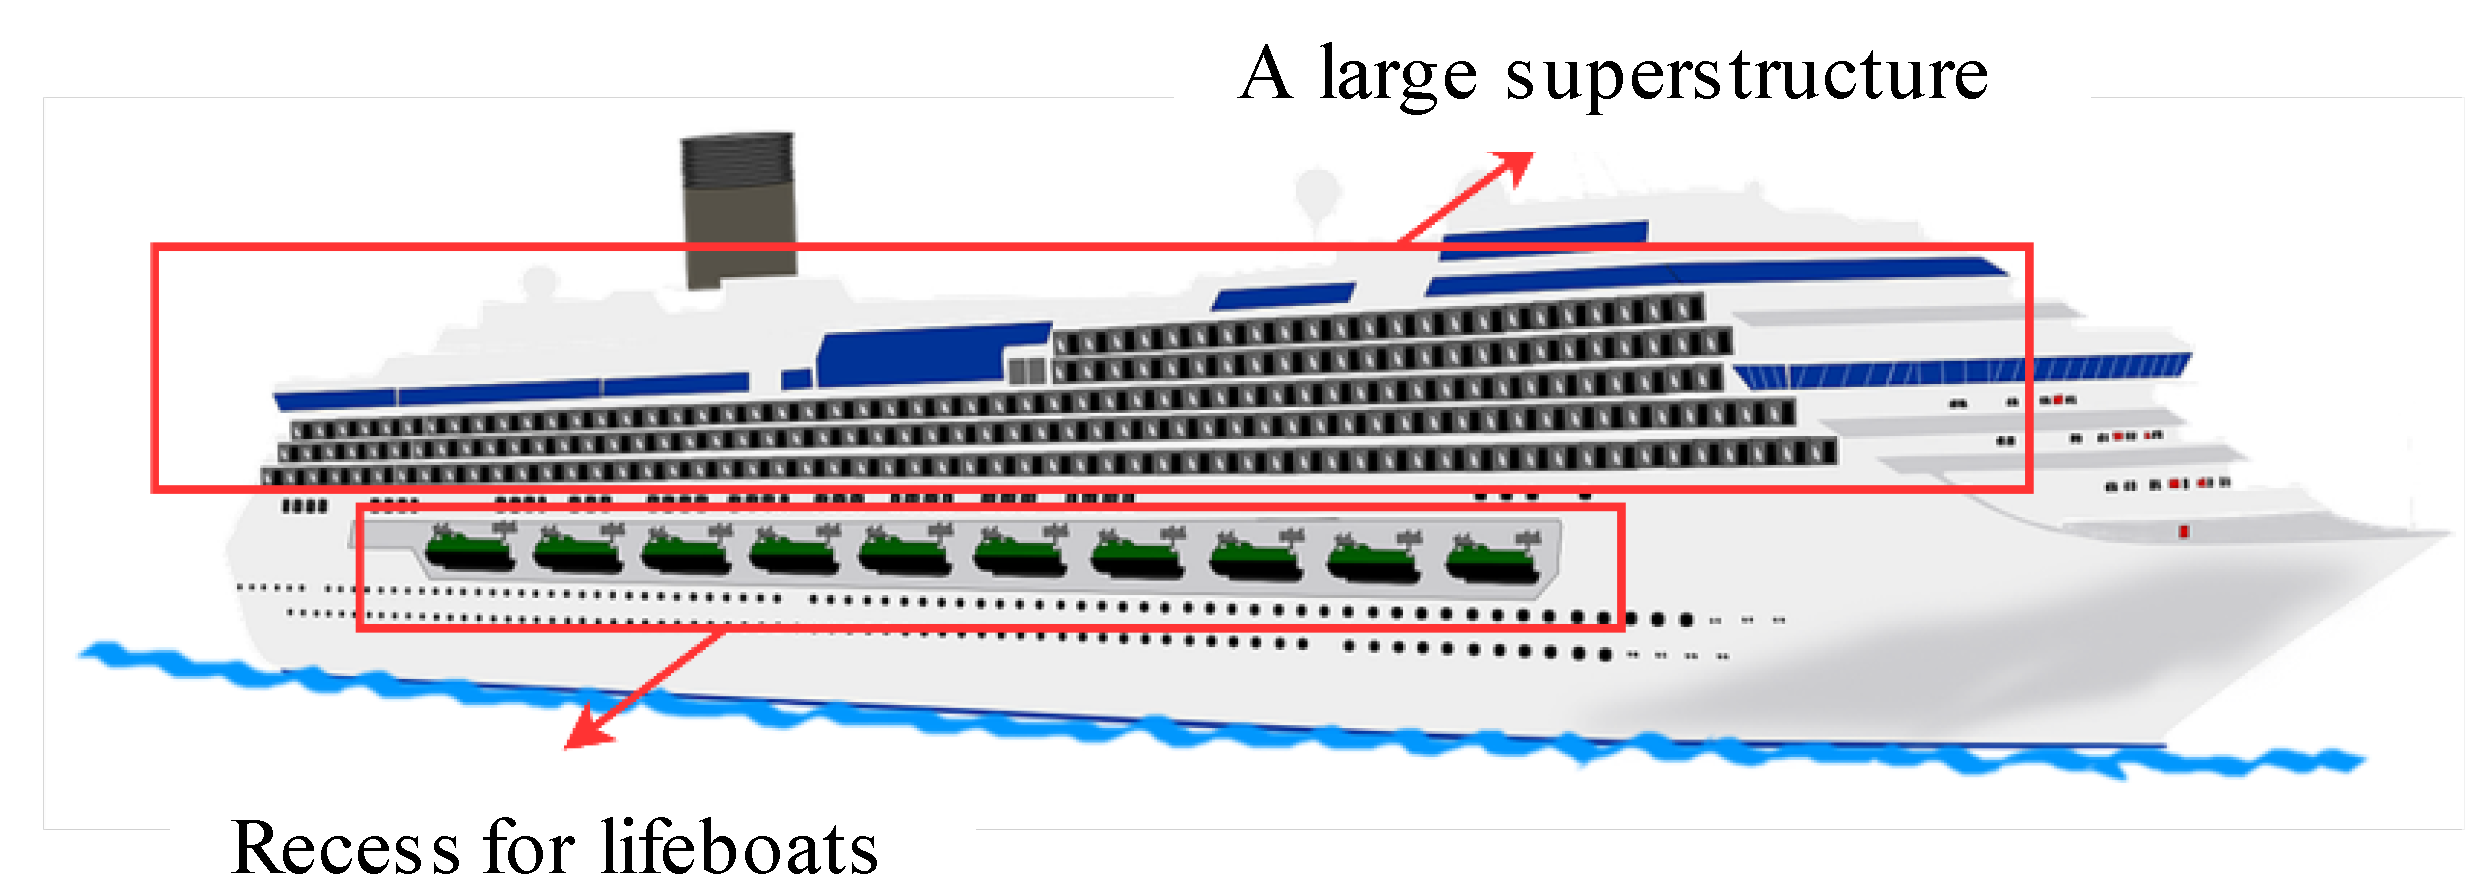
For high technology and high value-added entertainment ships, generous living space and a comfortable environment are the most important aspects of cruise ships, which results in plump superstructure arrangements. The lightweight design and the control of the center of gravity bring a series of challenges to the structural design of large superstructures. Due to the arrangement of life-saving passageways and lifeboats, the connection between the main hull and superstructure will be retracted inwards to a certain extent. In addition, the bending stiffness of the superstructure is always designed to be weaker than that of the main hull due to the purpose of the lightweight design. Therefore, there is a stiffness step between the main hull and superstructure, which affects the force transformation.
The cruise ship is typically designed with a large superstructure consisting of multiple decks, as shown in Figure 1. To meet the entertainment requirement, complex structural forms such as atrium and theater are also included, which sets them apart from other merchant ships.
For cruise ships, the interaction mechanism between the main hull and superstructure is more complex. The superstructure adopts a lightweight design for the control of the center of gravity, which results in the weaker bending stiffness of the superstructure. Furthermore, the inward structure between the main hull and superstructure aggravates the stiffness difference, as shown in Figure 1. Due to the existence of different stiffness, the deformation between the main hull and superstructure is inconsistent. Therefore, it is necessary to conduct a model experiment to investigate the influence of the stiffness step between the main hull and superstructure on the structural response of cruise ships.
The theoretical methods that consider the stiffness characteristics of cruise ships include the simple beam theory, two-beam theory, coupled beam theory, and multi-beam method. The longitudinal stress is generally estimated using simple beam theory in the initial design [1]. The simple beam theory is derived from the thin-walled beam theory, based on the assumption of plane section. The longitudinal stress σ on cross-section along height can be calculated according to Equation (1).
M is the bending moment of the cross-section. Iy is the moment of inertia on the neutral axis. z is the distance from the calculation position to the neutral axis. Simple beam theory is widely used in the initial design due to its advantages of simplicity. However, the deformation of the main hull and superstructure cannot be consistent when the longitudinal bending occurs, and the longitudinal stress distribution along height does not conform to the plane section assumption. When this theory is used to calculate longitudinal stress, errors may occur [2].
Crawford and Ruby [3] proposed the two-beam theory based on the traditional simple beam theory. The fundamental idea is to consider the main hull and superstructure as two independent beams, taking into account the longitudinal shear and vertical forces generated by the interaction between them. Many researchers subsequently investigated and developed the theory on simple beam theory with certain assumptions. Bleich [4] discussed in detail the inconsistency in the curvature of the main hull and superstructure. Terazawa and Yagi [5] applied the energy method to estimate the longitudinal stress in the main hull and superstructure using assumed structural stress distribution modes. However, the beam equilibrium formulas must be modified to accommodate different interactions between the main hull and superstructure when the two-beam theory is adopted.
Naar [6] proposed the couple beam theory for the multi-deck superstructure of cruise ships. It is assumed that the cruise ship can be composed of multiple thin-walled beams coupling with longitudinal and vertical springs. Morshedsolouk [7] modified the couple-beam equilibrium equations proposed by Naar. Toming [8] assumed that the main deck and each deck are thin-walled beams with bending and axial stiffness so that the ship structure can be divided into spring-distributed beams based on vertical stiffness and shear stiffness. When using the couple beam theory for structural response analysis, the longitudinal stress distribution will no longer be continuous. In addition, the couple beam theory needs to use FEM to solve the beam equilibrium equations, which makes it difficult to popularize the application in the initial design.
Yang et al. [9] proposed the multiple-beam method to examine the stress-distribution characteristics and the bending efficiency of the superstructure. The method assumes that the main hull and each deck of the superstructure can be regarded as thin-walled beams, considering the vertical forces and horizontal shear forces interacting between adjacent decks. The multiple-beam method is suitable in initial design without finite element analysis results.
Reasonable theoretical analysis can make preliminary judgments on longitudinal stress distribution and provide a reference basis for the structural design of superstructures. However, this approach may no longer be effective for the plump superstructure of cruise ships. With the development of computational technologies, numerical simulation methods have become powerful tools.
The interaction between the main hull and superstructure is so complex that it has become one hotspot of research for a long time. Pauling and Payer [10] investigated the interaction between the main hull and superstructure using the finite element method. Mitchell [11] further researched the difference in stiffness between the main hull and superstructure and discussed how to build a reasonable finite element model. Fransman et al. [12] proposed a simplified modeling principle for the numerical simulation in detail and put forward a simplified calculation method for the longitudinal stress of cruise ships.
Furthermore, the issue of reducing the weight of the superstructure of cruise ships to a minimum while ensuring that it possesses sufficient strength has become a challenge that every designer must consider. Mackney et al. [13] designed a series of hull-superstructure interaction models to investigate the parameters that might affect the bending efficiency of the superstructure, such as superstructure length, number of decks, and deck spacing. As pointed out by Fricke and Gerlach [14], the superstructure undergoes a different bending curvature from the main hull. During the early stages of ship construction, the design of the superstructure was typically based on the strength of the main hull. [15]. Pei et al. [16] investigated the efficiency of superstructure participating in the longitudinal bending and analyzed the effects of different connection types between the main hull and superstructure on structural response.
In addition to the numerical method, the model experiment is an effective way to reveal the mechanism. Wu et al. [17] designed a large-scale model using the similarity theory and carried out experimental research on the bending efficiency of the superstructure. The research indicates that the main hull participating in the longitudinal bending is the middle deck, not the uppermost deck. Zhu et al. [18] conducted bending experiments on one ship with a long superstructure and concluded that the opening of the side of the superstructure could reduce the degree to which the superstructure participates in longitudinal bending. Shi et al. [19,20] carried out a collapse experiment to research the superstructure’s effectiveness. Then, the increment–iterative relationship is revised for the ultimate strength evaluation of the cruise ship. For the time being, the experimental research on the stiffness step between the main hull and plump superstructure of cruise ships has kept its virginity.
In the present paper, a typical cruise ship is considered as the research object. The structural features, including the multiple decks and the stiffness step between the main hull and superstructure, are analyzed first. A similar model considering the stiffness step between the main hull and superstructure is designed, and a model experiment is then carried out. The structural response and stiffness step are discussed and analyzed. The research has meaningful for the structural safety and reliability design of superstructures for cruise ships.
2. Experimental Details
The experimental model is designed based on the scantling of actual cruise ship. In order to consider the stiffness step, an inward retracted structure is designed in the connection area between the main hull and superstructure.
2.1. Description of the Model
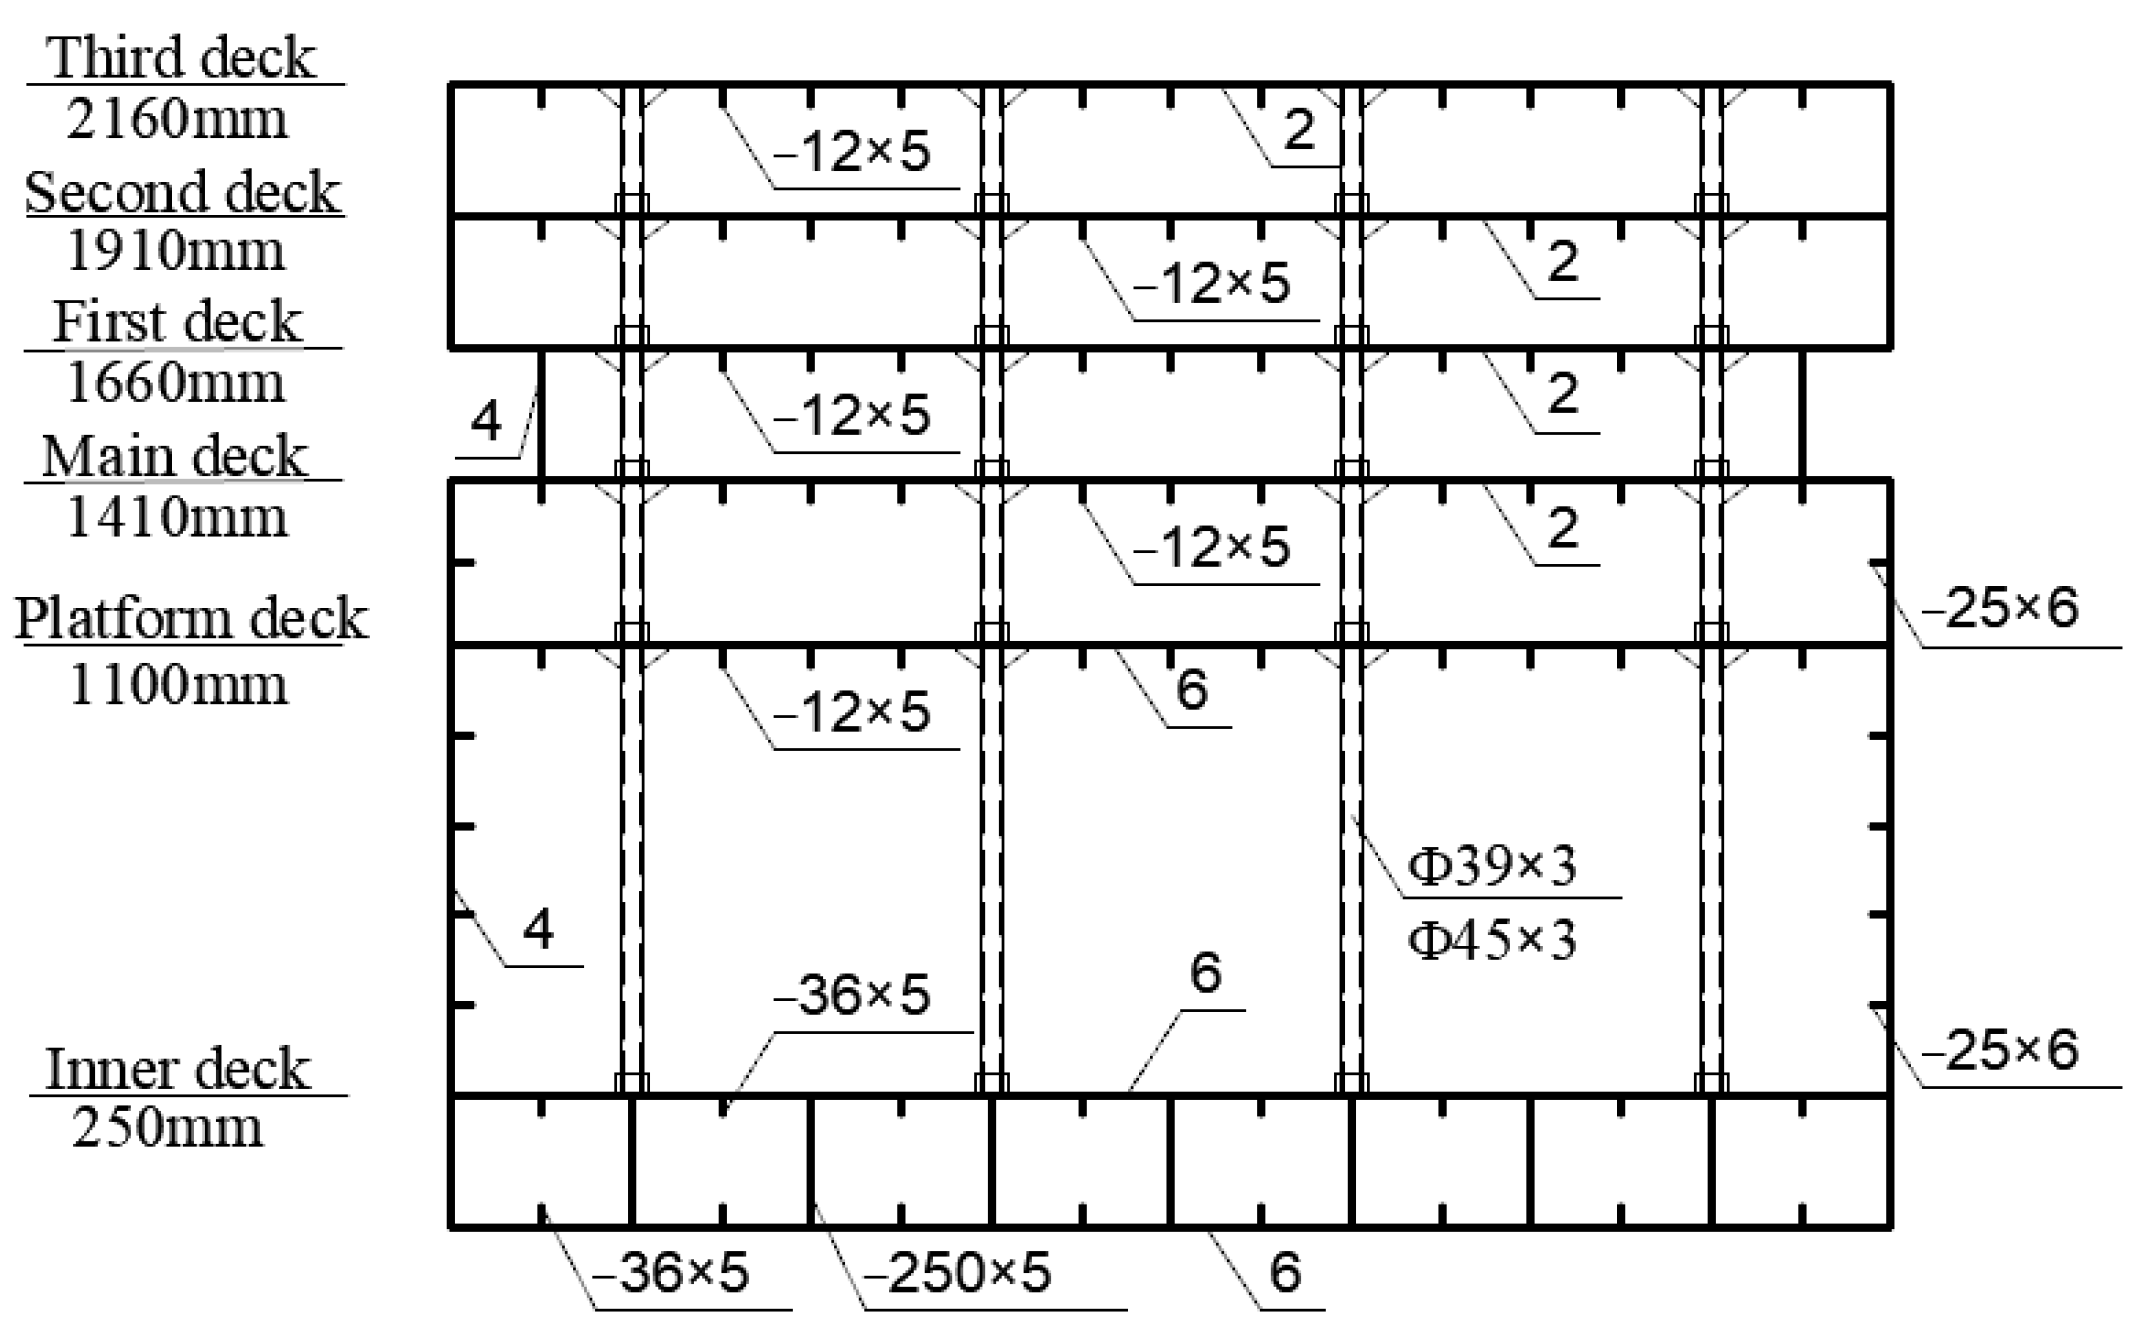
The main parameters of the model are shown in Table 1. The characteristics of the cross-section are shown in Table 2. The dimensions of the longitudinal components are shown in Table 3. The transverse bulkheads adopt a thicker plate with 16 mm to ensure the loading. The model uses a pipe with Φ39 × 3/45 × 3 to simulate the pillar of the cruise ship. The cross-section of the model is shown in Figure 2. As shown in Figure 2, Inner deck/250 mm represents the structure at this position is the inner deck, and the distance from the inner deck to the baseline is 250 mm. And the annotations in the other figure all represent this meaning.
Based on objective conditions such as the experiment site and the loading capacity, the geometric similarity ratio between the cruise ship and the experimental model has been determined as CL = 12:1. The experimental model was designed as a thin-walled structure. Suppose the thickness similarity ratio is taken to be the same as the geometric similarity ratio, which will result in a very small plate thickness of the model, which is obviously impossible to achieve [21]. Therefore, the thickness is regarded as an independent parameter, and the thickness similarity ratio between the prototype and the model is finally determined as Ct = 4:1 by comprehensively considering the experimental cost, laboratory condition, and processing technology.
The mid-ship section of the prototype is selected for a similar design to simplify the model structure. The prototype and model need to meet the linear bending similarity criterion, which means that the prototype and model are guaranteed to have similar moments of inertia in the cross-section and similar height of the neutral axis [22]. The similarity condition of the moment of inertia can be expressed as
CI is the ratio of moments of inertia between the prototype and the model. To ensure that the strain of members at corresponding positions in the prototype and model meet the similarity relationship, the height of the neutral axis must be similar, which can be expressed as
Ce is the height similarity ratio of the neutral axis between the prototype and model. After the model design has satisfied the bending similarity criterion, it is necessary to compare the sectional characteristics of the prototype and model to verify the similarity and ensure the reasonableness of the model design [23]. The comparison of sectional characteristics between the prototype and model is shown in Table 4. The height error of the neutral axis and the section of inertia of the prototype and model are all within 1%. Therefore, it can be determined that the section characteristics between the prototype and model are similar when bending occurs.
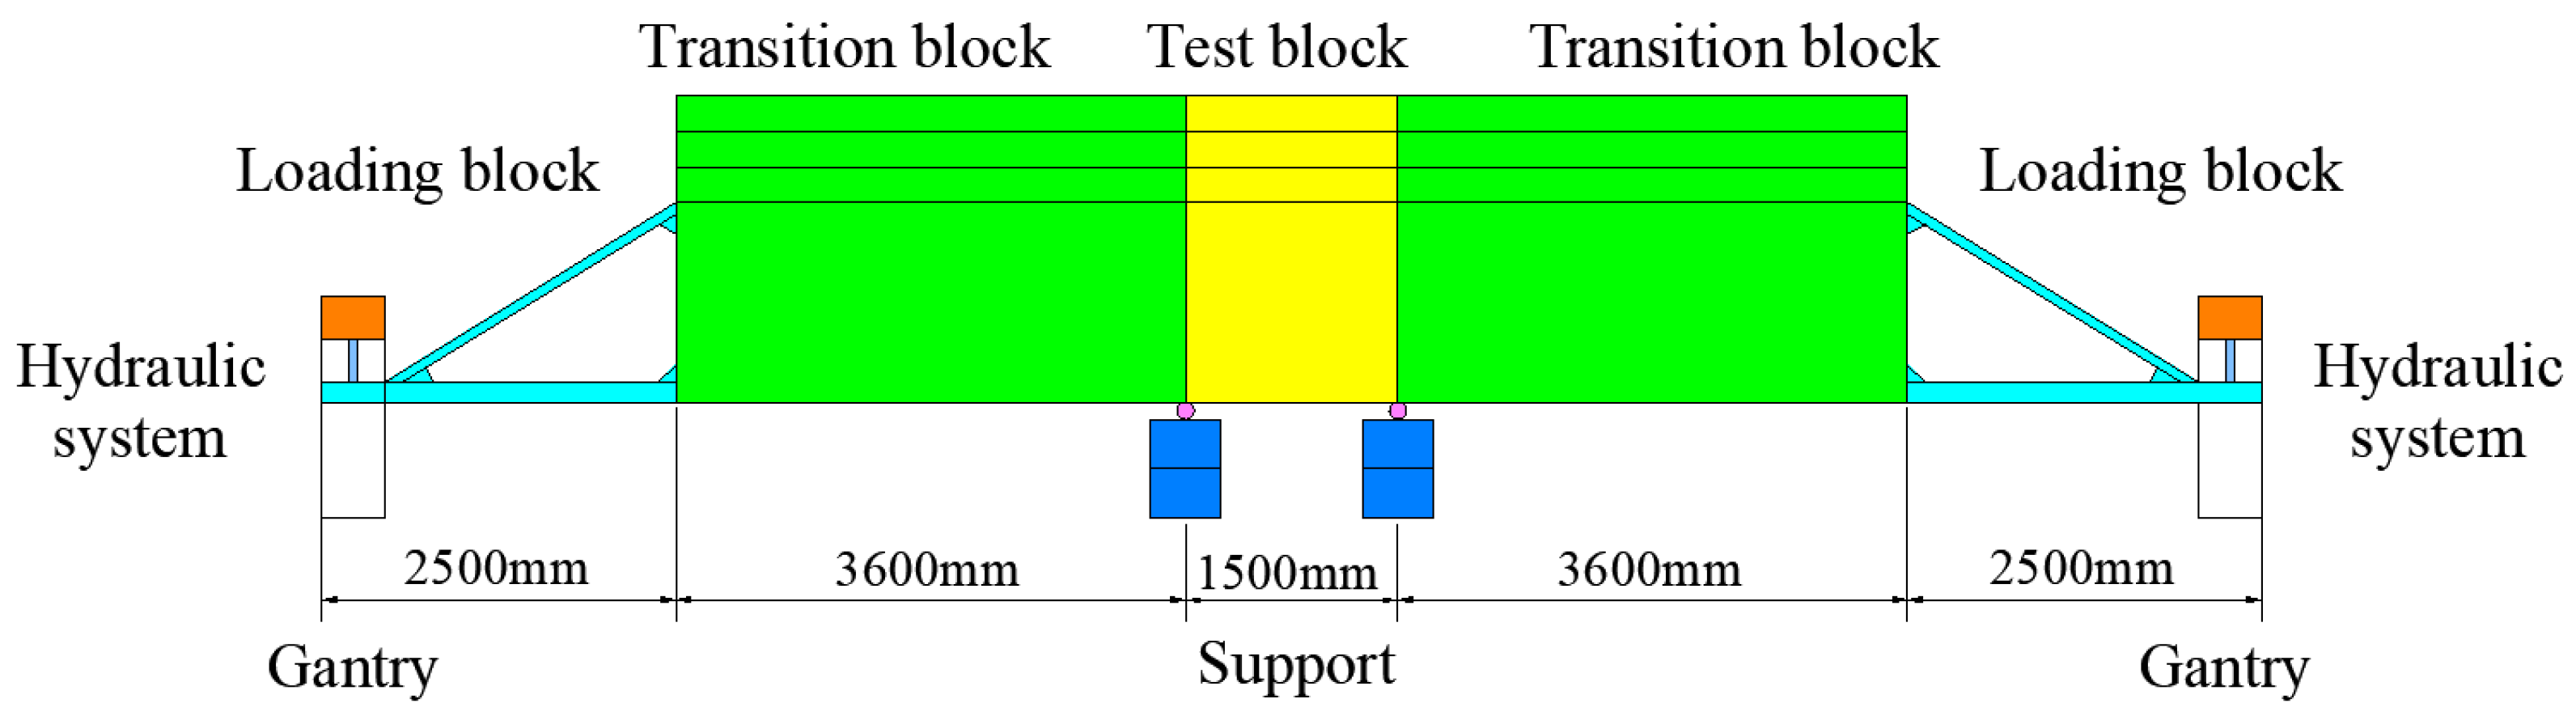
The model has a total length of 13,700 mm, a width of 2720 mm, a main hull height of 1410 mm, a superstructure layers spacing of 250 mm, and a total height of 2160 mm. Here, the model experiment under hogging bending is simulated with a four-point bending mechanism, as shown in Figure 3, including two loading blocks used to produce bending moments, two transition blocks connected to loading blocks for the force transmission, and a test block.
2.2. Experimental Setup
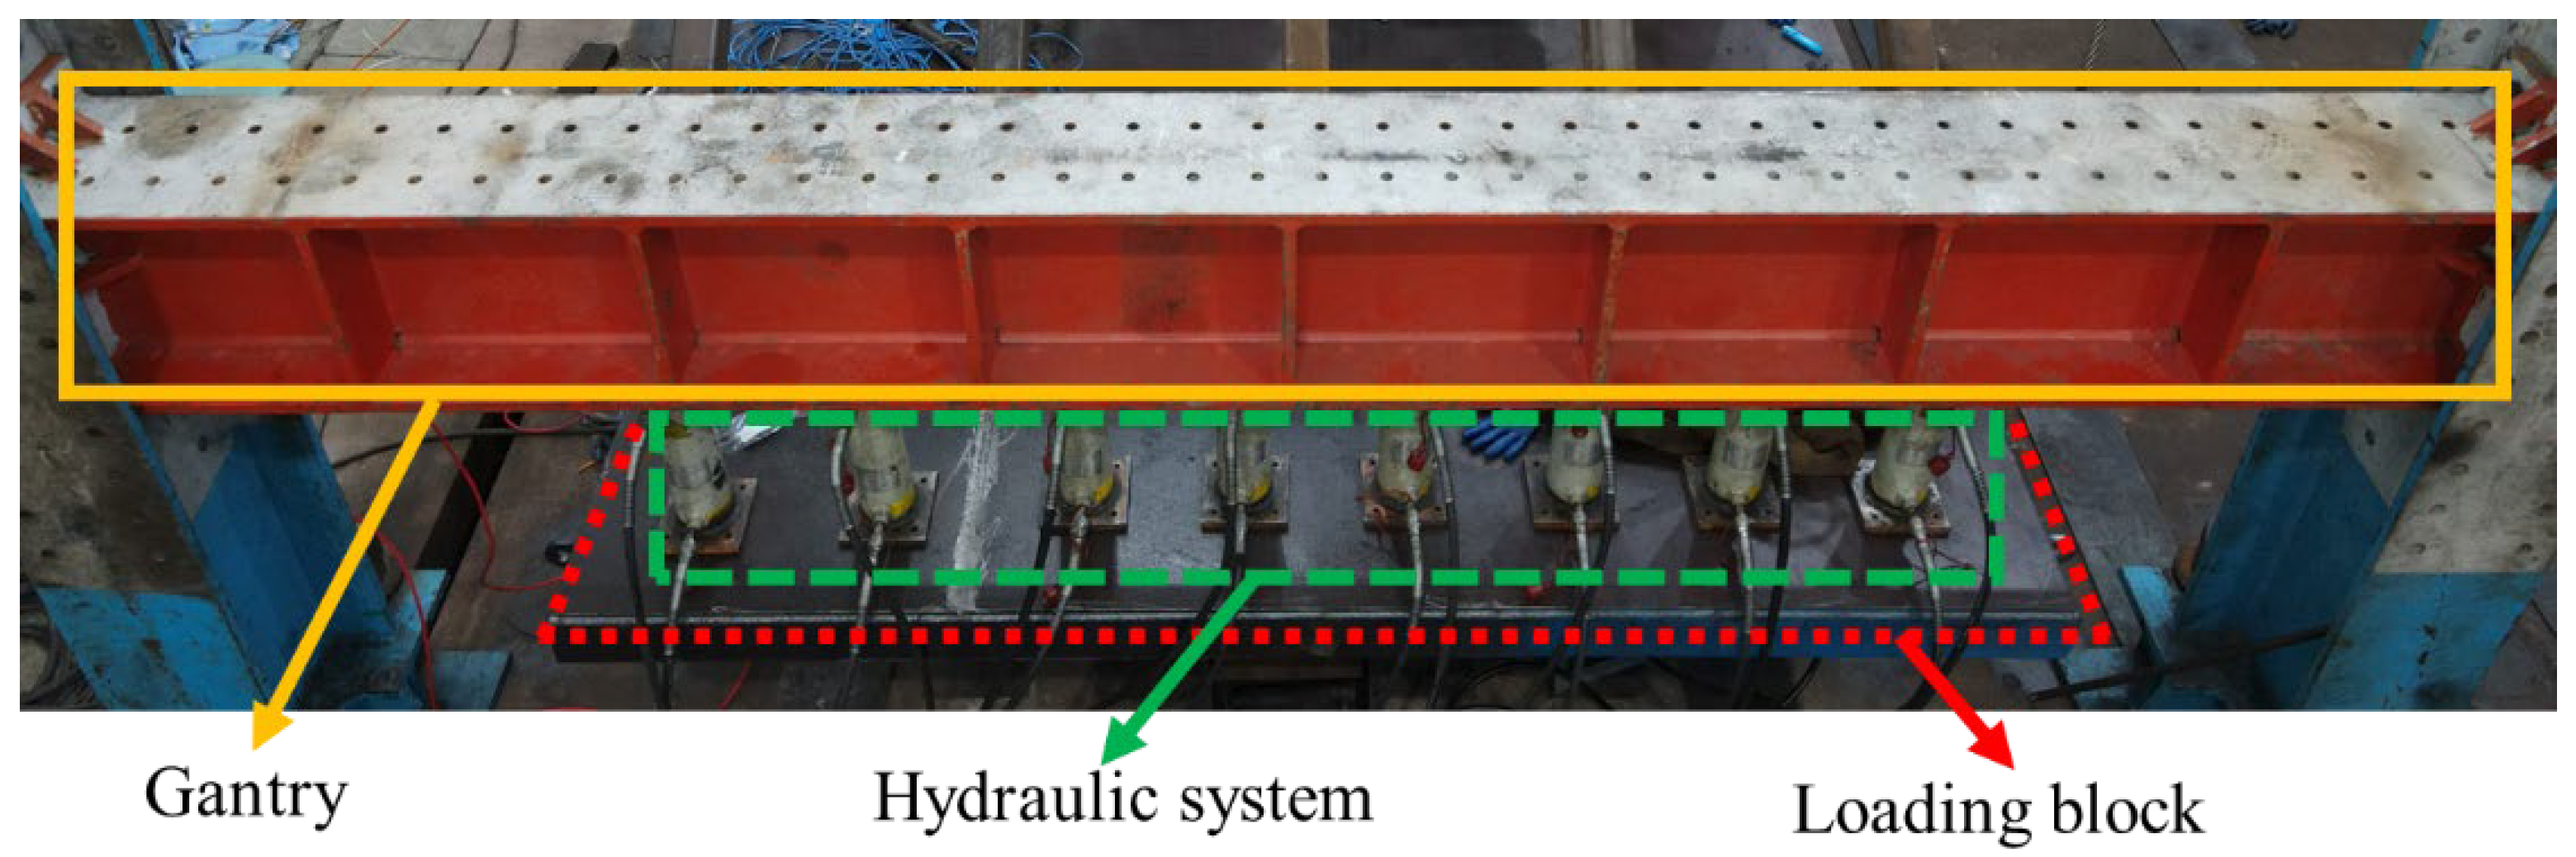
In the experimental procedure, the hydraulic system and gantry are included in the loading block to provide a downward load to the model, which is used to produce the bending moment, as shown in Figure 4.
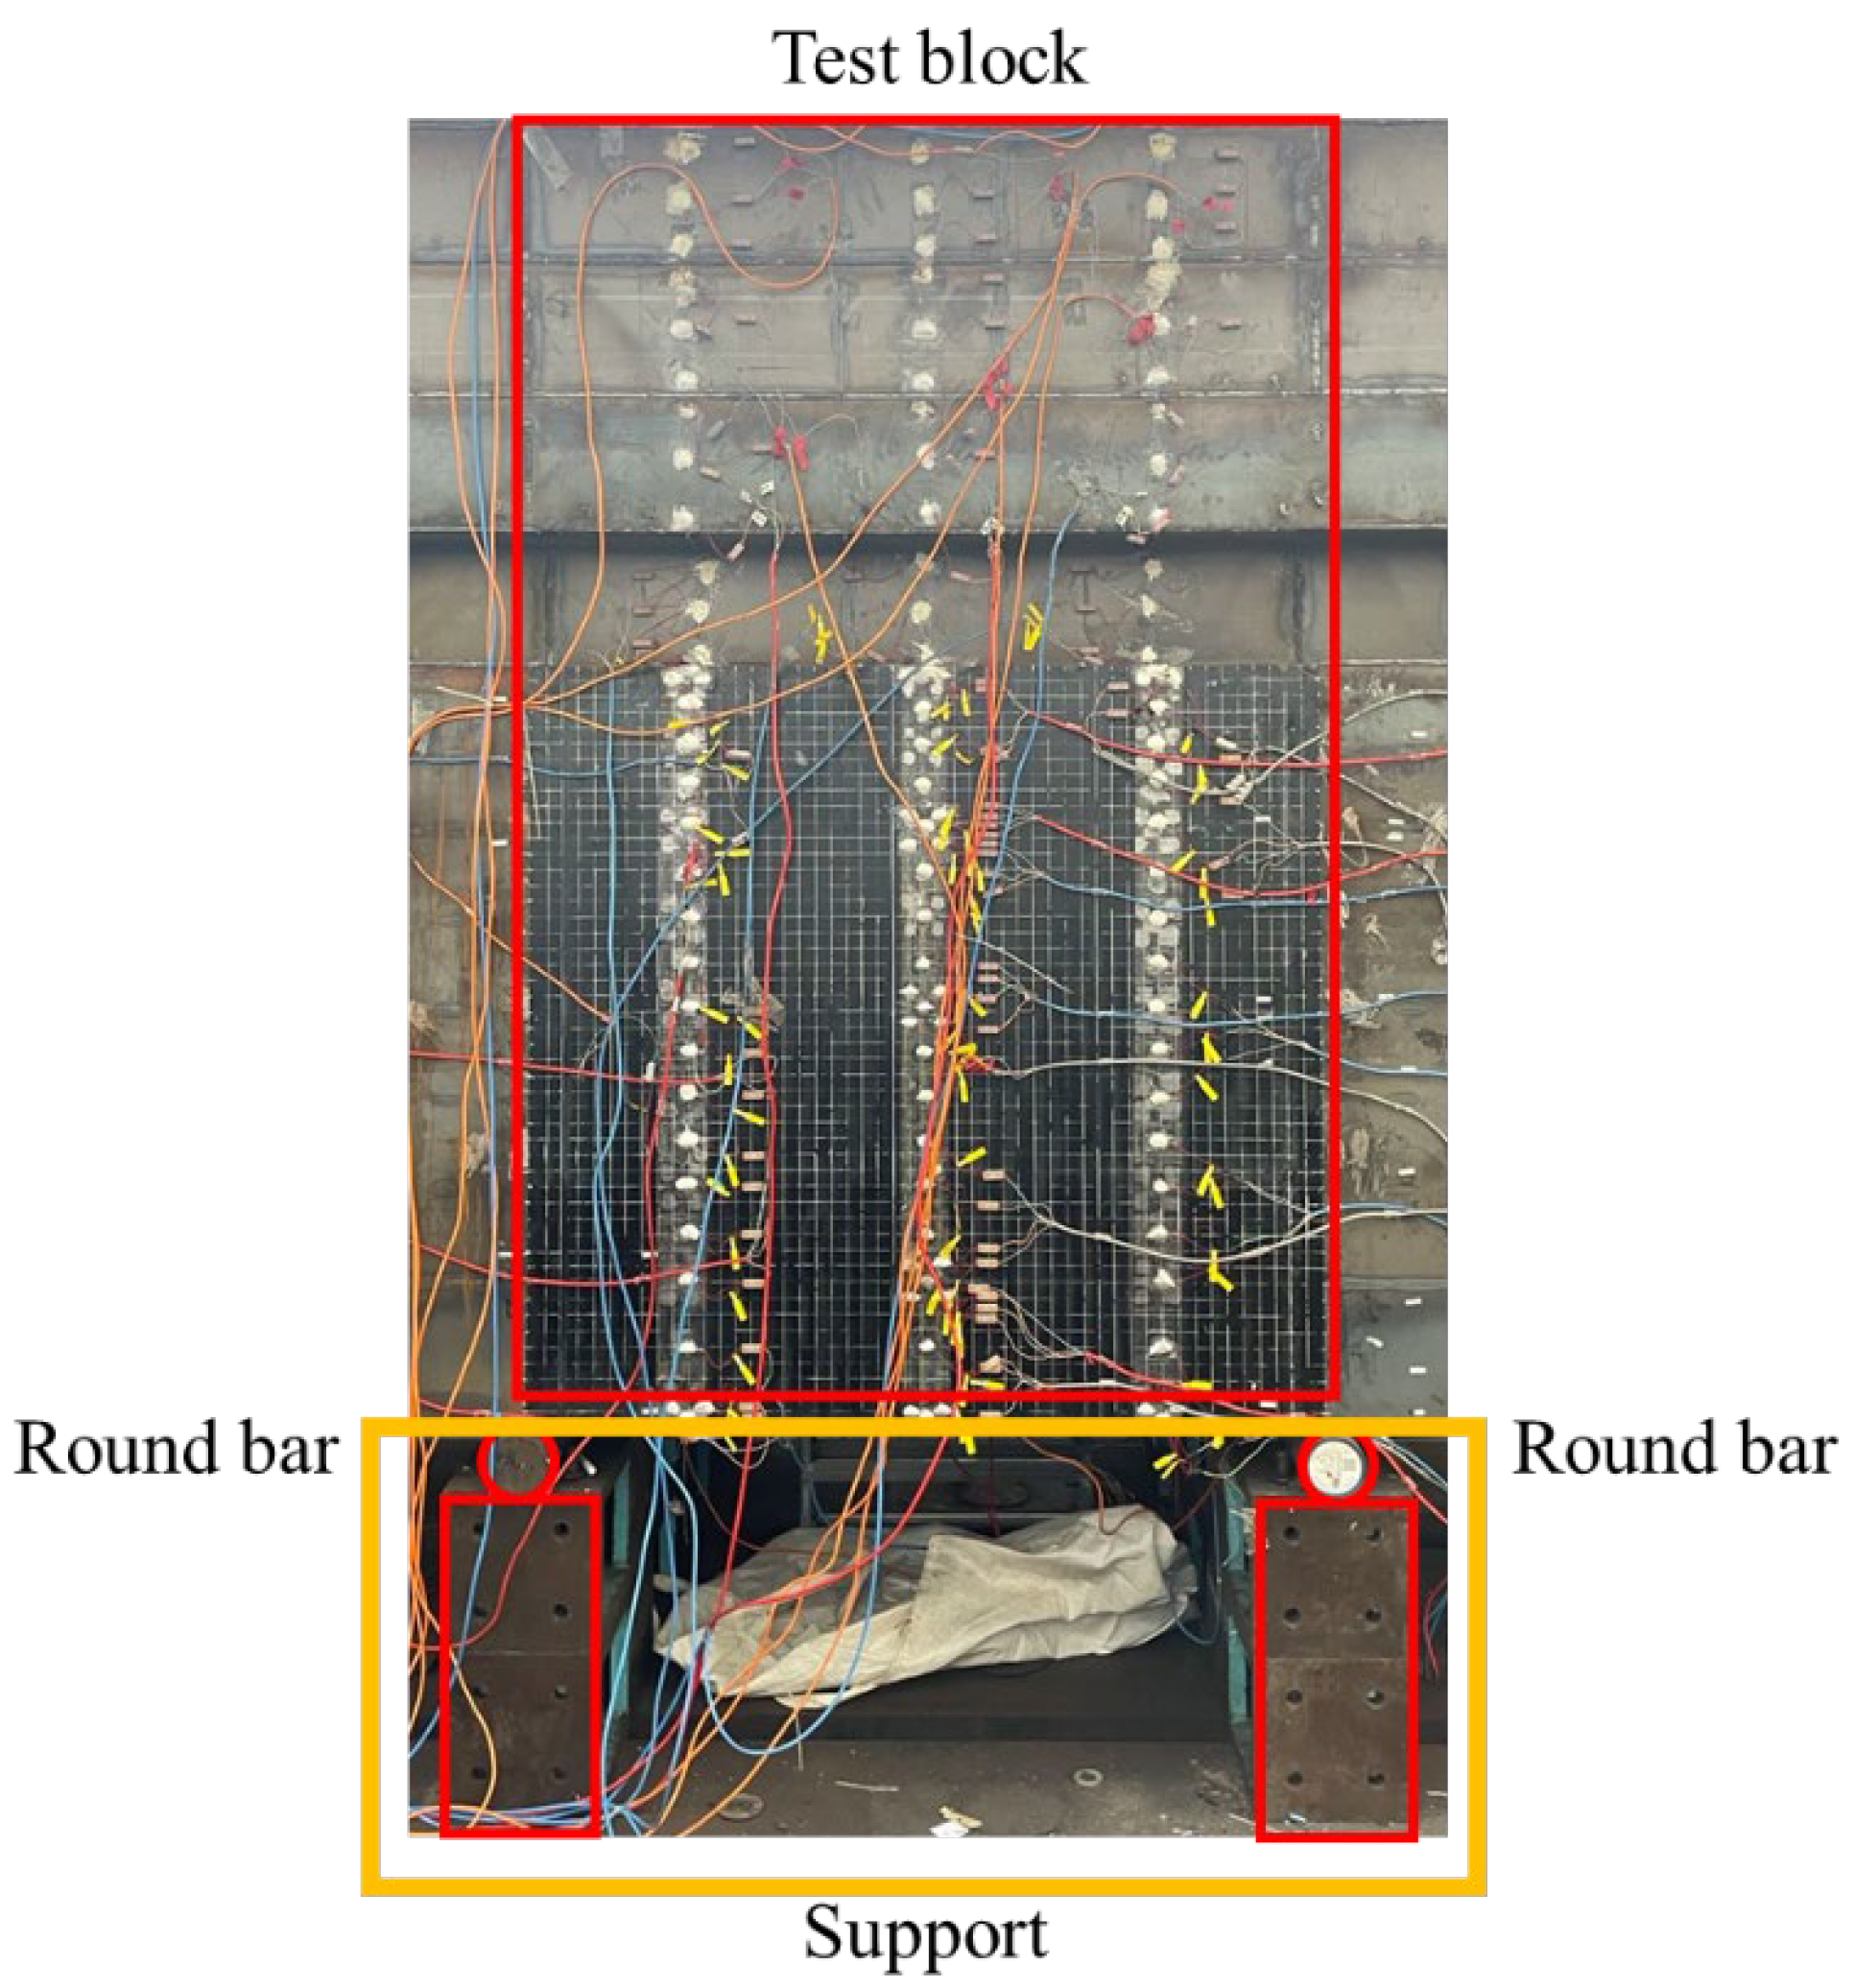
At the bottom of the transverse bulkheads of the test block, a combination of round steel and supports is used to provide reaction force for the experimental model, which can produce uniformly distributed bending moments in the test block, as shown in Figure 5.
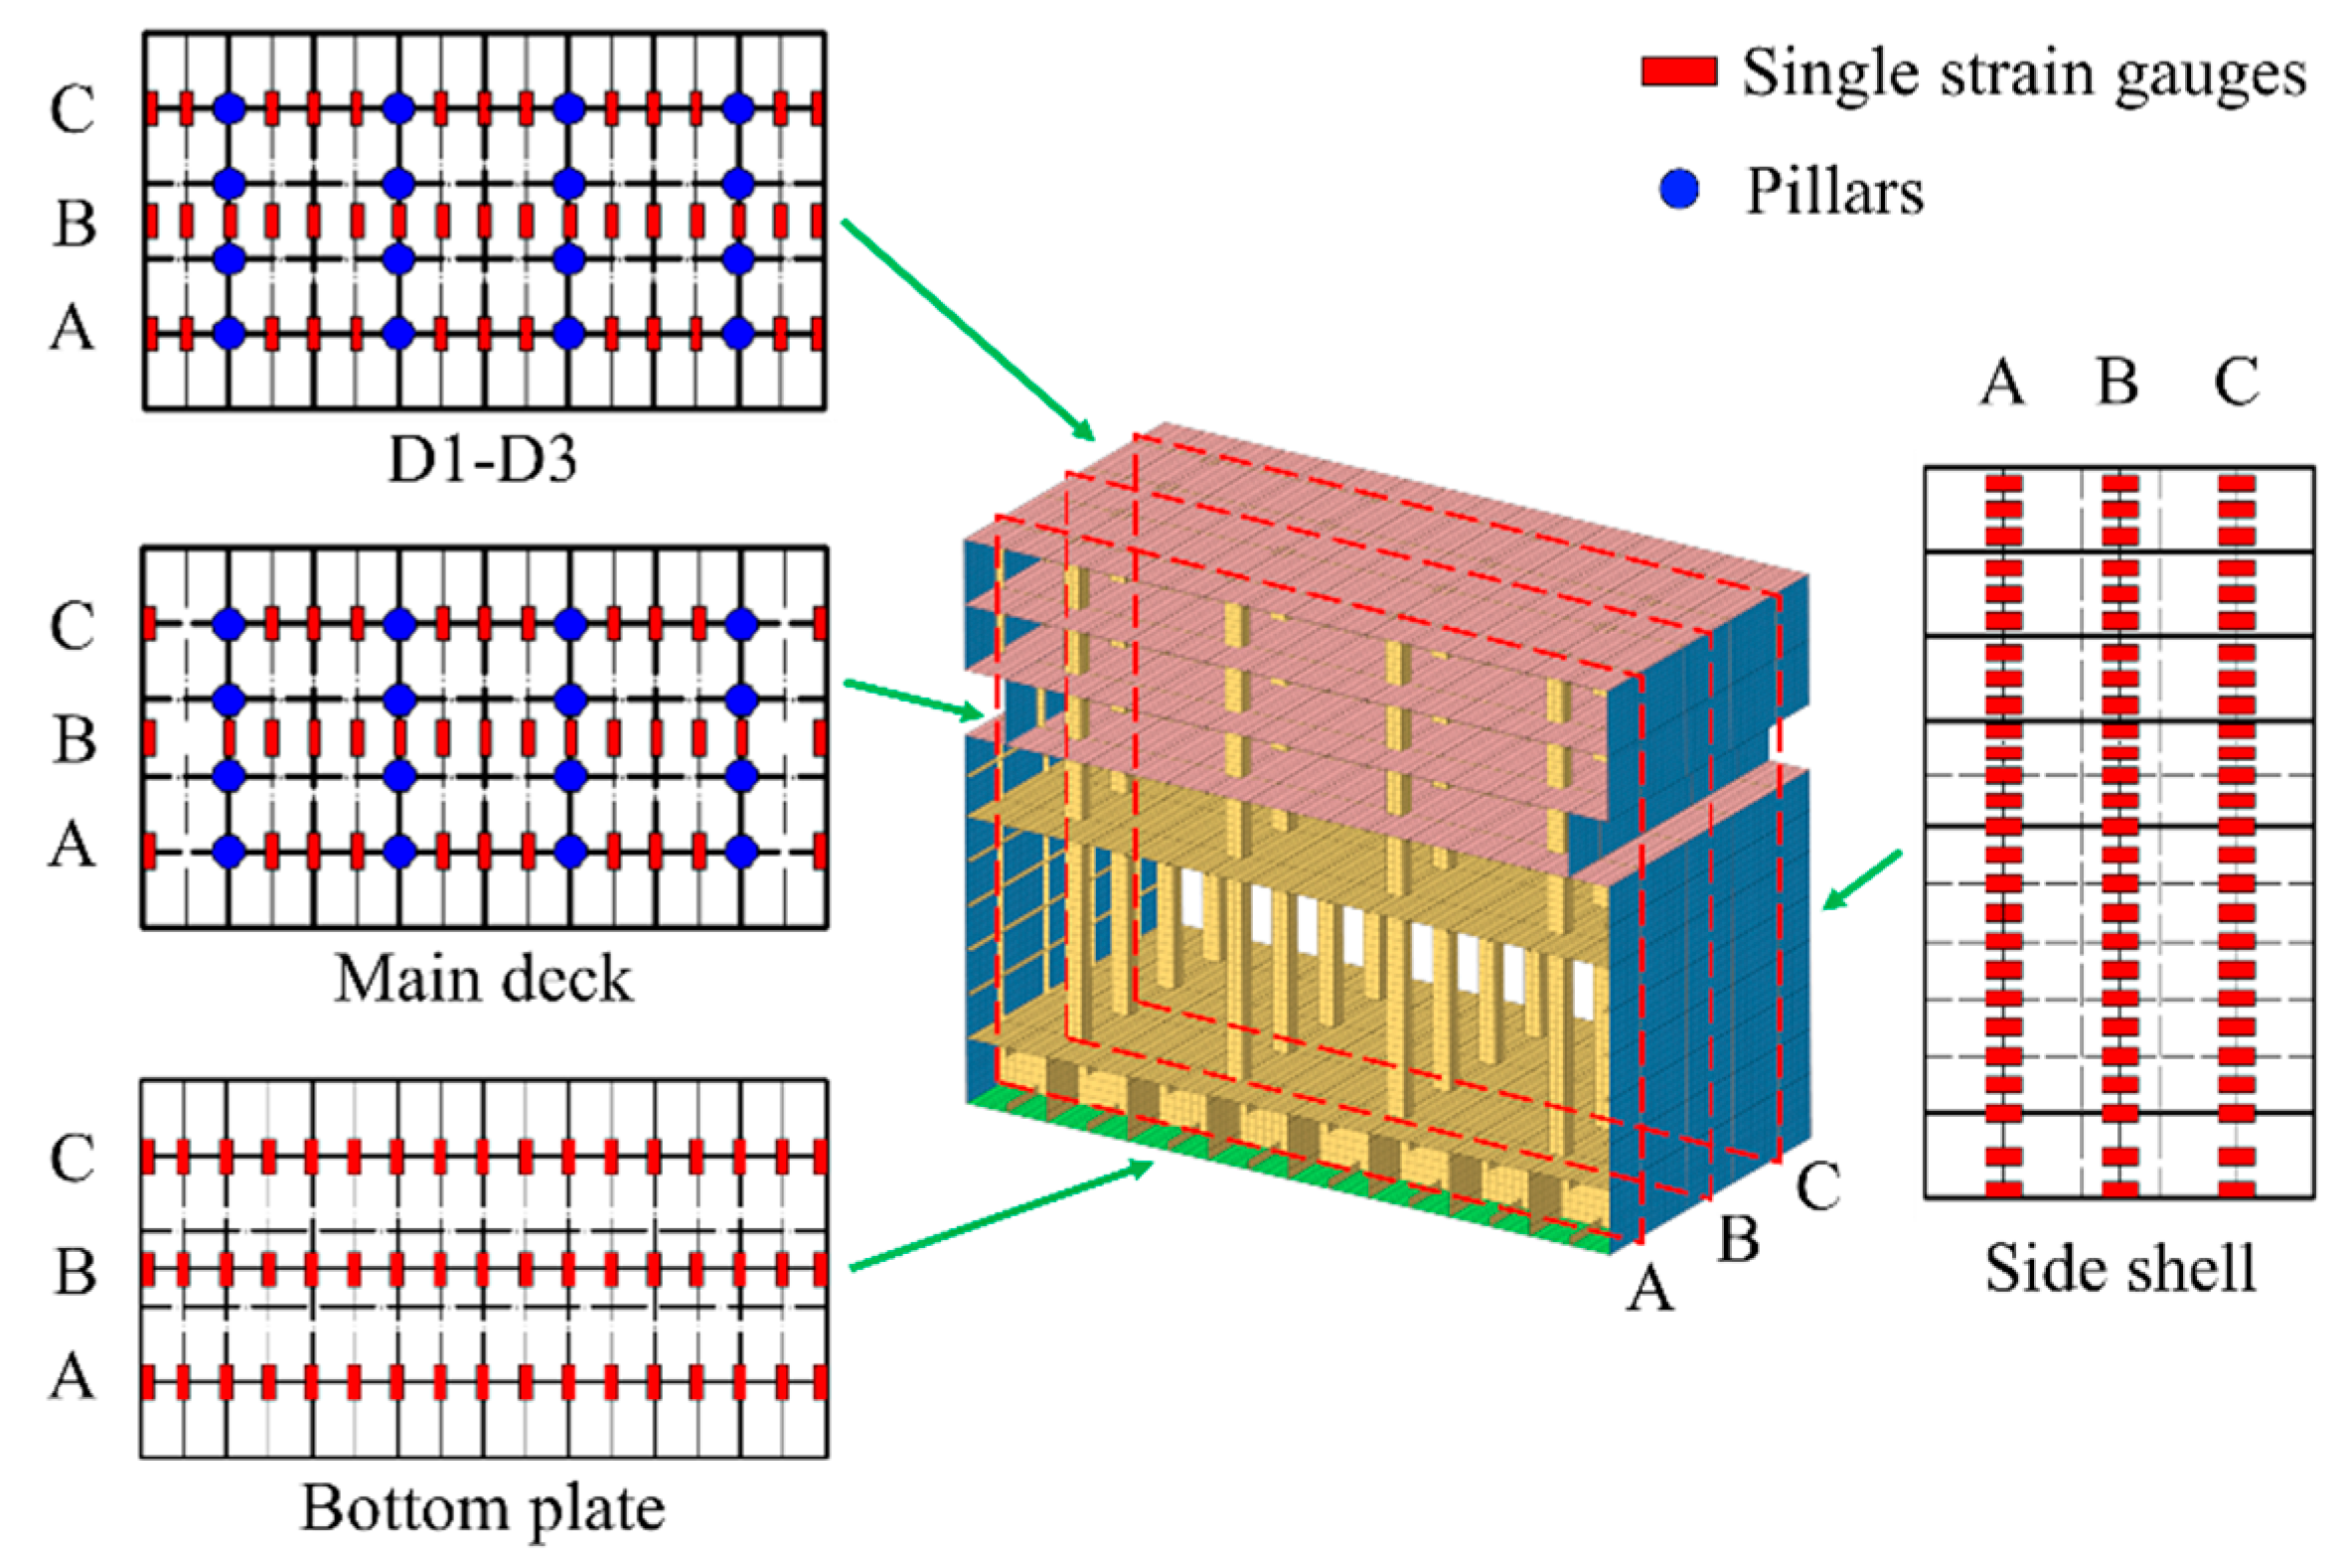
In order to monitor the changes of the longitudinal stress in critical areas during the test, single strain gauges are adopted to measure the longitudinal strain variation. Then, the main focus of the research is on the middle of the ship, including the decks, bottom plates, and side shells. Therefore, single strain gauges are arranged along the ship length at three sections near the midship, as shown in Figure 6.
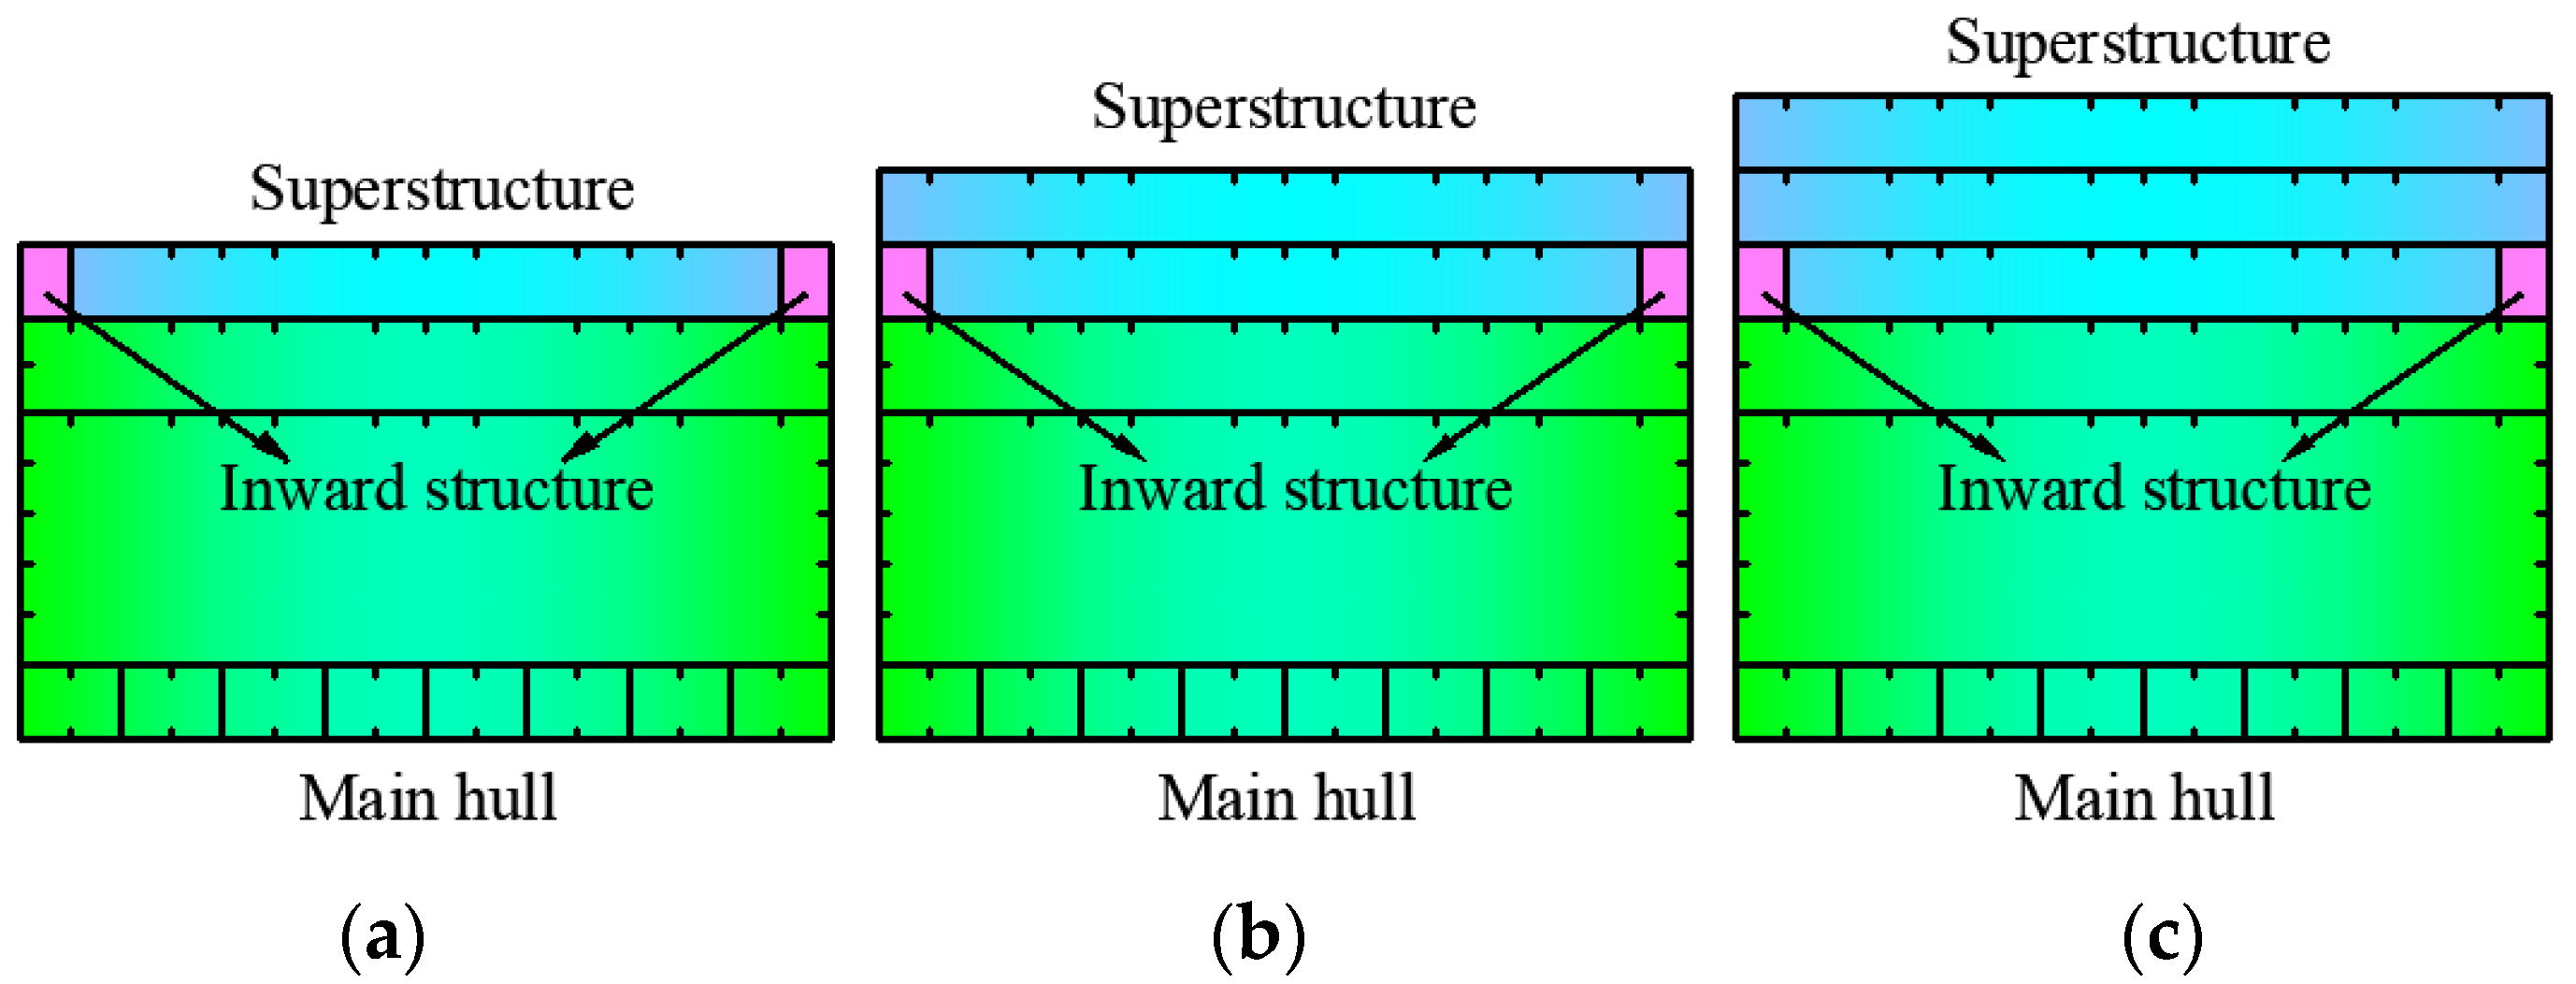
Loading is performed in the elastic range of the experiment model, and the loading order is shown in Table 5. In order to analyze the stiffness step between the main hull and superstructure, five groups of models with different deck forms are designed, as shown in Figure 7. The details are as follows.
M1 is the model of welding the first deck onto the main hull. There is a certain degree of indent inward at the side shell between the main deck and the first deck, as shown in Figure 7a.
M2 is the model of welding the second deck onto M1. There is a certain degree of indent inward at the side shell between the main deck and the first deck. M3 is the model that encloses the inward structure of M2, as shown in Figure 7b.
M4 is the model of welding the third deck onto M3, and there is no inward structure at the side shell between the main deck and the first deck. M5 is the model that exists the inward structure, as shown in Figure 7c.
The main process of the experiment is as follows.
Install the first superstructure to the main hull and then arrange the strain gauges at the corresponding positions, as shown in Figure 7a. Since the experiment model will produce residual stress during the manufacturing process, it is necessary to preload and unload within the elastic range (3–5 times), and the loading value is slightly greater than the maximum value of the experimental loading. Then, review the experimental measurement data to eliminate and repair the existence of bad points. Further, debug the loading system to prepare for the experiment. Graded loading is adopted in the experiment to observe the linear law of external load and strain. Each group is repeated more than twice to ensure the accuracy of the experiment data.
After completing the experiment of M1, the second superstructure was welded to the model, as shown in Figure 7b. Repeat the experiment steps and carry out the experiment of M2 and M3.
Similarly, the third superstructure was welded to the model after completing the experiment of M2 and M3, as shown in Figure 7c. Repeat the experiment steps and carry out the experiment of M4 and M5.
2.3. Experimental Results
In M3 and M4 conditions, the sides of the main hull extend directly to the superstructure, and the force from the main hull can be transferred to the superstructure. In M1, M2, and M5 conditions, the side at the connection between the main hull and superstructure is indented, so the force from the main hull cannot be effectively transferred to the superstructure. When there is a stiffness step between the main hull and superstructure, the transmission of forces at the connection between the main hull and superstructure will change, which will affect the longitudinal stress distribution along the height. Therefore, the influence of the stiffness step can be studied by analyzing the results of the longitudinal stress distribution along the height.
During the model experiment, all the data can be recorded automatically at each loading step. As the experiment model belongs to a symmetrical model, the strains measured on port and starboard are basically the same, and the strains measured on cross-section A and cross-section C are basically the same. This paper selects the experiment data of cross-section A and cross-section B (midship) on starboard as the research object with a series of data collations and analyses. As the trend of the longitudinal stress distribution along height is consistent with the increase of load, the experiment results of 20 t are selected to analyze the influence of the stiffness step.
2.3.1. Experiment Results of M1
M1 is the model experiment with one superstructure deck, and there is the stiffness step between the main hull and superstructure. The distribution of longitudinal stress along the height under 10 groups of loading is shown in Figure A1, and the distribution of longitudinal stress along the height of 20 t is shown in Figure 8. The longitudinal stress in cross-sections A and B are roughly linear along height in the main hull (0–1410 mm), with a step change in the magnitude of the stress above the main hull (1410–1660 mm). Furthermore, the longitudinal stress of cross-section B is slightly greater than that of cross-section A above the main hull (1410–1660 mm), which indicates that the longitudinal stress increases as the section gets closer to midship.
2.3.2. Experiment Results of M2 and M3
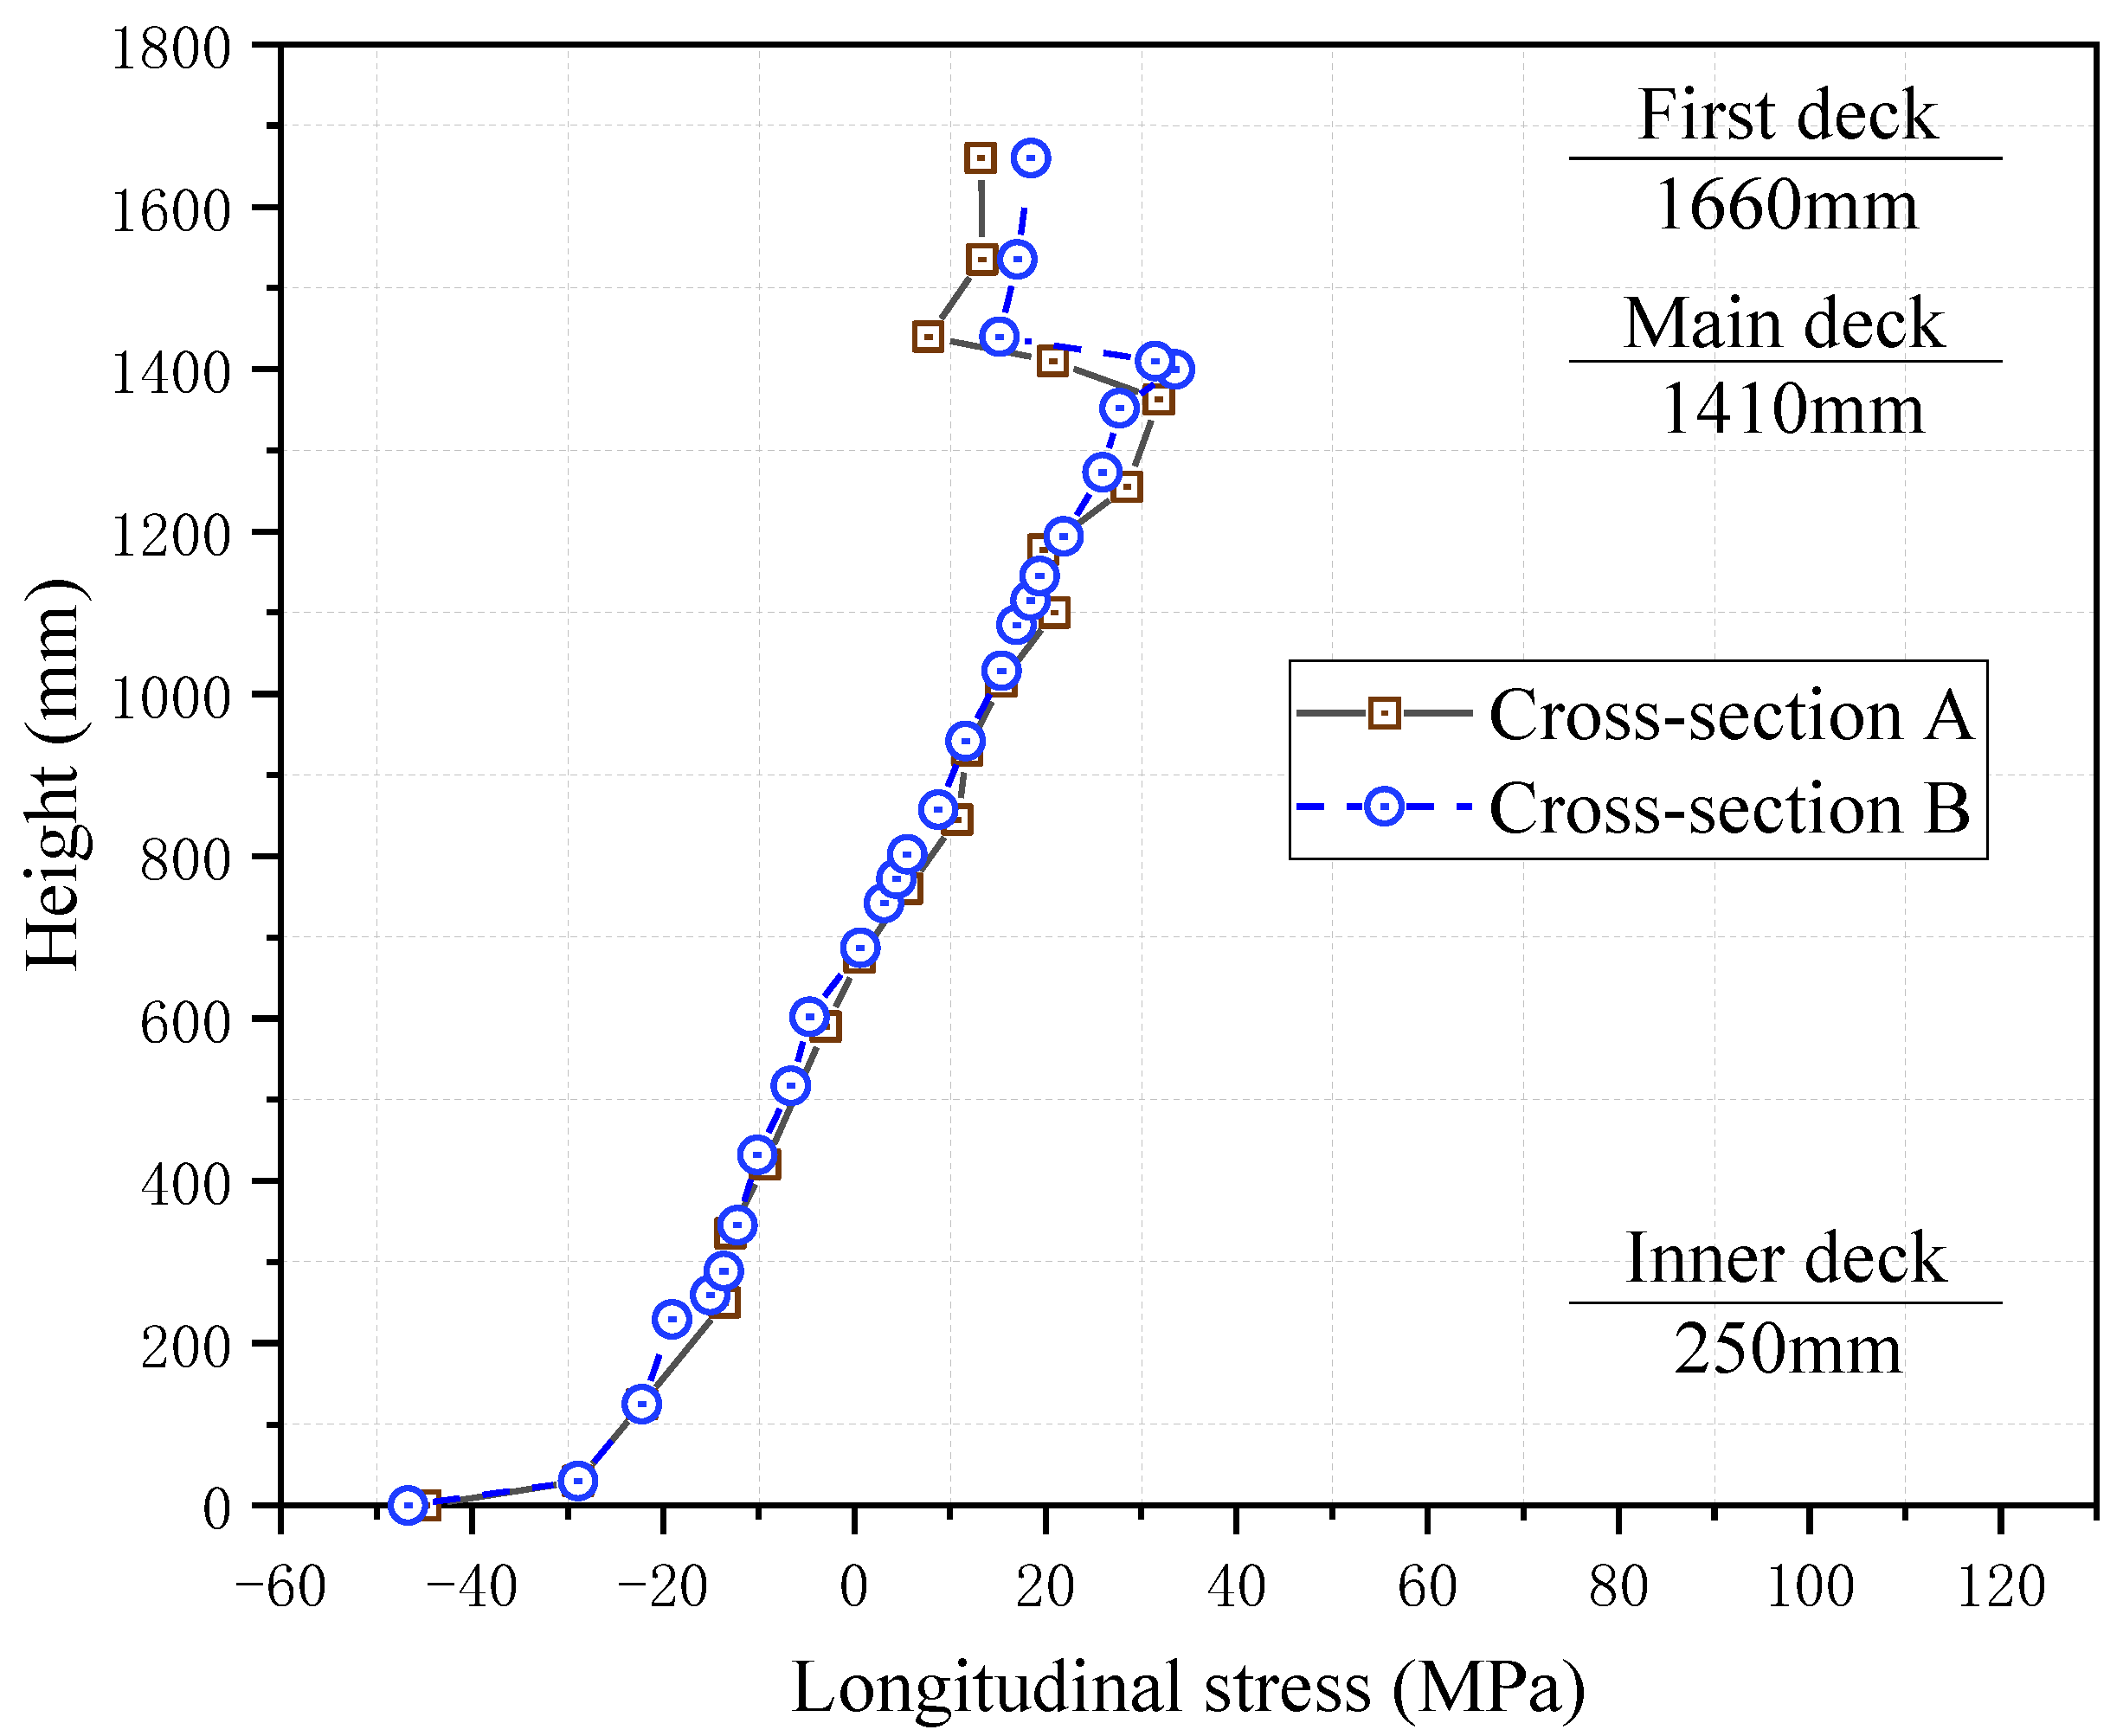
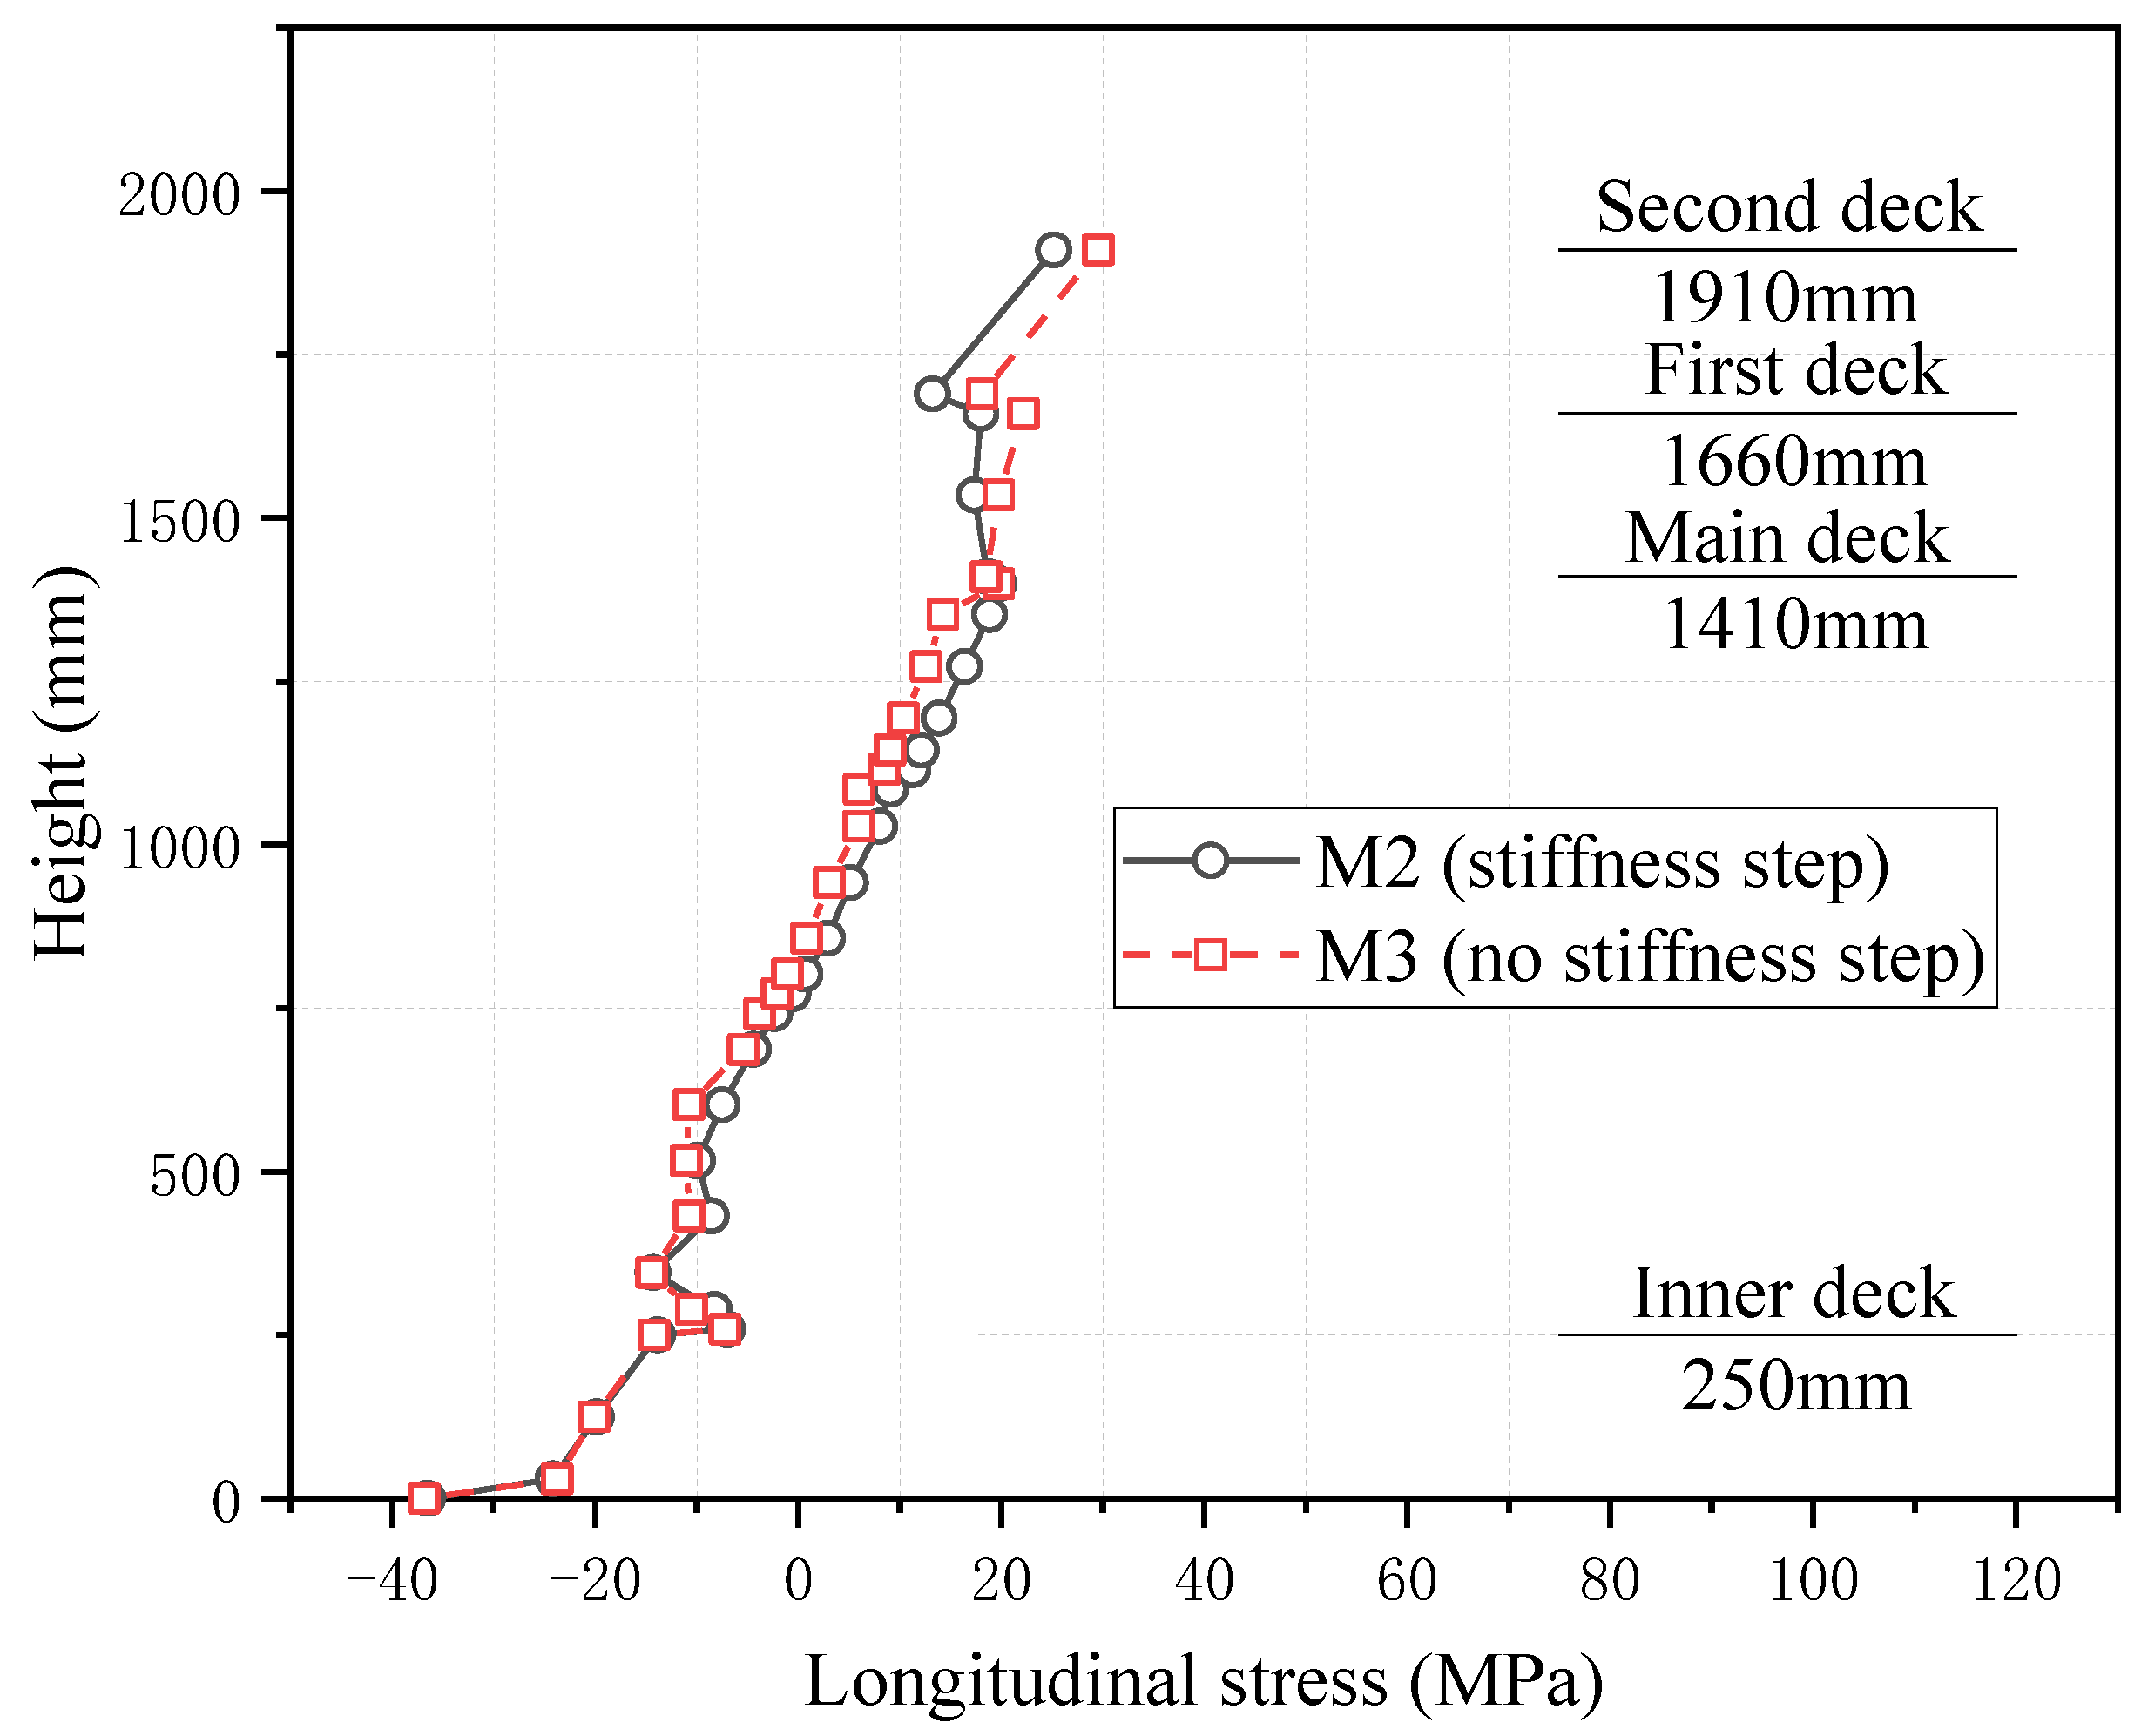
M2 is the model experiment with two superstructure decks, and there is the stiffness step between the main hull and superstructure. M3 is the model experiment with two superstructure decks, and there is no stiffness step between the main hull and the superstructure. The experimental results of M2 and M3 under 10 groups of loading are shown in Figure A2, and the experimental results of 20 t for cross-section B are shown in Figure 9.
The following conclusions can be drawn from Figure 9. The longitudinal stresses of M2 (stiffness step) and M3 (no stiffness step) are almost consistent from bottom to inner bottom (0–250 mm). The longitudinal stresses of M3 (no stiffness step) are lower than that of M2 (stiffness step) from the inner bottom to the main deck (250–1410 mm), while the longitudinal stresses of M3 (no stiffness step) become higher than that of M2 (stiffness step) from main deck to second deck (1410–1910 mm). The results indicate that the participation of the superstructure in the longitudinal bending will decrease when there is a stiffness step.
2.3.3. Experiment Results of M4 and M5
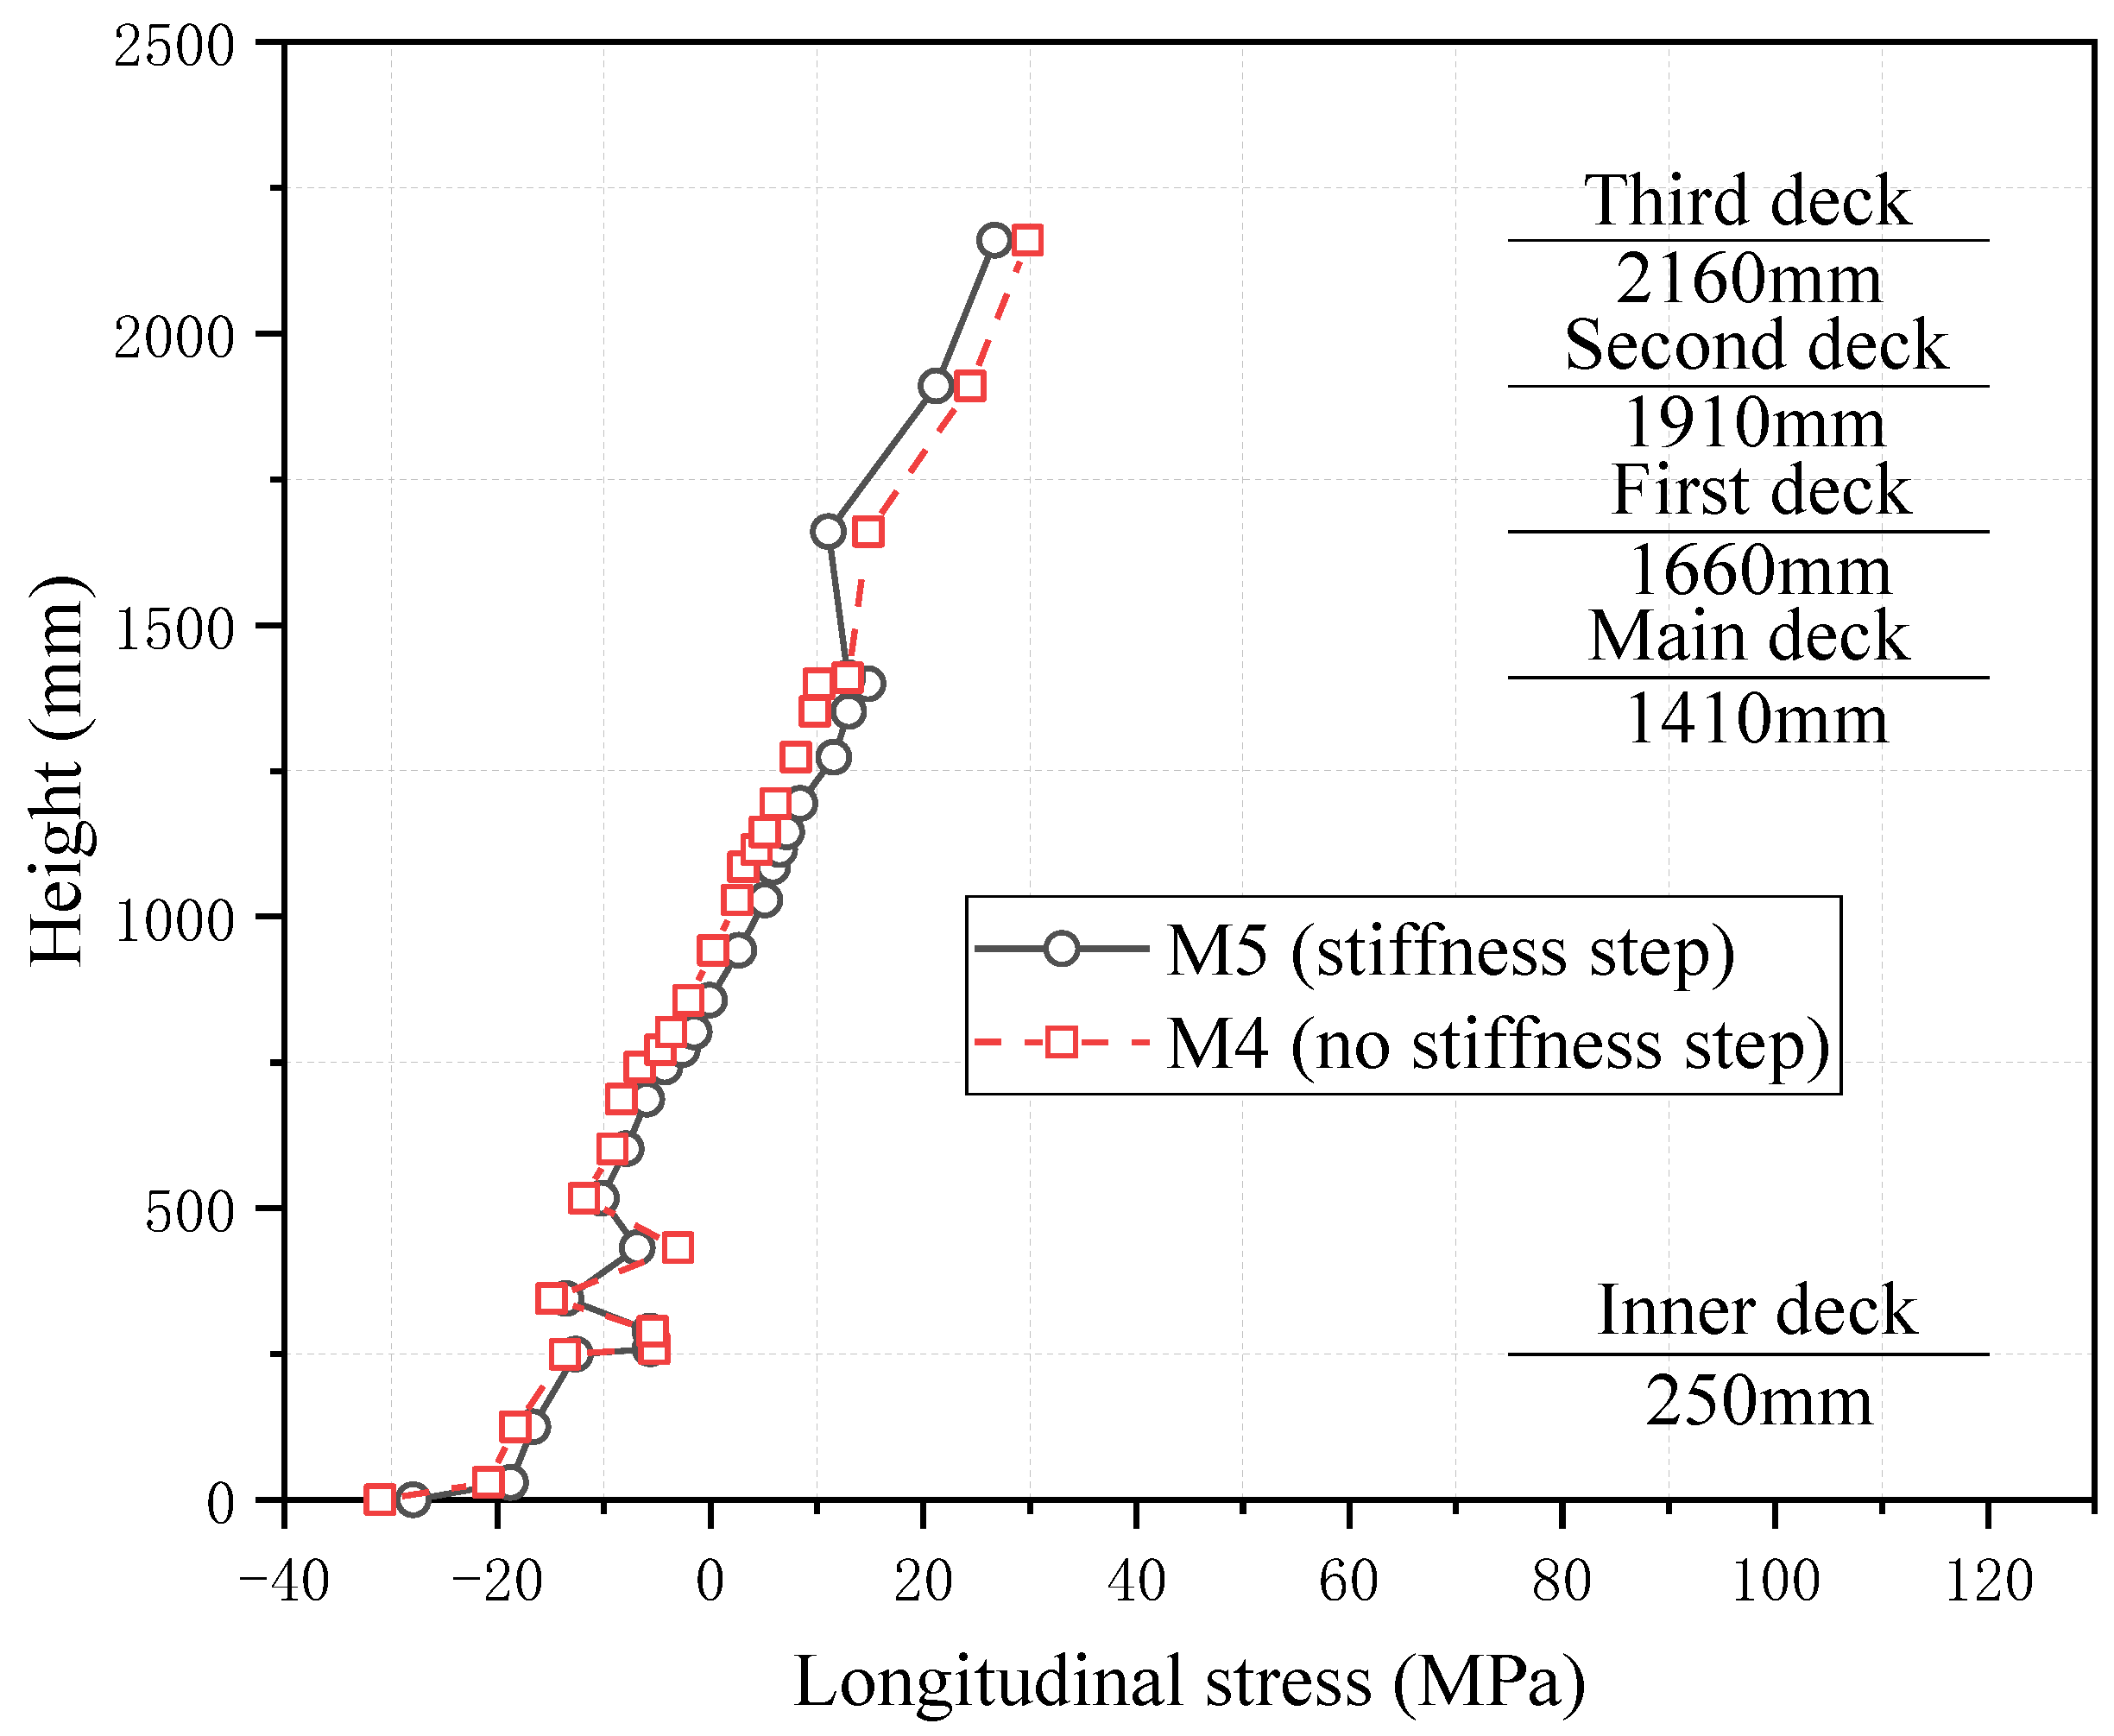
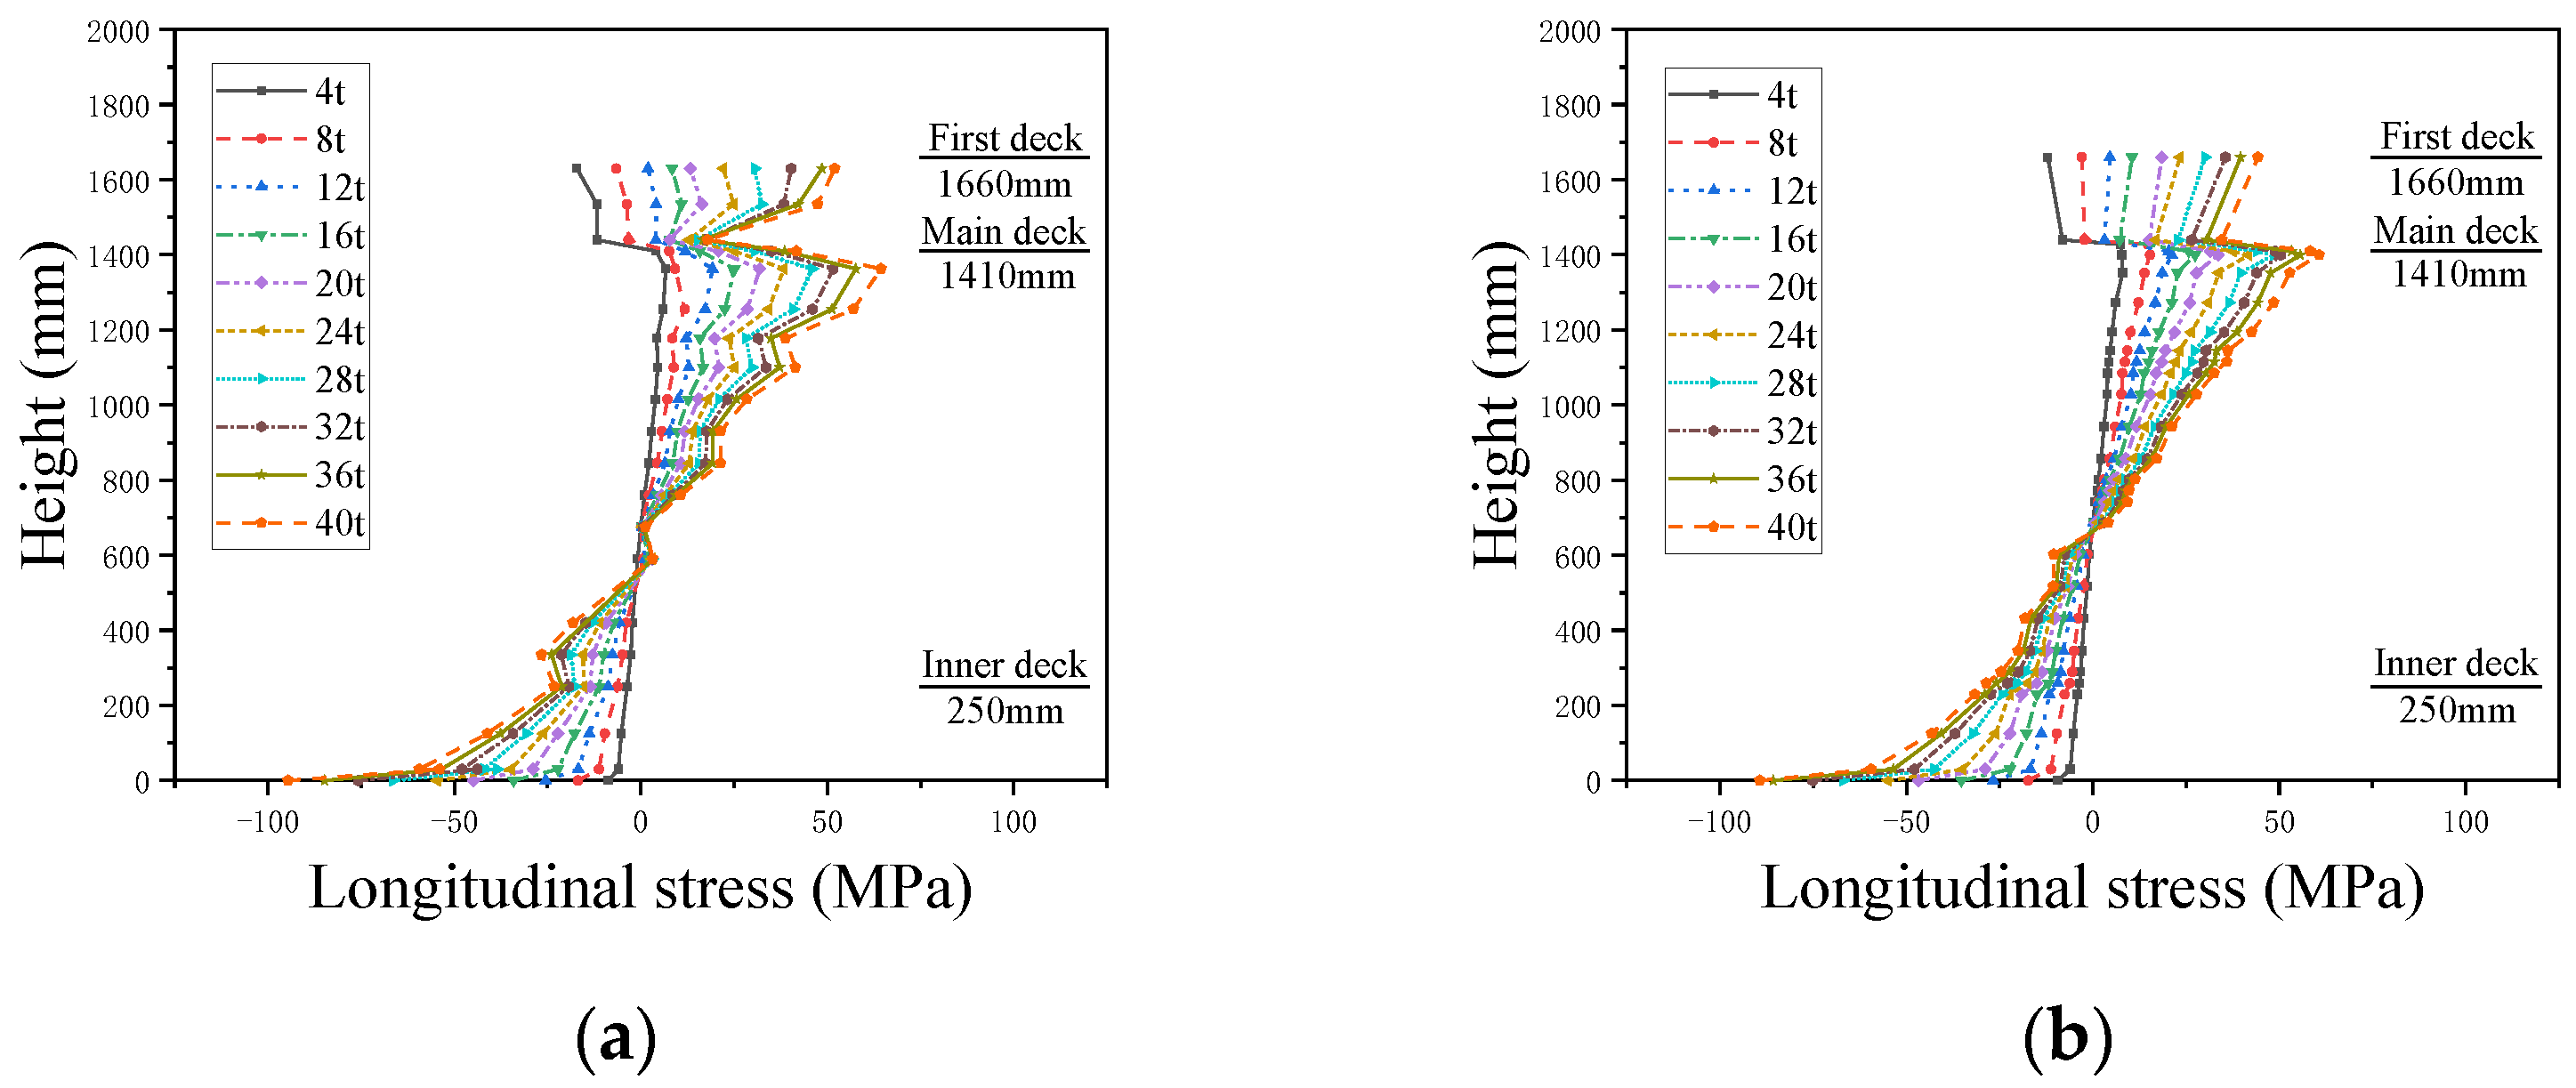
M4 is the model experiment with three superstructure decks, and there is no stiffness step between the main hull and the superstructure. M5 is the model experiment with three superstructure decks, and there is the stiffness step between the main hull and superstructure. The experimental results of M4 and M5 under 10 groups of loading are shown in Figure A3, and the experimental results of 20 t are shown in Figure 10.
3. Analysis and Discussion
As the influence of the stiffness step on the longitudinal stress in the midship position (cross-section B) is greater than that in the other two cross-sections, the superstructure of the midship cross-section is taken as the research object.
3.1. Longitudinal Stress Distribution Characteristics
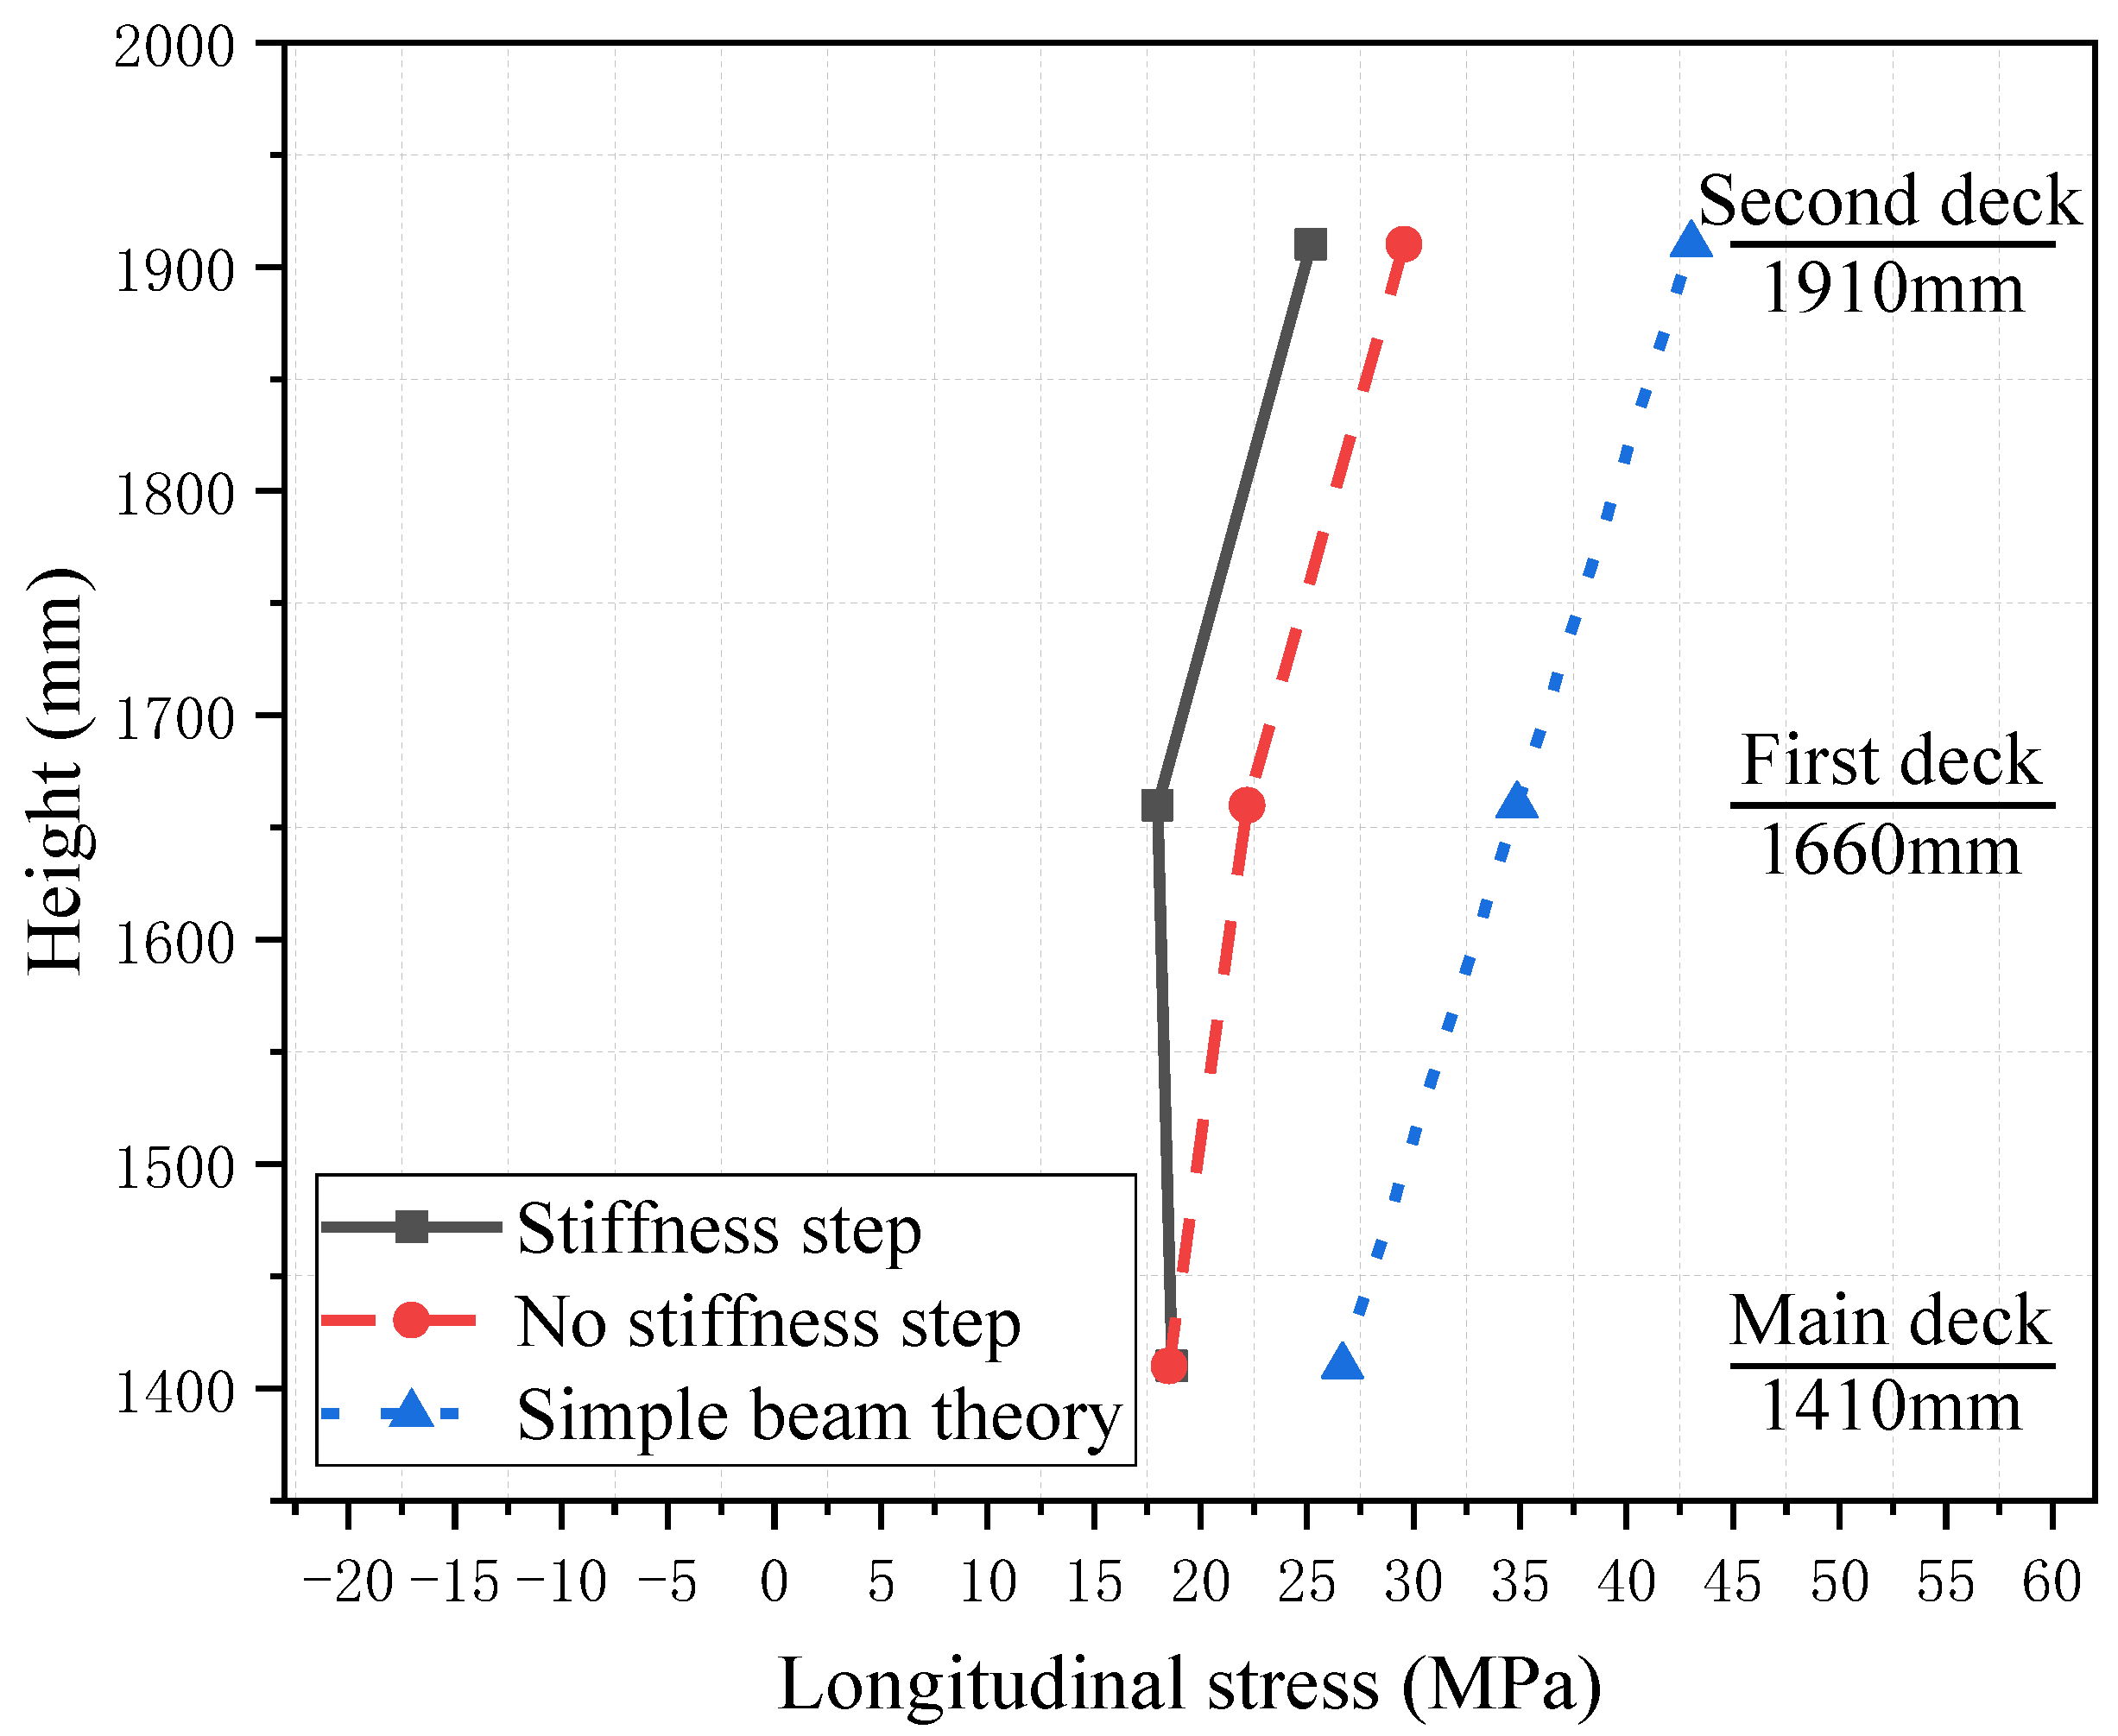
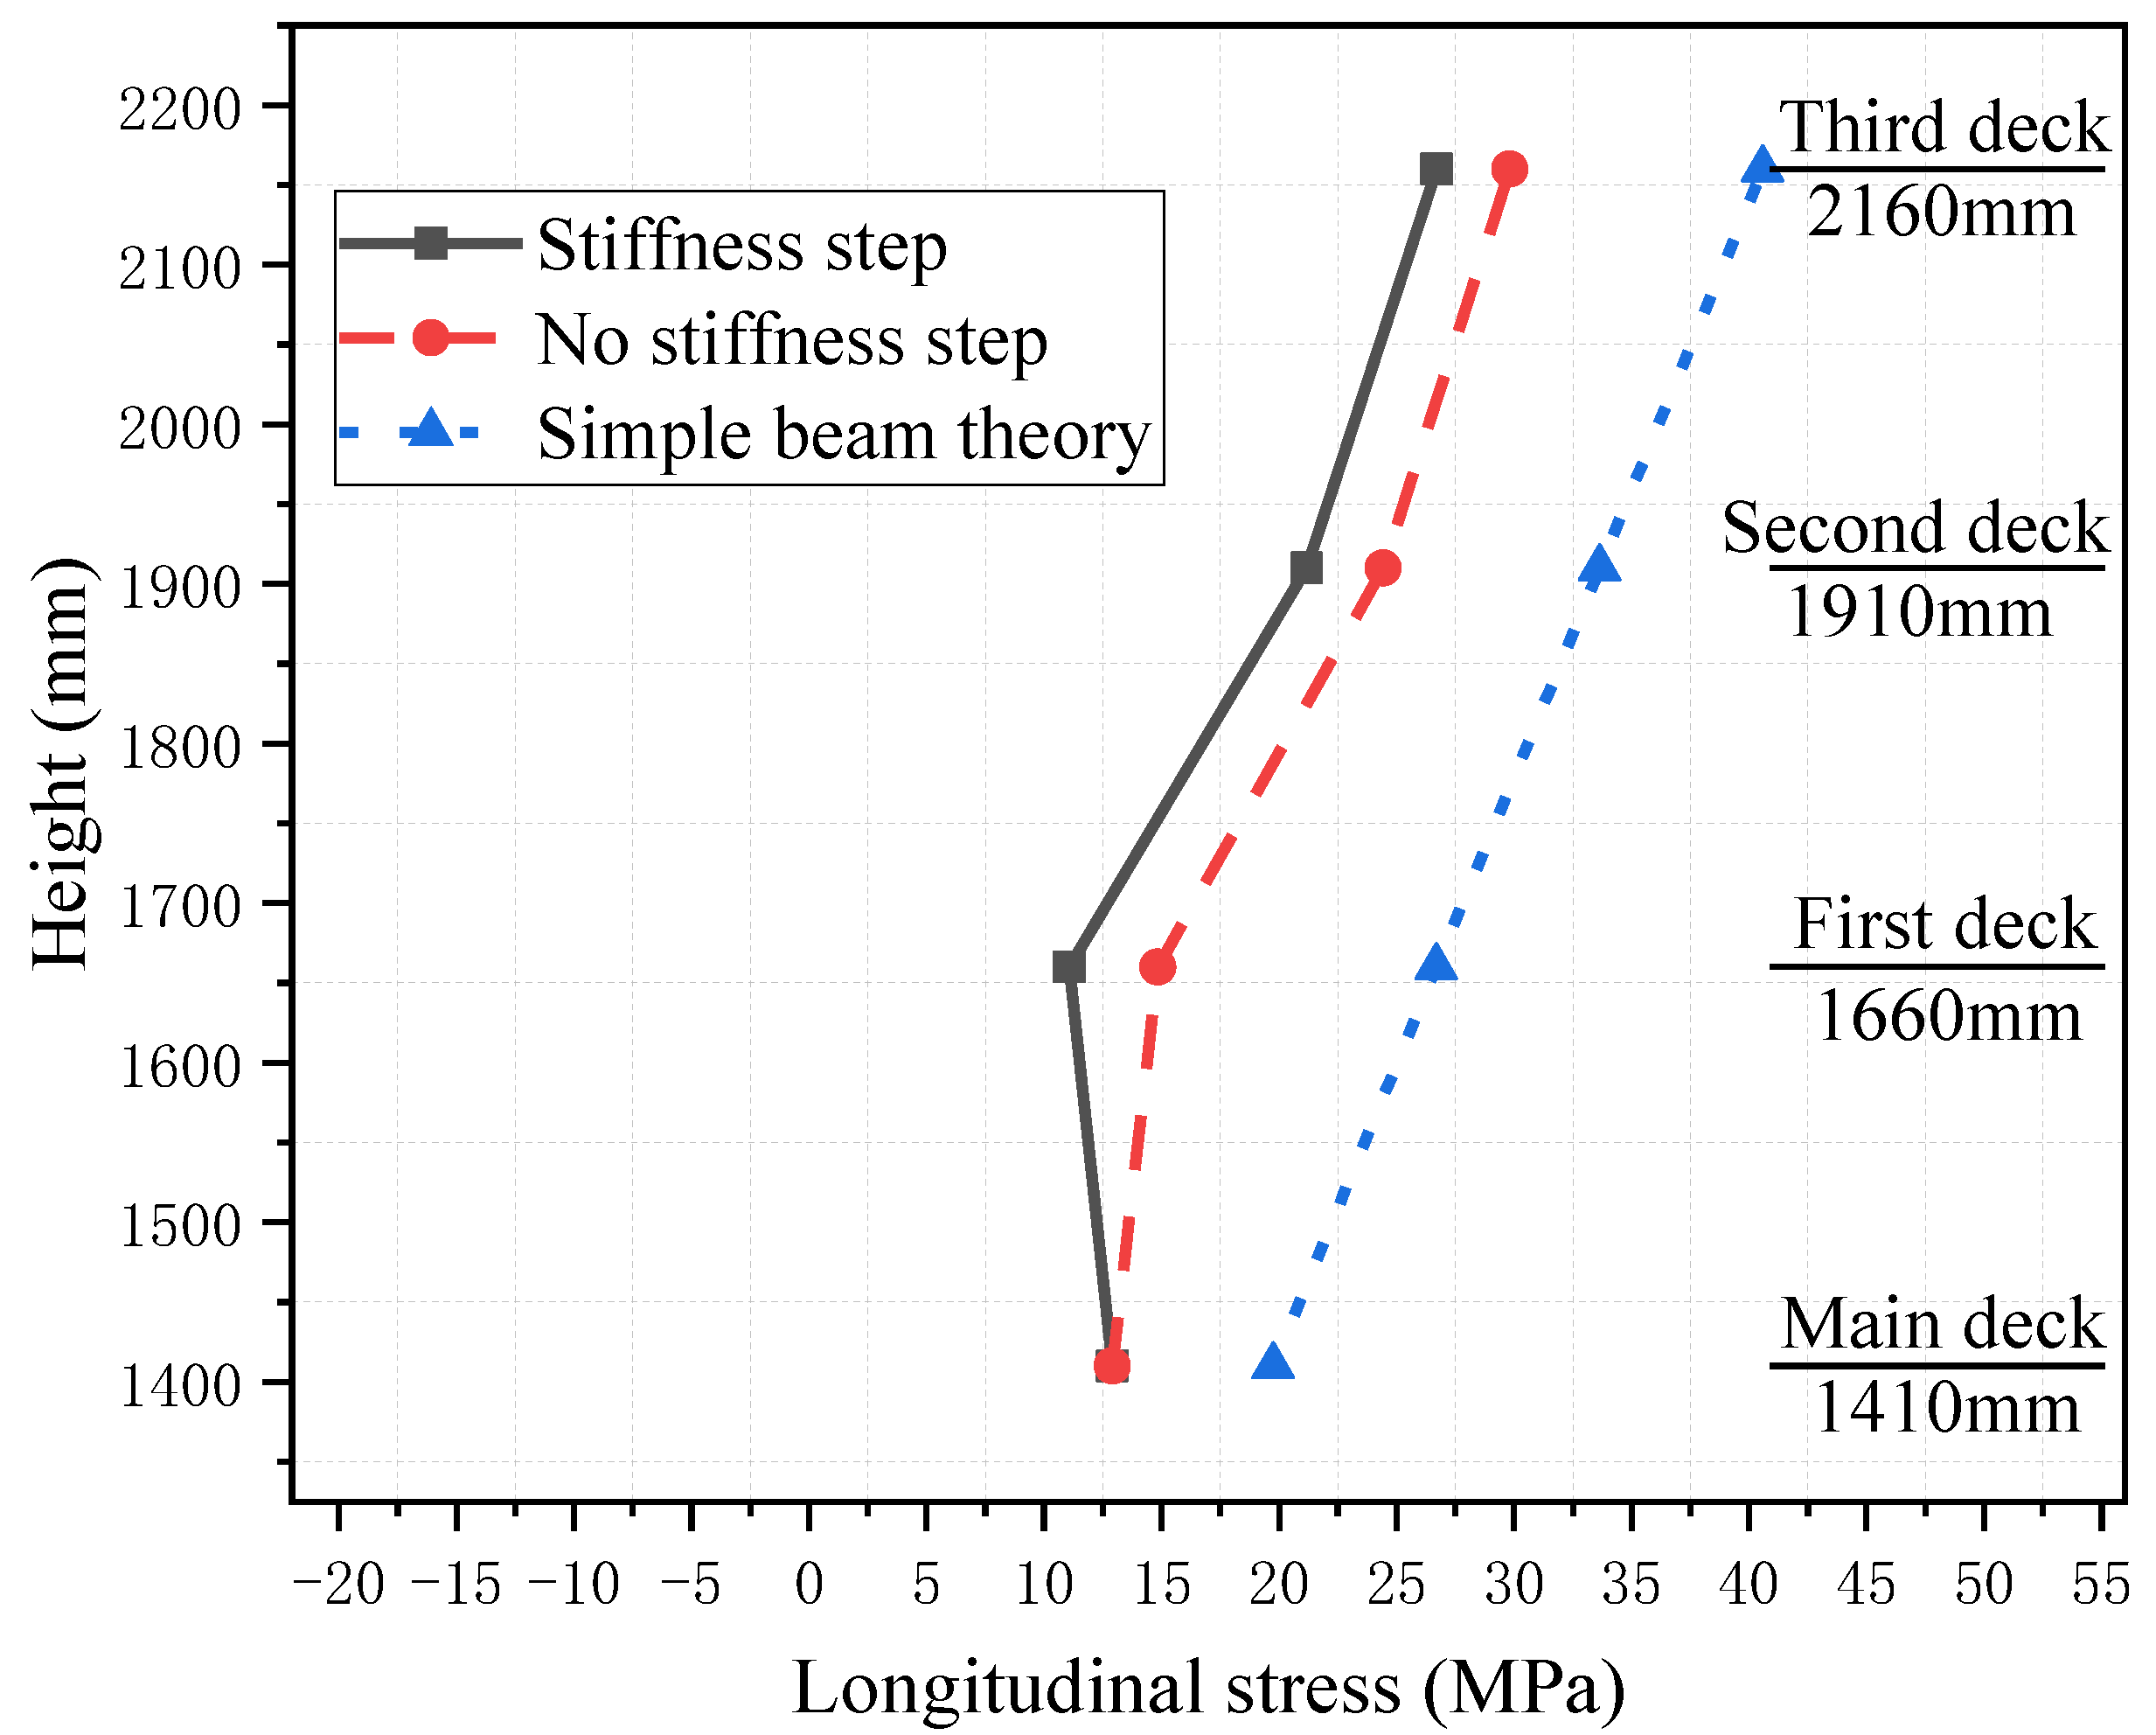
Simple beam theory is based on the assumption of planar cross-sections. The results obtained using this theory can be considered as the results when the superstructure fully participates in the longitudinal bending. Moreover, these results can serve as the basis for determining the effective degree of participation of the superstructure in longitudinal bending. The experiment results of 20 t for the cross-section B (midship) of the superstructure with two decks and three decks are compared with the results of simple beam theory, as shown in Figure 11 and Figure 12. The experimental results show that, different from ordinary ships, the plump superstructure of cruise ships does not participate in the longitudinal bending. Furthermore, the existence of the stiffness step between the main hull and superstructure further reduces the degree to which the superstructure participated in the longitudinal bending.
3.2. Bending Efficiency of Superstructures
While the analysis of longitudinal stress distribution characteristics in Section 3.1 highlights the difference between the results with and without the stiffness step, it is challenging to further analyze the influence of the stiffness step on superstructure effectively. In order to investigate the influence of the stiffness step on the longitudinal stress intuitively, the stiffness step on the structural response is analyzed in terms of the bending efficiency of the superstructure.
The extent of the superstructure participating in the longitudinal bending can be measured by the bending efficiency. The bending efficiency is commonly defined as follows [9]:
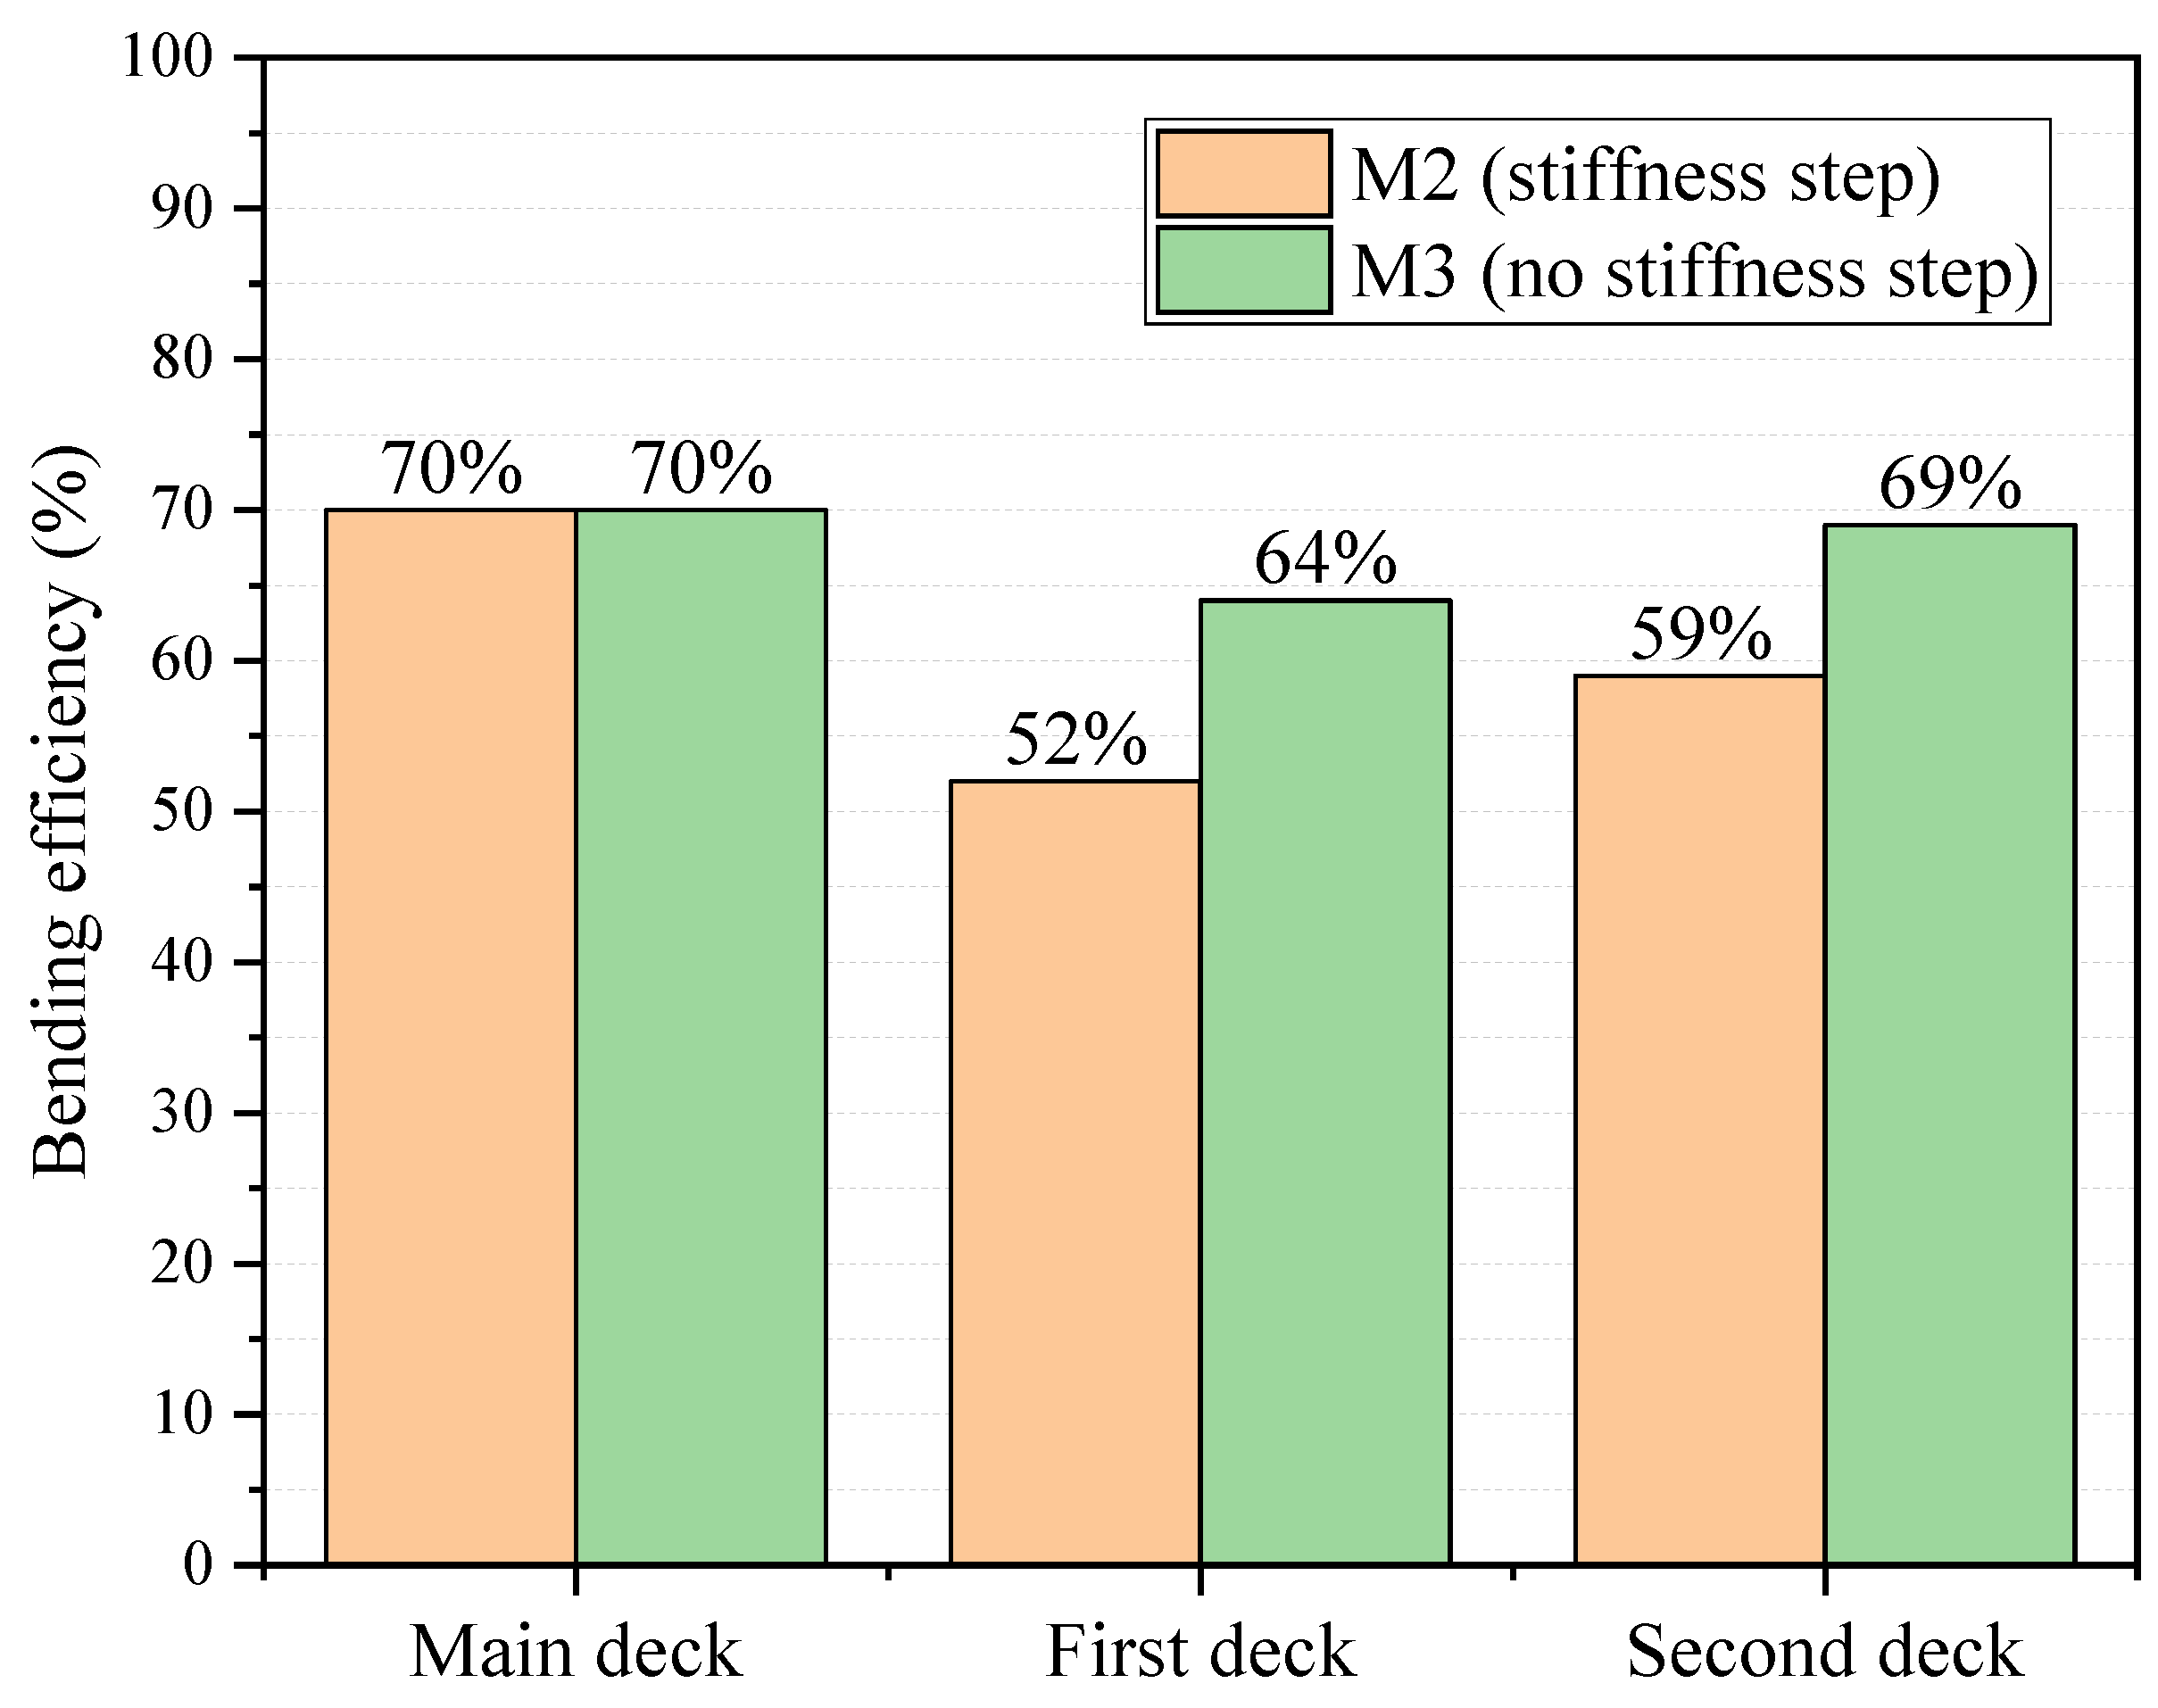
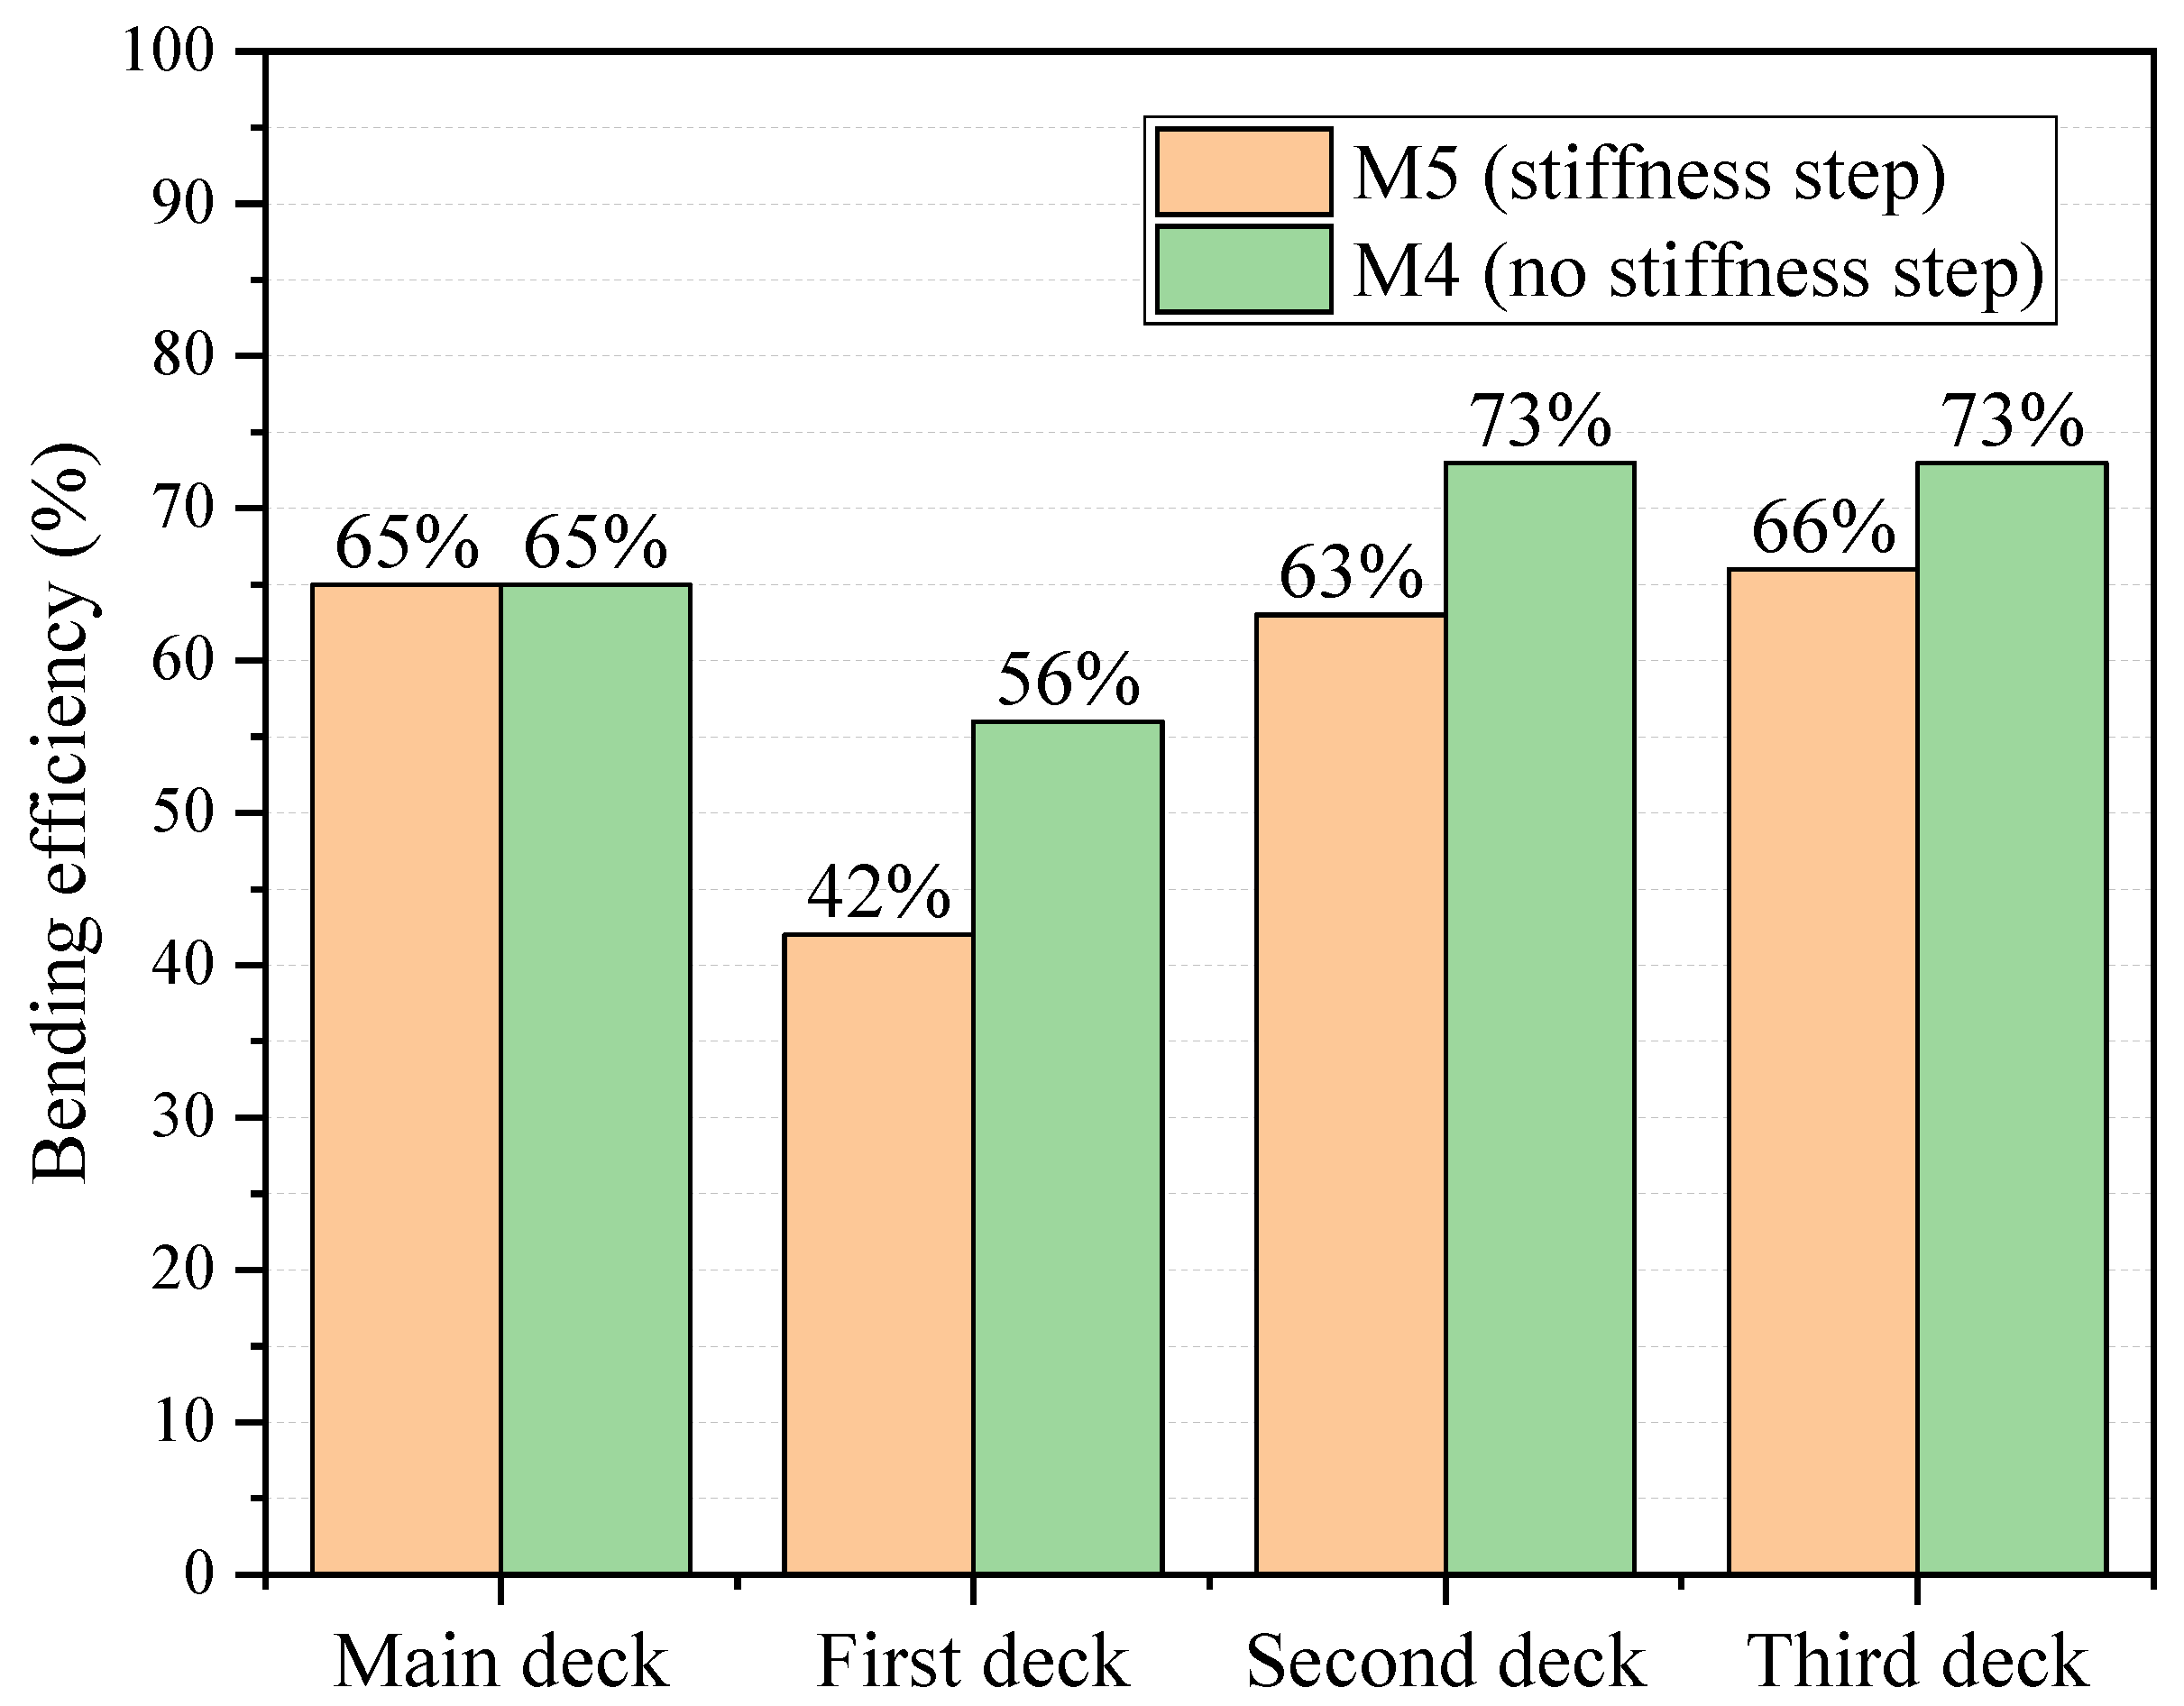
where v is the bending efficiency of the superstructure, σsv is the actual longitudinal stress, σs is the longitudinal stress when the superstructure fully participates in the longitudinal bending. In the research, σs is calculated using the simple beam theory. Furthermore, the bending efficiency of the superstructure with two decks is shown in Figure 13, while the bending efficiency of the superstructure with three decks is shown in Figure 14.
The following conclusions can be drawn from Figure 13 and Figure 14. At the main deck, the bending efficiency of the superstructure is essentially the same with and without the stiffness step, which indicates that the stiffness step has little effect on the main deck.
For superstructures with two decks, the presence or absence of the stiffness step at the first and second decks has a large effect on the bending efficiency of the superstructure, with the difference remaining at around 10%.
For superstructures with three decks, the difference in bending efficiency remains about 14% at the first deck with and without the stiffness step. At the second deck, the difference in bending efficiency remains about 10% at the first deck with and without the stiffness step. While for the third deck, the difference in bending efficiency remains around 8% with and without the stiffness step.
3.3. Maximum Longitudinal Stress and Deformation
According to the results of traditional beam theory, the maximum stress location will occur at the uppermost deck of the model. The results indicate that the maximum stresses for all five sets of conditions under hogging bending moment occur at the bottom deck of the model, as shown in Figure 8, Figure 9 and Figure 10. The stresses in the uppermost deck are significantly less than the theoretically calculated stresses, as shown in Figure 11 and Figure 12.
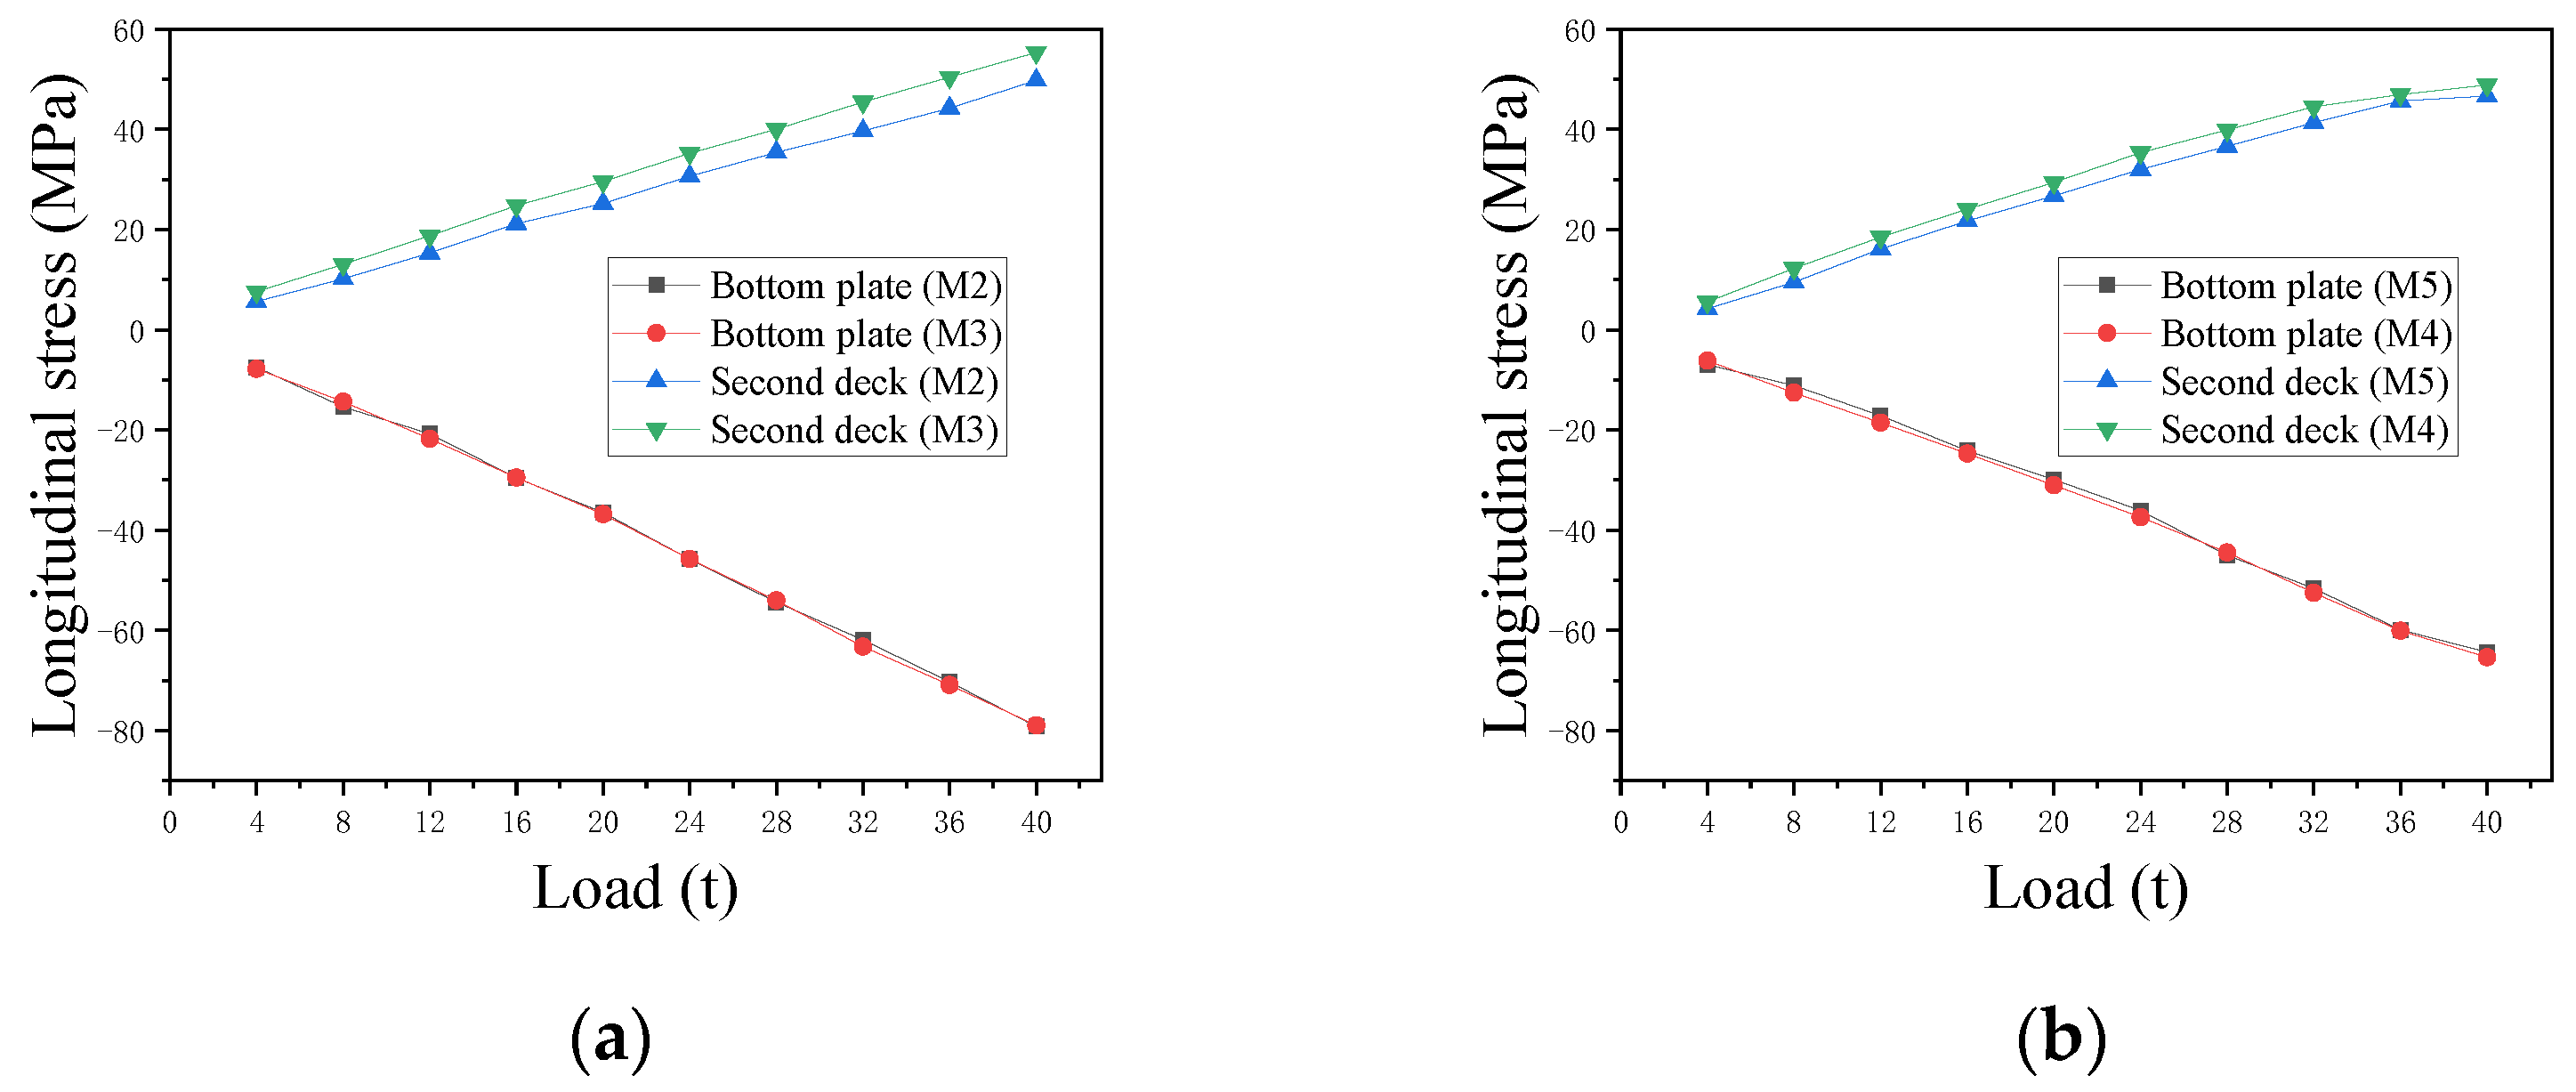
The stresses in the bottom plate and the second deck for M2 and M3 are shown in Figure 15a. The stresses in the bottom plate and the third deck for M4 and M5 are shown in Figure 15b. The stresses in the bottom plate are greater than the stresses in the uppermost deck. Furthermore, the stresses with the stiffness step are less than the stresses without the stiffness step in the uppermost deck. Due to the stiffness step between the main hull and the superstructure, the main hull cannot transfer the force to the superstructure completely and effectively. As a result, thin plates are commonly used in the superstructure design of cruise ships.
4. Conclusions
There are differences in stiffness between the main hull and superstructure of cruise ships. Currently, there is a lack of a simple evaluation method to analyze the influence of the stiffness step on the structure response. In this paper, the stiffness step experiment of cruise ships is designed and carried out. Based on the experimental results, the influence of the stiffness step on force transformation and structural response is analyzed and discussed. The research is meaningful for the structural safety and reliability of superstructure. The main conclusions are as follows.
Due to the influence of the stiffness step between the main hull and superstructure, the traditional beam theory cannot correctly estimate longitudinal stress distribution along the height of large cruise ships. Therefore, the superstructure and the main hull should be calculated as two beams with different stiffness in the initial design.
Based on a series of experimental results, the longitudinal stress in the model with the stiffness step is less than that without the stiffness step. Additionally, the bending efficiency of the superstructure with the stiffness step is also less than that without the stiffness step. The above analysis indicates that the presence of the stiffness step prevents the superstructure from effectively participating in the longitudinal bending of the main hull.
The experimental results demonstrate that the maximum stress did not occur at the uppermost deck, indicating that the presence of the stiffness step is advantageous for the lightweight and safe design of the superstructure on cruise ships.
Author Contributions
Conceptualization, B.Y. and Z.P.; methodology, B.Y.; software, G.L.; validation, W.W.; writing—original draft preparation, B.Y.; writing—review and editing, G.L., Z.P. and B.Y.; supervision, Z.P. and G.L. All authors have read and agreed to the published version of the manuscript.
Funding
This research received no external funding.
Institutional Review Board Statement
Not applicable.
Informed Consent Statement
Not applicable.
Data Availability Statement
Not applicable.
Acknowledgments
This work was supported by Hubei Provincial Engineering Research Center on Green & Smart River-sea-going Ship, China.
Conflicts of Interest
The authors declare no conflict of interest.
Nomenclature
The following symbols are used in this manuscript:
| Symbol | Description |
| σ | Longitudinal stress |
| M | Bending moment of cross-section |
| Iy | Moment of inertia on the neutral axis |
| z | Distance from the calculation position to the neutral axis |
| CL | Geometric similarity ratio between the prototype and the model |
| Ct | Thickness similarity ratio between the prototype and the model |
| CI | Ratio of moments of inertia between the prototype and the model |
| Ce | Height similarity ratio of the neutral axis between the prototype and the model |
| Ms | Moment of inertia of the prototype |
| Mm | Moment of inertia of the model |
| Hs | Height of neutral axis of the prototype |
| Hm | Height of neutral axis of the model |
| v | Bending efficiency of the superstructure |
| σsv | Actual longitudinal stress |
| σs | Longitudinal stress when the superstructure fully participates in the longitudinal bending |
Appendix A
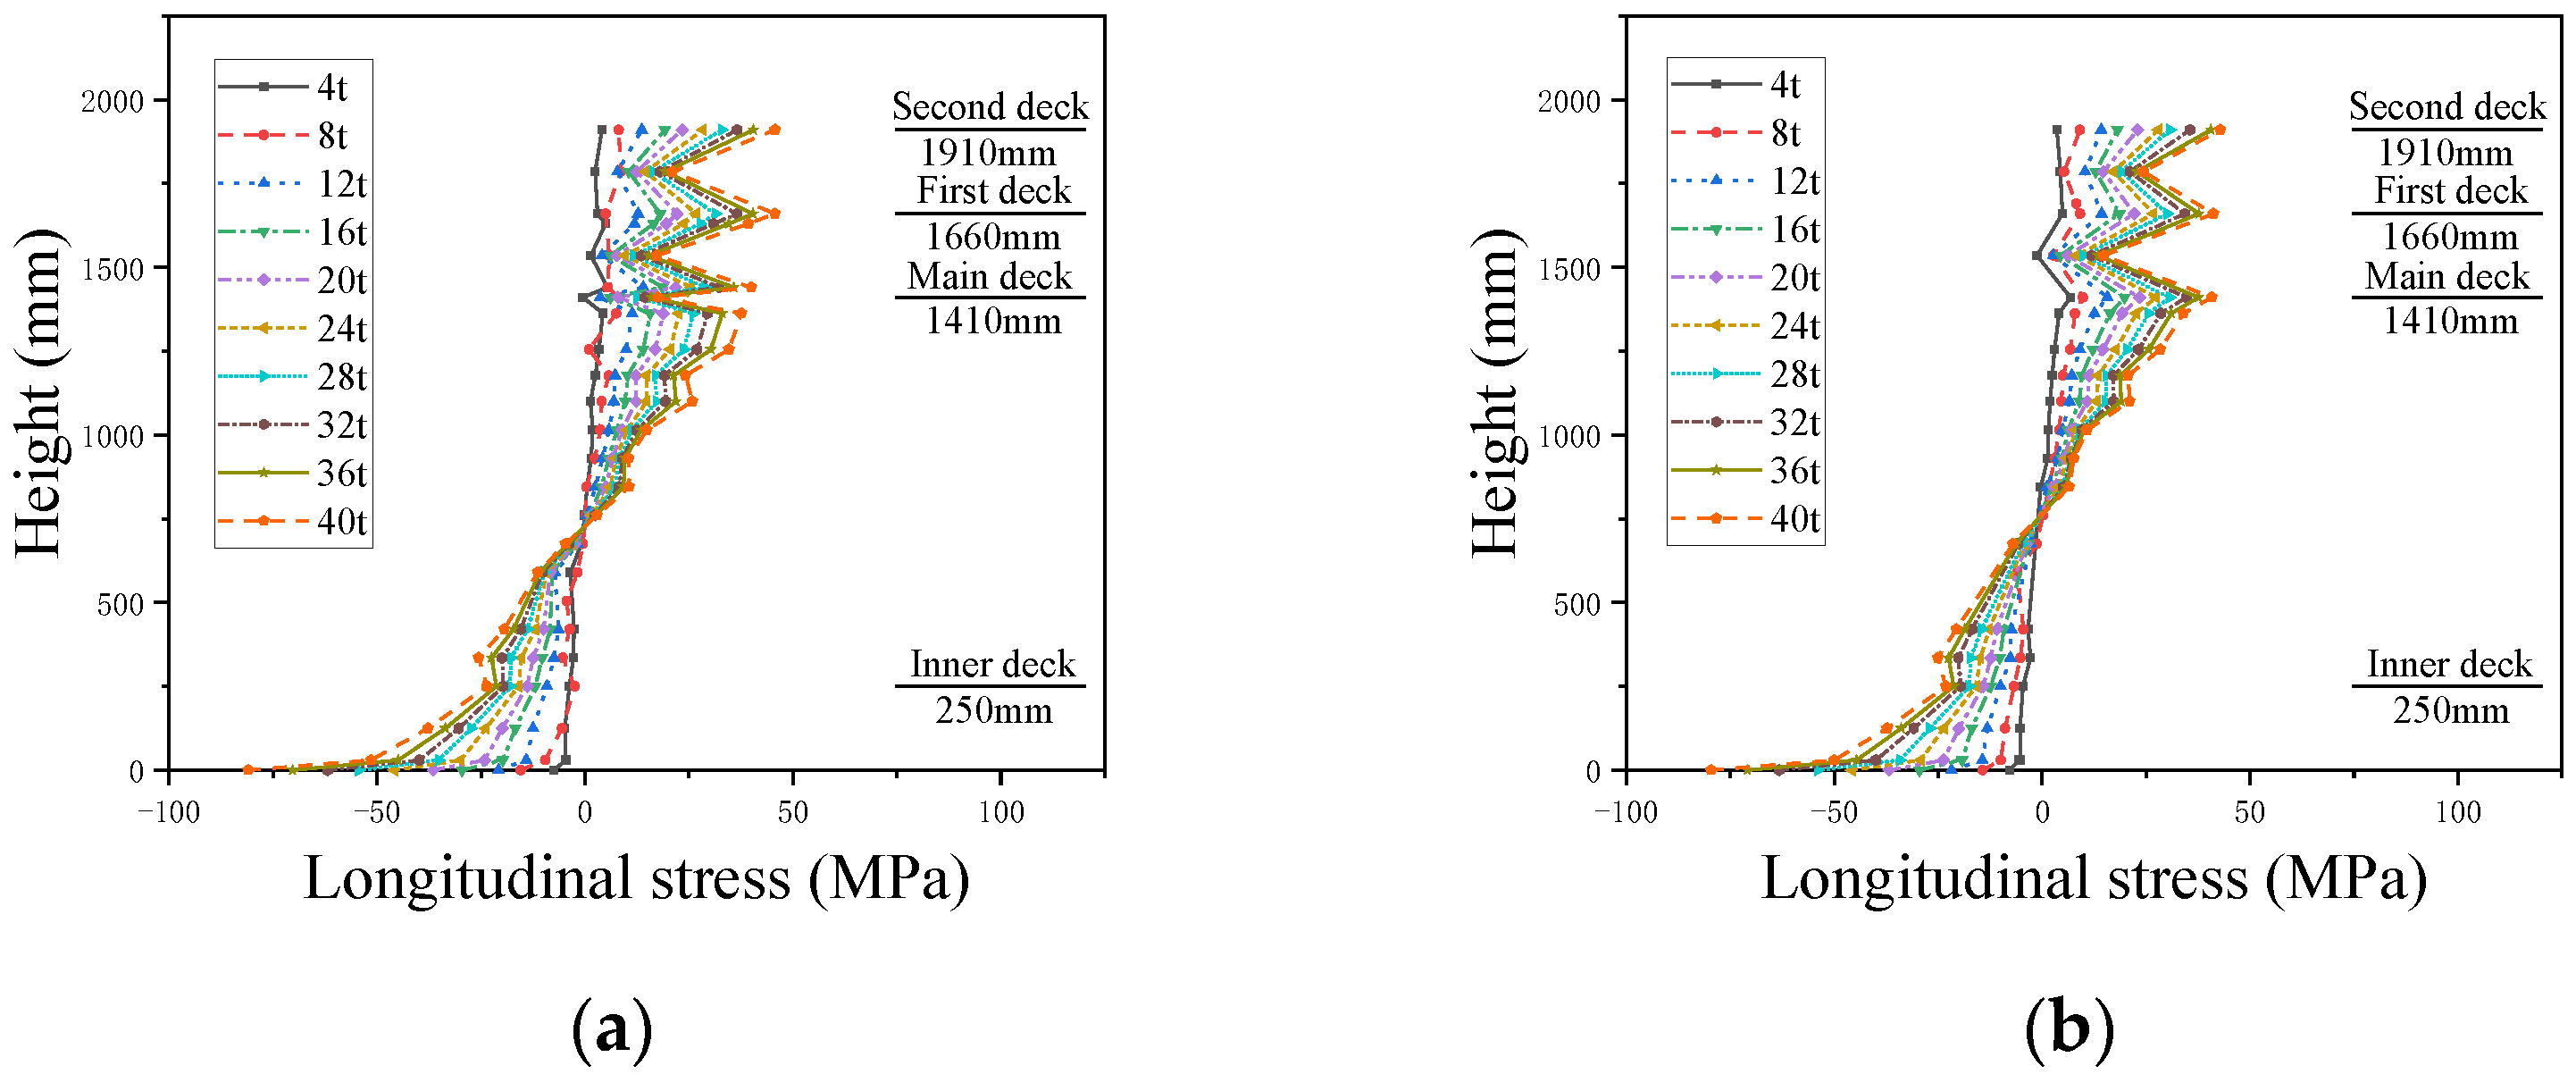
The experimental results of M1 under 10 groups of loading are shown in Figure A1.
Figure A1.
Longitudinal stress distribution along height of M1 under 10 groups of loading. (a) Cross-section A (b) Cross-section B.
Figure A1.
Longitudinal stress distribution along height of M1 under 10 groups of loading. (a) Cross-section A (b) Cross-section B.

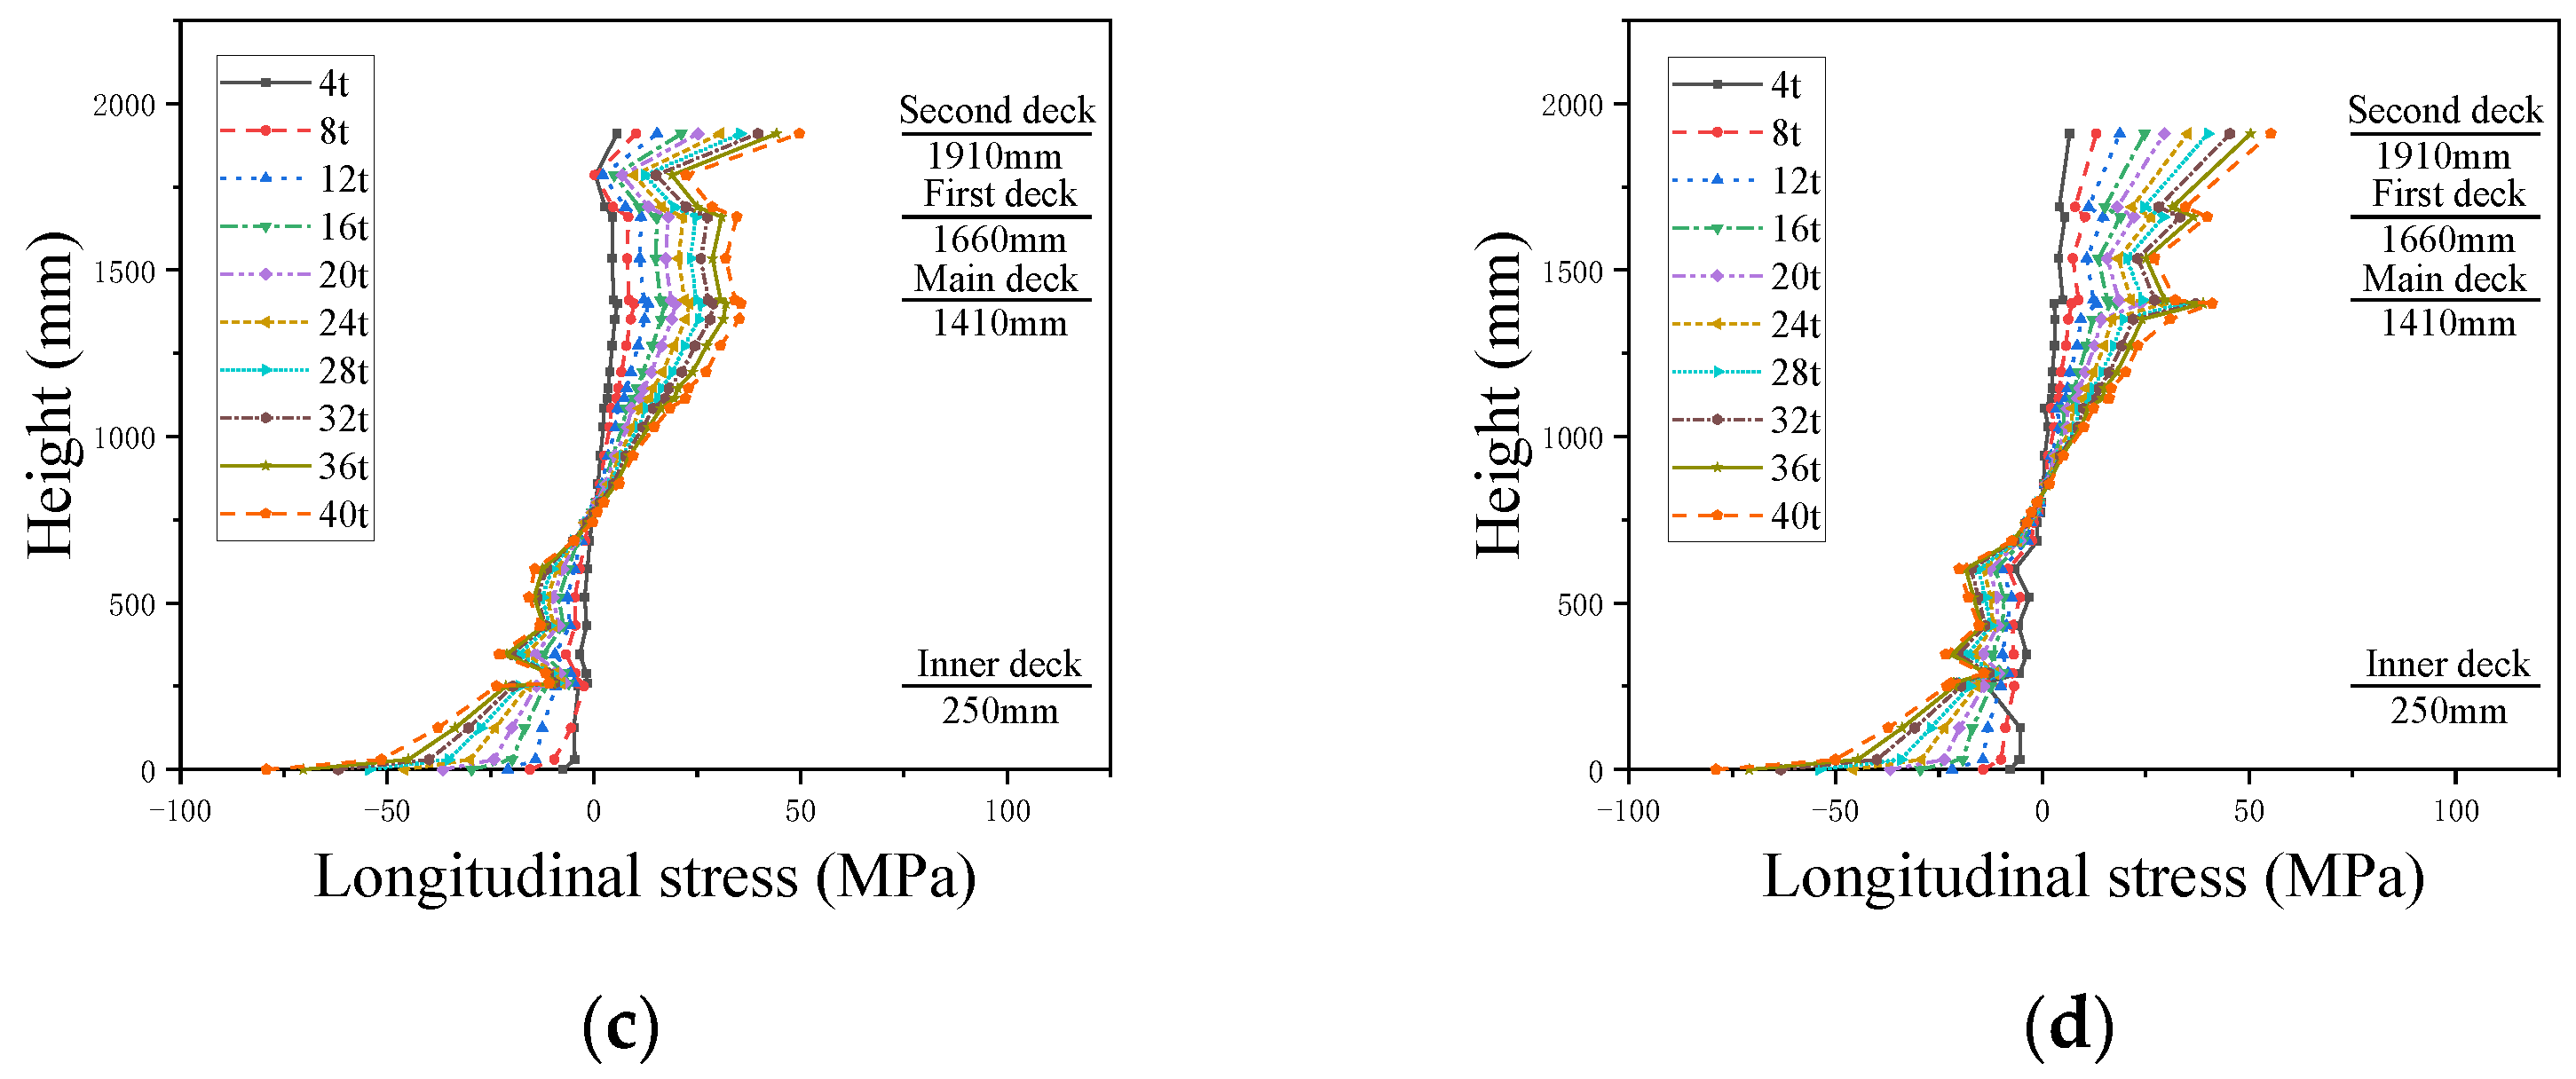
The experimental results of M2 and M3 under 10 groups of loading are shown in Figure A2.
Figure A2.
Longitudinal stress distribution along height of M2 and M3 under 10 groups of loading. (a) Cross-section A of M2 (b) Cross-section A of M3 (c) Cross-section B of M2 (d) Cross-section B of M3.
Figure A2.
Longitudinal stress distribution along height of M2 and M3 under 10 groups of loading. (a) Cross-section A of M2 (b) Cross-section A of M3 (c) Cross-section B of M2 (d) Cross-section B of M3.


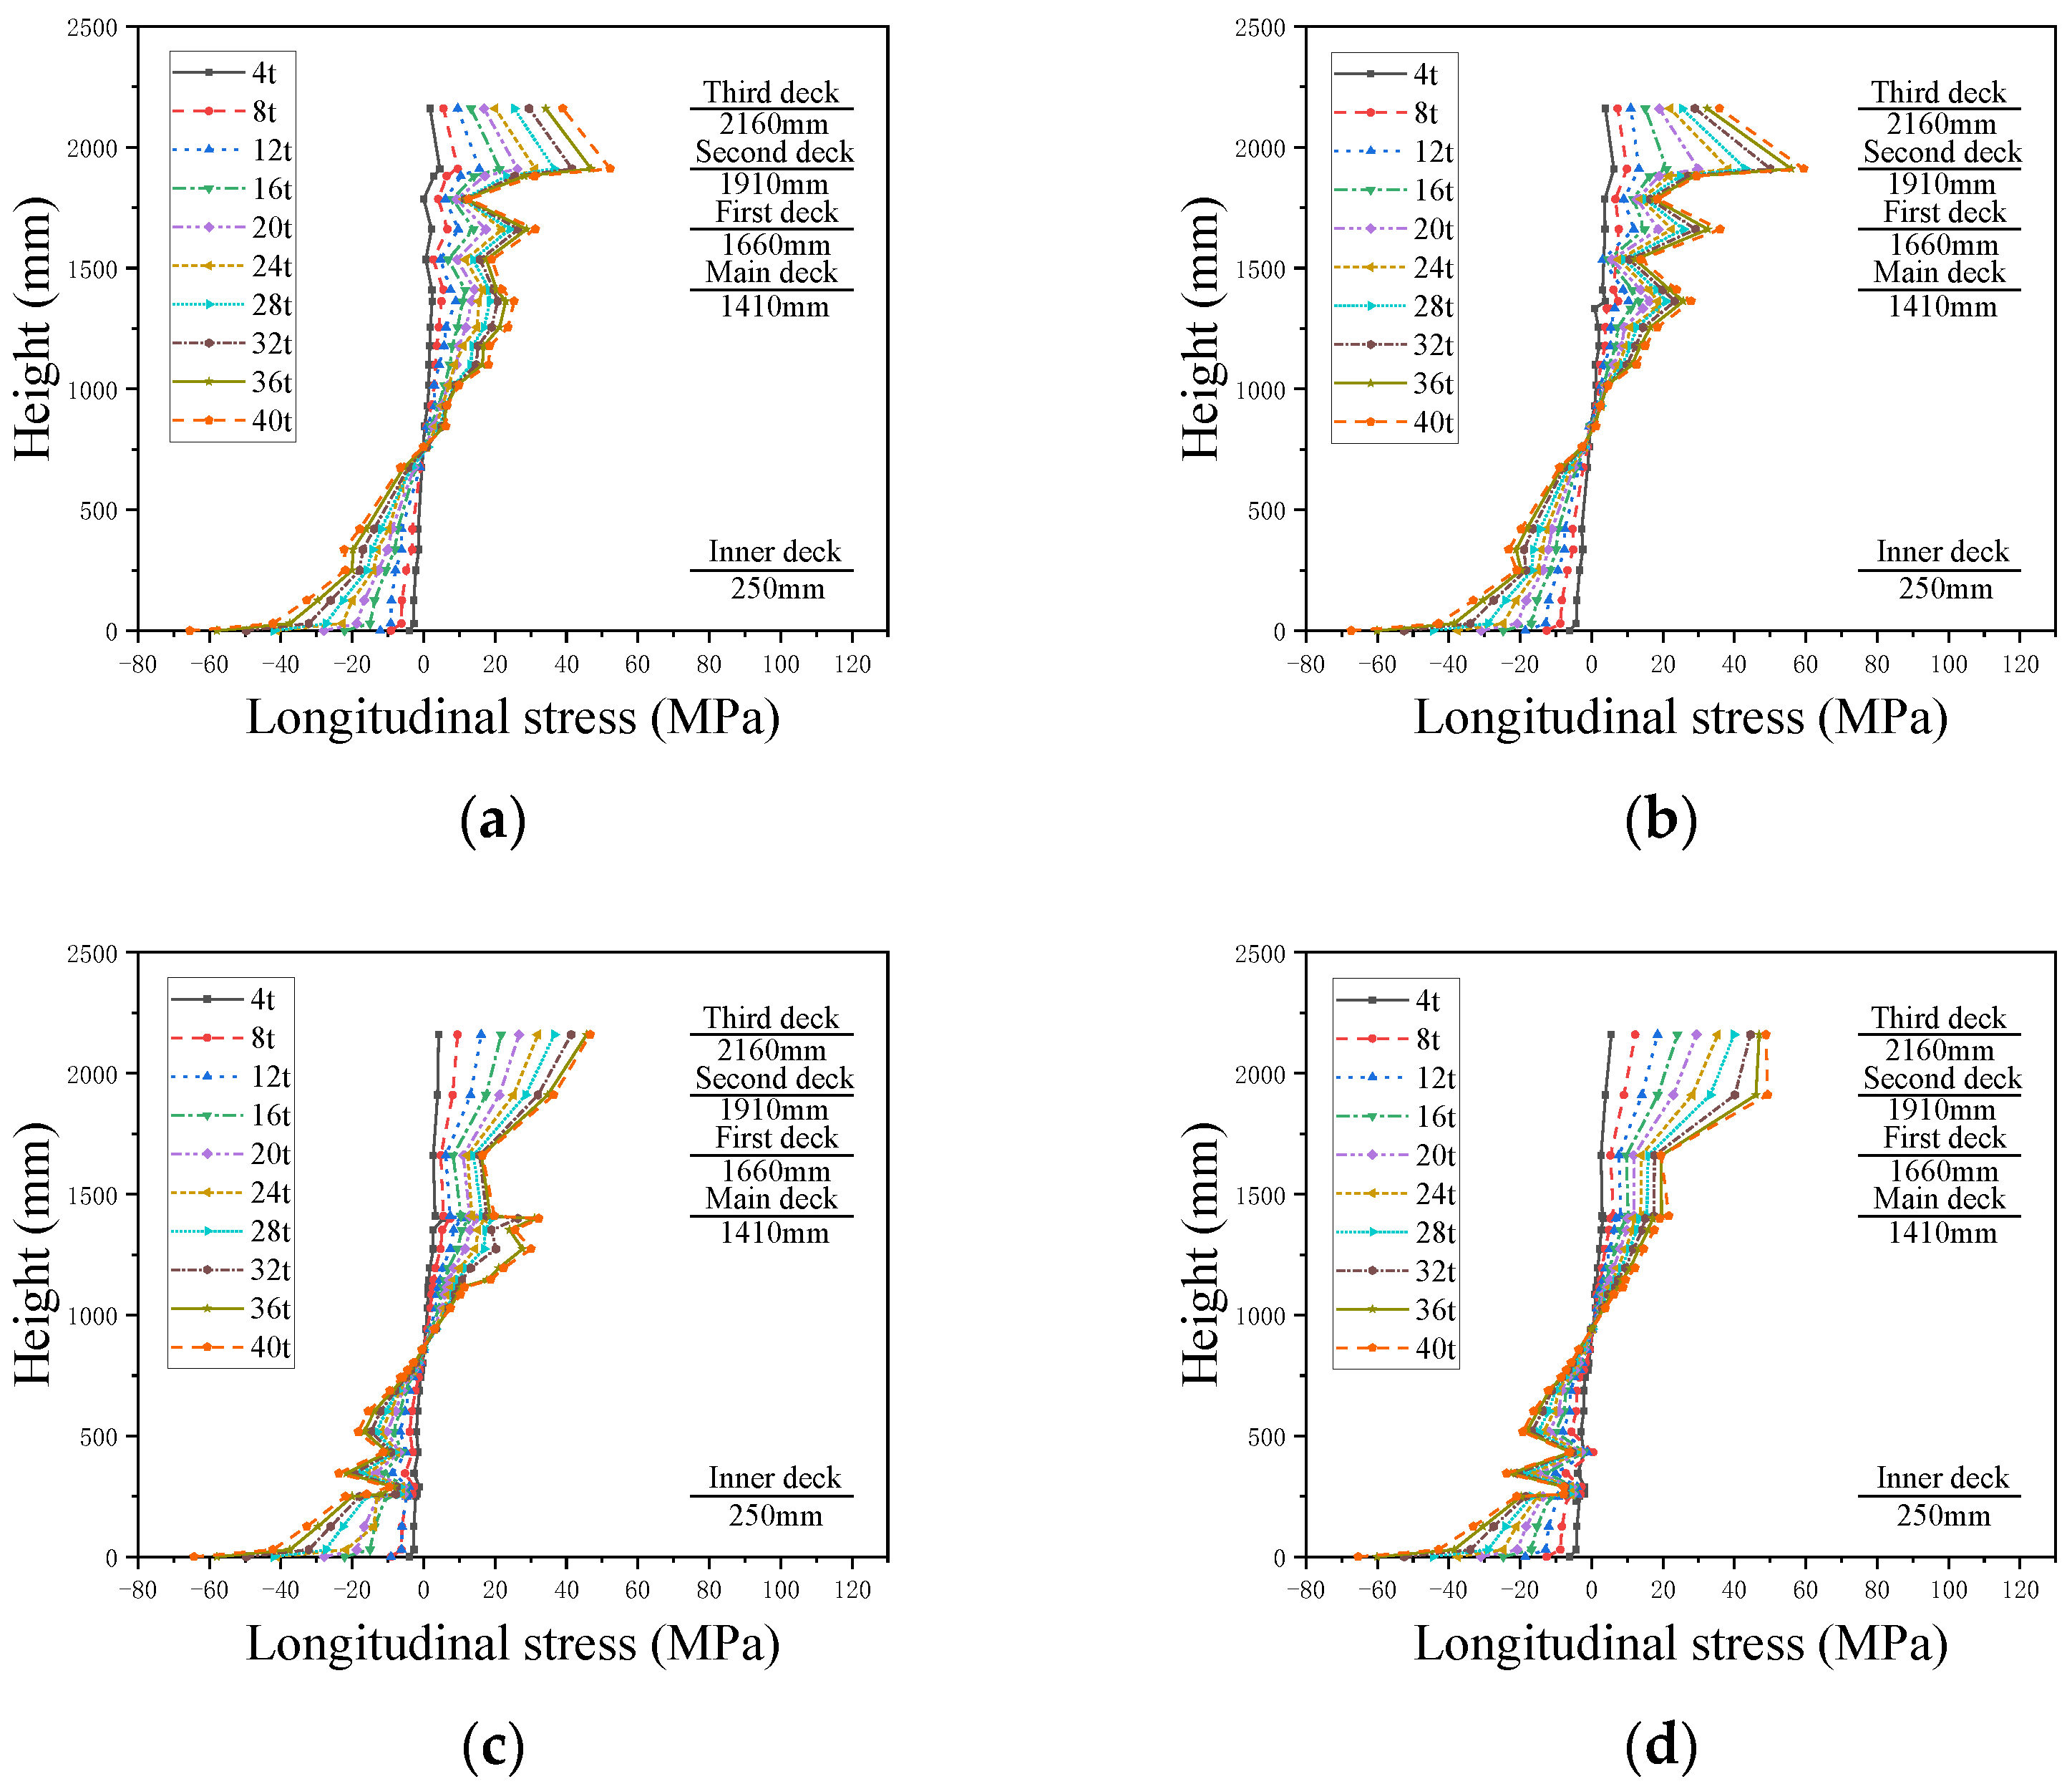
The experimental results of M4 and M5 under 10 groups of loading are shown in Figure A3.
Figure A3.
Longitudinal stress distribution along height of M4 and M5 under 10 groups of loading. (a) Cross-section A of M4 (b) Cross-section A of M5 (c) Cross-section B of M4 (d) Cross-section B of M5.
Figure A3.
Longitudinal stress distribution along height of M4 and M5 under 10 groups of loading. (a) Cross-section A of M4 (b) Cross-section A of M5 (c) Cross-section B of M4 (d) Cross-section B of M5.

References
- Wu, F.; Zhu, X.; Mei, Z. Ship Structural Mechanics; National Defense Industry Press: Beijing, China, 2010; pp. 18–34. [Google Scholar]
- Yang, B.; Pei, Z.; Wu, W. Research on Stress Distribution Characteristics of Cruise Ship Based on Modified Two-beam Theory. J. Ship Mech. 2022, 26, 1503–1513. [Google Scholar]
- Crawford, L.; Ruby, W. Model Tests on Hull-Deckhouse Interaction; Ship Structure Committee: Washington, DC, USA, 1955; Volume 4, pp. 693–699. [Google Scholar]
- Bleich, H. Nonlinear distribution of bending stresses due to distortion of the cross section. J. Appl. Mech. 1952, 29, 95–104. [Google Scholar] [CrossRef]
- Terazava, K.; Yagi, J. Stress distribution in deckhouse and superstructure. Soc. Nav. Archit. Jpn. 1964, 9, 51–150. [Google Scholar]
- Naar, H.; Varsta, P.; Kujala, P. A theory of coupled beams for strength assessment of passenger ships. Mar. Struct. 2004, 17, 590–611. [Google Scholar] [CrossRef]
- Morshedsolouk, F.; Khedmati, M. An extension of coupled beam method and its application to study ship’s hull-superstructure interaction problems. Lat. Am. J. Solids Struct. 2011, 8, 265–290. [Google Scholar] [CrossRef] [Green Version]
- Toming, R.; Kerge, E.; Naar, H. Hull and superstructure interaction using coupled beam method. In International Symposium on Practical Design of Ships and Other Floating Structures; Technical University of Denmark: Lyngby, Denmark, 2016; pp. 851–859. [Google Scholar]
- Yang, B.; Pei, Z.; Wu, W. Stress-distribution characteristics of cruise ship based on multiple-beam method. Ocean Eng. 2022, 266, 112646. [Google Scholar] [CrossRef]
- Paulling, J.; Payer, H. Hull-deckhouse interaction by finite-element calculations. Trans. Soc. Nav. Archit. Mar. Eng. 1968, 76, 281–296. [Google Scholar]
- Mitchell, G. Analysis of structural interaction between a ship’s hull and deckhouse. Trans. R. Inst. Nav. Archit. 1978, 120, 121–136. [Google Scholar]
- Fransman, J. The influence of passenger ship superstructures on the response of the hull girder. Trans. R. Inst. Nav. Archit. 1988, 131, 55–83. [Google Scholar]
- Mackney, M. Superstructure Effectiveness in the Preliminary Assessment of the Hull Behavior. Mar. Technol. 1999, 36, 29–43. [Google Scholar] [CrossRef]
- Fricke, W.; Gerlach, B. Effect of large openings without and with windows on the shear stiffness of side walls in passenger ships. Ships Offshore Struct. 2015, 10, 256–271. [Google Scholar] [CrossRef]
- Pei, Z.; Shen, W.; Yang, P.; Wu, W. Hull Strength and Structure Design; Science Press: Beijing, China, 2017; pp. 202–210. [Google Scholar]
- Pei, Z.; Ma, Z.; Zhu, B. Research on the bending efficiency of superstructure to hull girder strength of inland passenger ship. Ocean Eng. 2019, 195, 106762. [Google Scholar]
- Wu, W.; Duan, H.; Pei, Z.; Wong, C. Ship superstructure participation in the longitudinal bending strength test study. J. Ship Mech. 2001, 3, 62–68. [Google Scholar]
- Zhu, X. Experimental study on effect of cut-apart side wall plate on the longitudinal bending. Shipbuild. China 2003, 3, 67–74. [Google Scholar]
- Shi, G.; Gao, D. Analysis of hull girder ultimate strength for cruise ship with multi-layer superstructures. Ships Offshore Struct. 2019, 14, 698–708. [Google Scholar] [CrossRef]
- Shi, G.; Gao, D. Model experiment of large superstructures’ influence on hull girder ultimate strength for cruise ships. Ocean Eng. 2021, 222, 108626. [Google Scholar] [CrossRef]
- Araneda, J. Dimensional-directional analysis by a quaternionic representation of physical quantities. J. Frankl. Inst. 1996, 333, 113–126. [Google Scholar] [CrossRef]
- Pei, Z.; Xie, S.; Yang, B.; Ao, L. Research on model design of structural collapse test of large cruise ship. J. Wuhan Univ. Technol. 2022, 46, 242–246. [Google Scholar]
- Zhang, S.; Khan, I. Buckling and ultimate capability of plates and stiffened panels in axial compression. Mar. Struct. 2009, 22, 791–808. [Google Scholar] [CrossRef]
Figure 1.
The cruise ship with a large superstructure.

Figure 2.
The sectional characteristics of the model.

Figure 3.
Schematic diagram of experimental model.

Figure 4.
The loading system of the experimental model.

Figure 5.
The simple support at the bottom of the test block.

Figure 6.
Arrangement of gauges in the test block.

Figure 7.
Different layers of deck and inward structure for stiffness step. (a) M1. (b) M2 and M3. (c) M4 and M5.
Figure 7.
Different layers of deck and inward structure for stiffness step. (a) M1. (b) M2 and M3. (c) M4 and M5.

Figure 8.
Longitudinal stress distribution along height of M1.

Figure 9.
Longitudinal stress distribution along height of M2 and M3 for cross-section B.

Figure 10.
Longitudinal stress distribution along height of M4 and M5 for cross-section B.

Figure 11.
The longitudinal stress distribution of two superstructure decks.

Figure 12.
The longitudinal stress distribution of three superstructure decks.

Figure 13.
The bending efficiency of the superstructure with two decks (20 t).

Figure 14.
The bending efficiency of the superstructure with three decks (20 t).

Figure 15.
The stresses in the bottom plate and the uppermost deck. (a) Longitudinal stress for M2 and M3 (b) Longitudinal stress for M4 and M5.
Figure 15.
The stresses in the bottom plate and the uppermost deck. (a) Longitudinal stress for M2 and M3 (b) Longitudinal stress for M4 and M5.


Table 1.
The main parameters of the experiment model.
| Width (mm) | Height of Main Hull (mm) | Height of Deck (mm) | |
|---|---|---|---|
| Model | 2720 | 1410 | 250 |
Table 2.
The section characteristics of the experiment model.
| Parameter | Model |
|---|---|
| Height of neutral axis (mm) | 697.507 |
| Moment of inertia (mm2·mm2) | 5.43 × 10¹⁰ |
Table 3.
The dimensions of longitudinal components.
| Components | Dimension(mm) |
|---|---|
| Bottom plate | 6 |
| Inner bottom plate | 6 |
| Bottom girder | 5 |
| Bottom longitudinal | −36 × 5 |
| Inner longitudinal | −36 × 5 |
| Side longitudinal | −25 × 6 |
| Side plate | 4 |
| Deck plate | 2 |
| Deck longitudinal | −12 × 5 |
Table 4.
The comparison of sectional characteristics between the prototype and model.
| Parameter | Symbol | Value |
|---|---|---|
| Moment of inertia of prototype (mm2·mm2) | Ms | 3.79 × 10¹⁴ |
| Moment of inertia after being scaled (mm2·mm2) | Ms/CI | 5.48 × 10¹⁰ |
| Moment of inertia of model (mm2·mm2) | Mm | 5.43 × 10¹⁰ |
| Error of the moment of inertia (%) | - | 0.887 |
| Height of neutral axis of prototype (mm) | Hs | 8408.6 |
| Height of neutral axis after being scaled (mm) | Hs/Ce | 700.7 |
| Height of neutral axis of model (mm) | Hm | 697.5 |
| Error of the height of neutral axis (%) | - | 0.458 |
Table 5.
The loading order of the experimental model.
| Order | Load (t) |
|---|---|
| 1 | 4 |
| 2 | 8 |
| 3 | 12 |
| 4 | 16 |
| 5 | 20 |
| 6 | 24 |
| 7 | 28 |
| 8 | 32 |
| 9 | 36 |
| 10 | 40 |
Disclaimer/Publisher’s Note: The statements, opinions and data contained in all publications are solely those of the individual author(s) and contributor(s) and not of MDPI and/or the editor(s). MDPI and/or the editor(s) disclaim responsibility for any injury to people or property resulting from any ideas, methods, instructions or products referred to in the content. |
© 2023 by the authors. Licensee MDPI, Basel, Switzerland. This article is an open access article distributed under the terms and conditions of the Creative Commons Attribution (CC BY) license (https://creativecommons.org/licenses/by/4.0/).
Share and Cite
MDPI and ACS Style
Pei, Z.; Yang, B.; Liu, G.; Wu, W. Experimental Research on the Stiffness Step between the Main Hull and Superstructure of Cruise Ships. J. Mar. Sci. Eng. 2023, 11, 1264. https://doi.org/10.3390/jmse11071264
AMA Style
Pei Z, Yang B, Liu G, Wu W. Experimental Research on the Stiffness Step between the Main Hull and Superstructure of Cruise Ships. Journal of Marine Science and Engineering. 2023; 11(7):1264. https://doi.org/10.3390/jmse11071264
Chicago/Turabian StylePei, Zhiyong, Bin Yang, Guangwu Liu, and Weiguo Wu. 2023. "Experimental Research on the Stiffness Step between the Main Hull and Superstructure of Cruise Ships" Journal of Marine Science and Engineering 11, no. 7: 1264. https://doi.org/10.3390/jmse11071264
Note that from the first issue of 2016, this journal uses article numbers instead of page numbers. See further details here.