
Hydrodynamic Tests of Innovative Tourist Submarine

1
Faculty of Mechanical Engineering and Naval Architecture, University of Zagreb, 10000 Zagreb, Croatia
2
Croatian Shipbuilding Corporation—Jadranbrod, 10000 Zagreb, Croatia
3
Cloud Towing Tank, In Silico d.o.o., 10000 Zagreb, Croatia
*
Author to whom correspondence should be addressed.
J. Mar. Sci. Eng. 2023, 11(6), 1199; https://doi.org/10.3390/jmse11061199
Submission received: 13 May 2023
/
Revised: 1 June 2023
/
Accepted: 6 June 2023
/
Published: 9 June 2023
(This article belongs to the Special Issue Design, Analysis and Maintenance of Green Innovative Marine Structures)
Abstract
:This paper deals with the resistance, towing, seakeeping, and open water propeller tests of an innovative tourist submarine model. Tests were performed in a 276 m long towing tank. As the submarine model is a complex structure composed of various parts attached to the pressure hull, the largest possible model, in the scale of 1:5.0, was produced, considering the towing tank depth and the capabilities of the measurement equipment. Resistance tests were performed in deep water and on the surface in calm water. The tested speed range in both cases was up to 5.5 knots. To ensure the avoidance of free surface effects, resistance tests in deep water were performed for different draughts and then extrapolated to infinite water depth. Smaller effective powers were found for the surface condition. The results are compared to an independently performed computational fluid dynamics (CFD) analysis using OpenFOAM. A fair agreement between the experimentally and numerically predicted effective power is found, while the reasons for the differences found are explained. The free submarine model was towed with a rope performed for the speed range 1.7 kn–3.5 kn, and the towing force in the rope was measured. Seakeeping tests in irregular beam waves at zero speed were performed to check the flooding risk on open hatches. Open water tests of the main thrusters for propelling the submarine were conducted, indicating that both power demand and propeller thrust are slightly larger compared to the initial estimates.
1. Introduction
The purpose of a tourist submarine is to provide passengers with a broad and clear view of the underwater world. The pressure hull of tourist submarines is traditionally built of steel and fitted with large acrylic windows. The hull of the innovative tourist submarine, however, is made of transparent acrylic cylinders, enabling passengers an almost unobstructed view from the hull’s interior. The pressure hull of the novel submarine consists of steel heads and transverse steel rings that support acrylic cylindrical sections. The pressure hull is surrounded by an exostructure, providing global stiffness for lifting/launching of the submarine and protecting the sensitive acrylic hull from collision and grounding. Such innovative structural design brings many challenges, and a structural analysis based on “first principles” is required [1].
While tourist submarines are low-speed vessels, their hydrodynamics resistance is still essential to ensure enough battery power for sufficient cruising autonomy and to resist sea currents. Thus, a hydrodynamic analysis of the hull of the tourist submarine moving in forward and transverse directions was performed in [2], while the sensitivity of the force of resistance to the shape of the fore and stern heads of the bare hull was studied in [3].
Much research has dealt with the challenge of predicting the hydrodynamics resistance of various submarines and other underwater vehicles, both experimentally and numerically. Thus, towing tank experiments were recently conducted to study the resistance of underwater vehicles [4,5] and submarines [6]. Huifeng et al. [7] used computational fluid dynamics (CFD) to calculate the resistance coefficient of a towed manned submersible. Jiang et al. [8] estimated the hydrodynamic resistance of an autonomous, remotely operated submersible while in forward and downward motion using CFD. Wei et al. [9] varied the geometry of a submersible with the goal of optimising its resistance, using a response surface method as a surrogate model. Kotb et al. [10] calculated the hydrodynamic resistance for various parts of a touristic submarine geometry to understand the influence of individual parts on the overall resistance. Phillips et al. [11] conducted an analysis using CFD aimed at comparing three different submersible designs in terms of hydrodynamic resistance, as well as different submarine bow shapes. Khan et al. [12] analysed four different shapes of the submersible’s pressure hull and found that a conical shape produces the least resistance. Karim et al. [13] used a two-dimensional CFD analysis to study the effect of using different grids on submarine resistance, as well as evaluating the performance of turbulence modelling using the k– STT model. Chen et al. [14] used CFD RANS to analyse the effect of depth on the hydrodynamic resistance of the SUBOFF.
The main difference in the hydrodynamic resistance of the innovative tourist submarine and other military and non-military submarines is the existence of the exostructures, orthogonally exposed to the flow, increasing the hydrodynamic resistance of the tourist submarine against forward motion, as shown by the CFD analysis presented in [15]. Because of the complexity of the wetted surface of this innovative vehicle and to increase confidence in the numerical predictions, the hydrodynamic resistance calculated by the CFD analysis should be confirmed by model tests in a towing tank. A challenge is imposed on manoeuvrability, as the submarine is equipped with six thrusters in total: two stern main thrusters for propelling the vessel, two side thrusters for manoeuvring, and two vertical thrusters for opposing the extra buoyancy and vertical movements. Finally, dynamic hydrodynamic stability should be ensured during the emergence of the submarine in regular and emergency conditions, when the solid ballast is released while liquid ballast tanks are discharged.
To meet these design challenges, an extensive experimental campaign for the innovative tourist submarine was envisaged, including four phases:
- Resistance, towing, and seakeeping tests.
- Open water propeller tests.
- Self-propulsion tests of diving, manoeuvring, and emergency lifting using wire rope.
- Testing of submarine emergence in regular and emergency conditions by ballasting.
Within the first phase of the project, a large-scale submarine model (λ = 5.0) was manufactured. The first testing phase included resistance tests conducted in deepwater and surface conditions. The submarine model was also towed with a rope, and the towing force in the rope was measured. In addition to resistance and towing, a seakeeping test in beam waves was performed for a zero speed, i.e., a stationary free model in irregular beam waves. Within the second phase of the project, open water tests of the suitable stock propeller model with the nozzle were conducted. The submarine’s designer provided input data for the calculation and selection of the appropriate stock propeller. Lower-scale models will be used in the third and fourth phases of the project, which are still under development.
The present contribution aims to describe the first and second phases of the project, while the third and fourth phases will be described in a separate paper. For the clarity of presentation, only open water tests for the main horizontal (propulsion) thrusters are included, while the results for the side and vertical thrusters are similar and, therefore, omitted from the paper.
The Croatian Shipbuilding Corporation (Jadranbrod) conducted tests in the facilities of the Brodarski Institute in a towing tank with a length of 276 m. The largest possible submarine model was built, at a scale of 1:5.0, considering the depth of the towing tank. The resistance results are converted to the full scale and compared to the results of the independently performed CFD analysis.
The paper is organized as follows. In the Section 2, the submarine model and the experimental set-up are described. Section 3 presents the results of the resistance tests and comparisons with CFD, followed by the results of the remaining tests. A discussion of the results is presented in Section 4, while the article ends with the corresponding conclusions.
2. Model and Experimental Set-Up
The main particulars of the tourist submarine and towing tank are given in Table 1 and Table 2, respectively.
The tourist submarine model is a complex structure composed of various parts attached to the pressure hull. It was decided to manufacture the largest possible model concerning the towing tank depth and the capabilities of the measurement equipment. This is beneficial for the model accuracy and the measurements themselves, since the Reynolds number for the lowest tested speed exceeded 106.
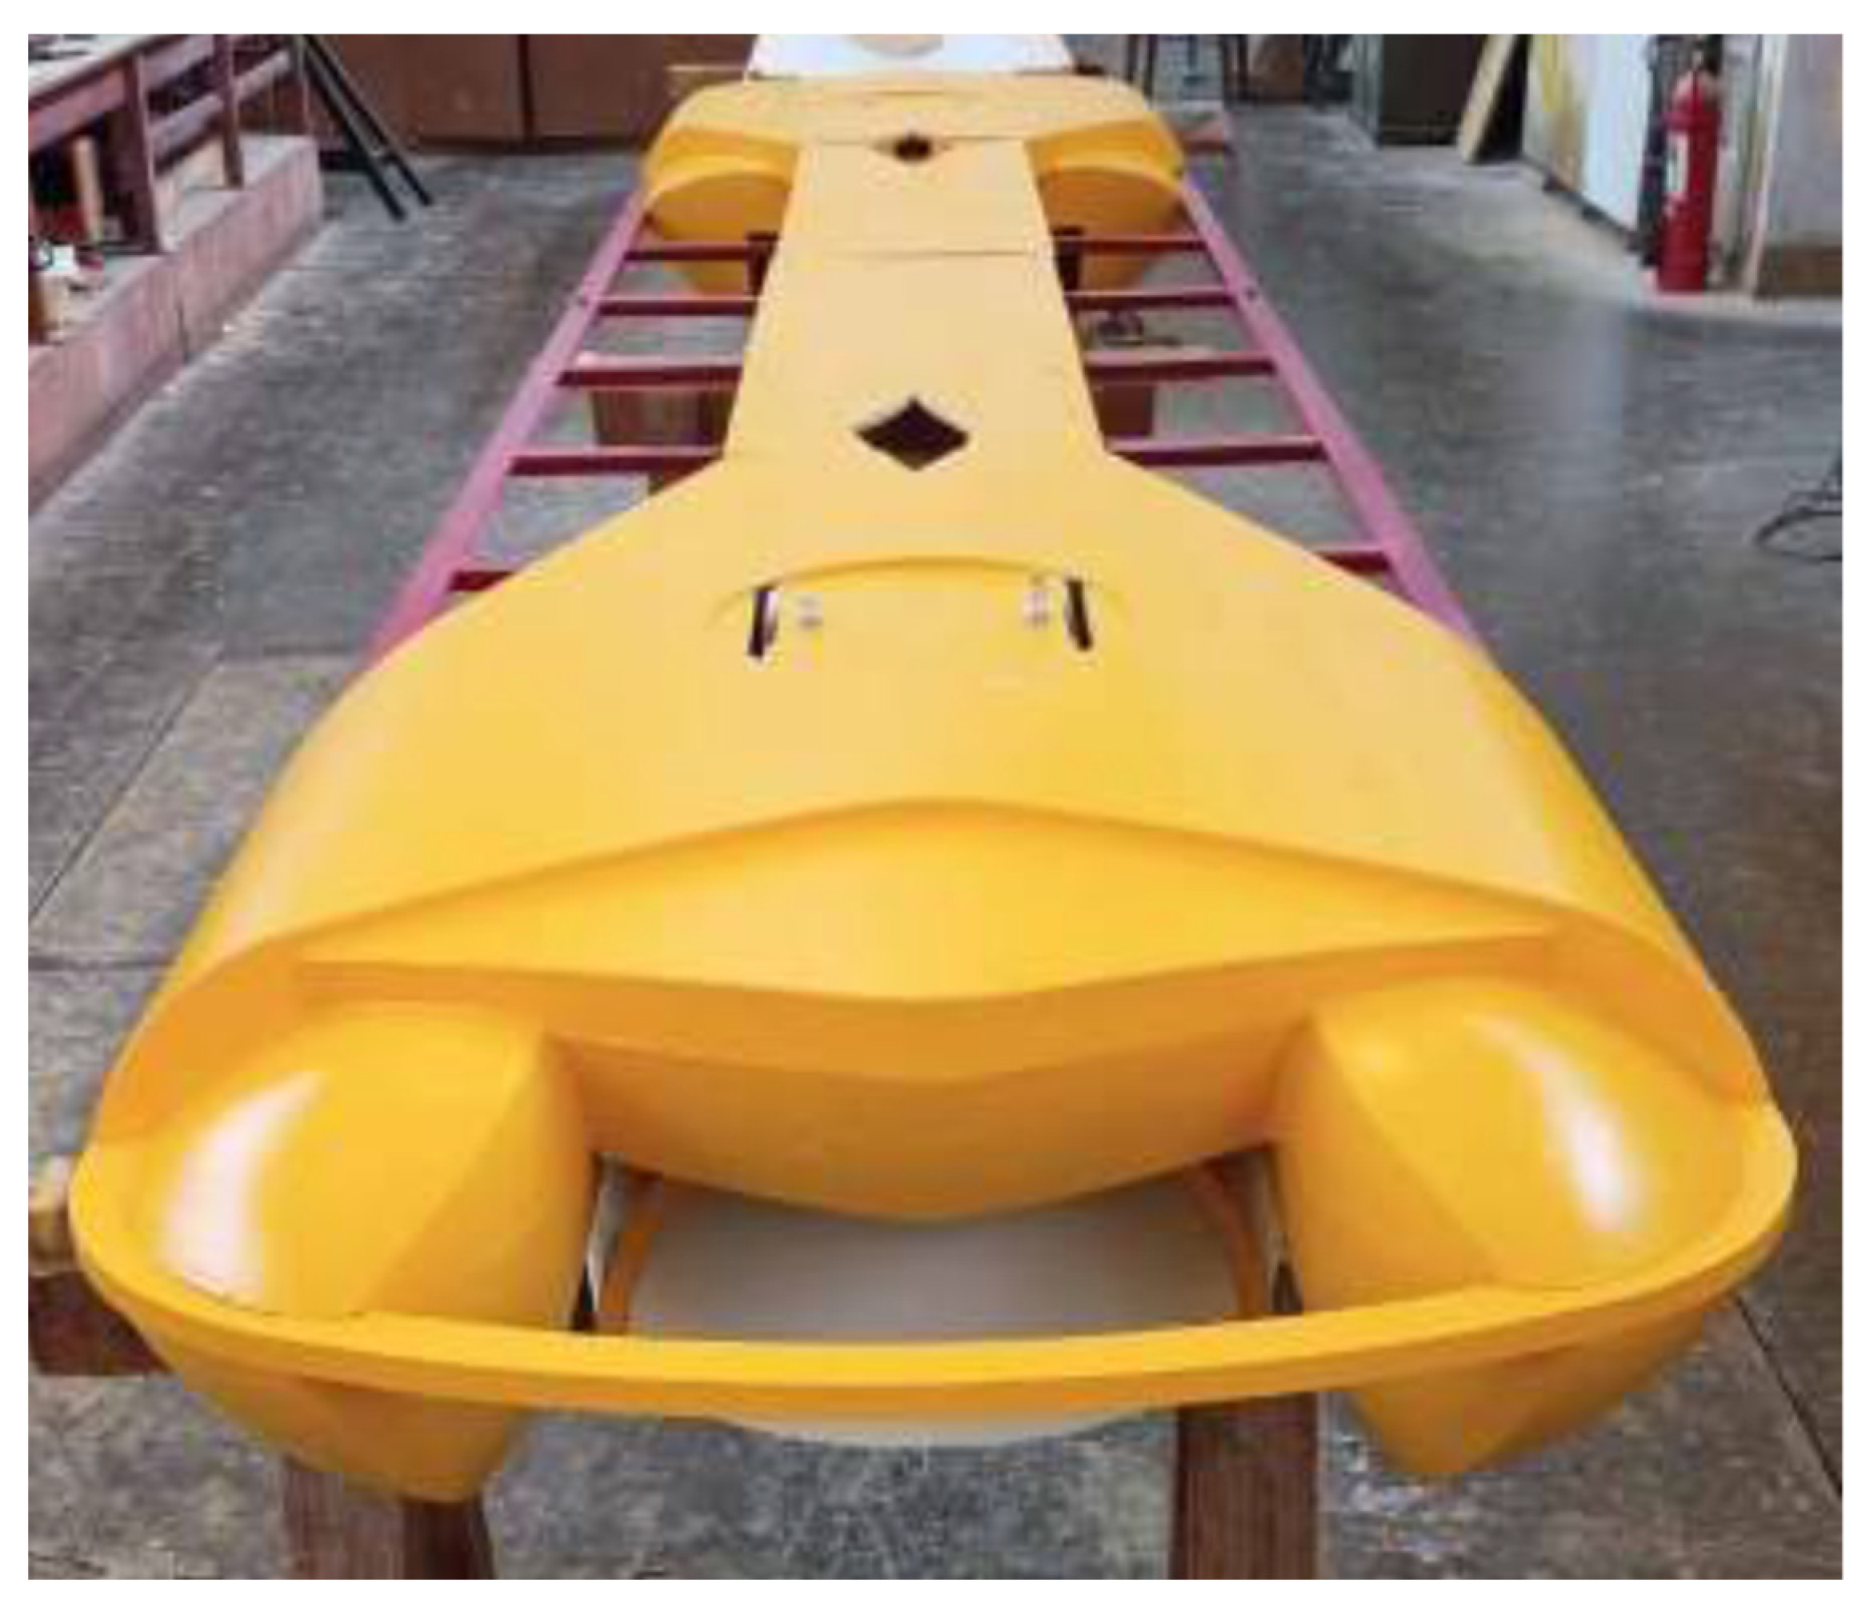
The model was, therefore, produced of various materials, at a scale of 1:5.0. The hull was constructed from GRP, cover parts from plywood and obeche wood, and the exostructure consisted of metal parts. The battery pods were produced from tin, and the variable ballast tanks were made from plastic. Photographs of the model are presented in Figure 1, Figure 2 and Figure 3.
2.1. Resistance Tests in Deep Water
Deepwater tests were performed with the aid of sabre-shaped girders (Figure 4) whose function is to keep the model at the required depth. They do not interfere with the model and, therefore, do not influence the obtained results.
The submarine model was towed by a carriage, and the total resistance was measured. The towing force was applied in the direction of the propeller thrust. The resistance tests were performed in the submerged deepwater conditions. To eliminate free surface and tank bottom effects, the resistance tests of the submarine model were conducted at four different draughts, and the measured resistance values were extrapolated to infinite water depth. The obtained values of model resistance at infinite depth were considered further.
The tested speed range for the deep water was v = 1.5 kn–5.5 kn, corresponding to Froude numbers Fn = 0.047–0.174. The maximum speed of interest, given in Table 1, was v = 2.5 kn, however, a higher speed was considered to account for a possible current in the opposite direction. A test speed of 6 kn was also envisaged, but it was not performed because of the excessive forces.
The total resistance coefficient, , in the full scale was obtained as:
where and are the full-scale friction and viscous (pressure) resistance coefficients, respectively, while = 0.8 × 10⁻³ is the total correlation allowance.
The total resistance coefficient is calculated from the measured total resistance, , at the model scale as:
where cTm is the model’s total resistance coefficient, S is the dynamic wetted surface, and v is the submarine’s speed in m/s.
The friction resistance coefficient at the model- and full-scale is calculated from the Hughes correlation line [16]:
where is the Reynolds number, different for the model and full-scale cases. Equation (3) is used for conversion from the model- to the full-scale friction resistance. The frictional force, , at the model scale is calculated from the friction force coefficient at the model scale, , given as:
The viscous (pressure) resistance coefficient is assumed to be constant for the model- and full-scale at the same Froude number, given as:
where is the model’s viscous (pressure) force, determined from the measured total model resistance, , and the calculated model’s friction resistance, , as:
So, for the measured total resistance, , and calculated friction resistance, , is calculated from Equation (6) and then is determined from Equation (5). The full-scale friction resistance is then calculated from the correlation line Equation (3) and then the total resistance coefficient is obtained using Equation (1). The total resistance is determined for the full scale according to an expression equivalent to Equation (2).
The Reynolds number, , appearing in Equation (3) reads:
where is the kinematic viscosity of the fluid, while is the length of the model or submarine for test and full-scale conditions, respectively. The kinematic viscosity of the freshwater during testing was 1.107 × 10⁻⁶ m2/s, while the kinematic viscosity of the seawater was assumed to be 1.1883 × 10⁻⁶ m2/s.
The full-scale resistance is additionally increased by 7.5% to account for sea trial conditions, in accordance with the trial’s database of tested submarines of the Brodarski Institute.
2.2. Resistance Test on Surface in Calm Water
Surface testing was conducted at the full-scale draught of 3.42 m. Surface resistance tests in calm water were performed with cylindrical girders, allowing the model to trim and sink freely (Figure 5).
The tested speed range for the surface test was up to v = 5.5 kn. The forces were lower compared to the deepwater conditions, but the water raised up to the uppermost part of the cover for the speed of v = 5.5 kn and, therefore, higher speeds would not be obtainable since the water would cover the entire upper part of the submarine.
The conversion from the model- to the full-scale was made on the presumption that the residuary resistance coefficient, , is identical for the submarine and the model at a certain equal Froude number. The total resistance coefficient, , was obtained in accordance with:
The conversion from the model to the full-scale submarine was achieved by means of the ITTC-1957 correlation line [17]:
with total correlation allowance = 0.4 × 10⁻³.
2.3. Towing with Rope in Calm Water
The submarine model was towed with a rope, and the towing force in the rope was measured. The test was performed in calm water, towing was performed for the speed range v = 1.7 kn–3.5 kn, and the model was free during the tests. The model was towed with a rope of length 1.87 m at the model scale, and the height of the towing point at the carriage was 0.32 m above the towing point at the model, forming a towing angle of 9.7 deg. The towing point of the model was positioned in the front part of the model, 43 cm (model scale) from the front end (frame). From the given configuration of the towing rope length and angle it is possible to recalculate the towing force for different configurations. A photograph of the model during towing is presented in Figure 6.
2.4. Seakeeping Tests
The seakeeping tests in irregular beam waves (JONSWAP spectrum) at zero speed were performed for the submarine with the surface conditions. The testing wave parameters were:
- -
- Significant wave height, H1/3 = 1.2 m
- -
- Wave period, T01 = 6.9 s
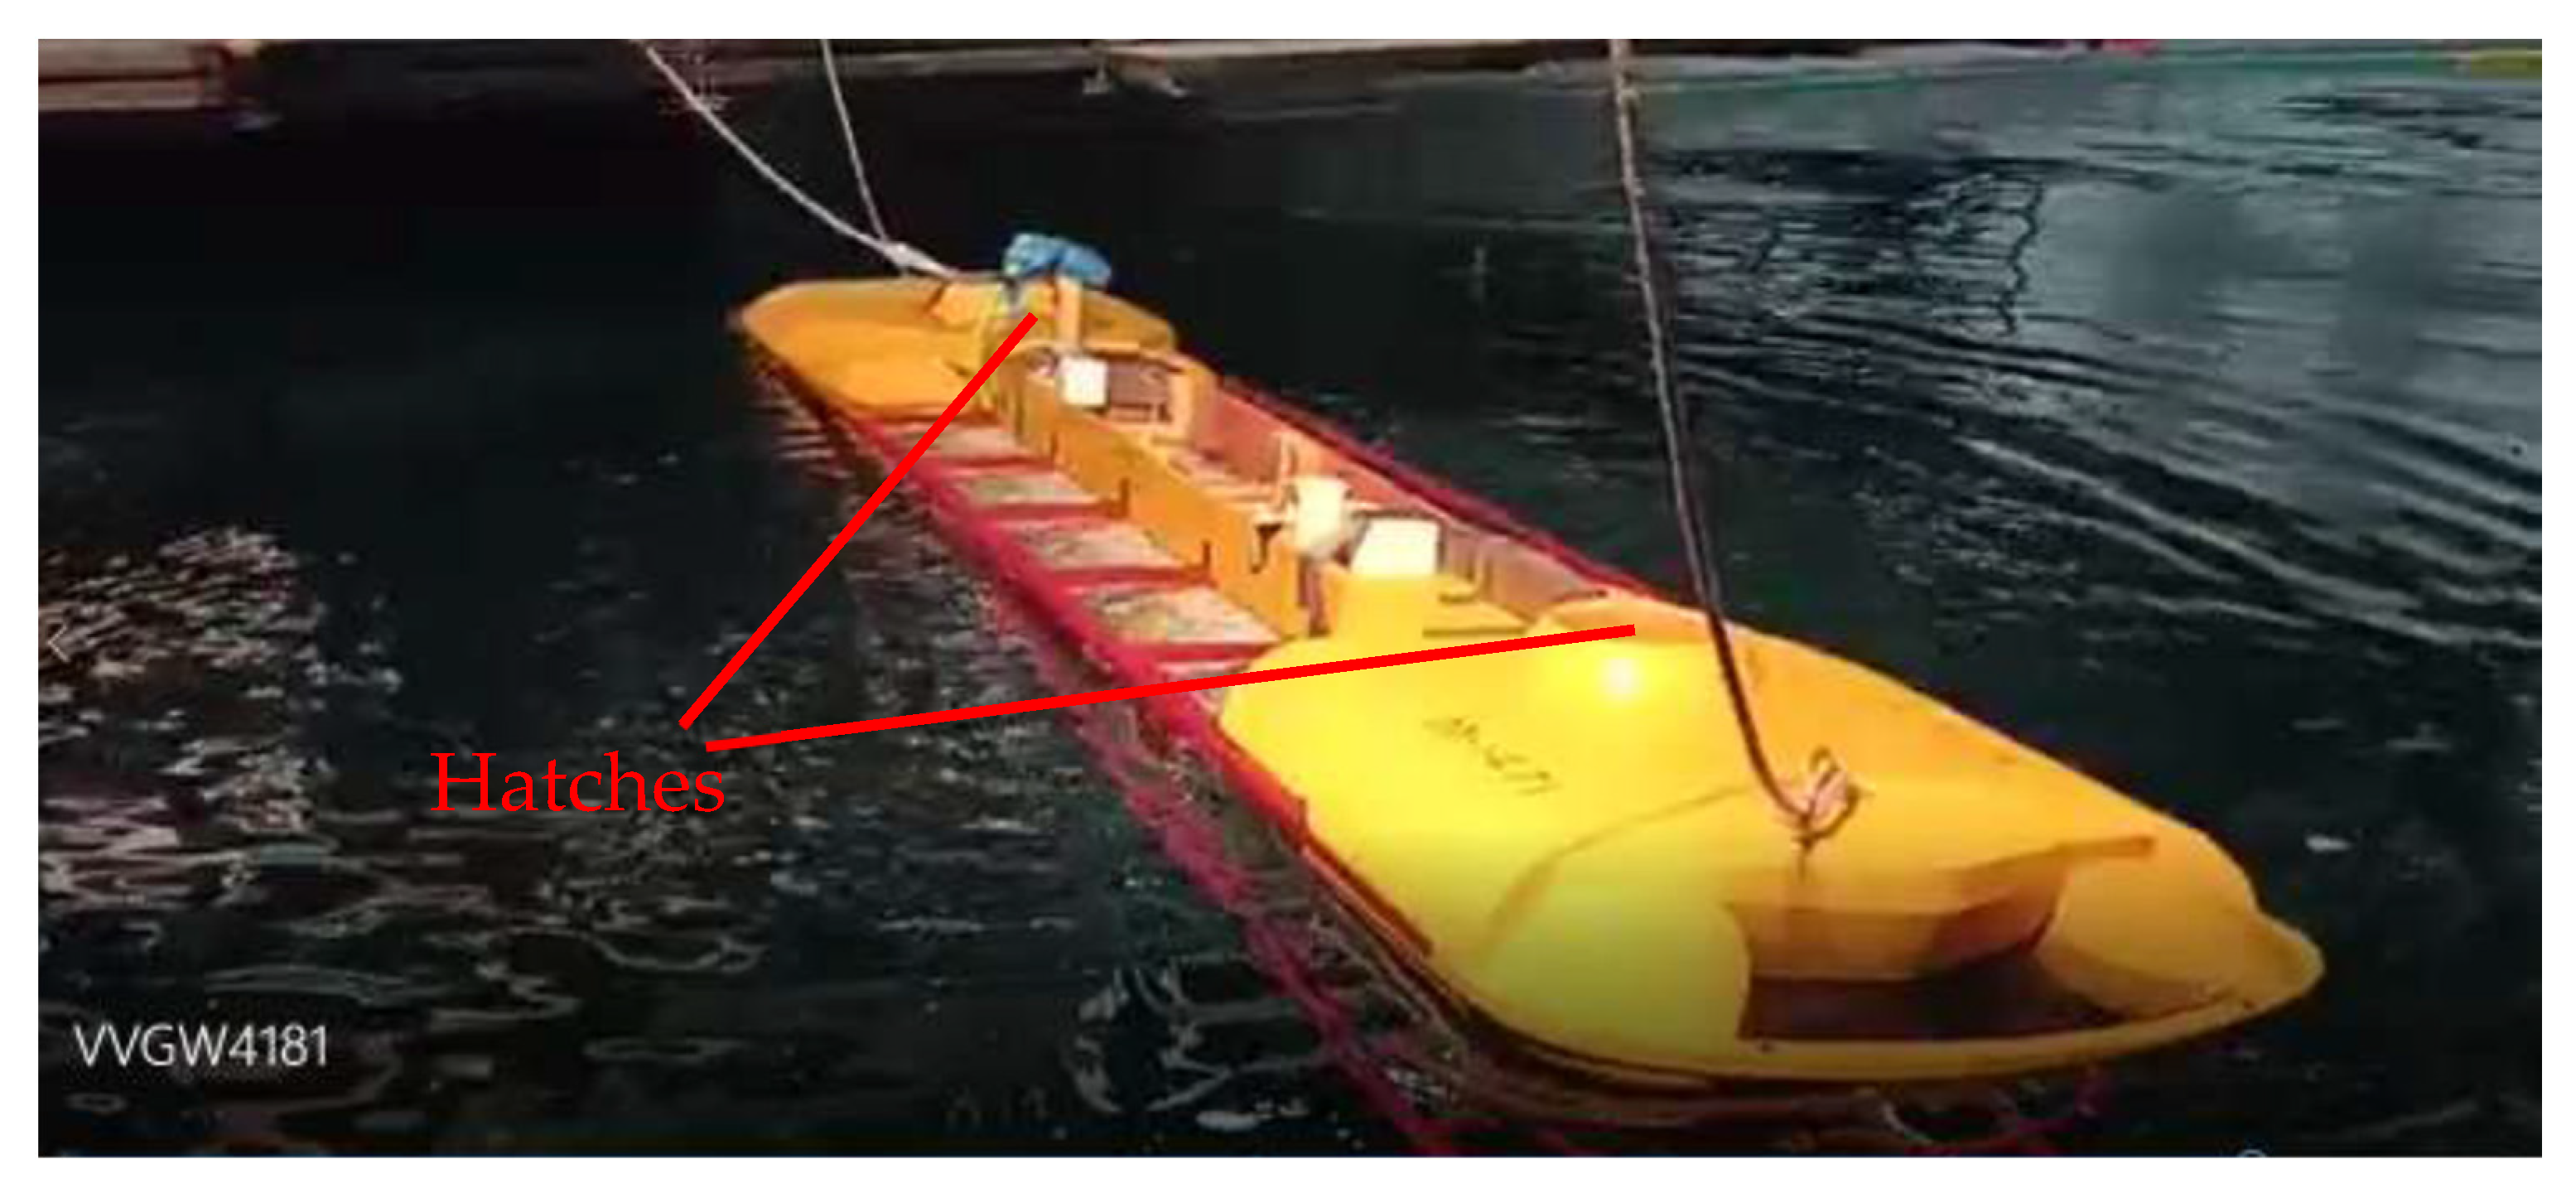
The sea state was selected given that the tourist submarine is designed for operation in mild weather conditions in the Adriatic Sea, where 80% of sea states have a significant wave height lower than 1.2 m [18]. The test aimed to observe the flow around the hatches and check the flooding risk on open hatches. A photograph of the seakeeping test with marked observed hatches is presented in Figure 7.
2.5. Open Water Propeller Tests
The open water tests were performed with the controllable pitch stock propeller and stock nozzle models, selected based on the theoretical calculations of the submarine’s designer, given in Table 3.
The designer’s calculations were based on the Kaplan propeller and nozzle design, while the test was conducted on different type of propeller and nozzle design, to serve as a basis of improvement of the final design.
Such an approach is suitable since the operating points of the thrusters in the required conditions (low speeds and high revolutions), as given in Table 3, are far from the optimal advance coefficient. Therefore, a more detailed investigation of propeller designs with respect to the advance coefficient of interest is worth considering.
is the advance coefficient, given as
where is the speed of advance of the propeller, while is the rate of propeller revolutions.
During the test, the propeller model was attached to a horizontal shaft. The draught of the shaft’s centre line was one and a half diameters below the water’s surface to avoid air drawing from the water’s surface. The dimensions of the tank were such that any blockage was avoided. The experimental set-up is schematically shown in Figure 8.
The test method applied was the constant RPM method, whereas the advance velocity (speed of carriage) was varied so that the complete interesting range of the advance coefficients was examined, i.e., from = 0 to corresponding to thrust zero/negative values.
The propeller’s performance in open water was measured with the propeller dynamometer, which measures the propeller’s thrust, torque, and revolutions. The nozzle thrust was measured using a separate dynamometer for thrust.
For the standard tests of the propeller with a nozzle in open water conditions, a propeller model is mounted within the nozzle on a drive shaft. A streamlined nose cap is mounted upstream of the propeller as well to ensure that the inflow over the hub is parallel to the shaft. The connection of the nose cap to the hub is smooth, and the rotating part of the hub is positioned in such a way as to avoid pressure build-up.
The nozzle was supported by a strut which had a streamlined section shape. During the test, only the thrust of the nozzle was measured. The nozzle thrust was measured by a load cell placed inside a shielded strut. Photographs of the propeller in the nozzle, the equipment setting, and the open water tests are shown in Figure 9.
The results of the analysis are presented in the form of a diagram, where the abscissa represents the advance coefficient (Equation (11)), while on the ordinate are plotted simultaneously the torque coefficient , the thrust coefficient , and the propeller efficiency , given as
where ρ is the water density, while and are the propeller torque and thrust, respectively.
3. Results
The resistance of the submarine is compared to the RANS-based CFD calculations in OpenFOAM, described in detail in ref. [15]. The CFD results are available for surface and deepwater conditions for three speeds, i.e., 1.5 kn, 3.0 kn, and 6.0 kn. A computational mesh consisting of 11,091,951 cells was employed; the sliced geometry of the submarine is presented in Figure 10. The k–ω SST turbulence model was used, and the time derivative terms in the governing equations were discretised with a first-order accurate implicit Euler scheme. The convection term in the momentum equation was discretised using the Gauss theorem, where linear, upwind-biased interpolation is used to interpolate from cell-centres to face-centres. All diffusion terms were discretised using the Gauss theorem and central differencing, with an over-relaxed approach for the non-orthogonal correction [15].
The numerical model was validated by comparing the frictional resistance coefficient of the isolated “smooth” pressure hull (without stiffening rings and exostructure) against the ITTC-1957 correlation line friction coefficient of the flat plate. The calculations resulted in a similar resistance as the flat plate resistance, with some addition due to the form factor [15].
3.1. Results for Infinite Depth
The resistance and effective power for the submarine in infinite sea depth conditions are presented in Figure 11. The lines show the results obtained by the tests, while the three points available from CFD analysis are shown as dots. The experimental resistance results for 6 kn are obtained by extrapolating from lower speeds, as explained in Section 2.1.
It may be observed from Figure 11, that there is a sharp increase in the effective power for high submarine speeds, above 5 kn. A fair agreement between the experimental test and the CFD results may be noticed, with the tendency that the CFD calculations slightly overestimate the measured resistance and effective power. Thus, for the highest speed of 6 kn, the measured resistance and effective power are overestimated by 6.6% by the CFD results.
3.2. Results for Surface Still Water Testing
The resistance and effective power for the submarine in calm surface conditions are presented in Figure 12. The lines show the results obtained by the tests, while the three points available from CFD analysis are shown as dots. The test resistance results for 5.5 kn and 6 kn are obtained by extrapolating from lower speeds, as explained in Section 2.2.
It may be seen that a lower effective power is required at the calm surface (Figure 12) compared to the deep water (Figure 11). The agreement between the CFD calculations and the measurements is fair, although the CFD resistance overestimates the measurements. At a maximum speed of 6 kn, this overestimation is 7%.
3.3. Results for the Towing Test in Calm Surface Conditions
The towing test was performed in calm surface conditions with the aid of a rope, and the model was fully free to move. It was demonstrated in the towing test that the submarine was stable for the tested speeds up to v = 3.5 kn, with no tendency to heave/pitch/yaw, and that towing operations can be safely conducted. The required towing force in the rope for a speed of v = 3.0 kn is 11 kN. As to the extrapolated values, at a speed of 4 kn, the force in the rope is 19.3 kN.
A video showing the towing of the submarine in the calm surface is available in the Supplementary Material (Video S1).
3.4. Results for the Seakeeping Tests in Irregular Beam Seas
Seakeeping tests were conducted as qualitative tests only, since the Classification Society required a demonstration that at a sea state representing the operational limit of the submarine, in the beam seas condition, the hatches are not endangered by waves. A test in irregular waves was conducted for a period of 600 s at the model scale, representing over 22 min of the sea realization in full scale. The model was free during the measurements. Roll measurements were not conducted since it is not expected that values of the roll angle will be of relevance. Namely, the horizontal exostructure framing and cover plate at the water level (Figure 7), as well as other appendages (Figure 3), cause a large viscous drag, thus preventing an excessive rolling motion of the submarine. A video showing the submarine motion in irregular waves is available in the Supplementary Material (Video S2).
A seakeeping test was performed for zero speed, i.e., a stationary free model in irregular beam waves. For the JONSWAP wave spectrum, with significant wave height H1/3 = 1.2 m, it was demonstrated through tests that water does not endanger the hatches at any time. Even the covers remain fully dry, with only some occasional spray.
3.5. Open Water Propeller Test Results
It may be observed in Figure 13, that for the advance coefficient J = 0.2, corresponding to the submarine speed of 3 knots, the open water efficiency is 0.294. Since the thrusters operate in open flow conditions, open water efficiency equals total efficiency. With a power demand of P = 35 kW (Table 3), two stern thrusters achieve a speed of v = 2.9 kn at revolutions of N = 566 1/min, which is similar to the input data, although this indicates that a larger power demand may be considered for the final design. The achieved thrust with the stock propeller and the nozzle is T = 8.1 kN, which is larger compared to the estimated input data, which is beneficial from the manoeuvring aspect.
The operating point of the thrusters related to the open water efficiency curve is at quite low values of the advance ratio J and, therefore, the efficiency of the thrusters is low as well, meaning that the analysis is not, as usually, oriented towards the area of almost maximal efficiency. The purpose of the test was to serve as a basis to the future thrusters’ designer/producer in defining project space and limitations.
4. Discussion
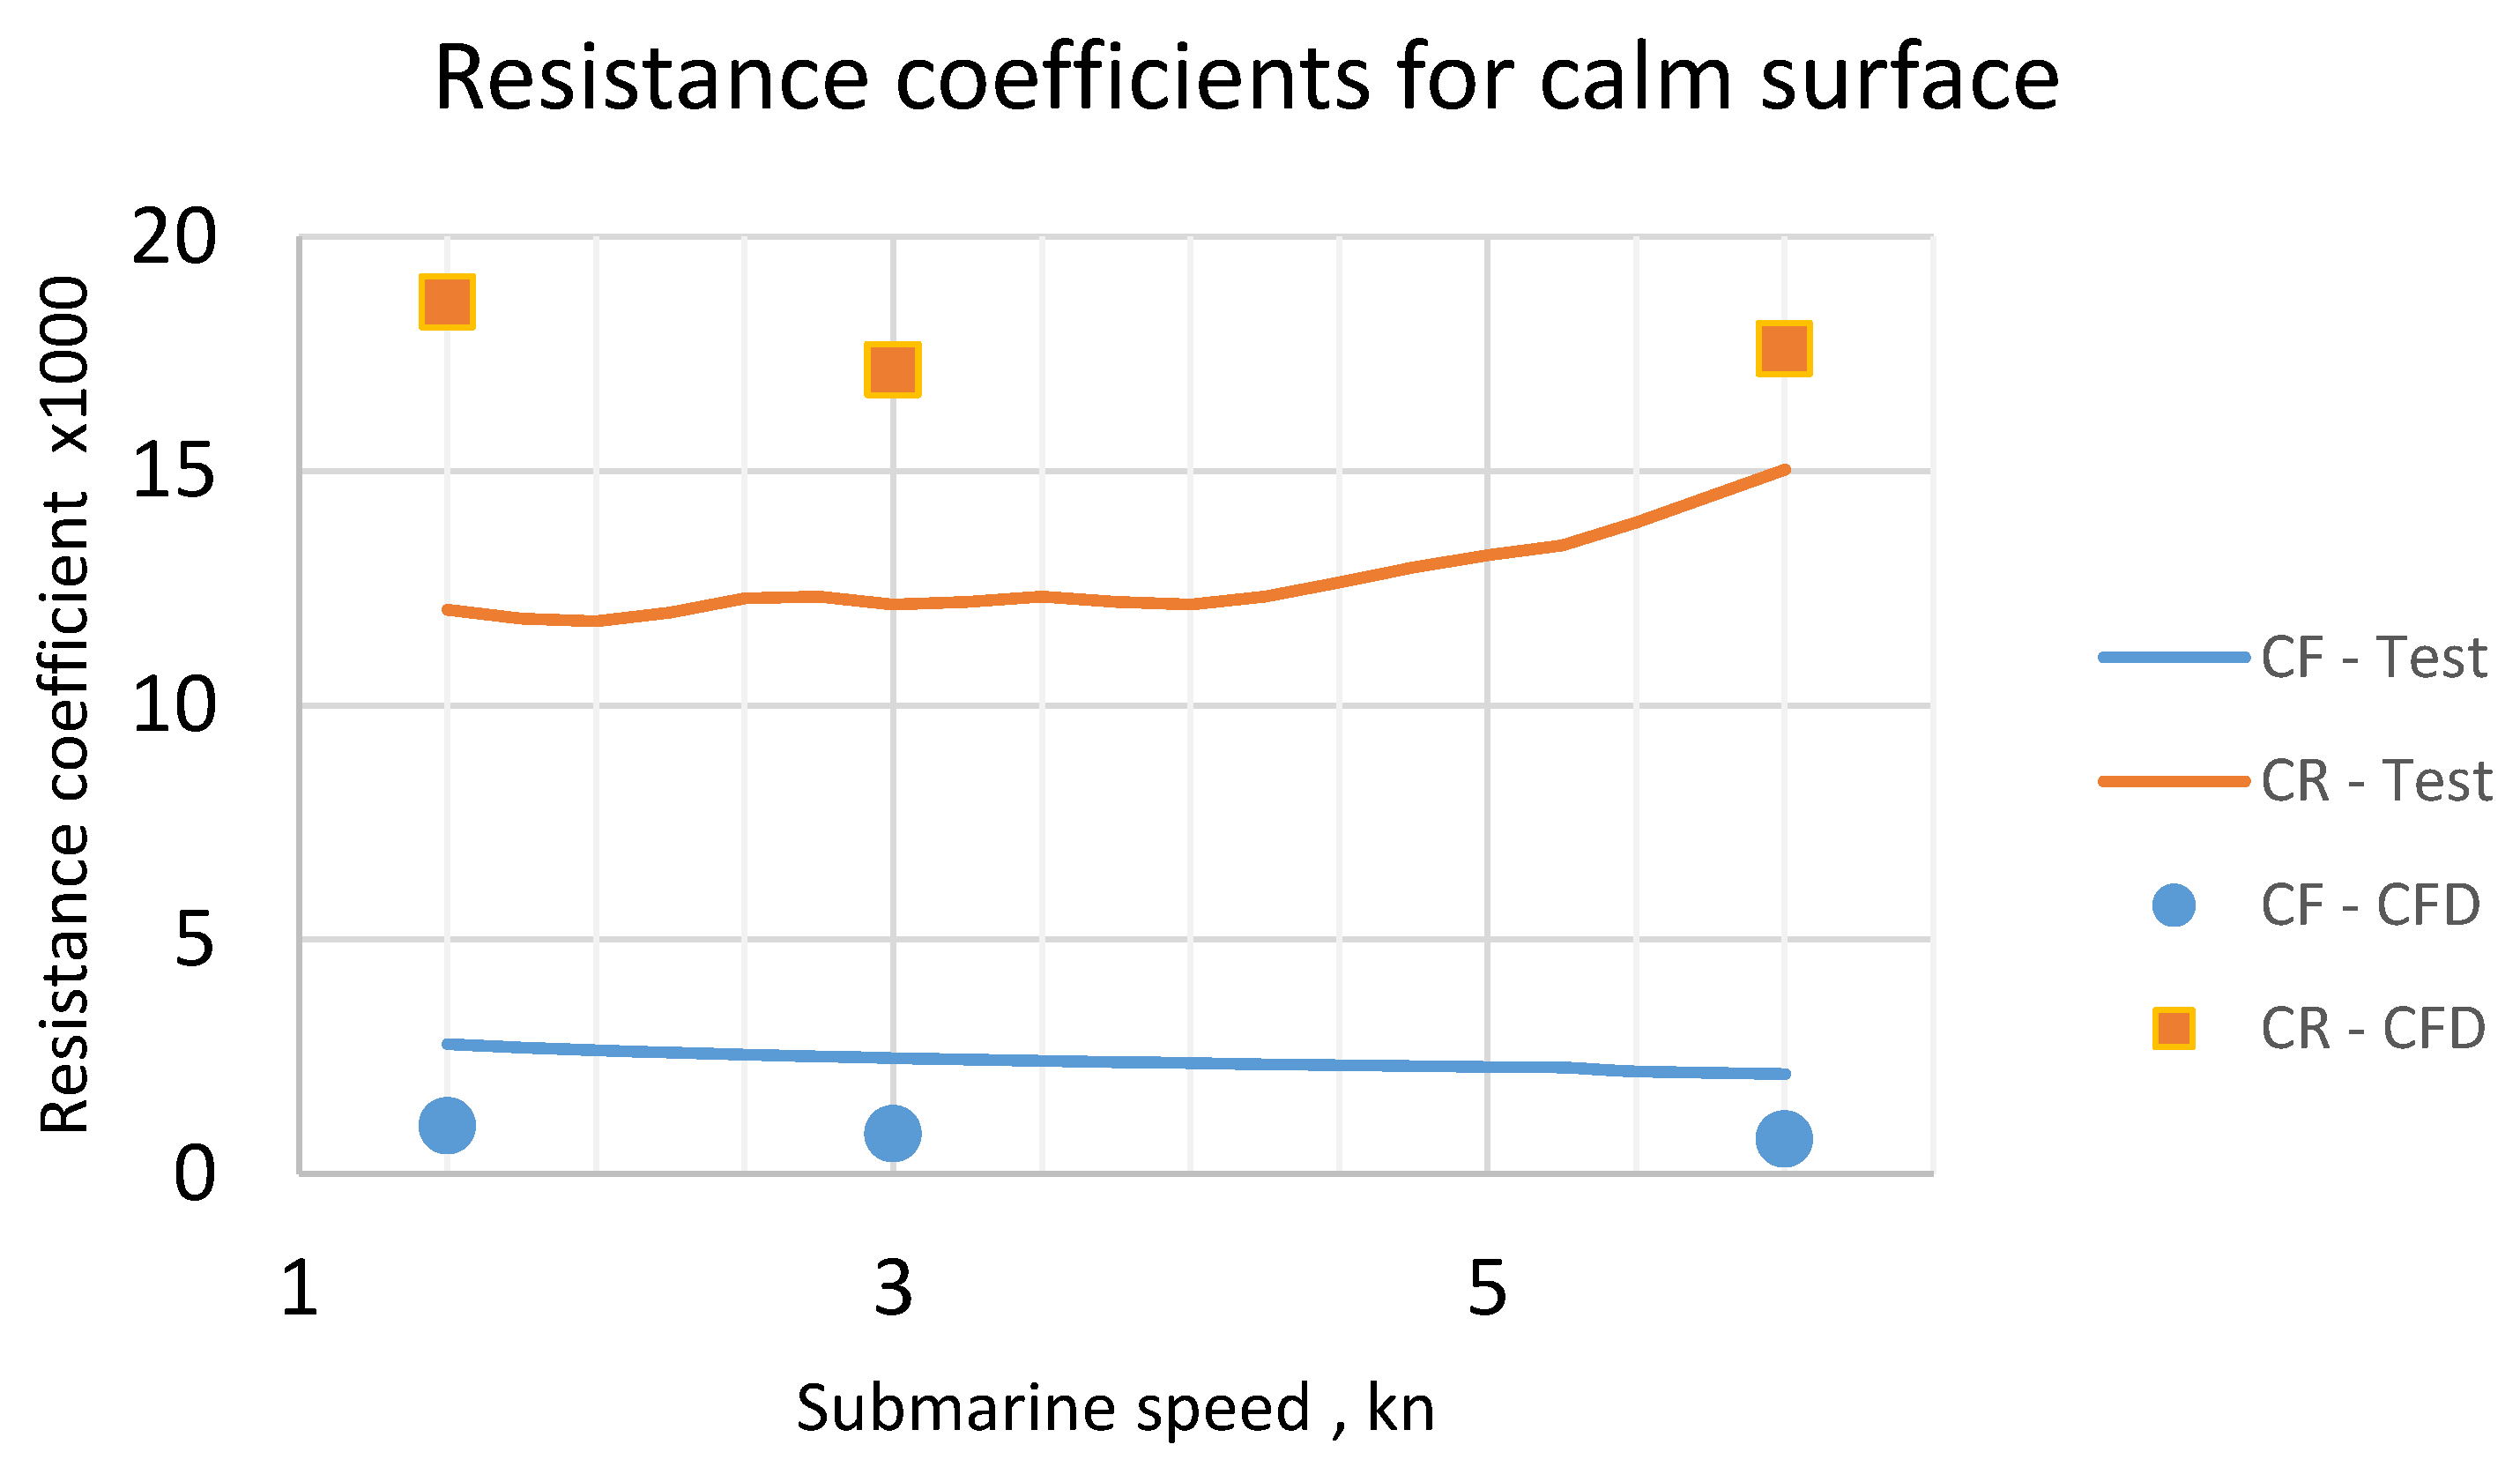
Although the agreement between the resistance determined by the model tests and the CFD analysis is fair concerning the practical application, the differences found in Figure 11 and Figure 12 deserve attention and further investigation. Therefore, the resistance coefficients were calculated and are presented in Figure 14 and Figure 15 for deep water and at the free surface, respectively.
It may be noticed in both figures that friction resistance is a minor part of the total resistance coefficient. This is a consequence of the perpendicularly placed exostructure elements that may be noticed in Figure 1, Figure 2, Figure 3, Figure 4 and Figure 5. These elements cause flow separation and re-circulation, reducing the amount of shear flow close to the submarine’s surfaces. The occurrence of this phenomenon can be seen from the CFD results of streamlines around the submarine when sailing at 3 knots speed at 40 m depth, presented in Figure 15 in ref. [15].
Another conclusion that may be drawn from Figure 14 and Figure 15 is that the viscous and residual force coefficients are higher for the CFD calculations than for the model tests. This is the main reason for the overestimation of total experimental resistance by the CFD results. The opposite is true for the friction force coefficients, but this is less relevant since the friction force coefficients are much smaller and hence unimportant.
Additionally, there is certainly a strong interaction between the cylindrical parts in the bottom portion of the submarine’s body and the exostructure elements of the cylindrical cross-section and the other parts of the submarine’s body. This may lead to certain flow instabilities and affect the measurement results, and at the same time it is a challenge for the numerical calculation as well, in the first place regarding the choice of an appropriate turbulence model. Consequently, deviations in the results are almost inevitable. Altogether eight cylinders are in the bottom part of the submarine. Four of them (outer ones) represent battery pods and the other four (inner ones) represent variable ballast tanks (Figure 2). Their fineness ratio, L/D, is above 10 and the gap between the inner cylinders is about 0.3 Di (Di is the diameter of the inner cylinders), while the gap between the inner and outer cylinders is 0.3 DO (DO is the diameter of the outer cylinder). Furthermore, in the axial direction there are two cylinders located (i.e., a gap in between two different segments is present). In addition to the cylinders, there are also supporting structures which induce even more complexity to the flow (rectangularly shaped). The maximal local Reynolds number of a cylinder at the model scale was 2.5 × 10⁵, for the larger cylinder at a speed of 5.5 kn. In all other conditions, the local Reynolds numbers were smaller. Axial flow over such a structure, including the creation of a boundary layer of each component and local values of Reynolds numbers, is expected to be complex and to include interactions of components. These interactions can also be seen from the CFD results of streamlines around the submarine, presented in Figure 15 in ref. [15].
Although experimental model testing is considered more reliable than numerical computations, this may not be so in this case. The potential reason could be the conversion from the model scale to the full scale of the submarine, as the assumption that the viscous and residual force coefficients are constant during conversion, which is applicable for classic submarine hulls, in this case, may be insufficient. Namely, such an assumption is derived for smooth ship and submarine hulls, while exostructure elements and rings between acrylic cylinders obstruct the flow around the hull of the tourist submarine. This could make assumptions during the conversion of measurements doubtful.
It is evident from Figure 14 and Figure 15, that for both conditions, deeply submerged and surface, the difference between the residual resistance coefficient is higher for the lowest tested speeds. Although the model size was chosen to be as large as possible for the lower tested speeds, the effect of the Reynolds number may still be present. The Reynolds number can locally drop below the threshold value for lower speeds, causing the flow to be laminar. In full scale, the flow is fully turbulent. Hence, the scaling of drag forces might be more impacted since the flow similarity is worse in low speeds than at higher speeds.
Lastly, some smaller details were modelled for numerical calculations but omitted for the physical model production. It was estimated that due to their size and corresponding local Reynolds number, they might create unrealistic effects. So, a small percentage of differences in results is definitively attributed to this difference in the appearance of the models.
5. Conclusions
Resistance, towing, and seakeeping tests of the innovative tourist submarine model, at a scale of 1:5.0, performed in a 276 m long towing tank, are described. The resistance tests are performed for infinitely deep water and for the submarine on a calm free surface and compared to CFD computations using OpenFOAM. The hydrodynamic resistance is strongly affected by the exostructure elements that keep together the acrylic hull segments of the submarine. The towing experiments are performed on a calm surface, with the model free to move. Seakeeping experiments are performed in irregular beam waves with zero speed. The open water tests are also performed with the controllable pitch stock propeller and stock nozzle models, selected based on the theoretical calculations of submarine’s designers. The following conclusions are drawn from the study:
- The resistance on a calm surface is lower compared to in deep water.
- There is a steep increase in the resistance for speeds higher than 5 knots in deep water, while such higher speeds on a calm surface are prevented by excessive water overtopping.
- Although the agreement between the full-scale resistance obtained by the model tests and the CFD analysis is fair, the CFD calculations overestimate the experimental tests by up to 7% for the highest speed of 6 knots.
- The main reason for the discrepancies between the calculated and experimental resistance are the external elements (exostructure, battery pods, and variable ballast tanks) causing flow instability, separation and re-circulation, affecting both the measured and calculated results and thus making differences in resistance prediction almost inevitable.
- It is demonstrated in the towing test that the submarine is stable and towing operations can be safely conducted.
- For the irregular beam waves and limiting significant wave height for the operation of the submarine, it is shown through tests that water does not endanger hatches at any time.
- The results of the open water propeller tests indicate that the tested stock propellers are suitable and acceptable for further evaluation. It was found that the power demand and propeller thrust are slightly larger compared to the initial estimate of the designer.
Finally, it is deemed necessary to perform both CFD analysis and model tests to obtain a reliable estimate of the resistance. The conversion of resistance from the model tests to the full scale and the choice of the appropriate turbulence model could be the most challenging parts of the experiments and CFD analysis, respectively.
Supplementary Materials
The following supporting information can be downloaded at: https://www.mdpi.com/article/10.3390/jmse11061199/s1, Video S1: Towing with rope in calm water, Video S2: Seakeeping experiment.
Author Contributions
Conceptualization, M.P.-B. and I.G.; methodology, M.P.-B. and I.G.; software, I.G.; validation, J.P., M.P.-B. and I.G.; formal analysis, J.P., M.P.-B., I.G. and I.Ć.; investigation, J.P., M.P.-B., I.G. and I.Ć.; resources, J.P.; data curation, M.P.-B. and I.G.; writing—original draft preparation, J.P.; writing—review and editing, M.P.-B., I.G. and I.Ć.; visualization, M.P.-B. and I.G; supervision, J.P., M.P.-B., I.G. and I.Ć.; project administration, J.P.; funding acquisition, J.P. All authors have read and agreed to the published version of the manuscript.
Funding
The project is co-financed by the European Union from the European Regional Development Fund within the Operational Program “Competitiveness and Cohesion 2014-202”, project KK.01.2.1.02.0339—Development of the multipurpose luxury touristic and research submarine. This work has been supported in part by Croatian Science Foundation under the project lP-2019-04-2085.
Institutional Review Board Statement
Not applicable.
Informed Consent Statement
Not applicable.
Data Availability Statement
Not applicable.
Acknowledgments
The content of the publication is the sole responsibility of the project partner Faculty of Mechanical Engineering and Naval Architecture. The general and structural design of the tourist submarine analysed are the property of Marine and Energy Solutions DIV d.o.o.
Conflicts of Interest
The authors declare no conflict of interest.
References
- Ćorak, M.; Šperanda, Z.; Čokić, J.; Palaversa, M.; Parunov, J. Finite Element Simulations of Novel Submersible Design Based on the ASME Design-by-Analysis Approach. J. Mar. Sci. Eng. 2023, 11, 275. [Google Scholar] [CrossRef]
- Saghi, H.; Parunov, J.; Mikulić, A. Resistance Coefficient Estimation for a Submarine’s Bare Hull Moving in Forward and Transverse Directions. Appl. Sci. 2022, 12, 10953. [Google Scholar] [CrossRef]
- Saghi, H.; Parunov, J. Hydrodynamic Force of Resistance of Tourist Underwater Vehicle’s Bare Hull with Different Heads using OpenFOAM. Naše More 2023, 70, 11–22. [Google Scholar] [CrossRef]
- Moonesun, M.; Javadi, M.; Charmdooz, P.; Mikhailovich, K.U. Evaluation of submarine model test in towing tank and comparison with CFD and experimental formulas for fully submerged resistance. Indian J. Geo-Mar. Sci. 2013, 42, 1049–1056. [Google Scholar]
- Utina, M.R.; Murwatono, T.T.; Sadiah, S. The Study on the Resistance Test Performance of BPPT Mini Submarine. In Proceedings of the SENTA 2018—The 3rd International Conference on Marine Technology, Surabaya, Indonesia, 5–6 December 2018. [Google Scholar]
- Mackay, M. The Standard Submarine Model: A Survey of Static Hydrodynamic Experiments and Semi Empirical Predictions; TR 2003-079; Defence R & D Canada, Atlantic: Dartmouth, NS, Canada, 2003. [Google Scholar]
- Jiao, H.; Fu, W.; Zhang, L.; Zhao, C.; Zeng, Z. Simulation research and optimization design on towed system of manned submersible. In Proceedings of the 2018 IEEE 8th International Conference on Underwater System Technology: Theory and Applications (USYS), Wuhan, China, 1–3 December 2018. [Google Scholar]
- Jiang, Z.; Shen, X.; Hui, Y.; Cui, W. A Numerical Study of the Descent and Ascent Motion of a Full Ocean Depth Human Occupied Vehicle. In Proceedings of the ASME 2017 36th International Conference on Ocean, Offshore and Arctic Engineering, Trondheim, Norway, 25–30 June 2017; Volume 6. [Google Scholar]
- Wei, Z.-F.; Wang, M.-Y.; Yu, Q.; Yang, S.-L. A Design of Resistance Optimization System for Unmanned Submersible Vehicle Based on Response Surface Method. In Proceedings of the 2014 International Conference on Mechanics and Civil Engineering, Wuhan, China, 13–14 December 2014; Volume 7, pp. 128–133. [Google Scholar]
- Kotb, M.A.; Banawan, A.; Ahmed, Y.M. Flow field characteristics past a slow speed tourist submarine and their environmental impacts. In Proceedings of the 7th International Conference on Role of Engineering towards a Better Environment, Alexandria, Egypt, 20–22 December 2008. [Google Scholar]
- Phillips, A.; Furlong, M.; Turnock, S.R. The use of computational fluid dynamics to assess the hull resistance of concept autonomous underwater vehicles. In Proceedings of the OCEANS 2007–Europe, Aberdeen, UK, 18–21 June 2007. [Google Scholar] [CrossRef] [Green Version]
- Khan, S.A.; Fatepurwala, M.; Pathan, K.; Dabeer, P.; Baig, M.A.A. CFD analysis of human powered submarine to minimize drag. Int. J. Mech. Prod. Eng. Res. Dev. 2018, 8, 1057–1066. [Google Scholar] [CrossRef]
- Karim, M.M.; Rahman, M.; Alim, M.A. Performance of SST k-ω turbulence model for computation of viscous drag of axisymmetric underwater bodies. Int. J. Eng. Trans. B Appl. 2011, 24, 139–146. [Google Scholar]
- Chen, J.; Lv, B.; Peng, L.; Huang, B. Study on resistance characteristics of submarine near water surface. MATEC Web Conf. 2022, 355, 01002. [Google Scholar] [CrossRef]
- Gatin, I.; Čokić, J.; Romić, D.; Parunov, J. CFD Study on the Influence of Exostructure Elements on the Resistance of a Submarine. J. Mar. Sci. Eng. 2022, 10, 1542. [Google Scholar] [CrossRef]
- Hughes, G. Frictional and Form Resistance in Turbulent Flow, and a Proposed Formulation for Use in Model and Ship Correlation. Trans. Inst. Nav. Archit. 1954, 96, 337. [Google Scholar]
- ITTC. Resistance Test, 7.5-02-02-01. In ITTC Recommended Procedures and Guidelines; ITTC: Zürich, Switzerland, 2011. [Google Scholar]
- Katalinić, M.; Parunov, J. Comprehensive Wind and Wave Statistics and Extreme Values for Design and Analysis of Marine Structures in the Adriatic Sea. J. Mar. Sci. Eng. 2021, 9, 522. [Google Scholar] [CrossRef]
Figure 1.
Upper view of the submarine model (upper half of the pressure hull, cover, main ballast tanks, and upper exostructure).
Figure 1.
Upper view of the submarine model (upper half of the pressure hull, cover, main ballast tanks, and upper exostructure).

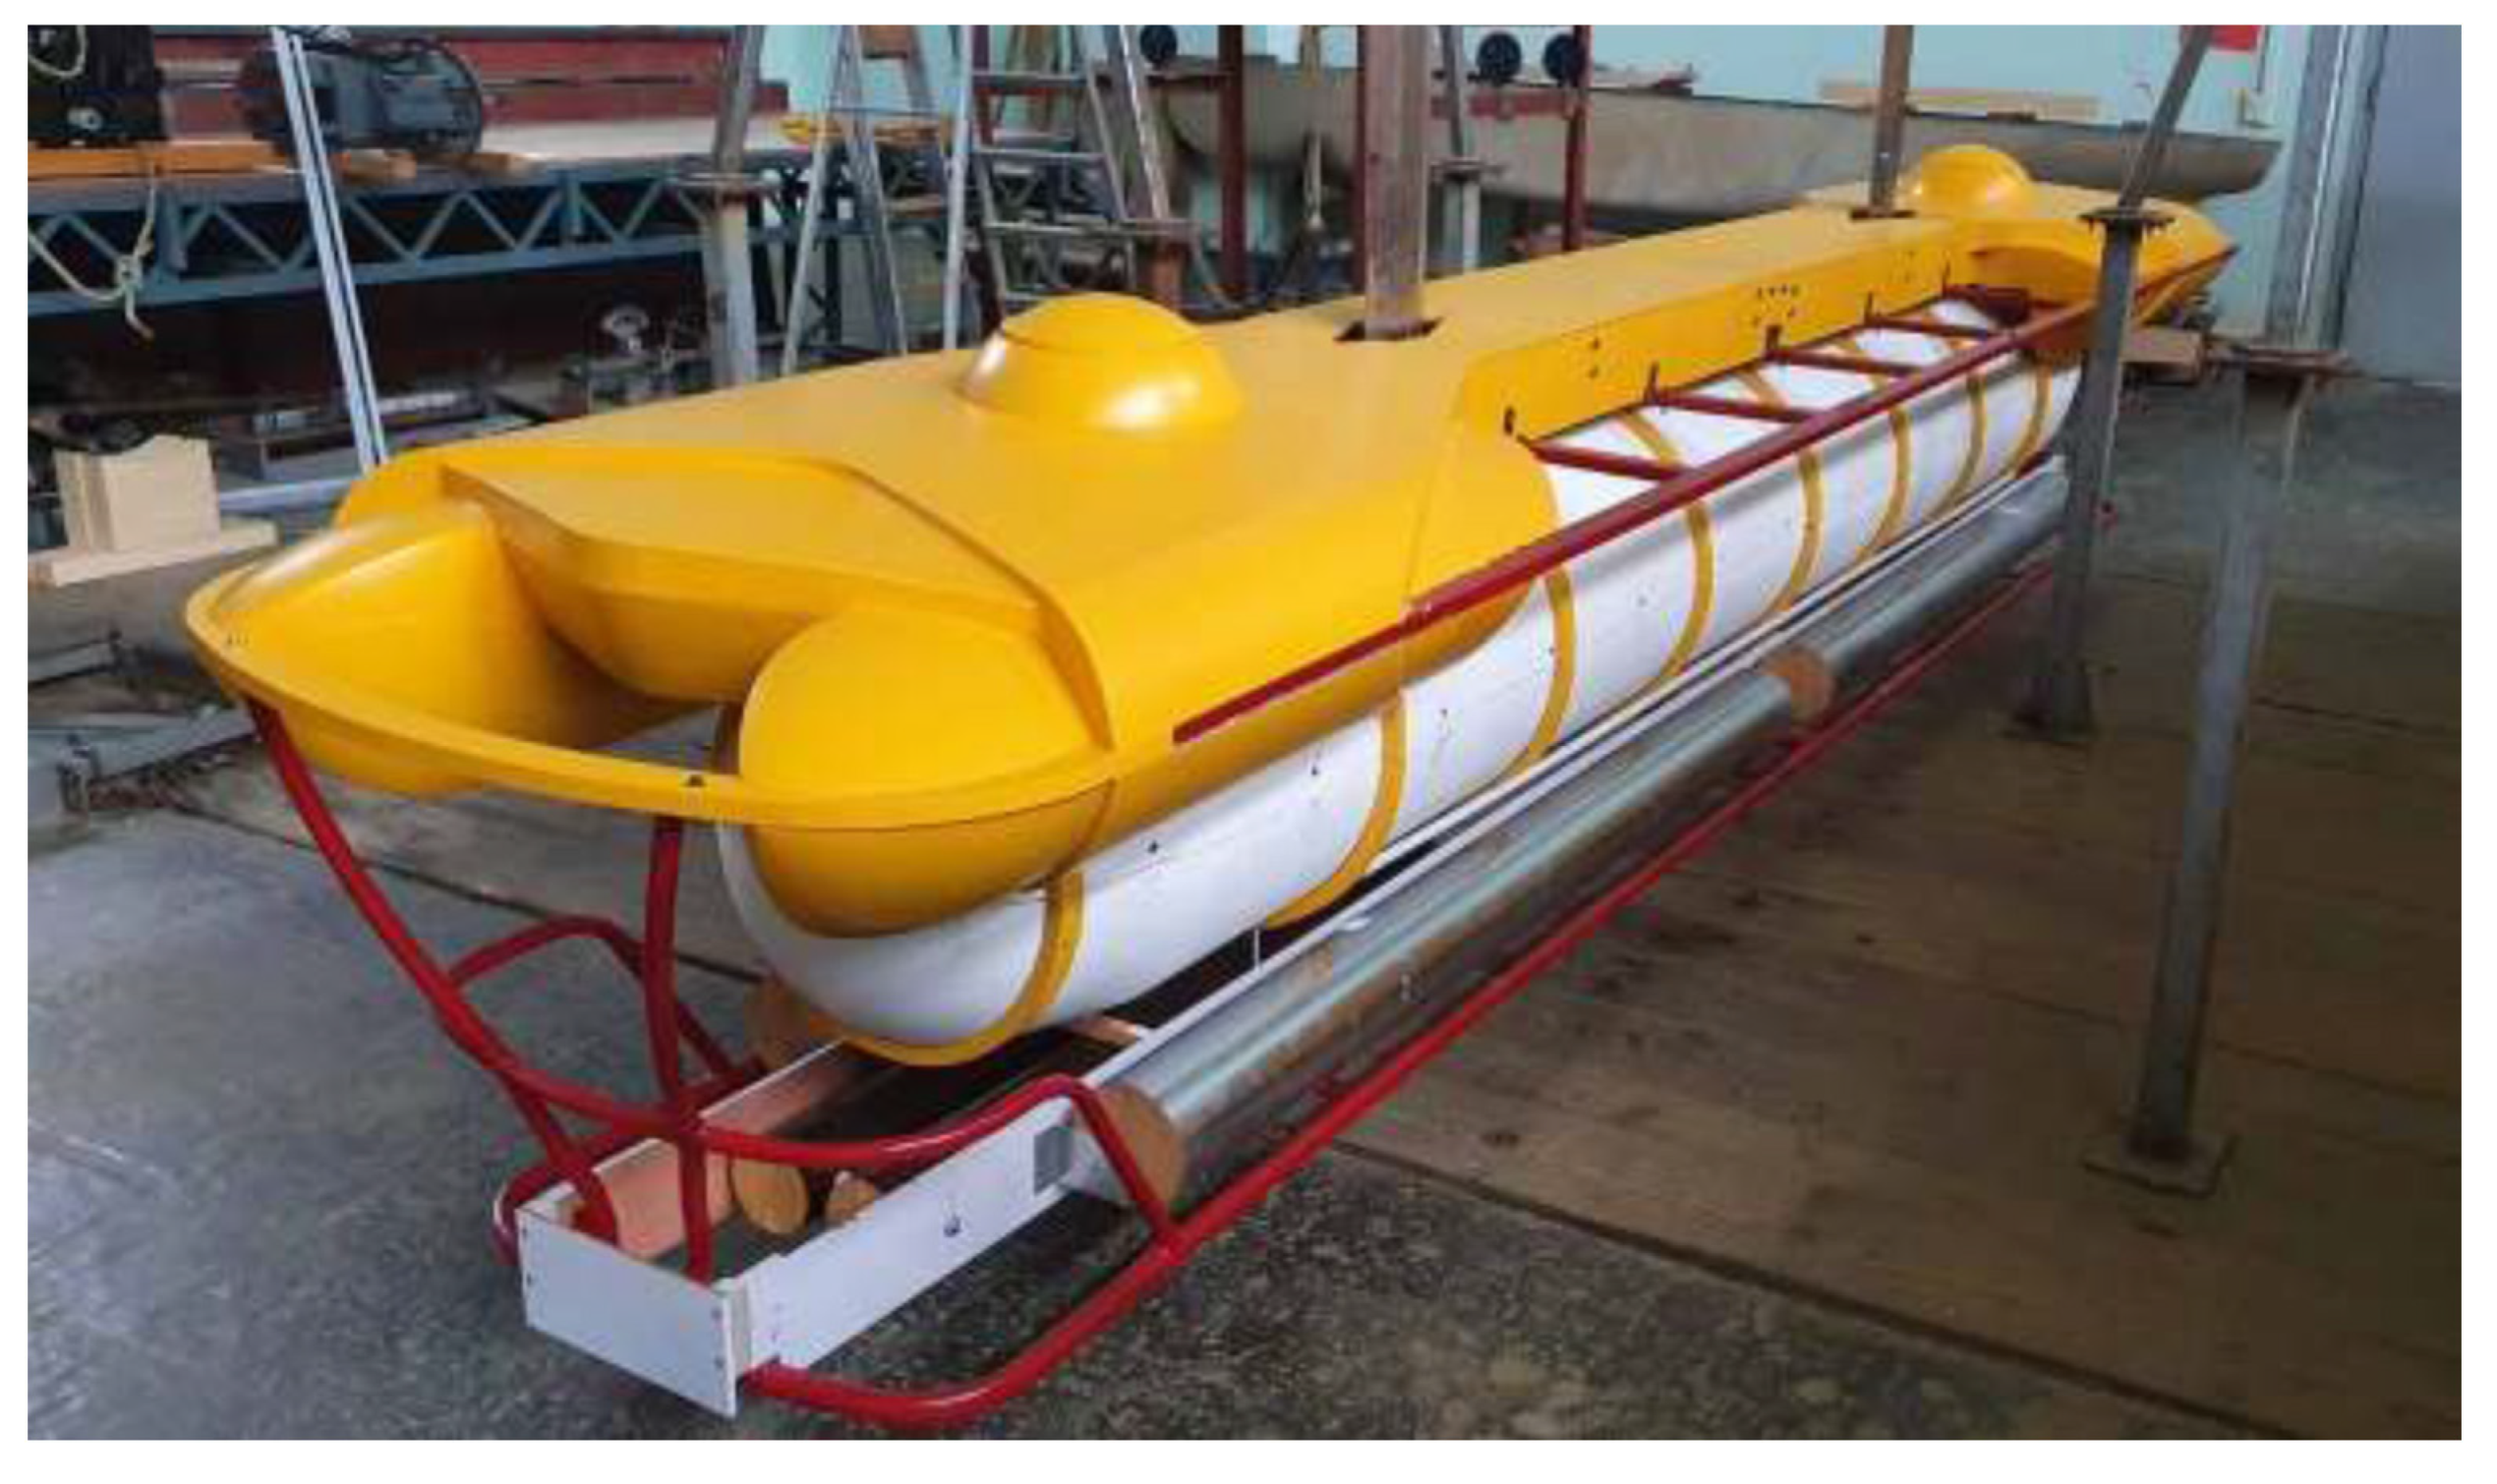
Figure 2.
Bottom view of the submarine model (lower half of the pressure hull, battery pods, variable ballast tanks, and lower exostructure).
Figure 2.
Bottom view of the submarine model (lower half of the pressure hull, battery pods, variable ballast tanks, and lower exostructure).

Figure 3.
Submarine model (front ISO view) completed for tests in deep water.

Figure 4.
Submarine model mounted on sabre-shaped girders and installed under the carriage for resistance tests in deepwater conditions.
Figure 4.
Submarine model mounted on sabre-shaped girders and installed under the carriage for resistance tests in deepwater conditions.

Figure 5.
Setting for the surface resistance test in calm water (cylindrical girders installed).

Figure 6.
Towing test in calm water.

Figure 7.
Seakeeping test in beam seas.

Figure 8.
Sketch of typical setting for the open water test.

Figure 9.
Propeller in the nozzle (left); setting of the equipment (middle); and open water test (right).
Figure 9.
Propeller in the nozzle (left); setting of the equipment (middle); and open water test (right).

Figure 10.
The geometry of the pressure hull and exostructure used in the CFD simulation (top). Sliced view of the discretised surface geometry of the submarine (bottom) [15].
Figure 10.
The geometry of the pressure hull and exostructure used in the CFD simulation (top). Sliced view of the discretised surface geometry of the submarine (bottom) [15].

Figure 11.
Resistance and effective power in infinitely deep water.

Figure 12.
Resistance and effective power at a calm free surface.

Figure 13.
Open water propeller diagram.

Figure 14.
Friction force coefficient, cf, and viscous (pressure) force coefficient, cv, for submarine in deep water plotted against submarine speed.
Figure 14.
Friction force coefficient, cf, and viscous (pressure) force coefficient, cv, for submarine in deep water plotted against submarine speed.

Figure 15.
Friction force coefficient, cf, and residual force coefficient, cv, for submarine in calm surface conditions plotted against submarine speed.
Figure 15.
Friction force coefficient, cf, and residual force coefficient, cv, for submarine in calm surface conditions plotted against submarine speed.


Table 1.
The particulars of the tourist submarine.
| Feature | Value |
|---|---|
| Length overall | 25.09 m |
| Beam | 4.750 m |
| Draft | 3.420 m |
| Dry weight | 155 tons |
| Hull acrylic outer diameter | 2.64 m |
| Forward speed (max) | 2.5 knots |
| Passengers | 48 |
| Test depth | 65 m |
Table 2.
The particulars of the towing tank.
| Feature | Value |
|---|---|
| Length | 276 m |
| Breadth | 12.5 m |
| Water depth | 6 m |
| Max carriage speed | 14 m/s |
Table 3.
The particulars of the main thrusters for propelling the vessel.
| Feature | Value |
|---|---|
| Power | P = 35 kW |
| Diameter | D = 0.75 m |
| Pitch/diameter ratio | P0.7R/D = 0.75 * |
| Area ratio | AE/A0 = 0.65 |
| Open water efficiency | app. 0.35 ** |
| Achievable thrust | app. 7.6 kN *** |
| Nozzle type | 19A |
| Propeller type | Kaplan |
| Number of blades | Z = 4 |
* expected cca 600 1/min at v = 3 kn; ** for app. 0.2; *** for v = 3 kn.
Disclaimer/Publisher’s Note: The statements, opinions and data contained in all publications are solely those of the individual author(s) and contributor(s) and not of MDPI and/or the editor(s). MDPI and/or the editor(s) disclaim responsibility for any injury to people or property resulting from any ideas, methods, instructions or products referred to in the content. |
© 2023 by the authors. Licensee MDPI, Basel, Switzerland. This article is an open access article distributed under the terms and conditions of the Creative Commons Attribution (CC BY) license (https://creativecommons.org/licenses/by/4.0/).
Share and Cite
MDPI and ACS Style
Parunov, J.; Pedišić-Buča, M.; Gatin, I.; Ćatipović, I. Hydrodynamic Tests of Innovative Tourist Submarine. J. Mar. Sci. Eng. 2023, 11, 1199. https://doi.org/10.3390/jmse11061199
AMA Style
Parunov J, Pedišić-Buča M, Gatin I, Ćatipović I. Hydrodynamic Tests of Innovative Tourist Submarine. Journal of Marine Science and Engineering. 2023; 11(6):1199. https://doi.org/10.3390/jmse11061199
Chicago/Turabian StyleParunov, Joško, Marta Pedišić-Buča, Inno Gatin, and Ivan Ćatipović. 2023. "Hydrodynamic Tests of Innovative Tourist Submarine" Journal of Marine Science and Engineering 11, no. 6: 1199. https://doi.org/10.3390/jmse11061199
Note that from the first issue of 2016, this journal uses article numbers instead of page numbers. See further details here.