

Desalination Plant for Irrigation Purposes Driven by an Inland Floating Photovoltaic System

Abstract
:1. Introduction
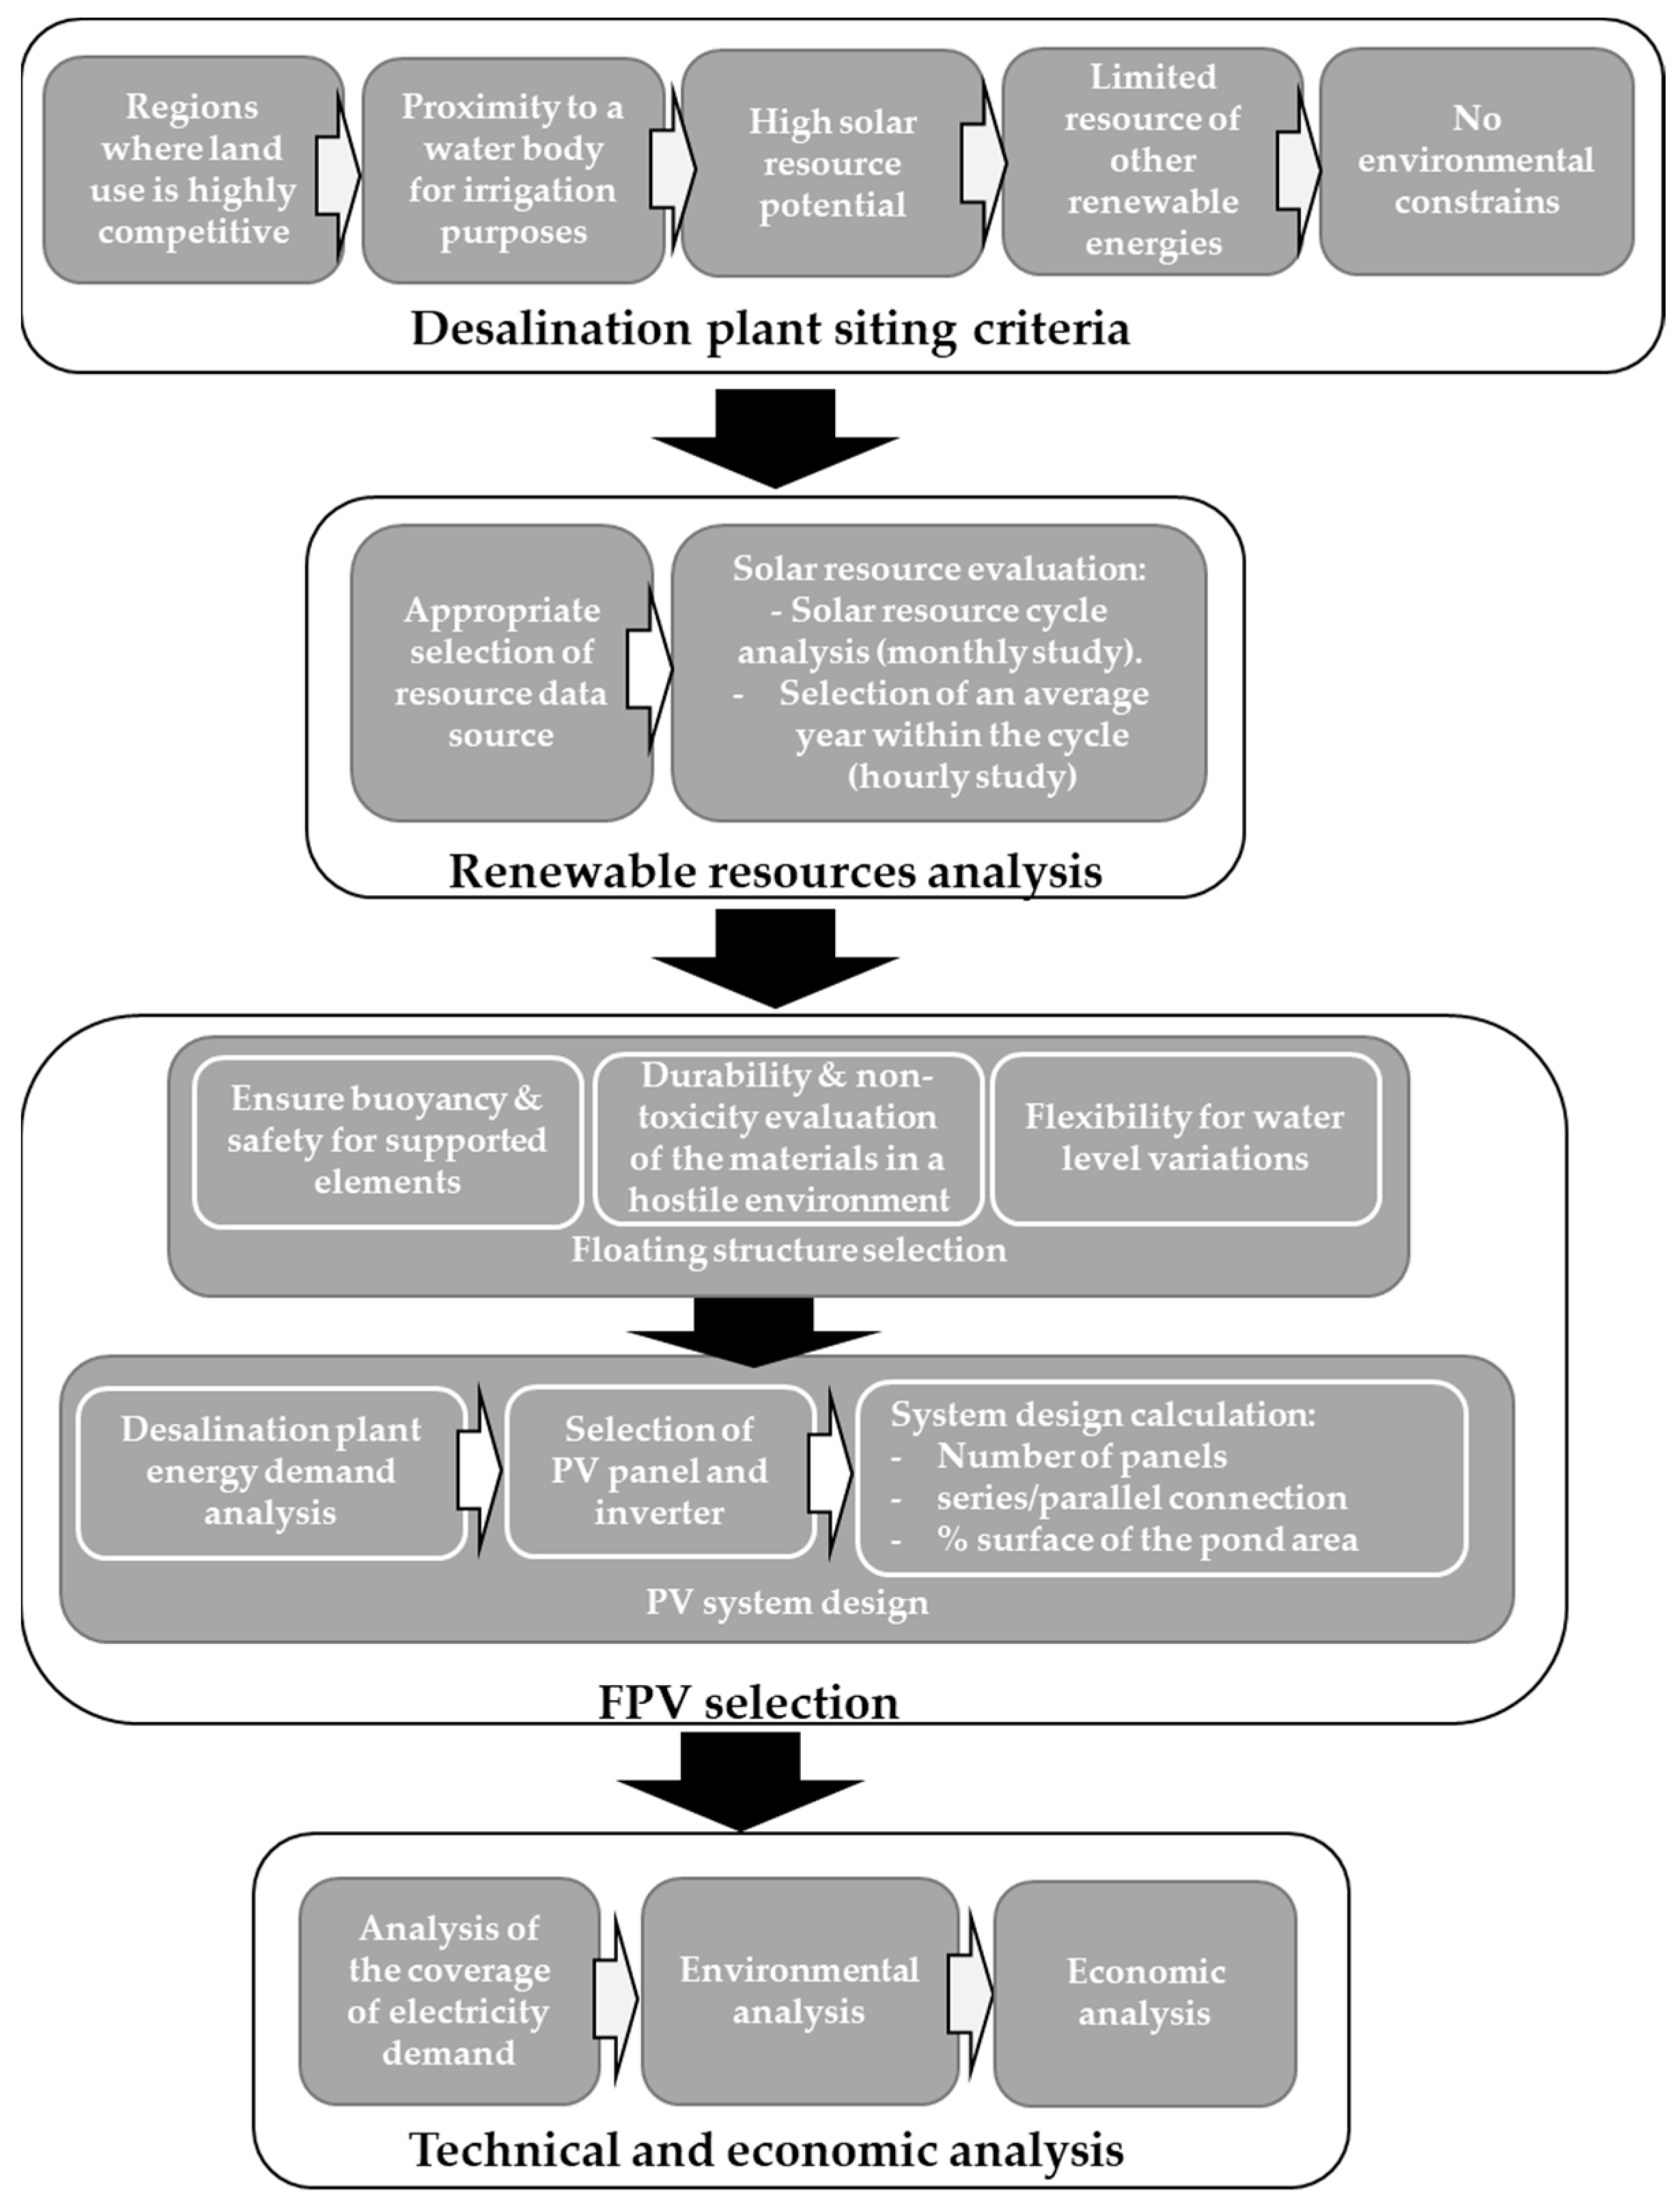
2. Materials and Methods
2.1. Suitability Identification for Supplying a Desalination Plant Using FPV
2.2. Renewable Resources Analysis
2.3. FPV Selection
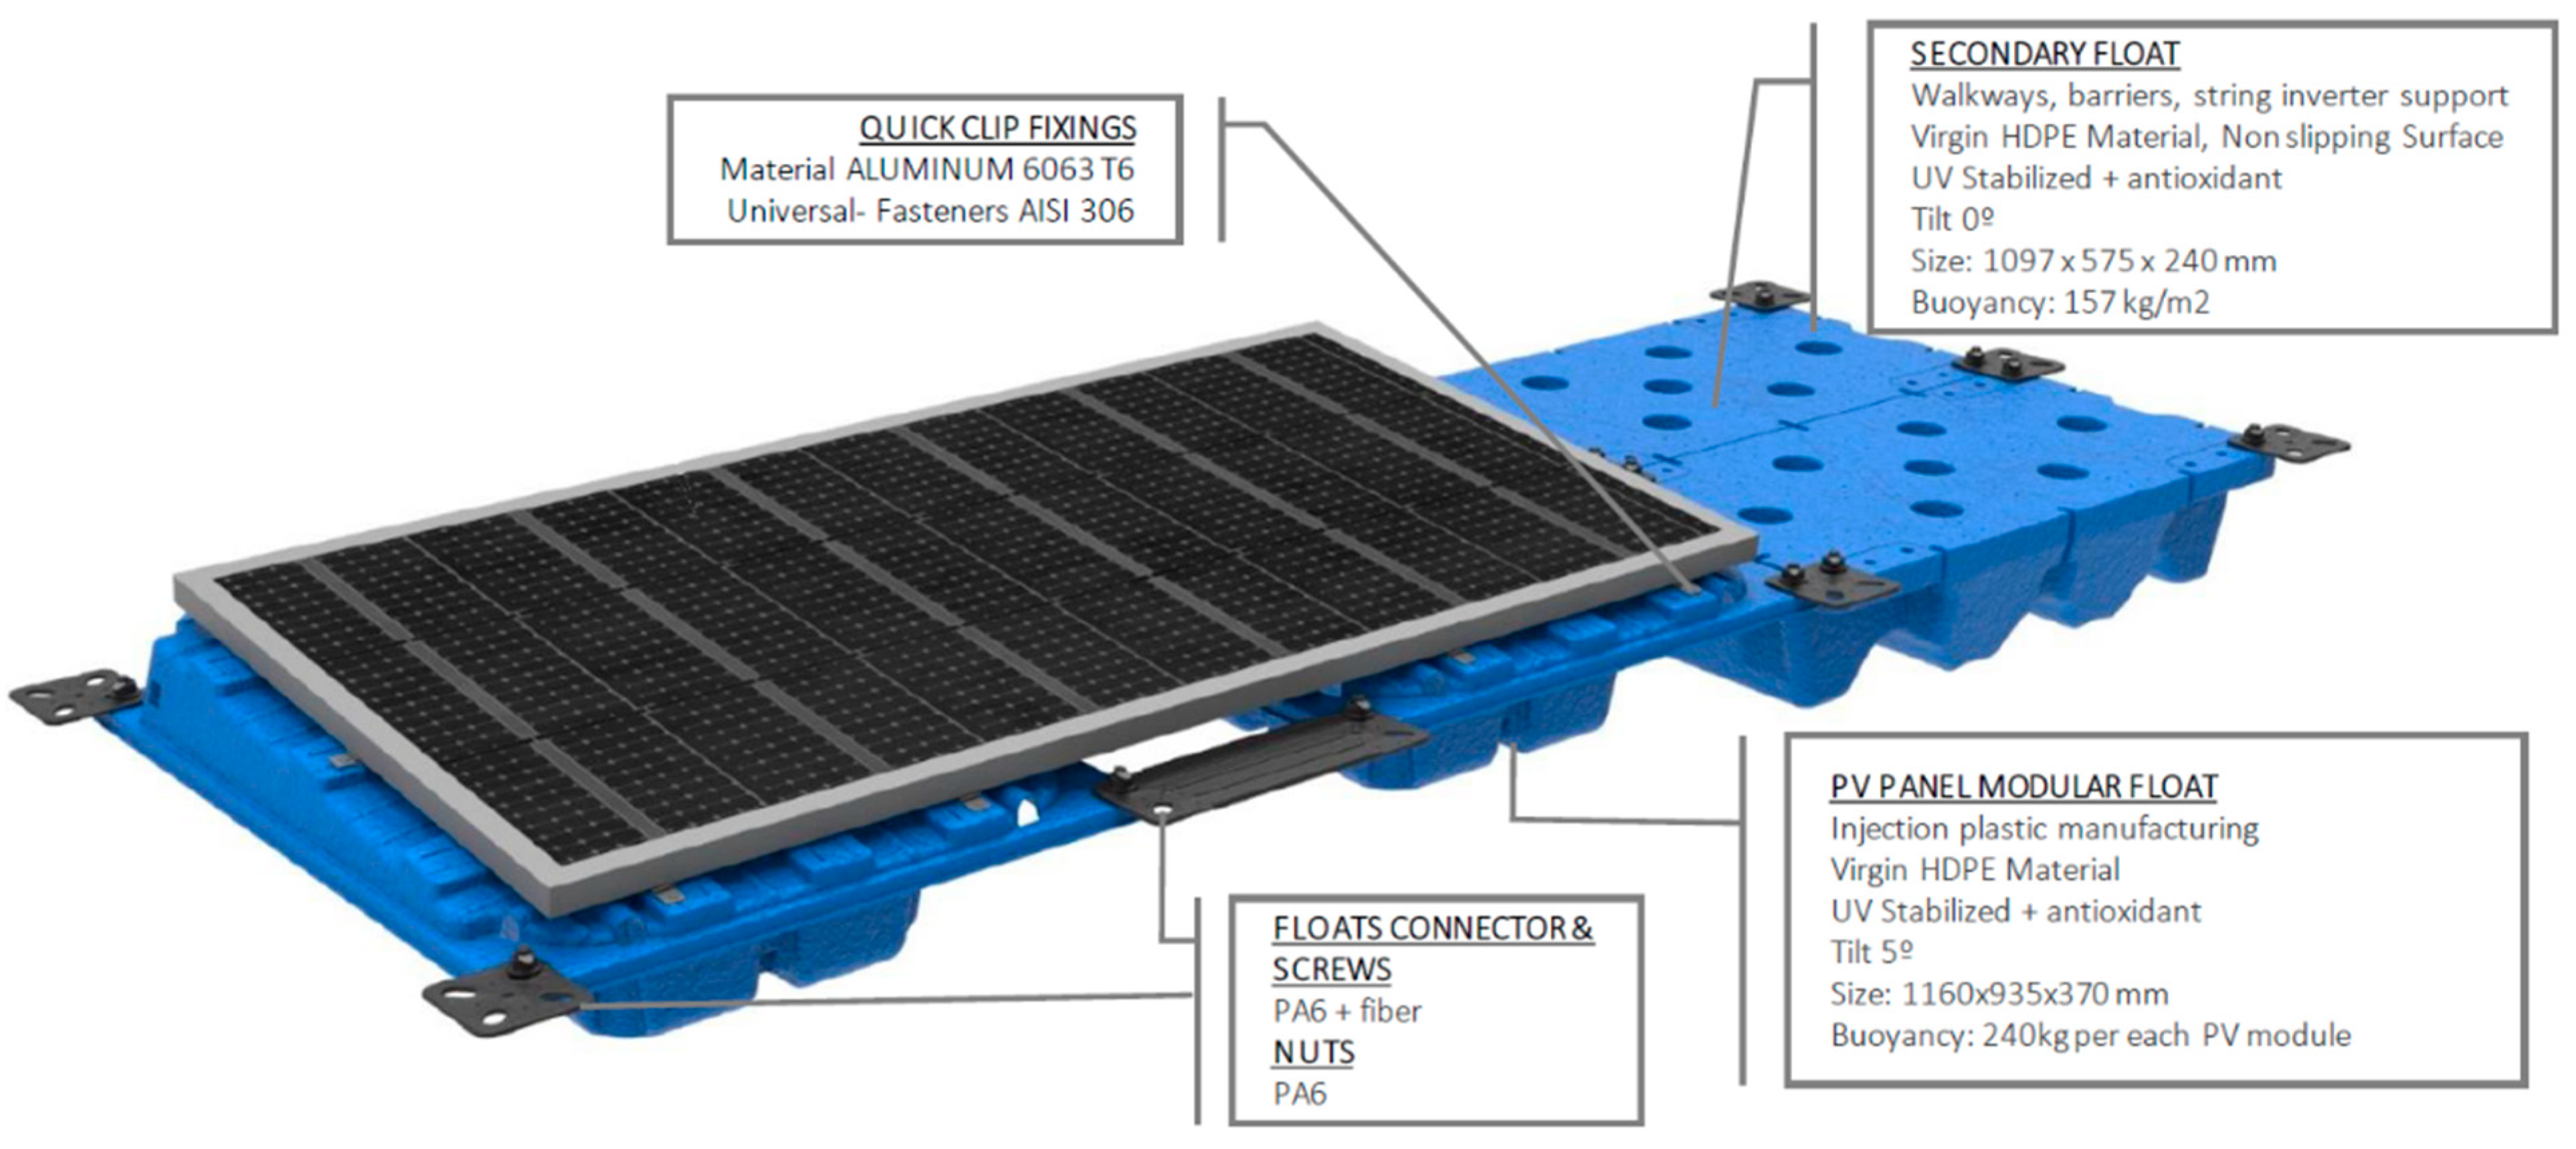
2.3.1. Floating Structure
2.3.2. PV System Design
- Pinstalled: peak power required to be installed in the PV system (kWp)
- Edemand: energy demand to be supplied (kWh)
- PR: Installation performance ratio (%)
- Radiation: average monthly solar radiation (kWh/m2).
- RT (%): power loss thermal coefficient provided by the manufacturer
- γ: thermal coefficient of power loss, (γ = −0.352%/°CC), provided by the panel manufacturer in its data sheet
- Tcell (°C): working temperature of the solar cell
- Ta (°C): air temperature
- NOCT: nominal operating cell temperature
- S: average daily insolation (W/m2).
- Maximum power point (MPP) search voltage range. Working outside this range does not damage the equipment, but it can cause energy losses;
- Maximum input voltage to the inverter;
- Maximum input current to the inverter.
2.4. Analysis of the Coverage of Electricity Demand
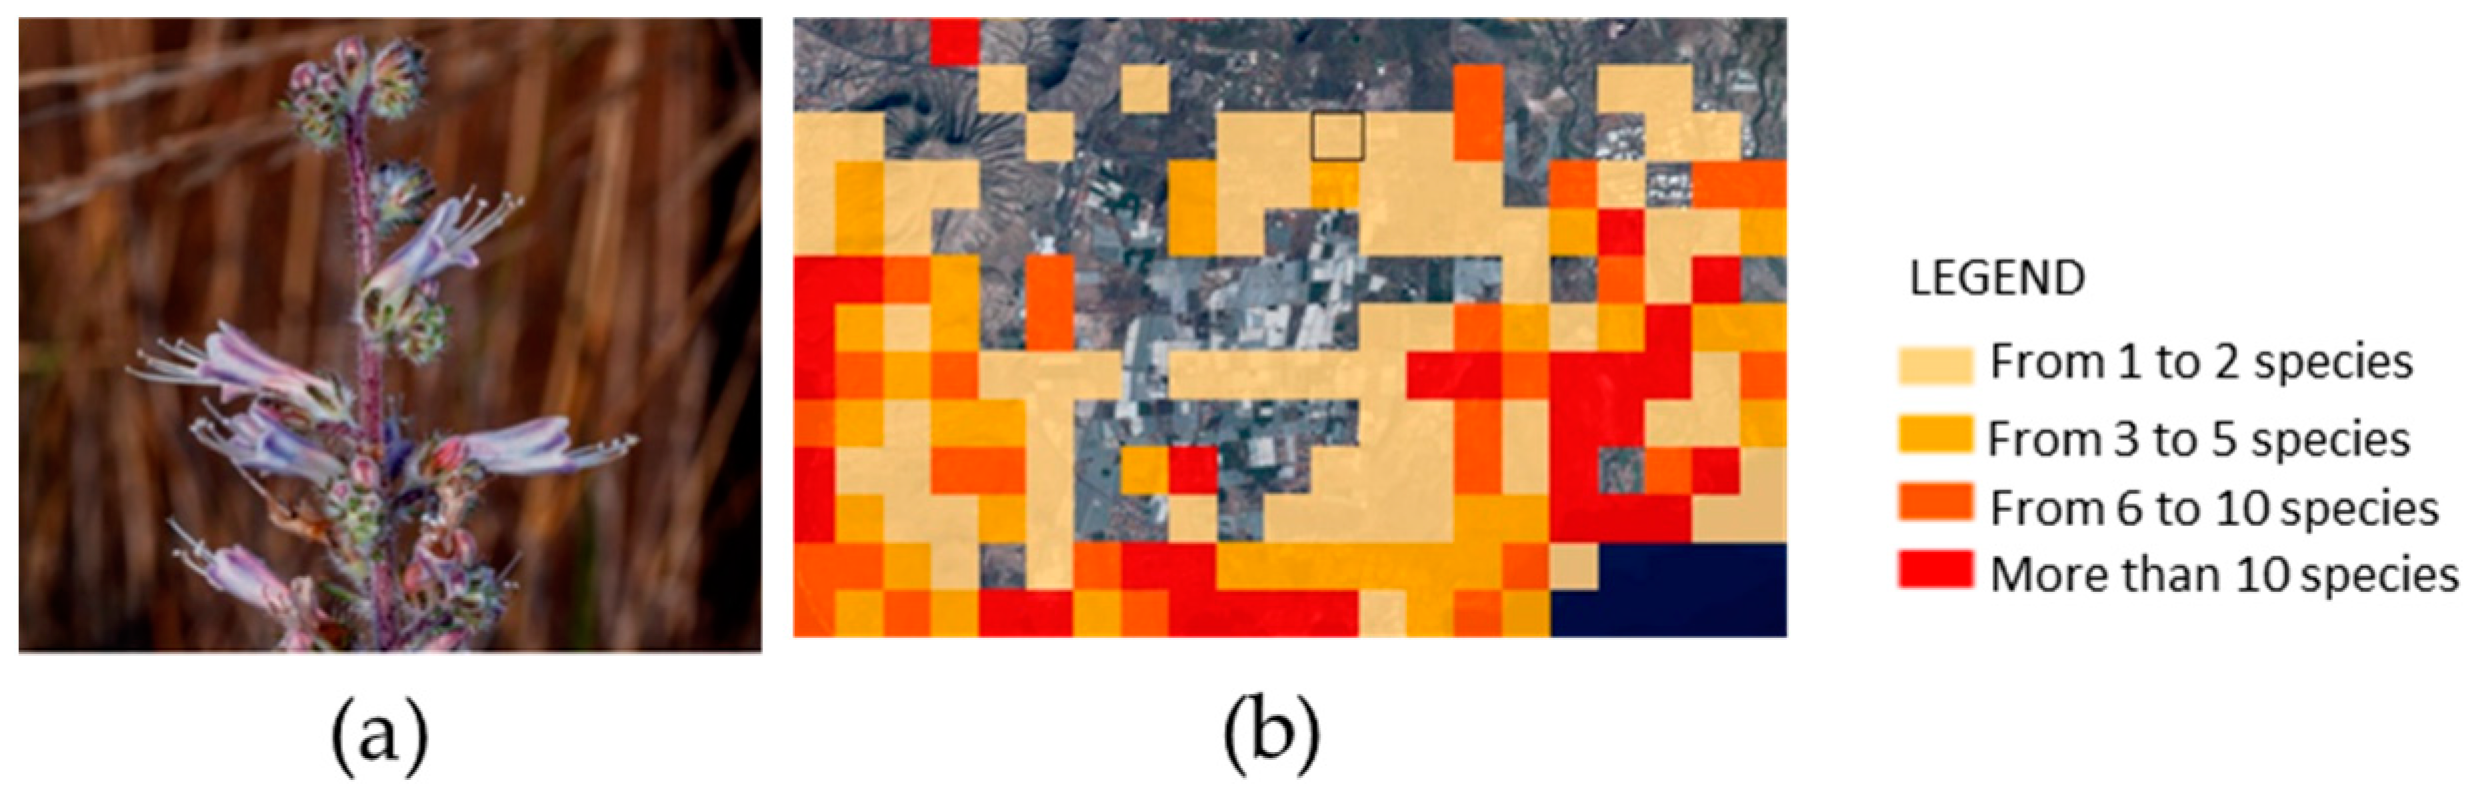
2.5. Environmental and Economic Aspects
- E: estimated annual evaporation in the water body (m3)
- S: pond surface (m2)
- Kp: dimensionless coefficient based on pond geometry and local climatic conditions
- Ep: annual evapotranspiration (mm/year) at the pond location.
- tCO2: carbon dioxide emissions amount (kg)
- E: electricity generated (kWh)
- kCO2: emission coefficient (kgCO2/kWh) specific to the Canary Islands (0.776).
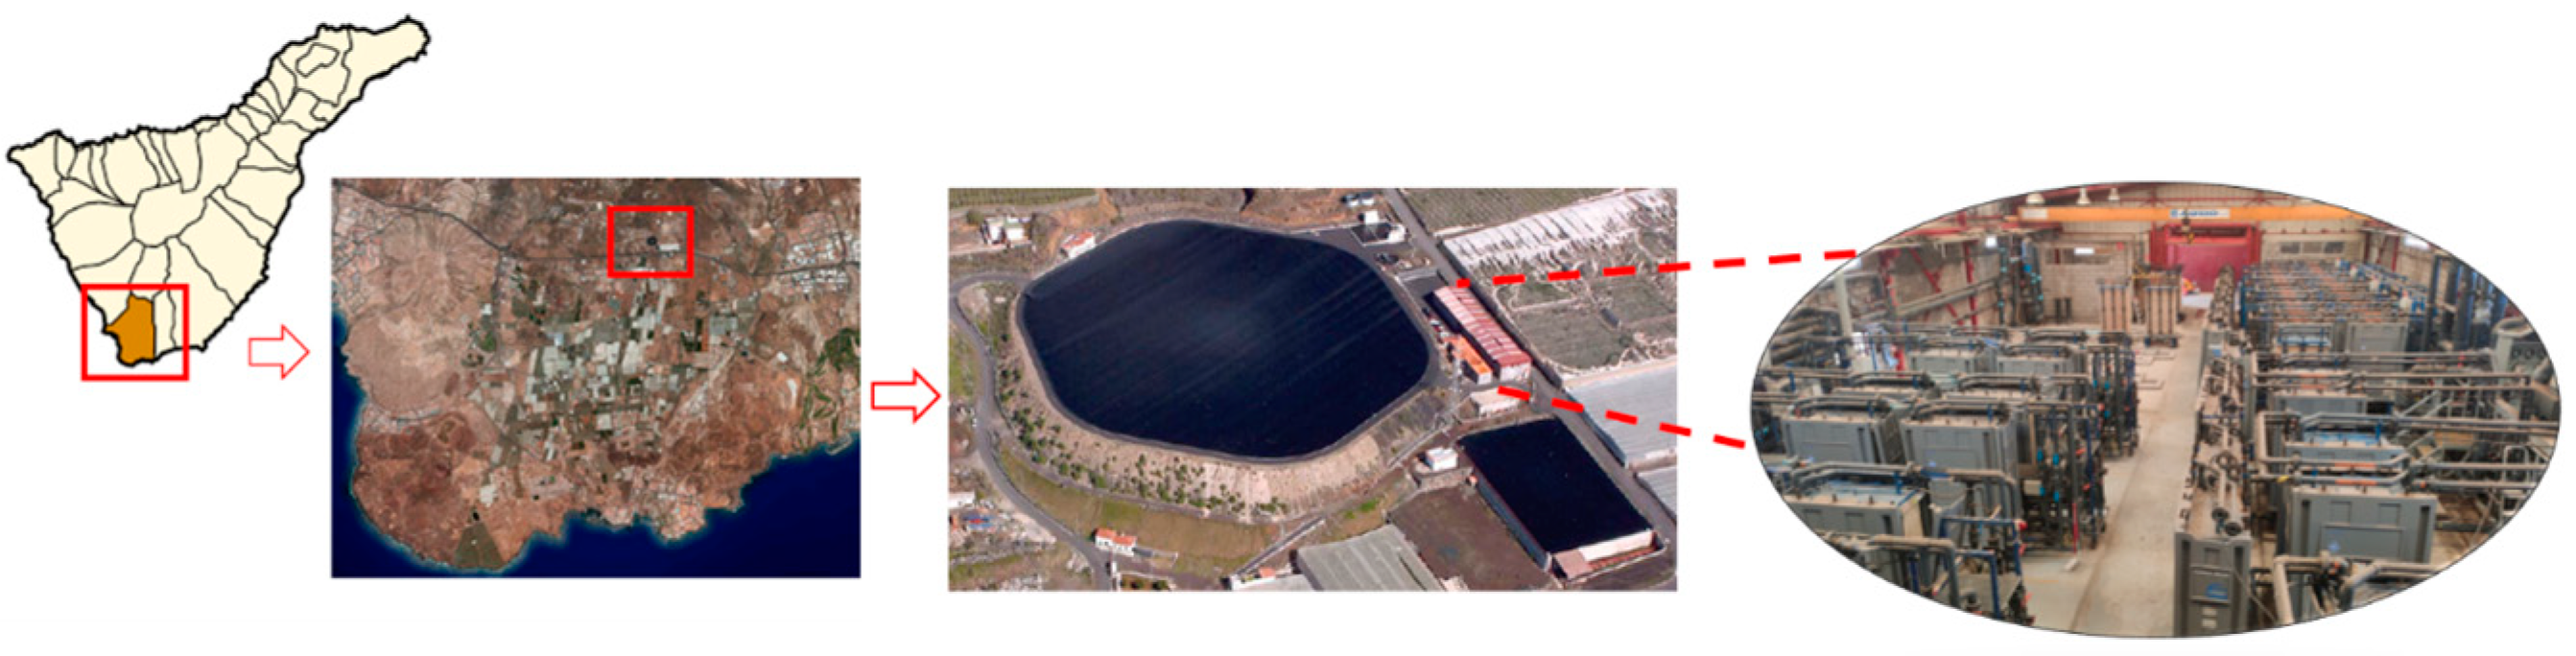
3. Practical Case Study
3.1. Desalination Plant Site Selection: Valle de San Lorenzo EDR Brackish Water Desalination Plant
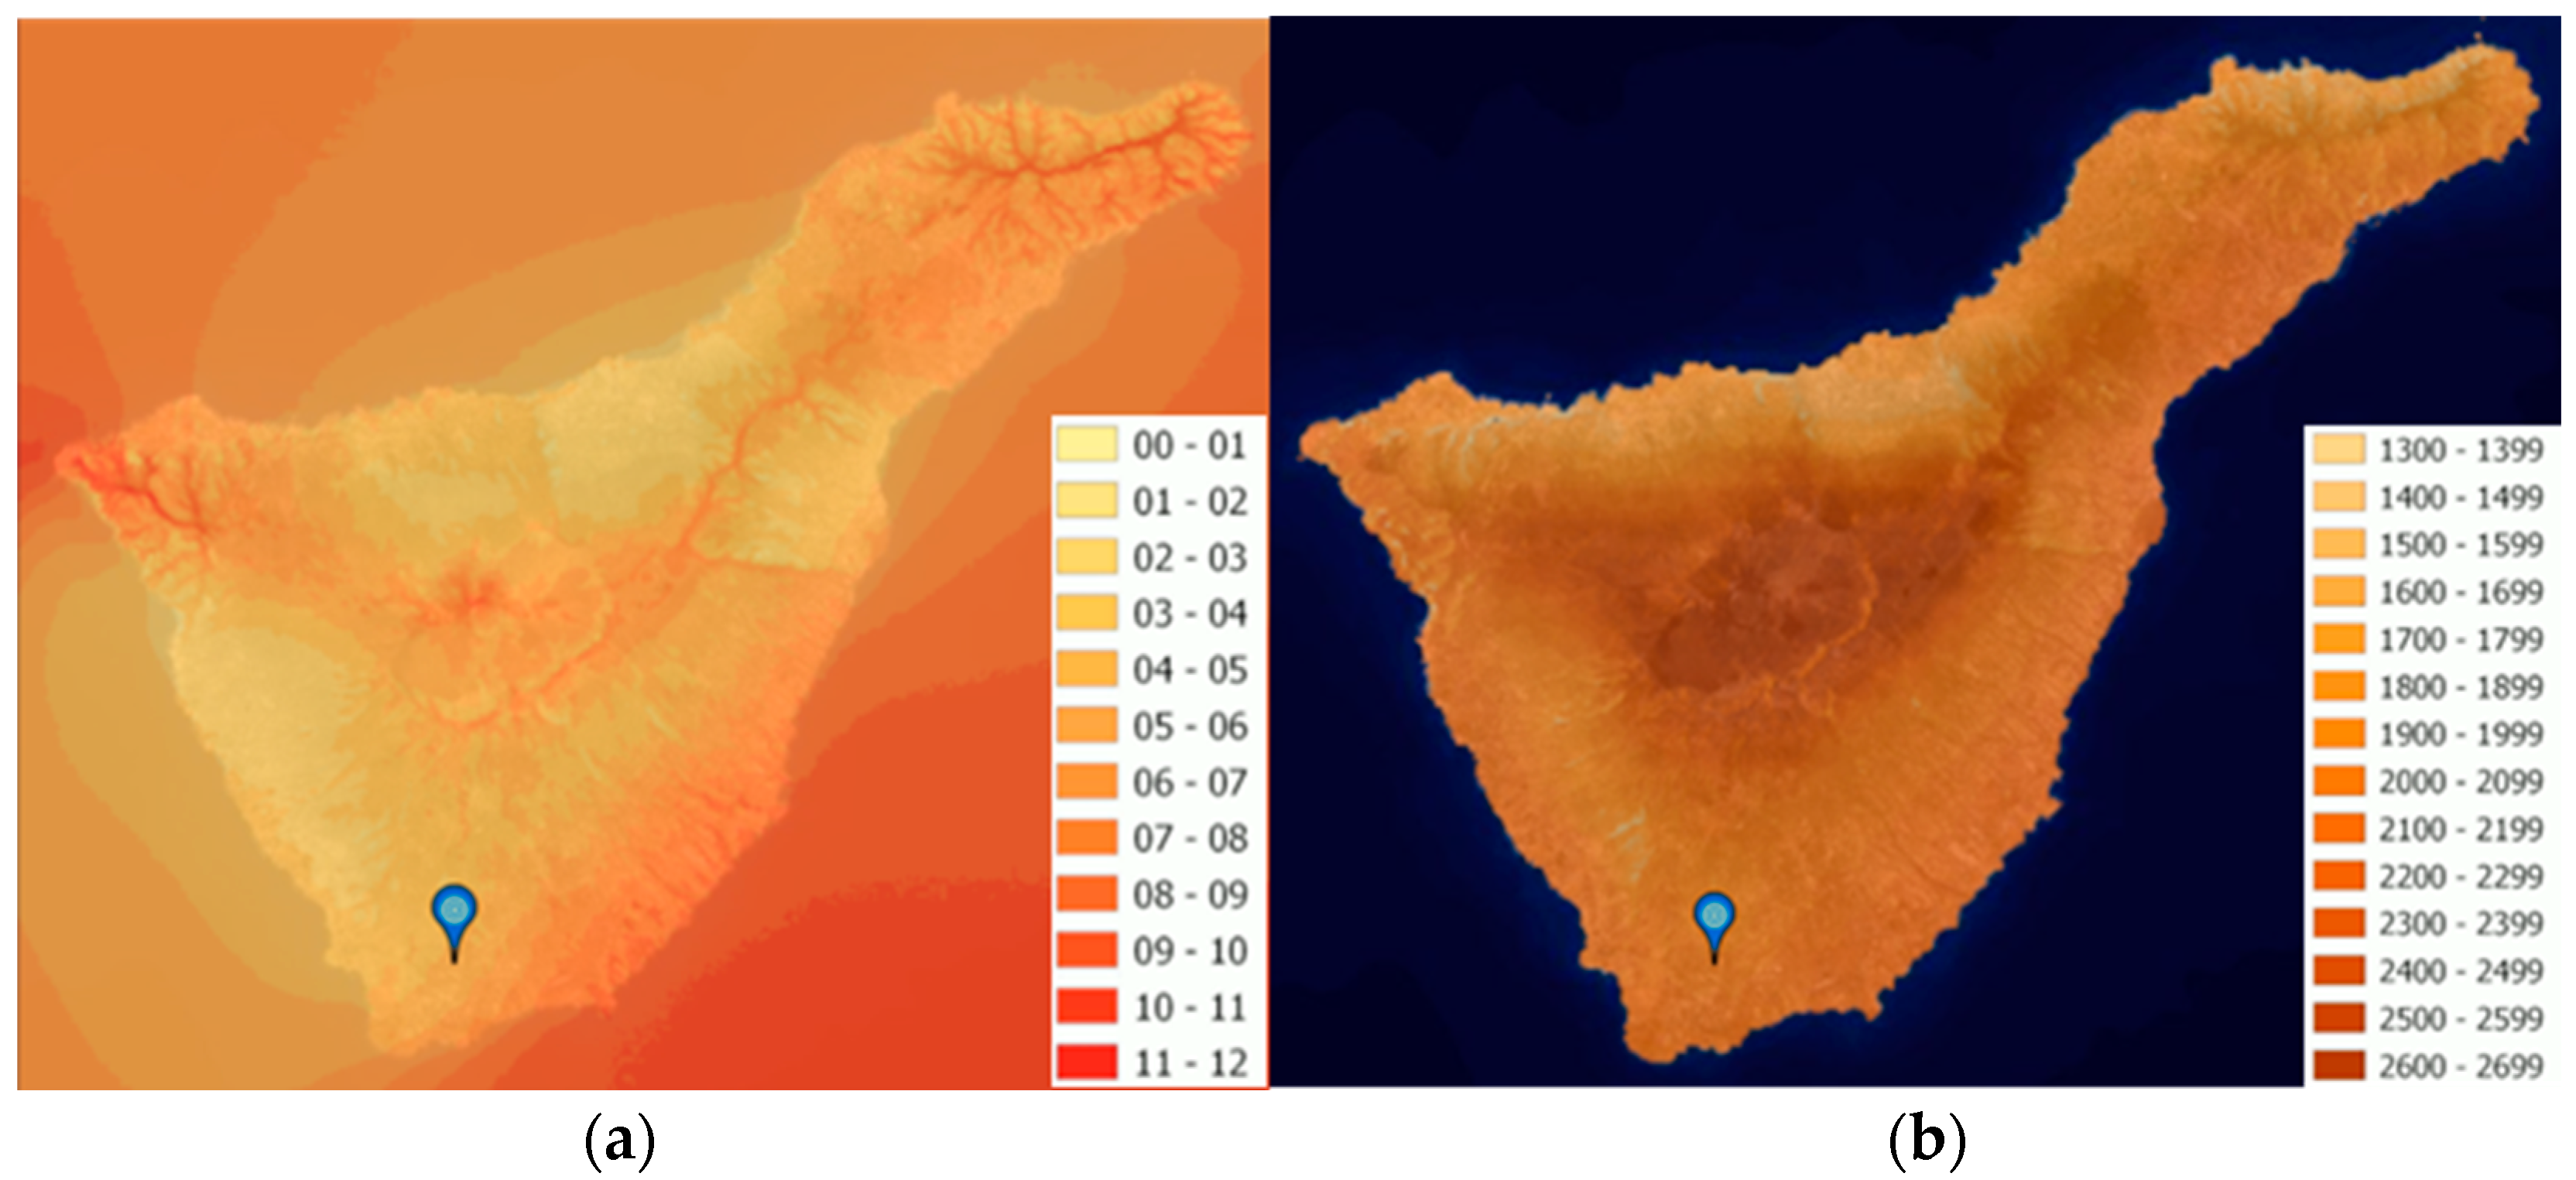
3.2. Solar Resource Analysis
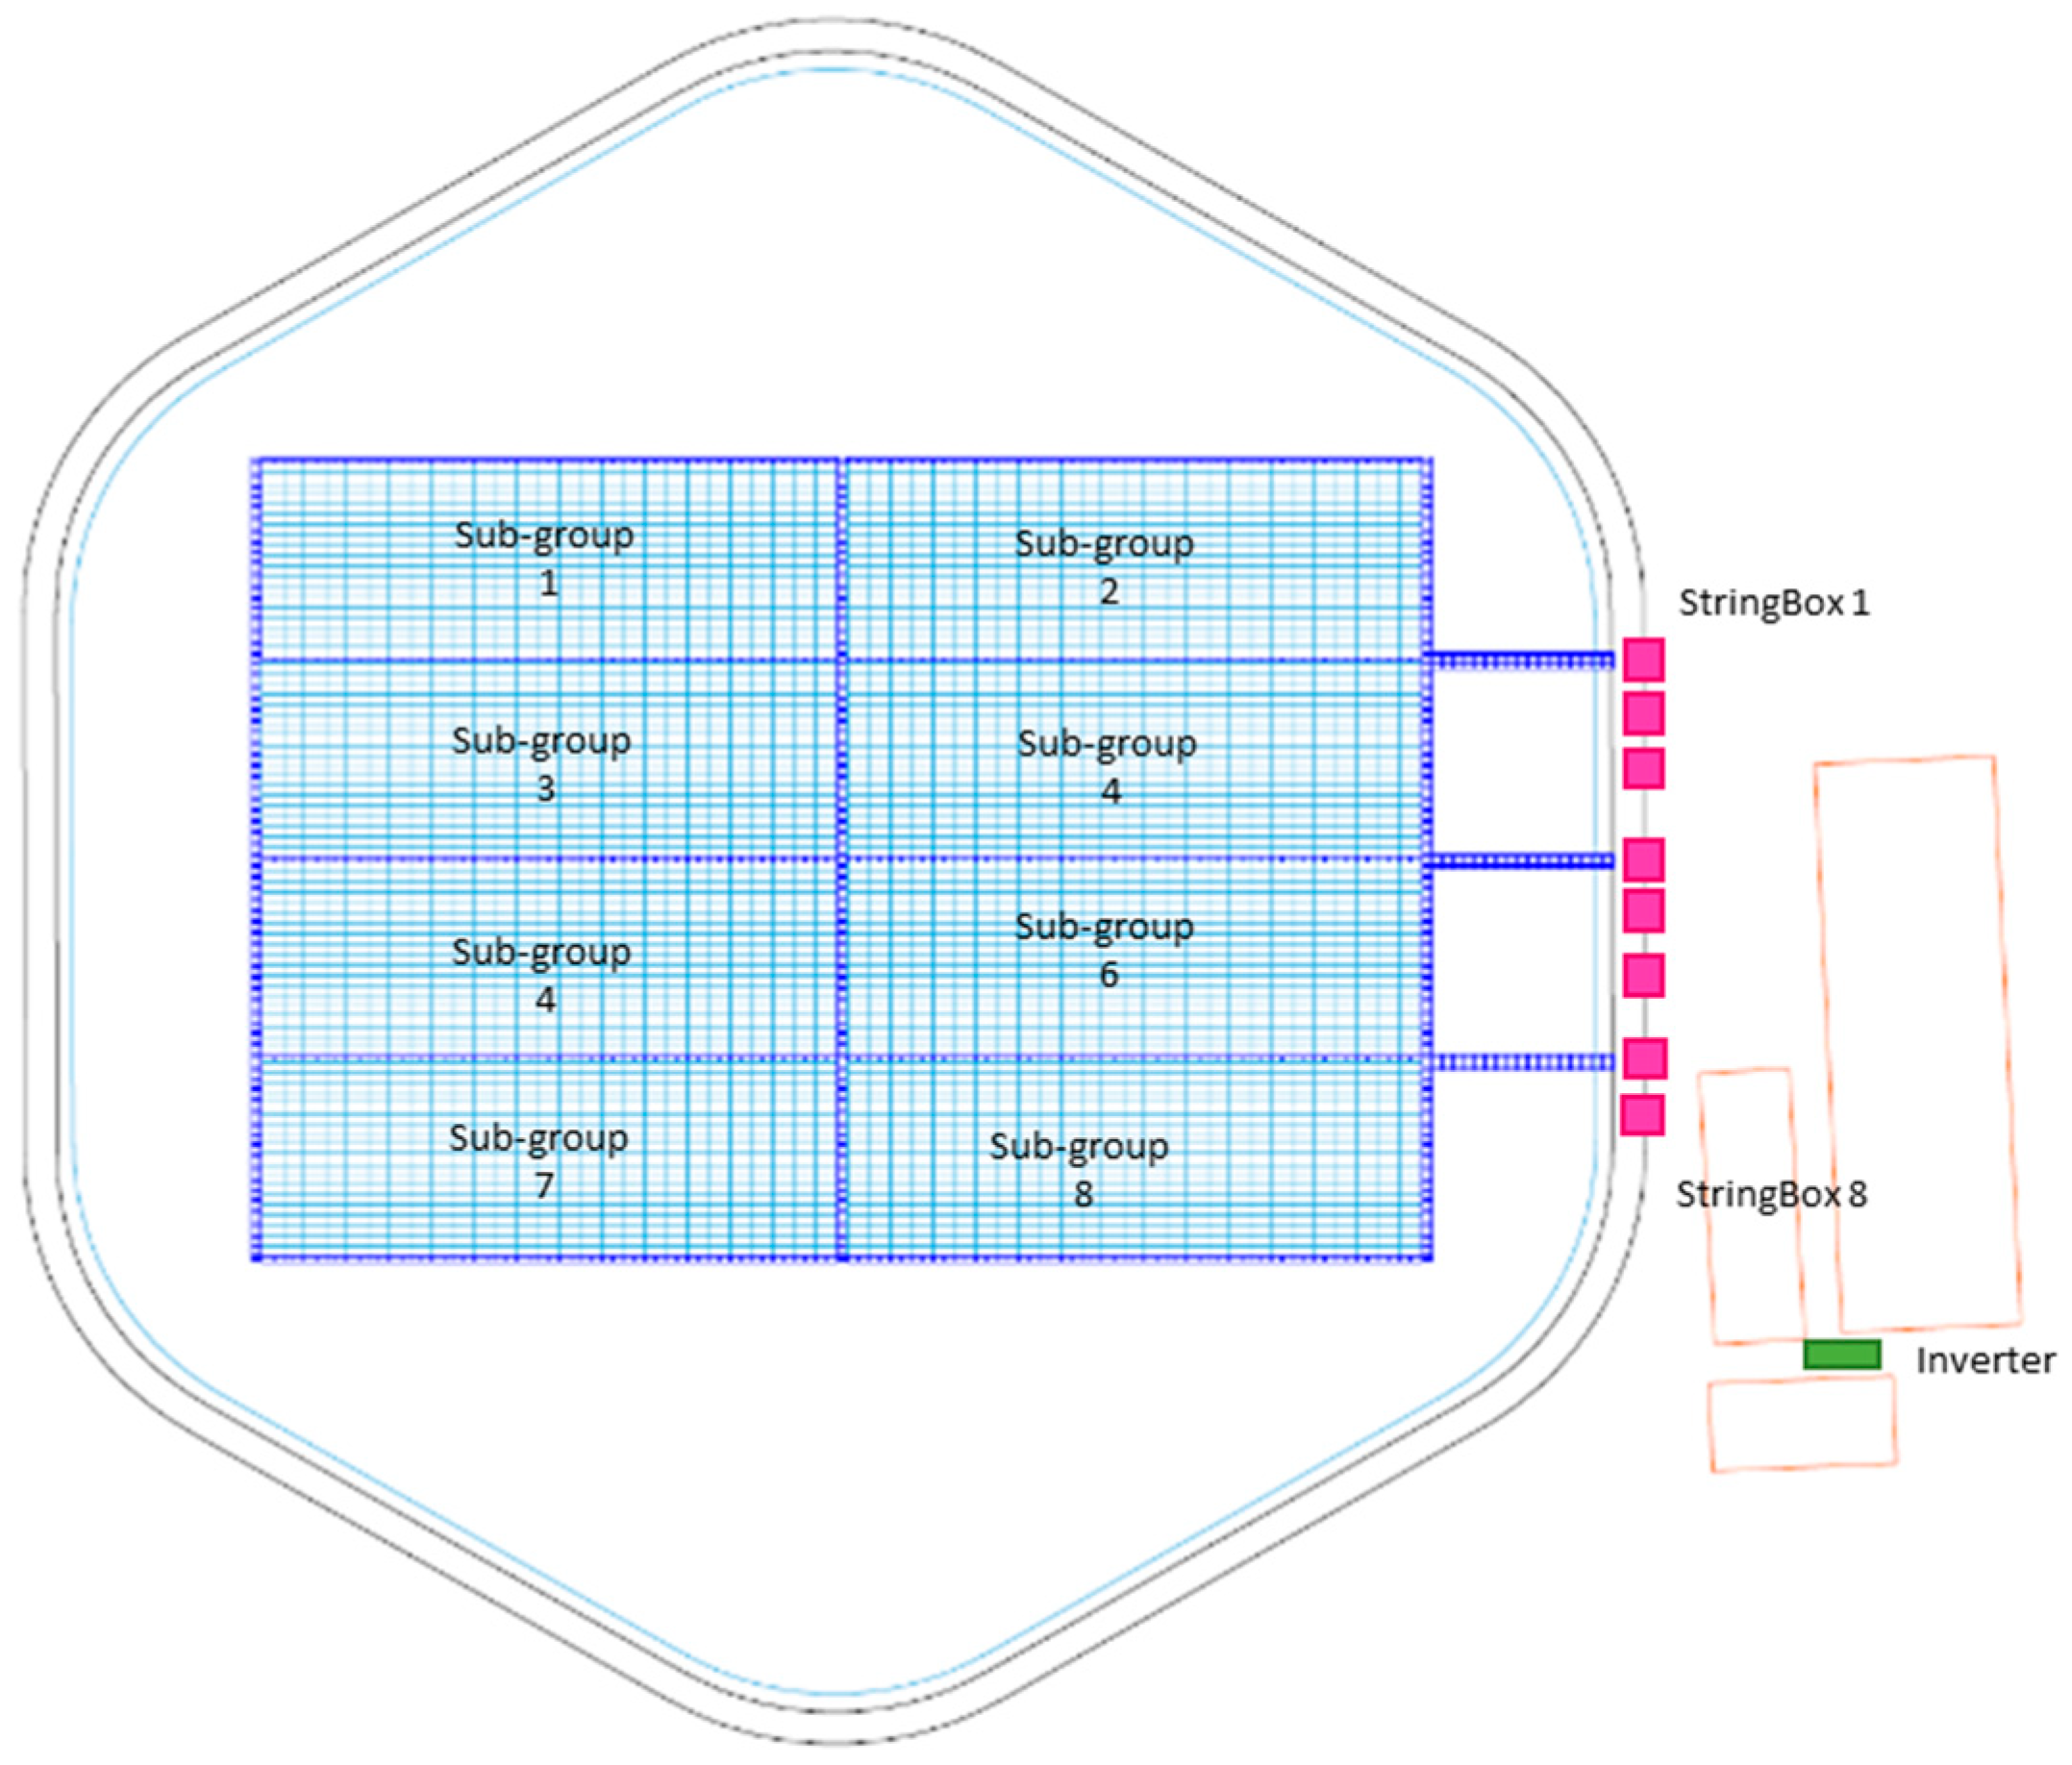
3.3. FPV Selection and Configuration Design
Configuration Design
4. Results
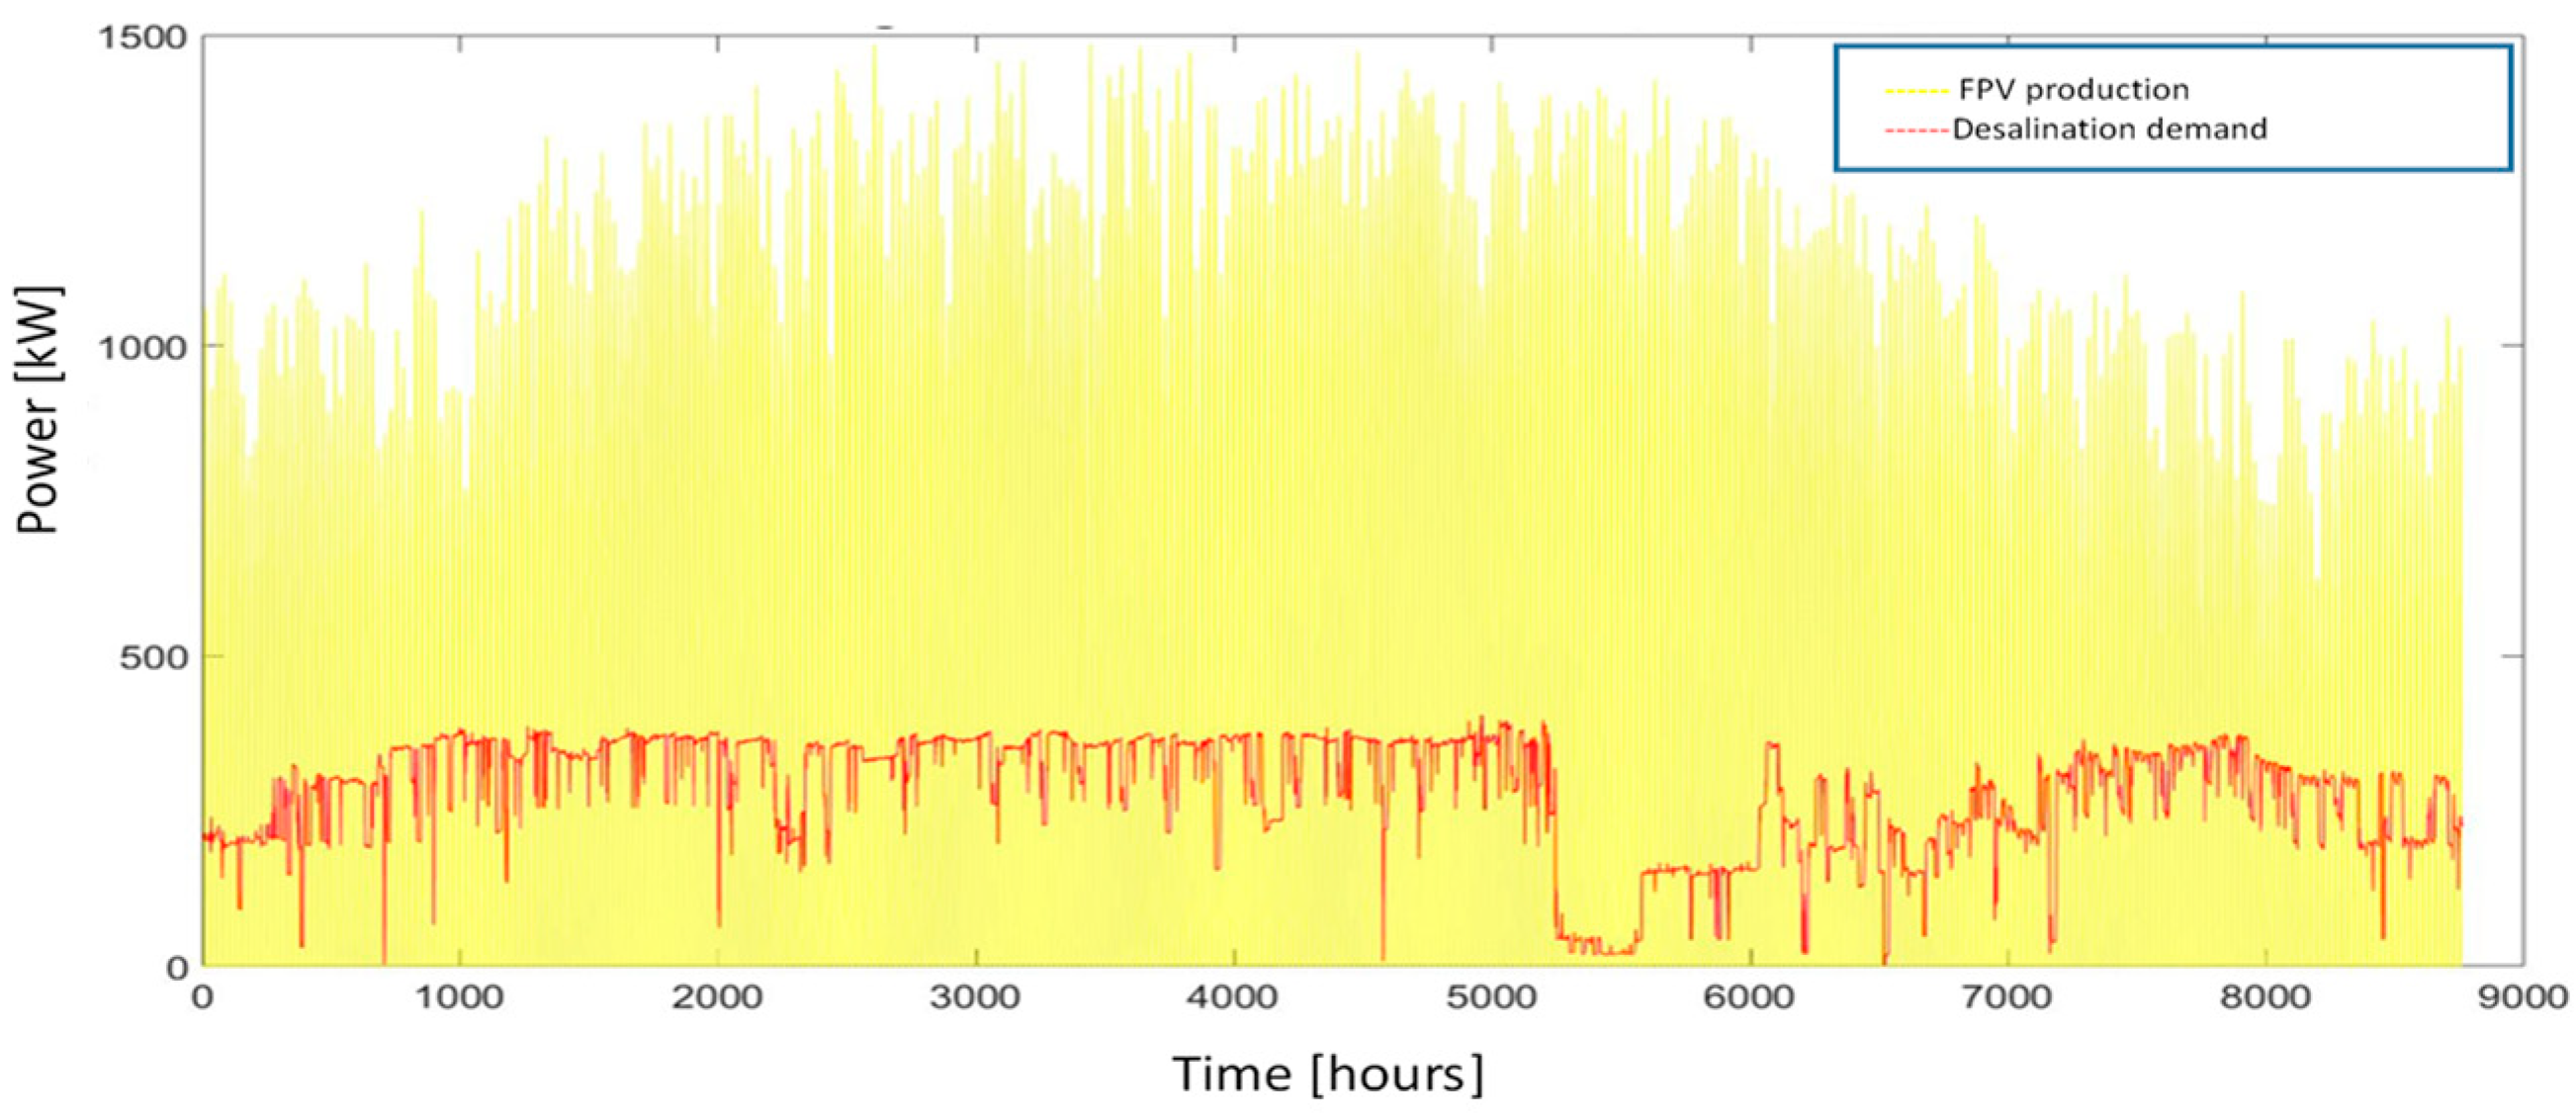
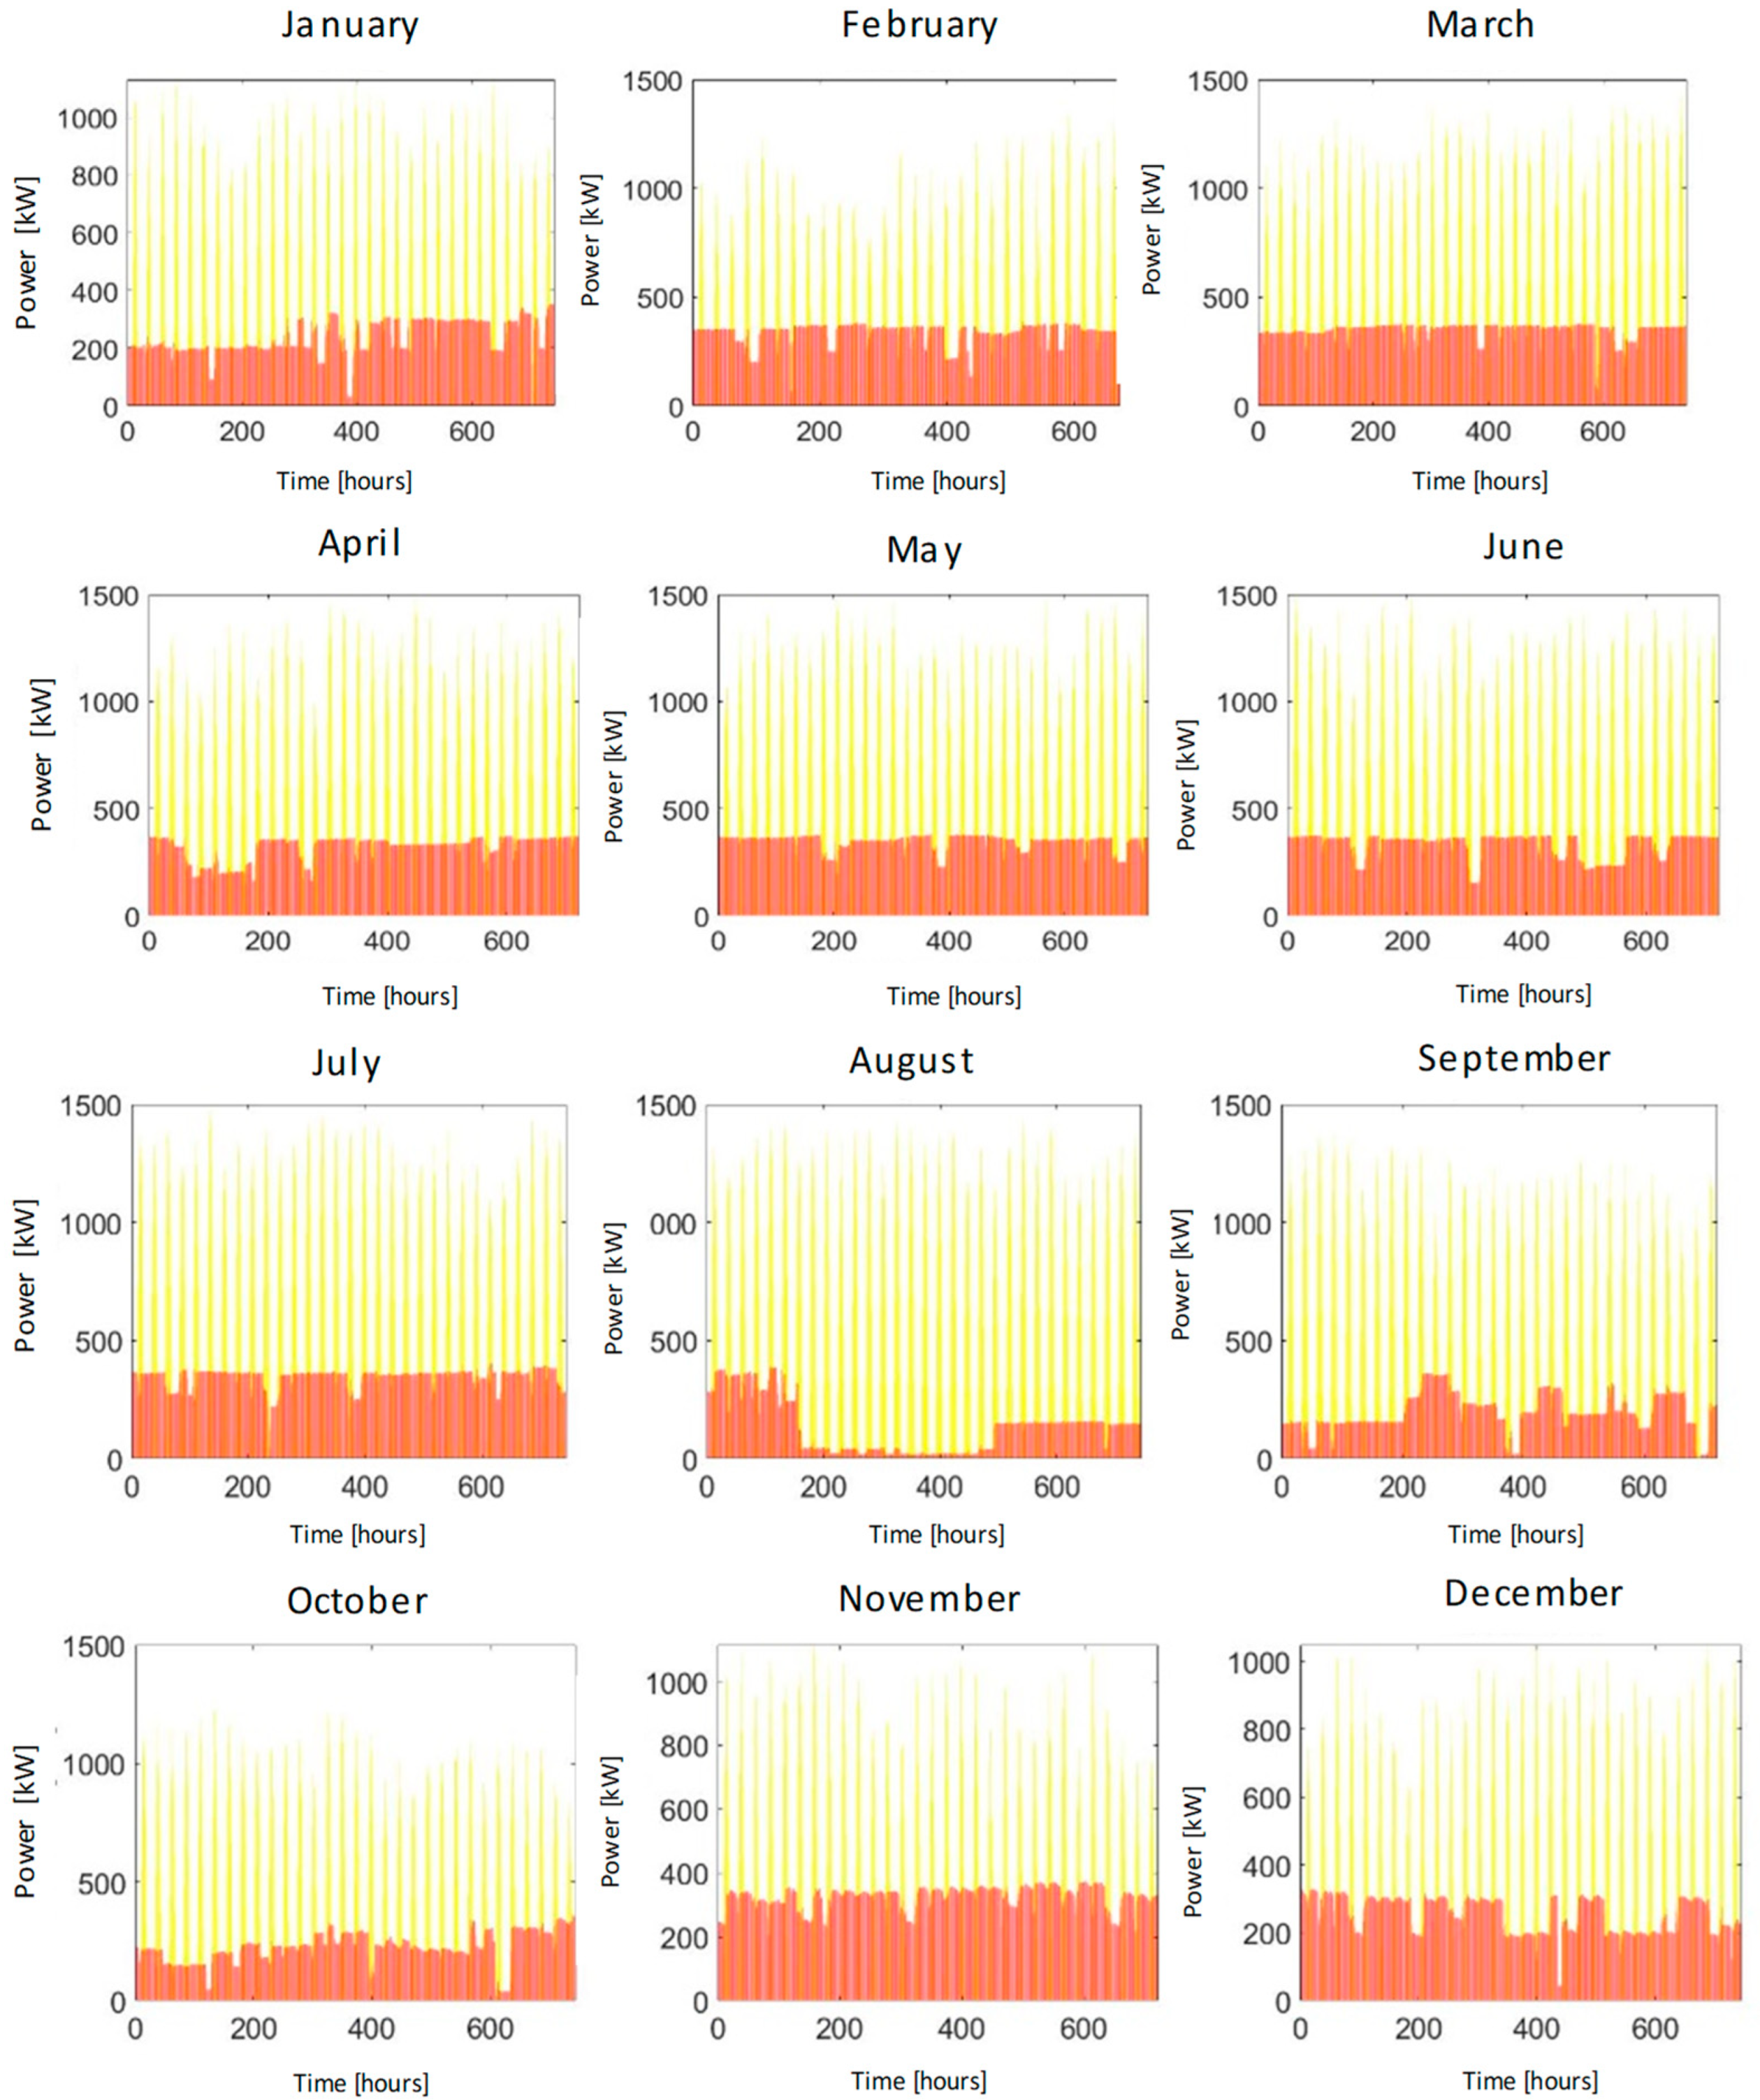
4.1. Energy Balance
4.2. Environmental and Economic Implications
5. Discussion and Conclusions
Author Contributions
Funding
Institutional Review Board Statement
Informed Consent Statement
Data Availability Statement
Acknowledgments
Conflicts of Interest
Nomenclature
| PV | Photovoltaic |
| RES | Renewable energy sources |
| LCOE | Levelized cost of energy |
| FPV | Floating photovoltaic |
| EDR | Electrodialysis reversal |
| PVGIS | Photovoltaic Geographical Information System |
| PR | Performance ratio |
| MPP | Maximum power point |
| NPV | Net present value |
| IRR | Internal rate of return |
| HDPE | High-density polyethylene |
| WWTPs | Wastewater treatment plants |
| NTU | Nephelometric turbidity units |
| TSS | Total suspended solids |
| CFU | Colony Forming Units |
Appendix A. Floating PV Systems. State-of-the-Art
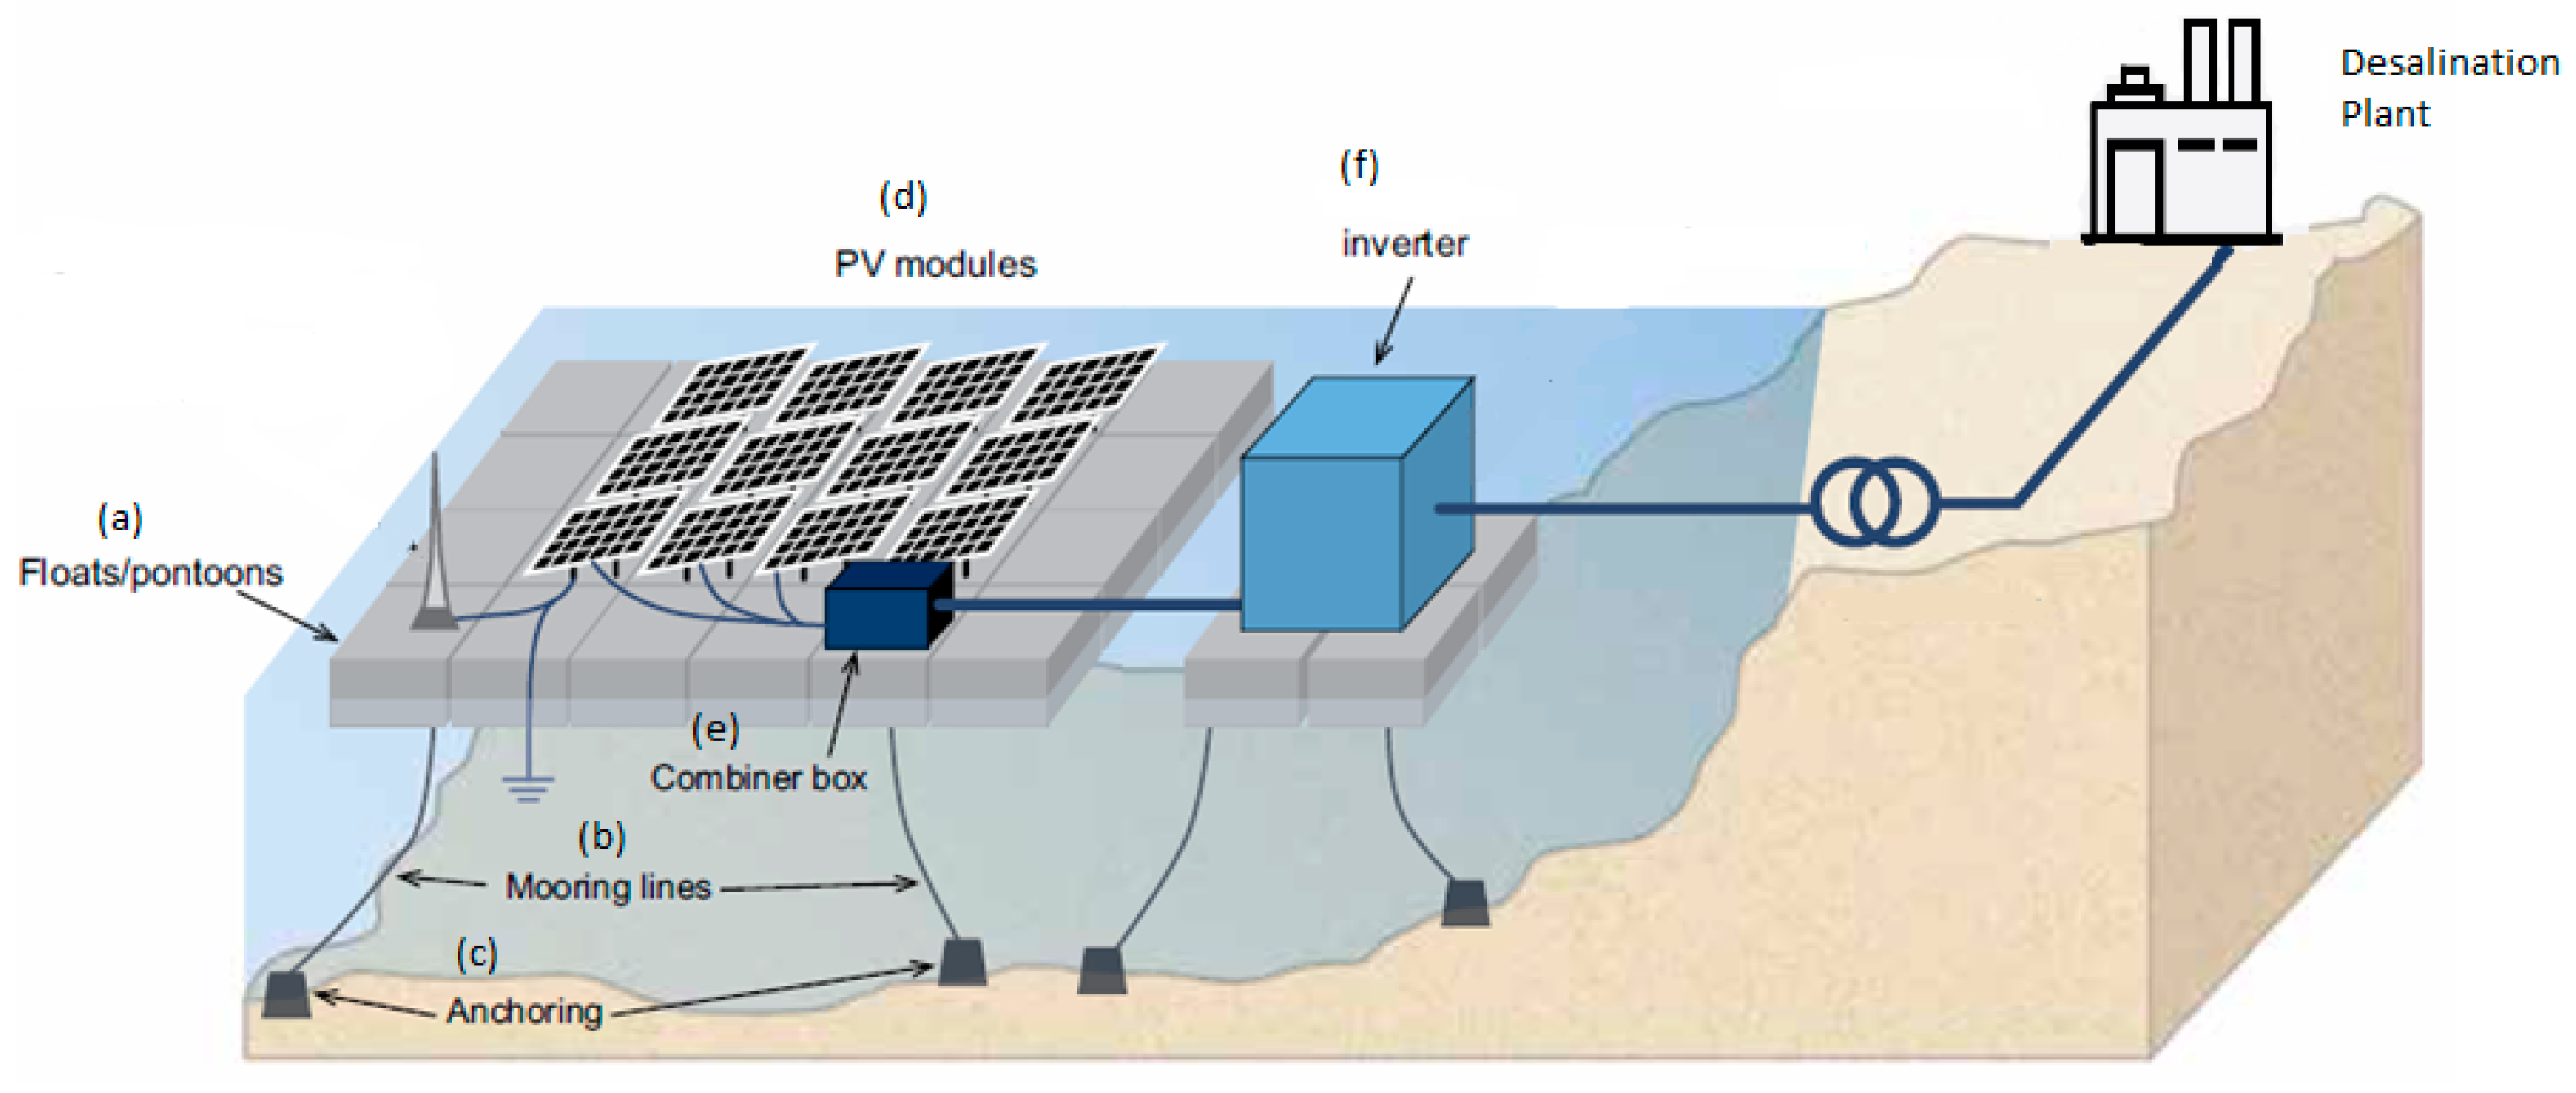
Appendix A.1. Structural Concept Diagram of the FPV System

Appendix A.2. Floating Structure
- Configuration 1: high-density polyethylene (HDPE) pipes, combined with a structure, usually metallic, that provides rigidity and supports the PV panels, resulting in a raft;
- Configuration 2: small HDPE floating modules (usually housing only one PV panel per unit) and suitably joined to others to form larger assemblies;
- Configuration 3: Floating pontoon-type structures linked together and capable of supporting the rest of the PV structure, housed on rigid elements;
- Configuration 4: Membrane configuration, where the PV panels are placed on this element, supported on a floating circular structure.
Appendix A.3. Mooring Systems
Appendix A.4. Photovoltaic Panels
References and Note
- European Commission. 2030 Climate & Energy Framework. Available online: https://ec.europa.eu/clima/policies/strategies/2030 (accessed on 13 December 2022).
- Ministry of Ecological Transition. National Integrated Energy and Climate Plan; Spanish Institute for Energy Diversification and Saving: Madrid, Spain, 2019; p. 25. [Google Scholar]
- International Energy Agency. Solar PV 2022; IEA: Paris, France, 2022; License: CC BY 4.0.; Available online: https://www.iea.org/reports/solar-pv (accessed on 15 December 2022).
- International Renewable Energy Agency (IRENA). Renewable Power Generation Costs in 2019; IRENA: Abu Dhabi, United Arab Emirates, 2019; ISBN 978-92-9260-244-4. [Google Scholar]
- Wang, J.; Lund, P.D. Review of Recent Offshore Photovoltaics Development. Energies 2022, 15, 7462. [Google Scholar] [CrossRef]
- Campana, P.E.; Wästhage, L.; Nookuea, W.; Tan, Y.; Yan, J. Optimization and Assessment of Floating and Floating-Tracking PV Systems Integrated in on- and off-Grid Hybrid Energy Systems. Sol. Energy 2019, 177, 782–795. [Google Scholar] [CrossRef]
- Liu, L.; Sun, Q.; Li, H.; Yin, H.; Ren, X.; Wennersten, R. Evaluating the Benefits of Integrating Floating Photovoltaic and Pumped Storage Power System. Energy Convers. Manag. 2019, 194, 173–185. [Google Scholar] [CrossRef]
- Liu, L.; Wang, Q.; Lin, H.; Li, H.; Sun, Q.; Wennersten, R. Power Generation Efficiency and Prospects of Floating Photovoltaic Systems. Energy Procedia 2017, 105, 1136–1142. [Google Scholar] [CrossRef]
- Ranjbaran, P.; Yousefi, H.; Gharehpetian, G.B.; Astaraei, F.R. A Review on Floating Photovoltaic (FPV) Power Generation Units. Renew. Sustain. Energy Rev. 2019, 110, 332–347. [Google Scholar] [CrossRef]
- Kumar, M.; Chandel, S.S.; Kumar, A. Performance Analysis of a 10 MWp Utility Scale Grid-Connected Canal-Top Photovoltaic Power Plant under Indian Climatic Conditions. Energy 2020, 204, 117903. [Google Scholar] [CrossRef]
- Trapani, K.; Millar, D.L.; Smith, H.C.M. Novel Offshore Application of Photovoltaics in Comparison to Conventional Marine Renewable Energy Technologies. Renew. Energy 2013, 50, 879–888. [Google Scholar] [CrossRef]
- Pouran, H.M. From Collapsed Coal Mines to Floating Solar Farms, Why China’s New Power Stations Matter. Energy Policy 2018, 123, 414–420. [Google Scholar] [CrossRef]
- Khalifeh Soltani, S.R.; Mostafaeipour, A.; Almutairi, K.; Hosseini Dehshiri, S.J.; Hosseini Dehshiri, S.S.; Techato, K. Predicting Effect of Floating Photovoltaic Power Plant on Water Loss through Surface Evaporation for Wastewater Pond Using Artificial Intelligence: A Case Study. Sustain. Energy Technol. Assess. 2022, 50, 101849. [Google Scholar] [CrossRef]
- Kumar, M.; Mohammed Niyaz, H.; Gupta, R. Challenges and Opportunities towards the Development of Floating Photovoltaic Systems. Sol. Energy Mater. Sol. Cells 2021, 233, 111408. [Google Scholar] [CrossRef]
- Ma, C.; Liu, Z. Water-Surface Photovoltaics: Performance, Utilization, and Interactions with Water Eco-Environment. Renew. Sustain. Energy Rev. 2022, 167, 112823. [Google Scholar] [CrossRef]
- Manoj Kumar, N.; Chakraborty, S.; Kumar Yadav, S.; Singh, J.; Chopra, S.S. Advancing Simulation Tools Specific to Floating Solar Photovoltaic Systems—Comparative Analysis of Field-Measured and Simulated Energy Performance. Sustain. Energy Technol. Assess. 2022, 52, 102168. [Google Scholar] [CrossRef]
- Farfan, J.; Breyer, C. Combining Floating Solar Photovoltaic Power Plants and Hydropower Reservoirs: A Virtual Battery of Great Global Potential. Energy Procedia 2018, 155, 403–411. [Google Scholar] [CrossRef]
- Moraes, C.A.; Valadão, G.F.; Renato, N.S.; Botelho, D.F.; Oliveira, A.C.L.d.; Aleman, C.C.; Cunha, F.F. Floating Photovoltaic Plants as an Electricity Supply Option in the Tocantins-Araguaia Basin. Renew. Energy 2022, 193, 264–277. [Google Scholar] [CrossRef]
- Meydani, A.; Meidani, A.; Shahablavasani, S. Clean Energy’s Role in Power Plant Development. In Proceedings of the 2023 8th International Conference on Technology and Energy Management (ICTEM), Babol, Iran, 8–9 February 2023; pp. 1–7. [Google Scholar]
- Armstrong, A.; Page, T.; Thackeray, S.J.; Hernandez, R.R.; Jones, I.D. Integrating Environmental Understanding into Freshwater Floatovoltaic Deployment Using an Effects Hierarchy and Decision Trees. Environ. Res. Lett. 2020, 15, 114055. [Google Scholar] [CrossRef]
- Boeuf, G.; Le Bail, P.Y. Does Light Have an Influence on Fish Growth? Aquaculture 1999, 177, 129–152. [Google Scholar] [CrossRef]
- Menicou, M.; Vassiliou, V. Prospective Energy Needs in Mediterranean Offshore Aquaculture: Renewable and Sustainable Energy Solutions. Renew. Sustain. Energy Rev. 2010, 14, 3084–3091. [Google Scholar] [CrossRef]
- Woodhouse, M.; Repins, I.; David, M. LID and LeTID Impacts to PV Module Performance and System Economics: Draft Analysis. In Proceedings of the Impacts to PV Module Performance and System Economics, Online, 14 December 2020. [Google Scholar]
- Ministerio de Industria, E.y.T. Factores de Emisión de CO2 y Coeficientes de Paso a Energía Primaria de Diferentes Fuentes de Energía Final Consumidas En El Sector de Edificios En España. Doc. Reconocido Reglam. Instal. Térmicas Edif. 2016, 16, 17–18. [Google Scholar]
- Mercedes Garcia, A.V.; Sánchez-Romero, F.J.; López-Jiménez, P.A.; Pérez-Sánchez, M. A New Optimization Approach for the Use of Hybrid Renewable Systems in the Search of the Zero Net Energy Consumption in Water Irrigation Systems. Renew. Energy 2022, 195, 853–871. [Google Scholar] [CrossRef]
- Li, H.X.; Edwards, D.J.; Hosseini, M.R.; Costin, G.P. A Review on Renewable Energy Transition in Australia: An Updated Depiction. J. Clean. Prod. 2020, 242, 118475. [Google Scholar] [CrossRef]
- Gils, H.C.; Simon, S. Carbon Neutral Archipelago—100% Renewable Energy Supply for the Canary Islands. Appl. Energy 2017, 188, 342–355. [Google Scholar] [CrossRef]
- Santamarta, J.C.; Neris, J.; Rodríguez-Martín, J.; Arraiza, M.P.; López, J.V. Climate Change and Water Planning: New Challenges on Islands Environments. IERI Procedia 2014, 9, 59–63. [Google Scholar] [CrossRef]
- Del Río-Gamero, B.; Lis Alecio, T.; Schallenberg-Rodríguez, J. Performance Indicators for Coupling Desalination Plants with Wave Energy. Desalination 2022, 525, 115479. [Google Scholar] [CrossRef]
- Roggenburg, M.; Warsinger, D.M.; Bocanegra Evans, H.; Castillo, L. Combatting Water Scarcity and Economic Distress along the US-Mexico Border Using Renewable Powered Desalination. Appl. Energy 2021, 291, 116765. [Google Scholar] [CrossRef]
- Fernández Prieto, L.; Rodríguez Rodríguez, G.; Schallenberg Rodríguez, J. Wave Energy to Power a Desalination Plant in the North of Gran Canaria Island: Wave Resource, Socioeconomic and Environmental Assessment. J. Environ. Manag. 2019, 231, 546–551. [Google Scholar] [CrossRef]
- Schallenberg-Rodríguez, J.; Del Rio-Gamero, B.; Melian-Martel, N.; Lis Alecio, T.; González Herrera, J. Energy Supply of a Large Size Desalination Plant Using Wave Energy. Practical Case: North of Gran Canaria. Appl. Energy 2020, 278, 115681. [Google Scholar] [CrossRef]
- Delgado-Torres, A.M.; García-Rodríguez, L. Off-Grid SeaWater Reverse Osmosis (SWRO) Desalination Driven by Hybrid Tidal Range/Solar PV Systems: Sensitivity Analysis and Criteria for Preliminary Design. Sustain. Energy Technol. Assess. 2022, 53, 102425. [Google Scholar] [CrossRef]
- European, C. Photovoltaic Geographical Information System (PVGIS). Available online: https://ec.europa.eu/jrc/en/pvgis (accessed on 1 November 2022).
- MATLAB and Statistics Toolbox Release 2018, The MathWorks, Inc.: Natick, MA, USA, 2018.
- Grafcan. Gobierno de Canarias. Territorial Information System of the Canary Islands. Protected Areas. Available online: https://visor.grafcan.es/visorweb/ (accessed on 15 November 2022).
- Graber, T.A.; Galleguillos, H.R.; Cabeza, L.F.; Rojas, R.; Taboada, M.E.; Cáceres, L. Solar Water Heating System and Photovoltaic Floating Cover to Reduce Evaporation: Experimental Results and Modeling. Renew. Energy 2017, 105, 601–615. [Google Scholar] [CrossRef]
- Isigenere Company. Isifloating es el Sistema Solar Flotante de mas alta Calidad y Durabilidad. Available online: https://www.isifloating.com/wp-content/uploads/2021/05/ANEJO2_FICHA_ISIFLOATING-ESP-ISI200715.pdf (accessed on 23 December 2022).
- Sendeco2. Precios CO2. Available online: https://www.sendeco2.com/es/precios-co2 (accessed on 3 January 2023).
- Grafcan. Gobierno de Canarias. Territorial Information System of the Canary Islands. Wind Resource at 100 Meters. Available online: https://visor.grafcan.es/visorweb/ (accessed on 15 November 2022).
- BALTEN. Estado de Almacenamiento de las Balsas. Available online: https://www.balten.es/Articulo/Display/16?titulo=estado-de-almacenamiento-de-las-balsas&categoria=estado-de-las-balsas (accessed on 25 February 2021).
- BALTEN. Pliego de Condiciones Técnicas. Operación, Mantenimiento y Conservación de las Instalaciones del Sistema de Reutilización y Desalación de la isla de Tenerife. Available online: https://www.infopublic.net/concursos/servicio-realizacion-funciones-operacion-mantenimiento-conservacion-instalaciones-sistema-reutilizacion-desalacion-isla-tenerife-2845595?top_concept=Agua&concurso=Convocatorias&sort=fecha&page_number=4&noIndex (accessed on 25 March 2022).
- BALTEN. Memorias 20 años de BALTEN. Available online: https://www.balten.es/Articulo/Display/18?titulo=memoria-de-balten&categoria=otros-documentos (accessed on 25 March 2022).
- BALTEN. Balsas de Tenerife. Datos de La Demanda Horaria de La Planta Desalinizadora EDR Del Valle de San Lorenzo 2019. Oral communication by Juan Antonio Medina on 18 February 2021.
- Aguiar, E.; Delgado, S.; Renz, O.; Gonzalez, A.; Reutilización de Aguas Depuradas en la Isla de Tenerife. Instalaciones Para la Mejora de la Calidad para uso Agrícola. Available online: http://hispagua.cedex.es/sites/default/files/hispagua_articulo/Ingcivil/113/articulo1/reutilizacion.htm (accessed on 22 April 2022).
- Dirección General de Agricultura y Desarrollo Rural. Plan de Regadíos de Canarias, 2014–2020; Dirección General de Agricultura y Desarrollo Rural: Brussel, Belgium, 2014; Volume 1, pp. 1–281. Available online: https://www.gub.uy/ministerio-ganaderia-agricultura-pesca/dgdr (accessed on 18 December 2022).
- Cabildo de Tenerife; Consejo Insular de Aguas de Tenerife. Plan Hidrológico Tenerife. 2015. Annex3, p. 268. Available online: https://www.tenerife.es/portalcabtfe/es/temas/aguas/consejo-insular-de-aguas-de-tenerife/33-temas/aguas (accessed on 18 March 2023).
- Atersa. Panel Solar 450W A-450M ATERSA GS. Available online: https://atersa.shop/panel-solar-450w-a-450m-atersa-gs-m6x24/ (accessed on 7 May 2022).
- Ingeteam. INGECON SUN Power (1170–1800 kVA). Available online: https://www.ingeteam.com/es-es/sectores/energia-fotovoltaica/p15_24_36/ingecon-sun-power-1170-1800-kva.aspx (accessed on 8 May 2022).
- Sendeco2. CO2 Costs. Available online: https://www.sendeco2.com/es/precios-co2 (accessed on 18 December 2022).
- World Bank Group; Energy Sector Management Assistance Program; Solar Energy Research Institute of Singapore. Where Sun Meets Water: Floating Solar Handbook for Practitioners; World Bank: Washington, DC, USA, 2019. [Google Scholar]
- Friel, D.; Karimirad, M.; Whittaker, T.; Doran, J.; Howlin, E. A Review of Floating Photovoltaic Design Concepts and Installed Variations. In Proceedings of the 4th International Conference Offshore Renew Energy CORE, Lisbon, Portugal, 12–15 October 2020. [Google Scholar]
- Cazzaniga, R. Floating PV Structures; Elsevier Inc.: Amsterdam, The Netherlands, 2020. [Google Scholar] [CrossRef]
- Cossu, S.; Baccoli, R.; Ghiani, E. Utility Scale Ground Mounted Photovoltaic Plants with Gable Structure and Inverter Oversizing for Land-Use Optimization. Energies 2021, 14, 3084. [Google Scholar] [CrossRef]
- Ciel et Terre. The Floating Solar Company. Available online: https://ciel-et-terre.net/floating-solar/ (accessed on 5 January 2023).
- Oliveira-Pinto, S.; Stokkermans, J. Assessment of the Potential of Different Floating Solar Technologies—Overview and Analysis of Differente Cases Studies. Energy Convers. Manag. 2020, 211, 112747. [Google Scholar] [CrossRef]
- Ocean Sun Company. Ocean Sun Products. Available online: https://oceansun.no/ (accessed on 18 March 2022).
- Power PVTECH. PV Tech Power Report: Asia Focus. Solar and Storage Finance Asia; PV Tech Power: London, UK, 2019; Volume 1, pp. 1–56. [Google Scholar]
- CORDIS. European Commission. Bringing Offshore Ocean Sun to the Global Market. Available online: https://cordis.europa.eu/project/id/965671 (accessed on 2 February 2023).
- Acharya, M.; Devraj, S. Floating Solar Photovoltaic (FSPV): A Third Pillar to Solar PV Sector? TERI Discussion Paper:Output of the ETC India Project; The Energy and Resources Institute: New Delhi, India, 2019; pp. 1–68. [Google Scholar]
- Whittaker, T.; Folley, M.; Hancock, J. Environmental Loads, Motions, and Mooring Systems; Elsevier Inc.: Amsterdam, The Netherlands, 2020. [Google Scholar] [CrossRef]
- Institute for Solar Energy Systems. Fraunhofer’s Photovoltaics Report; Institute for Solar Energy Systems: Freiburg im Breisgau, Germany, 2020; Available online: https://www.ise.fraunhofer.de/content/dam/ise/en/documents/annual_reports/fraunhofer-ise-annual-report-2020-2021.pdf (accessed on 10 February 2023).
- Masson, G.; Kaizuka, I. Trends in Photovoltaic Applications 2019; International Energy Agency: Sweden, 2019; ISBN 978-3-906042-91-6. [Google Scholar] [CrossRef]


| Site Parameters | Renewable Resource Evaluation | |||
|---|---|---|---|---|
| Adjacent ground available? | High temperature & evaporation climatology? | Is the ground environmental protected? | Is the solar resource high? | Are other RES limited? |
| No | Yes | N/A | Yes | Yes |
| Number of Desalination Units | 8 |
|---|---|
| Conversion rate (%) | 85 |
| Net production per unit (m3/d) | 2000 |
| Number of lines per desalination unit | 3 |
| Number of stages per line | 4 |
| Number of stacks per unit | 12 |
| Total number of stacks | 96 |
| cation-exchange membranes | CR67HMR |
| anion-exchange membranes | AR908 |
| Spacer-Mark | IV |
| Max stack voltage (V)/current (A) | 600/65 |
| January–February | March–April | May–June | July–August | September–October | November–December | Total Year | |
|---|---|---|---|---|---|---|---|
| 2015 | 1,167,440 | 1,177,000 | 1,373,928 | 1,519,014 | 1,097,244 | 873,850 | 7,208,476 |
| 2016 | 1,049,054 | 1,172,986 | 1,322,808 | 1,575,505 | 1,175,637 | 820,005 | 7,115,995 |
| 2017 | 997,476 | 1,123,575 | 1,396,110 | 1,536,402 | 1,394,042 | 1,013,952 | 7,461,557 |
| 2018 | 968,937 | 1,133,908 | 1,281,279 | 1,573,597 | 1,295,799 | 1,045,801 | 7,299,321 |
| 2019 | 1,114,855 | 1,207,628 | 1,309,067 | 1,643,912 | 1,664,398 | 908,671 | 7,848,531 |
| Period average | 1,059,552 | 1,163,019 | 1,336,638 | 1,569,686 | 1,325,424 | 932,456 | 7,386,776 |
| Preliminary Analysis | |||
|---|---|---|---|
| pH | 7.7 | Total hardness (°F) | 8.1 |
| Conductivity (μS/cm, 20 °C) | 982 | Silica (mg/L) | 29 |
| Cations (mg/L) | Anions (mg/L) | ||
| Calcium | 11.0 | Carbonates | <0.25 |
| Magnesium | 13 | Bicarbonates | 324 |
| Potassium | 24.6 | Sulfates | 37 |
| Sodium | 157 | Chlorides | 137 |
| Iron | 0.08 | Nitrates | 3.4 |
| Ammonium | 18.3 | Nitrites | 3.2 |
| Phosphates | 6.5 | ||
| Fluorides | 0.2 | ||
| Trace elements | |||
| Boron (mg/L) | 0.8 | Manganese (mg/L) | 0.03 |
| Copper (mg/L) | <0.005 | Chromium (mg/L) | <0.005 |
| Organic analysis | |||
| TSS (mg/L) | <2.5 | Turbidity (NTU) | 1 |
| Microbiological analysis | |||
| Escherichia coli (CFU/100 mL) | 2 | Intestinal nematodes (Eggs/10l) | 0 |
| Legionella spp. (CFU/L) | 0 | ||
| Month | Inclination Degrees | Temperature | |||
|---|---|---|---|---|---|
| 0° | 5° | 10° | 15° | (°C) | |
| January | 118.75 | 129.49 | 139.50 | 148.71 | 18.9 |
| February | 125.60 | 133.26 | 140.20 | 146.34 | 17.8 |
| March | 177.33 | 183.96 | 189.57 | 194.11 | 17.8 |
| April | 191.30 | 194.01 | 195.66 | 196.24 | 18.5 |
| May | 216.62 | 216.33 | 214.85 | 212.18 | 19.4 |
| June | 218.25 | 216.45 | 213.44 | 209.25 | 20.8 |
| July | 226.35 | 225.29 | 222.99 | 219.46 | 22.0 |
| August | 213.90 | 215.68 | 216.27 | 215.64 | 23.2 |
| September | 173.67 | 178.28 | 181.95 | 184.62 | 23.2 |
| October | 145.69 | 153.14 | 159.77 | 165.52 | 22.7 |
| November | 113.44 | 122.13 | 130.17 | 137.47 | 21.1 |
| December | 106.60 | 116.77 | 126.31 | 135.11 | 19.9 |
| Annual total | 2027.5 | 2084.8 | 2130.7 | 2164.6 | |
| Maximum power (Pmax) | 450 W |
| Maximum power voltage (Vmp) | 41.50 V |
| Maximum power current (Imp) | 10.85 A |
| Open-circuit voltage (Voc) | 49.30 V |
| Short-circuit current (Isc) | 11.60 A |
| Module efficiency (%) | 20.70 |
| Minimum MPPT voltage | 935 V |
| Maximum MPPT voltage | 1300 V |
| Maximum voltage | 1500 V |
| Maximum current | 1870 A |
| Power IP54 30 °C | 1715 kVA |
| MPP voltage | 1120 V (upper 935 V) |
| Maximum voltage | 1331 V (lower 1500 V) |
| Maximum current | 1763 A (lower 1870 A) |
| Number of Hours | Surplus Power [kW] | Percentage with Respect to Total Surplus Hours (%) |
|---|---|---|
| 41 | 1200 | 1.20 |
| 107 | 1100 | 3.14 |
| 261 | 1000 | 7.65 |
| 533 | 900 | 15.62 |
| 877 | 800 | 25.70 |
| 1236 | 700 | 36.21 |
| 1637 | 600 | 47.96 |
| 2013 | 500 | 58.98 |
| 2305 | 400 | 67.54 |
Disclaimer/Publisher’s Note: The statements, opinions and data contained in all publications are solely those of the individual author(s) and contributor(s) and not of MDPI and/or the editor(s). MDPI and/or the editor(s) disclaim responsibility for any injury to people or property resulting from any ideas, methods, instructions or products referred to in the content. |
© 2023 by the authors. Licensee MDPI, Basel, Switzerland. This article is an open access article distributed under the terms and conditions of the Creative Commons Attribution (CC BY) license (https://creativecommons.org/licenses/by/4.0/).
Share and Cite
Del Rio-Gamero, B.; Rodríguez-López, E.; Schallenberg-Rodríguez, J. Desalination Plant for Irrigation Purposes Driven by an Inland Floating Photovoltaic System. J. Mar. Sci. Eng. 2023, 11, 905. https://doi.org/10.3390/jmse11050905
Del Rio-Gamero B, Rodríguez-López E, Schallenberg-Rodríguez J. Desalination Plant for Irrigation Purposes Driven by an Inland Floating Photovoltaic System. Journal of Marine Science and Engineering. 2023; 11(5):905. https://doi.org/10.3390/jmse11050905
Chicago/Turabian StyleDel Rio-Gamero, B., Edgar Rodríguez-López, and Julieta Schallenberg-Rodríguez. 2023. "Desalination Plant for Irrigation Purposes Driven by an Inland Floating Photovoltaic System" Journal of Marine Science and Engineering 11, no. 5: 905. https://doi.org/10.3390/jmse11050905