Seasonal Variability in Ocean Heat Content and Heat Flux in the Arabian Gulf
by
 , , and
Afnan Y. Alsayed
1,*, 
Mohammed A. Alsaafani
1,
Abdullah M. Al-Subhi
1,
Turki M. Alraddadi
1 and
Ahmed M. Taqi
2 1
Department of Marine Physics, King Abdulaziz University, P.O. Box 80207, Jeddah 21589, Saudi Arabia
2
Department of Marine Physics, Hodeidah University, Hodeidah P.O. Box 3114, Yemen
*
Author to whom correspondence should be addressed.
J. Mar. Sci. Eng. 2023, 11(3), 532; https://doi.org/10.3390/jmse11030532
Submission received: 6 February 2023
/
Revised: 23 February 2023
/
Accepted: 26 February 2023
/
Published: 28 February 2023
(This article belongs to the Section Physical Oceanography)
Abstract
:This study aimed to evaluate the seasonal variability in surface heat content in the Arabian Gulf (AG) based on hydrographic data. The ocean heat content (OHC) was initially estimated from surface to maximum depth (75 m) to show the seasonal variability, where the seasonal temperature reaches to that depth. Then OHC was re-estimated from the surface to a depth of 35 m, which represents the average depth of AG, to obtain accurate horizontal distributions. Results showed that during winter, the northern part of AG experiences the lowest OHC compared to the southeastern part. The monthly spatial average implies that the highest OHC of AG water was in September and October, while the lowest heat content was found in February and March. However, the OHC horizontal distributions were almost the same for the entire gulf during summer. In general, there was increasing in the OHC in the southeast region of the gulf. OHC anomalies are concentrated in the northern region of the AG, while the southeastern part near the Strait of Hormuz has the lowest values. Regarding heat flux, the highest heat gains were during spring, while the highest loss was in autumn. The water exchange between the AG and the Indian Ocean through the Strait of Hormuz may play a major role in the seasonal variability in OHC.
1. Introduction
The ocean affects climate by transporting and storing large amounts of heat, carbon, and freshwater, and through exchanging these quantities with the atmosphere [1]. Over the last 50 years, almost 93% of the Earth’s excess heat energy storage has been found in oceans [2,3]. Oceans absorb most of the excess energy stored in the climate system resulting from anthropogenic greenhouse gases emissions, resulting in further thermal expansion and rising sea levels [4]. The ocean’s ability to store significant amounts of heat is due to the large heat capacity and large mass of seawater compared to air and the fact that vertical mixing exchanges heat between the surface and ocean interior.
According to Huhn and his colleagues [1], the stored heat (thermal energy) in the ocean is defined as the ocean heat content (OHC). Monitoring of OHC and its long-term change represents the most efficient approach to estimate Earth’s energy imbalance [2]. Furthermore, OHC is useful for predicting interannual climate variations and tropical cyclone intensification [5]. OHC is divided into two parts: (1) upper ocean heat content from the surface to 700 m and (2) deep ocean heat content below 700 m [6]. Warming of the upper ocean represents 64% of the total warming of the ocean [3]. The upper OHC is considered an important climate parameter necessary for oceanographic and atmospheric studies such as hurricanes [7]. Regarding deep OHC, for the period between 1957 and 2009, it was reported that ocean warming between 700 and 2000 m participated in almost 30% of the total increase in global OHC [8]. The annual OHC value signal can be impacted by instrumental errors or internal variabilities (i.e., ENSO, El Niño–Southern Oscillation); therefore, long-term trends are more important than any single year to demonstrate climate change [9].
Changes in the ocean heat content are important for studying sea-level rise due to thermal expansion. In other words, increasing the OHC should lead to increased sea levels [10]. In addition, OHC is considered a possible factor that can affect precipitation [11].
The ocean’s surface heat flux is a vital component of the earth’s surface energy budget [12], as oceans influence weather and climate by heating and cooling the lower atmosphere [13]. An air–sea energy exchange takes place through turbulent heat processes (sensible and latent heat) and radiative processes (shortwave and longwave radiation) [14].
The ocean’s surface heat flux can be directly influenced by many factors, including: (1) SST; decreasing or increasing SST results in reducing or enhancing heat release, respectively, from the ocean to the atmosphere. Furthermore, heat flux anomalies can also be produced by vast surface temperature anomalies [15,16]. (2) Ocean dynamics; these can influence the LHF through SST variations and advection (3) winds; zonal winds can transfer the zonal heat from one ocean basin to another [17], and strong winds also result in wave breaking and make huge amounts of sea spray, affecting mass and energy exchange significantly at the interface [18]. (4) convective process; heat transport is increasing with the increasing of convective strength [17].
Heat exchange between the ocean and the atmosphere through the sea surface has significant effects on many meteorological phenomena [19]. Hence, understanding the variability in air–sea heat fluxes is key for determining variations in weather systems [20], climatic conditions [21], sea surface temperature (SST) [22], and the transfer of gases across the air–sea interface [23]. Therefore, the determination of air–sea interface heat exchange is very important to examine many scientific applications, such as weather forecasting, the investigation of the dynamics of climate, investigation of oceanic and atmospheric circulation, and investigation of thermal alteration in the lower atmosphere and the upper ocean [24].
The Arabian Gulf (AG, here and after) is a semi-enclosed shallow gulf area between the Arabian Peninsula and Iran. It is linked to the Gulf of Oman and the Indian Ocean through the Strait of Hormuz. The narrow Strait of Hormuz restricts water exchange between the Arabian Gulf with the northern Indian Ocean [25]. Shatt-Al-Arab is the major freshwater source in the Arabian Gulf, and this area is located at the head of the Gulf and is fed by the Tigris, Euphrates, and Karun Rivers.
The weather of the AG is influenced by the extra-tropical weather systems from the northwest [26]. The “Shamal” winds (in both winter and summer), sea and land breezes, and monsoonal winds prevail in the region [26]. The winter “Shamal” winds may continue for 5 days and reach speeds of 20 ms−1 [27]. Recent study [28] points out that the easterly Nashi winds have a significant role on the wave characteristics in the Arabian Gulf, so there is a possibility these winds contribute to the dynamics of this region. Regarding monsoonal winds, they form four seasons: June–September (southwest monsoon), October and November (fall inter-monsoon), December–March (northeast monsoon), and April and May (spring inter-monsoon period) [29]. Moreover, there are seasonal variations in insolation in the AG region along with cold winds from nearby highlands [26,30], which cause seasonal fluctuations in the surface water temperature ranging from 35 °C in August and cooling to about 12 °C in February [31].
Sea surface temperature (SST) is an important physical attribute of the world’s oceans. Numerous published data and related studies indicate an increase in surface temperature in recent years, which is important for understanding and interpreting climate signals and critical environmental issues such as storm intensity and coral bleaching [32]. The increases in global mean surface temperature were projected to be in the range of 0.3 °C to 1.3 °C by 2100. The IPCC report concludes: “on a global scale, the ocean warming is largest near the surface, and the upper 75 m warmed by 0.09 to 0.13 °C per decade over the period 1971 to 2010” [33]. According to Al-Subhi [32], the AG is experiencing a temperature rise of 0.63 °C/decade based on AVHRR data from Oct 1981 to Dec 2016. This value is higher compared to global oceans but agrees with the earlier studies in the Gulf. This SST increase is not exclusive to the surface but rather extends to the maximum depth of the gulf. In the AG, the rise in SST caused much damage to marine ecosystems such as the destruction of coral reefs according to many studies such as Riegl [34,35] and Kabiri et al. [36,37].
Previous estimates of water and heat budgets are highly uncertain in the AG due to limited observational data. This represents the main barrier in understanding the current climate of the AG system and in projecting its future trends [38]. Nagamani et al. [11] analyzed the annual OHC of the AG from 1993–2010, using satellite observations, in situ data, and a model simulation. They found that OHC increased significantly in the AG from 1993–2010 compared to the north Indian Ocean. According to Al Senafi et al. [39], the average annual value of the net surface heat flux ranges from +66 W m−2 gain flux to −21 W m−2 loss from the Gulf. Pous et al. [40] presented a realistic, interannual model of the circulation in the AG and Strait of Hormuz and noted that the southeastern part of the AG is warmer than the northwestern part.
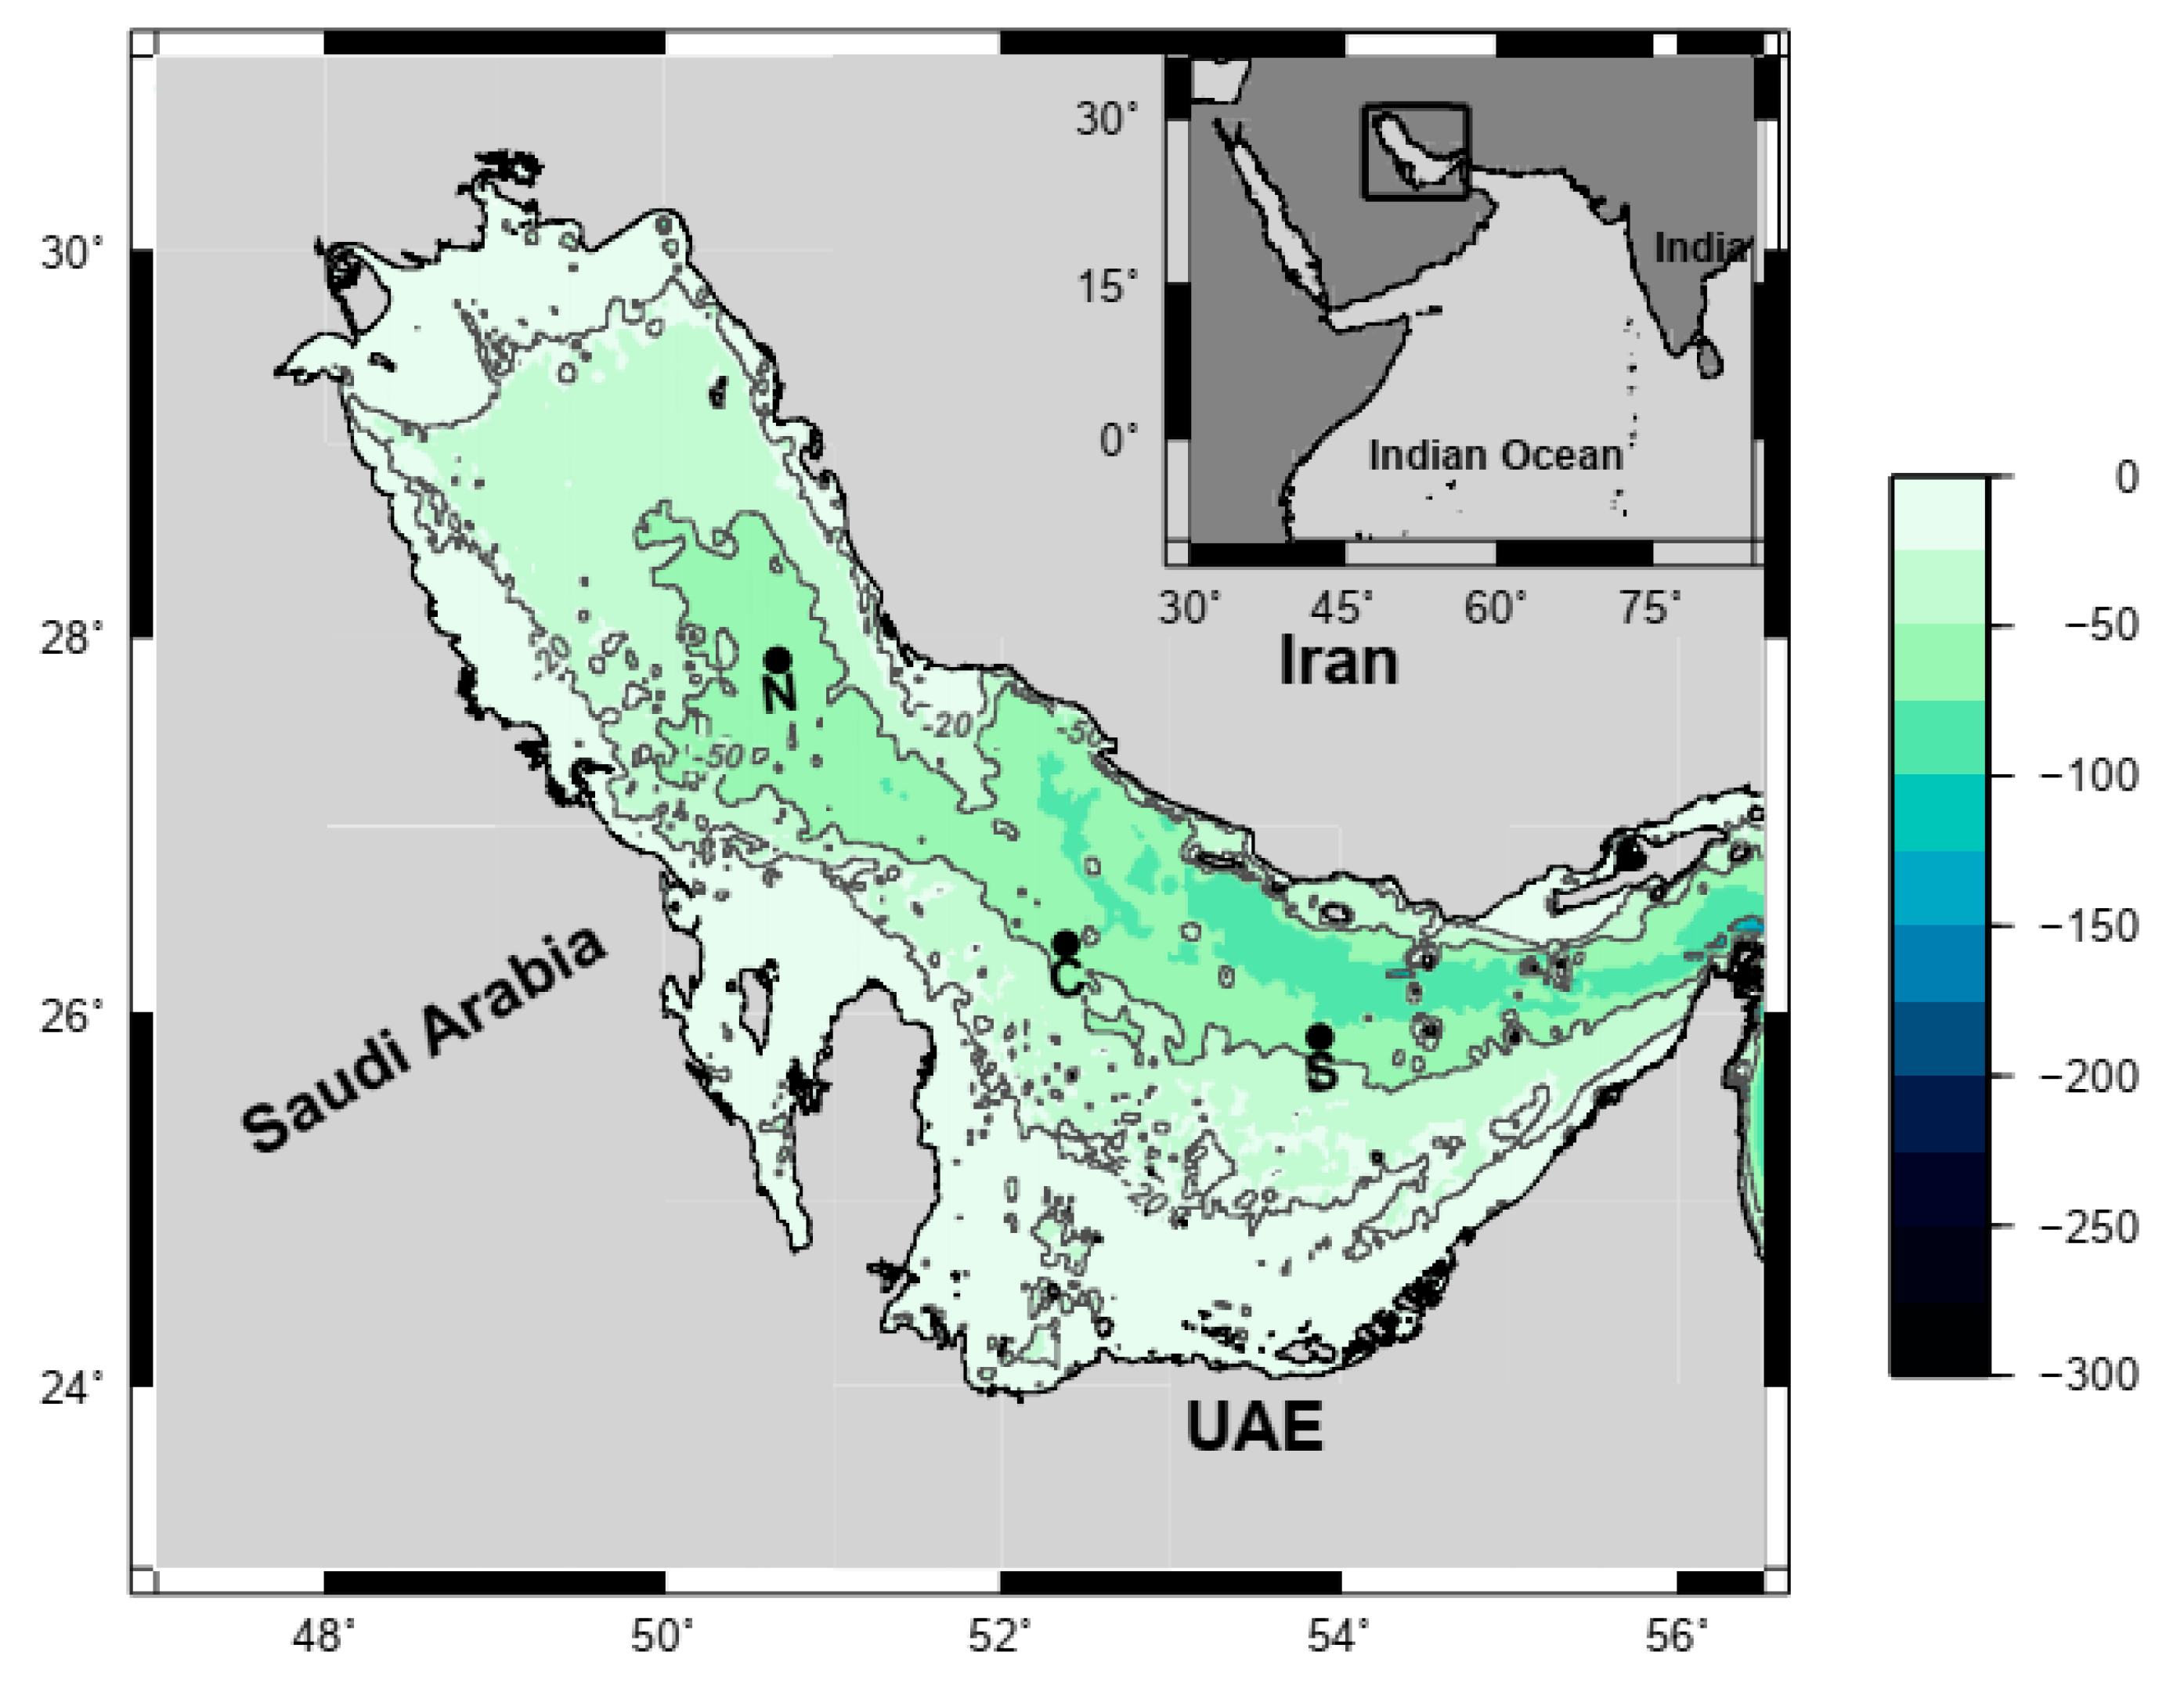
Since the average depth of the AG is significantly shallow (~35 m), the surface OHC is considered to store the entire heat content as shown in Figure 1. The few available studies in the AG indicate insufficient observations to understand the seasonal variability in the OHC. This study aimed to evaluate the seasonal variability in surface heat content in the AG based on hydrographic data. On the other hand, this research also investigates the role of surface heat fluxes on the seasonal variability in OHC.
2. Data and Methodology
2.1. Data
The present study was performed based on World Ocean Atlas 2018 (WOA18). The NOAA National Centers for Environmental Information (NCEI) published this dataset, which contains annual, seasonal, and monthly means of temperature (T), salinity (S), dissolved oxygen, phosphate, nitrate, and other variables for the world’s oceans. In this dataset, 102 depth levels were used from the surface to the seafloor (5500 m depth) and also included associated statistical fields of observed oceanographic profile data interpolated to standard depth levels on 5°, 1°, and 0.25° grids [41]. The dataset covers all the world’s oceans including the AG area. The required variables for this study included temperature, depth, salinity, and density.
The heat flux computations were based on the meteorological dataset. The source of this dataset is the ERA5, which is the updated reanalysis product of the European Centre for Medium-range Weather Forecasts (ECMWF), which provides hourly estimates of a large number of atmospheric, land, and oceanic climate variables (https://www.ecmwf.int/en/forecasts/datasets/reanalysis-datasets/era5 (accessed on 29 November 2020). The dataset contained monthly data for average wind components U and V (10 m above the sea surface), sea surface temperatures, monthly evaporation data (EVAP), mean sea level pressure (SLP), and surface shortwave radiation. The data was gridded (0.25° × 0.25°) and covered the entire area of the AG in the period from 1980 to 2017 [42]. The ERA5 winds have been verified in the Arabian Gulf against the measurements [43].
The quality control checks were applied on the data, in addition to filter errors or missing values [44].
2.2. Heat Content Estimation
The heat content was estimated in Jm−2 as follows [45,46]:
where ρ is the seawater density, Cp is the average specific heat capacity at constant pressure for the AG, 3970 Jkg−1 C−1, is the potential temperature at level i, and Z is the depth of the water column. For a given depth layer, the OHC is defined as the vertical integral of temperature multiplied by seawater density and the specific heat capacity, with units of Jm−2.
2.3. Heat Fluxes Estimation
Where the net heat flux at the surface (Qt) is:
where Qs is the shortwave flux, Ql is the longwave flux, Qe and Qh are the latent and the sensible heat fluxes, respectively, Tw is the sea surface temperature, Ta is the air temperature, w is wind speed, e0 is the saturated air vapor pressure, and ea is the actual vapor pressure.
2.4. Data Analysis
Since the AG is a shallow marginal sea, seasonal variability in temperature affects the entire water column from the surface to a depth of 75 m (Figure 2). In this figure, three locations were selected (see Figure 1 for location) to investigate the seasonal variability in temperature from the surface to the maximum depth at each location (upper panel). It is shown that the surface temperature is at a maximum during August with about 33 °C and the minimum is during March, about 19–20 °C, in the northern part (Figure 2 left), 20–21 °C in the central part, and 21–22 °C in the southern part. It is also clear that this seasonal variability extends to the maximum depth at the three designated locations with a lower range. To show the seasonal range at different depths, the monthly temperature anomalies were estimated for the entire gulf as shown in Table 1. The lower panel of Figure 2 shows the temperature anomalies at selected depths (marked with horizontal-colored lines in the upper panel). It is clear from the table and figure that the seasonal variability in temperature extends to the maximum depth, where the seasonal range varies from about 12 °C at the surface to about 3 °C at the depth of 75 m.
As a result, the OHC was estimated from the surface to the maximum depth at each grid for all months. The monthly mean heat content was calculated by accumulating, for each grid, each heat content layer from the maximum depth to the surface. The annual mean estimated from the monthly values, accordingly, the anomalies of the monthly OHC were estimated to show the seasonal variability.
3. Results and Discussion
3.1. Monthly OHC of AG to Maximum Depth
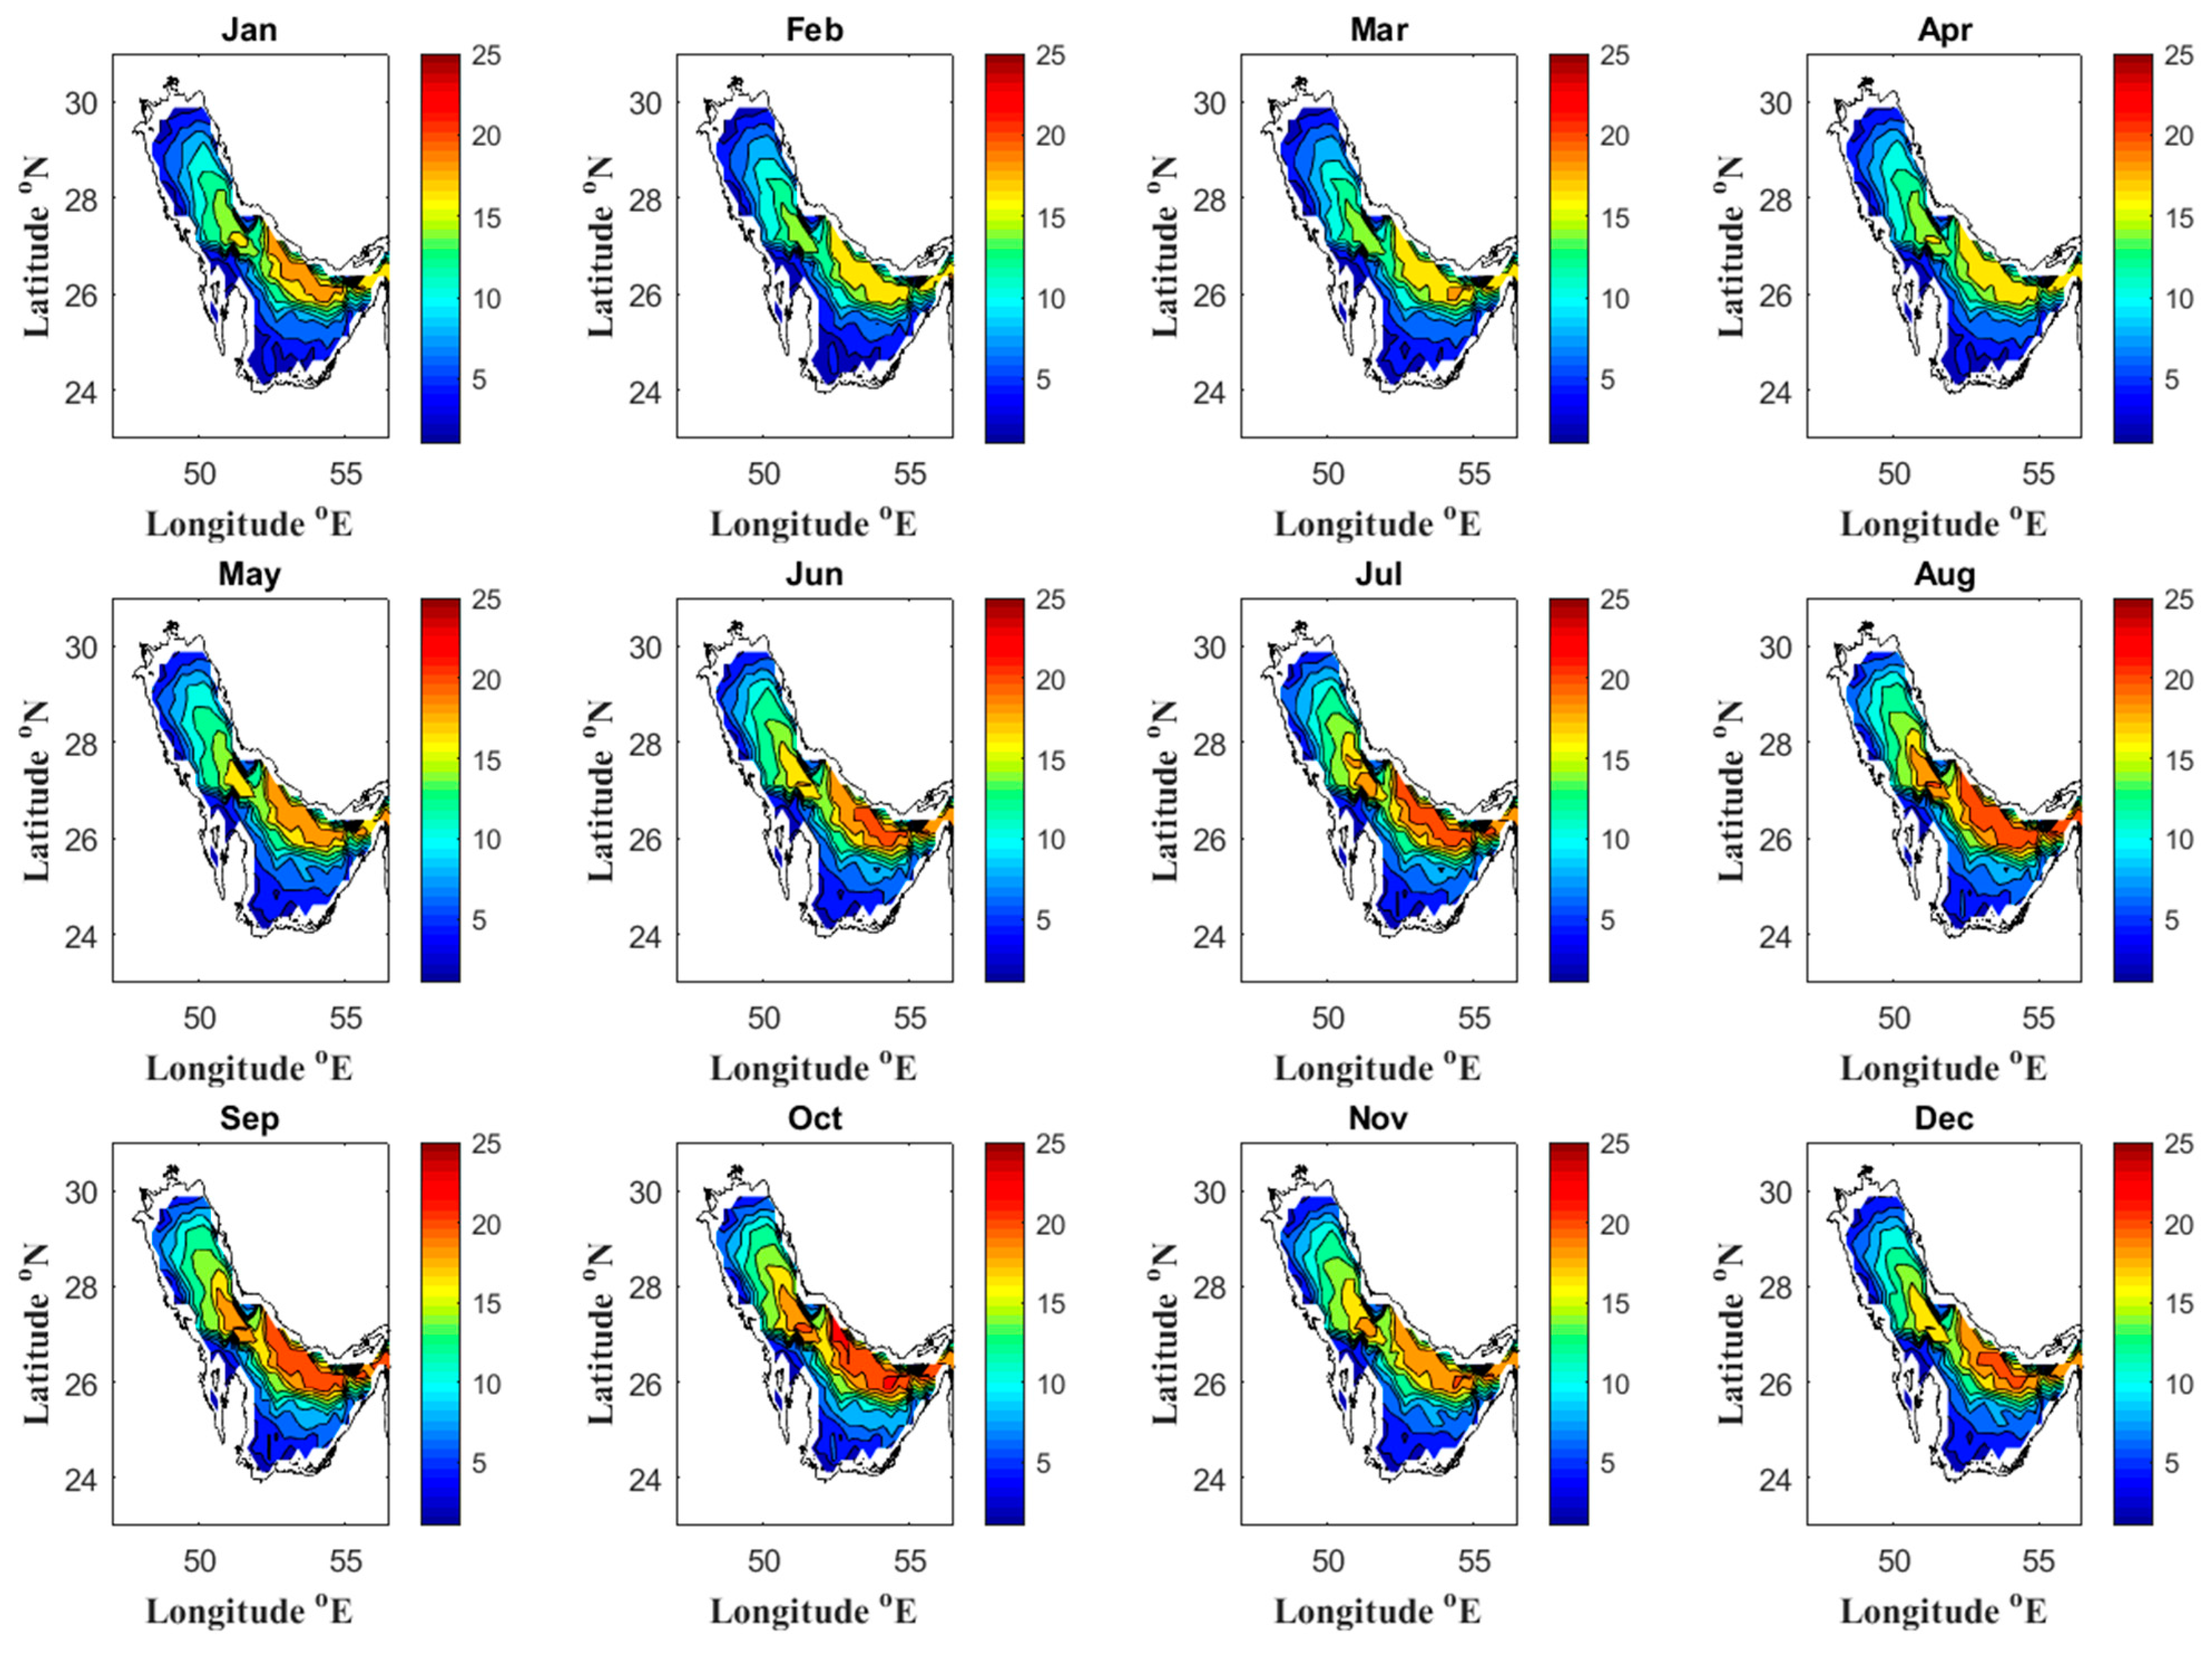
Figure 3 shows the heat content for the water column from the surface to the maximum depth at each grid for all months. It is clear from the figure that the highest heat contents are in August, September, and October. This result is expected, since these months represent late summer/early autumn, which means that the water acquired and stored heat throughout the summer months, which subsequently increased the water heat content. The minimum heat content was found in February followed by March and April, and this result is also expected since those months represent winter and the beginning of spring. The horizontal distribution of the surface OHC shows higher values in the southeastern part of the Gulf more than in the entire basin due to its greater depth, which agrees with the findings of Pous et al. [49].
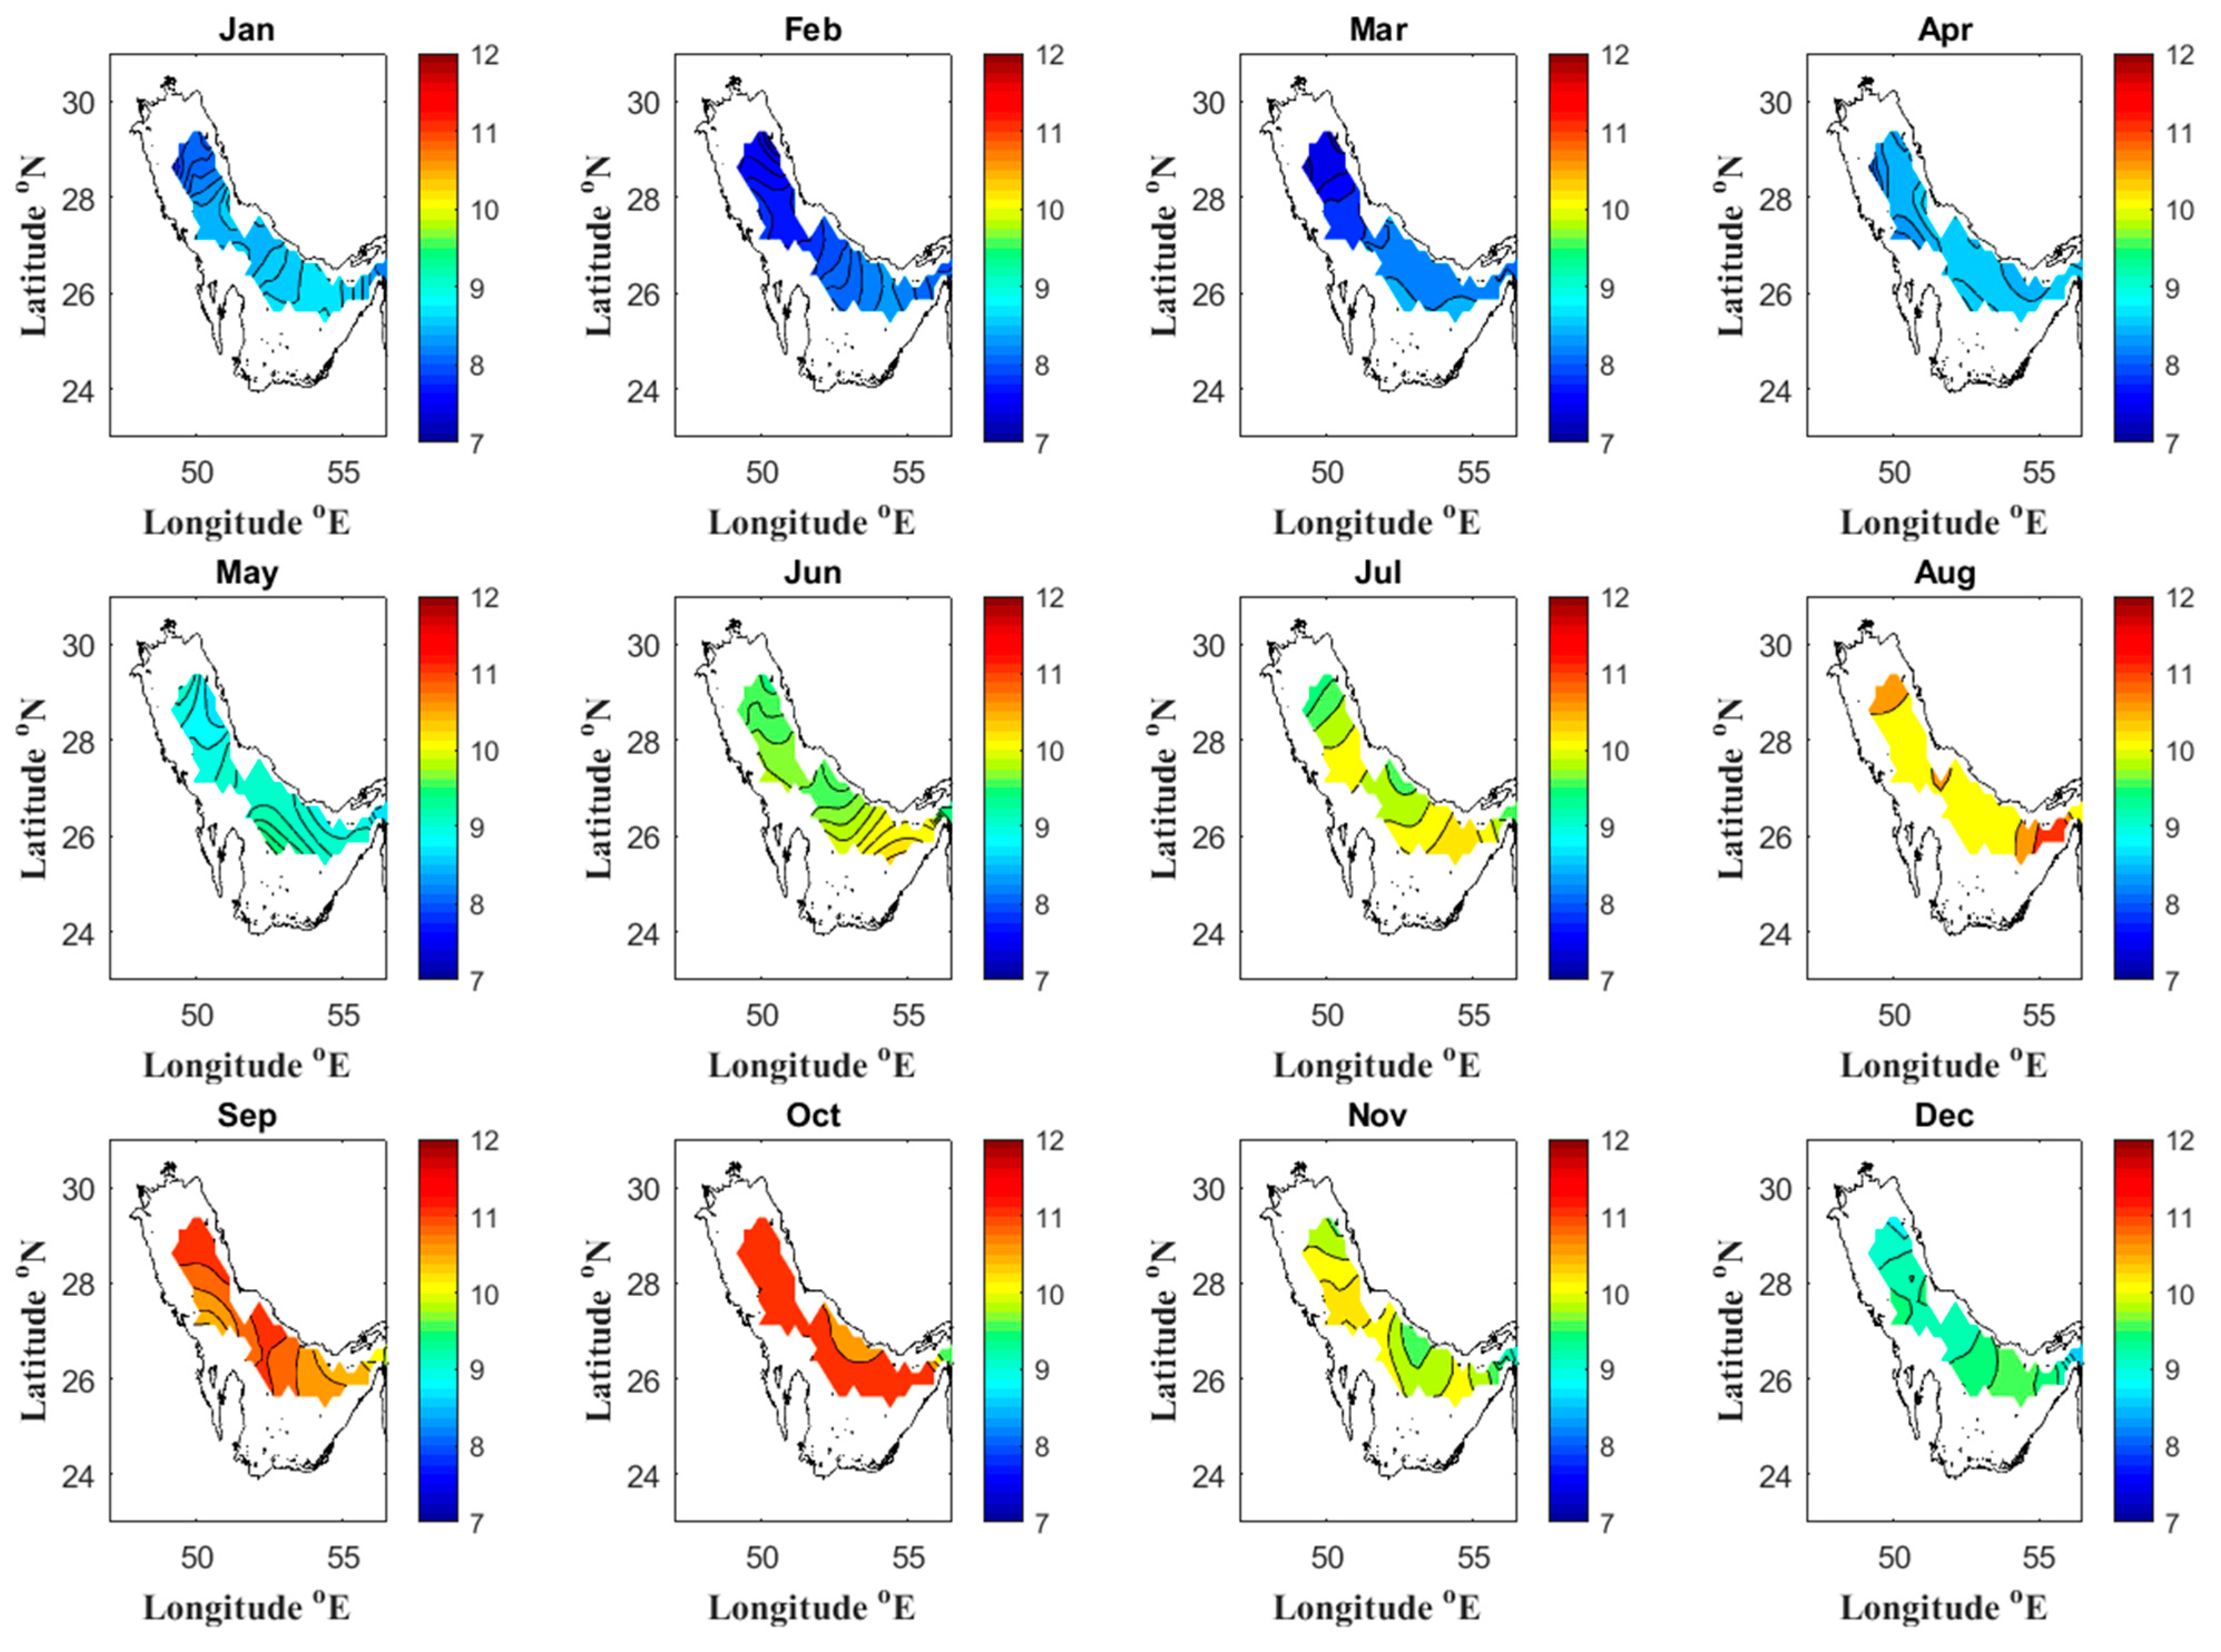
In order to obtain a clear picture of OHC horizontal distribution, the OHC is re-estimated from the surface to a depth of 35 m, which represents the average depth of the Gulf. Figure 4 shows the heat content for the water column from the surface to 35 m for all months. From the figure, it is clear that the highest heat contents were found in late summer to early autumn (September and October), while the minimum heat content was found in late winter to early spring (February and March). This seasonal variability in heat content estimated to 35 m is similar to the heat content estimated to the maximum depth. From the same figure, it is obvious that during winter and spring, the northern part of the Gulf showed a lower heat content compared to the southern and southeastern parts. Moreover, the heat content during summer horizontal distributions is almost the same for the entire Gulf.
3.2. Average Annual Heat Content of AG
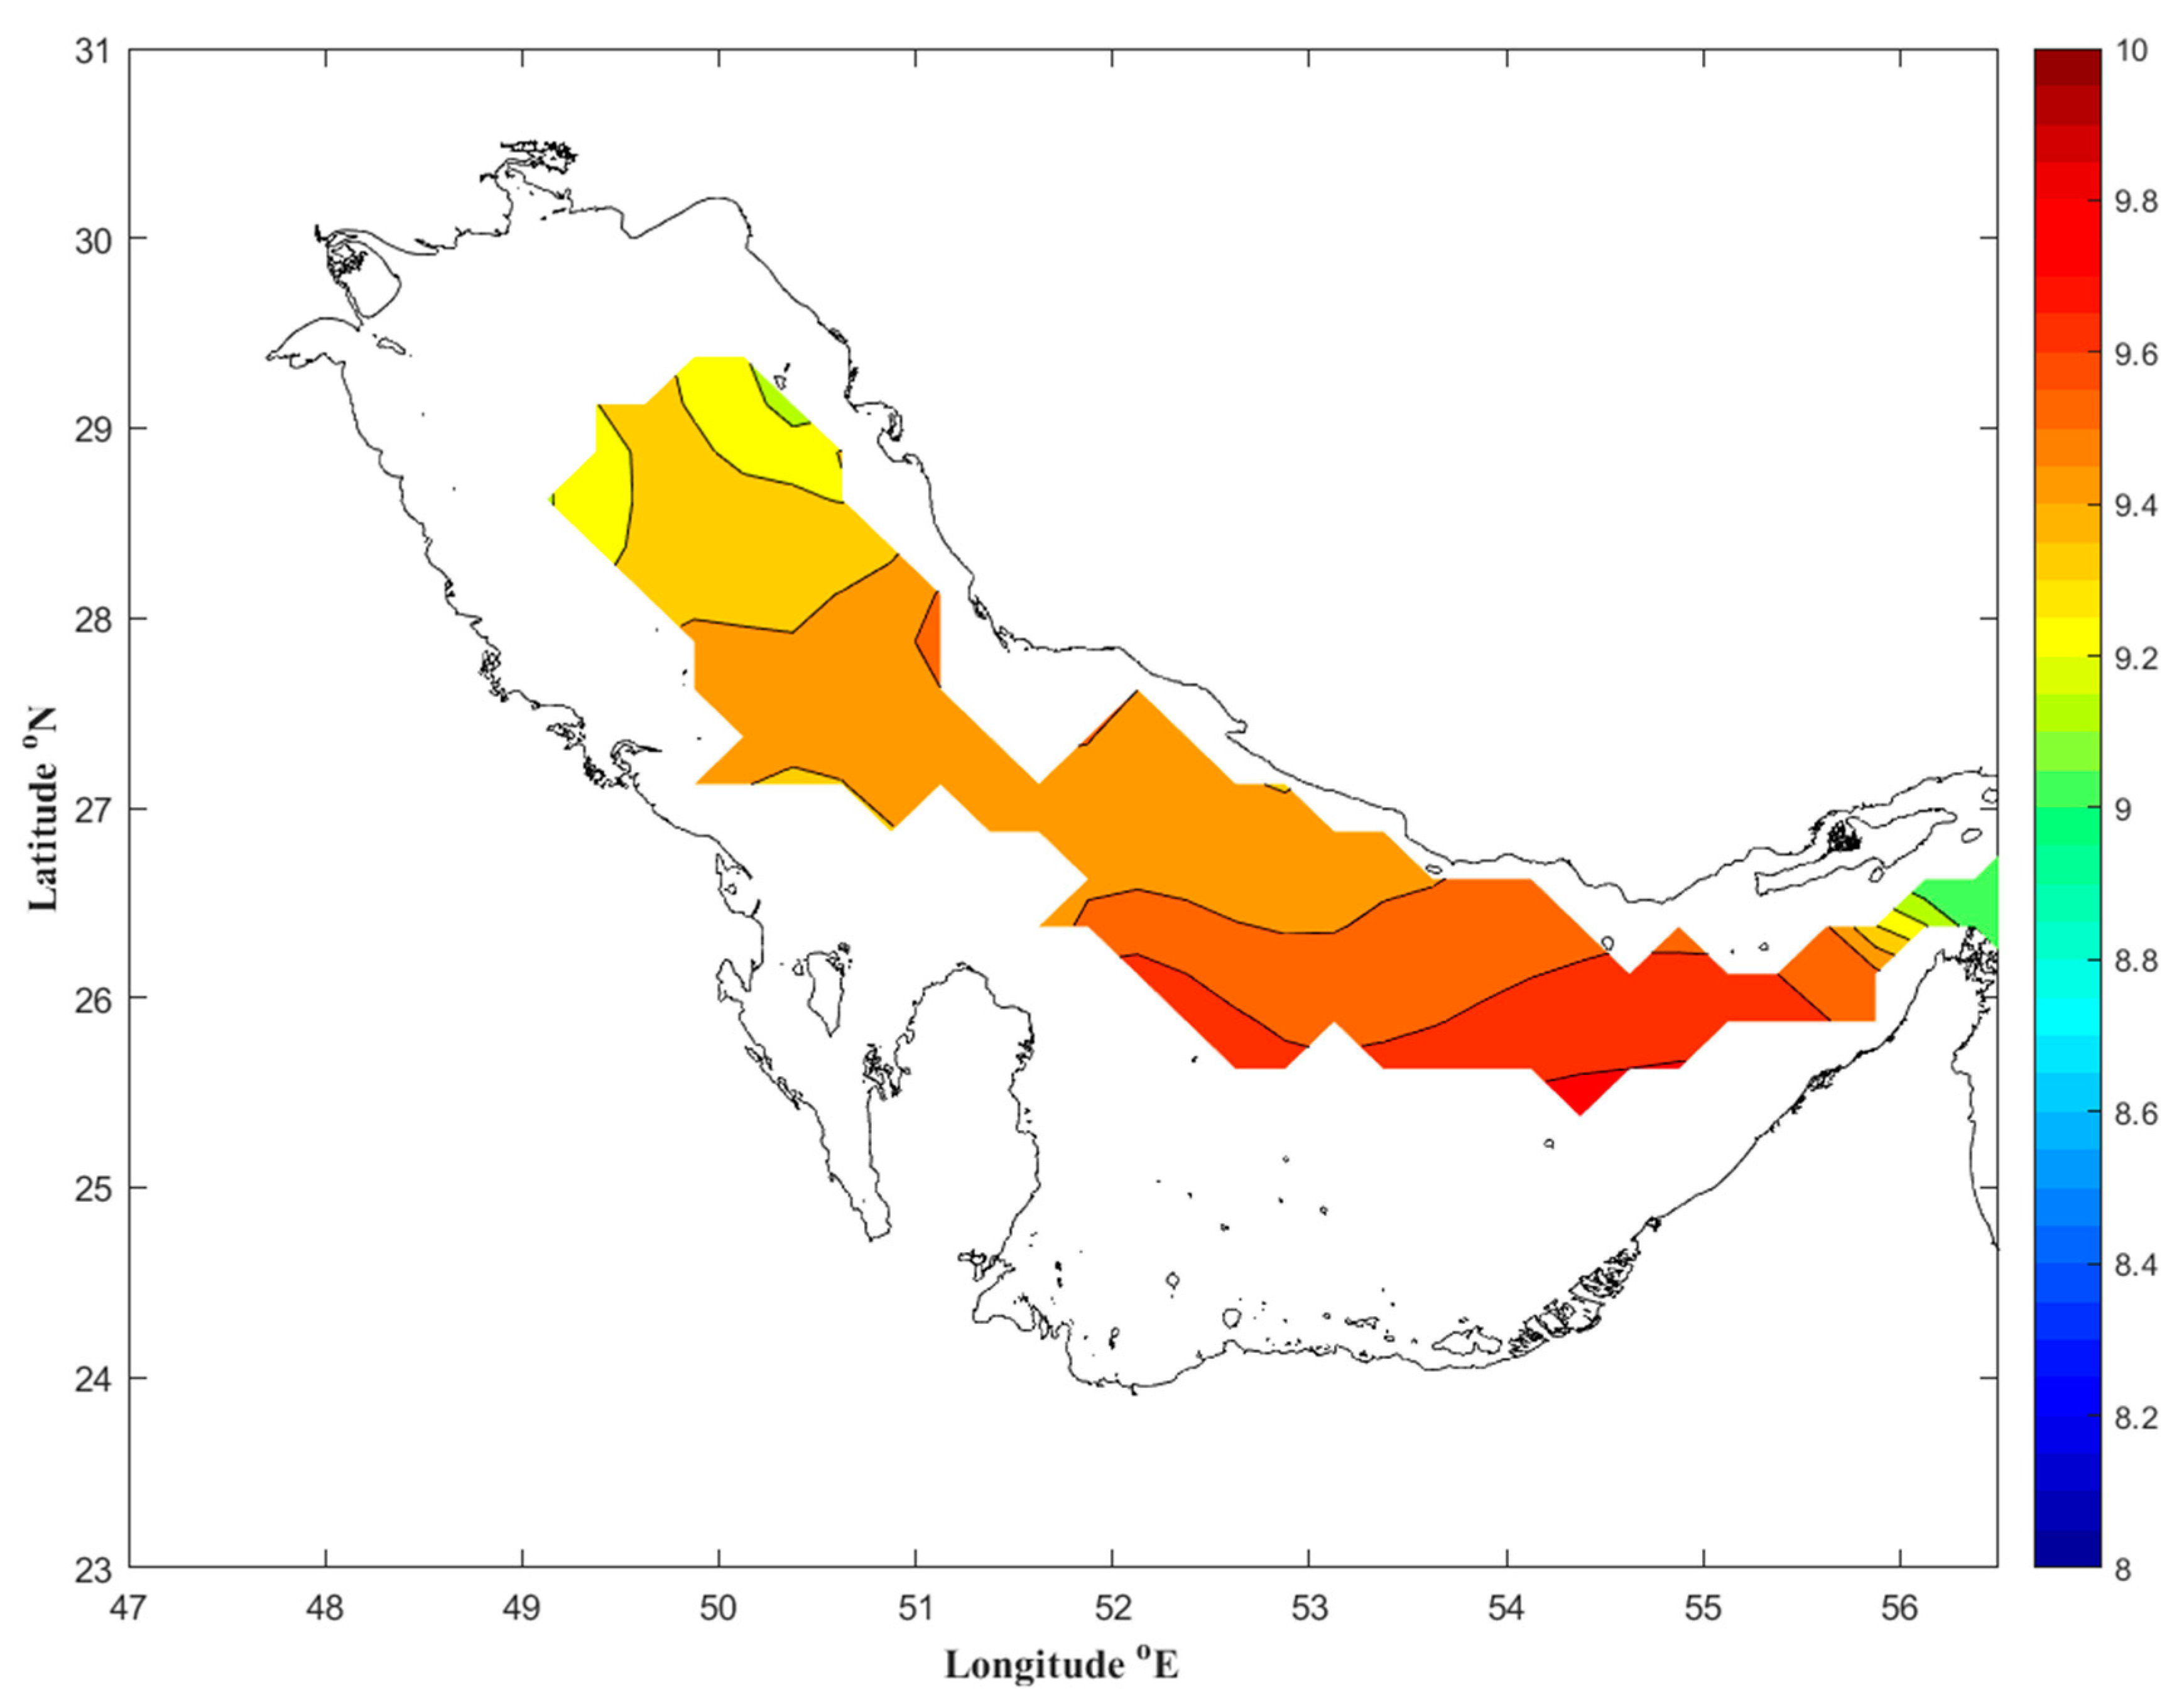
Figure 5 shows the average annual heat content of the AG. In general, the highest heat content in the AG region reached about 9.6 to 9.7 × 10⁷ Jm−2 in the area located between longitudes 54 and 55 and latitudes 25 and 26 in the southeastern region. This heat content decreases in the north and west direction to become the lowest in the far north region of the AG. Many factors may contribute to this degradation in heat content between the different regions of the AG. Among these is Shamal wind, which is cold during winter, and which creates heat flux differences between the north and south regions of the Gulf. In addition, the cold freshwater input of the major rivers at Shatt-Al-Arab, at the head of the Gulf, arrives from areas considered colder than the AG region. This process lowers the temperature and thus reduces the heat content of the northern part of the AG. At the south end of the Gulf, the narrow Strait of Hormuz restricts water exchange between the AG and the northern Indian Ocean [25], thus also reducing the temperature exchange, which may contribute to increasing the heat content in that region.
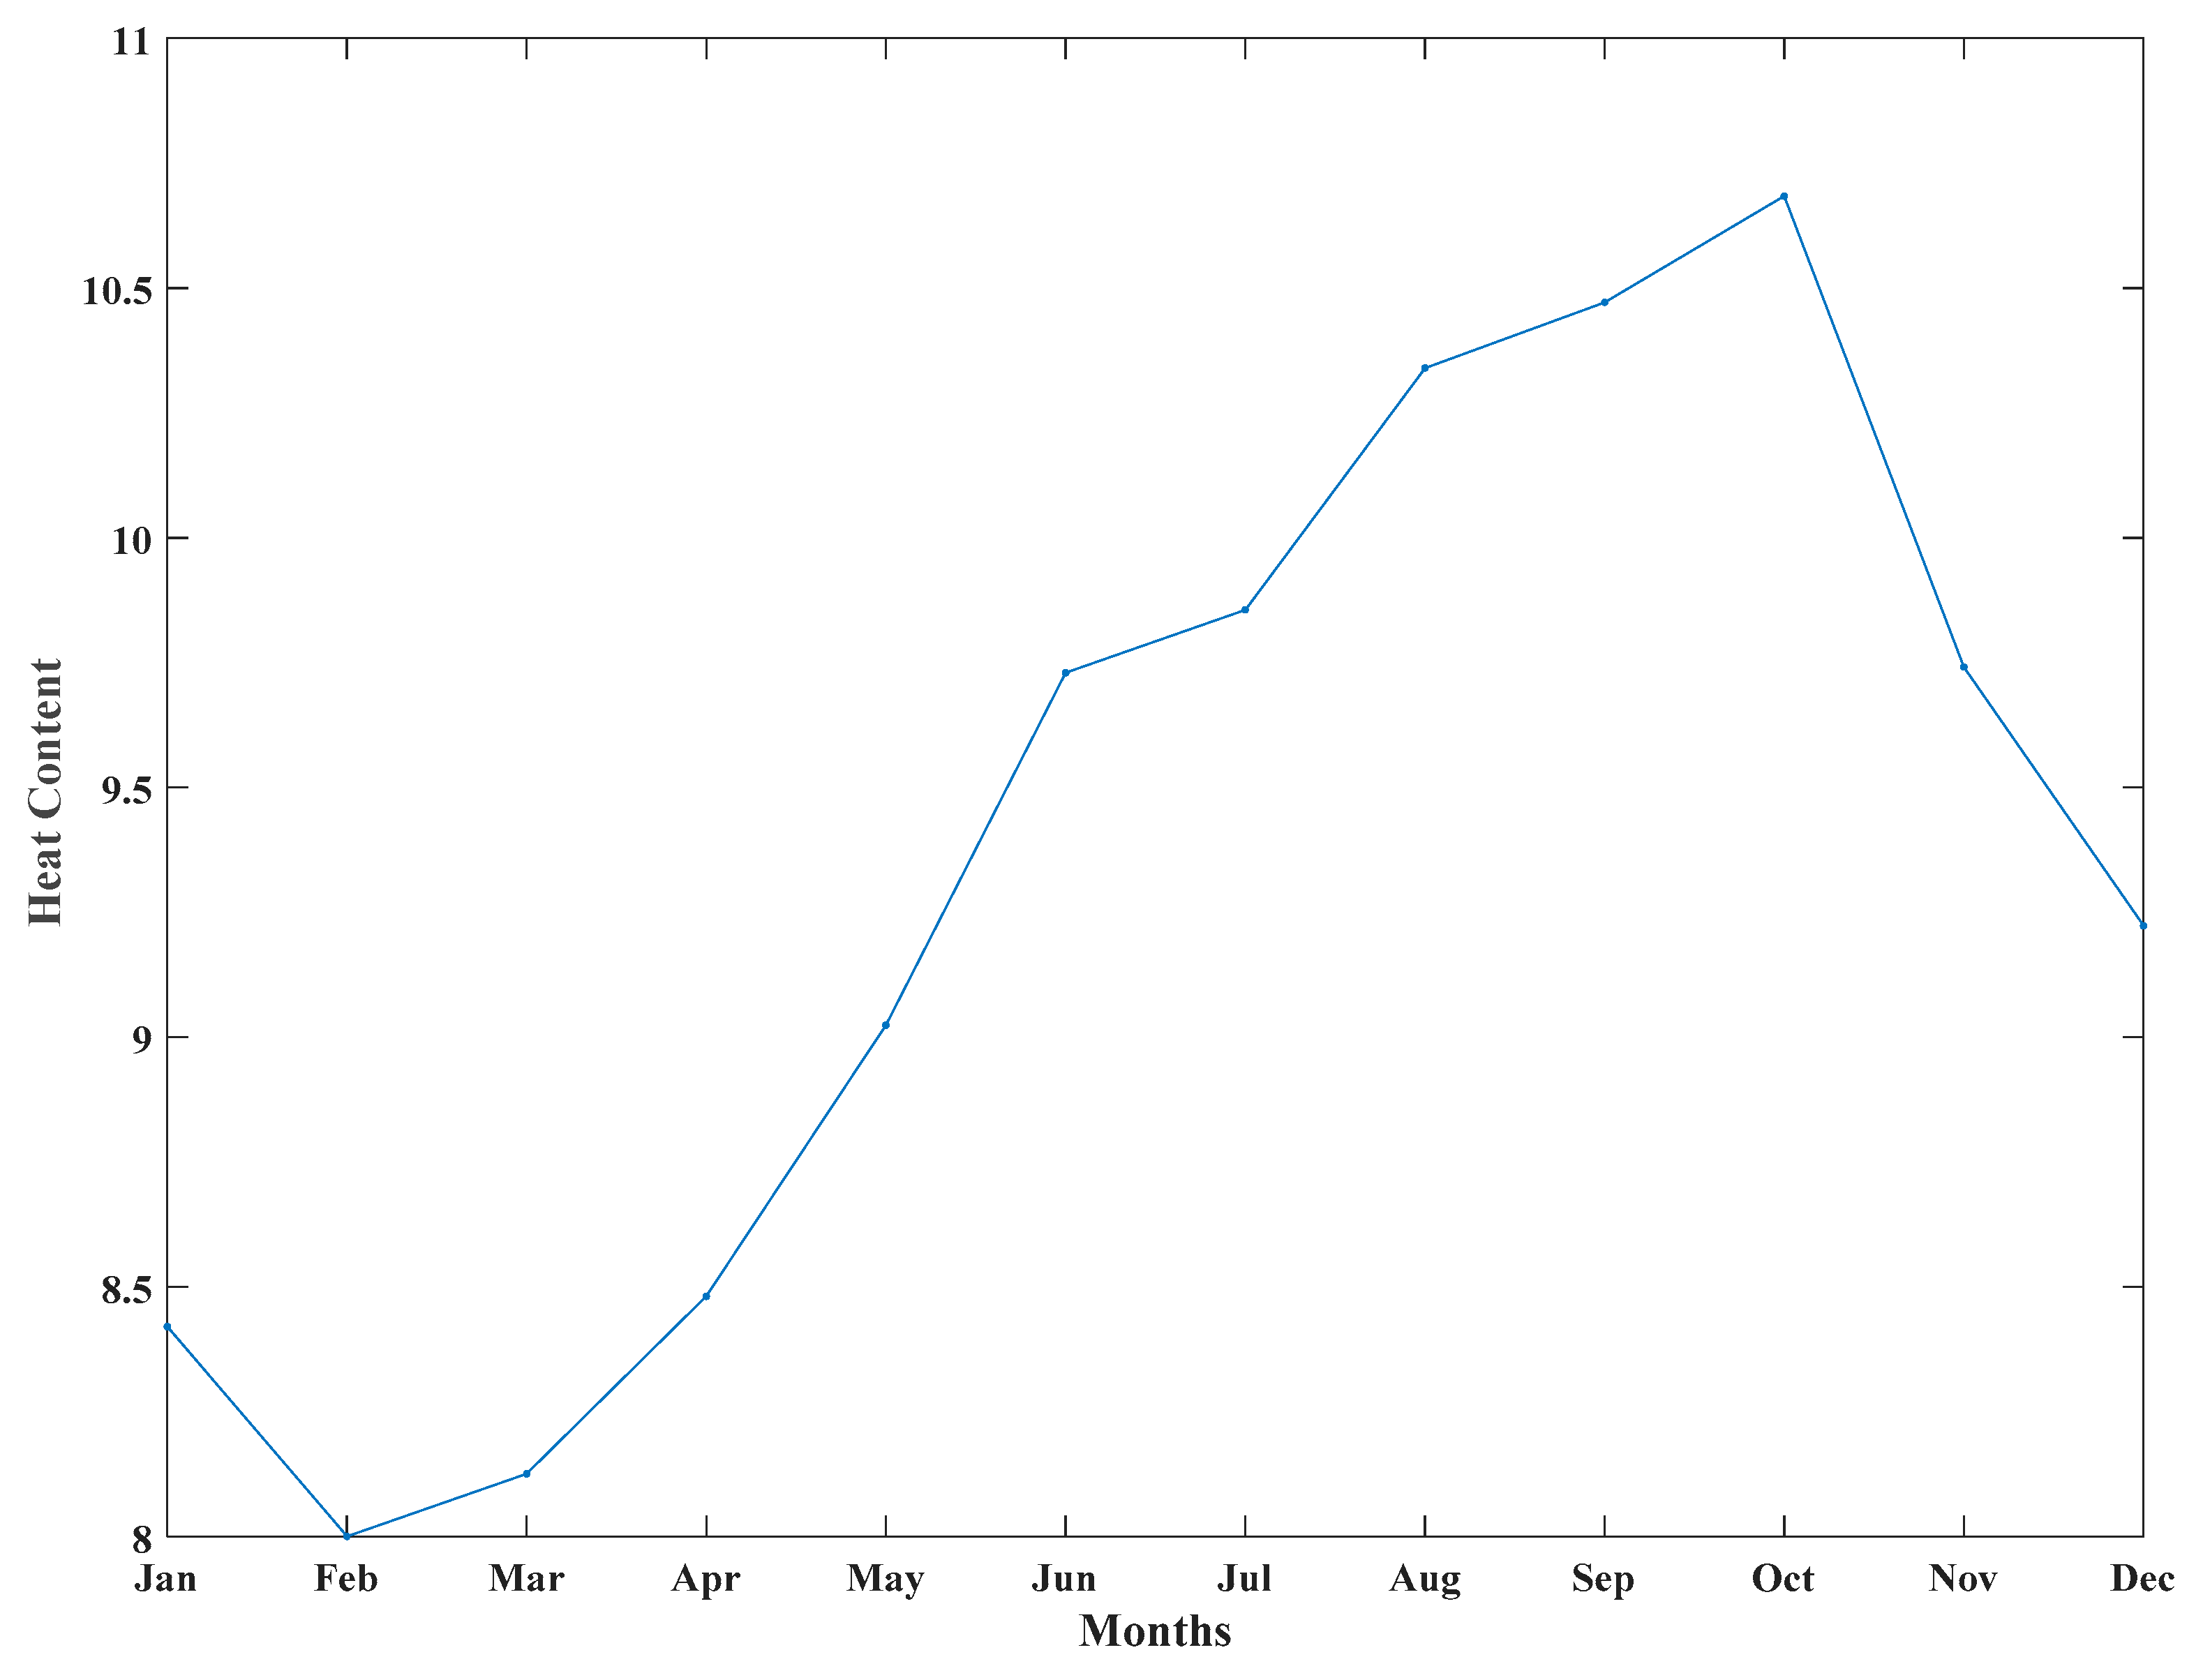
The monthly spatial average heat content shown in Figure 6 implies that the highest heat content of AG water was found in September and October, where it reached about 10.7 × 10⁷ Jm−2, while the lowest heat content was found in February and March, where it reached about 8.0 × 10⁷ Jm−2.
3.3. Monthly Heat Content Anomalies
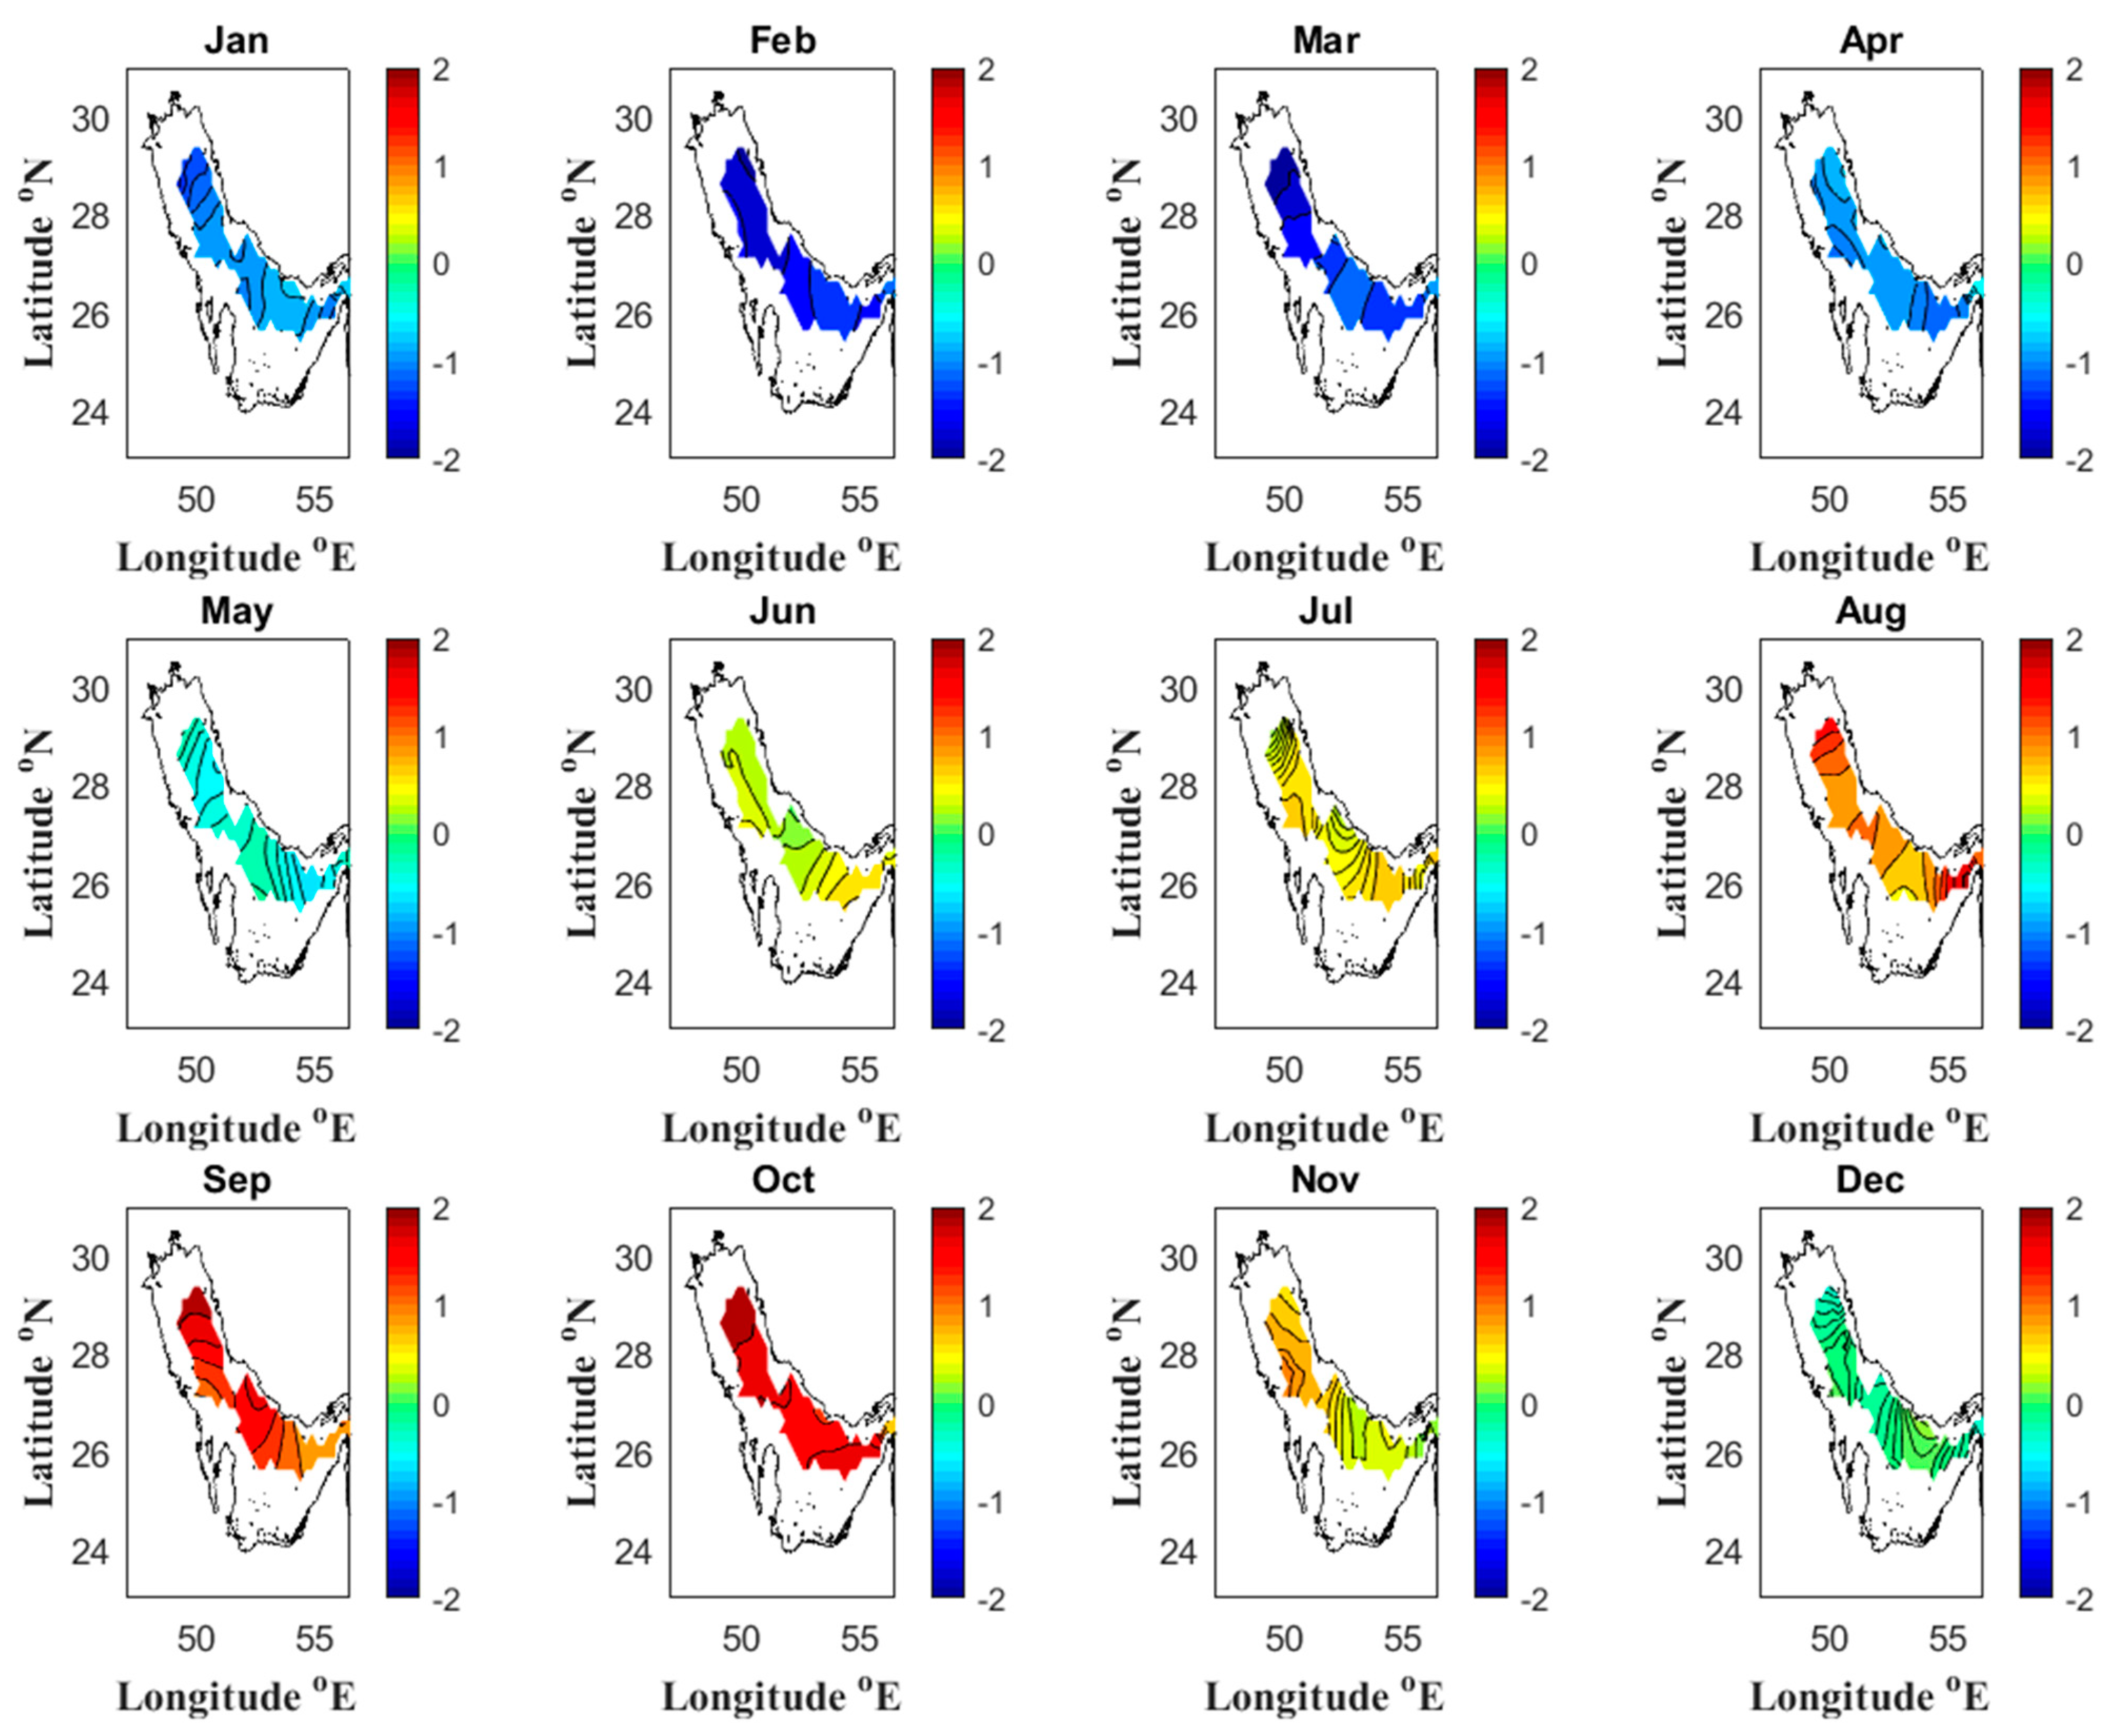
The heat content anomalies (with reference to 35m depth) shown in Figure 7 indicate that December is the closest month to the average heat content compared with all months. In May, the anomalies are about −0.5 × 10⁷ Jm−2, while in February and March the values are about −2 × 10⁷ Jm−2, which is the lowest heat content compared to the average. September and October have the highest heat content compared to the average (1.5 to 2 × 10⁷ Jm−2). The results show that heat content anomalies are concentrated in the northern region of the Gulf. On the contrary, in the southeastern part near the Strait of Hormuz, the OHC anomalies have the lowest values due to the increase in depth in this region [50] which results from less temperature variability in comparison to the rest of the Gulf (due to the high heat capacity of the water).
3.4. The Heat Flux at the Surface
3.4.1. Seasonal Variability in Atmospheric Parameters and Surface Temperature
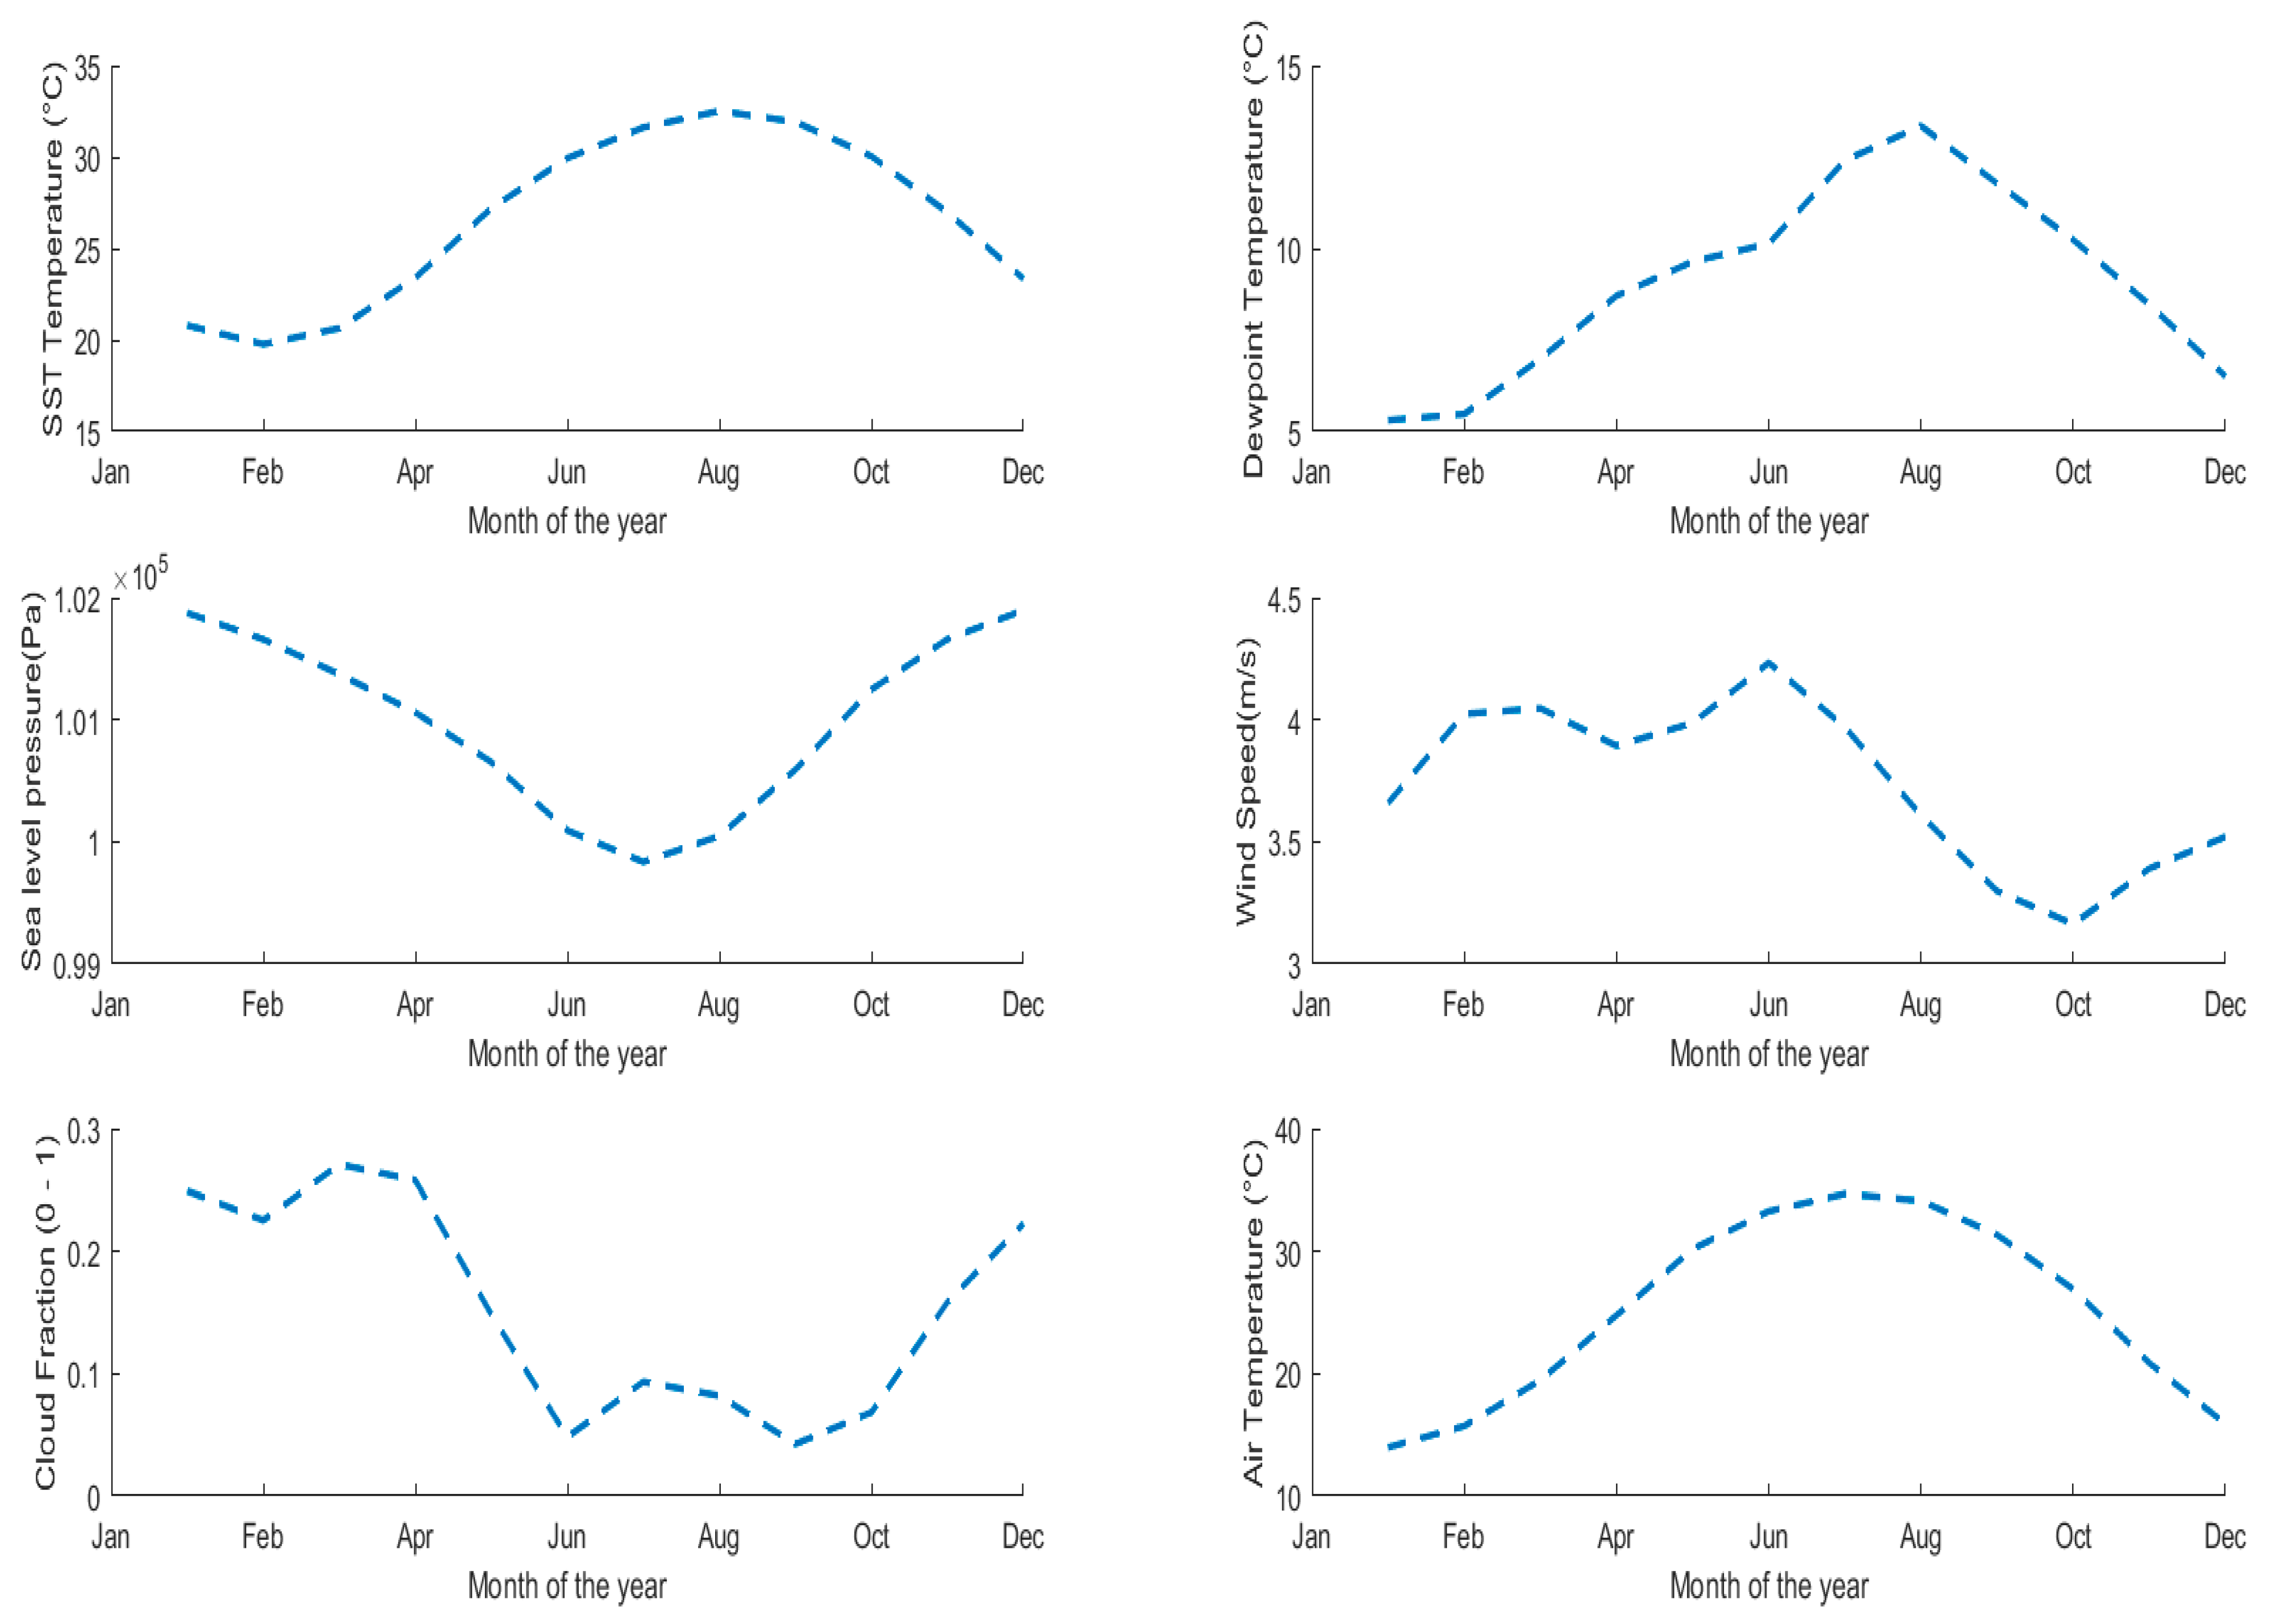
Before estimating the heat flux components, the meteorological parameters used in the estimation includes the monthly mean variations in air temperature (T), surface sea temperature (SST), sea level pressure (Pa), cloud fraction (0–1), dewpoint temperature (°C) and wind speed (Ws) of AG (one-year period; 2017 has been chosen to show seasonal variations). The monthly values are listed in Table 2 and plotted in Figure 8.
The SST shows the annual cycle clearly, where it was the minimum in the winter season, especially in February (20 °C), increasing steadily from April (25 °C) to almost reach maximum value in August (32.5 °C) and then decreasing gradually again towards the end of year. The Dewpoint temperature shows a similar pattern, as the minimum was in January (5.2 °C), increasing gradually to reach the value of (13.8 °C) in August and then decreasing gradually again towards the end of the year. Regarding the sea level pressure (Pa), it showed an opposite behavior to that of SST, and this is expected because with SST increasing, the air temperature increases and air density decreases, and thus the sea level pressure decreases. As sea level pressure was the maximum in January (1.02 × 10⁵), it decreased to gradually reach the minimum in July (1 × 10⁵) and then it increased again to the maximum (1.02 × 10⁵) in December. The mean wind speed was fluctuating between low and high during the year, as the wind speed ranged between 3.2 m/s and 4.2 m/s. According to our results, there is no relationship between wind speed and SST, and this contradicts with several previous studies that show that there is a negative relationship between SST and wind speed [51,52,53,54]. Cloud fraction (0–1) also showed fluctuant behavior between high and low, and did not show a clear effect on SST, as the month of March had the highest humidity (0.27) while September was the least humid (0.048).
3.4.2. Seasonal Variability in Heat Flux
Figure 9 and Table 3 show the computations of the annual cycle of heat flux at the surface of the AG at the air–sea interface depending on atmospheric and oceanographic data. The shortwave radiation (Qs) had the highest values that ranged between 230 and 250 Wm−2 from 150 days until nearly 250 days, which means from May until August. This consents with Ahmad and Sultan [47], who found that the highest values of Qs were from May until August and ranged between 254 and 275 Wm−2, and Sultan and Elghribi [55], who found that the highest values of Qs were from May until August and ranged between 250 and 275 Wm−2, while Xue and Eltahir [38] found higher values for Qs that ranged between 320 and 350 Wm−2 from May until August.
The value of sensible heat flux (Qh) in our study started from 25 Wm−2 and decreased to reach almost −25 Wm−2 at the period from May until July, then increases to about 25 Wm−2 at the end of the year. Ahmad and Sultan [47] also found that the value of Qh was positively started from 20 Wm−2 and decreased to reach almost −40 Wm−2 at the period from May until July, then increased again to reach about 25 Wm−2 at the end of the year. Our results also consent with Sultan and Elghribi [55], who found that the value of Qh started from 0 and increased to reach almost 40 Wm−2 in June, then decreased again to 0 Wm−2 at the end of the year. Additionally, Xue and Eltahir [38] found that the Qh values were increasing from −10 at the start of the year to reach almost 20 Wm−2 in June, then decreasing to −20 Wm−2 at the end of the year.
Regarding the latent heat flux (Qe) in our study, it starts from about −77 Wm−2 and increased to reach −233 Wm−2 in July, then it starts decreasing to reach −100 Wm−2 at the end of the year. Xue and Eltahir [38] also found similar results indicating that Qe started from −130 Wm−2 and decreased to reach −10 Wm−2 in May, then increased to −180 Wm−2 at the end of the year. Ahmad and Sultan [47] also found that the Qe values started from −100 Wm−2 and then increased to reach −300 Wm−2 in July, then decreased to reach −100 Wm−2 at the end of the year. Furthermore, Sultan and Elghribi [55] found that the Qe values started from −100 Wm−2 and increased to reach −300 Wm−2 in July, then decreased to reach −100 Wm−2 at the end of the year.
The net upward longwave radiation (Ql) in our study also started from −100 Wm−2 then decreased to reach −35 Wm−2 during summertime, then increased back to −100 Wm−2 again at the end of the year. Our results here are consistent with Ahmad and Sultan [47], who found that the Ql started from −100 Wm−2 then decreased to reach −40 Wm−2 at the period between May until August, then increased to −90 Wm−2 at the end of the year. Sultan and Elghribi [55] found that the Ql started from −70 Wm−2 and decreased to reach −40 Wm−2 in June, then increased to −90 Wm−2 at the end of the year. Xue and Eltahir [38] found similar results.
The net heat gain or loss Qt in the present study show gain for the period from March to May, with a maximum gain in April reaching 49 Wm−2. The net heat flux shows heat loss for the rest of the year, with a maximum loss of −86 Wm−2 during November. Ahmad and Sultan [47] found lower values for the Qt, which started from −80 and increased to 80 Wm−2 at the period from March to May, then decreased to −70 Wm−2 in August, then increased to −20 Wm−2 in September, then reached −70 Wm−2 at the end of the year, while Sultan and Elghribi [55] found that the Qt started at 0 Wm−2 and increased to 80 in March, then decreased to −60 Wm−2 in June, and after that it increased to 10 Wm−2 in September, then finally it reached −70 Wm−2 in November and −50 at the end of the year. Xue and Eltahir [38] found higher values for the Qt that started from 50 Wm−2 and increased to 220 Wm−2 in June, then decreased again to 50 Wm−2 at the end of the year.
The differences between some results in different studies may be due to the difference in the source of information and the period in which the readings were taken, as well as the difference in the equations that produced the different results in the different studies.
However, in general, there is a convergence between the results of our study and the results of the various previous studies mentioned earlier at different times. This may be due to the fact that the Arabian Gulf is a semi-closed region that remains in a stable state for long periods [56].
4. Conclusions
The OHC in the AG indicates that it gains its highest values out of all the months in summer-to-early autumn for the water column from the surface to the maximum depth. However, the minimum values were estimated in late winter to early spring. The horizontal distribution of the surface OHC shows that the lowest heat content seen in the northern part of the gulf during winter and spring compared with the southern and southeastern parts. However, the horizontal heat content distributions during summer are almost the same for the entire Gulf. According to this study, the highest heat content estimations are located between longitudes 54° and 55° E and latitudes 25° and 26° N in the southeastern region. Furthermore, many factors may contribute to this change in horizontal heat content distribution in the Gulf. Among them, in the north, Shamal winds and the cold freshwater input at the head of the Gulf reduce the surface temperature, while in the southeastern part of the Gulf, the narrow Strait of Hormuz restricts water exchange between the AG and the northern Indian Ocean, thus also reducing the temperature exchange, which may contribute to increasing the heat content in that region. The heat content anomalies with reference to the 35 m depth indicate that December is the closest month to the average values. Extreme negative values were in February and March and extreme positive values were in August, September, and October. Furthermore, the results showed that the heat content anomalies are concentrated in the northern region of the Gulf. On the contrary, in the southeastern part near the Strait of Hormuz, the OHC anomalies have the lowest values due to the increase in depth in this region.
The shortwave radiation had the highest values from May until August, while the sensible heat flux had the lowest values from May until July, increasing to its highest value in December. The latent heat flux shows the lowest values during the beginning of the year and its highest value in July. The net upward longwave radiation also shows the lowest values during summer, with its highest values were during winter. In general, the annual cycle of heat flux at the surface of the AG shows the highest heat gain was from April (spring), while the highest loss was in November (autumn). The water exchange between the AG and Indian Ocean through the Strait of Hormuz may play a major role in the seasonal variability in OHC.
Author Contributions
Conceptualization, A.Y.A. and M.A.A.; methodology, A.Y.A., A.M.T. and M.A.A.; software, T.M.A., A.Y.A. and A.M.T.; validation, A.Y.A., A.M.A.-S. and M.A.A.; formal analysis, A.Y.A.; investigation, A.Y.A., M.A.A. and A.M.A.-S.; resources, A.Y.A., A.M.A.-S., T.M.A. and M.A.A.; data curation, A.Y.A.; writing—original draft preparation, A.Y.A.; writing—review and editing, A.Y.A., A.M.A.-S., T.M.A. and M.A.A.; visualization, A.Y.A. and T.M.A.; supervision, A.Y.A. and A.M.A.-S. All authors have read and agreed to the published version of the manuscript.
Funding
This research received no external funding.
Institutional Review Board Statement
Not applicable.
Informed Consent Statement
Not applicable.
Data Availability Statement
No new data were created.
Conflicts of Interest
The authors declare no conflict of interest.
References
- Huhn, O.; Rhein, M.; Hoppema, M.; van Heuven, S. Decline of deep and bottom water ventilation and slowing down of anthropogenic carbon storage in the Weddell Sea, 1984–2011. Deep. Sea Res. Part I Oceanogr. Res. Pap. 2013, 76, 66–84. [Google Scholar] [CrossRef]
- Meyssignac, B.; Boyer, T.; Zhao, Z.; Hakuba, M.Z.; Landerer, F.W.; Stammer, D.; Köhl, A.; Kato, S.; L’ecuyer, T.; Ablain, M.; et al. Measuring global ocean heat content to estimate the Earth energy imbalance. Front. Mar. Sci. 2019, 6, 432. [Google Scholar] [CrossRef] [Green Version]
- Santos, F.D. Time, Progress, Growth and Technology: How Humans and the Earth Are Responding; Springer: Berlin/Heidelberg, Germany, 2020. [Google Scholar]
- Zanna, L.; Khatiwala, S.; Gregory, J.M.; Ison, J.; Heimbach, P. Global reconstruction of historical ocean heat storage and transport. Proc. Natl. Acad. Sci. USA 2019, 116, 1126–1131. [Google Scholar] [CrossRef] [Green Version]
- Shaika, N.A.; Alhomaidi, E.; Sarker, M.M.; An Nur, A.; Sadat, M.A.; Awal, S.; Mostafa, G.; Hasan, S.J.; Mahmud, Y.; Khan, S. Winter Bloom of Marine Cyanobacterium, Trichodesmium erythraeum and Its Relation to Environmental Factors. Sustainability 2023, 15, 1311. [Google Scholar] [CrossRef]
- Houghton, J. Global Warming: The Complete Briefing; Cambridge University Press: Cambridge, UK, 2009. [Google Scholar]
- Nath, S.; Kotal, S.D.; Kundu, P.K. Decadal variation of ocean heat content and tropical cyclone activity over the Bay of Bengal. J. Earth Syst. Sci. 2016, 125, 65–74. [Google Scholar] [CrossRef] [Green Version]
- Rhein, M.; Rintoul, S.R.; Aoki, S.; Campos, E.; Chambers, D.; Feely, R.A.; Gulev, S.; Johnson, G.C.; Josey, S.A.; Kostianoy, A.; et al. Observations: Ocean. In Climate Change 2013: The Physical Science Basis, 3rd ed.; Cambridge University Press: Cambridge, UK; New York, NY, USA, 2013; pp. 255–316. [Google Scholar]
- Cheng, L.; Abraham, J.; Zhu, J.; Trenberth, K.E.; Fasullo, J.; Boyer, T.; Locarnini, R.; Zhang, B.; Yu, F.; Wan, L.; et al. Record-setting ocean warmth continued in 2019. Adv. Atmos. Sci. 2020, 37, 137–142. [Google Scholar] [CrossRef] [Green Version]
- Radjawane, I.M.; Bernawis, L.I.; Priyono, B.; Fadli, M.; Putuhena, H.S. Interannual variation of ocean heat content in outer Indonesian waters in warming ocean (Case study: West Sumatra waters). AIP Conf. Proc. 2015, 1677, 060015. [Google Scholar]
- Nagamani, P.V.; Ali, M.M.; Goni, G.J.; Udaya Bhaskar, T.V.; McCreary, J.P.; Weller, R.A.; Rajeevan, M.; Gopala Krishna, V.V.; Pezzullo, J.C. Heat content of the Arabian Sea mini warm pool is increasing. Atmos. Sci. Lett. 2016, 17, 39–42. [Google Scholar] [CrossRef] [Green Version]
- Zhou, X.; Ray, P.; Barrett, B.S.; Hsu, P.C. Understanding the bias in surface latent and sensible heat fluxes in contemporary AGCMs over tropical oceans. Clim. Dyn. 2020, 55, 2957–2978. [Google Scholar] [CrossRef]
- Cronin, M.F.; Gentemann, C.L.; Edson, J.; Ueki, I.; Bourassa, M.; Brown, S.; Clayson, C.A.; Fairall, C.W.; Farrar, J.T.; Gille, S.T.; et al. Air-sea fluxes with a focus on heat and momentum. Front. Mar. Sci. 2019, 6, 430. [Google Scholar] [CrossRef] [Green Version]
- Kim, J.; Lee, Y.G. Characteristics of Satellite-Based Ocean Turbulent Heat Flux around the Korean Peninsula and Relationship with Changes in Typhoon Intensity. Remote Sens. 2020, 13, 42. [Google Scholar] [CrossRef]
- Gulev, S.K.; Latif, M.; Keenlyside, N.; Park, W.; Koltermann, K.P. North Atlantic Ocean control on surface heat flux on multidecadal timescales. Nature 2013, 499, 464–467. [Google Scholar] [CrossRef]
- Roberts, C.D.; Palmer, M.D.; Allan, R.P.; Desbruyeres, D.G.; Hyder, P.; Liu, C.; Smith, D. Surface flux and ocean heat transport convergence contributions to seasonal and interannual variations of ocean heat content. J. Geophys. Res. Ocean. 2017, 122, 726–744. [Google Scholar] [CrossRef]
- Kamenkovich, I.; Marotzke, J.; Stone, P.H. Factors affecting heat transport in an ocean general circulation model. J. Phys. Oceanogr. 2000, 30, 175–194. [Google Scholar] [CrossRef]
- Bharti, V.; Fairall, C.W.; Blomquist, B.W.; Huang, Y.; Protat, A.; Sullivan, P.P.; Siems, S.T.; Manton, M.J. Air-sea heat and momentum fluxes in the Southern Ocean. J. Geophys. Res. Atmos. 2019, 124, 12426–12443. [Google Scholar] [CrossRef] [Green Version]
- Hong, G.M.; Kwon, B.H.; Kim, Y.S. Heat fluxes in the marine atmospheric surface layer around the Korean Peninsula based on satellite data. J. Fish. Mar. Sci. Educ. 2005, 17, 209–217. [Google Scholar]
- Zhou, S.; Zhai, X.; Renfrew, I.A. The impact of high-frequency weather systems on SST and surface mixed layer in the central Arabian Sea. J. Geophys. Res. Ocean. 2018, 123, 1091–1104. [Google Scholar] [CrossRef]
- Terray, P.; Kamala, K.; Masson, S.; Madec, G.; Sahai, A.K.; Luo, J.J.; Yamagata, T. The role of the intra-daily SST variability in the Indian monsoon variability and monsoon-ENSO–IOD relationships in a global coupled model. Clim. Dyn. 2012, 39, 729–754. [Google Scholar] [CrossRef] [Green Version]
- Shinoda, T. Impact of the diurnal cycle of solar radiation on intraseasonal SST variability in the western equatorial Pacific. J. Clim. 2005, 18, 2628–2636. [Google Scholar] [CrossRef]
- Blomquist, B.W.; Brumer, S.E.; Fairall, C.W.; Huebert, B.J.; Zappa, C.J.; Brooks, I.M.; Yang, M.; Bariteau, L.; Prytherch, J.; Hare, J.E.; et al. Wind speed and sea state dependencies of air-sea gas transfer: Results from the High Wind speed Gas exchange Study (HiWinGS). J. Geophys. Res. Ocean. 2017, 122, 8034–8062. [Google Scholar] [CrossRef] [Green Version]
- Abualnaja, Y.O. Estimation of the net surface heat flux in the Arabian Gulf based on the equilibrium temperature. Mar. Sci. 2009, 20, 21–29. [Google Scholar] [CrossRef]
- Kämpf, J.; Sadrinasab, M. The circulation of the Persian Gulf: A numerical study. Ocean Sci. 2006, 2, 27–41. [Google Scholar] [CrossRef] [Green Version]
- Piontkovski, S.A.; Hamza, W.M.; Al-Abri, N.M.; Al-Busaidi, S.S.; Al-Hashmi, K.A. A comparison of seasonal variability of Arabian Gulf and the Sea of Oman pelagic ecosystems. Aquat. Ecosyst. Health Manag. 2019, 22, 108–130. [Google Scholar] [CrossRef]
- Thoppil, P.G.; Hogan, P.J. A modeling study of circulation and eddies in the Persian Gulf. J. Phys. Oceanogr. 2010, 40, 2122–2134. [Google Scholar] [CrossRef]
- Aboobacker, V.M.; Samiksha, S.V.; Veerasingam, S.; Al-Ansari, E.M.; Vethamony, P. Role of shamal and easterly winds on the wave characteristics off Qatar, central Arabian Gulf. Ocean Eng. 2021, 236, 109457. [Google Scholar] [CrossRef]
- Fett, R.W.; Mitchell, W.F.; Rabe, K.; Issacs, R.; Bohan, W.A.; Burk, S.D.; Tag, P.M.; Bohan, W.A.; Englebretson, R.E. Indian Ocean (Red Sea/Persian Gulf) weather analysis and forecast applications. Navy Tactical Appl. Guide 1983, 5, 83. [Google Scholar]
- Nandkeolyar, N.; Raman, M.; Kiran, G.S. Comparative analysis of sea surface temperature pattern in the eastern and western gulfs of Arabian Sea and the Red Sea in recent past using satellite data. Int. J. Oceanogr. 2013, 2013, 16. [Google Scholar] [CrossRef]
- Rezai, H.; Wilson, S.; Claereboudt, M.; Riegl, B. Coral reef status in the ROPME sea area: Arabian/Persian Gulf, Gulf of Oman and Arabian Sea. Status Coral Reefs World 2004, 1, 155–170. [Google Scholar]
- Al-Subhi, A.M. A comprehensive statistical analysis of nearly 35 years AVHRR SST data from the Arabian Gulf: Trends, anomalies, and intra-inter-annual seasonality. J. King Abdulaziz Univ. Mar. Sci. 2019, 29, 53–72. [Google Scholar]
- IPCC. Climate Change 2014: Synthesis Report. In Contribution of Working Groups I, II and III to the Fifth Assessment Report of the Intergovernmental Panel on Climate Change; Core Writing Team; Pachauri, R., Meyer, L., Eds.; IPCC: Geneva, Switzerland, 2014; p. 151. [Google Scholar]
- Riegl, B. Effects of the 1996 and 1998 positive sea-surface temperature anomalies on corals, coral diseases and fish in the Arabian Gulf (Dubai, UAE). Mar. Biol. 2002, 140, 29–40. [Google Scholar]
- Riegl, B. Climate change and coral reefs: Different effects in two high-latitude areas (Arabian Gulf, South Africa). Coral Reefs 2003, 22, 433–446. [Google Scholar] [CrossRef]
- Kabiri, K.; Pradhan, B.; Rezai, H.; Ghobadi, Y.; Moradi, M. Fluctuation of sea surface temperature in the Persian Gulf and its impact on coral reef communities around Kish Island. In Proceedings of the 2012 IEEE Colloquium on Humanities, Science and Engineering (CHUSER), Kota Kinabalu, Malaysia, 3–4 December 2012; pp. 164–167. [Google Scholar] [CrossRef]
- Kabiri, K.; Rezai, H.; Moradi, M.; Pourjomeh, F. Coral reefs mapping using parasailing aerial photography-feasibility study: Kish Island, Persian Gulf. J. Coast. Conserv. 2014, 18, 691–699. [Google Scholar] [CrossRef]
- Xue, P.; Eltahir, E.A. Estimation of the heat and water budgets of the Persian (Arabian) Gulf using a regional climate model. J. Clim. 2015, 28, 5041–5062. [Google Scholar] [CrossRef]
- Al Senafi, F.; Anis, A.; Menezes, V. Surface heat fluxes over the Northern Arabian Gulf and the Northern Red Sea: Evaluation of ECMWF-ERA5 and NASA-MERRA2 reanalyses. Atmosphere 2019, 10, 504. [Google Scholar] [CrossRef] [Green Version]
- Pous, S.; Lazure, P.; Carton, X. A model of the general circulation in the Persian Gulf and in the Strait of Hormuz: Intraseasonal to interannual variability. Cont. Shelf Res. 2015, 94, 55–70. [Google Scholar] [CrossRef] [Green Version]
- Garcia, H.E.; Weathers, K.W.; Paver, C.R.; Smolyar, I.; Boyer, T.P.; Locarnini, M.M.; Zweng, M.M.; Mishonov, A.V.; Baranova, O.K.; Seidov, D. World ocean atlas 2018. Vol. 4: Dissolved inorganic nutrients (phosphate, nitrate and nitrate+ nitrite, silicate). NOAA Atlas NESDIS 2019, 84, 35. [Google Scholar]
- Hersbach, H.; Bell, B.; Berrisford, P.; Hirahara, S.; Horányi, A.; Muñoz-Sabater, J.; Nicolas, J.; Peubey, C.; Radu, R.; Schepers, D.; et al. The ERA5 global reanalysis. Q. J. R. Meteorol. Soc. 2020, 146, 1999–2049. [Google Scholar] [CrossRef]
- Aboobacker, V.M.; Shanas, P.R.; Veerasingam, S.; Al-Ansari, E.M.; Sadooni, F.N.; Vethamony, P. Long-term assessment of onshore and offshore wind energy potentials of Qatar. Energies 2021, 14, 1178. [Google Scholar] [CrossRef]
- Siddig, N.A.; Al-Subhi, A.M.; Alsaafani, M.A.; Alraddadi, T.M. Applying Empirical Orthogonal Function and Determination Coefficient Methods for Determining Major Contributing Factors of Satellite Sea Level Anomalies Variability in the Arabian Gulf. Arab. J. Sci. Eng. 2022, 47, 619–628. [Google Scholar] [CrossRef]
- Maiyza, I.A. Heat storage in the eastern Mediterranean. J. Phys. Oceanogr. 1993, 23, 1259–1263. [Google Scholar] [CrossRef]
- Alraddadi, T.M. Temporal Changes in the Red Sea Circulation and Associated water Masses. Ph.D. Thesis, University of Southampton, Southampton, UK, 2013. [Google Scholar]
- Ahmad, F.; Sultan, S.A.R. Annual mean surface heat fluxes in the Arabian Gulf and the net heat transport through the Strait of Hormuz. Atmos. -Ocean. 1991, 29, 54–61. [Google Scholar] [CrossRef] [Green Version]
- Matsoukas, C.; Banks, A.C.; Hatzianastassiou, N.; Pavlakis, K.G.; Hatzidimitriou, D.; Drakakis, E.; Stackhouse, P.W.; Vardavas, I. Seasonal heat budget of the Mediterranean Sea. J. Geophys. Res. Ocean. 2005, 110, C12. [Google Scholar] [CrossRef]
- Pous, S.; Carton, X.J.; Lazure, P. A process study of the wind-induced circulation in the Persian Gulf. Open J. Mar. Sci. 2013, 3, 27160. [Google Scholar] [CrossRef] [Green Version]
- Hereher, M.E. Assessment of climate change impacts on sea surface temperatures and sea level rise—The Arabian Gulf. Climate 2020, 8, 50. [Google Scholar] [CrossRef] [Green Version]
- Bjerknes, J. Atlantic air-sea interaction. In Advances in Geophysics; Landsberg, H.E., van Mieghem, J., Eds.; Academic Press, Inc.: New York, NY, USA, 1964; Volume 10. [Google Scholar] [CrossRef]
- Huang, C.; Qiao, F. The relationship between sea surface temperature anomaly and wind energy input in the Pacific Ocean. Prog. Nat. Sci. 2009, 19, 1409–1412. [Google Scholar] [CrossRef]
- Hurrell, J.W. Decadal trends in the North Atlantic Oscillation: Regional temperatures and precipitation. Science 1995, 269, 676–679. [Google Scholar] [CrossRef] [Green Version]
- Shukla, J.; Misra, B.M. Relationships between sea surface temperature and wind speed over the central Arabian Sea, and monsoon rainfall over India. Mon. Weather. Rev. 1977, 105, 998–1002. [Google Scholar] [CrossRef]
- Sultan, S.A.R.; Elghribi, N.M. Heat budget of the southeastern part of the Arabian Gulf. Qatar Univ. Sci. J. 2001, 21, 119–124. [Google Scholar]
- Rezaei-Latifi, A.; Hosseinibalam, F. An estimate of the surface heat fluxes transfer of the Persian Gulf with the overlying atmosphere. J. Radiat. Res. Appl. Sci. 2015, 8, 354–361. [Google Scholar] [CrossRef] [Green Version]
Figure 1.
Map of the Arabian Gulf with Bathemtry. The black dots represent locations of temperature depth profiles for the northen (N), central (C), and southern (S) parts.
Figure 1.
Map of the Arabian Gulf with Bathemtry. The black dots represent locations of temperature depth profiles for the northen (N), central (C), and southern (S) parts.

Figure 2.
(Upper panel): monthly temperature profiles at north (left), center (middle), and south (right) of AG. The (lower panel): temperature anomalies at selected depths marked with different color in the upper panel. For profile and location, refer to Figure 1.
Figure 2.
(Upper panel): monthly temperature profiles at north (left), center (middle), and south (right) of AG. The (lower panel): temperature anomalies at selected depths marked with different color in the upper panel. For profile and location, refer to Figure 1.

Figure 3.
Heat content (×107 Jm−2) for the water column to the maximum depth for every month.

Figure 4.
Heat content (×107 Jm−2) for the water column to 35 m depth for every month.

Figure 5.
Annual average of heat content (×107 Jm−2) in the AG to 35 m.

Figure 6.
Monthly average heat content (×107 Jm−2) for the entire gulf up to 35 m depth.

Figure 7.
Monthly OHC (×107 Jm−2) anomalies to 35m.

Figure 8.
The seasonal variability in atmospheric parameters and surface temperature.

Figure 9.
The annual cycle of heat flux (Wm−2) at the surface of the Arabian Gulf.


Table 1.
Monthly temperature anomalies for the AG.
| Depth | January | February | March | April | May | June | July | August | September | October | November | December | Min | Max |
|---|---|---|---|---|---|---|---|---|---|---|---|---|---|---|
| 0 | −5.1 | −6.2 | −5.3 | −3.6 | 0.0 | 3.0 | 4.4 | 5.7 | 5.5 | 3.5 | 0.5 | −2.4 | −6.2 | 5.7 |
| 5 | −5.0 | −6.1 | −5.4 | −3.7 | −0.1 | 2.7 | 4.4 | 5.7 | 5.5 | 3.5 | 0.7 | −2.2 | −6.1 | 5.7 |
| 10 | −4.8 | −6.0 | −5.4 | −3.7 | −0.4 | 2.3 | 4.2 | 5.7 | 5.7 | 3.7 | 0.8 | −2.0 | −6.0 | 5.7 |
| 15 | −4.4 | −5.7 | −5.3 | −3.7 | −0.9 | 1.8 | 3.7 | 5.3 | 5.7 | 4.0 | 1.1 | −1.6 | −5.7 | 5.7 |
| 20 | −3.8 | −5.1 | −4.9 | −3.6 | −1.3 | 0.9 | 3.0 | 4.4 | 5.7 | 4.3 | 1.5 | −1.1 | −5.1 | 5.7 |
| 25 | −3.1 | −4.4 | −4.5 | −3.4 | −1.8 | 0.2 | 1.8 | 3.3 | 5.7 | 4.5 | 2.1 | −0.5 | −4.5 | 5.7 |
| 30 | −2.4 | −3.8 | −3.9 | −3.1 | −2.0 | 0.0 | 0.7 | 2.5 | 5.0 | 4.6 | 2.4 | 0.0 | −3.9 | 5.0 |
| 35 | −1.8 | −3.3 | −3.4 | −2.9 | −2.1 | 0.0 | 0.1 | 2.0 | 4.1 | 4.5 | 2.5 | 0.5 | −3.4 | 4.5 |
| 40 | −1.3 | −2.8 | −3.0 | −2.7 | −2.1 | −0.1 | −0.1 | 1.3 | 3.2 | 4.0 | 2.6 | 1.0 | −3.0 | 4.0 |
| 45 | −0.9 | −2.3 | −2.5 | −2.5 | −2.0 | −0.2 | −0.1 | 0.9 | 2.5 | 3.3 | 2.5 | 1.3 | −2.5 | 3.3 |
| 50 | −0.4 | −1.9 | −2.1 | −2.2 | −1.8 | −0.5 | −0.1 | 0.6 | 2.1 | 2.7 | 2.1 | 1.6 | −2.2 | 2.7 |
| 55 | 0.1 | −1.4 | −1.6 | −1.8 | −1.5 | −0.6 | −0.5 | 0.5 | 1.5 | 1.7 | 1.7 | 2.0 | −1.8 | 2.0 |
| 60 | 0.4 | −1.1 | −1.3 | −1.9 | −1.4 | −0.8 | −0.7 | 0.4 | 1.1 | 1.6 | 1.3 | 2.2 | −1.9 | 2.2 |
| 65 | 0.7 | −0.9 | −1.0 | −1.9 | −1.4 | −0.7 | −0.6 | 0.4 | 0.8 | 1.4 | 1.2 | 2.0 | −1.9 | 2.0 |
| 70 | 0.8 | −0.5 | −0.8 | −1.8 | −1.2 | −0.8 | −0.5 | 0.0 | 0.7 | 1.3 | 1.2 | 1.6 | −1.8 | 1.6 |
| 75 | 1.2 | 0.0 | −0.5 | −1.6 | −0.8 | −0.8 | −0.8 | −0.1 | 0.4 | 0.9 | 0.6 | 1.4 | −1.6 | 1.4 |
| Min | −5.1 | −6.2 | −5.4 | −3.7 | −2.1 | −0.8 | −0.8 | −0.1 | 0.4 | 0.9 | 0.5 | −2.4 | - | - |
| Max | 1.2 | 0.0 | −0.5 | −1.6 | 0.0 | 3.0 | 4.4 | 5.7 | 5.7 | 4.6 | 2.6 | 2.2 | - | - |
Table 2.
Monthly values of meteorological parameters.
| Year | Month | SST (°C) | Sea Level Pressure (Pa) | Cloud Fraction | Air Temperature (°C) | Wind Speed (m/s) | Dew Point Temperature (°C) |
|---|---|---|---|---|---|---|---|
| 2017 | January | 20.75 | 101,786 | 0.23 | 15.56 | 3.97 | 5.15 |
| February | 19.05 | 101,868 | 0.36 | 14.57 | 4.25 | 5.81 | |
| March | 20.28 | 101,352 | 0.35 | 20.08 | 3.92 | 10.33 | |
| April | 23.91 | 101,120 | 0.24 | 26.50 | 4.18 | 10.08 | |
| May | 27.84 | 100,691 | 0.18 | 31.36 | 4.26 | 11.83 | |
| June | 30.16 | 100,107 | 0.01 | 34.26 | 4.86 | 10.94 | |
| July | 32.51 | 99,851 | 0.11 | 35.75 | 3.84 | 13.58 | |
| August | 33.65 | 100,087 | 0.09 | 34.80 | 3.48 | 14.32 | |
| September | 33.16 | 100,636 | 0.05 | 32.00 | 3.36 | 12.11 | |
| October | 30.92 | 101,127 | 0.01 | 28.01 | 3.51 | 10.60 | |
| November | 27.66 | 101,638 | 0.14 | 21.42 | 3.41 | 8.50 | |
| December | 23.08 | 102,016 | 0.16 | 16.18 | 3.75 | 4.48 |
Table 3.
Monthly average values for Qe, Ql, Qh, Qs, and Qt in Wm−2.
| (Qe) | (Ql) | Qh | Qs | Qt | |
|---|---|---|---|---|---|
| January | −82.7828 | −98.7891 | 21.65376 | 125.5675 | −34.3506 |
| February | −76.6365 | −86.8352 | 8.071069 | 157.7227 | 2.322069 |
| March | −80.1601 | −71.9438 | −5.3159 | 187.8296 | 30.4098 |
| April | −99.2647 | −57.2265 | −14.8642 | 221.1475 | 49.7921 |
| May | −154.536 | −45.3224 | −23.0134 | 242.0639 | 19.1921 |
| June | −223.56 | −40.1828 | −26.5478 | 242.9013 | −47.3893 |
| July | −233.447 | −34.7025 | −20.8025 | 230.8508 | −58.1012 |
| August | −227.776 | −38.6444 | −11.5739 | 224.0062 | −53.9881 |
| September | −207.033 | −53.0651 | −4.0383 | 202.4089 | −61.7275 |
| October | −172.966 | −69.7529 | 3.114904 | 174.072 | −65.532 |
| November | −150.719 | −92.2655 | 16.97038 | 139.5305 | −86.4836 |
| December | −108.175 | −101.114 | 24.80918 | 120.0867 | −64.3931 |
Disclaimer/Publisher’s Note: The statements, opinions and data contained in all publications are solely those of the individual author(s) and contributor(s) and not of MDPI and/or the editor(s). MDPI and/or the editor(s) disclaim responsibility for any injury to people or property resulting from any ideas, methods, instructions or products referred to in the content. |
© 2023 by the authors. Licensee MDPI, Basel, Switzerland. This article is an open access article distributed under the terms and conditions of the Creative Commons Attribution (CC BY) license (https://creativecommons.org/licenses/by/4.0/).
Share and Cite
MDPI and ACS Style
Alsayed, A.Y.; Alsaafani, M.A.; Al-Subhi, A.M.; Alraddadi, T.M.; Taqi, A.M. Seasonal Variability in Ocean Heat Content and Heat Flux in the Arabian Gulf. J. Mar. Sci. Eng. 2023, 11, 532. https://doi.org/10.3390/jmse11030532
AMA Style
Alsayed AY, Alsaafani MA, Al-Subhi AM, Alraddadi TM, Taqi AM. Seasonal Variability in Ocean Heat Content and Heat Flux in the Arabian Gulf. Journal of Marine Science and Engineering. 2023; 11(3):532. https://doi.org/10.3390/jmse11030532
Chicago/Turabian StyleAlsayed, Afnan Y., Mohammed A. Alsaafani, Abdullah M. Al-Subhi, Turki M. Alraddadi, and Ahmed M. Taqi. 2023. "Seasonal Variability in Ocean Heat Content and Heat Flux in the Arabian Gulf" Journal of Marine Science and Engineering 11, no. 3: 532. https://doi.org/10.3390/jmse11030532
Note that from the first issue of 2016, this journal uses article numbers instead of page numbers. See further details here.