Article

An Evaluation of the Efficiency of the Floating Solar Panels in the Western Black Sea and the Razim-Sinoe Lagunar System

by
Alexandra Ionelia Manolache
,
Gabriel Andrei
and
Liliana Rusu
*
Department of Mechanical Engineering, Faculty of Engineering, “Dunarea de Jos” University of Galati, 47 Domneasca Street, 800008 Galati, Romania
*
Author to whom correspondence should be addressed.
J. Mar. Sci. Eng. 2023, 11(1), 203; https://doi.org/10.3390/jmse11010203
Submission received: 15 November 2022 / Revised: 10 December 2022 / Accepted: 10 January 2023 / Published: 12 January 2023
(This article belongs to the Special Issue Offshore Renewables for a Transition to a Low Carbon Society)

Abstract

:
The development of novel solar power technologies is regarded as one of the essential solutions to meeting the world’s rising energy demand. Floating photovoltaic panels (FPV) have several advantages over land-based installations, including faster deployment, lower maintenance costs, and increased efficiency. Romania is considered a country with enormous solar energy potential, which is one of the most exploited sectors of the renewable energy sector. With this in mind, the purpose of this work is to assess the energetic potential provided by the sun, taking into account three lakes in Romania’s east and extending to the west of the Black Sea. In this context, we examine the hourly distribution of solar radiation for the year 2021. The solar radiation data were extracted using the ERA5 database, as well as data collected in situ near them. Following this research, we discovered that all of the chosen locations have a high energetic potential and could be used as locations for the exploitation of solar energy, thereby avoiding the use of land that could be used for agricultural purposes in these areas. We also noticed that there are minor differences between the solar radiation values obtained from the ERA5 database and the measured ones.

1. Introduction

Since the Framework Convention on Climate Change was adopted in 1992, the globe has altered dramatically. In 1990, industrialized countries accounted for two-thirds of global emissions; today, they account for roughly half, and by 2020, developing countries will account for two-thirds of global emissions. The Kyoto Protocol, which has governed the limitation of greenhouse gas emissions until now is no longer sufficient. To mitigate the worst effects of climate change, the Paris Agreement was adopted. By reducing global warming to well below 2 °C and pursuing efforts to restrict it to 1.5 °C [1], the Paris Agreement [2] lays out a worldwide framework to avoid severe climate change. It also aims to support countries in their efforts to improve their capacity to deal with the negative effects on the environment. Aside from tackling climate change, there is also a significant interest in reducing global greenhouse gas emissions. By 2030, it is desired to have cut greenhouse gas emissions by at least 55% [3]. To accomplish this, we must stop relying on fossil fuels [4] and start investing in reliable [5] clean, accessible, and affordable alternative energy sources. The sun, wind, water, waste, and heat from the Earth are all abundant sources of renewable energy that are renewed by nature and release little to no greenhouse gases or air pollution.
The energy sector is taking the lead in the decarbonization effort [6] because significant investments are made in mature and affordable renewable energy technologies, such as wind and photovoltaic (PV). Solar energy is regarded as the most promising source of renewable energy [7,8]. It is a free, clean, and ever-lasting source of energy. In ancient times, it met the necessity for cooking and warmth. Nowadays, it is employed in a variety of ways, including converting solar energy to electrical energy by means of solar panels (PVs). The sun produces more than enough energy to cover the entire world’s energy requirements and, unlike fossil fuels, it will not run out anytime soon. The only constraint of solar power as a renewable energy source is our ability to convert it into electricity efficiently and cost-effectively. The harvesting and usage of light and/or heat energy generated by the sun, as well as the technologies (passive and active) involved in achieving such goals, are regarded as being essential to the solar energy concept [9,10]. Solar energy is harnessed using three primary technologies: photovoltaics (PV), which directly converts light to electricity; concentrating solar power (CSP) [11,12], which uses heat from the sun (thermal energy) to drive utility-scale electric turbines; and solar heating and cooling (SHC) systems [13], which collect thermal energy to provide hot water and air heating or conditioning. The most common technology is PVs, which are devices made of semiconductor materials that directly convert sunlight falling on them to electrical energy. PVs should be installed in such a way that they form a tilt angle with the horizontal plane to extract the most power from them and allow sunlight to fall at a steep angle [14].
According to global data, more solar photovoltaic capacity is being installed than any other generation technology, making solar power the world’s favorite new type of electricity generation. Solar photovoltaics had an electrical capacity of 8,485,405 GW in 2021, out of a total of 30,683 GW of renewable energy [15]. The photovoltaic sector accounts for approximately 28% of total renewable energy. However, when we look at Romania’s renewable energy sector, we can see that its capacity is not very large, with a capacity quantity of approximately 11,138 TW, of which the photovoltaic sector accounts for only 12.6% (approximately 1.4 TW). When we look at the map of solar radiation capacity around the world, we can see that countries such as the Netherlands, Poland, the United Kingdom, and Germany are in areas with solar energy resources similar to Romania, but their production is much higher. Until now, Romania has had a little well-established supporting program for the development of the renewable energy sector; however, in 2022, a program to increase wind and solar energy production will be developed for small and large enterprises that can help to improve the renewable sector.
Floating photovoltaics is a concept that has gained popularity in recent years, with no commercial deployments and only a few demonstrator projects deployed globally [16,17]. Many places around the world, primary islands such as Japan, Singapore, Korea, and the Philippines, do not have enough land for PV installations. There is already demand in this field in countries such as Japan, Australia, the United States, Brazil, Korea, India, and others, and it is expected to expand globally. Floating solar systems can be installed in bodies of water such as oceans, lakes, lagoons, reservoirs, fish farms, dams, canals, and so on. Far Niente wineries in California, USA, received the most media attention and was widely regarded as the first to develop a floating PV project (despite the fact that a research floating PV project had been installed the previous year in Aichi, Japan) [18]. A large number of studies have been conducted to examine the advantages that floating photovoltaics have over conventional ones on the ground [19,20]. Choi Y.K [21] also conducted research in this area, comparing empirical data from floating photovoltaic systems developed in Korea with those on the ground. Following studies that concluded that floating photovoltaic systems can be more efficient by over 11%, the development of larger projects could lead to a larger-scale approach to the floating solar energy sector. Another study that highlights the superior efficiency of FPV was conducted by Sasmanto A.A et al. [22].
The power output of solar cells varies in response to temperature changes. Because the efficiency of the PV module is temperature dependent, installing solar PV systems on the water’s surface benefits from a significantly lower ambient temperature due to the cooling effect of water [23,24,25]. If aluminum frames are used to support the floating solar PV module, the cooler temperature from the water is also carried out, lowering the overall temperature of the modules, as determined by the work of Liu H. et al. [26]; this aspect is also studied by El Hammoumi A. et al. [27].
Another aspect that is being thoroughly researched is the environmental benefits. Floating photovoltaics reduce negative effects such as deforestation, bird death, erosion, microclimate change, and others [28]. In addition, photovoltaics can reduce the evaporation of lake water and prevent algae growth [29]. Studies in these areas are being conducted by Elshafei M. [30], where one of the main conclusions is related to the possibility of reducing water loss through floating photovoltaics.
Potential assessment is one of the most popular FPV-related topics since it has been demonstrated that there is technological potential for anthropogenic reservoirs all over the world. A study that investigates the potential of solar energy is the one in reference [31], which investigates the possibility of placing floating photovoltaic panels in existing hydropower reservoirs in Laos. Another study that focuses on the energy potential is the one from reference [32], which analyzes the possibility of placing FPV on 10% of the surfaces covered by water, which could generate 31% of the energy needs in Spain. The research in references [33,34] examines the same topic, but this time for India. However, they also integrate studies on the prevention of water evaporation, which is a significant issue in this region. A study that covers the whole of Europe is found in reference [35], which studies all the hydropower basins on the continent in the desire to increase attention on this industry with the idea in mind of achieving carbon neutrality by 2030. One of the nations mentioned is Romania, which has a surface area of 394 km2 and ranks fourth among the countries with reservoir areas. This region might be used for the installation of FPV with a capacity of 44.1 TWh if the entire surface is used. For Romania, this topic is not addressed; there are some studies, such as the one in reference [35] which address the entirety of Europe and is primarily focused on hydropower reservoirs, but there are no studies that also analyze the lakes that are used for irrigation. A study that addresses this topic is carried out by Popa B. et al. [36], which analyzes the possibility of locating a 1 MW FPV farm on Morii Lake.
The need to find innovative strategies that may result in acquiring huge amounts of energy is required given the current state of Europe, which is dealing with a widespread energy crisis that has caused energy costs to rise exponentially. At the national level, Romania is now dealing with this issue and is working to find quick solutions, making recent investments in renewable energy stand out. The goal of this study is to provide insight into the Romanian market’s unrealized potential for floating solar energy. It intends to demonstrate the advantages of FPV over those on land, enabling the growth of the solar energy industry. In this way, the importing of power from other countries will be reduced to the maximum.
This work aims to evaluate the solar radiation on three lakes in Romania: Lake Razim, Lake Sinoe, and Lake Golovita, but it also extends to locations with deeper waters. To perform this, data on solar radiation and temperature were extracted from the ERA5 database, and in situ data will be used to validate the satellite data. A 540 kWh PV will be used to outline an overview of the solar radiation from the chosen locations. The novelty of this work is that it focuses on water-covered areas in Romania, where there is a desire to use PVs on water. The first FVP farm in Romania was launched in 2022 in the port of Constanta and was evaluated at an annual production of 15,000 kWh provided by its 22 PVs. So, the values obtained from this study can be considered as benchmarks in future investigations for the identification of other locations for the exploration of this energy sector that is less addressed in Romania, and it could have a huge impact in combating polluting sources. However, there are many challenges that this sector must overcome, the major one is related to the sea waves, as the system developed for Romania is able to deal only with waves of a maximum height of one meter.
This work is divided into five sections, the first of which presents the literature review that was used to write the work to observe what has been studied over time and to structure the work. The second section discusses the research area and gives the data used to assess resources, technical specifications used to compute energy production, and methods. The third section presents the results acquired after processing the ERA5 database data. Section four contains data from in situ measurements, as well as a brief discussion of the results and comparisons to previous research. Finally, the study’s conclusions and potential future research topics are given.

2. Materials and Methods

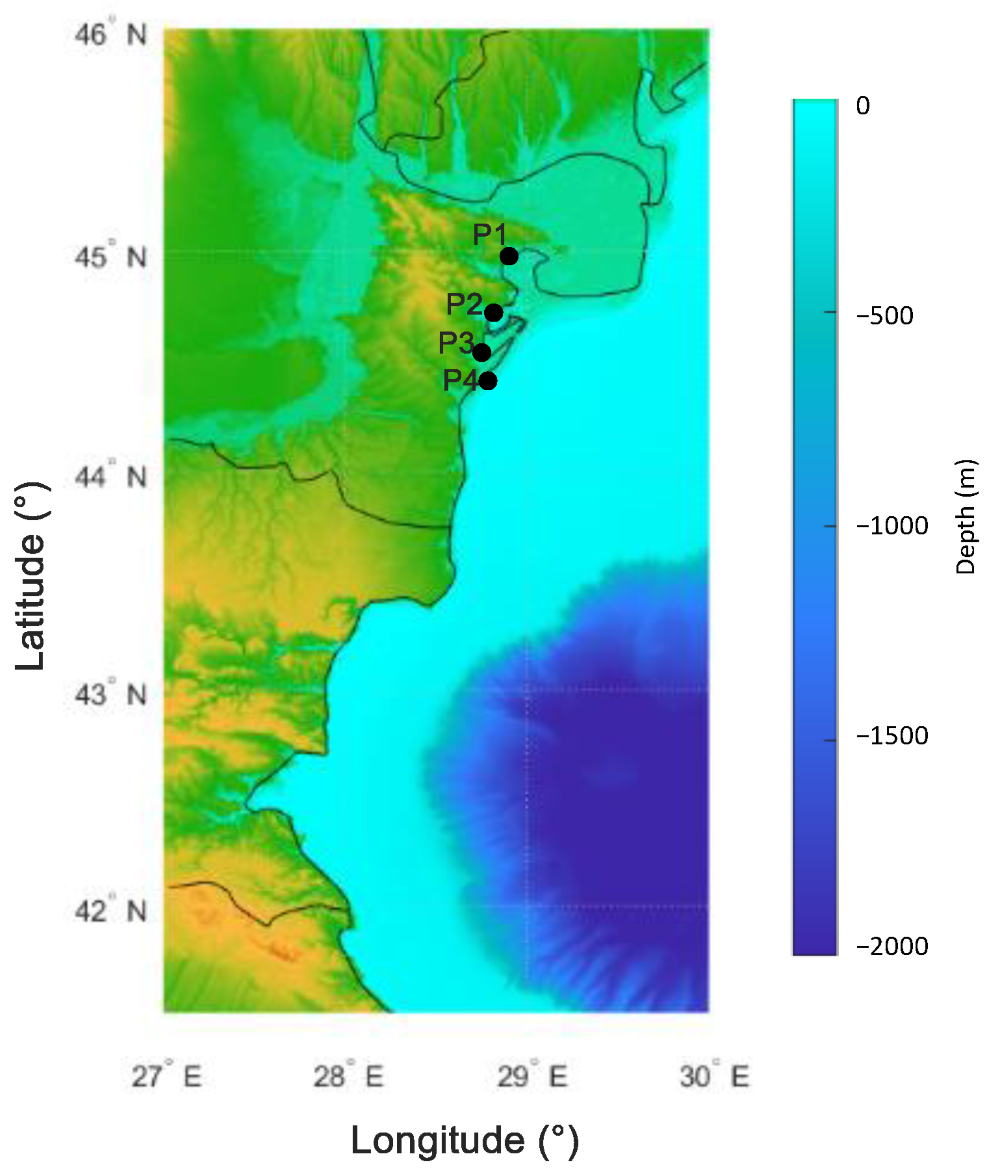
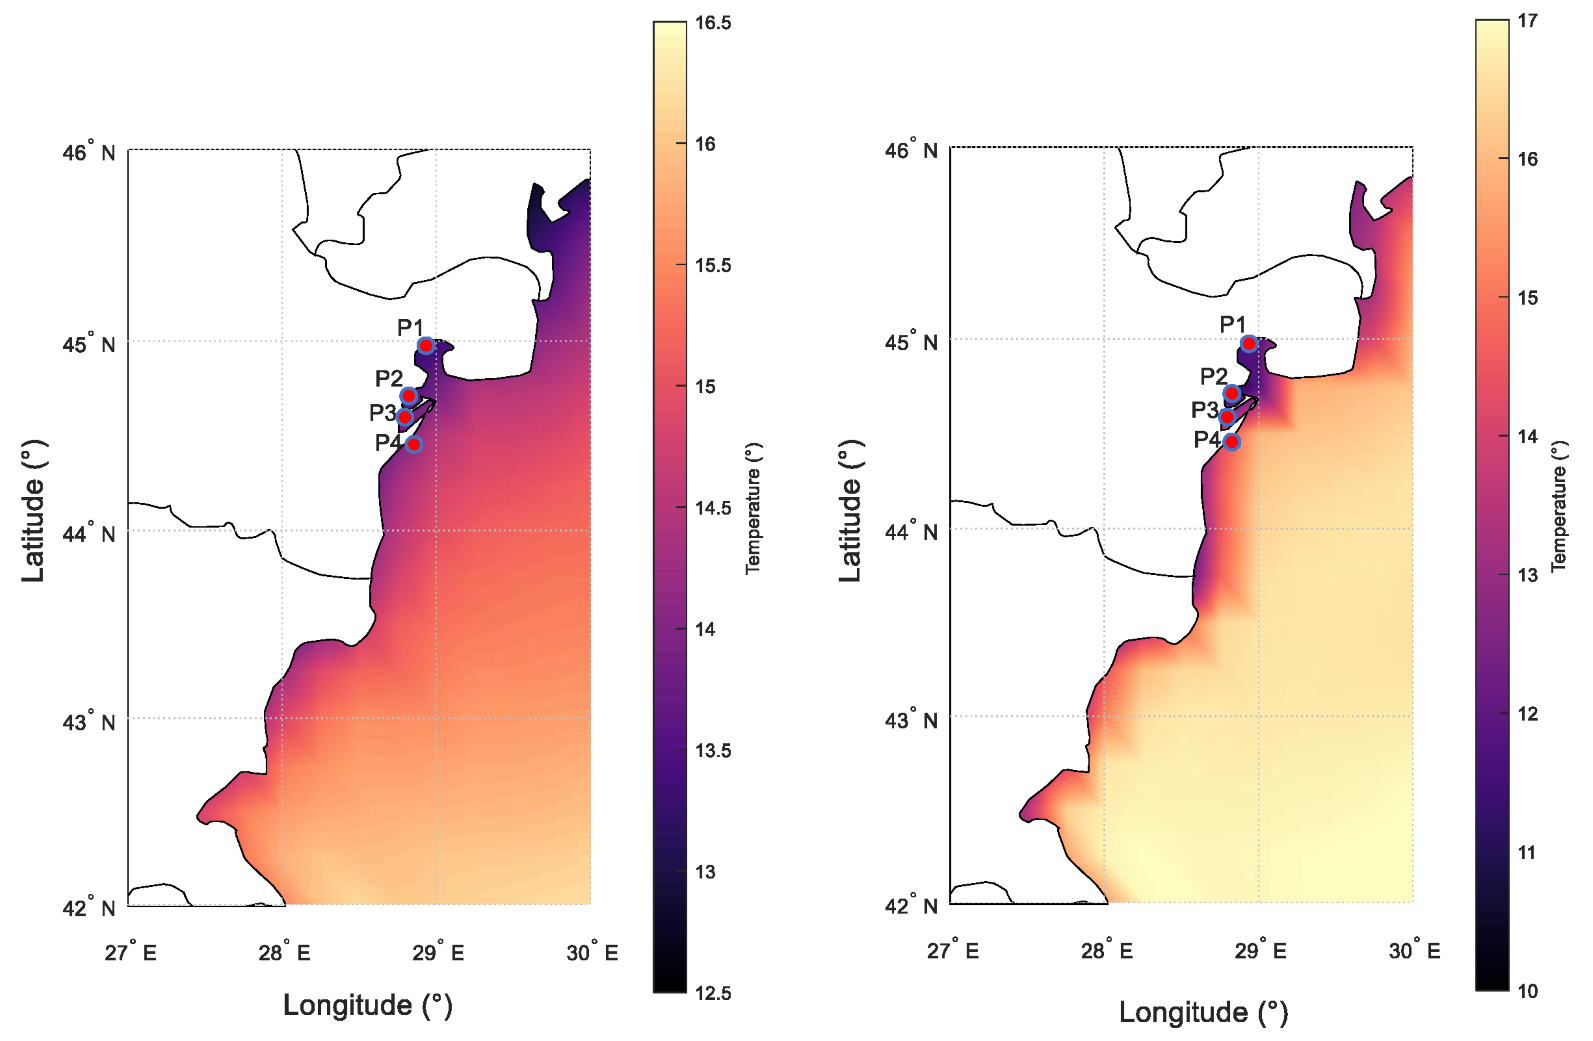
2.1. The Location of Interest

While early floating PV projects were typically located on landlocked bodies of water, such as lakes and reservoirs, organizations have recently begun to consider installing plants on offshore waters. Although this entails far more technical challenges, such as surviving heavy swells and overcoming saltwater corrosion, it also opens up vast new areas for floating PV, potentially in conjunction with aquaculture. To carry out the study, four points of interest were chosen (Table 1), three of which are in the Razim-Sinoie Lagoon Complex and one in the western part of the Black Sea. The location at P4 was chosen to determine whether there are better resources in open water than on the lake; their exact position is also illustrated in Figure 1.
The Razim-Sinoie Complex is part of the Danube Delta Biosphere Reserve and is located in the south of the Danube Delta. It consists primarily of lakes, sea beds, and some higher relief formations. Even though its total surface area is approximately 800 square kilometers, its depth does not exceed 3.5 m. These are low-salinity lakes formed by the mixing of fresh and saltwater due to their proximity to both the Danube and the Black Sea.
Point P4 is located in the Black Sea, an intercontinental sea located between South-Eastern Europe and Anatolia. Romania has a 245 km coastline that connects to the Black Sea in the southeast.
The average annual temperature in the lake area is around 10 °C, and the coastal area, which is a strip of 10–15 km west of the seashore, benefits from temperatures above 11 °C.

2.2. ERA5 Data Set

The ECMWF (European Centre for Medium-Range Weather Forecasts) is a non-governmental organization supported by 35 countries. It generates global numerical weather forecasts and other data for its member and cooperating countries, as well as the general public. The ECMWF’s most recent reanalysis product is ERA5 [37,38]. Following several years of modeling and data assimilation advancements, a new model cycle for the Integrated Forecasting System (IFS Cycle 47r3) [39] was introduced into the reanalysis operations to ensure a substantial improvement in forecast accuracy and computational efficiency. The reanalysis combines the model with observations from around the world to create a globally complete and consistent data set that is constrained by physical laws. For each hour of the day, the ERA5 data set provides estimates of numerous atmospheric, land–surface, and sea-state parameters on 0.25° × 0.25° latitude–longitude grids [40,41]. Surface solar radiation downwards (SSRD) [42] and total sky direct solar radiation at the surface (FDIR) [43] are the parameters used in this study to represent the amount of shortwave radiation (surface direct and diffuse solar radiation) and direct radiation reaching the Earth’s surface, respectively. The year 2021 was chosen as the study’s time frame.

2.3. The Mathematical Model Used

The entire quantity of shortwave radiation received from above by a surface horizontal to the ground is referred to as global horizontal irradiance (GHI). This value is especially important for solar installations since it combines both direct normal irradiance (DNI) and diffuse horizontal irradiance (DHI), and the relation between all three parameters can be expressed using the formula below [44,45]. DNI is solar radiation that travels in a straight line from the sun’s current position in the sky. DHI is solar energy that has been scattered by molecules and particles in the atmosphere and comes from all directions equally. GHI represents all the light that arrives on a horizontal plane, from the sun, sky, and clouds. By subtracting DNI from GHI, DHI can be obtained. We should mention that direct solar radiation also includes the radiation that has been scattered by cloud particles by a fraction of a degree. All parameters are in W / m 2 .
GHI = DHI + DNIcos θ z
DHI = GHI - DNIcos θ z
where θ z represents the zenith angle in degrees. The angle formed by the sun’s beams and the vertical direction is known as the solar zenith angle [46]. This means that the zenith angle decreases as the Sun rises higher in the sky. The formula is:
cos θ = sin ϕ   sin δ + cos ϕ   cos δ   cos h
where ϕ represents the local latitude, δ is the current declination of the sun, and h is the hour angle, in the local solar time. All mentioned parameters are in degrees.
The solar declination angle (Equation (4)) is the angle formed by the sun’s beams and the Earth’s equator [37]. The solar declination angle varies with time; it is not a fixed quantity. Every single day will be unique. However, the angle is limited to 23.44° and 23.44°.
δ = 23 . 4   sin 360 ° n + 284 365
where n denotes the day of the year (for example 1 for January 1, 32 for February 1, 60 for March 1, etc.).
The hour angle (h) is defined as the angular displacement of the sun east or west of the local meridian caused by the Earth’s rotation and is stated in degrees as:
h = 15 ( AST - 12 )
where AST means the apparent solar time.
The difference between the two types of solar time is described by the equation of time (Equation (6)) [47,48]. The two periods that are different are the mean solar time, which follows a hypothetical mean sun with uniform motion down the celestial equator, and apparent solar time (AST), which directly tracks the diurnal motion of the sun [49]. By measuring the sun’s present location (hour angle), as indicated (with varying degrees of precision) by a sundial, one can determine the apparent solar time. The time displayed by a reliable clock set up so that its variations from apparent solar time has a mean of zero over the course of a year, which would be the mean solar time for the same location. The conversion from local standard time (LST) to solar time is accomplished in two steps. First, the equation of time is applied to the local standard time, and then a longitude (LON) correction is applied. This longitude correction is four minutes of time per degree of difference between the local (site) longitude and the longitude of the time zone’s local standard meridian (LSM) [50]; so, AST is connected to LST as follows:
AST = LST + ET 60 + LON LSM 15
ET = 2 . 2918 ( 0 . 0075 + 0 . 1868   cos ( B ) 3 . 2077   sin ( B ) 1 . 4615   cos ( 2 B ) 4 . 089   sin ( 2 B ) and B = 360 ( n 1 ) 365
where TZ is the time zone, given in coordinated hours ahead or behind universal time (UTC).
The average total solar radiation for an inclined surface ( W / m 2 ) can be calculated using the method developed by Liu and Jardon [51], as follows:
GHI T = R · GHI
R is the monthly ratio of daily average radiation on a tilted surface to that on a level surface. R may be calculated by evaluating the direct, diffuse, and reflected components of radiation incident on the tilted surface separately [52,53]. Assuming that diffuse and reflected radiation is isotropic, R can be calculated using the formula [54]:
R = 1 DHI GHI R b + DHI 1 + cos β 2   GHI + ρ 1 cos β 2
where ρ is the ground reflectance and has a value of 0.2 [55] for hot and humid tropical locations and R b is the beam conversion factor and for the northern hemisphere and can be expressed as:
R b = cos ϕ β cos δ sin ω h + π 180 ω h sin ϕ β sin δ cos ϕ cos δ sin ω s + ( π 180 ) ω s sin ϕ sin δ
where ω s (°) is the sunrise or sunset hour angle for the inclined surface [53] and has the following equation:
ω s = min ω s , cos - 1 ( tan ϕ β tan δ )
The sunrise and sunset hour angles both have the same numerical value; the sunrise angle is negative and the sunset angle is positive. The following equation may be used to compute both:
ω s = cos - 1 ( tan ϕ tan δ )
The annual solar energy output of a photovoltaic system
P = A p · r · GHI T · PR
where A p is the area of the PV in m 2 , r is the panel yield in % (determined using Equation (14)), GHI T is the average solar radiation on panels W / m 2 , and PR is the performance ratio which has a value of 0.75 usually but can range between 0.5 and 0.9.
r = PE 10 A p
where PE   is the electrical power kWp.

3. Results

Because the production of sun-based energy is dependent on the availability of the sun, it is necessary to determine the hours when solar radiation is present. The average hourly global, diffuse, and direct radiation values calculated as a mean for all days in 2021 are illustrated in Figure 2. The peak value for all four locations is recorded around 11 o’clock. The only difference is given by site P1, which has the maximum at 10 o’clock, but the difference between the global radiation from 11 o’clock and that from 10 o’clock is only 1 W / m 2 . For these locations, no value for solar radiation was recorded in an 8 h interval.
In Figure 3 and Figure 4, it can be seen that the summer months in this region receive a large quantity of solar radiation, with the month of July having the highest value of global solar radiation and the P3 site also having the highest value of approximately 287 W / m 2 , and the P1 site having the lowest value of 278 W / m 2 . December receives the least amount of solar radiation with just 41 W / m 2 registered for site P1. The difference between the most productive site and the least productive is 3.2% for the maximum radiation and 9% for the minimum.
Figure 5 describes the tilt angle for each day of the year, and Table 2 represents the monthly one. As can be seen, the differences from one location to another is insignificant. According to the seasonal optimal tilt angle calculation based on solar angles, the tilt angle of the summer season is the smallest and the tilt angle of the winter season is the largest. The maximum tilt angle was observed for 20–21 December as 68.4°. For winter, the optimal tilt angle is considered to be 64° for all four locations, and for summer it is 24°. Additionally, for the cold half of the year, the optimal tilt angle can be obtained from the sum of the latitude and 15°, and for the warm half of the year by the difference between the latitude and 15°. This result can also be obtained by using Table 2, the average of the cold months being approximately 59° and the average of the warm months being approximately 29°. The annual optimum tilt angle was calculated by averaging the value of optimum tilt angles for all months of a year and was found to be the exact latitude value for each location.
The graph below (Figure 6) depicts the change in the solar declination angle over time. The solar declination angle is positive from the vernal equinox to the autumnal equinox, as illustrated in the graph below, or from 20 March 20 to 22 September (or 23), and it is expected to be negative for the rest of the year. The declination angle must be estimated to calculate the solar elevation. The solar elevation increases with the declination angle and its peak is during the summer months. As winter approaches, the declination angle reduces and the solar elevation decreases. As a result, in winter, the sun descends toward the horizon. Thus, the tilt angle of the PV rises, and the PVs are virtually vertically aligned to optimize solar output, as can be seen in Figure 5.
To determine the annual energy production, the average solar radiation for the year 2021 was used, which has a value of 700 kWh. The PV used for this study was JRH 540 W, with a panel area of 2.584 m2 and a maximum power of 540 W (Table 3) with an adjustable tilt angle. Figure 7 shows that sites P3 and P4 have almost identical values for the annual energy production of 728 W/m2, the difference between them being almost imperceptible. The lowest value is recorded in location P1 with approximately 700 W/m2. The capacity factor for the year 2021 is around 18.2%; the lowest value is also recorded for the P1 site at only 17.7%.
The temperature coefficient, or more specifically, the open-circuit voltage temperature coefficient, given in either a percentage of VOC per degree C (%/°C) or volts per degree C (V/°C), is one of the factors that can affect the actual performance of a photovoltaic panel, causing it to vary away from its theoretical value. For the chosen panel, the temperature coefficient has a value of 0.275%/°C. This coefficient represents the amount by which its output voltage, current, or power varies as a result of a physical change in the ambient temperature conditions surrounding it before the array begins to warm up. As a result, the performance of the panel will decrease when the temperature increases compared to the reference one, which is 25 °C, and when the temperature decreases, it will improve. The performance of the 540 W PV can be seen in Figure 8.
Figure 9 and Figure 10 show the average minimum and maximum temperatures for our locations. According to the graph, the average maximum temperature in summer is 25.7 °C, while the average minimum temperature in winter is around 7.5 °C for lake locations and 4 °C for sea locations. Figure 10 shows that the water temperature is more constant than the air temperature, so in winter the water temperature is higher than the air temperature, and in summer the opposite, because water heats up and cools down slower.

4. Discussion

Renewable energy from the sun is one of the most used for the production of green energy globally, ranking 3rd after hydropower and wind. In this case, solar radiation was examined for four locations in Romania that are located on the water, to evaluate the possibility of exploiting solar energy not only on land but also on the water. An important aspect to emphasize is the one related to the validation of the data obtained from the ERA5 database. Numerous studies evaluate the veracity of the data obtained from different databases, such as the studies performed by Jiang et al. [40], which analyze 98 locations in China using in situ data and data from the ERA5 database, after which they could observe that the values for GHI are close for the two, but large differences appear for DHI and DNI because the model cannot accurately evaluate aerosols, clouds, and their interaction. Another study that analyzed the correlation between the data obtained from the ERA5 database and measured data, for three locations in Germany, is the one in Ref. [56]. This paper showed that the best results were recorded in high-pressure situations, and in the rest of the cases, the ERA5 data overestimated the results. Similar studies were also performed in references [57,58], and following them, we could observe that the areas that are dominated by rains and clouds have the weakest results when it comes to the correlation of the ERA5 database with the in situ data. Other studies compare data from different reanalysis databases, such as the work by Ref. [59], which conducts a comparative study between the solar radiation obtained from the ERA-5, MERRA-2, ERA-Interim, JRA-55, NCEP-NCAR, NCEP-DOE, and CFSR databases, and measured data. The closest results are those of the ERA5 and ERA-Interim databases. The better results were observed for the ERA5-land database, which provides better results than ERA5 [60]. This can be attributed to the ERA5-land database’s much better resolution of 9 km compared to ERA5’s resolution of 31 km.
Figure 11 shows the GHI for four locations in Romania, all in areas where solar radiation is considered to have the highest values. The Constanta site is relevant in this case because it is located near the four locations used for this study. Since no measuring devices are installed in these locations, we used the in situ measurements in Constanta to further compare the results obtained to determine if they are relevant or not. As can be seen in Figure 12 and Figure 3, the differences between the measured data and those from the database are relatively small. In this case, the root mean square error (RMSE) has a value of 32.29 W / m 2   for P1, 30.06   W / m 2 for P2, 27.73 W / m 2 for P3, and 27.58 W / m 2 for P4. In this case, the data obtained from the ERA5 database underestimates the real values of solar radiation. Additionally, in Figure 11, the other three locations were chosen to make a small comparison between the solar resources; all these locations exploit the soil resources, especially the areas in the vicinity of Bucharest, but we can see that the best resources are still in Constanta where the study in question is carried out.
Another study focused on solar radiation in Romania is the one developed by AKTAG and YILMAZ [61] that analyzed the port cities on the shore of the Black Sea, among which is Constanta. In the reference mentioned above, the average solar radiation can be deduced as 14.02   MJm - 2 day - 1 , which would represent approximately 162.26 W / m 2 as an average for the year studied. The annual average for the four locations is 158.39 W / m 2   for P1, 160.9 W / m 2 for P2, 163.51 W / m 2 for P3, and 163.73 W / m 2 for P4. We can see that the values are close so that the profile of solar radiation can be said to be kept constant over time.
The more that FPV technology advances, the more farms of this kind appear all over the world. There is currently more than 3 MW of installed capacity. In this context, we have chosen to simulate four projects that are in the course of commissioning or are already in operation. These projects were selected based on size and installed capacity. If we refer to the size, they range from 6800 m 2 to 2,023,430 m 2 . With these visible differences, the installed capacities will also be varied, from 729 kW to 0.10 GW projects. In terms of the regions, we picked both high- and low-radiation areas but also regions that were similar to the one in this study. Table 4 shows the locations of the chosen farms, as well as their properties.
The only farm that generates more energy at its original site is the one in India, as shown in Figure 12, because the solar radiation there is substantially greater than in the areas we selected for the research. Projects, such as those in Figure 12, may provide for around 280, 2425, 15,650, or 38,510 homes, given that the average household usage in Romania is roughly 283 kWh / month , or 3396 kWh / year . Even if the project with the lowest capacity (729 kW) may be regarded as weak, we can state that in this situation it may be useful. A project like this could be sufficient for the first three locations that are on the lake since they could supply the communities nearby that are not developed and where the population is declining.
Romania does not have high values of solar radiation on a global scale, as it is located in an area with medium to low solar radiation resources. However, countries such as Germany, which is located in more deficient areas, is among the top four countries with the most PVs installed (in fourth place), as is Japan, which is the third.
Another aspect worth analyzing is the one related to water and air temperatures. As already mentioned in this paper, water is an important factor/element that solar panels can use as a cooling system. As noted above, when the temperature increases, the performance of the panel decreases, so that in the summer months, the average monthly temperature for the selected areas is about 25.7 °C, with a maximum monthly temperature of 35 °C. When the temperature exceeds 25 °C, the PV will no longer perform as expected by the manufacturer. In this case, the temperature of the water can play an important role in cooling the panels, with temperatures 3 or 5 degrees lower than that of the air. The idea of reducing the temperature of the panels has been intensively studied over time and is described extensively in reference papers [62,63,64]. All these studies have shown that energy production improves by 3–6% compared to conventional PVs, and water has a positive effect even when its temperature is higher than that of the air.

5. Conclusions

The development of new projects that will result in the generation of power is crucial given the energy crisis Romania is facing. By implementing these projects, we can reduce the purchase of electricity from external grids. Since there are currently no studies that provide information about possible locations on the water where solar energy can be exploited, this study presents an overview of the benefits that can come from the implementation of FPV farms.
The present research highlights the importance of floating PV systems installed on bodies of still water such as ponds, lakes, dams, and reservoirs but also the sea. In this study, the GHI, DNI, and DHI components of surface solar irradiance observed on the west side of Romania have been analyzed, based on 1 h data obtained from the ERA5 database, and the analyzed period is between January 2021 and 31 December 2021. It also compares energy production by floating PV plants in different locations. The study yielded the following conclusions:
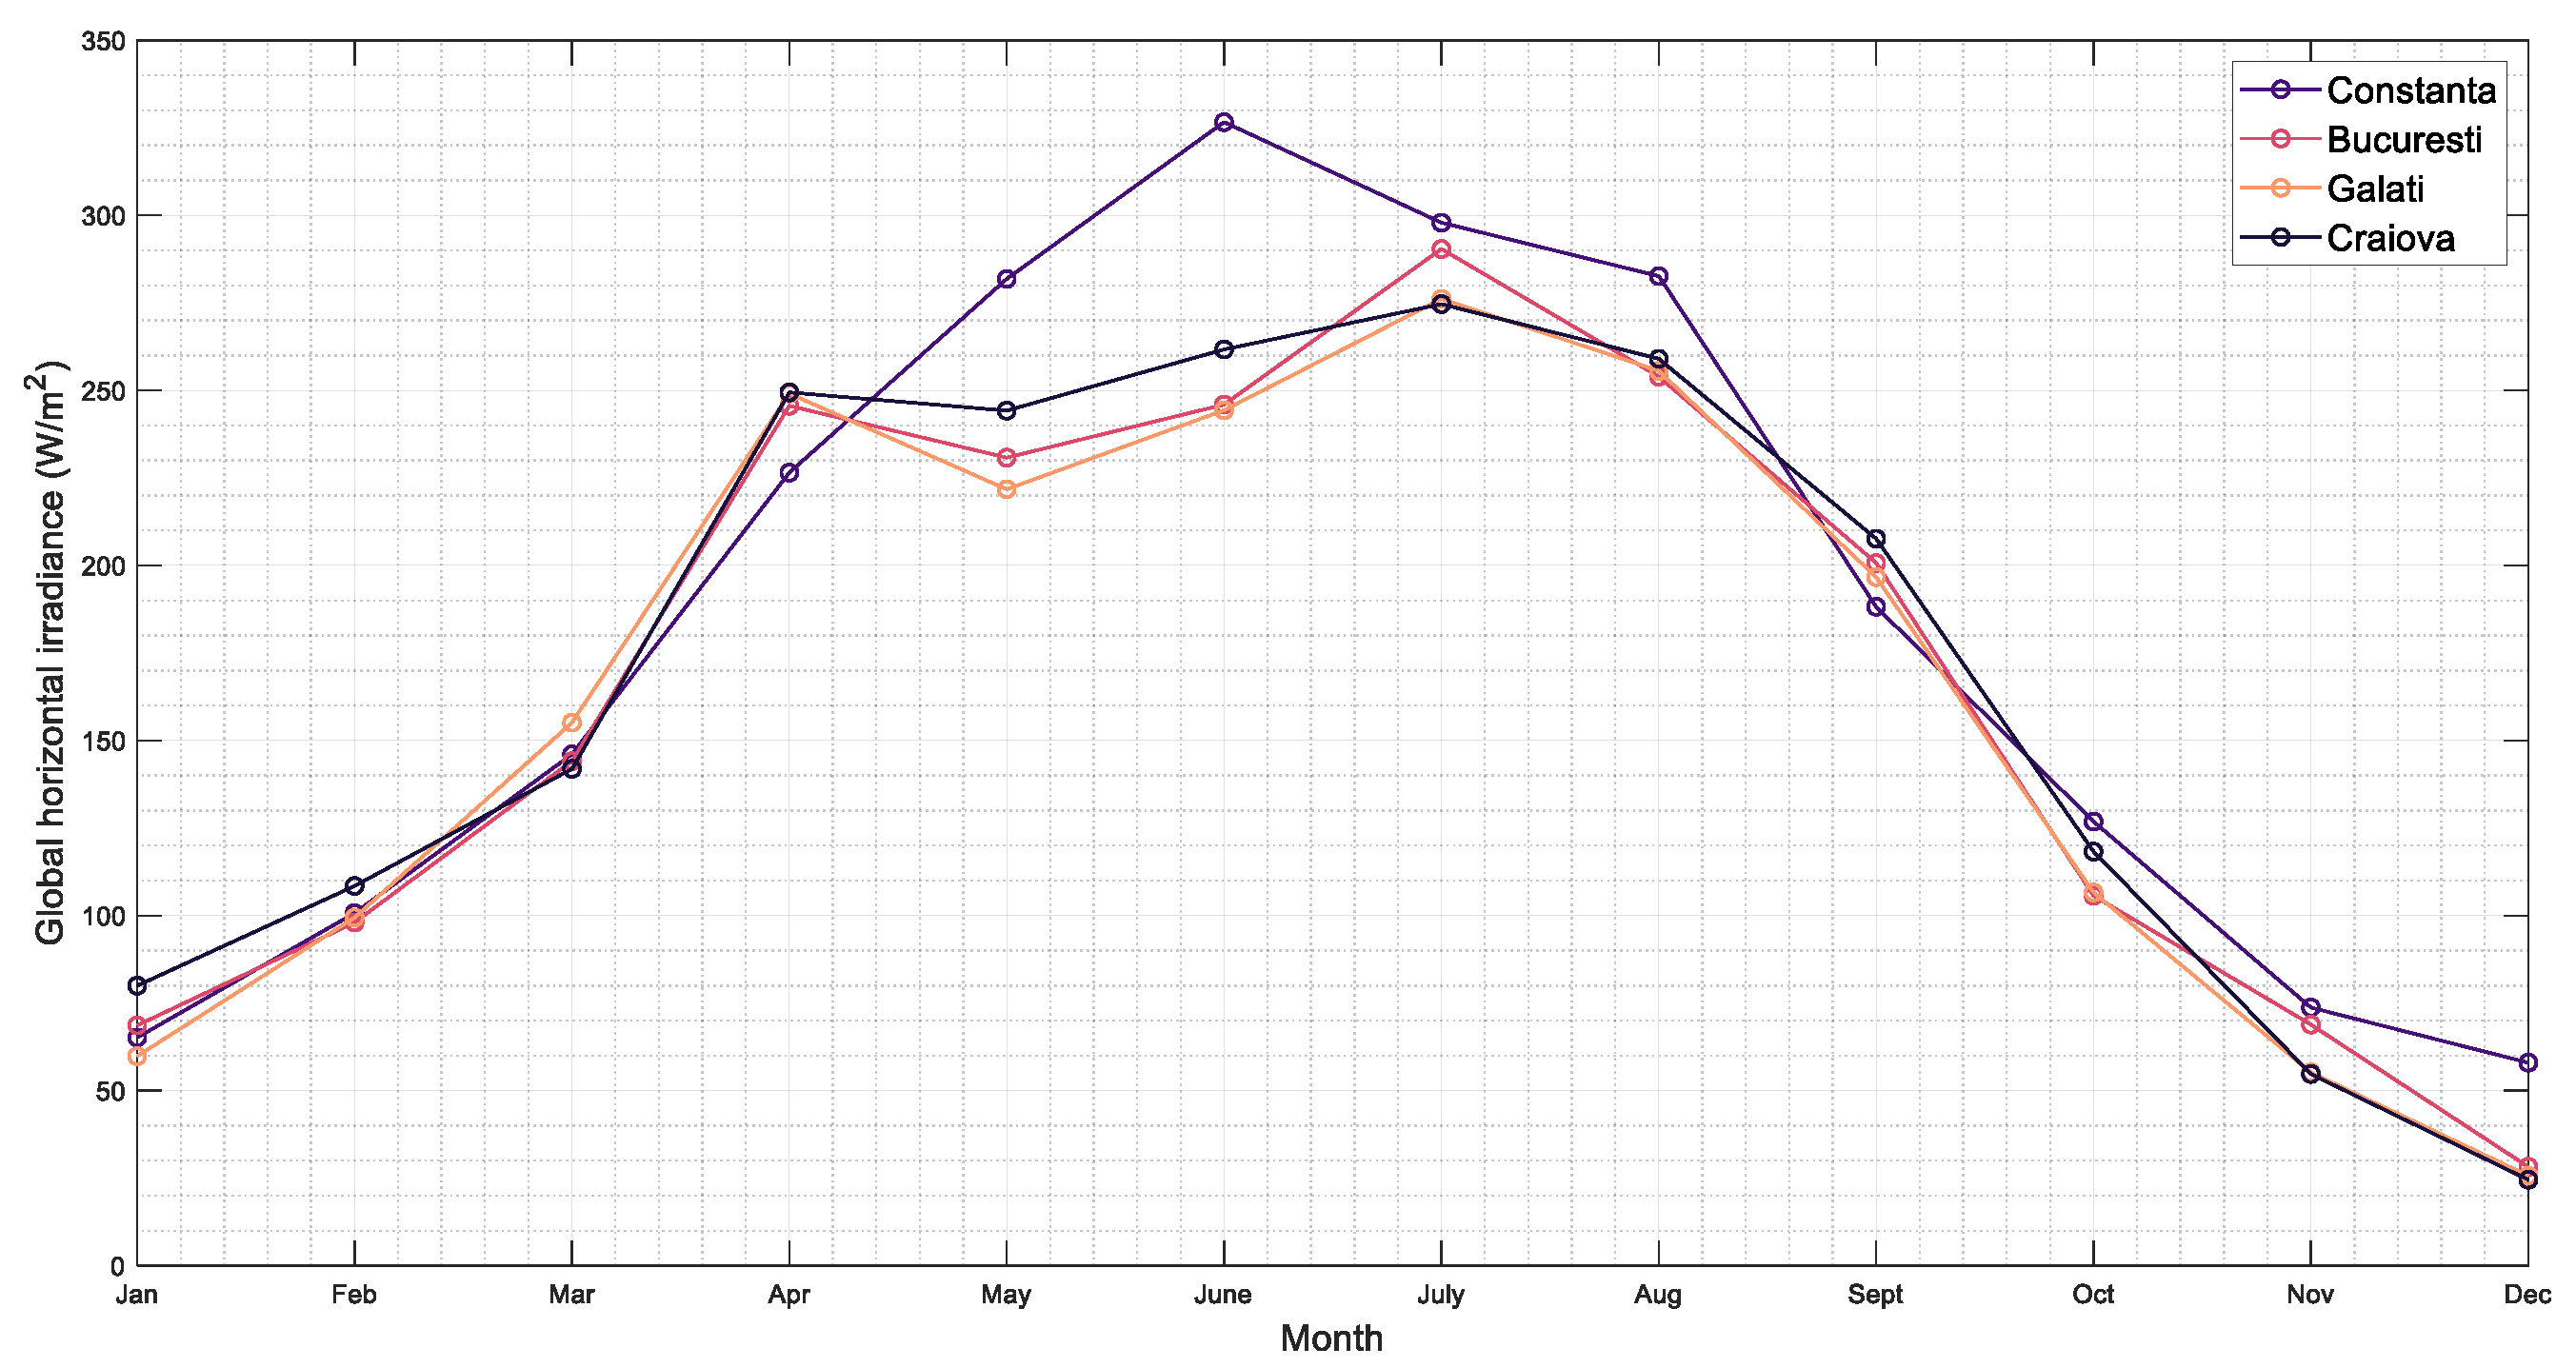
  • The data obtained from the ERA5 database are similar to the measured ones; those from ERA5 underestimate solar radiation.
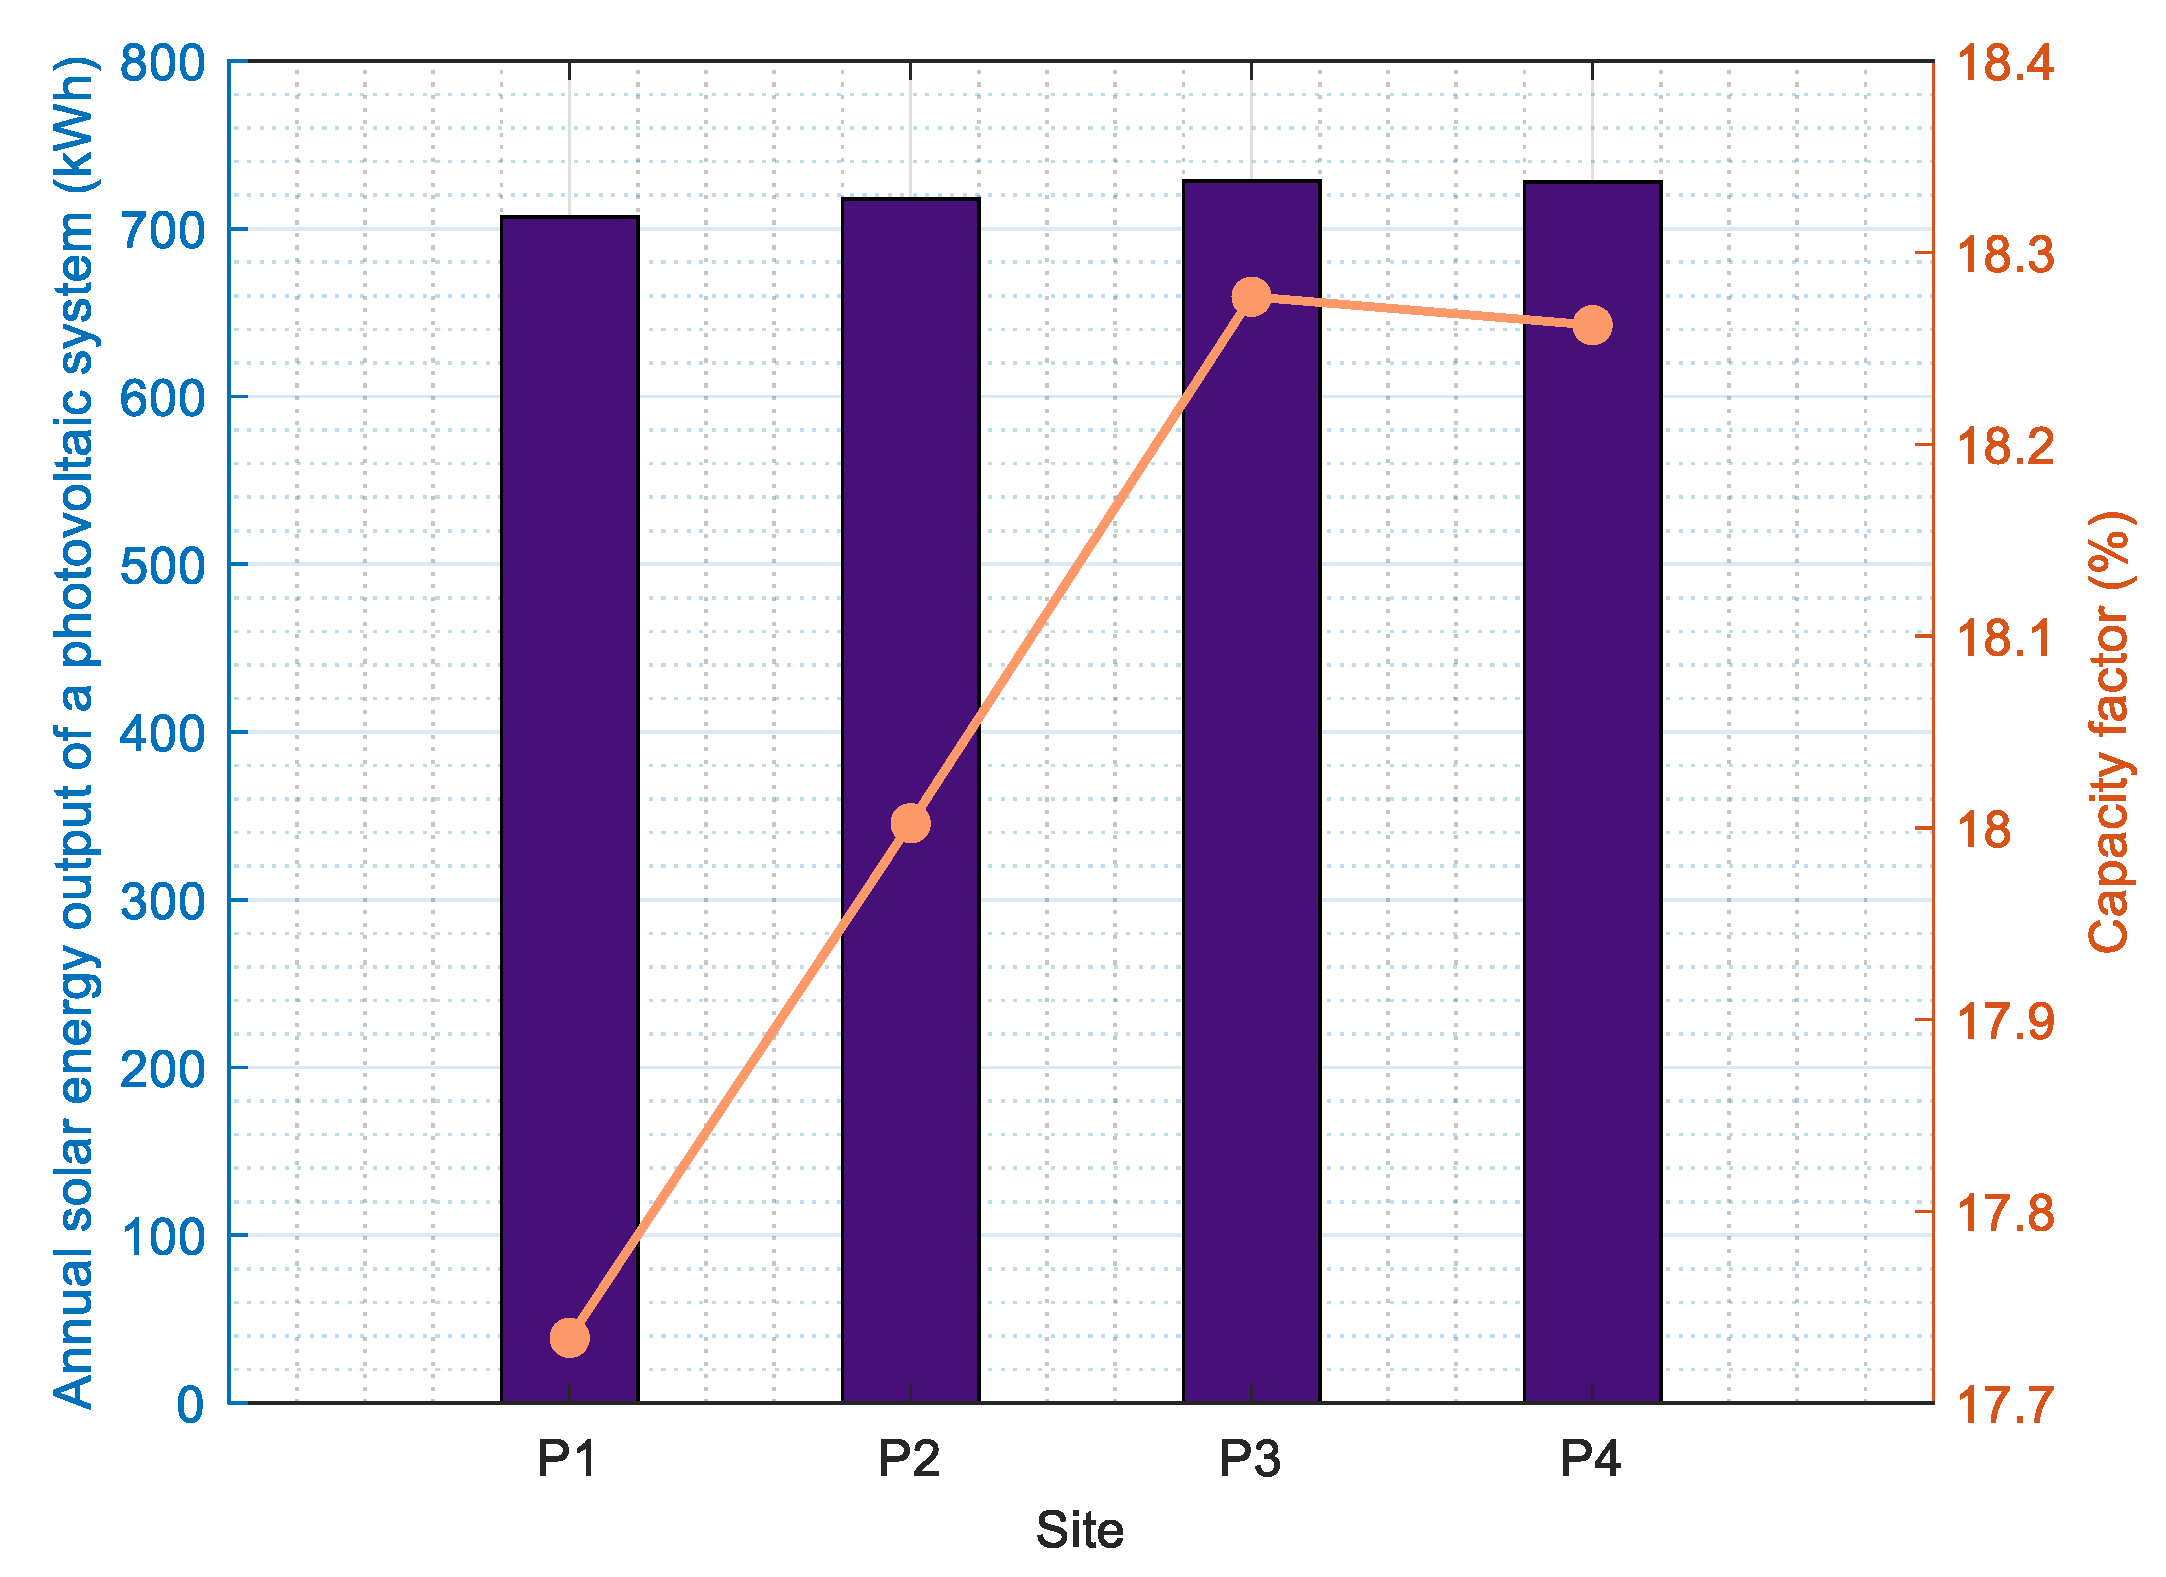
  • The energy production for the chosen locations is high, reaching 700 kWh for a 540 W PV. These results are similar to the first PV farm located on the water in Romania, which is estimated at 15,000 kWh for 22 panels.
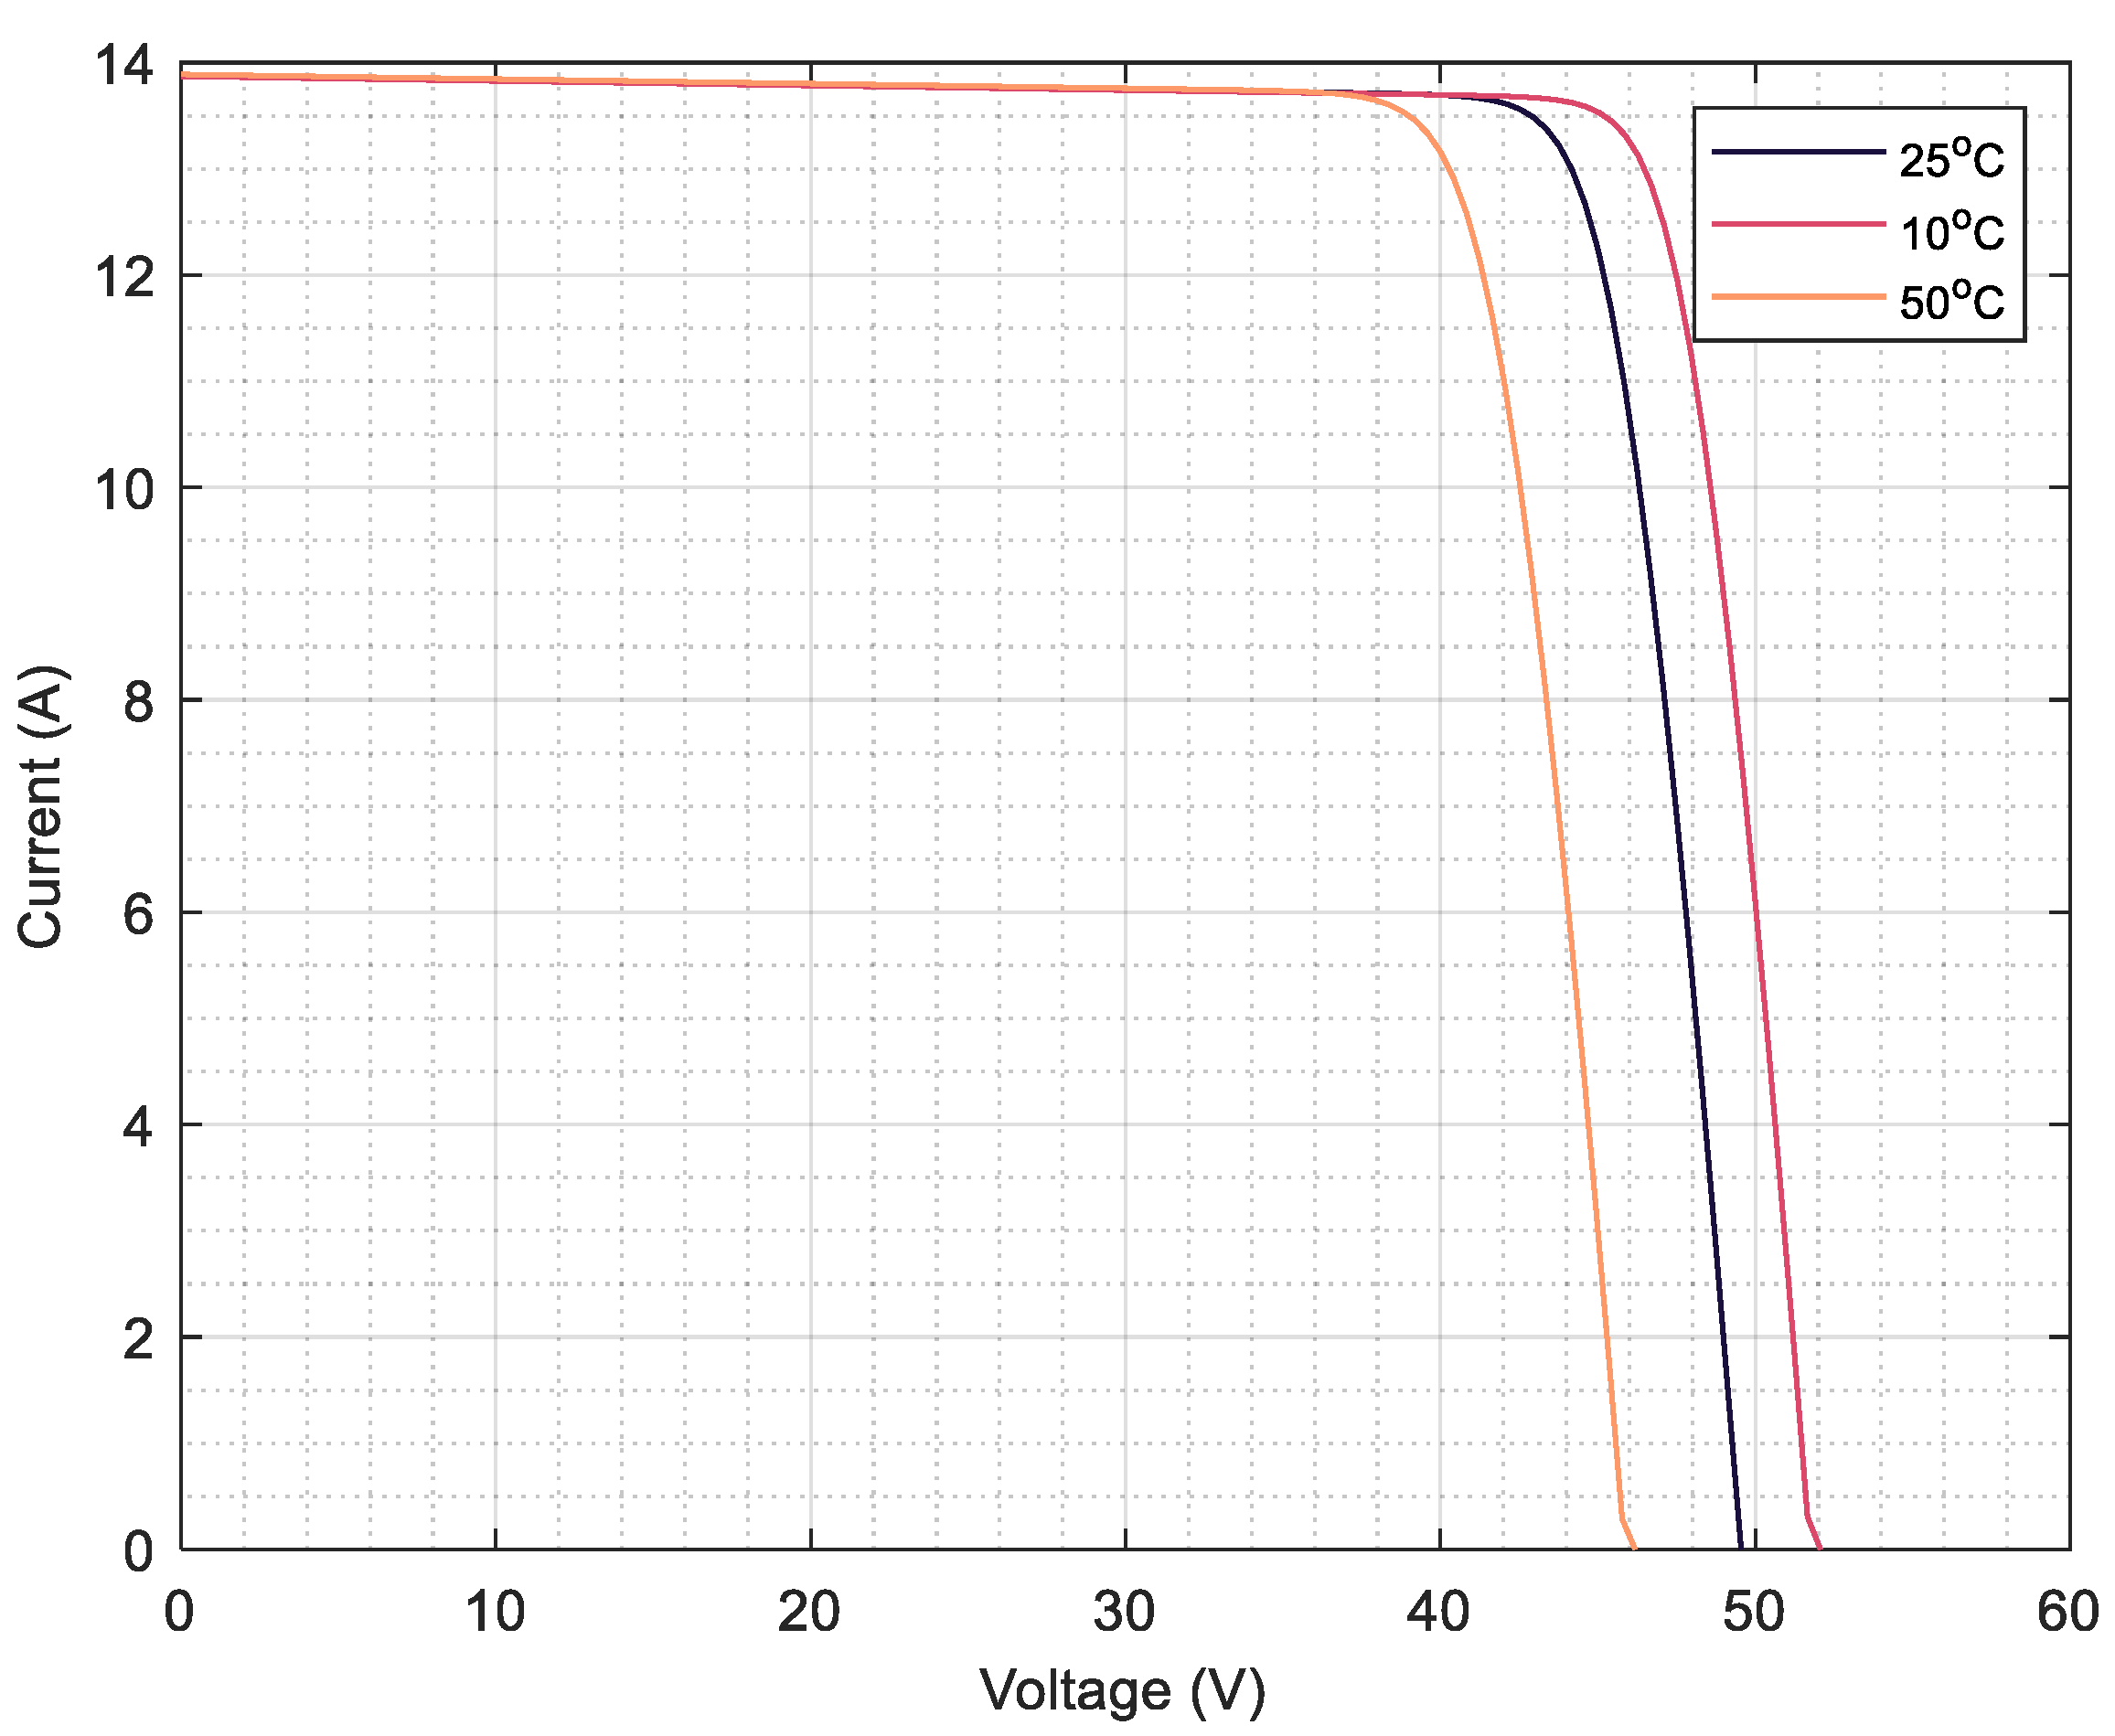
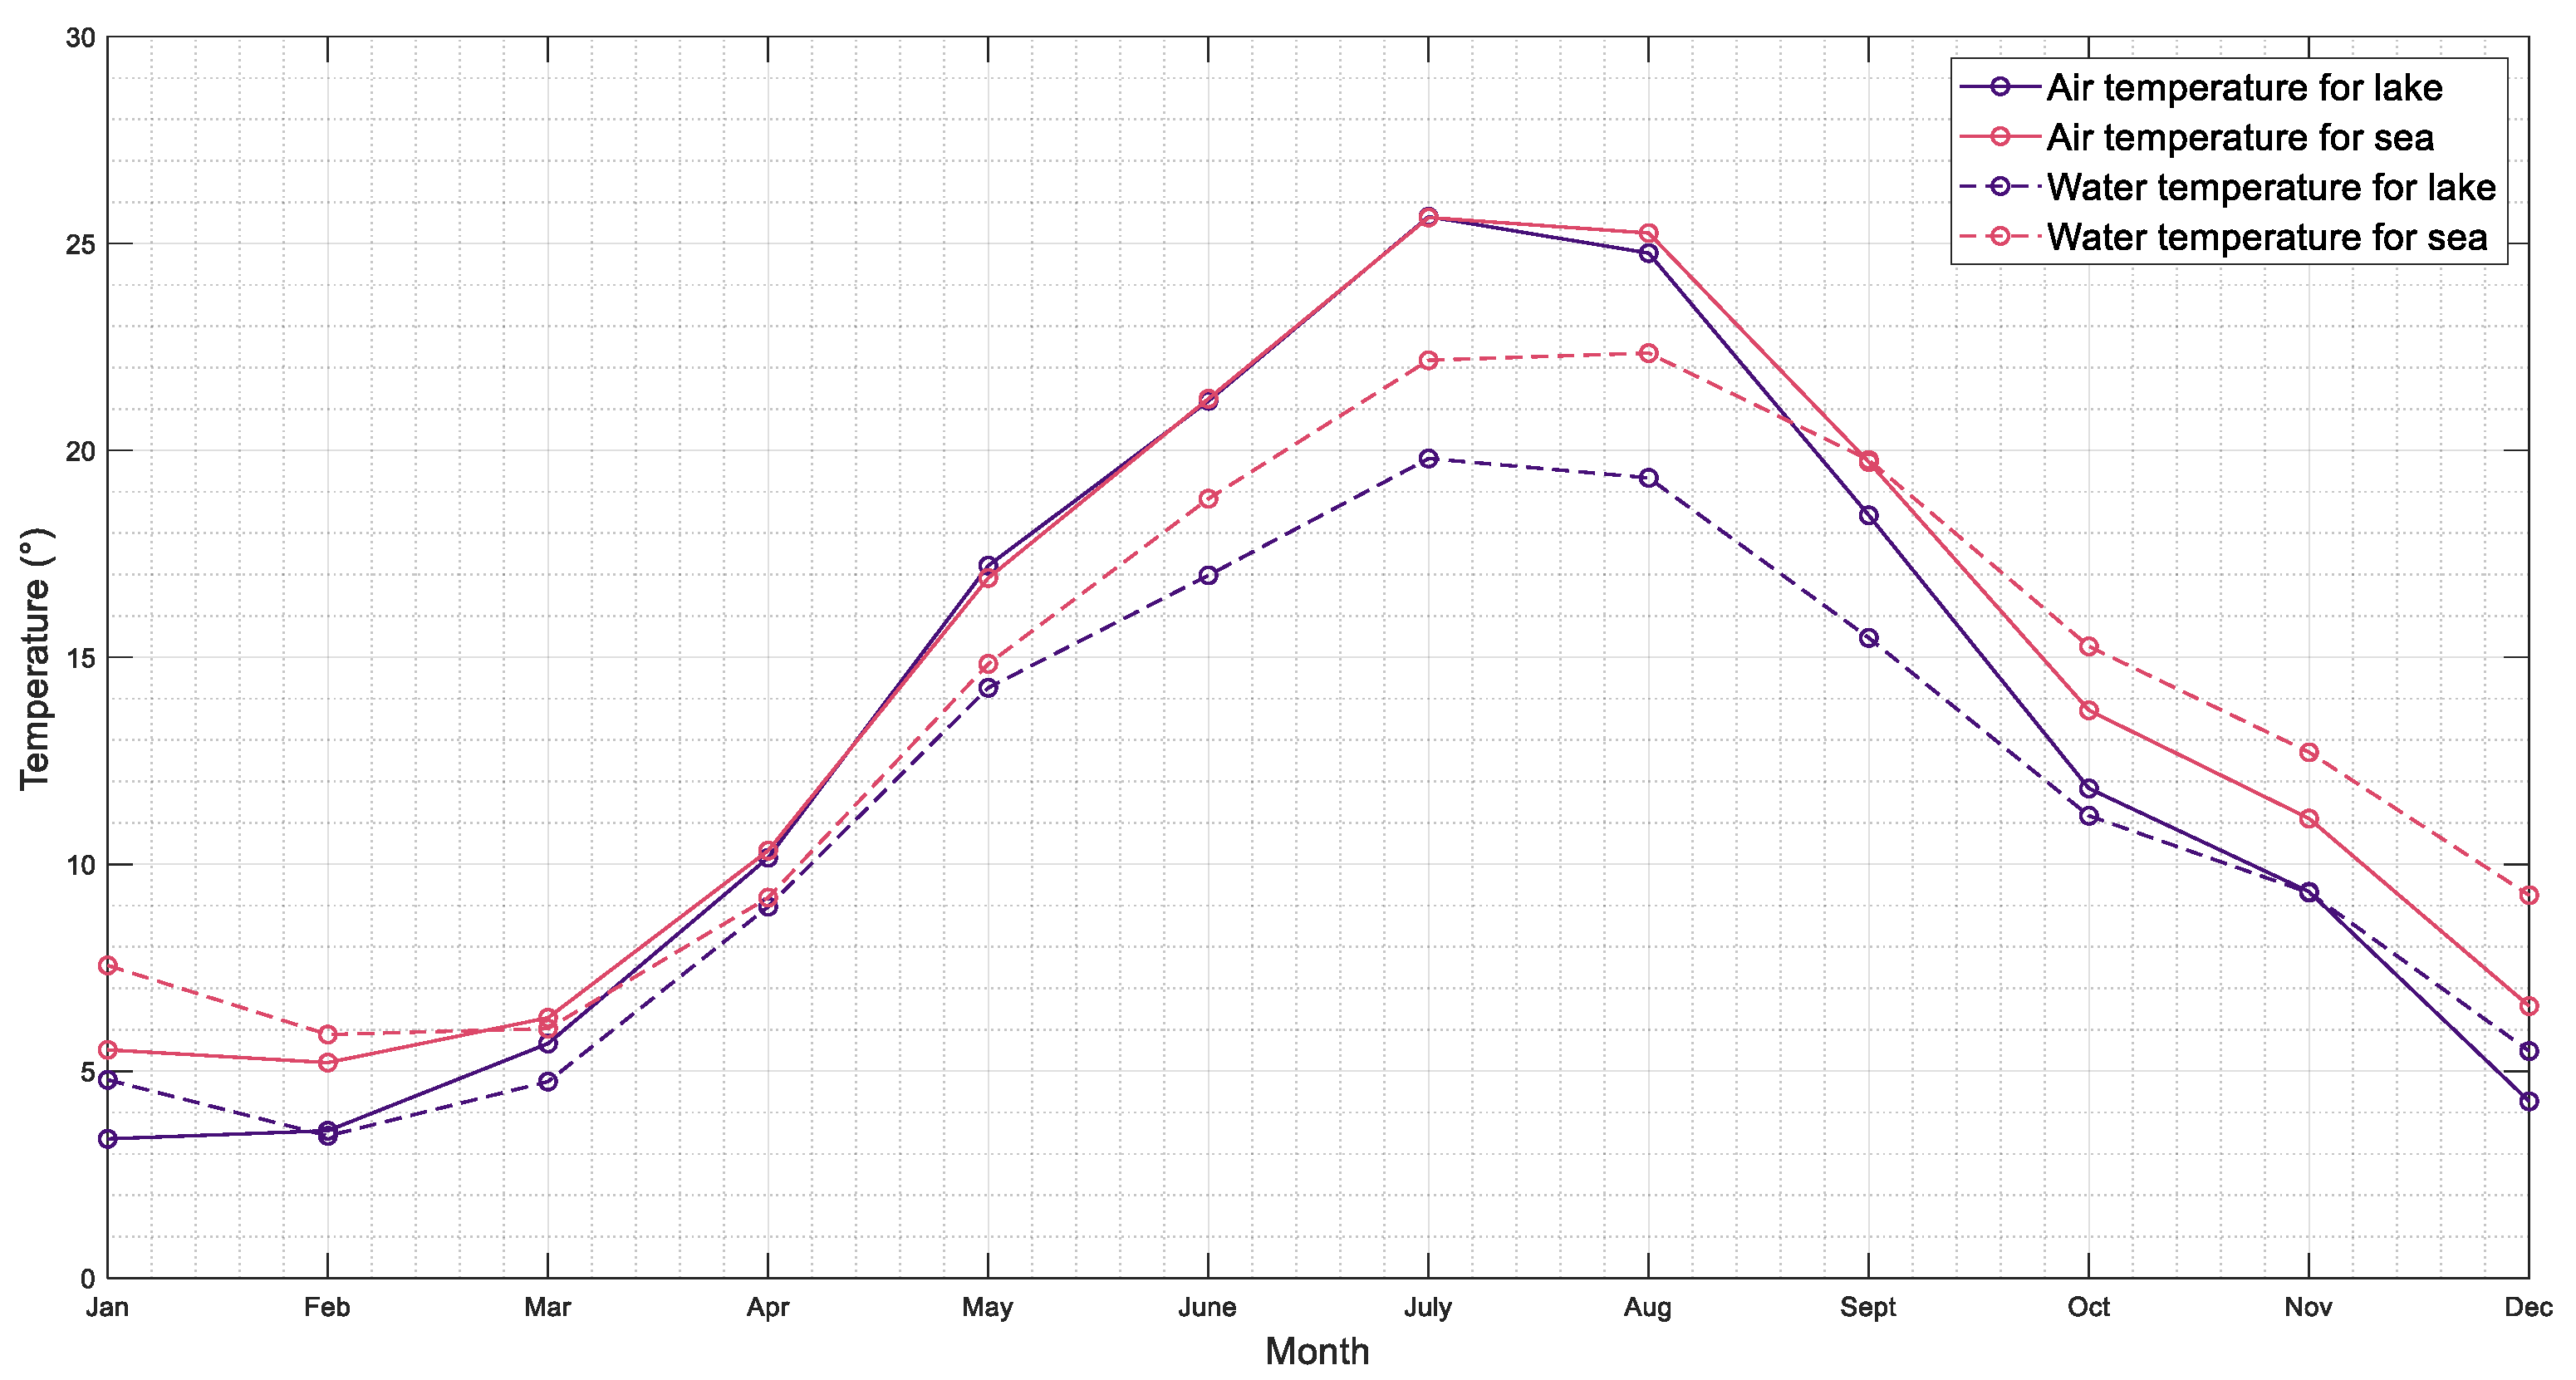
  • Because the PVs will be floating on water, they will be cooler and thus will produce more power than those installed on land. Overheating can lead to component damage, and by placing them on water, maintenance can be significantly reduced. Furthermore, rain and wind help to clean the surface of the PV, minimizing the amount of maintenance necessary.
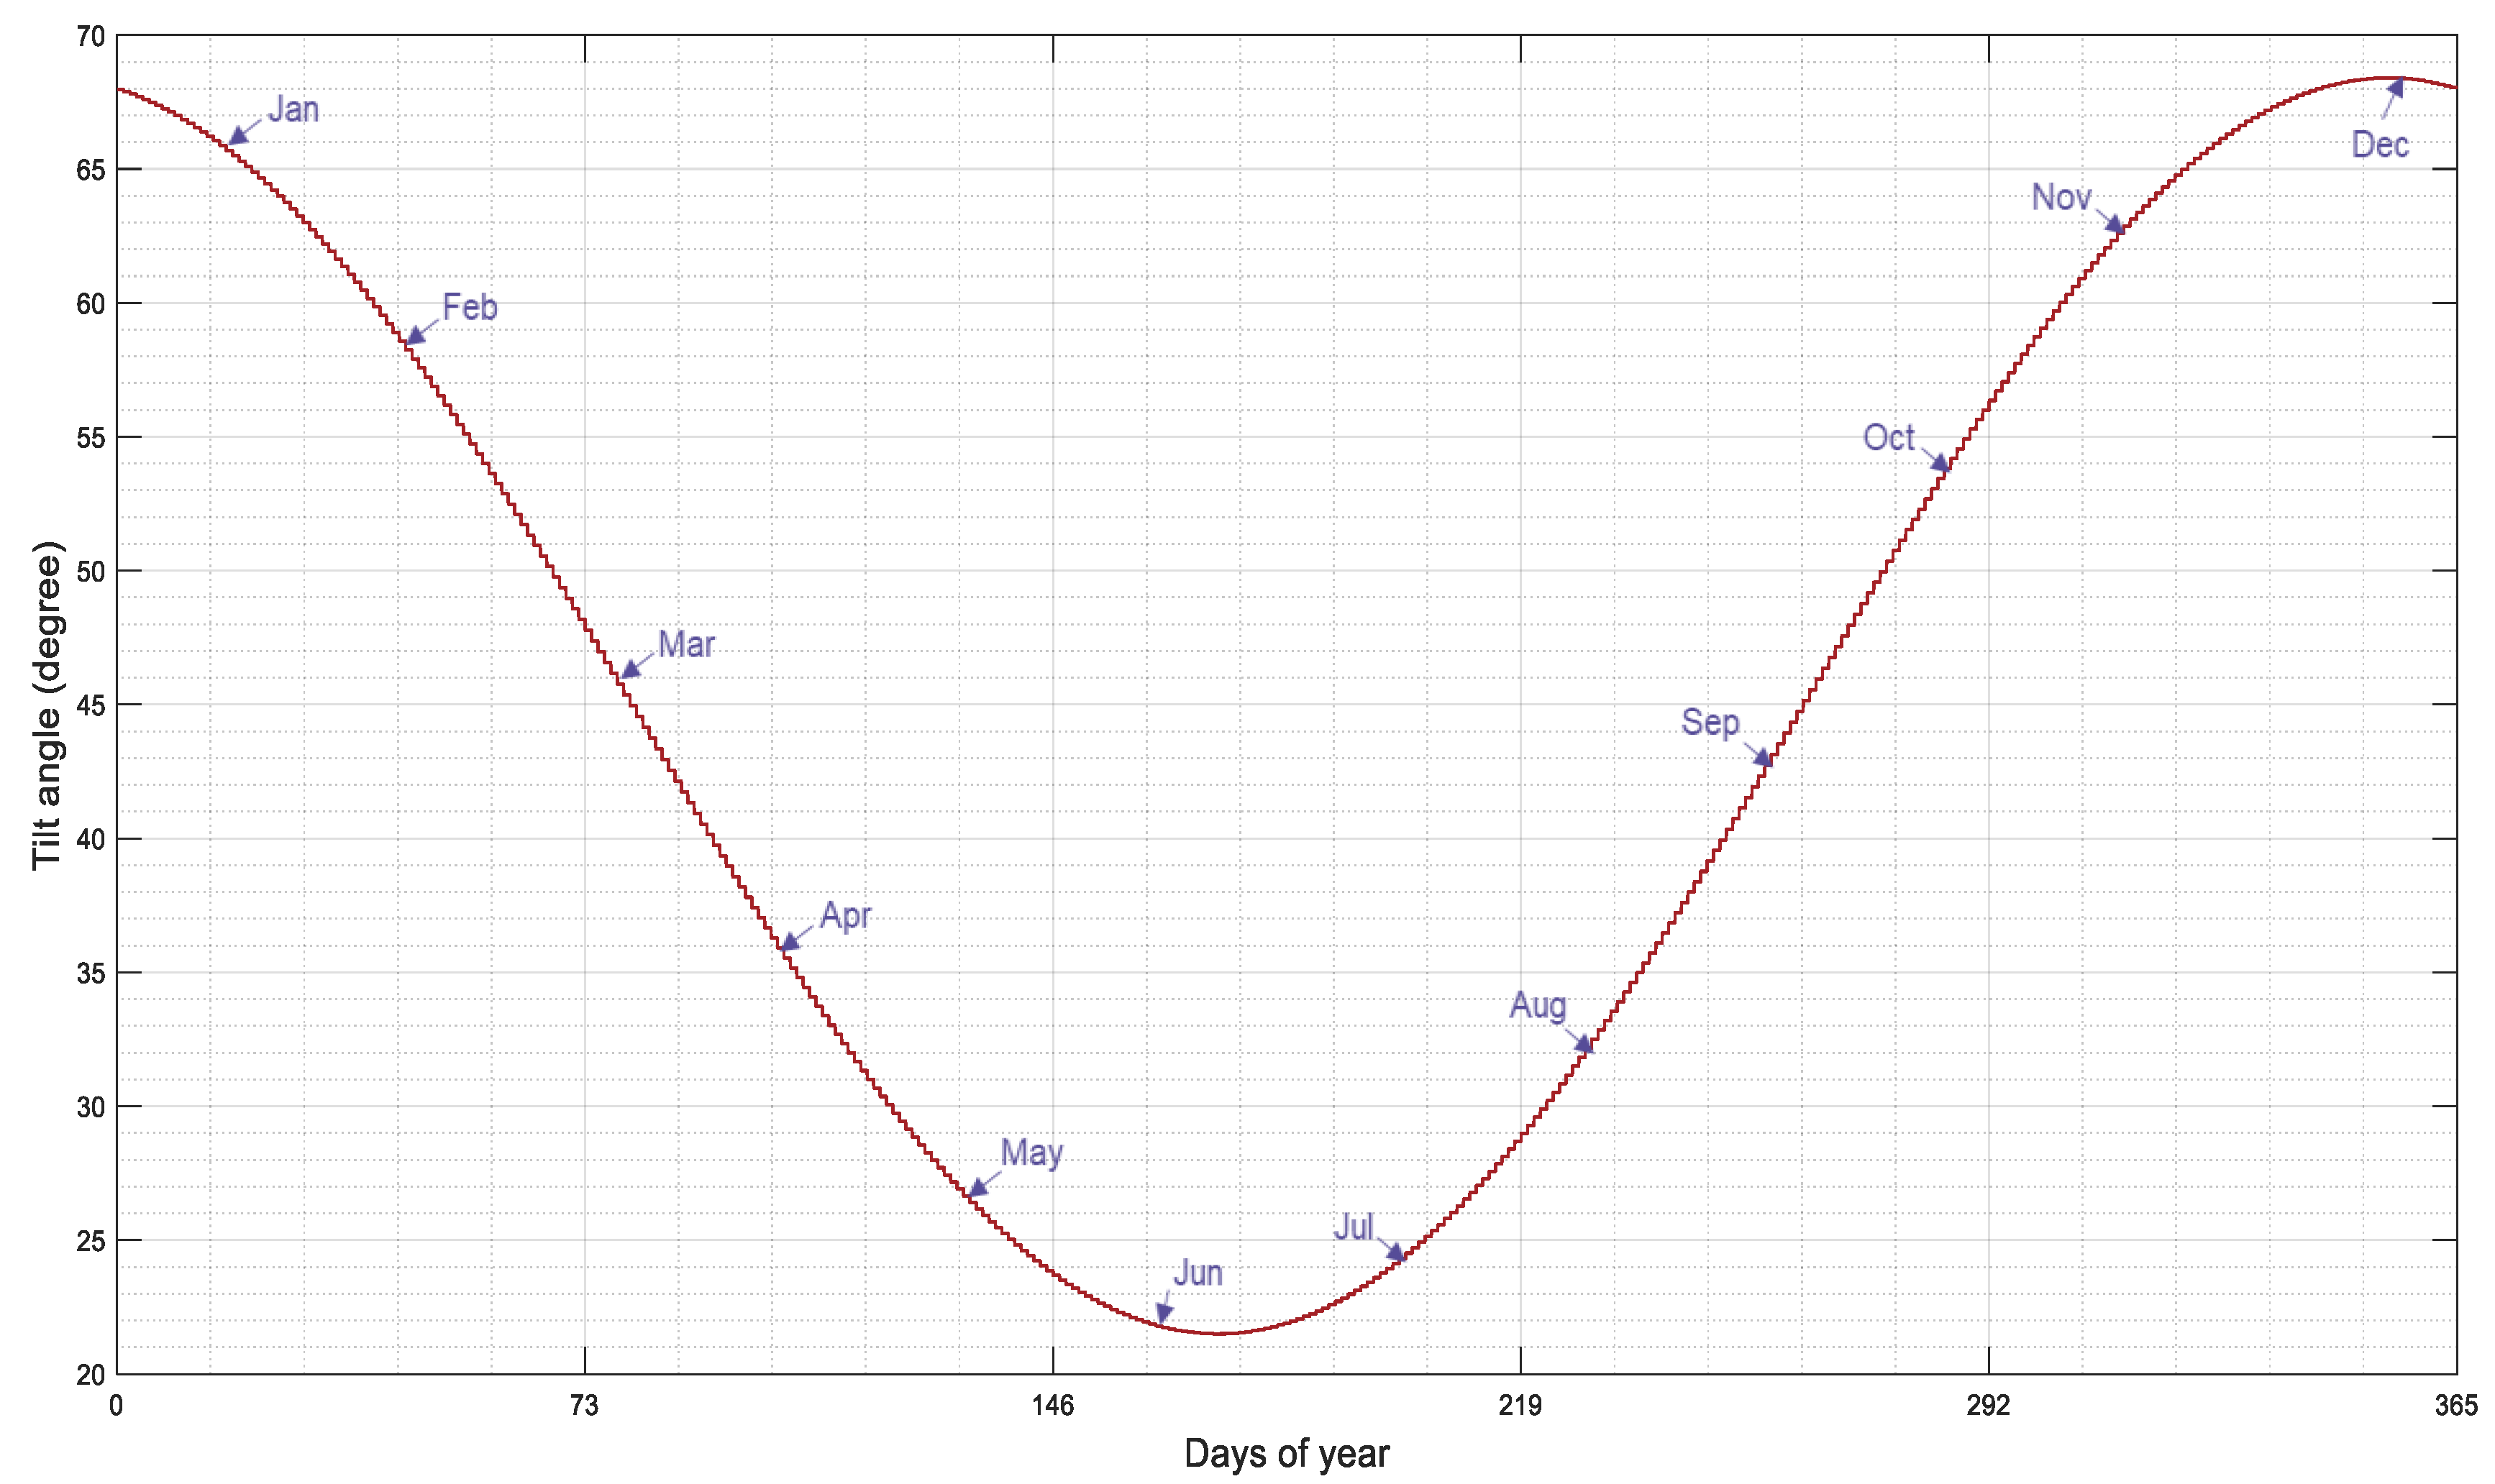
  • The tilt angle has a significant impact on solar energy production. In our case, the value of this angle should be set at 64° and for summer at 24°. The use of PVs without an angle reduces energy production by about 10–15%. This tilt angle is a challenge for FPVs because the technology has not yet been sufficiently developed.
  • FPV technology could be an innovative solution to the problem of insufficient land. The majority of land in Romania is used for agricultural purposes, and the country is positioned among the first countries in agriculture in Europe.
  • The lakes used for this study have two main economic purposes, one being tourism, having beautiful fauna and flora, and the main one being for irrigation. Taking into account the remark about how the panels help to reduce water evaporation, as was also concluded in reference [65], we can say that the economic impact of irrigation is increased by the location of PVs on the water.
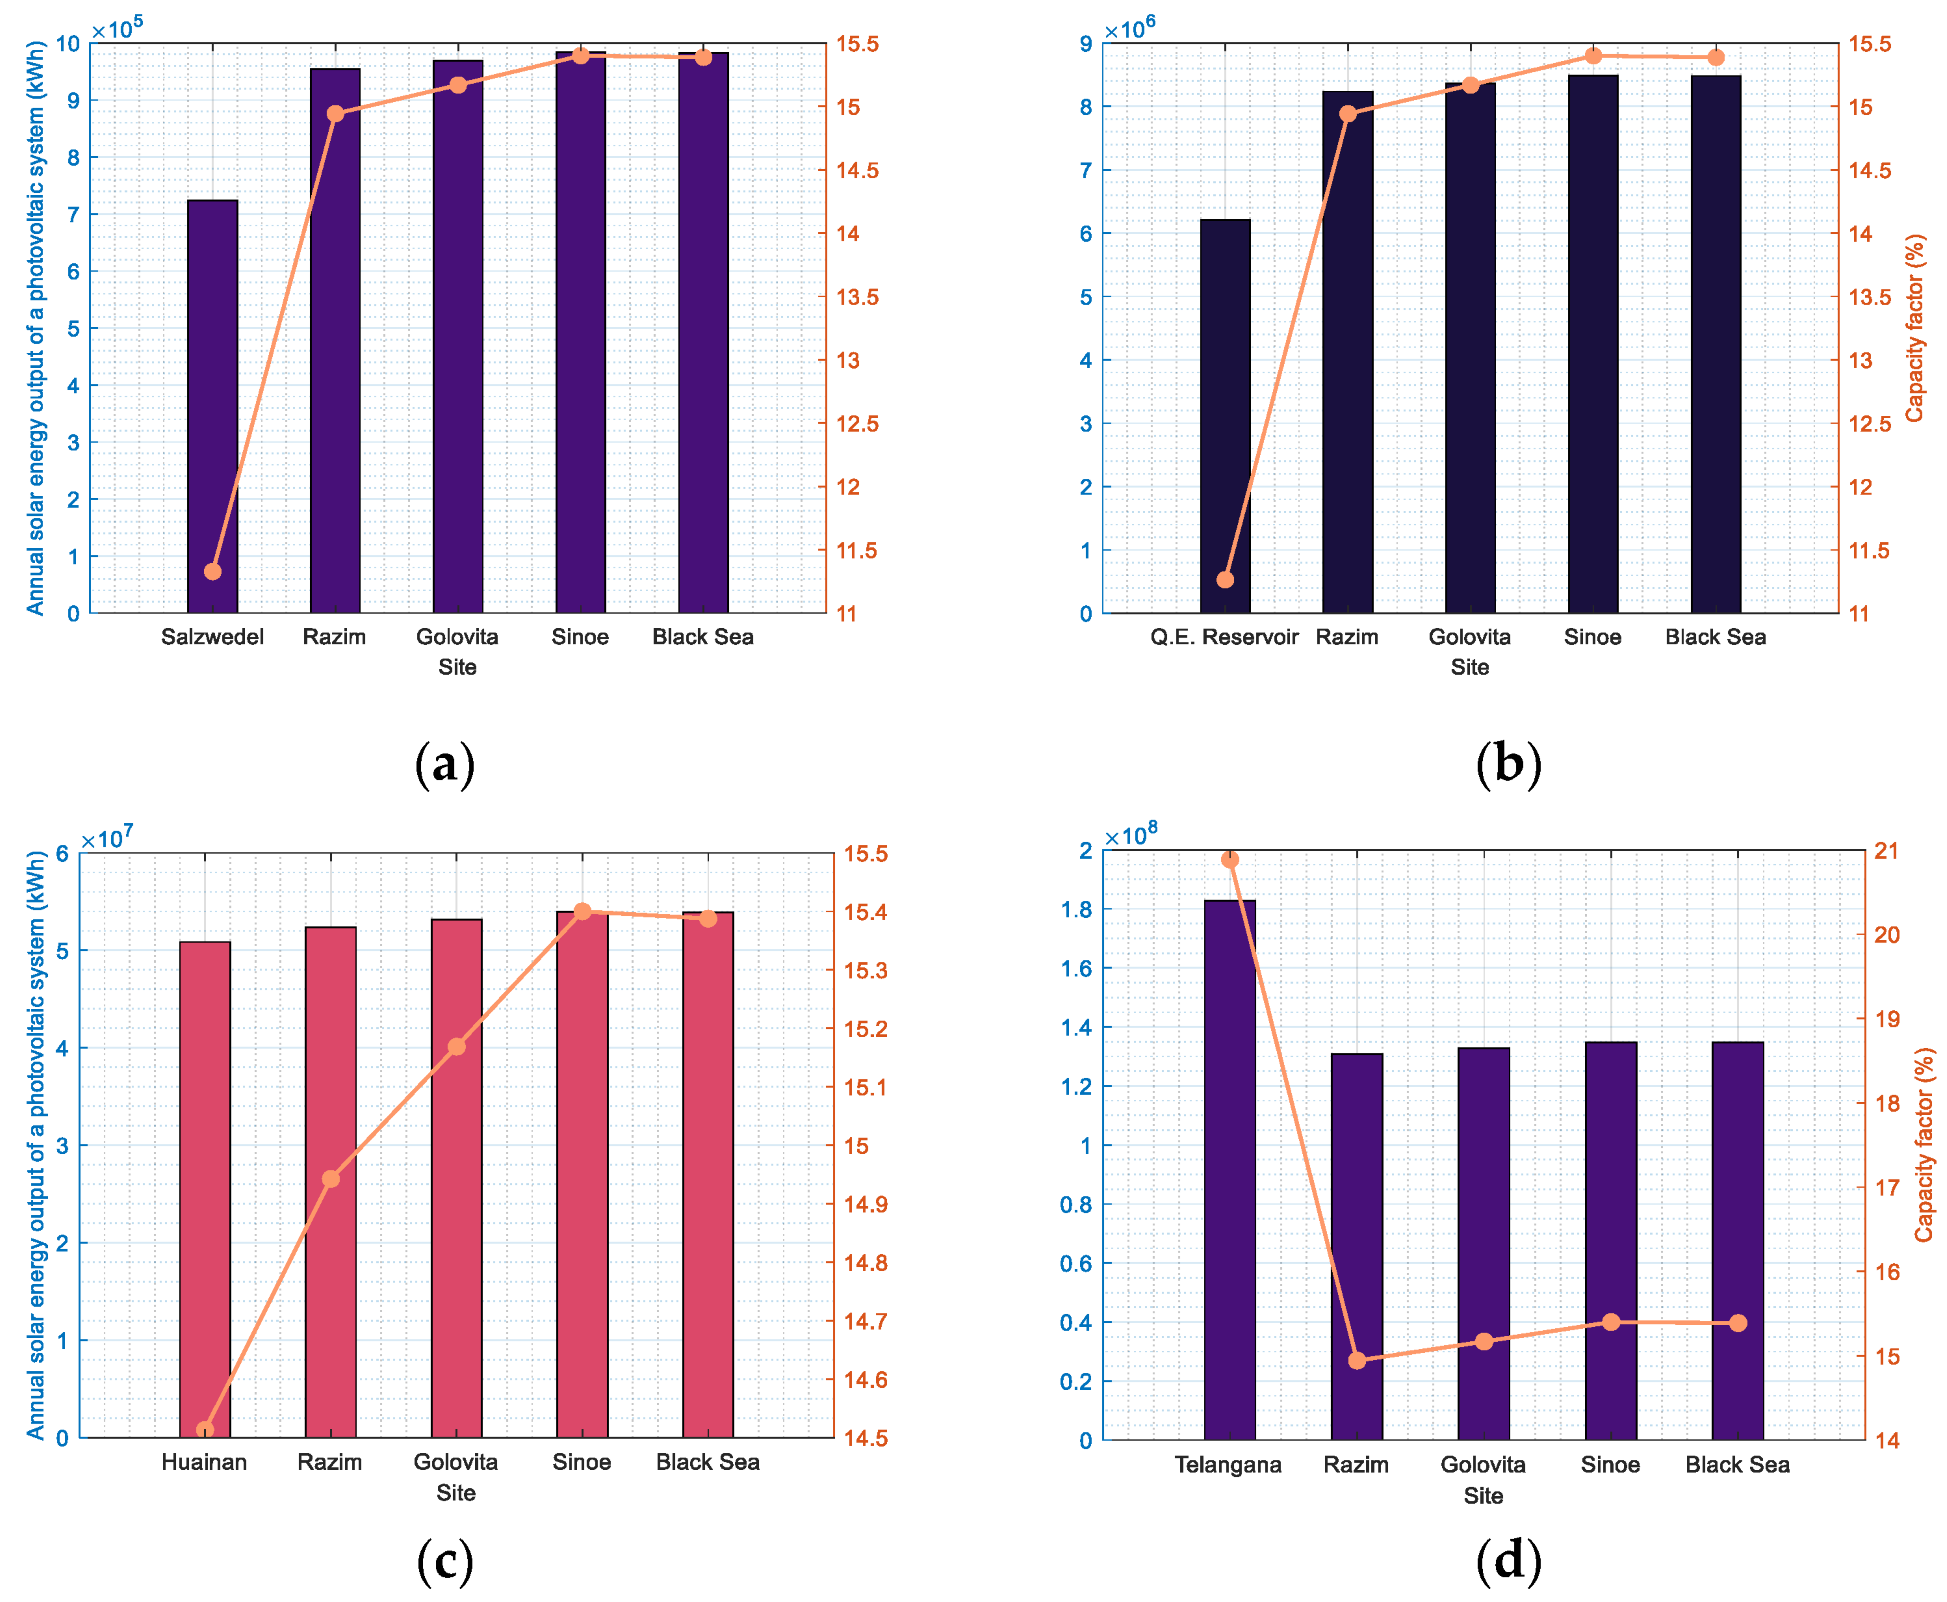
  • By integrating several FPV farms into the four sites, we were able to see that, in three out of the four cases, our locations were able to produce more energy than their existing positions. Dobrogea nowadays is characterized by undeveloped, largely uninhabited settlements, and renewable energy sources are advantageous to these communities. Many of these villages use wind turbines to provide electricity. As a result, it is possible to assure the nearby communities’ access to electricity by building even the smallest FVP project.
  • The Black Sea location provided the best results, but it is also the most difficult in terms of environmental conditions, as it will be affected by waves, and the structure must be designed to last implying higher costs.
Previous research has revealed good qualities of wind energy for the Black Sea [66,67]. We can conclude that the Black Sea has enormous potential for renewable energy, whether it is solar or wind energy.
As future research directions, we intend to direct this study to a practical case either carried out in the laboratory or carried out in situ at one of the locations in the study.

Author Contributions

A.I.M. drafted this manuscript, processed the numerical data, and assembled the manuscript, G.A. checked and revised the manuscript and supervised it, L.R. came up with the idea of floating solar panels and was in charge of funding acquisition and project administration. All authors have read and agreed to the published version of the manuscript.

Funding

This work was carried out in the framework of the research project DREAM (Dynamics of the Resources and Technological Advance in Harvesting Marine Renewable Energy), supported by the Romanian Executive Agency for Higher Education, Research, Development, and Innovation Funding-UEFISCDI (grant number PN-III-P4-ID-PCE-2020-0008).

Institutional Review Board Statement

Not applicable.

Informed Consent Statement

Not applicable.

Data Availability Statement

Not applicable.

Conflicts of Interest

The authors declare no conflict of interest.

References

  1. IRENA. Global Hydrogen Trade to Meet the 1.5 °C Climate Goal: Part II—Technology Review of Hydrogen Carriers; IRENA: Abu Dhabi, United Arab Emirates, 2022; ISBN 978-92-9260-431-8. [Google Scholar]
  2. United Nations. Report of the Conference of the Parties to the United Nations Framework Convention on Climate Change (21st Session); United Nations: Paris, France, 2015; Volume 4, p. 2017. [Google Scholar]
  3. Wang, C.; Wang, Y.; Tong, X.; Ulgiati, S.; Liang, S.; Xu, M.; Wei, W.; Li, X.; Jin, M.; Mao, J. Mapping Potentials and Bridging Regional Gaps of Renewable Resources in China. Renew. Sustain. Energy Rev. 2020, 134, 110337. [Google Scholar] [CrossRef]
  4. Singh, D.P.; Dhami, S.S.; Banwait, S.S.; Goyal, D. Performance Comparison of Fixed and Tracking Type Solar Plants. Int. J. Innov. Technol. Explor. Eng. 2020, 9, 612–620. [Google Scholar] [CrossRef]
  5. Ravichandran, N.; Ravichandran, N.; Panneerselvam, B. Comparative Assessment of Offshore Floating Photovoltaic Systems Using Thin Film Modules for Maldives Islands. Sustain. Energy Technol. Assess. 2022, 53, 102490. [Google Scholar] [CrossRef]
  6. Olabi, A.G.; Abdelkareem, M.A. Renewable Energy and Climate Change. Renew. Sustain. Energy Rev. 2022, 158, 112111. [Google Scholar] [CrossRef]
  7. Kannan, N.; Vakeesan, D. Solar Energy for Future World—A Review. Renew. Sustain. Energy Rev. 2016, 62, 1092–1105. [Google Scholar] [CrossRef]
  8. Essak, L.; Ghosh, A. Floating Photovoltaics: A Review. Clean Technol. 2022, 4, 752–769. [Google Scholar] [CrossRef]
  9. Devabhaktuni, V.; Alam, M.; Depuru, S.S.S.R.; Green, R.C., II; Nims, D.; Near, C. Solar Energy: Trends and Enabling Technologies. Renew. Sustain. Energy Rev. 2013, 19, 555–564. [Google Scholar] [CrossRef]
  10. Claus, R.; López, M. Key Issues in the Design of Floating Photovoltaic Structures for the Marine Environment. Renew. Sustain. Energy Rev. 2022, 164, 112502. [Google Scholar] [CrossRef]
  11. Weinstein, L.A.; Loomis, J.; Bhatia, B.; Bierman, D.M.; Wang, E.N.; Chen, G. Concentrating Solar Power. Chem. Rev. 2015, 115, 12797–12838. [Google Scholar] [CrossRef]
  12. Santos, J.J.C.S.; Palacio, J.C.E.; Reyes, A.M.M.; Carvalho, M.; Freire, A.J.R.; Barone, M.A. Concentrating Solar Power. In Advances in Renewable Energies and Power Technologies; Elsevier: Amsterdam, The Netherlands, 2018; pp. 373–402. [Google Scholar]
  13. Ge, T.S.; Wang, R.Z.; Xu, Z.Y.; Pan, Q.W.; Du, S.; Chen, X.M.; Ma, T.; Wu, X.N.; Sun, X.L.; Chen, J.F. Solar Heating and Cooling: Present and Future Development. Renew Energy 2018, 126, 1126–1140. [Google Scholar] [CrossRef]
  14. Hairong, X.; Hao, G.; Yusuke, Y.; Takayoshi, S.; Renzhi, M. Photo-Enhanced Rechargeable High-Energy-Density Metal Batteries for Solar Energy Conversion and Storage. Nano Res. Energy 2022, 1, e9120007. [Google Scholar] [CrossRef]
  15. International Renewable Energy Agency. Renewable Capacity Statistics 2022; IRENA: Abu Dhabi, United Arab Emirates, 2022; ISBN 978-92-9260-428-8. [Google Scholar]
  16. Sahu, A.; Yadav, N.; Sudhakar, K. Floating Photovoltaic Power Plant: A Review. Renew. Sustain. Energy Rev. 2016, 66, 815–824. [Google Scholar] [CrossRef]
  17. Vo, T.T.E.; Ko, H.; Huh, J.; Park, N. Overview of Possibilities of Solar Floating Photovoltaic Systems in the OffShore Industry. Energies 2021, 14, 6988. [Google Scholar] [CrossRef]
  18. Kumar, M.; Niyaz, H.M.; Gupta, R. Challenges and Opportunities towards the Development of Floating Photovoltaic Systems. Sol. Energy Mater. Sol. Cells 2021, 233, 111408. [Google Scholar] [CrossRef]
  19. Trapani, K.; Millar, D.L. Floating Photovoltaic Arrays to Power the Mining Industry: A Case Study for the McFaulds Lake (Ring of Fire). Env. Prog. Sustain. Energy 2016, 35, 898–905. [Google Scholar] [CrossRef]
  20. Trapani, K.; Millar, D.L.; Smith, H.C.M. Novel Offshore Application of Photovoltaics in Comparison to Conventional Marine Renewable Energy Technologies. Renew Energy 2013, 50, 879–888. [Google Scholar] [CrossRef]
  21. Choi, Y.K. A Study on Power Generation Analysis of Floating PV System Considering Environmental Impact. Int. J. Softw. Eng. Its Appl. 2014, 8, 75–84. [Google Scholar] [CrossRef]
  22. Sasmanto, A.A.; Dewi, T. Eligibility Study on Floating Solar Panel Installation over Brackish Water in Sungsang, South Sumatra. EMITTER Int. J. Eng. Technol. 2020, 8, 240–255. [Google Scholar] [CrossRef]
  23. Majid, Z.A.A.; Ruslan, M.H.; Sopian, K.; Othman, M.Y.; Azmi, M.S.M. Study on Performance of 80 Watt Floating Photovoltaic Panel. J. Mech. Eng. Sci. 2014, 7, 1150–1156. [Google Scholar] [CrossRef]
  24. Cazzaniga, R.; Cicu, M.; Rosa-Clot, M.; Rosa-Clot, P.; Tina, G.M.; Ventura, C. Floating Photovoltaic Plants: Performance Analysis and Design Solutions. Renew. Sustain. Energy Rev. 2018, 81, 1730–1741. [Google Scholar] [CrossRef]
  25. Micheli, L. The Temperature of Floating Photovoltaics: Case Studies, Models and Recent Findings. Sol. Energy 2022, 242, 234–245. [Google Scholar] [CrossRef]
  26. Liu, H.; Krishna, V.; Lun Leung, J.; Reindl, T.; Zhao, L. Field Experience and Performance Analysis of Floating PV Technologies in the Tropics. Prog. Photovolt. Res. Appl. 2018, 26, 957–967. [Google Scholar] [CrossRef]
  27. El Hammoumi, A.; Chalh, A.; Allouhi, A.; Motahhir, S.; El Ghzizal, A.; Derouich, A. Design and Construction of a Test Bench to Investigate the Potential of Floating PV Systems. J. Clean. Prod. 2021, 278, 123917. [Google Scholar] [CrossRef]
  28. Pimentel Da Silva, G.D.; Branco, D.A.C. Is Floating Photovoltaic Better than Conventional Photovoltaic? Assessing Environmental Impacts. Impact Assess. Proj. Apprais. 2018, 36, 390–400. [Google Scholar] [CrossRef]
  29. Haas, J.; Khalighi, J.; De La Fuente, A.; Gerbersdorf, S.U.; Nowak, W.; Chen, P.-J. Floating Photovoltaic Plants: Ecological Impacts versus Hydropower Operation Flexibility. Energy Convers. Manag. 2020, 206, 112414. [Google Scholar] [CrossRef]
  30. Elshafei, M.; Ibrahim, A.; Helmy, A.; Abdallah, M.; Eldeib, A.; Badawy, M.; AbdelRazek, S. Study of Massive Floating Solar Panels over Lake Nasser. J. Energy 2021, 2021, 6674091. [Google Scholar] [CrossRef]
  31. Nhiavue, Y.; Lee, H.S.; Chisale, S.W.; Cabrera, J.S. Prioritization of Renewable Energy for Sustainable Electricity Generation and an Assessment of Floating Photovoltaic Potential in Lao PDR. Energies 2022, 15, 8243. [Google Scholar] [CrossRef]
  32. López, M.; Soto, F.; Hernández, Z.A. Assessment of the Potential of Floating Solar Photovoltaic Panels in Bodies of Water in Mainland Spain. J. Clean. Prod. 2022, 340, 130752. [Google Scholar] [CrossRef]
  33. Mamatha, G.; Kulkarni, P.S. Assessment of Floating Solar Photovoltaic Potential in India’s Existing Hydropower Reservoirs. Energy Sustain. Dev. 2022, 69, 64–76. [Google Scholar] [CrossRef]
  34. Agrawal, K.K.; Jha, S.K.; Mittal, R.K.; Vashishtha, S. Assessment of Floating Solar PV (FSPV) Potential and Water Conservation: Case Study on Rajghat Dam in Uttar Pradesh, India. Energy Sustain. Dev. 2022, 66, 287–295. [Google Scholar] [CrossRef]
  35. Kakoulaki, G.; Sanchez, R.G.; Amillo, A.G.; Szabo, S.; de Felice, M.; Farinosi, F.; de Felice, L.; Bisselink, B.; Seliger, R.; Kougias, I. Benefits of Pairing Floating Solar Photovoltaics with Hydropower Reservoirs in Europe. Renew. Sustain. Energy Rev. 2023, 171, 112989. [Google Scholar] [CrossRef]
  36. Popa, B.; Vuta, L.I.; Dumitran, G.E.; Picioroaga, I.; Calin-Arhip, M.; Porumb, R.-F. FPV for Sustainable Electricity Generation in a Large European City. Sustainability 2021, 14, 349. [Google Scholar] [CrossRef]
  37. Hersbach, H. The ERA5 Atmospheric Reanalysis; American Geophysical Union: Washington, DC, USA, 2016; p. NG33D-01. [Google Scholar]
  38. Hersbach, H.; Bell, B.; Berrisford, P.; Hirahara, S.; Horányi, A.; Muñoz-Sabater, J.; Nicolas, J.; Peubey, C.; Radu, R.; Schepers, D. The ERA5 Global Reanalysis. Q. J. R. Meteorol. Soc. 2020, 146, 1999–2049. [Google Scholar] [CrossRef]
  39. Savazzi, A.C.M.; Nuijens, L.; Sandu, I.; George, G.; Bechtold, P. The Representation of Winds in the Lower Troposphere in ECMWF Forecasts and Reanalyses during the EUREC4A Field Campaign. Atmos. Chem. Phys. Discuss. 2022, 22, 1–29. [Google Scholar]
  40. Jiang, H.; Yang, Y.; Bai, Y.; Wang, H. Evaluation of the Total, Direct, and Diffuse Solar Radiations from the ERA5 Reanalysis Data in China. IEEE Geosci. Remote Sens. Lett. 2019, 17, 47–51. [Google Scholar] [CrossRef]
  41. Gleixner, S.; Demissie, T.; Diro, G.T. Did ERA5 Improve Temperature and Precipitation Reanalysis over East Africa? Atmosphere 2020, 11, 996. [Google Scholar] [CrossRef]
  42. Hogan, R. Radiation Quantities in the ECMWF Model and MARS; ECMWF: Reading, UK, 2015. [Google Scholar]
  43. Jiang, H.; Yang, Y.; Wang, H.; Bai, Y.; Bai, Y. Surface Diffuse Solar Radiation Determined by Reanalysis and Satellite over East Asia: Evaluation and Comparison. Remote Sens. 2020, 12, 1387. [Google Scholar] [CrossRef]
  44. Stein, J.S.; Hansen, C.W.; Reno, M.J. Global Horizontal Irradiance Clear Sky Models: Implementation and Analysis; Sandia National Laboratories (SNL): Albuquerque, NM, USA; Livermore, CA, USA, 2012. [Google Scholar]
  45. Yang, D.; Sharma, V.; Ye, Z.; Lim, L.I.; Zhao, L.; Aryaputera, A.W. Forecasting of Global Horizontal Irradiance by Exponential Smoothing, Using Decompositions. Energy 2015, 81, 111–119. [Google Scholar] [CrossRef] [Green Version]
  46. Fatemi, S.A.; Kuh, A. Solar Radiation Forecasting Using Zenith Angle. In Proceedings of the 2013 IEEE Global Conference on Signal and Information Processing, Austin, TX, USA, 3–5 December 2013; IEEE: Piscataway, NJ, USA, 2013; pp. 523–526. [Google Scholar]
  47. Deceased, J.A.D.; Beckman, W.A. Solar Engineering of Thermal Processes; Wiley: Hoboken, NJ, USA, 1982; Volume 3, ISBN 9780470873663. [Google Scholar]
  48. Duffie, J.A.; Beckman, W.A.; Blair, N. Solar Engineering of Thermal Processes, Photovoltaics and Wind; John Wiley & Sons: Hoboken, NJ, USA, 2020; ISBN 11195-40283. [Google Scholar]
  49. Sproul, A.B. Derivation of the Solar Geometric Relationships Using Vector Analysis. Renew. Energy 2007, 32, 1187–1205. [Google Scholar] [CrossRef]
  50. ASHRAE Handbook of Fundamentals; ASHRAE Inc.: Atlanta, GA, USA, 2009; ISBN 6785392187.
  51. Liu, B.Y.H.; Jordan, R.C. Daily Insolation on Surfaces Tilted towards the Equator. Trans. ASHRAE 1962, 67, 526–541. [Google Scholar]
  52. Islam, M.A.; Alam, M.S.; Sharker, K.K.; Nandi, S.K. Estimation of Solar Radiation on Horizontal and Tilted Surface over Bangladesh. Comput. Water Energy Environ. Eng. 2016, 5, 54–69. [Google Scholar] [CrossRef] [Green Version]
  53. Bakirci, K. General Models for Optimum Tilt Angles of Solar Panels: Turkey Case Study. Renew. Sustain. Energy Rev. 2012, 16, 6149–6159. [Google Scholar] [CrossRef]
  54. Berisha, X.; Zeqiri, A.; Meha, D. Solar Radiation–The Estimation of the Optimum Tilt Angles for South-Facing Surfaces in Pristina. Preprints 2017, 2017080010. [Google Scholar] [CrossRef]
  55. Muneer, T. Solar Radiation and Daylight Models; Routledge: Boca Raton, FL, USA, 2007; ISBN 00804-74411. [Google Scholar]
  56. Mierzwiak, M.; Kroszczyński, K.; Araszkiewicz, A. On Solar Radiation Prediction for the East–Central European Region. Energies 2022, 15, 3153. [Google Scholar] [CrossRef]
  57. Jiao, B.; Li, Q.; Sun, W.; Martin, W. Uncertainties in the Global and Continental Surface Solar Radiation Variations: Inter-Comparison of in-Situ Observations, Reanalyses, and Model Simulations. Clim. Dyn. 2022, 59, 2499–2516. [Google Scholar] [CrossRef]
  58. Trolliet, M.; Walawender, J.P.; Bourlès, B.; Boilley, A.; Trentmann, J.; Blanc, P.; Lefèvre, M.; Wald, L. Downwelling Surface Solar Irradiance in the Tropical Atlantic Ocean: A Comparison of Re-Analyses and Satellite-Derived Data Sets to PIRATA Measurements. Ocean. Sci. 2018, 14, 1021–1056. [Google Scholar] [CrossRef] [Green Version]
  59. Tahir, Z.R.; Azhar, M.; Mumtaz, M.; Asim, M.; Moeenuddin, G.; Sharif, H.; Hassan, S. Evaluation of the Reanalysis Surface Solar Radiation from NCEP, ECMWF, NASA, and JMA Using Surface Observations for Balochistan, Pakistan. J. Renew. Sustain. Energy 2020, 12, 23703. [Google Scholar] [CrossRef]
  60. Galanaki, E.; Emmanouil, G.; Lagouvardos, K.; Kotroni, V. Long-Term Patterns and Trends of Shortwave Global Irradiance over the Euro-Mediterranean Region. Atmosphere 2021, 12, 1431. [Google Scholar] [CrossRef]
  61. Aktağ, A.; Yilmaz, E. A Suitable Model to Estimate Global Solar Radiation in Black Sea Shoreline Countries. Energy Sources Part A Recovery Util. Environ. Eff. 2012, 34, 1628–1636. [Google Scholar] [CrossRef]
  62. Elminshawy, N.A.S.; El-Damhogi, D.G.; Ibrahim, I.A.; Elminshawy, A.; Osama, A. Assessment of Floating Photovoltaic Productivity with Fins-Assisted Passive Cooling. Appl. Energy 2022, 325, 119810. [Google Scholar] [CrossRef]
  63. Dörenkämper, M.; Wahed, A.; Kumar, A.; de Jong, M.; Kroon, J.; Reindl, T. The Cooling Effect of Floating PV in Two Different Climate Zones: A Comparison of Field Test Data from the Netherlands and Singapore. Sol. Energy 2021, 219, 15–23. [Google Scholar] [CrossRef]
  64. Kjeldstad, T.; Lindholm, D.; Marstein, E.; Selj, J. Cooling of Floating Photovoltaics and the Importance of Water Temperature. Sol. Energy 2021, 218, 544–551. [Google Scholar] [CrossRef]
  65. Abdelal, Q. Floating PV; an Assessment of Water Quality and Evaporation Reduction in Semi-Arid Regions. Int. J. Low-Carbon Technol. 2021, 16, 732–739. [Google Scholar] [CrossRef]
  66. Diaconita, A.I.; Rusu, L.; Andrei, G. A Local Perspective on Wind Energy Potential in Six Reference Sites on the Western Coast of the Black Sea Considering Five Different Types of Wind Turbines. Inventions 2021, 6, 44. [Google Scholar] [CrossRef]
  67. Diaconita, A.; Andrei, G.; Rusu, L. New Insights into the Wind Energy Potential of the West Black Sea Area Based on the North Sea Wind Farms Model. Energy Rep. 2021, 7, 112–118. [Google Scholar] [CrossRef]
Figure 1. Map of the western side of the Black Sea and the location of the four sites considered.
Jmse 11 00203 g001
Figure 2. The curve of GHI, DHI, and DNI. The square symbol is for Lake Razim; the circle symbol is for Lake Golovita; the triangle symbol is for Lake SInoe; and the diamond symbol is for the Black Sea.
Jmse 11 00203 g002
Figure 3. Monthly average GHI of solar irradiance ( W / m 2 ).
Jmse 11 00203 g003
Figure 4. Solar radiation (in W / m 2 ) for each season and daily hour. The square symbol is for Lake Razim; the circle symbol is for Lake Golovita; the triangle symbol is for Lake SInoe; and the diamond symbol is for the Black Sea.
Jmse 11 00203 g004
Figure 5. The annual variation in tilt angle.
Jmse 11 00203 g005
Figure 6. The annual variation in declination angle.
Jmse 11 00203 g006
Figure 7. The annual energy production of the PV of 540 W and the capacity factor for the four locations.
Jmse 11 00203 g007
Figure 8. Temperature-dependent PV module current output.
Jmse 11 00203 g008
Figure 9. Map with the lakes of eastern Romania and the western Black Sea. The left side shows the air temperature and the right side shows the water temperature.
Jmse 11 00203 g009
Figure 10. Average monthly temperature variations.
Jmse 11 00203 g010
Figure 11. GHI for four locations in Romania from high-potential areas.
Jmse 11 00203 g011
Figure 12. Four FPV farms annual energy output and their usage within the study’s chosen locations: (a) Germany; (b) the United Kingdom; (c) China; and (d) India.
Jmse 11 00203 g012
Table 1. The location of the four chosen sites.
Sites
P1P2P3P4
LocationLake RazimLake GolovitaLake SinoeBlack Sea
Latitude (°)44°57′07.03″ N44°43′17.40″ N44°28′00.95″ N44°20′35.93″ N
Longitude (°)28°51′37.11″ E28°47′32.28″ E28°45′23.41″ E28°41′39.11″ E
Table 2. Monthly optimum fixed tilt angles.
SitesJanuaryFebruaryMarchAprilMayJune
P165.858.347.335.526.121.9
P265.658.047.135.225.921.6
P365.357.846.935.025.721.4
P465.257.746.734.925.521.3
JulyAugustSeptemberOctoberNovemberDecember
P123.931.743.054.864.068.0
P223.631.442.754.663.867.8
P323.431.242.554.363.567.6
P423.231.042.354.263.467.4
Table 3. PV catalog specifications.
Characteristics
Power540 W
TypeMonocrystalline
Area 2.584   m 2
Number of cells144
Open Cct voltage49.55 V
Short Cct current13.89 A
Voltage, max power41.62 V
Current, max power12.98 A
Table 4. The location of the four chosen sites.
Sites
GermanyUnited KingdomChinaIndia
LocationSalzwedelQueen Elizabeth II ReservoirHuainanTelangana
Capacity729 kW6.3 MW40 MW100 MW
Area 6800   m 2 57 , 000   m 2 800 , 000   m 2 2 , 023 , 430   m 2
Disclaimer/Publisher’s Note: The statements, opinions and data contained in all publications are solely those of the individual author(s) and contributor(s) and not of MDPI and/or the editor(s). MDPI and/or the editor(s) disclaim responsibility for any injury to people or property resulting from any ideas, methods, instructions or products referred to in the content.

