Article

Submarine Small-Scale Features of Cyclic Steps in the Penghu Canyon: Implications for the Migration of Canyon

1
Frontiers Science Center for Deep Ocean Multispheres and Earth System, Key Lab of Submarine Geosciences and Prospecting, MOE and College of Marine Geosciences, Ocean University of China, Qingdao 266100, China
2
Laboratory for Marine Mineral Resources, Pilot National Laboratory for Marine Science and Technology (Qingdao), Qingdao 266237, China
3
Shandong Provincial Key Laboratory of Marine Environment and Geological Engineering (MEGE), Ocean University of China, Qingdao 266100, China
4
Laboratory for Marine Geology, Pilot National Laboratory for Marine Science and Technology (Qingdao), Qingdao 266100, China
*
Author to whom correspondence should be addressed.
J. Mar. Sci. Eng. 2022, 10(9), 1301; https://doi.org/10.3390/jmse10091301
Submission received: 10 August 2022 / Revised: 9 September 2022 / Accepted: 14 September 2022 / Published: 15 September 2022
(This article belongs to the Section Geological Oceanography)

Abstract

:
The submarine canyons are an important clue to study the evolution process of seafloor geomorphology and they generally indicate the significant linear grooves on the seafloor related to seafloor geodynamic erosion during the evolution of geomorphology. The submarine canyons or canyon groups are not only the channels for the sediment transport from shallow sediments with land-based sources to the deep sea in the sediment source-sink system, but also a key temporary sediment deposition area to study sediment transport patterns and the evolution of submarine geomorphology. In this paper, we processed and analyzed the multibeam bathymetry data acquired in the South China Sea continental margin by the research vessel “Dongfanghong 3” in 2020. Based on fine submarine geomorphological features identified from multibeam bathymetry data, we construct the formation pattern of the cyclic steps. The six cyclic steps (wavelengths of 1–6 km and wave heights of 19–81 m) are found in the lower section of the Penghu canyon and they appeared at the conjunction part of the Penghu and the Taiwan canyon. Based on location and the wavelength variations of the cyclic steps, we propose that the cyclic steps are formed by turbidity current flow along the Penghu and the Taiwan canyons. The axis of the cyclic step CS4–CS6 is shifted westward by about 5° compared to the axis of the cyclic step CS1–CS3. The inconsistency in the axis direction of the cyclic steps CS1–CS3 and CS4–CS6 suggests that is where the migration of the Penghu canyon occurred.

1. Introduction

Submarine canyons commonly grow at the submarine slope break area in the middle of the continental slope and are significant negative submarine topographic features marked as narrow depressions. They are important conduits for the transport of debris materials from land to deep sea [1,2,3]. Cyclic steps are developed within the submarine canyon system [1,4,5,6,7,8,9]. In addition, water masses, sediments, nutrients, and even marine trash and pollutants were transported from the coast region to deep water areas through submarine canyons [10]. With the frame of the regional source-sink system, submarine canyons are considered to be an important geomorphic-dynamic component, as major channels for sediment transport and a temporary depositional zone [11]. Different types of gravity flow, such as debris current, and turbidity current occur in the submarine canyon system and they cause the structure variations of the canyon system by erosion and deposition [12,13,14]. In previous studies, several submarine canyon groups were identified in the South China Sea continental margin by the multi-beam bathymetry investigation, such as the Taixinan submarine canyon group [9,15,16] and the Shenhu canyon group [17,18].
Turbidity currents [2,3], and numerous currents develop in the Luzon Strait, including internal solitary waves [19,20] and Pacific deep-water intrusion [21,22,23,24] propagated westward to the northern basin of the South China Sea (Figure 1). These gravity currents can lead to form complex canyon system structures and induce different submarine geomorphologies. Cyclic steps are an obvious submarine geomorphology and are laminar formations with a stepped, columnar, long-wave shape and upstream slope on the seafloor [9,25] or a gully in the transition area between the lee and stoss sides [26]. The presence of crescent-shaped cyclic steps has been found in global canyon areas, such as the Monterey, the Santa Monica, the Mugu, the Redondo, the Carmel, the La Jolla, the Penghu, and the Taiwan canyons from the multibeam bathymetry data [1,5,6,7,9].
Cyclic steps are usually classified as net-erosional or net-depositional depending on the bed forms controlled by the erosion or deposition [9,15,27,28]. The net-depositional cyclic steps are further classified as symmetrical, asymmetrical and inverse asymmetrical [28,29,30]. The formation of cyclic steps explained by tidal [1], slip collapse [8] or turbidity currents [8,9]. Some authors believe that the cyclic steps in the Taiwan canyon and the West Penghu canyon are divided into net-erosional cyclic steps and net-depositional cyclic steps [9], but others believe that the cyclic steps in both Taiwan canyon and West Penghu canyon are net-erosional cyclic steps [15]. Sediment waves in the South China Sea are mainly distributed on the canyon levees [2,31], or downstream of the canyon mouth [31]. However, there is still debate about the origin of sediment waves. Some authors argue that sediment waves are formed mainly by deep-water intrusion from the western Pacific Ocean through the Luzon Strait [2], but others insist that sediment waves are formed by turbidity currents flowing through the canyon [31,32]. Dynamic canyons, buried channels and thalweg deposits were found in stratigraphy of the canyon group by using seismic data, revealing a stacking pattern of unidirectional migration of the canyon group [3,17,33]. The canyon migration is an important landmark for studying the oceanic circulation as well as paleoclimatic changes [33,34]. Although most of the cyclic steps were studied on the formation mechanisms and transport patterns, how crescentic cyclic steps affect the migration of canyons is still enigmatic.
In the South China Sea, new cyclic steps have been discovered. This discovery can complement the bedform systems in the South China Sea, and also provides a research object to reveal the influence of the cyclic steps on canyon migration. In this paper, we present a detailed study of cyclic steps within the canyon systems by using multibeam bathymetry data collected in 2020. The geometry and fine structure of cyclic steps are identified. We analyze the shaping influence of cyclic steps on canyon formation and migration. In general, the detailed study of cyclic steps can allow us to better understand the migration and evolution mechanism of submarine canyon. The discovery of the cyclic steps may provide a possible explanation for the migration of canyons and the formation of deep-water canyons. It also may reveal the marine sediment transport patterns and the changes of ocean currents.

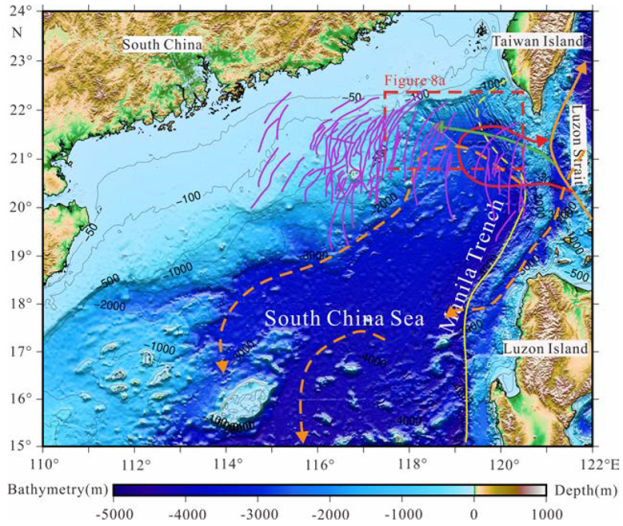
2. Geological Setting

The South China Sea is the largest marginal sea in the western Pacific Ocean. It is located at the convergent region of the Pacific plate, the Eurasian plate and the India–Australia plate [35,36,37]. On the west side of Luzon Strait, the South China Sea lithosphere is subducting beneath the Philippine Sea plate with a subducting rate of about 70 mm/year [3,38]. During the Late Cretaceous period, the tectonic stress on the continental margin of South China changed from extrusion to tension. Tectonic subsidence and seafloor spreading in the northern South China Sea occurred during the Cenozoic period [31,35,39,40,41]. Deep-tow magnetic surveys show that the spreading of the South China Sea basin began at 32 Ma and continued until 15 Ma [42]. The South China Sea underwent a rifting period from the Late Eocene to the Early Oligocene. After the Miocene, the South China Sea was in a relatively quiet subsidence period [43]. A wide rift zone located at the northern South China Sea margin was explained from the seismic reflection data [44]. The deep-water current enters the South China Sea through the Luzon Strait and turns northwestward, then turns southwestward along the continental margin in southeastern China to become the South China Sea contour current [1,23]. Field oceanographical observations in the Luzon Strait indicate that deep Pacific water first flows into the Luzon Strait through the Bashi Channel and Taltung canyon, then turns southward along the Luzon Trough, and finally enters the South China Sea through the Hengchun Ridge [20,21,22,23].
The Taixinan canyon groups include the Dongsha, the Taiwan, the Western Penghu, the Penghu and the Gaoping canyon [9,15,16]. The Penghu canyon is located on the northeastern side of the Central and Western Penghu canyon. It is bounded to the east by the Taiwan orogenic belt. The Penghu canyon extends longitudinally downward to intersect with the Taiwan canyon and to the south it merges into the northern Manila Trench (Figure 2). The complex tectonic deformation of the Taiwan accretionary wedge is located in the Penghu canyon area and the large supply of sediment transports in the canyon area [45]. Internal solitary waves and Pacific deep-water intrusion develop and propagate westward to the northern continental slope of the South China Sea through the Luzon Strait [21,22,23,24]. Submarine sampling by piston cores and drilling supported the existence of simultaneous debris flow and turbidity current deposition in the Penghu canyon [31,40].

3. Data and Methods

The multibeam bathymetry data were collected in 2020 by the research vessel “Dongfanghong 3” in the South China Sea. Multibeam bathymetry data were acquired by using the 12 kHz EM122 multibeam survey system and track-line bathymetry data have been processed [18]. The EM122 multibeam survey system onboard has a beamwidth of 0.5° × 1°. The maximum strip width is six times the water depth (maximum ~30 km). The main operating frequency is 12 kHz in the working water depth range and sounding accuracy reaches the 3‰ of water depth.
The multibeam bathymetry data were processed using the multibeam post-processing software CARIS HIPS and SIPS 9.1. The main process steps include navigation data editing, attitude data editing, tidal correction, sound velocity correction, calculation of propagation error, surface filtering, strip filtering and data interpolation [18]. We used one sound velocity-depth profile and water temperature (salinity) profile obtained from the sea surface to 4500 m at a CTD site to do sound velocity correction and the detailed introduction was provided in the previous cruise [18]. The grid spacing of the processed bathymetry data is 20 m. The processed data were mapped using the programs grdgradient, grdimage, and grdview in the General Mapping Tool (GMT) [46] to create two-dimensional and three-dimensional topographic maps of the study area. The slopes of canyon terrain are calculated and plotted by using the Slope module in ArcMap software.

4. Geometric Features of Submarine Geomorphology

Based on the processed multibeam bathymetry data, the Penghu submarine canyon, cyclic steps and sediment waves are identified from the data (Figure 3). The refined geometric morphological features inside the canyon are used to study the formation and migration of the canyons on the continental slope of the South China Sea.

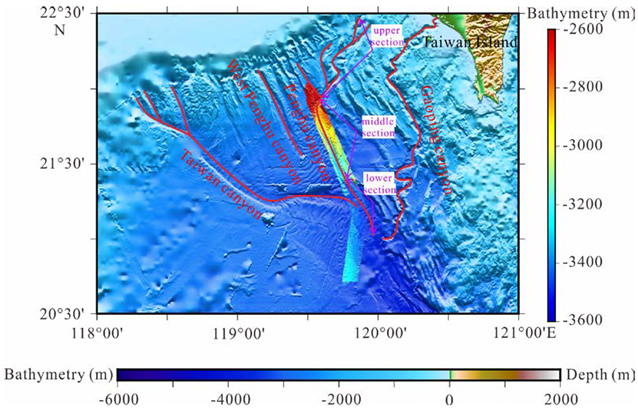
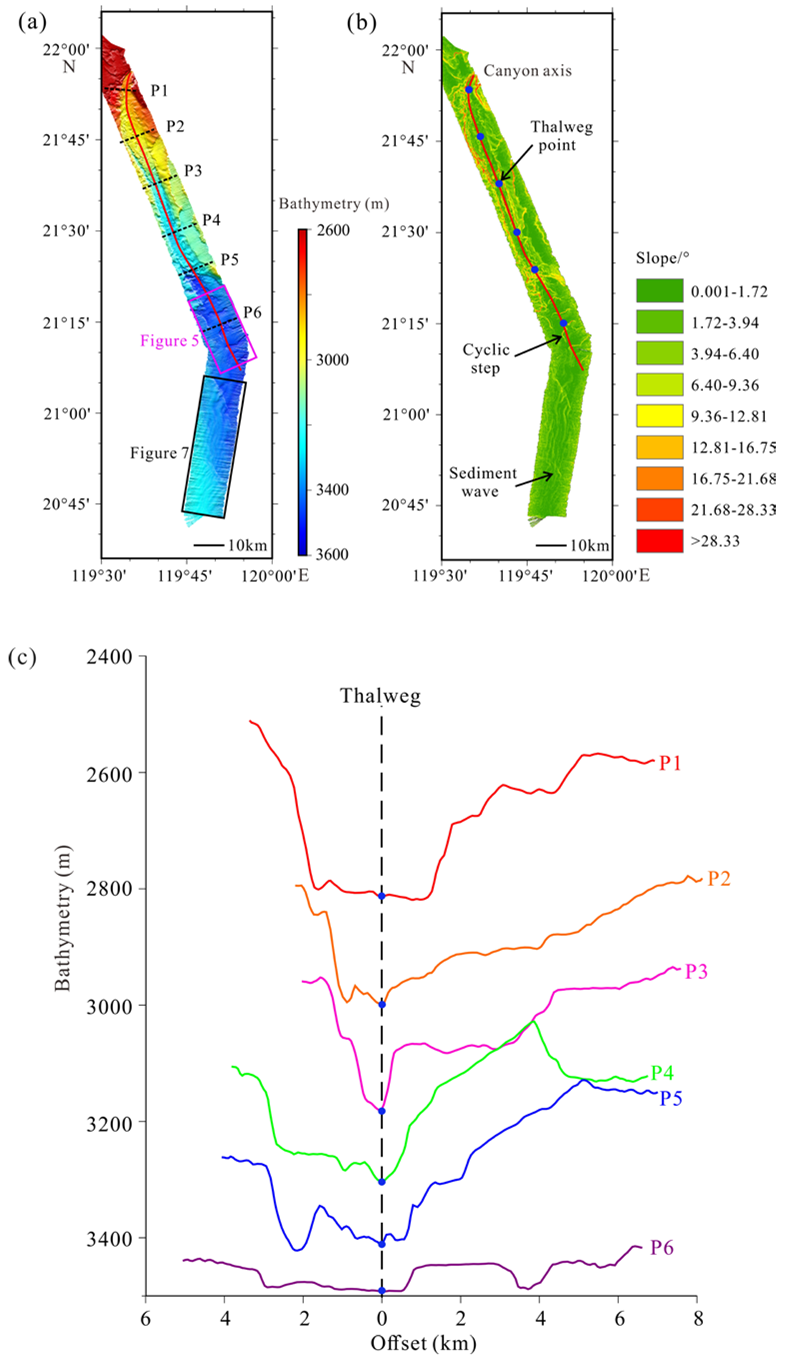
4.1. Geomorphic Features of the Penghu Canyon

Analysis and interpretation of multibeam bathymetry data indicate that the water depth range of Penghu canyon is between 2400 and 3600 m. The linear Penghu canyon is divided into the upper, middle and lower sections according to the water depth and the shape of the canyon profile (Figure 2). The upper section of the Penghu canyon contains three major branch channels (Figure 2). Cyclic steps and sediment waves are found in the lower section of the canyon (Figure 3).
The slope of the upper section of the Penghu canyon varies from 21.68–28.33° (Figure 4b). In the middle section of the canyon, the profile shape shows the “U” type (Figure 4a–c, profiles 1–4), with a width of 2–4 km. The depth of undercutting is about 200–300 m. The thalweg point deepens from 2800 to 3200 m (Figure 4c). The profile shape of the lower section of the canyon is mainly a symmetrical “U” type (Figure 4a,c, profiles 5–6), with slopes ranging from 3.94–6.40°. A higher slope of 6.40–12.81° at the crescent bedforms area is more than the surrounding area (Figure 4b). The width of the canyon gradually increases and the depth of undercutting gradually becomes smaller, and the depth of the thalweg point deepens from 3200 to 3500 m (Figure 4c). The shape of the Penghu canyon changes from “V” to “U” type along the NS direction. From the upper section to the lower section of the Penghu canyon, the canyon gradually becomes wider and the slope of the canyon gradually decreases (Figure 4).

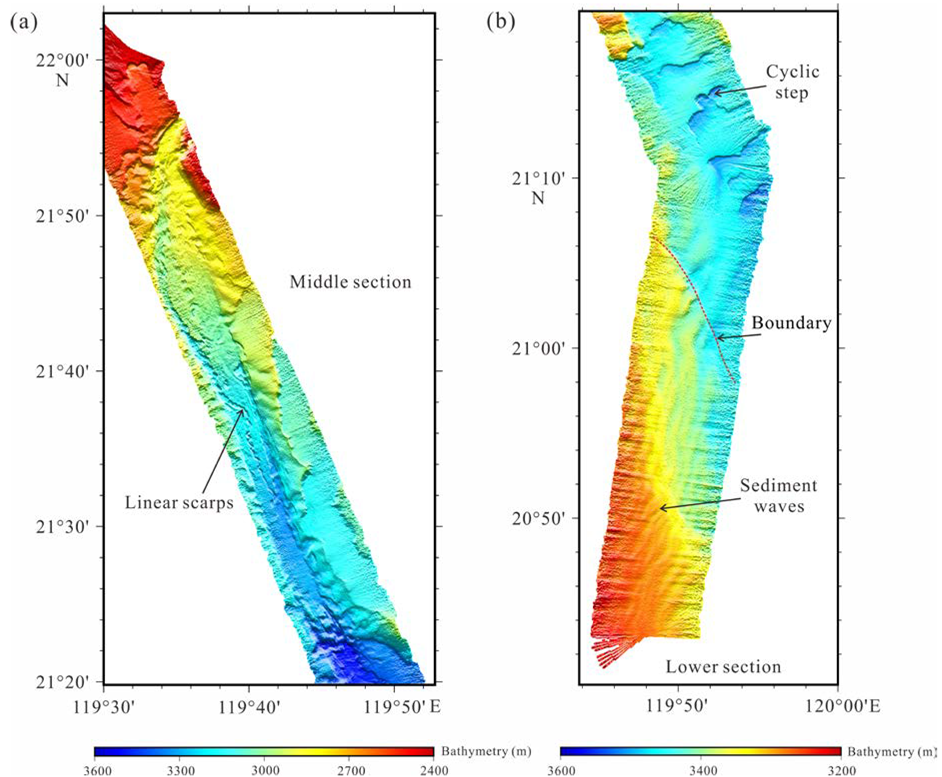
4.2. Cyclic Steps and Sediment Wave in the Penghu Canyon

Six cyclic steps were identified in the lower section of the Penghu canyon through the analysis of multibeam bathymetry data, named CS1–CS6 herein (Figure 5 and Figure 6). The six cyclic steps at the lower section of the canyon are arranged in trains and indicate a crescent shape. The CS1–CS6 show a closed curve in the contour map (Figure 6a). Although the shape of the CS3 as a whole is irregular, it can be seen as three small crescent-shaped cyclic steps (Figure 5). The CS1–CS6 with upstream-migrating are all tilted toward the NW direction (Figure 5). The wavelength, wave height, lee side length, stoss side length, lee side slope, stoss side slope, slope, aspect ratio, asymmetry ratio, and area of the CS1–CS6 are measured and calculated in Table 1. The depth ranges of cyclic steps are ~3425–3525 m. The wavelengths of the CS1–CS6 are about 1–6 km and the wave heights are about 19–81 m. The slopes of both the lee side and stoss side of the CS1–CS6 are small (0.01–0.15°) and the overall slope of the lee side is smaller than that of the stoss side (Figure 6b). The slope of the CS1–CS6 is steeper than the surrounding strata, with a slope difference of 5–10° (Figure 4b).
Sediment waves occur in the southern Taiwan canyon, adjacent to the CS1–CS6 in the lower section of the Penghu canyon (Figure 3 and Figure 4a). The sediment waves in the study area are aligned from SE to NW, and the sediment wave area spreads about 330 km2 with water depths from 3250 to 3400 (Figure 7). Sediment waves in the latitudinal profile show no obvious symmetry. There is a clear boundary (Q1–Q3) between sediment waves and the CS1–CS6 based on the water depth variation (Figure 7). Sediment waves in the longitudinal profiles show wavelengths of 1–3 km, wave heights of 10–30 m and slopes from 1.72° to 6.40° (Figure 4b).

5. Results and Discussion

5.1. Formation Pattern of Cyclic Steps

Four sediment wave fields have been identified in the northeastern South China Sea, the western Dongsha canyon (WDSW), the western Taiwan canyon (WTSW), the southern Taiwan canyon (STSW), and the western Penghu canyon (WPSW) sediment wave fields [9,15,16,31]. Sediment waves and cyclic steps with large wavelength, columnar arrangement, typical crescent shape, well symmetry and closed curve in contours were found in the lower section of the Penghu canyon (Figure 5 and Figure 6). Due to the lack of reflection seismic data, it is impossible to determine whether there is backset bedding and the reflection truncations observed on the lee flanks of the CS1–CS6 in the Penghu canyon. However, the CS1–CS6 show an inverse step shape from the multibeam bathymetric, profiles and contour maps (Figure 5 and Figure 6). As the axis of the CS1–CS6 is opposite to the canyon extension direction (Figure 6), the cyclic steps indicate the upstream-migrating. Based on the columnar arrangement, upstream-migrating and the crescent shape of the CS1–CS6, they are explained as net-erosional cyclic steps, the same as the previous cyclic steps [9,15]. The various parameters of the cyclic steps in this area are measured and calculated in Table 1.
The bathymetry variation along the boundary (Q1–Q3) suggests that the formation of sediment waves is not only controlled by turbidity currents in the Taiwan canyon, but also influenced by other factors. Sediment waves in the southern Taiwan canyon was controlled by the WSW bottom (contour) currents caused by the intrusion of deep water from the North Pacific into the South China Sea [2]. Sufficient sediment transported in the Luzon Trough by turbidity currents due to the Taiwan orogeny [47]. This may have led to the development of cyclic step and sediment wave in Quaternary [47]. The sediment waves and cyclic steps in the northern South China Sea are the best preserved and most abundant in the Late Quaternary stratigraphy [31,48]. It supports the existence of strong turbidity activity in the northern South China Sea during this period [9,15,31]. The development of sediment waves is controlled by Taiwan orogenic movements [49,50]. At about 1.2 Ma, the Taiwan orogenic movement moved to the south and the sediment waves began to form [50]. Therefore, we suggest that the CS1–CS6 are likely formed after 1.2 Ma. The water depth on both sides of the boundary line (Q1–Q3) vary greatly and the profile structure is different, and the waveforms on both sides of the boundary line are similar (Figure 6 and Figure 7). The formation time of the CS1–CS6 and sediment waves may be different. The accurate age of the CS1–CS6 and sediment waves require the detailed seismic reflection profiles or piston cores in these areas.
The Penghu canyon connects the Taiwan canyon, the West Penghu canyon, and the Gaoping canyon, and it plays a key role of transporting sedimentary detritus southward to deep-water environment. Most of sedimentary debris originates from the numerous gullies and canyons developed on the Gaoping slope in southwestern Taiwan [48]. The location of CS1–CS6 is at the intersection between the Penghu and Taiwan canyons. The sediment source is the denuded material from the gullies and canyons developed on the Gaoping slope and the sediment material transported from the Taiwan canyon [2,3]. The sufficient sediment source is also conducive to the development of cyclic steps. The CS1–CS6 are developed in the location of the sedimentary fan in the lower section of the Penghu canyon, arranged in trains, and the terrain around the development of cyclic steps is flat with a similar slope. It is impossible to form a landslide without large undulation, to form a crescent-shaped landslide. Piston core sampling showed a high sand content in the study area, with decreasing grain size from top to bottom and low CaCO3 content. These are not consistent with the characteristics of contour current deposition [2,48]. The identified cyclic steps have large size wavelengths and wave heights, typical of upstream-migrating (Figure 5 and Figure 6), and no significant thicker sedimentary layers [48,51]. These indicate that internal waves and tides do not play a major role in the development and formation of cyclic steps. However, the northern South China Sea is influenced by the North Pacific deep-water intrusion through the Luzon Strait [52,53]. The current velocity of the intrusion current is only 3–7 cm/s [2,54,55] and it is smaller than the turbidity current velocity with 10 m/s observed and calculated in the Taiwan canyon and Penghu canyon [2,9]. Therefore, the North Pacific deep-water intrusion is not a major factor for the formation of cyclic steps. Based on the morphological characteristics of the CS1–CS6, we propose that cyclic steps are controlled by the supercritical turbidity current flowing along the canyon.
The CS1–CS6 in the Penghu canyon indicate an upstream-migrating feature on the whole and they are formed by the erosion of the canyon wall by turbidity currents. Flume experiments and numerical simulations indicate that turbidity currents with higher sediment concentrations and coarser sediment grain sizes in the head of a higher gradient canyon generate shorter wavelengths and a greater number of cyclic steps [30]. There is no significant difference in slope at the development of the CS1–CS6 in the Penghu canyon, so the effect of slope on turbidity currents is weak. The flow velocity of turbidity currents is related to the lateral confinement of the canyon, loss of lateral confinement of the canyon leads to flow relaxation and a subsequent decrease in flow velocity [56,57]. In a study of the bedform within the West Penghu and the Taiwan canyons, it was found that higher flow velocities and higher flow discharges of turbidity currents create cyclic steps of larger wave heights and shorter wavelengths [15]. The cyclic steps in the Monterey Bay canyon [1,8], the West Penghu canyon [9], and the Taiwan canyon [15] conform to the rule that the higher the turbidity current velocity, the shorter the wavelength [30]. However, the CS1–CS6 in the Penghu canyon are only located at the lower section of the canyon and the wavelength of the CS1–CS6 (Table 1) is not consistent with the rule that the wavelength of the cyclic step can be longer, as the turbidity current velocity decreases with the distance from the upper section of the canyon. The axis direction of the CS1–CS6 can be significantly shifted. The formation of the CS1–CS6 is not only controlled by the turbidity current of the Penghu canyon but also influenced by other external forces. In the study of the Monterey canyon cyclic steps, it was proposed that the formation of the crescent-shaped cyclic step may be related to turbidity currents flowing through the canyon and may also be caused by the slip collapse of sedimentary layers within the canyon [8]. Based on the analysis of the formation of cyclic steps, ocean currents and bottom currents are not the main factors. The development of the CS1–CS6 in Penghu canyon has a low slope and it is not possible to be formed by slip collapse of sedimentary layers. The axis of the CS1–CS6 moves to the southwest and implies that there is also an external force moving westward during the formation of the cyclic step. The turbidity currents from the Taiwan canyon and the Penghu canyon converge at the CS1–CS6 and the turbidity currents from the Taiwan canyon flows from SW to NE direction. A new developmental model is proposed for the CS1–CS6 in the Penghu canyon (Figure 8). The turbidity current flows out of the canyon and loses the restriction of the walls on both sides of the canyon. The decreased flow velocity leads to a gradual increase in the wavelength of the CS1–CS3. The flow velocity becomes larger and it will result in a sudden wavelength shortening of CS4–CS6. The cyclic steps near the Penghu canyon (CS1–CS3) are influenced by the turbidity current from the Penghu canyon and forms a feature of the upper section of the anadromous canyon. In contrast, the cyclic steps (CS4–CS6) located at the junction of the Taiwan and Penghu canyons are subject to the turbidity current through two canyons at the same time. It causes the axis of the CS4–CS6 to be oriented differently from the axis of the CS1–CS3.
Cyclic steps have been found only in the Taiwan canyon, the West Penghu canyon and the Penghu canyon in the northern South China Sea. The Shenhu canyon group and the Taixinan canyon group have similar turbidity current environments [31,39,40,41]. However, different small-scale geomorphologies are formed in these canyon groups. We summarize and compare the similarities and differences among the Shenhu canyon, the Taiwan canyon, the West Penghu canyon and the Penghu canyon based on seismic profiles, multibeam bathymetry data and previous research results [2,16,26,31,32,58], and we make an attempt to explain the different small-scale geomorphological features at the similar turbidity current environment.
Comparing the similarities and differences among the canyons in the northern South China Sea (Table 2), the main differences between the Shenhu canyon and other canyons are the upper section slope, tectonics, and sediment type of the canyon. The slope of the upper section of the Shenhu canyon is smaller (1.96–2.88°) than other canyons (3–12°) (Table 2) and lacks material supply, which cannot form a good restriction on turbidity current. Therefore, it is difficult to form cyclic steps with low current velocity. In addition, the Shenhu canyon is located in the Baiyun Sag, where the tectonic movement is relatively gentle. The formation of the Penghu canyon was controlled by the collision between the Philippine Sea plate and the Eurasian plate [16]. Accumulated sediments are subject to gravitational effects to collapse in the upper section of the steeper canyon. The combination of sediment and currents can result in density differences that can create turbidity currents of a certain scale and velocity [59,60] to form cyclic steps. The sediment type of the Shenhu canyon is silt and clay [14]. The sediment particles are small in size, and the silt and clay have high cohesion, which can increase the strength to resist the erosion of the canyon bottom by consolidation in the face of turbidity current [1,30]. In contrast, the CS1–CS6 in the Penghu canyon are sandy, and sandy sediments are loose, so they cannot resist turbidity current erosion very well and are prone to form the CS1–CS6. The lack of cyclic steps in the Shenhu canyon is due to the interaction of several factors, including the gentle slope of the upper section of the canyon, the inability of the canyon to restrict turbidity currents, and the strong resistance of the sediments to erosion by turbidity currents. This is consistent with the numerical simulation experiments that its formation, migration pattern, and structure are mainly controlled by sediment grain size [1,61], sediment type [30,60], and slope [9,15,16].

5.2. Evolution and Migration of the Penghu Canyon

The Penghu canyon is considered to be a tectonically controlled type, where the tectonics control the location and orientation of the canyon [3,51,62]. The canyon is tectonically controlled to migrate westward, and sedimentary processes also play an important role [62]. The upper and middle sections of the Penghu canyon are close to the Taiwan accretionary wedge, and their migration direction is mainly controlled by the Taiwan orogeny. The lower section of the Penghu canyon is close to the Manila Trench and strongly influenced by the subduction of the South China Sea lithosphere along the Manila trench, topography and currents [3,38,48]. Multibeam bathymetric maps show that the depositional system changes at the conjunction part, the width of the Penghu canyon becomes wider at the conjunction part with the Taiwan canyon and the east-side canyon wall looks eroded (Figure 2, Figure 3 and Figure 4). In combination with the above, the cyclic steps have a tendency to migrate upward (Figure 5 and Figure 6), and in the process of migration upward will damage the west-side wall. The main cause of the erosion of the east-side wall is turbidity currents.
The occurrence of cyclic steps indicates that the canyon is active at present [8]. The axis direction of the CS1–CS3 is ~40–45° NW, and that of the CS4–CS6 is ~ 45–50° NW. The inconsistency of the axis direction of the CS1–CS3 and the CS4–CS6 cyclic steps implies that there was the westward migration of the Penghu canyon. A high sand content with decreasing grain size from the upper to the lower section of the Penghu canyon was shown from piston cores [48]. The widely developed internal solitary waves [63,64,65], internal tides [22,66], and deep-water intrusion in the North Pacific [52,53] in the Luzon Strait are persistent. The previous study indicates that deep-water current in the South China Sea can act at water depths below 2400 m, and the deep-water current will be shifted to the southeast or will first move westward and then turn and flow eastward [20,21,22,23]. The mixing and fragmentation of internal waves and internal tides, as well as the exchange of deep water between the North Pacific deep-water and the South China Sea, can have important effects on the re-transportation of deep-sea sediments and sediments from the erosional canyon materials during the upstream-migrating of the cyclic steps. These currents also provide hydrodynamic conditions for the westward migration of the Penghu canyon. In addition, sediment sources can also have an impact on the migration of the Penghu canyon [17,33]. The sediments of the Penghu canyon originate from Taiwan Island [3] or transports by the deep-water intrusion [22,23,45], coupled with a high western and low eastern topography [36]. The sediments in the western South China Sea will also migrate eastward under the scouring of currents. Therefore, we assume that the appearance of the CS1–CS6 implies a trend of westward migration in the lower section of the Penghu canyon. However, if the southern Taiwan canyon sediment wave field (STSW) grows up further eastward, it will lead to erosion of the eastern wall of the Penghu canyon and the Penghu canyon may migrate to the eastward. Further work needs to be supported by a larger range of detailed multibeam bathymetry data and seismic data.
Cyclic steps in the canyon may be the initial stage of submarine channel evolution [27,67]. Under erosion and sediment accumulation by turbidity current, cyclic steps may eventually contribute to topographic alteration and cause the migration of canyons. The presence of cyclic steps indicates that the canyon is active at the evolutional stage [8] and the upstream migration of cyclic steps disrupts the canyon wall and promotes the canyon migration further.

6. Conclusions

The influence of cyclic steps on canyon migration can provide new ideas for the study of sedimentary characteristics of deep-sea sediment transport patterns, hydrodynamic changes in ocean circulation, paleoclimatic changes, and the study and prediction of hydrocarbon storage. Based on the processed multibeam bathymetry data acquired in 2020, six cyclic steps are recognized in the lower section of the Penghu canyon. The detailed geometry of the cyclic steps is shown in the bathymetric topography maps. Our findings are summarized as follows.
(1)
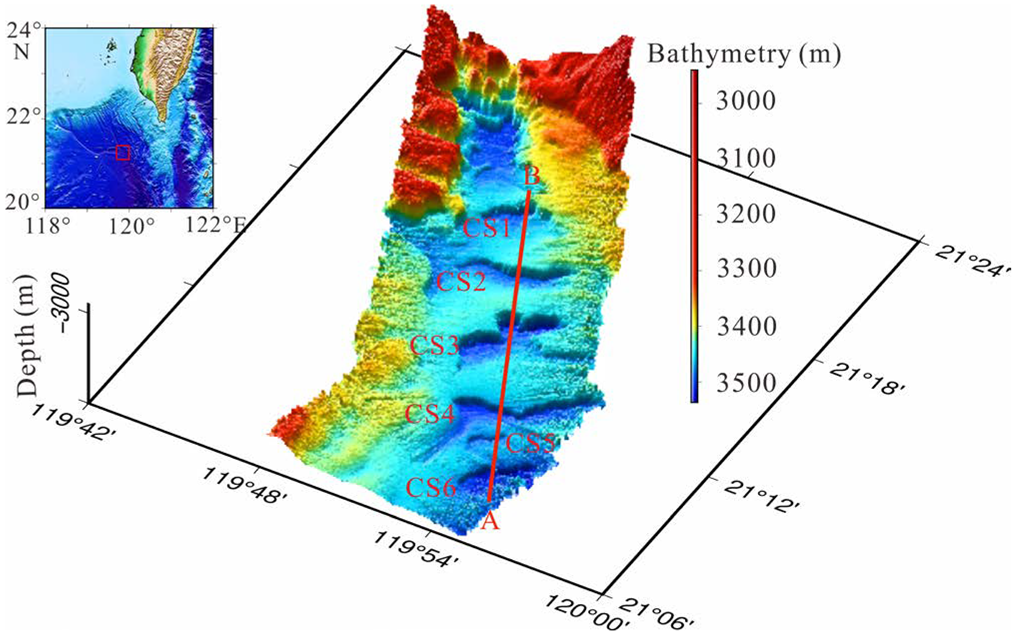
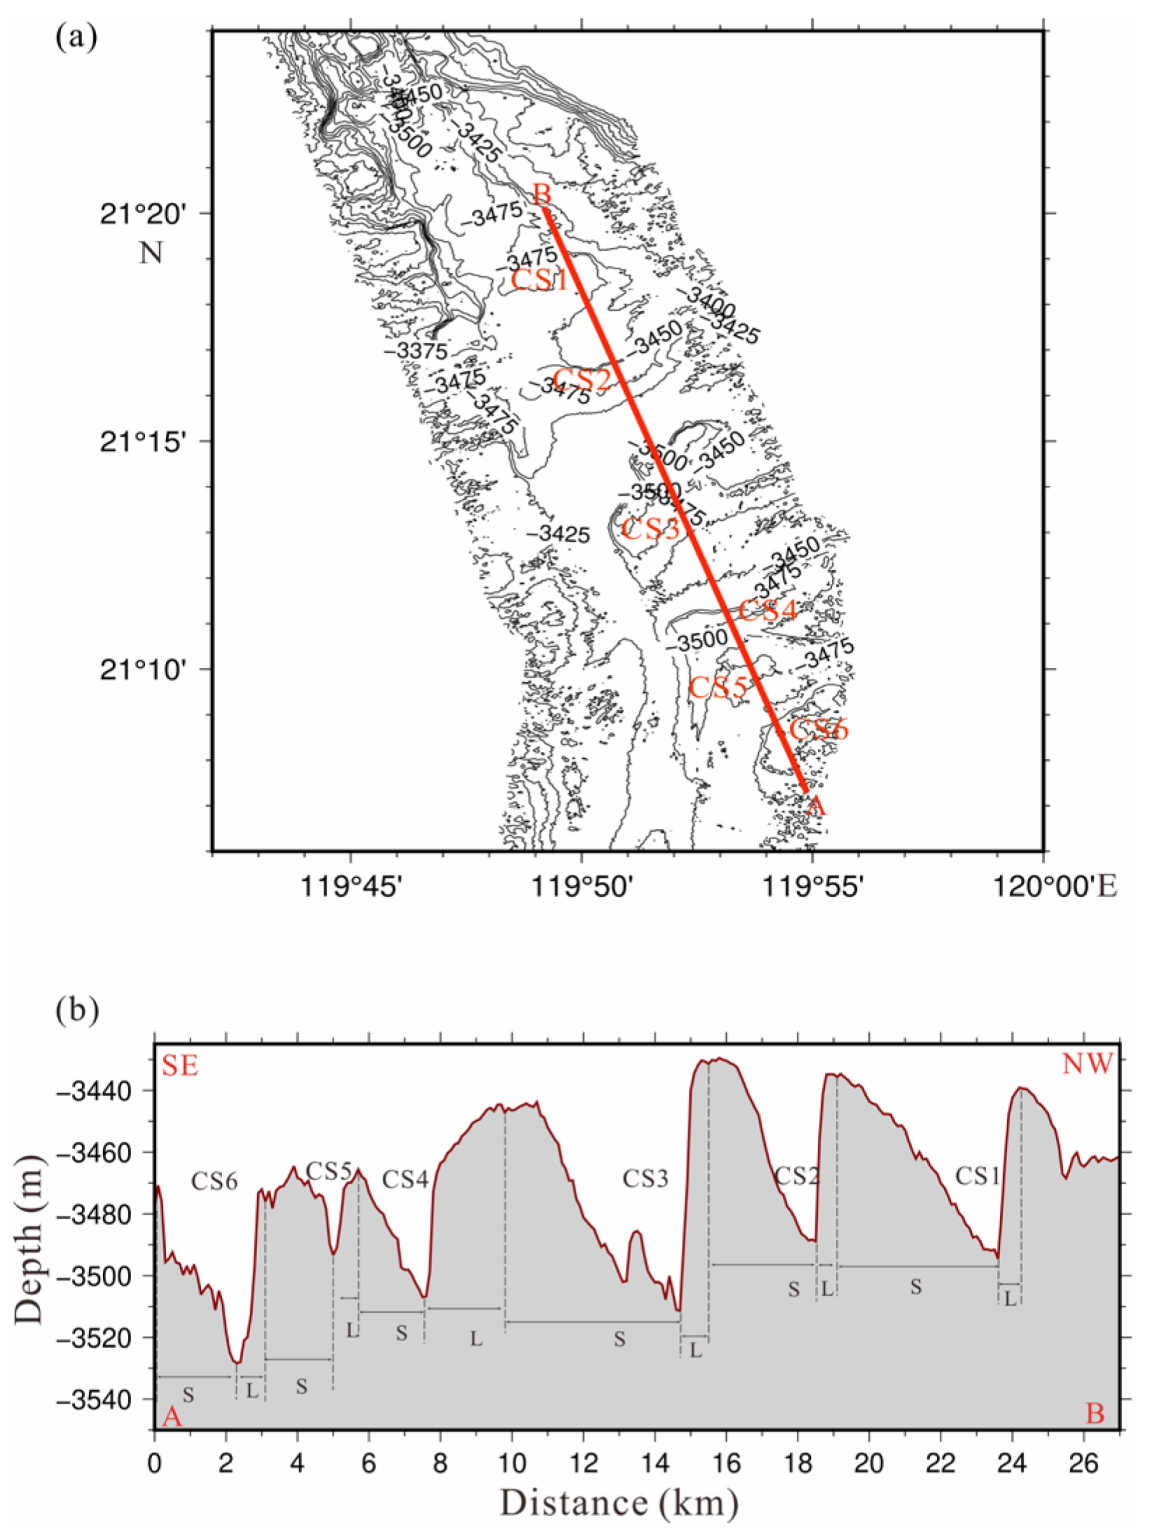
Six cyclic steps (CS1–CS6) indicate with the crescent-shape and upstream-migration in the Penghu canyon. The wavelengths of the CS1–CS6 vary from 1 to 6 km and wave heights are ranged from 19 to 81 m. They represent the net-erosional type according to the geometry features of cyclic steps;
(2)
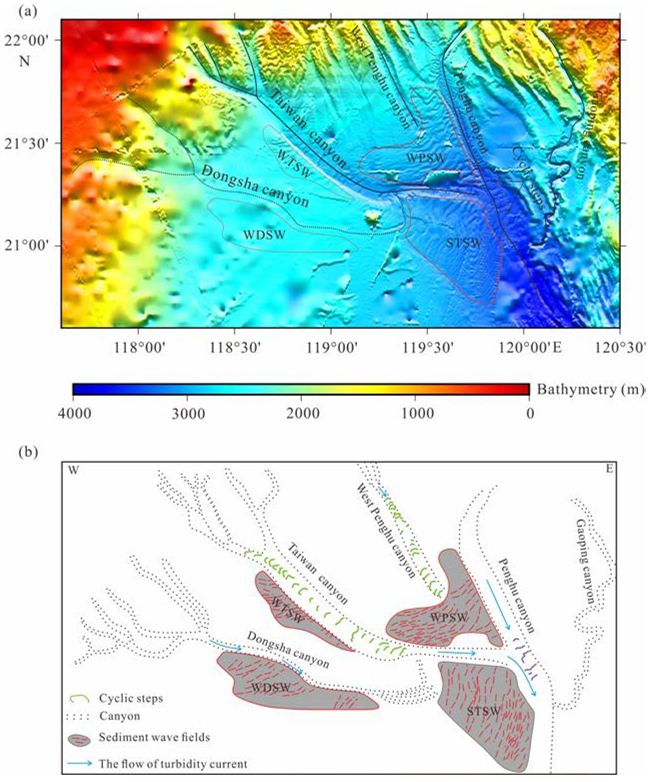
Based on the location and geometry of the CS1–CS6 at the junction of Penghu canyon and Taiwan canyon, the formation of the CS1–CS6 is caused by turbidity currents along two canyons. The CS1–CS6 are formed by rapid erosion under scouring turbidity current along the lower section of the canyon; and
(3)
The occurrence of the CS1–CS6 in the canyon suggests that the Penghu canyon is an active canyon at the evolution stage. During the active stage of the canyon, cyclic steps destroy the canyon wall and may promote the migration of the canyon.

Author Contributions

S.Z. and J.Z., writing-original draft preparation, writing review and editing; S.L., review and editing; Y.J., project administration; R.C. and X.C., data curation; X.O., software; Q.L., resources. All authors have read and agreed to the published version of the manuscript.

Funding

This study has been supported by the National Natural Science Foundation of China (41831280; 42276058; 91958214), by the Marine S&T Fund of Shandong Province for Pilot National Laboratory for Marine Science and Technology (Qingdao) (No. 2022QNLM050302-2) and the National Natural Science Foundation of Shandong Province (ZR2019MD036), and by the Fundamental Research Funds for the Central Universities (202172002; 202172003) and the 111 Project (No. B20048).

Institutional Review Board Statement

The study was conducted according to the guidelines of the Declaration of Helsinki, and approved by the Institutional Review Board.

Informed Consent Statement

Informed consent was obtained from all subjects involved in the study.

Data Availability Statement

The General Bathymetric Chart of the Oceans, https://www.gebco.net/data_and_products/gridded_bathymetry_data/ (accessed on 15 August 2021).

Acknowledgments

We would like to thank crew members of the R/V “Dongfanghong 3” for their efforts in the collection of the multibeam bathymetry data in this study. We used GMT software [46] to plot some figures. J. Z. acknowledges support from the Youth Talents Program of the OUC. The editor and four anonymous reviewers provided very valuable comments and suggestions that greatly improved the quality of our manuscript.

Conflicts of Interest

The authors declare no conflict of interest.

References

  1. Paull, C.K.; Caress, D.W.; Ussler, W.; Lundsten, E.; Thomas, H. Axial channel morphology fill and movement within submarine canyons off California. In AGU Fall Meeting Abstracts; 2008; abs. OS54A-01; Available online: https://ui.adsabs.harvard.edu/abs/2008EOSTr..89..493J/abstract (accessed on 9 August 2022).
  2. Gong, C.L.; Wang, Y.M.; Peng, X.C.; Li, W.G.; Qiu, Y.; Xu, S. Sediment waves on the South China Sea slope off southwestern Taiwan: Implications for the intrusion of the Northern Pacific Deep Water into the South China Sea. Mar. Petrol. Geol. 2012, 32, 95–109. [Google Scholar] [CrossRef]
  3. Hsiung, K.H.; Yu, H.S. Sediment dispersal system in the Taiwan–South China Sea collision zone along a convergent margin: A comparison with the Papua New Guinea collision zone of the western Solomon Sea. J. Asian Earth Sci. 2013, 62, 295–307. [Google Scholar] [CrossRef]
  4. Parker, G.; Izumi, N. Purely erosional cyclic and solitary steps created by flow over a cohesive bed. J. Fluid. Mech. 2000, 419, 203–238. [Google Scholar] [CrossRef]
  5. Smith, D.P.; Ruiz, G.; Kvitek, R.; Iampietro, P.J. Semi-annual patterns of erosion and deposition in Upper Monterey Canyon from serial multibeam bathymetry. Geol. Soc. Am. Bull. 2005, 117, 1123–1133. [Google Scholar] [CrossRef]
  6. Smith, D.P.; Kvitek, R.; Ruiz, G.; Iampietro, P.J.; Wong, K. Twenty-nine months of geomorphic change in upper Monterey Canyon (2002–2005). Mar. Geol. 2007, 236, 79–94. [Google Scholar] [CrossRef]
  7. Xu, J.P.; Wong, F.L.; Kvitek, R.; Smith, D.; Paull, C.K. Sand-wave migration in Monterey Submarine Canyon, central California. Mar. Geol. 2008, 248, 193–212. [Google Scholar] [CrossRef]
  8. Paull, C.K.; Caress, D.W.; Ussler, W., III; Lundsten, E.; Meiner-Johnson, M. High-resolution bathymetry of the axial channels within Monterey and Soquel submarine canyons, offshore central California. Geosphere 2015, 7, 1077–1101. [Google Scholar] [CrossRef]
  9. Zhong, G.F.; Cartigny, M.J.B.; Kuang, Z.G.; Wang, L.L. Cyclic steps along the South Taiwan Shoal and West Penghu submarine canyons on the northeastern continental slope of the South China Sea. Geol. Soc. Am. Bull. 2015, 127, 804–824. [Google Scholar] [CrossRef]
  10. Pierdomenico, M.; Casalbore, D.; Chiocci, F.L. The key role of canyons in funnelling litter to the deep sea: A study of the Gioia Canyon (Southern Tyrrhenian Sea). Anthropocene 2020, 30, 100237. [Google Scholar] [CrossRef]
  11. Sømme, T.O.; Helland, H.W.; Martinsen, O.J. Relationships between morphological and sedimentological parameters in source-to-sink systems: A basis for predicting semi-quantitative characteristics in subsurface systems. Basin Res. 2009, 21, 361–387. [Google Scholar] [CrossRef]
  12. Shanmugam, G. 50 years of the turbidite paradigm (1950s–1990s): Deep-water processes and facies models-acritical perspective. Mar. Petrol. Geol. 2000, 17, 285–342. [Google Scholar] [CrossRef]
  13. Hasiotis, T.; Papatheodorou, G.; Ferentions, G. A high-resolution approach in the recent sedimentation processes at the head of Zakynthos Canyon, western Greece. Mar. Geol. 2005, 214, 49–73. [Google Scholar] [CrossRef]
  14. Li, S.J.; Chu, F.Y.; Fang, Y.X.; Wu, Z.Y. Associated interpretation of sub-bottom and single-channel seismic profiles from Shenhu area in the north slope of South China Sea-characteristic of gas hydrate sediment. J. Trop. Oceanogr. 2012, 29, 56–62. [Google Scholar]
  15. Li, S.; Li, W.; Alves, T.M.; Wang, J.; Wu, S. Large-scale scours formed by supercritical turbidity currents along the full length of a submarine canyon, northeast South China Sea. Mar. Geol. 2020, 424, 106158. [Google Scholar] [CrossRef]
  16. Wang, Y.B.; Wu, Z.Y.; Shang, J.H.; Yin, S.R.; Zhou, J.Q. Morphologic characteristics and controlling factors of the northeastern South China Sea canyon group. Acta. Oceanol. Sin. 2020, 42, 62–74. [Google Scholar] [CrossRef]
  17. Ding, W.; Li, J.; Li, J. Morphotectonics and evolutionary controls on the Pearl River Canyon system, South China Sea. Mar. Geophys. Res. 2013, 34, 221–238. [Google Scholar] [CrossRef]
  18. Ou, X.L.; Zhu, J.J.; Li, S.Z.; Jia, Y.G.; Jia, Z.J.; Zhang, S.S.; Zhang, S.Y.; Chen, R.X.; Chen, X.Q.; Ding, D.; et al. Submarine geomorphological features and their origins analyzed from multibeam bathymetry data in the South China Sea. J. Mar. Sci. Eng. 2021, 9, 1419. [Google Scholar] [CrossRef]
  19. Zhao, Z.; Klemas, V.; Zheng, Q.; Yan, X. Remote sensing evidence for baroclinic tide origin of internal solitary waves in the northeastern South China Sea. Geophys. Res. Lett. 2004, 31, L06302. [Google Scholar] [CrossRef]
  20. Qu, T.D.; Girton, J.B.; Whitehead, J.A. Deepwater overflow through Luzon Strait. J. Geophys. Res. 2006, 111, C01002. [Google Scholar] [CrossRef]
  21. Wang, G.H.; Xie, S.P.; Qu, T.D.; Huang, R.X. Deep South China Sea circulation. Geophys. Res. Lett. 2011, 38, L05601. [Google Scholar] [CrossRef]
  22. Zhao, W.; Zhou, C.; Tian, J.W.; Yang, Q.X.; Wang, B.; Xie, L.L.; Qu, T.D. Deep water circulation in the Luzon Strait. J. Geophys. Res. Oceans 2014, 119, 790–804. [Google Scholar] [CrossRef]
  23. Liu, Z.; Zhao, Y.; Colin, C.; Stattegger, K.; Wiesner, M.G.; Huh, C.-A.; Zhang, Y.; Li, X.; Sompongchaiyakul, P.; You, C.-F.; et al. Source-to-sink transport processes of fluvial sediments in the South China Sea. Earth-Sci. Rev. 2016, 153, 238–273. [Google Scholar] [CrossRef]
  24. Xu, Z.; Wang, Y.; Liu, Z.; McWilliams, J.C.; Gan, J. Insight into the dynamics of the radiating internal tide associated with the Kuroshio Current. J. Geophys. Res. Ocean. 2021, 126, e2020JC017018. [Google Scholar] [CrossRef]
  25. Parker, G. Interaction between basic research and applied engineering: A personal perspective. J. Hydraul. Res. 1996, 34, 291–316. [Google Scholar] [CrossRef]
  26. Wang, D.W.; Bai, H.X.; Wu, S.G. The research progress of turbidity currents and related deep-water bedforms. Adv. Earth Sci. 2018, 33, 52–65. [Google Scholar] [CrossRef]
  27. Fildani, A.; Normark, W.R.; Kostic, S.; Parker, G. Channel formation by flow stripping: Large-scale scour features along the Monterey East Channel and their relation to sediment waves. Sedimentology 2006, 53, 1265–1287. [Google Scholar] [CrossRef]
  28. Covault, J.A.; Kostic, S.; Paull, C.K.; Ryan, H.F.; Fildani, A. Submarine channel initiation, filling and maintenance from seafloor geomorphology and morphodynamic modelling of cyclic steps. Sedimentology. 2014, 61, 1031–1054. [Google Scholar] [CrossRef]
  29. Migeon, S.; Savoye, B.; Faugeres, J.C. Quaternary development of migrating sediment waves in the Var deep-sea fan: Distribution, growth pattern, and implication for levee evolution. Sediment. Geol. 2000, 133, 265–293. [Google Scholar] [CrossRef]
  30. Kostic, S. Modeling of submarine cyclic steps: Controls on their formation, migration, and architecture. Geosphere 2011, 7, 294–304. [Google Scholar] [CrossRef]
  31. Kuang, Z.G.; Zhong, G.F.; Wang, L.L.; Wang, L.L.; Guo, Y.Q. Channel-related sediment waves on the eastern slope offshore Dongsha Islands, northern South China Sea. J. Asian Earth. Sci. 2014, 79, 540–551. [Google Scholar] [CrossRef]
  32. Ding, W.W.; Li, J.B.; Han, X.Q.; Li, M.B.; Suess, E. Geomorphology, grain-size charicteristics, matter source and forming mechanism of sediment waves on the ocean bottom of the northeast South China Sea. Acta. Oceanol. Sin. 2010, 32, 96–105. [Google Scholar]
  33. Zhu, M.Z.; Graham, S.; Pang, X.; Mchargue, T. Characteristics of migrating submarine canyons from the middle Miocene to present: Implications for paleoceanographic circulation, northern South China Sea. Mar. Petrol. Geol. 2010, 27, 307–319. [Google Scholar] [CrossRef]
  34. Baztan, J.; Berné, S.; Olivet, J.L.; Rabineau, M.; Aslanian, D.; Gaudin, M. Axial incision: The key to understand submarine canyon evolution (in the western Gulf of Lion). Mar. Pet. Geol. 2005, 22, 805–826. [Google Scholar] [CrossRef]
  35. Tapponnier, P.; Peltzer, G.; Dain, A.; Armijo, R.; Cobbold, P. Propagating extrusion tectonics in Asia: New insights from simple experiments with plasticine. Geology 1982, 10, 611. [Google Scholar] [CrossRef]
  36. Taylor, B.; Hayes, D.E. Origin and History of the South China Sea Basin; Geophysical Monograph Series; American Geophysical Union: Washington, DC, USA, 1983; Volume 27, pp. 23–56. [Google Scholar]
  37. Mishra, O.P. Lithospheric heterogeneities of northeast (NE) India and Indo-Burma region: Geodynamical implications. Geosyst. Geoenviron. 2022, in press. [CrossRef]
  38. Yu, S.B.; Kuo, L.C.; Punongbayan, R.S.; Ramos, E.G. GPS observation of crustal deformation in the Taiwan–Luzon region. Geophys. Res. Lett. 1999, 26, 923–926. [Google Scholar] [CrossRef]
  39. He, Y.; Zhong, G.; Wang, L. Characteristics and occurrence of submarine canyon-associated landslides in the middle of the northern continental slope, South China Sea. Mar. Petrol. Geol. 2014, 57, 546–560. [Google Scholar] [CrossRef]
  40. Zhong, G.F.; Liang, J.Q.; Guo, Y.Q.; Kuang, Z.; Su, P.; Lin, L. Integrated corelog facies analysis and depositional model of the gas hydrate-bearing sediments in the northeastern continental slope, South China Sea. Mar. Petrol. Geol. 2017, 86, 1159–1172. [Google Scholar] [CrossRef]
  41. Zhu, J.J.; Li, S.Z.; Jia, Y.G.; Zhang, S.Y.; Chen, X.Q.; Chen, R.X.; Suo, Y.H.; Cao, X.Z.; Jia, Z.J.; Ou, X.L.; et al. Links of high velocity anomalies in the mantle to the Proto-South China Sea slabs: Tomography-based review and perspective. Earth-Sci. Rev. 2022, 231, 0012–8252. [Google Scholar] [CrossRef]
  42. Li, C.-F.; Xu, X.; Lin, J.; Sun, Z.; Zhu, J.; Yao, Y.; Zhao, X.; Liu, Q.; Kulhanek, D.K.; Wang, J. Ages and magnetic structures of the South China Sea constrained by deep tow magnetic surveys and IODP Expedition 349. Geochem. Geophys. Geosyst. 2014, 15, 4958–4983. [Google Scholar] [CrossRef]
  43. Zhu, J.; Xu, H.; Qiu, X.; Ye, S.; Li, S. Crustal structure and rifting of the northern South China Sea margin: Evidence from shoreline-crossing seismic investigations. Geol. J. 2018, 53, 2065–2083. [Google Scholar] [CrossRef]
  44. Zhu, J.; Qiu, X.; Kopp, H.; Xu, H.; Sun, Z.; Ruan, A.; Sun, J.; Wei, X. Shallow anatomy of a continent-ocean transition zone in the northern South China Sea from multichannel seismic data. Tectonophysics 2012, 554–557, 18–29. [Google Scholar] [CrossRef]
  45. Zhang, Y.W.; Liu, Z.F.; Zhao, Y.L.; Colin, C.; Zhang, X.; Wang, M.; Kneller, B. Long-term in situ observations on typhoon-triggered turbidity currents in the deep sea. Geology 2018, 46, 675–678. [Google Scholar] [CrossRef]
  46. Wessel, P.; Luis, J.F.; Uieda, L.; Scharroo, R.; Wobbe, F.; Smith, W.H.F.; Tian, D. The generic mapping tools version 6. Geochemistry, Geophysics, Geosystems 2019, 20, 5556–5564. [Google Scholar] [CrossRef]
  47. Lin, A.T.; Watts, A.B.; Hesselbo, S.P. Cenozoic stratigraphy and subsidence history of the South China Sea margin in the Taiwan region. Basin Res. 2003, 15, 453–478. [Google Scholar] [CrossRef]
  48. Wang, C.S.; Zhu, J.; Zhao, D.D.; Yang, G.M.; Xiong, Z.X.; Zhang, S.S.; Li, S.Z.; JIA, Y.G. Origin and evolution of submarine canyons. Mar. Geol. Front. 2021, 37, 1–15. [Google Scholar] [CrossRef]
  49. Damuth, J.E. Migrating sediment waves created by turbidity currents in the northern South China Basin. Geology 1979, 7, 520–523. [Google Scholar] [CrossRef]
  50. Wang, H.; Wang, Y.; Qiu, Y.; Peng, X.; Huang, Q. Development and its tectonic activity ’s origin of turbidity current sediment wave in Manila Trench, the South China Sea. Acta Sedimentol. Sin. 2008, 26, 39–45. (In Chinese) [Google Scholar]
  51. Lin, C.C.; Lin, T.S.; Liu, C.S.; Horng, C.S.; Wang, Y. Canyon-infilling and gas hydrate occurrences in the frontal fold of the offshore accretionary wedge off southern Taiwan. Mar. Geophys. Res. 2014, 35, 21–35. [Google Scholar] [CrossRef]
  52. Zhang, Z.; Zhao, W.; Tian, J.; Liang, X. A mesoscale eddy pair southwest of Taiwan and its influence on deep circulation. J. Geophys. Res.-Oceans 2013, 118, 6479–6494. [Google Scholar] [CrossRef]
  53. Zhang, Y.; Liu, Z.; Zhao, Y.; Wang, W.G.; Li, J.R.; Xu, J.P. Mesoscale eddies transport deep-sea sediments. Sci. Rep. 2014, 4, 5937. [Google Scholar] [CrossRef]
  54. Tian, J.W.; Yang, Q.X.; Liang, X.F.; Xie, L.L.; Hu, D.X.; Wang, F.; Qu, T.D. Observation of Luzon Strait transport. Geophys. Res. Lett. 2006, 33, 19. [Google Scholar] [CrossRef]
  55. Yang, Q.X.; Tian, J.W.; Zhao, W. Observation of Luzon Strait transport in summer 2007. Deep Sea Res. Part I Oceanogr. Res. Pap. 2010, 57, 670–676. [Google Scholar] [CrossRef]
  56. De Leeuw, J.; Eggenhuisen, J.T.; Cartigny, M.J.B. Morphodynamics of submarine channel inception revealed by new experimental approach. Nat. Commun. 2016, 7, 10886. [Google Scholar] [CrossRef]
  57. Pohl, F.; Eggenhuisen, J.T.; Tilston, M.; Cartigny, M.J.B. New flow relaxation mechanism explains scour fields at the end of submarine channels. Nat. Commun. 2019, 10, 4425. [Google Scholar] [CrossRef] [PubMed]
  58. Liu, Z.; Chen, R.X.; Zhu, Y.S.; Zhang, G.X.; Dong, D.X. Geophysical studies of mass transport deposits on the slope canyon floor with high-resolution autonomous underwater vehicle (AUV) in the Shenhu area and its implications for sediment transportation. Mar. Geol. Quat. Geol. 2021, 41, 13–21. [Google Scholar]
  59. Meiburg, E.; Kneller, B. Turbidity currents and their deposits. Annu. Rev. Fluid. Mech. 2010, 42, 135–156. [Google Scholar] [CrossRef]
  60. Cartigny, M.; Ventra, D.; Postma, G.; Van, D.; Venditti, J. Morphodynamics and sedimentary structures of bedforms under supercritical-flow conditions: New insights from flume experiments. Sedimentology 2014, 6, 712–748. [Google Scholar] [CrossRef]
  61. Kostic, S.; Parker, G. The response of turbidity currents to a canyon-fan transition: Internal hydraulic jumps and depositional signatures. J. Hydraul. Res. 2006, 44, 631–653. [Google Scholar] [CrossRef]
  62. Yu, H.S.; Hong, E. Shifting submarine canyons and development of a foreland basin in SW Taiwan: Controls of foreland sedimentation and longitudinal sediment transport. J. Asian Earth Sci. 2006, 27, 922–932. [Google Scholar] [CrossRef]
  63. Cai, S.; Xie, J.; He, J. An overview of internal solitary waves in the South China Sea. Surv. Geophys. 2012, 33, 927–943. [Google Scholar] [CrossRef]
  64. Cai, S.Q.; Xie, J.X.; Xu, J.X.; Wang, D.X.; Chen, Z.W.; Deng, X.D.; Long, X.M. Monthly variation of some parameters about internal solitary waves in the South China Sea. Deep Sea Res. Part I Oceanogr. Res. Pap. 2014, 84, 73–85. [Google Scholar] [CrossRef]
  65. Alford, M.; Peacock, T.; MacKinnon, J. The formation and fate of internal waves in the South China Sea. Nature 2015, 521, 65–69. [Google Scholar] [CrossRef]
  66. Tian, J.W.; Yang, Q.X.; Zhao, W. Enhanced diapycnal mixing in the South China Sea. J. Phys. Oceanogr. 2009, 39, 3191–3203. [Google Scholar] [CrossRef]
  67. Normark, W.R.; Piper, D.J.; Romans, B.W.; Covault, J.A.; Dartnell, P.; Sliter, R.W. Submarine canyon and fan systems of the California continental borderland. Geol. Soc. Am. Spec. Pap. 2009, 454, 141–168. [Google Scholar]
Figure 1. Bathymetric topography of a group of canyons on the northern continental margin of the South China Sea. Red dashed lines represent the Taixinan canyon group. The solid orange line is the direction of Kuroshio movement. The solid red line is the direction of deep-water intrusion movement in the western Pacific. The solid green line is the direction of internal wave movement [24]. The orange dashed line is the deep-water current of the South China Sea [20,21,22,23]. The purple curve is the internal solitary wave observed in the satellite image [22].
Jmse 10 01301 g001
Figure 2. Multibeam bathymetric map of the Taixinan canyon groups. The bottom map is drawn using GEBCO-2021 bathymetry data (https://www.gebco.net/data_and_products/gridded_bathymetry_data/ (accessed on 15 August 2021)), and the color bar is below the image. The Penghu canyon is shown in the new bathymetry data collected in 2020 by “Dongfanghong 3” research vessel, and the color bar is on the right of the image. The red lines represent the canyon axis. The Penghu canyon is divided into the upper, middle, and lower sections based on water depth and canyon profile morphology. The Penghu canyon extends downward to intersect with the Taiwan canyon and links with the Manila Trench to the south.
Jmse 10 01301 g002
Figure 3. Multibeam bathymetric map of the Penghu canyon. (a) Topographic map of the middle section of the Penghu canyon with a linear scarp; (b) topographic map of the lower section of the Penghu canyon. Six cyclic steps and sediment waves are identified in the lower section of the Penghu canyon.
Jmse 10 01301 g003
Figure 4. Geometry and slope map of the Penghu canyon. (a) Multibeam topographic map of the Penghu canyon. The solid red line is the axis of the canyon and the black dashed line is the location of the extracted topographic profiles; (b) slope map of the Penghu canyon. The blue dots are thalweg points. (c) Topographic profiles along the vertical axis of the Penghu canyon (P1–P6). The black dashed line is the thalweg line.
Jmse 10 01301 g004
Figure 5. Three-dimensional topographic map of the cyclic steps. Six cyclic steps CS1–CS6 are located in the lower section of the Penghu canyon. The CS1–CS6 indicate the crescent shape and upstream migration. The red line (AB) is the profile line.
Jmse 10 01301 g005
Figure 6. Contour map, and profiles across the cyclic step (CS1–CS6) in the lower sections of the Penghu canyon. (a) Contour map of the CS1–CS6 with contours at 50 m spacing. CS1–CS6 show a closed pattern. The red line (AB) is the profile line. (b) Profile (AB) map of the CS1–CS6. L-lee sides. S-stoss sides.
Jmse 10 01301 g006
Figure 7. Geometry of sediment wave in the lower section of the Penghu canyon. (a) Topographic map of sediment wave from the multibeam bathymetry data. The red lines are the cut sediment wave profiles, and the black dashed lines of Q1–Q2–Q3 are bathymetry boundary lines between sediment wave and cyclic steps. (bd) Longitudinal profiles of sediment wave. (ef) Cross-sectional profiles of sediment wave.
Jmse 10 01301 g007
Figure 8. Distribution and explained patterns of cyclic steps and sediment wave in the Taixinan canyon group. (a) Cyclic steps and sediment wave distributed in the northern South China Sea. (b) Schematic formation pattern of cyclic steps in the Penghu canyon. The cyclic steps developed at the lower section of the Penghu canyon are formed by the combined effect of turbidity current between the Taiwan canyon and Penghu canyon. The green line represents the cyclic steps previously found in the northern part of the South China Sea [9,15]. The purple line represents the cyclic steps newly found in this study. Sediment waves: WDSW = West Dongsha canyon sediment wave field; WTSW = West Taiwan canyon sediment wave field; STSW = South Taiwan Canyon sediment wave field; WPSW = West Penghu canyon sediment wave field [16,31]. Blue arrows: turbidity current flow direction [9,15].
Jmse 10 01301 g008
Table 1. Morphological parameters of six cyclic steps identified in the lower section of the Penghu canyon.
TypeCS1CS2CS3CS4CS5CS6
Wavelength/km4.16–5.373.25–3.985.00–5.863.14–4.321.28–2.672.76–3.09
Wave height/m45.13–60.7640.02–58.1177.88–80.9560.30–61.2119.10–29.9344.35–61.11
Area/km24.277.0811.0111.770.894.95
Lee-side length/km0.61–1.290.33–0.860.59–2.271.83–2.070.31–0.680.70–1.38
Stoss-side length/km2.88–4.732.39–3.223.59–5.261.31–2.200.84–1.981.70–2.17
Lee-side slope0.05–0.090.07–0.170.08–0.140.02–0.030.03–0.050.04–0.08
Stoss-side slope0.01–0.020.01–0.020.01–0.020.03–0.050.01–0.020.03–0.04
Overall slope1.291.081.601.091.161.11
Aspect ratio68.49–102.9955.84–99.5064.20–72.3552.12–70.4962.58–119.6950.69–62.14
Asymmetrical index0.13–0.450.10–0.360.11–0.630.94–1.390.16–0.510.32–0.81
Table 2. Comparison and summary of four submarine canyons in the northern South China Sea margin.
TypeShenhu CanyonPenghu CanyonTaiwan CanyonWest Penghu Canyon
ConstructedDeposition-basedExploitation-basedExploitation-basedExploitation
RiverPearl RiverNoneHanjiangNone
Canyon Typeriver-associated,
shelf incising canyon
shelf incising canyonriver-associated,
shelf incising canyon
Canyon head slope1.96–2.88°5–12°3–12°7–13°
Bathymetry700–1600 m2100–3000 m200–3500 m400–3000 m
Control FactorsCombination of turbidity flow, landslide and debris flowTectonic and turbidity currentsNW-oriented paleo transformation faults, magmatism and turbidity currentsTectonic and turbidity currents
Continental Edge TypePassive Continental EdgeActive Continental EdgePassive Continental EdgePassive Continental Edge
Canyon length30–60 km180 km150 km90 km
Sediment typesilt and claySandSandSand and mud
Publisher’s Note: MDPI stays neutral with regard to jurisdictional claims in published maps and institutional affiliations.

