Article

Characteristics of Chromophoric Dissolved Organic Matter (CDOM) Produced by Heterotrophic Bacteria Isolated from Aquaculture Systems

by
Mariel Gullian-Klanian
1,
Gerardo Gold-Bouchot
2,* and
María José Sánchez-Solís
1
1
School of Natural Resources, University Marist of Merida, Periférico Nte Tablaje Catastral 13941, Merida 97300, Mexico
2
Department of Oceanography and Geochemical and Environmental Research Group (GERG), Texas A&M University, College Station, TX 77843, USA
*
Author to whom correspondence should be addressed.
J. Mar. Sci. Eng. 2022, 10(5), 672; https://doi.org/10.3390/jmse10050672
Submission received: 17 March 2022 / Revised: 28 April 2022 / Accepted: 10 May 2022 / Published: 14 May 2022
(This article belongs to the Section Marine Environmental Science)

Abstract

:
Heterotrophic bacteria (HB) play an important role in aquatic ecosystems as recyclers of dissolved organic matter (DOM). The objective of this study was to characterize the spectral characteristics of intracellular (IC), and extracellular (EC) compounds produced by 12 HB isolated from two aquaculture systems. Microorganisms belonging to the genera Bacillus, Paenibacillus, and Psychrobacillus were identified by analysis of the 16S ribosomal gene. Aliquots of bacterial culture were centrifugated every hour (1st to 7th) to obtain the EC compounds. The pellet was ultrasound-lysed to obtain the IC compounds. Excitation-emission matrices were used in combination with parallel factor analysis (PARAFAC) to characterize the fluorescent components of DOM (FDOM). PARAFAC indicated two protein-like components and two humic-like components in both cell spaces. At the IC, B. macquariensis showed a high fluorescence index (FI), probably associated with fulvic acid, quinones, or ketones. Psychrobacillus insolitus showed an inverse correlation between spectral slopes S275–295 and S350–400 in the EC and IC fractions, which may indicate differential release of low and high molecular weight molecules in these two fractions. The opposite occurred with B. licheniformis and P. alvei. The origin of FDOM in HB is an important finding of this work. The most significant amount of protein-like substances was produced at the IC level, with the humic- and fulvic-type at the EC. The main finding of this work is the evidence of differential production of humic-type or protein-type FDOM production by HB species from marine and freshwater aquaculture systems in their intracellular and extracellular fractions, as well different relative molecular weight. For aquaculture, these findings suggest that some bacterial species show promise in supplying essential amino acids to growing organisms, and others play a major role in nutrient exchange and the global carbon cycle.

1. Introduction

Heterotrophic bacteria (HB) play an important role in aquatic environments as recyclers of dissolved organic matter (DOM) [1]. HB generally release DOM as metabolic by-products or because of the uncoupling of catabolic and anabolic processes [2]. They also actively release organic compounds for different cellular processes such as siderophores for iron absorption [3], acylated homoserine lactones for quorum detection [4], or polymers for enzymatic cleavage [5]. The Bacillus class consists of the most taxonomically diverse bacterial genera of the phylum Firmicutes. The class includes the Bacillaceae family, characterized by rod-shaped HB with the ability to form endospores, and the Paenibacillaceae family, a relatively new taxonomic classification containing the genus Paenibacillus [6]. The released products may differ between the different taxa [7,8] or change depending on environmental variables and nutrient concentrations [9,10].
HB have relevant roles in the carbon-nitrogen cycle in aquaculture production systems. They intervene in the availability of nutrients, the improvement of water quality, and the control of diseases and nutrition. Some aquaculture technologies, such as biofloc and suspended sludge production [11,12], promote mass production of HB in the water column to reduce production costs [13]. In addition to controlling toxic ammonia in the water, the heterotrophic microbiota represents an essential complementary food source for growing fish and crustaceans [14,15].
DOM is the main substrate for heterotrophic respiration and microbial growth [16]. Chromophoric dissolved organic matter (CDOM) is the chromophoric part of dissolved organic matter that absorbs light in the ultraviolet and visible (UV-Vis) wavelength range. The light emission and absorption properties of CDOM can affect the primary productivity in the water column and, therefore, water quality [17]. Fluorescent DOM (FDOM) is the fraction of CDOM capable of emitting fluorescence [18,19]. Variations in the fluorescence characteristics of CDOM have been associated with changes in bacterial metabolism [20,21,22,23]. Currently, very little is known about the characteristics of FDOM produced by marine individual heterotrophic species.
Bacterial phylogenetic groups differ in their dissolved organic components, mainly because their metabolic systems are different [22,24]. All microorganisms produce natural intracellular (IC) and extracellular (EC) fluorophores, whose concentrations depend on the physiological state of the cells [23,25]. Many biomolecules, including proteins, enzymes, coenzymes, pigments, and primary or secondary metabolites (e.g., fulvic and humic acids), exhibit characteristic fluorescence [26,27]. Fluorescence excitation-emission spectroscopy (EEM) matrices, together with parallel factor analysis (PARAFAC), have been used to characterize organic matter in natural aquatic systems and in vitro bacterial cultures, mainly due to the high selectivity and sensitivity [22,28,29]. According to EEM spectroscopy, the optically active fraction of FDOM has two main contributions: one similar to proteins (λex/λem 230–280/330–360 nm), and the other similar to humic and fulvic compounds [18,30]. Both contributions have been routinely divided into several subdivisions: tyrosine, tryptophan, and phenylalanine-like fluorescence for protein-like FDOM, visible and UV-like for humic-like FDOM [18,31]. PARAFAC enables the mathematical separation of overlapping chemically independent fluorescence components and their relative contributions to the EEMs [32,33].
Although there is knowledge about the production of FDOM in aquatic microbial communities, there is very little evidence of the production of humic-like or protein-like FDOM of HB from aquaculture environments. Hamby et al. [34] first used the EEM to characterize organic matter in a recirculating aquaculture system. Their results showed a 5-component PARAFAC model to describe organic matter of a recirculating aquaculture system. In our previous work, we studied the effect of incorporating Bacillus spp. on the characteristics of FDOM and mineralization in a recirculating aquaponic system [35]. Fox et al. [25] developed a methodology to study human pathogenic bacteria’s intracellular and extracellular FDOM production. Goto et al. [36,37] described FDOM produced by Alteromonas macleodii and Vibrio superbus and Phaeobacter gallaeciencis in cultures with glucose as the only carbon source. In the present study, we focus on studying the intracellular and extracellular origin of FDOM in some heterotrophic species of aquaculture origin. Some species of the genera Bacillus and Paenibacillus are characterized as having an important environmental role as recyclers of organic material and are used to develop sustainable production technologies [35]. This is an in vitro study where each species was grown individually, which avoids the complexities of interpretation that microbial communities represent. This work provides useful information to understand the role of HB in the biochemical cycle of dissolved organic matter in aquaculture environment.

2. Materials and Methods

2.1. Isolation of Bacteria

The bacteria were isolated from two commercial aquaculture systems in the last week of growth: the first from an outdoor sea cucumber production system (Isostichopus badionotus) exposed to environmental conditions, and the second from an indoor production of freshwater fish (Oreochromis niloticus). In the last weeks of growth, the density of suspended solids is more stable; the bacterial population is resident and wholly adapted to the water conditions. Forty-eight hours before harvest, the organisms do not feed, which implies a lower population of food-borne bacteria in the water.
The samples were obtained from the biofilm adhered to the walls of the seawater pond (SW) and from the biofloc suspended in the freshwater tanks (FW). Four species of Bacillus were isolated from the SW system and eight species from the FW system. The isolated species were purified up to the third generation. The phenotypic characterization of the isolates was carried out according to the guidelines of the Archaea and Bergey Bacteria Systematics Manual [38].

2.2. Amplification of the 16S Ribosomal RNA Gene and Phenotypic Characterization

Genomic DNA was obtained by protein lysis and digestion according to the method described by Altschul et al. [39]. The 16S ribosomal RNA gene was amplified by PCR using the universal primers 27f (5′-AGA GTT TGA TCM TGG CTC AG-3′) [40] and 1492r (5′-ACG GYT ACC TTG TTA CG-3′) [41]. The PCR reaction mix (25 µL) consisted of 10 mM Tris-HCl (pH 9.0), 50 mM KCl, 0.1% Triton X-100, 2.1 mM MgCl2, 0.2 µM of each one of deoxynucleoside triphosphate (dNTP), 0.4 µM primer concentration, 50 ng of bacterial DNA, and 1 U of Taq DNA polymerase (Promega Corp., Madison, WI, USA). The amplification protocol was as follows: 1 cycle of 240 s at 94 °C, 40 cycles of 5 s at 94 °C, 45 s at 46 °C, and 90 s at 72 °C; there was a final cycle of 10 min at 72 °C. The PCR products were electrophoresed on a 2% agarose gel at 85 V.
The purified PCR products were sequenced by the Sanger method (Applied Biosystems 3730xl; Thermo-Fisher Scientific, Waltham, MA, USA) on an automated DNA sequencing analyzer. The sequences were analyzed using the basic local alignment search tool (BLAST) [41]. The sequences were aligned with CLUSTAL W. The identity of the strains was determined by comparing the sequences with the NCBI-16S rRNA database.

2.3. Bacterial Growth Curves

Norris nitrogen-free and sodium citrate modified medium was used as the basal medium for microbial growth [42]. The formulation included 1.0% C₆H₁₂O₆, 0.08% Na3C6H5O7, 0.1% K2HPO4, 0.1% CaCO3, 0.02% MgSO4, 0.02% NaCl, 0.01% FeSO4, and 0.001% Na2MoO4, (pH = 7.0 ± 0.2). NaCl (up to 1.5%) was added to the final formulation of the marine species. The sterilization of the culture medium and the experimental test material was carried out in a steam autoclave at 121 °C (FE-396—Felisa, Jalisco, MX, USA).
The cryopreserved bacteria were spread on tryptic soy agar (TSA, Difco 236950) and subsequently on Bacillus agar (PEMBA, Neogene NCM016) and incubated both times overnight at 28 °C. Growth curves were made by inoculating a single colony into 50 mL of modified Norris broth. The flask was incubated overnight at 28 °C (16 h) and shaken at 150 rpm (Barnstead MaxQ 4000 Orbital, Thermo-Fisher Scientific, Waltham, MA, USA). Subsequently, each culture was diluted in 150 mL of sterile Norris broth and incubated under the same conditions described above. After that, a 100 mL aliquot was suspended in a new flask with 200 mL of fresh Norris broth. The study was carried out during 7 h of the exponential phase to record the highest cellular activity. Once the absorbance reached the optical density (OD) of 0.02 (time 0), 25 mL were withdrawn from the culture and used for the cell count and the separation of the IC and EC components. OD was measured at a wavelength of 600 nm in a visible light spectrophotometer (Spectronic Genesys 20—Thermo-Fisher Scientific, Waltham, MA, USA). Norris’s medium was used as a blank. Bacteria counting was performed using the Neubauer cell counting chamber. Samples were diluted 1/200 in 2.5% glutaraldehyde and viewed under a phase-contrast microscope at 100× magnification.

2.4. Separation of Extracellular (EC) and Intracellular (IC) Bacterial Compounds

The separation of IC and EC components was carried out following the methodology described by Fox et al. [25] with some modifications. Bacterial culture samples were taken every hour in duplicate from the first hour of growth to the seventh. Aliquots (25 mL) were centrifuged at 5000× g for 5 min (Allegra X-30R, Beckman Coulter, Brea, IN, USA) to obtain the EC compounds. The supernatant was then filtered using a 0.45 µm Millipore® cellulose filter (Sartorius Stedim Biotech, Göttingen, Germany) to ensure cell removal. The pellet was resuspended and washed three times in 5 mL of Ringer’s solution (38.5 μM NaCl, 1.41 μM KCl, 1.08 μM CaCl2, 0.60 μM NaHCO₃) to obtain the IC compounds. A 5 mL sample of the resuspended cells was lysed with ultrasound (Ultrasonic Processor XL 2020, Misonix Inc., Connecticut, CT, USA) in three pulses of 10 s each at a fixed frequency of 20 kHz and 40% amplitude. The protein concentration of the IC and EC extracts was determined by Lowry’s method at 541 nm [43] and calculated from a standard curve (0–20 mg mL−1) using bovine serum albumin (Sigma Chemical Co., St. Louis, MI, USA) as standard.

2.5. Fluorescence Measurements

Excitation-emission matrices (EEM) and absorbance spectra were processed using an Aqualog® spectrofluorometer (Horiba Ltd., Kyoto, Japan). The EEM and absorbance spectra were recorded at 3 nm intervals in the excitation wavelength range of 240 to 600 nm in a 1 cm quartz cuvette. Emission spectra were also recorded every 3 nm. The fluorescence and absorption spectra were corrected by subtracting a high purity water sample (Raman water fluorescence reference, Starna®). Each EEM was corrected for inner filter effects using the Aqualog software. Fluorescence intensities were converted to Raman units (λex/λem 350/371–428 nm) [44] using the package ‘staRdom’ version 1.12 [45] for R version 3.6.1 [46].
Fluorescence signals in the EEMs were decomposed by PARAFAC using the ‘drEEM’ toolbox version 0.5 for MATLAB [47], using non-negativity constraints in all modes. A four-component model was validated, with a core consistency of 93.3 and an explained variance of 92.2%. No samples were excluded, for a total of 168 samples (12 species X 7 EC + 7 IC). Spectral loadings of the four PARAFAC components are given in Appendix A (Figure A1). The model was validated using split-half analysis [48] using a Tucker congruence coefficient of 0.95. The results of the half-split validation for the excitation and emission spectra of thee four components are given in Appendix A (Figure A2). The intensities of fluorescence of the four components are reported relative to the maximum intensity of each component.

2.6. Data Analysis

Bacterial abundance data were modeled using the exponential growth function y = Co. exp (−K·t); Co is the initial concentration, and K the number of generations per unit of time.
Absorbance measurements for all samples (IC and EC) were converted to the Napierian absorption coefficients by a(λ) = 2.303 A(λ)/l; where A(λ) is the absorbance at wavelength λ, and “l” is the cuvette path length in meters. The absorption coefficient at 350 nm (a350) was taken as a proxy for dissolved organic carbon concentrations [49]. Spectral slope (S) of absorption coefficient [50] was calculated by fitting a Gaussian curve to the spectra using the equation: y = a0 + e(−S(x−λ0)) + K. The spectral slope ratio (SR) [51] was calculated as the ratio of the slope from 275 to 295 nm (S275–295) divided by the slope from 350 to 400 nm (S350–400). The absorption ratio E2:E3 was calculated as the absorption at 250 nm divided by the absorption at 365 nm. The spectral slope (Sr) and (S275–295) and (S350–400) indicate relative molecular weight and aromaticity of CDOM [52]. The spectral slopes, E2:E3, and spectral slope ratios were calculated using the ‘cdom’ package for R [53].
We focus on five optical indices of CDOM: (i) the spectral absorption coefficient (aλ), which has been used as a proxy of dissolved carbon concentrations [54], (ii) the SR, which indicates relative differences in the average molecular weight (MW) of CDOM [51], (iii) the biological index (BIX) [55] to determine the recent autochthonous contribution of CDOM, (iv) the fluorescence index (FI), which is a tracer of the origin of fluorescent CDOM [56], and (v) the humification index (HIX) for the humic content of the DOM [55]. These indices were calculated with the “eemR” package version 1.0.1 for R [57] (downloaded from https://github.com/PMassicotte/eemR, accessed on 20 January 2022). Packages ‘eemR’ and ‘cdom’ were run with R version 3.6.1 [46].
Canonical variant analysis (CVA) was used to identify the degree of discrimination between species according to the significant predictor variables. Redundancy analysis (RDA) was used to evaluate the statistical significance of the effect of the IC and EC compounds and species (explanatory variables) on the spectroscopic characteristics of dissolved organic matter (dependent variables). Prior to running the RDA analysis, all dependent variables were transformed to unit variance. RDA was performed under the stepwise regression modality using inclusion probabilities corrected by Bonferroni. A Monte Carlo permutation test with 9999 permutations was used to assess potential predictor variables [58]. All statistical analyzes were performed using XLSTAT (v2019.2, Addinsoft, NY, USA) and Canoco software v5.12.

3. Results

3.1. Phenotypic and Genotypic Identification of the Strains

Strain’s identity was determined by sequence comparison in the NCBI-16S rRNA database (Table 1).
Nine species of Bacillus were identified, including Psychrobacillus insolitus and two species of Paenibacillus. The P. polymyxa species was isolated from both production systems (FW and SW). The results of the phenotypic characterization, including 22 biochemical tests, are shown in Table 2. Of the twelve strains identified, 45.5% showed the ability to use glucose as a carbon source, 36.4% used citrate, and 18.1% used both carbon sources.

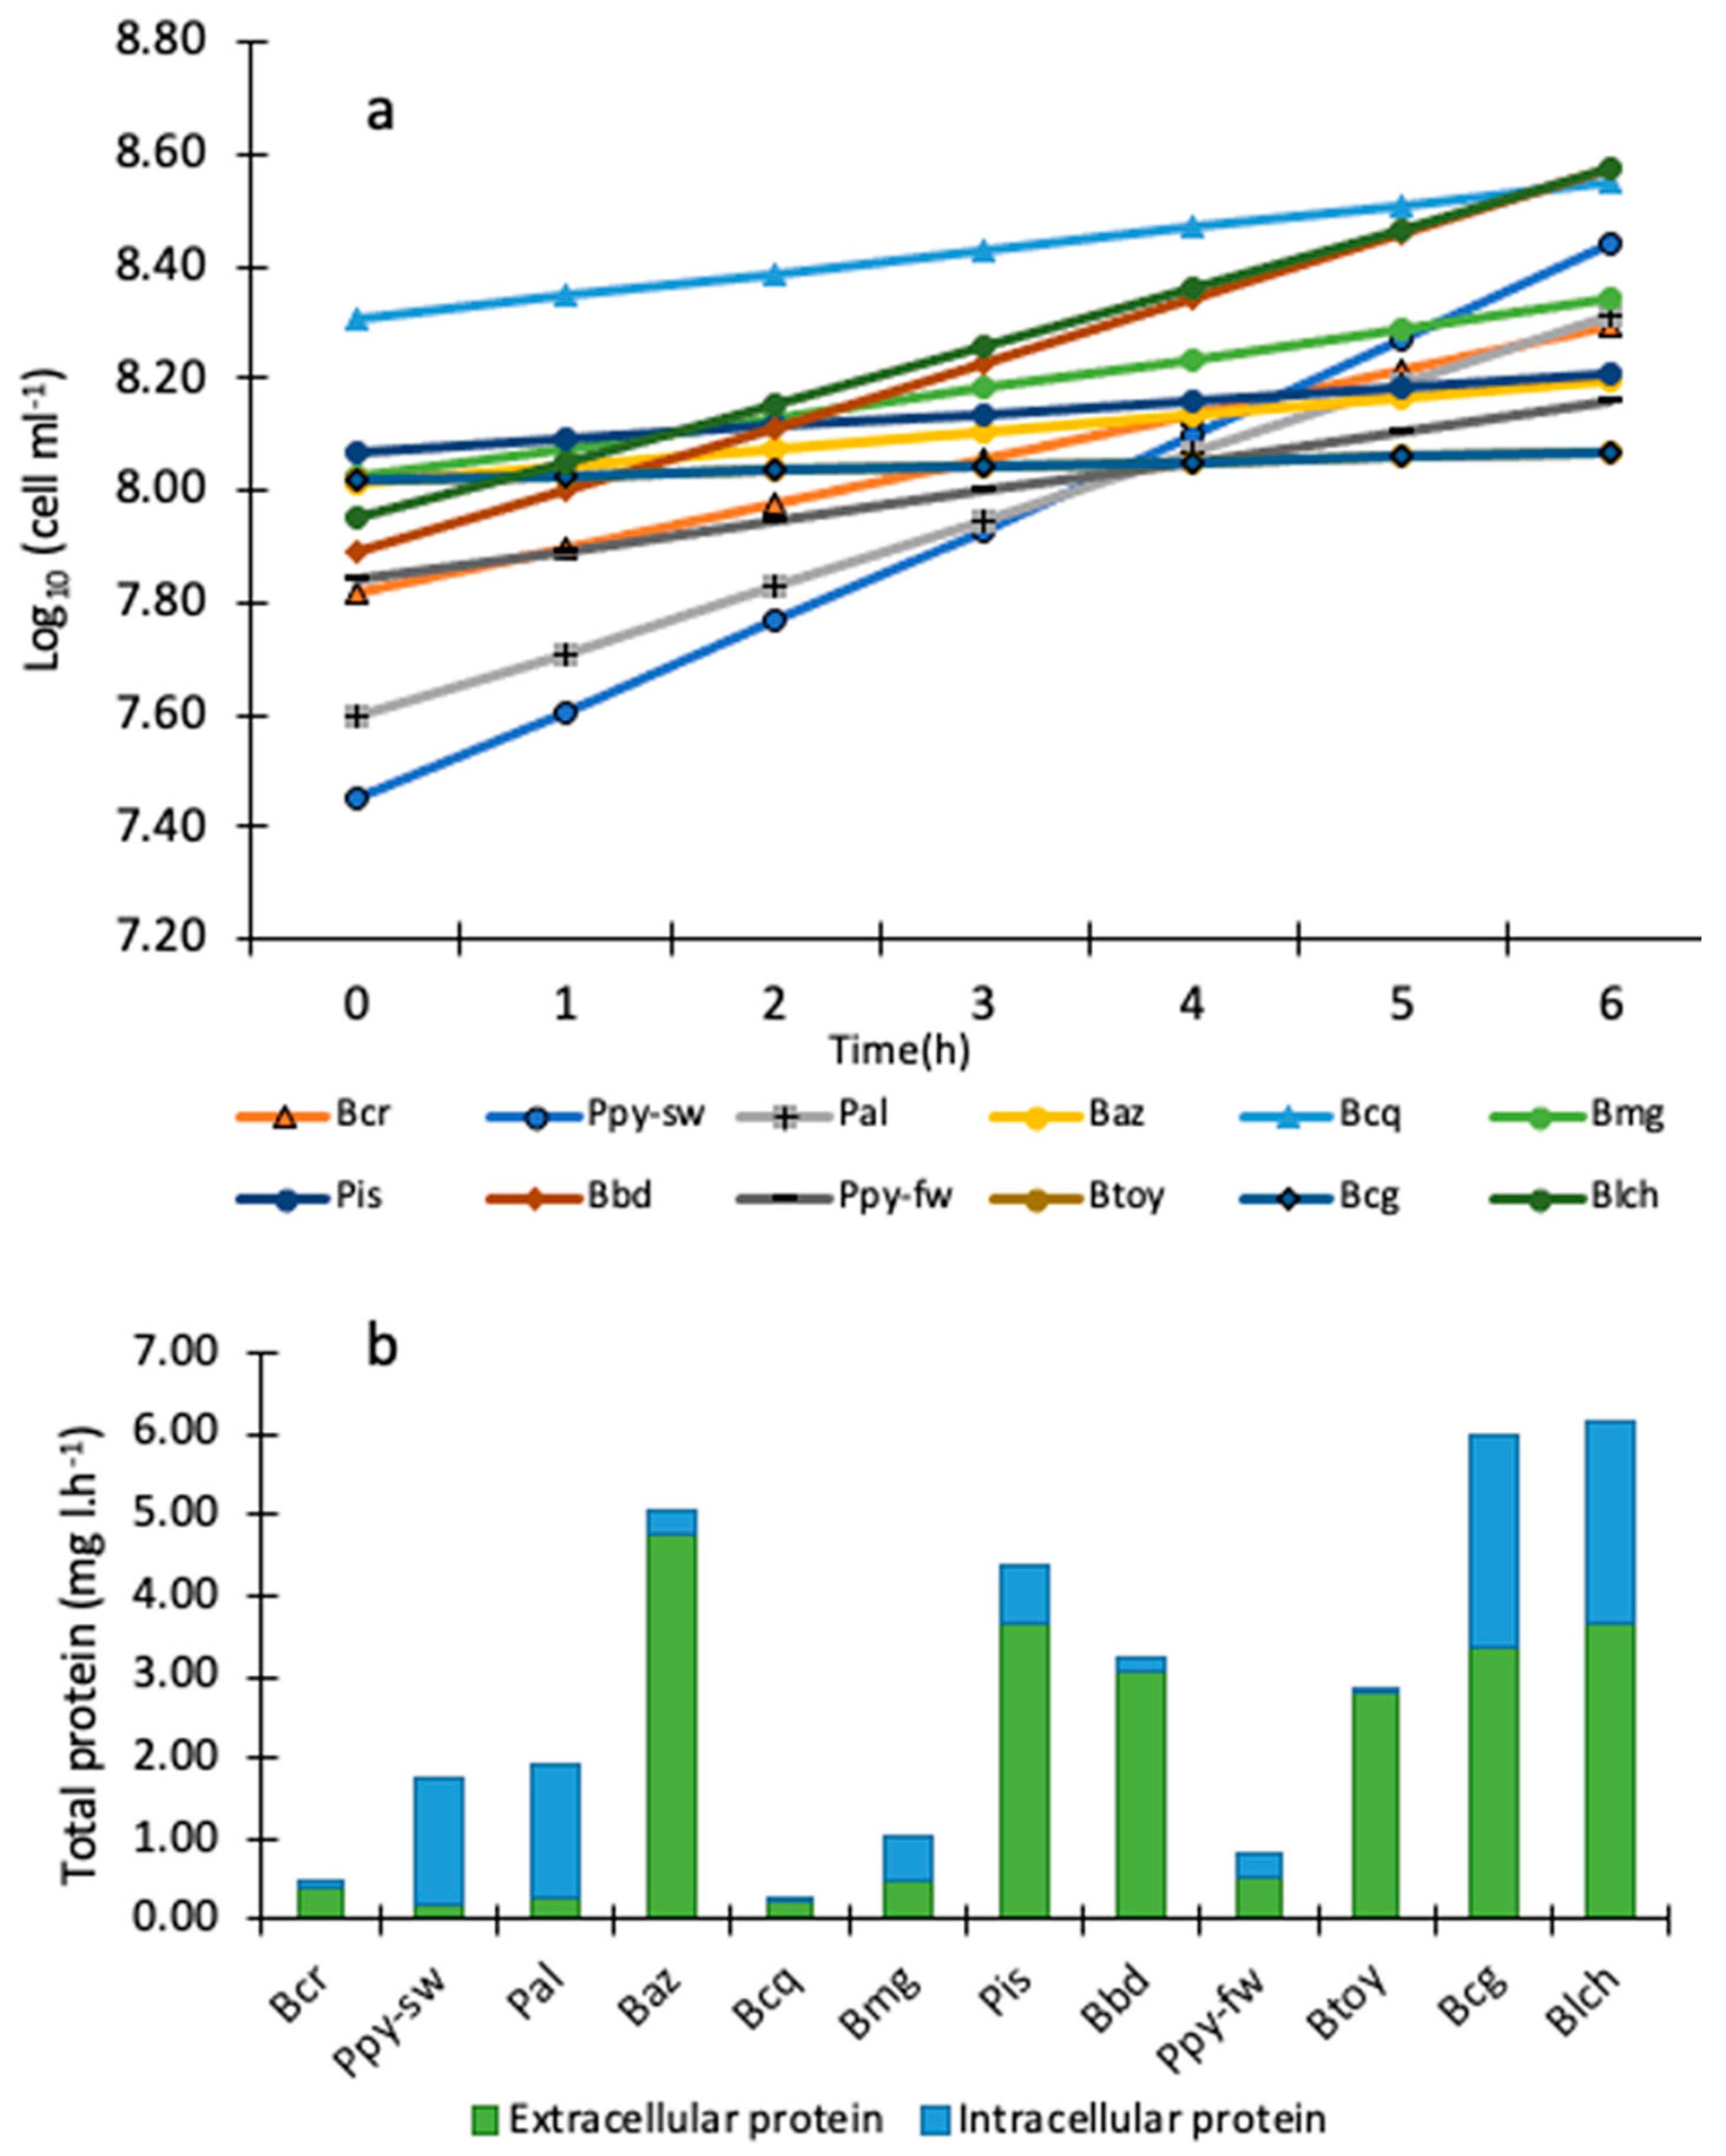
3.2. Exponential Bacterial Growth

Figure 1 shows (a) exponential bacterial growth as a function of time and (b) total intracellular and extracellular protein concentration. The growth function, including the parameter K, is shown in Table 3. P. alvei and B. badius presented the highest generation time (0.0151 h and 0.0138 h, respectively). B. toyonensis had the slowest growth rate (0.0009 h), reaching log10 8.07 cells mL−1 after 7 h.
In general, the EC protein concentration was higher than the IC in most bacteria, except for strains of the genus Paenibacillus. IC protein was 82% in P. polymyxa-SW and P. alvei. The EC protein reached 80% of B. cereus, B. azotoformans, B. macquariensis, P. insolitus, B. badius, and B. toyonensis. Species such as B. megaterium, P. polymyxa-fw, B. coagulans, and B. licheniformis showed a similar percentage of IC and EC protein (Figure 1b).

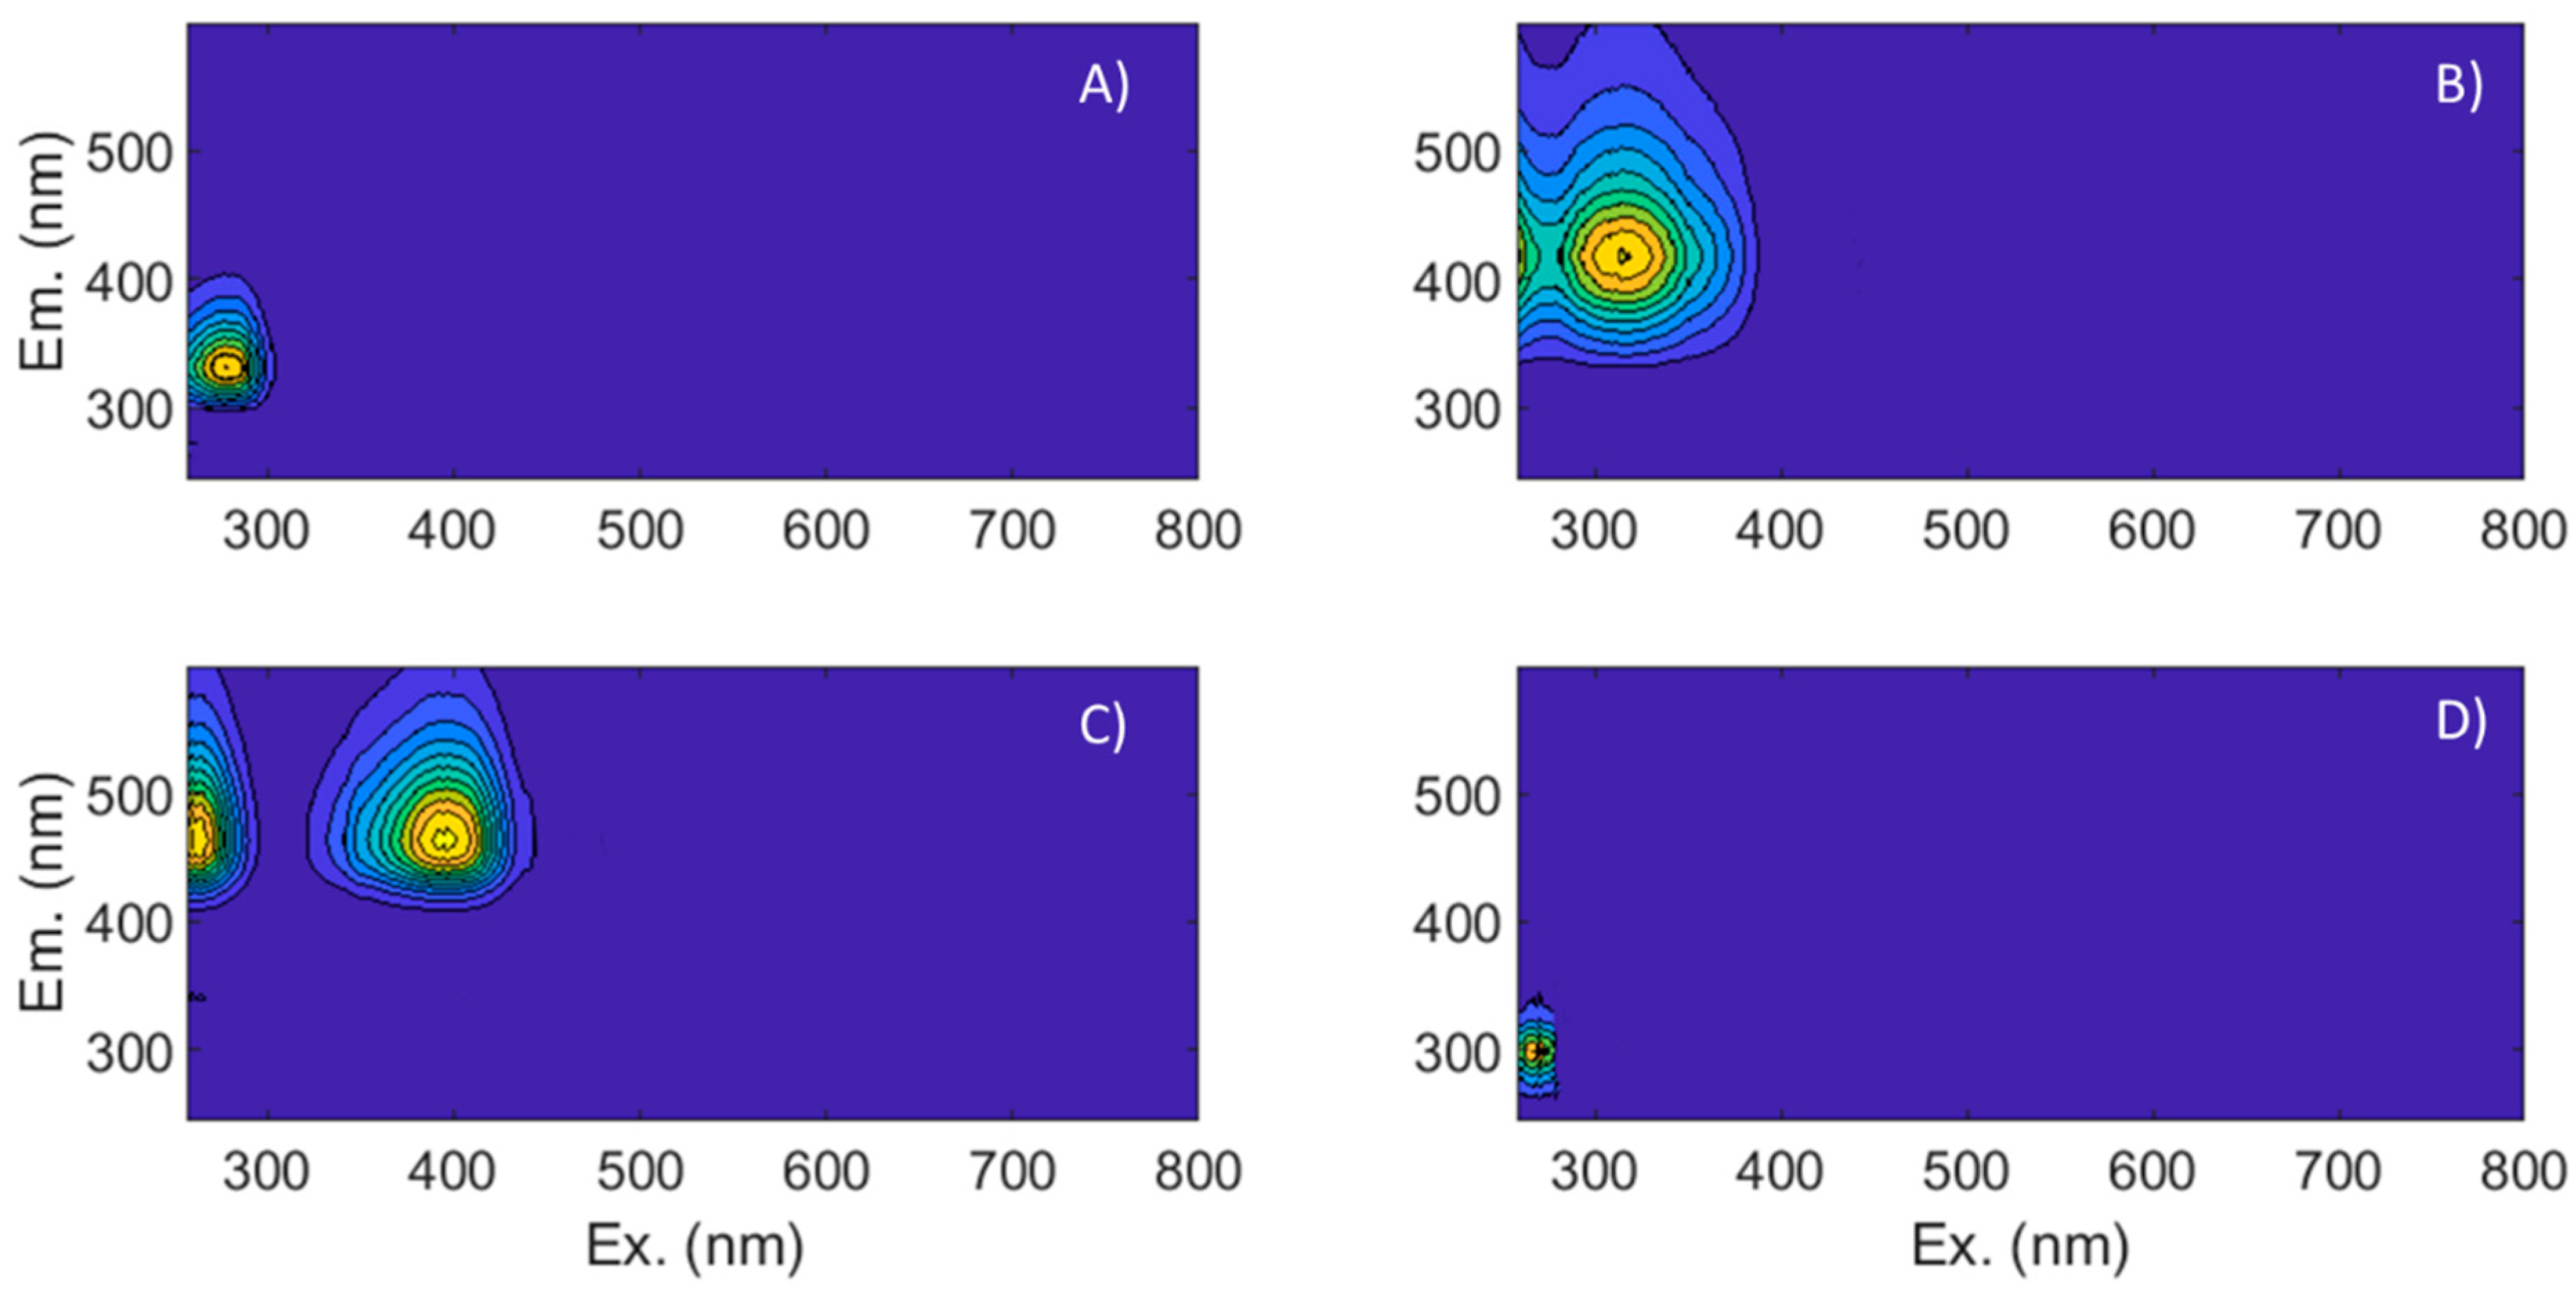
3.3. Fluorescence Characteristics and Identified Components

PARAFAC analysis indicated that the fluorescence signal can be mathematically decomposed into four independently varying fractions; the spectral loadings of all four components are shown in Appendix A. The results show two protein-type components (C1 and C4) and two humic-type components (C2 and C3). PARAFAC components obtained were compared to published spectra in the online OpenFluor database [59], and the results are shown in Table 4. Additionally, Cory and McKnight [60] interpret fluorescence in the C2 region as their microbial oxidized Q3 peak, and our C3 as their SQ2 peak, suggesting the presence of oxidized and reduced quinones.
C1 showed excitation/emission wavelengths of λexc = 275 nm/λem = 340 nm. This was associated with proteins containing tryptophan or Peak T, according to the designation by Coble [13]. C4 has excitation/emission wavelengths of λexc = 270 nm/λem = 310 nm and could not be classified using the peak definitions by Coble [18], but it was interpreted as a protein-like component in OpenFluor. C2 has excitation/emission wavelengths of λexc = 320 nm/λem = 410 nm and was associated with Coble’s peaks C and M [18], terrestrial and marine humic-like compounds. C3 was detected at λexc = 240–244 nm/λem = 510–515 nm; this component was associated with Coble’s peak A [18], which indicates that it is a substance similar to fulvic acid.

3.4. Biological Activity: Extracellular (EC) and Intracellular (IC) Bacterial Compounds

The forward selection of variables in RDA, using inclusion probabilities corrected by Bonferroni, showed that the cellular origin of the compounds (IC and EC, pseudo-F = 48.6; p < 0.0001) and the bacterial species (pseudo-F = 13.7; p = 0.0001) were significantly correlated with the spectroscopic characteristics of heterotrophic bacteria. The RDA using the first two canonical axes explained 40.56% of the total variance (Figure 2). The first axis (25.9% of total variance) explains the difference between the intracellular and extracellular components. The second canonical axis (8.3% of total variance) explains the difference between species, with Bacillus macquariensis at one end of the axis and Bacillus coagulants on the other end. Is interesting that differences between IC and EC components is larger than differences between bacterial species. Both axes are statistically significant (pseudo-F = 6.6; p = 0.0001, Monte Carlo test with 9999 permutations).
The fluorescence of C1 and C4 was 71.3% and 64.5% higher in the IC compounds than in the EC compounds. In contrast, C2 and C3 were 67.1% and 83.8% higher in EC compounds. The BIX was 54.1% higher in the IC compounds than in the EC ones, the opposite of HIX, which was 70.3% higher in the EC compounds. The absorption coefficient a350, the slope ratio (SR), the ratio of absorption coefficients (E2/E3), and S275–295, S350–400, were significantly higher in the EC compounds of all species. The fluorescence values and spectral data for each bacterium are shown in Table 5 and Table 6. No fluorescence was detected in Ringer’s medium, and no corrections were made to the sample EEMs.

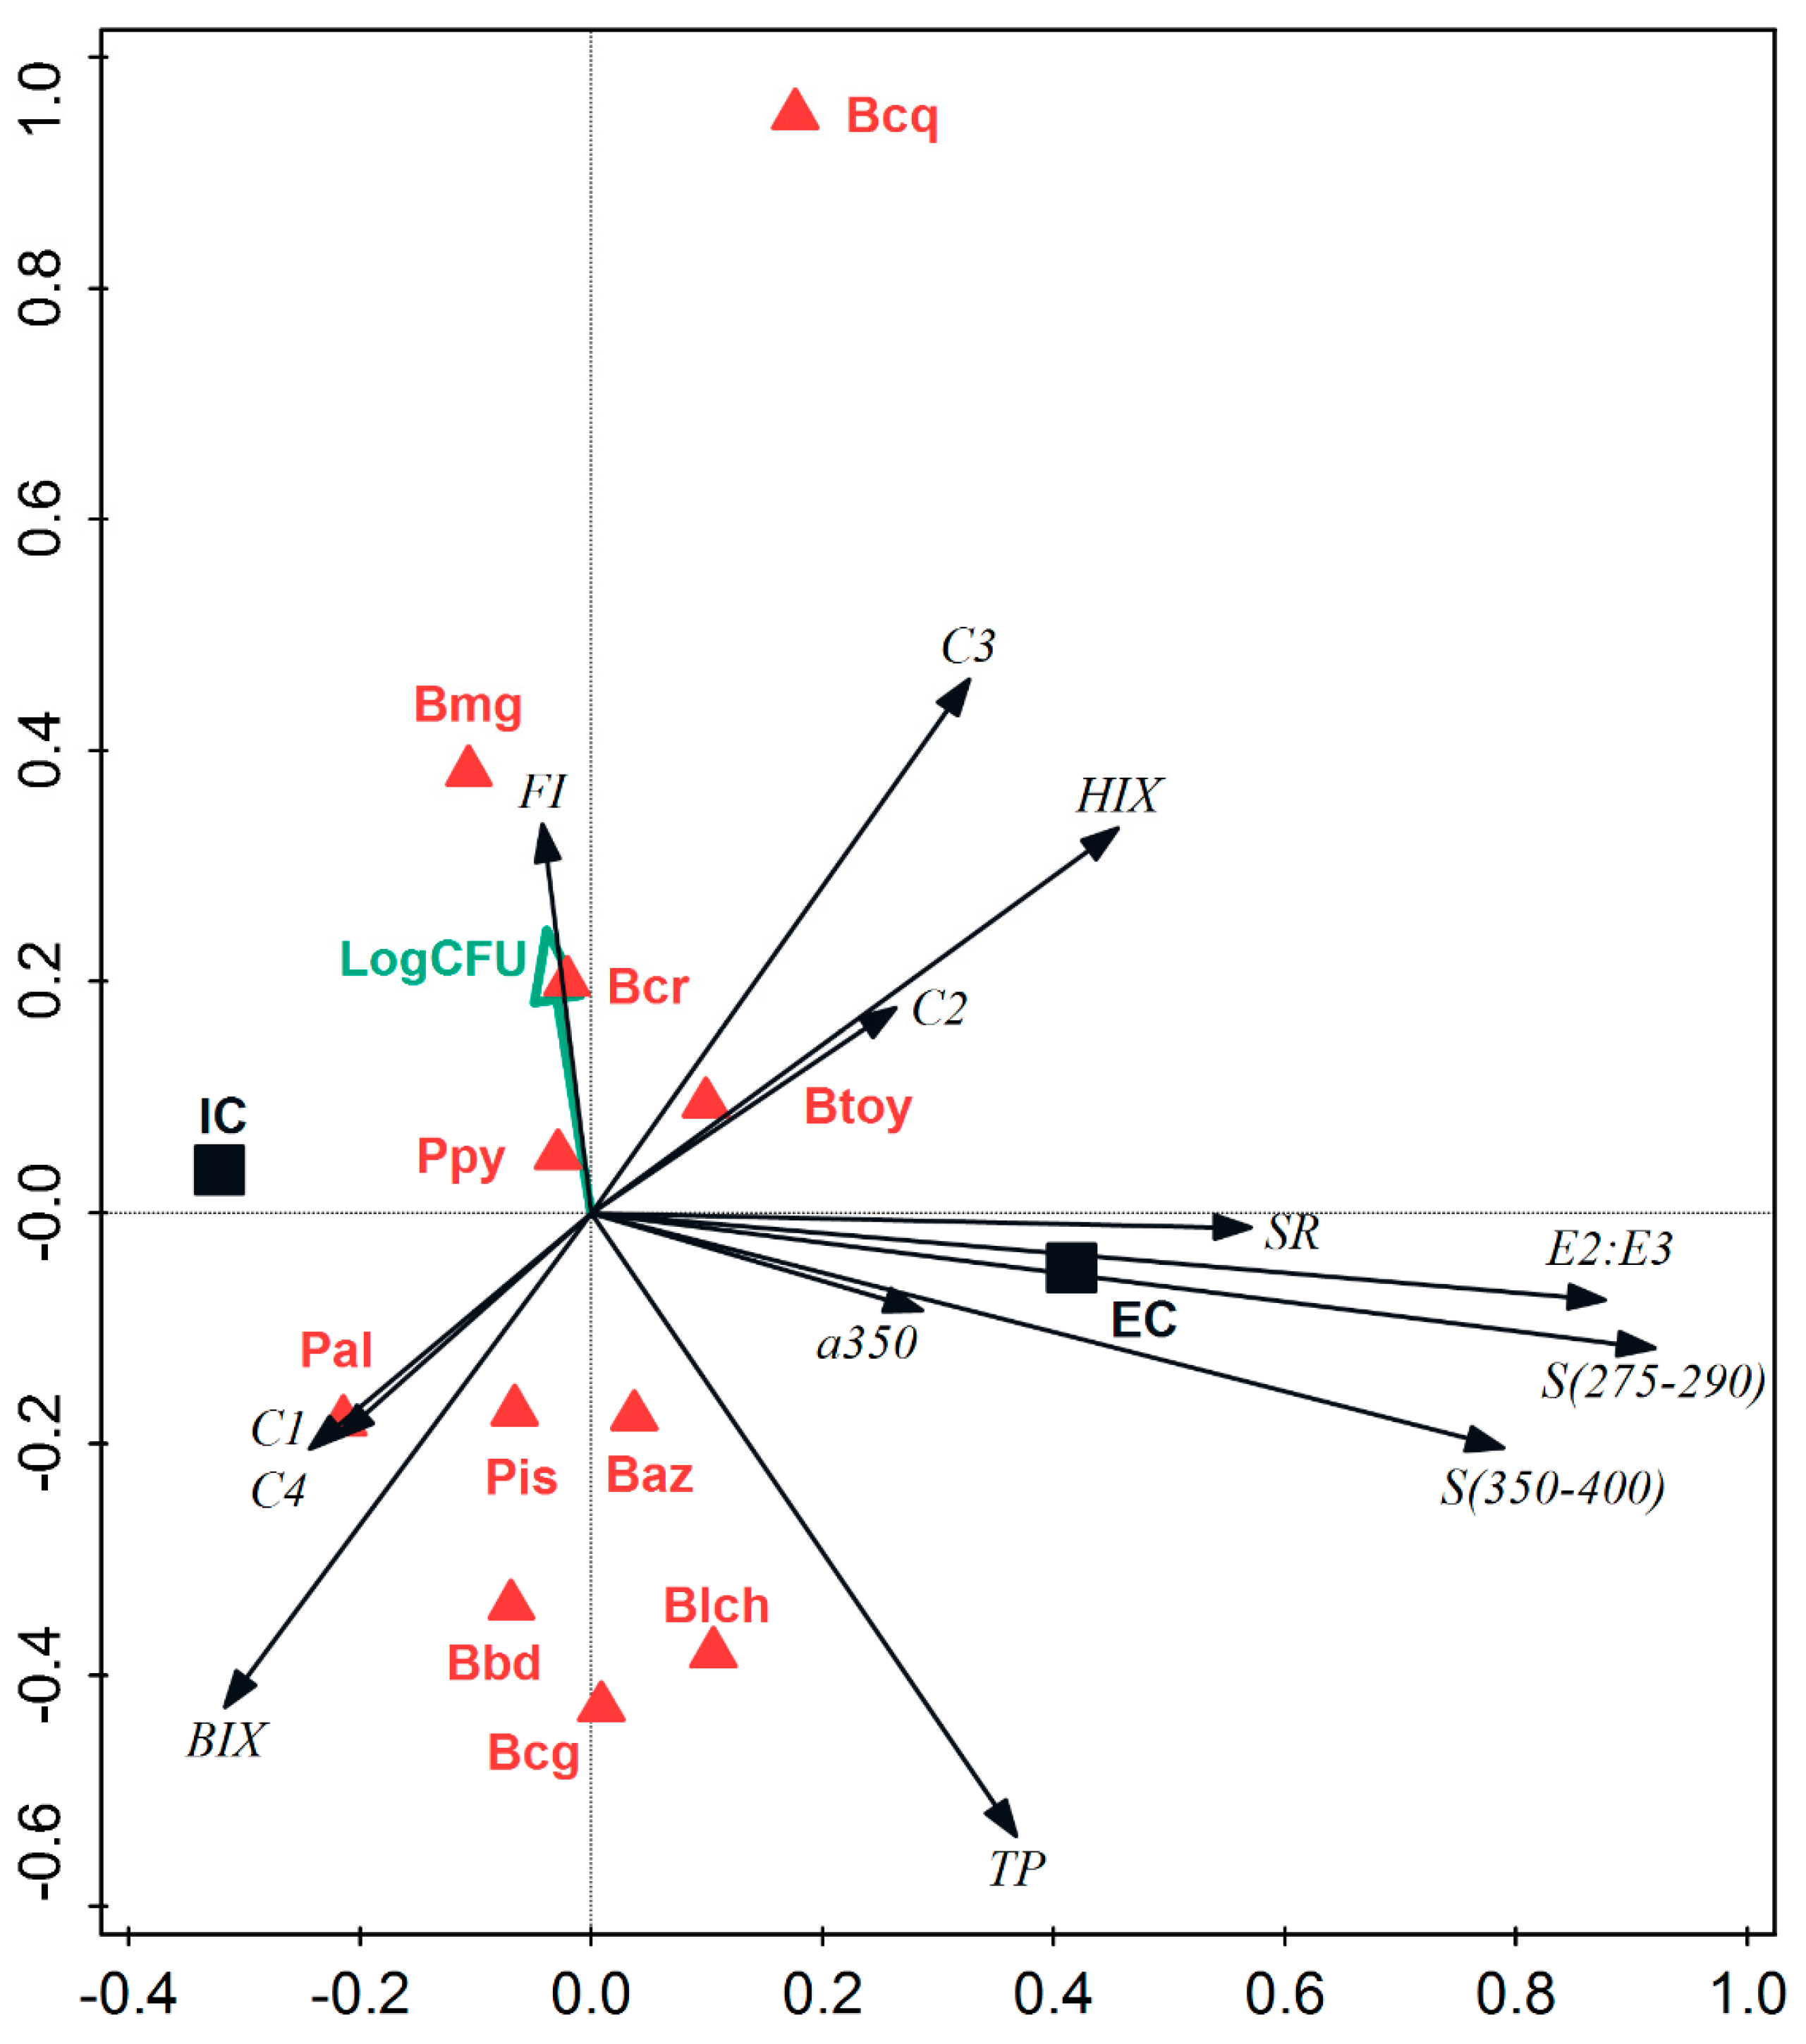
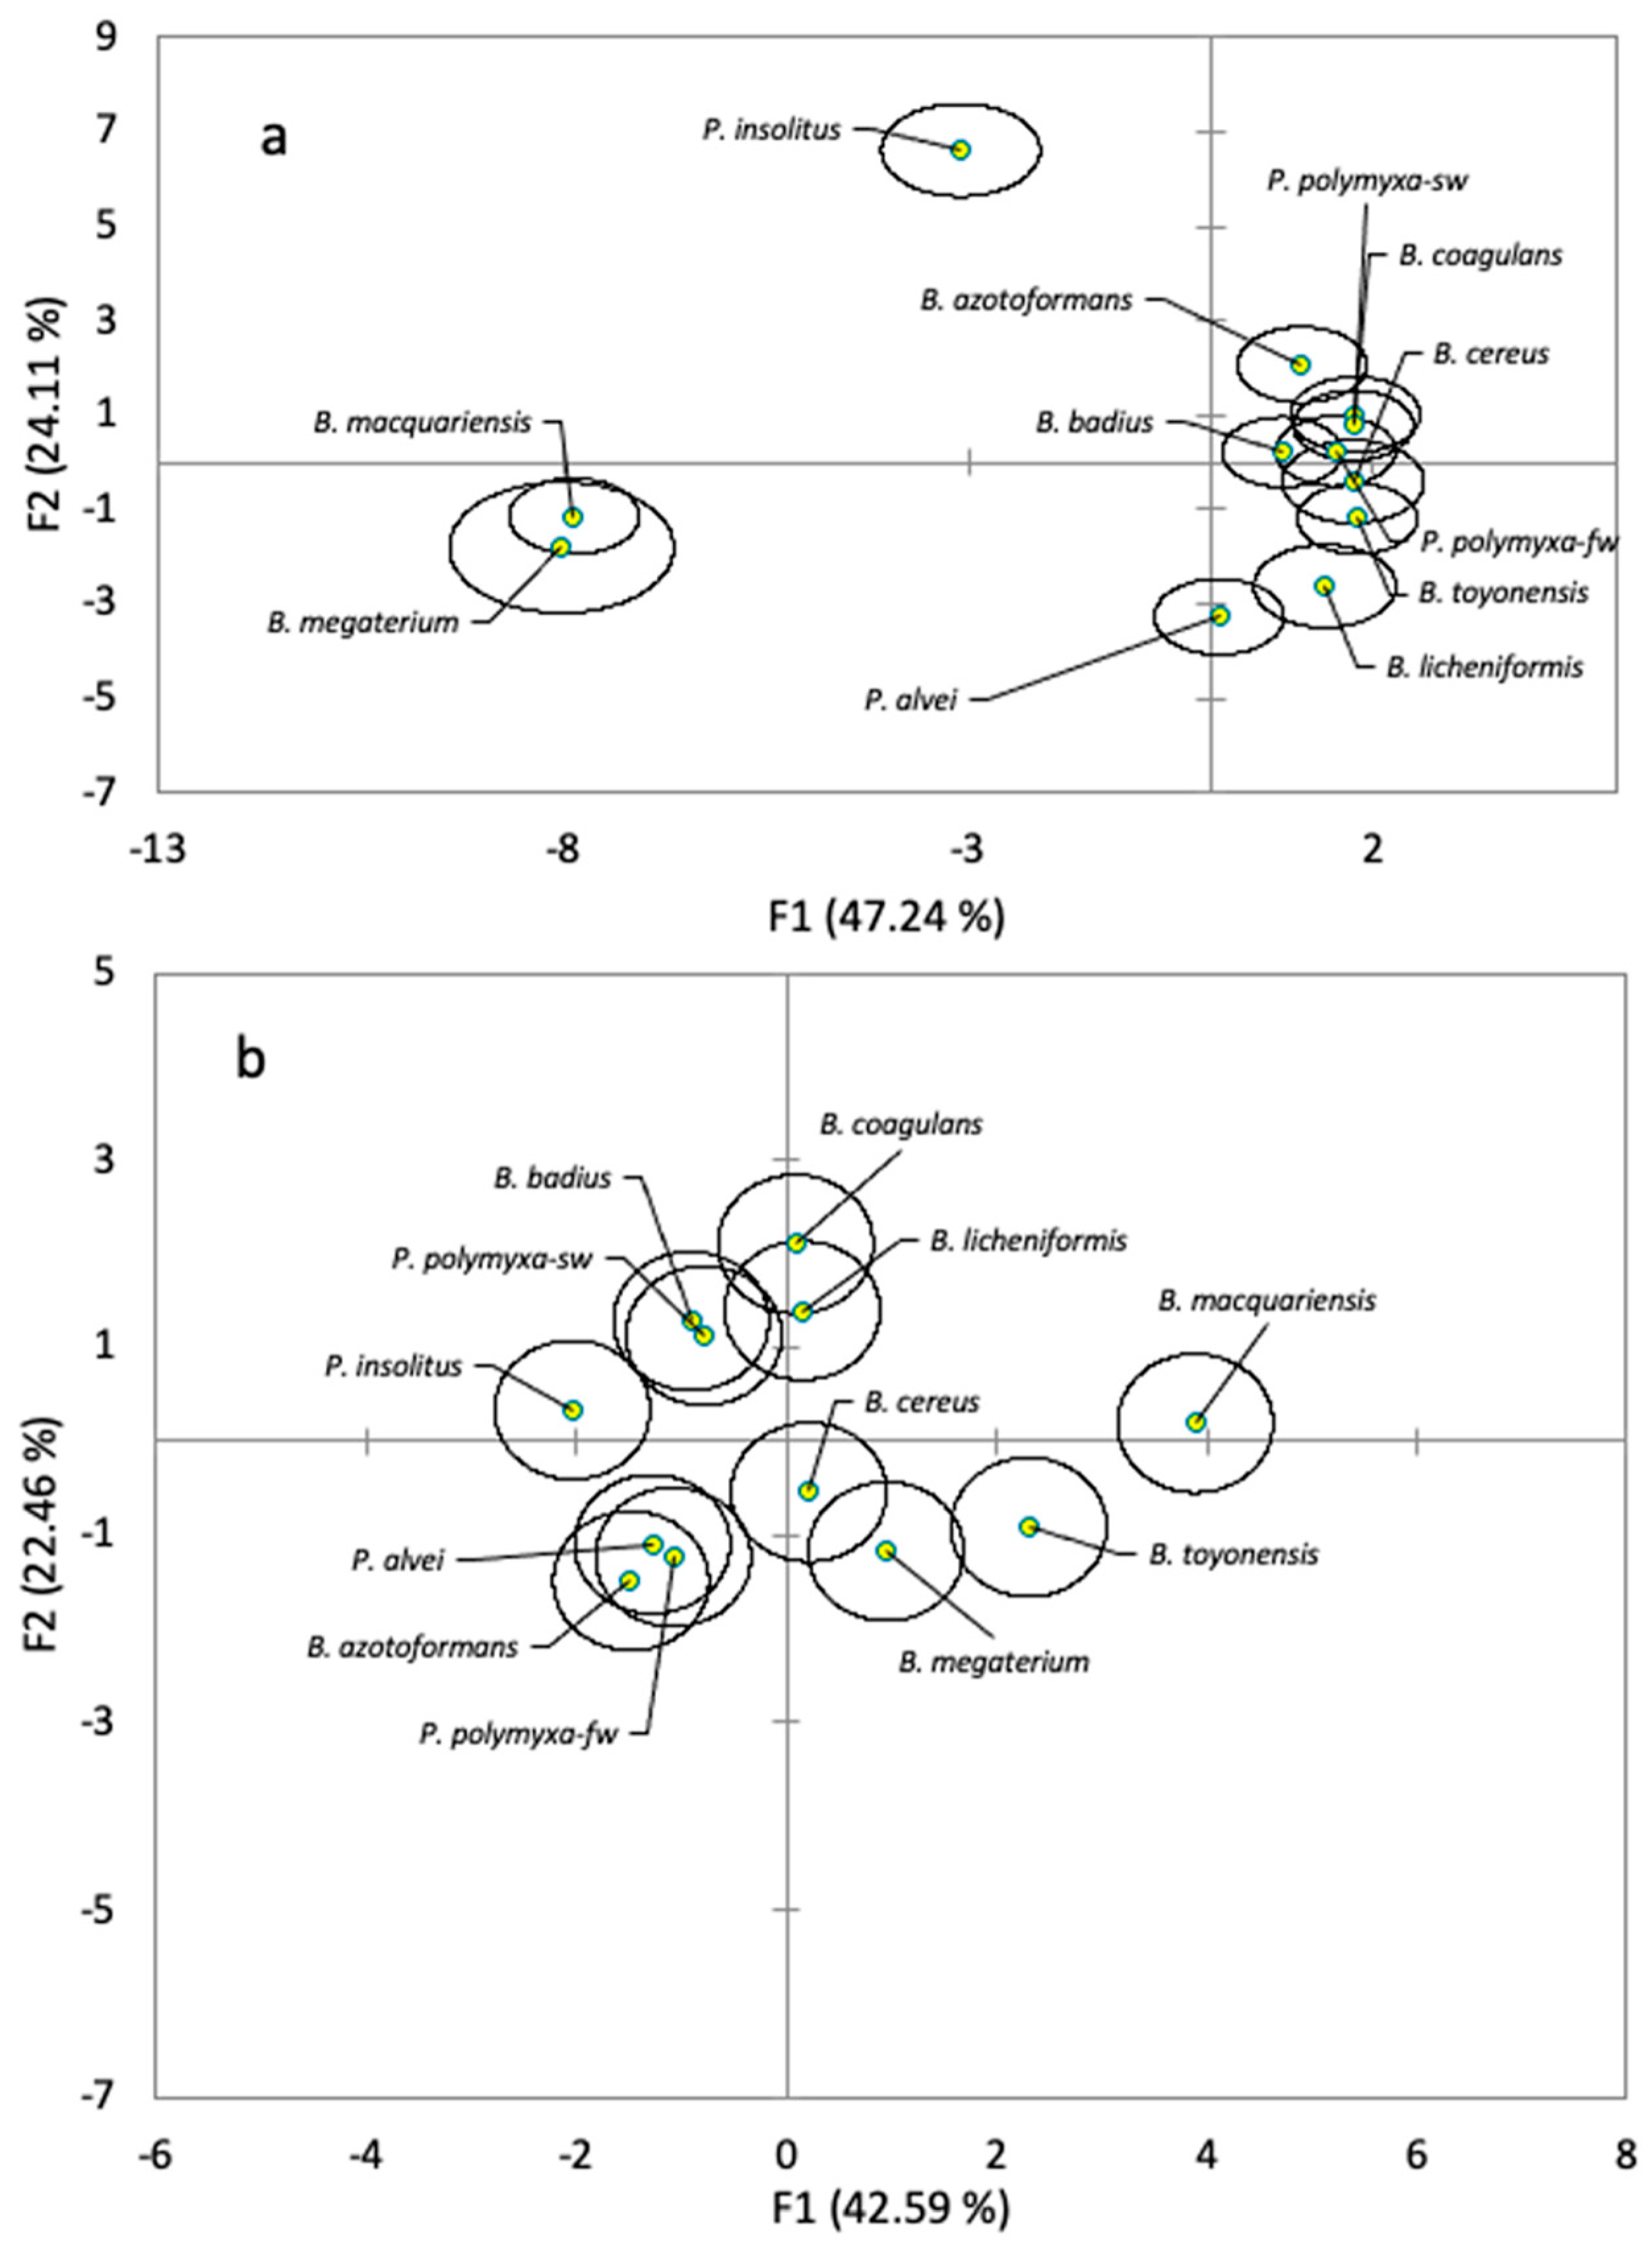
3.5. Differences between Species

The differences between the bacterial groups, according to the significance of the spectral and fluorescence predictor variables of the CVA, are shown in Figure 3. The origin of the bacteria (FW, SW) was not a significant factor in the fluorescent or spectral variables of the analyzed species, so this factor was not considered in the analysis. The strains were divided into three groups with similar EC characteristics (Figure 3a). The PARAFAC C3 component and the spectral slope S350–400 were the predictor variables that explained 86.6% of the difference between the groups (Table 7). B. macquariensis and B. megaterium were discriminated by their high C3 fluorescence (5.48 and 2.49 Raman units, respectively, Table 4). The spectral slopeS350–400 of B. licheniformis reached the highest value (0.77 nm), compared to P. insolitus, which showed the lowest EC value (0.15 nm; Table 5).
At the IC level, the FI, together with the value of BIX and SR, were the most significant predictors in the differentiation of species. Among them, they explained 78.4% of the inequality between the bacterial groups (Table 7). B. macquariensis once again stood out due to its higher IF value and the fluorescence of the C3 component (Figure 3b). The group formed by B. coagulans, B. licheniformis, B. badius, and P. polymyxa-sw were similar in their BIX value and a350. Bacteria such as P. alvei, P. polymyxa-fw, and B. azotoformans presented high SR value. P. insolitus had the lowest SR and the highest S350–400 (Table 6).

4. Discussion

The main finding of this work is the evidence of differential production of humic-type or protein-type FDOM production by HB species from marine and freshwater aquaculture systems in their intracellular and extracellular fractions, as well as CDOM with different relative molecular weights. Some bacteria, such as B. azotoformans, B. coagulans, and B. licheniformis, showed a high production of total protein per unit of time, although not necessarily associated with a fluorescent protein. Other species, such as B. badius, B. macquariensis, B. megaterium, and P. alvei, stood out for their high FDOM production at IC and EC levels. PARAFAC components C1 and C4 were associated with protein-like components and C2 and C3 with humic-like components. The highest percentage of C1 and C4 was present at the IC level, whereas the most significant amount of humic acid (C2 and C3) was present at the EC level. A similar finding was reported by Fox et al. [25] for other environmental microorganisms such as Escherichia coli, Bacillus subtilis, and Pseudomonas aeruginosa. These authors revealed that the highest intensity of microbial fluorescence occurs in the IC space and may be associated with the presence of structural or functional biological molecules. Kallenbach et al. [69] reported that humic-type FDOM are molecules released extracellularly by bacterial cells, which agrees with our findings. In the present study, the main groups of organic fluorophores that showed fluorescence in HB are attributed to humic and fulvic acids (with blue fluorescence), as well as to the group of proteins (with UV fluorescence); this group consists of three dissolved fluorescent amino acids tryptophan, tyrosine, and phenylalanine. These findings suggest that some bacterial species are promising in providing essential amino acids for growing aquaculture organisms, and others have their main function as recyclers of organic matter.
B. macquariensis and B. megaterium release large amounts of extracellular humic-type FDOM, which was previously associated with the presence of polymeric molecules considered both chemically and biologically refractory [70]. In fact, the FI, which provides information on the source or degree of DOM degradation [71], was significantly higher in B. macquariensis, which makes this bacterium a candidate for in vitro culture and inoculation in heterotrophic aquaculture systems or even in biological biofilters to maintain water quality. B. macquariensis has been previously investigated for its high capacity to secrete extracellular xylanase, which is involved in the degradation of some components of the animal diet, such as cellulose [72,73]. This makes us think that this strain would be recycling part of the food not consumed by aquatic organisms.
B. megaterium synthesizes polymeric substances such as polyhydroxyalkanoates (PHA) that accumulate as cytoplasmic inclusions when they are grown on substrates rich in carbon sources [74]. Heterotrophic aquaculture production systems require the continuous addition of supplementary sources of carbohydrates in the water, which could stimulate the metabolism of PHA-producing species, explaining the high value of fluorescence. Other studies will be required to know the role of components C1 and C3 as possible indicators of the content of PHA present in aquaculture effluents.
The spectral and fluorescence EC characteristics between the microorganims were similar (63.3%). The main differences occurred at the IC level, mainly due to the contribution of two significant predictors, FI and BIX (<0.0001) (Figure 3b, Table 7). Bacteria such as B. coagulans, B. licheniformes, B. badius, and P. alvei stood out for their high value of intracellular BIX; these bacteria also generate a high concentration of cellular protein (Figure 1b). The BIX-CI close to 1 (1.05 ± 0.03) suggests recent and active CDOM production [56,75]. The high fluorescence of the C1 component in this group of microorganisms reflects the production of protein-like substances. These characteristics make them interesting candidates for the nutritional supplementation of omnivorous aquatic species. It is known that B. badius can colonize and remain in the intestine of tilapias cultured in biofloc at values ranging between 80 and 170 CFU/mL [76]. B. licheniformis produces enzymes that are released at the EC level, such as α-amylase (58.4 kDa) and alkaline proteases, called subtilisins (20–45 kDa) [77,78]. These enzymes could contribute to the enzymatic digestion process and favor the assimilation of food in cultured organisms. P. alvei was another interesting microorganism, which showed a high fluorescence of the C1 and C4 components, both of protein type. This microorganism produces flocculant polysaccharides composed of aminosugars and peptides with Gram (-) antimicrobial activity [79,80], which are possibly the origin of the fluorescence.
The extracellular spectral characteristics of P. insolitus differed from the rest of the bacteria (Figure 3). This strain showed an inverse relationship between S275–295 and S350–400 in the IC and EC fractions (Table 6), suggesting differences in the relative molecular weight or aromaticity [81] of these two fractions. For this species, the EC fraction has a higher S275–295 than the S350–400 value, with the opposite being true for the IC fraction. These characteristics mainly differentiated P. insolitus from bacteria such as B. licheniformis and P. alvei, both with high S350–400 EC compared to the rest. The spectral slope values calculated for a small wavelength range for UVB (275–295 nm) and S values for UVB and UVA (350–400 nm) correlate negatively with molecular weight and photochemistry of exposure to degradation [51,52,81]. This suggests that P. insolitus releases more low molecular weight extracellular molecules. The opposite occurs with B. licheniformis and P. alvei. There is not much information about the substances that P. insolitus can synthesize, which makes it difficult to understand their role in aquaculture systems. It is known that P. alvei eliminate the chlorophenol compounds that originate from lignin residues present in the food [82]. This function suggests that it would have an essential role in water bioremediation.

5. Conclusions

FDOM production varies between bacterial species, and this study provides evidence that freshwater and marine heterotrophic microbes can produce CDOM with different characteristics in their IC and EC fractions. The main groups of organic fluorophores that showed fluorescence at the extracellular level are attributed to humic and fulvic acids and at the intracellular level to the group of proteins represented by tryptophan, tyrosine, and phenylalanine. B. badius produced a high amount of protein-type FDOM; B. macquariensis and B. megaterium were shown to produce and release a high quantity of humic-type FDOM into the medium. P. insolitus presented unique spectral characteristics releasing low molecular weight extracellular molecules into the medium. For aquaculture, these findings suggest that some bacterial species are promising in providing essential amino acids for growing organisms, and others play their main role in the exchange of nutrients and the global carbon cycle.

Author Contributions

Conceptualization, M.G.-K. and G.G.-B.; methodology, M.G.-K., G.G.-B. and M.J.S.-S.; formal analysis, M.G.-K. and G.G.-B., writing—original draft preparation, M.G.-K. and G.G.-B.; writing—review and editing, M.G.-K., G.G.-B. and M.J.S.-S. All authors have read and agreed to the published version of the manuscript.

Funding

This work was supported by grants from the National Science and Technology Council (CONACYT, MX) (000009-01EXTV-00076).

Institutional Review Board Statement

Not applicable.

Informed Consent Statement

Not applicable.

Data Availability Statement

The data presented in this study are available on request from the corresponding author.

Acknowledgments

The authors wish to acknowledge the contributions of Stiene Beyens from Rhine-Waal University of Applied Science (Kleve, Germany), José G. García Gutierrez from Instituto Superior de Los Reyes (Michoacán, Mexico), M. Teresita Cantún Ruelas and Alejandra C. González Coello from University Marist of Merida (Mérida, Mexico) for their assistance in laboratory analysis and the field experiment. We are grateful to F. Espinosa Faller for his support for this research. Thank you to the two anonymous reviewers; their suggestions greatly improved our paper.

Conflicts of Interest

The authors declare no conflict of interest.

Appendix A

Figure A1. Excitation-emission matrices (EEMs) for the four PARAFAC components obtained in this study. (A) Component 1 (protein-like), (B) Component 2 (humic-like), (C) Component 3 (humic-like), and (D) Component 4 (protein-like).
Jmse 10 00672 g0a1
Figure A2. Half-split validation of the four PARAFAC components: (A) excitation spectra, and (B) emission spectra. All splits agree with a Tucker congruence coefficient higher than 0.95.
Jmse 10 00672 g0a2

References

  1. Buchan, A.; LeCleir, G.R.; Gulvik, C.A.; González, J.M. Master recyclers: Features and functions of bacteria associated with phytoplankton blooms. Nat. Rev. Microbiol. 2014, 12, 686–698. [Google Scholar] [CrossRef] [PubMed]
  2. Carlson, C.A.; Giorgio, P.A.D.; Herndl, G.J. Microbes and the dissipation of energy and respiration: From cells to ecosystems. Oceanography 2007, 20, 89–100. [Google Scholar] [CrossRef]
  3. Andrews, S.C.; Robinson, A.K.; Rodríguez-Quiñones, F. Bacterial iron homeostasis. FEMS Microbiol. Rev. 2003, 27, 215–237. [Google Scholar] [CrossRef]
  4. Gram, L.; Grossart, H.P.; Schlingloff, A.; Kiorboe, T. Possible quorum sensing in marine snow bacteria: Production of acylated homoserine lactones by Roseobacter strains isolated from marine snow. Appl. Environ. Microbiol. 2002, 68, 4111–4116. [Google Scholar] [CrossRef] [PubMed] [Green Version]
  5. Smith, D.C.; Simon, M.; Alldredge, A.L.; Azam, F. Intense hydrolytic enzyme-activity on marine aggregates and implications for rapid particle dissolution. Nature 1992, 359, 139–142. [Google Scholar] [CrossRef]
  6. De Vos, P.; Garrity, G.; Jones, D.; Krieg, N.R.; Ludwig, W.; Rainey, F. Bergey’s Manual of Systematic Bacteriology. In The Firmicutes; Springer Science & Business Media: Berlin, Germany, 2011; Volume 3. [Google Scholar]
  7. Shimotori, K.; Watanabe, K.; Hama, T. Fluorescence characteristics of humic-like fluorescent dissolved organic matter produced by various taxa of marine bacteria. Aquat. Microb. Ecol. 2012, 65, 249–260. [Google Scholar] [CrossRef] [Green Version]
  8. Noriega-Ortega, B.E.; Wienhausen, G.; Mentges, A.; Dittmar, T.; Simon, M.; Niggemann, J. Does the chemodiversity of bacterial exometabolomes sustain the chemodiversity of marine dissolved organic matter? Front. Microbiol. 2019, 10, 215. [Google Scholar] [CrossRef] [PubMed] [Green Version]
  9. Guillemette, F.; del Giorgio, P.A. Simultaneous consumption, and production of fluorescent dissolved organic matter by lake bacterioplankton. Environ. Microbiol. 2012, 14, 1432–1443. [Google Scholar] [CrossRef]
  10. Thompson, S.K.; Cotner, J.B. P-limitation drives changes in DOM production by aquatic bacteria. Aquat. Microb. Ecol. 2020, 85, 35–46. [Google Scholar] [CrossRef]
  11. Avnimelech, Y. Carbon/nitrogen ratio as a control element in aquaculture systems. Aquaculture 1999, 176, 227–235. [Google Scholar] [CrossRef]
  12. Milstein, A.; Avnimelech, Y.; Zoran, M.; Joseph, D. Growth performance of hybrid bass and hybrid tilapia in conventional and active suspension intensive ponds. Isr. J. Aquac. Bamidgeh 2001, 53, 147–157. [Google Scholar] [CrossRef]
  13. Suárez-Puerto, B.; Delgadillo-Díaz, M.; Sánchez-Solís, M.J.; Gullian-Klanian, M. Analysis of the cost-effectiveness and growth of Nile tilapia (Oreochromis niloticus) in biofloc and green water technologies during two seasons. Aquaculture 2021, 538, 736534. [Google Scholar] [CrossRef]
  14. De Schryver, P.; Crab, R.; Defoirdt, T.; Boon, N.; Verstraete, W. The basics of bio-flocs technology: The added value for aquaculture. Aquaculture 2008, 277, 125–137. [Google Scholar] [CrossRef]
  15. Gullian Klanian, M.; Delgadillo Díaz, M.; Sánchez Solís, M.J.; Aranda, J.; Moreno Moral, P. Effect of the content of microbial proteins and the poly-β-hydroxybutyric acid in biofloc on the performance and health of Nile tilapia (Oreochromis niloticus) fingerlings fed on a protein-restricted diet. Aquaculture 2020, 519, 602–612. [Google Scholar] [CrossRef]
  16. Attermeyer, K.; Hornick, T.; Kayler, Z.E.; Bahr, A.; Zwirnmann, E.; Grossart, H.-P.; Premke, K. Enhanced bacterial decomposition with increasing addition of autochthonous to allochthonous carbon without any effect on bacterial community composition. Biogeosciences 2014, 11, 1479–1489. [Google Scholar] [CrossRef] [Green Version]
  17. Stedmon, C.A.; Markager, S.; Kaas, H. Optical properties and signatures of chromophoric dissolved organic matter (CDOM) in Danish coastal waters. Estuar. Coast. Shelf Sci. 2000, 51, 267–278. [Google Scholar] [CrossRef]
  18. Coble, P.G. Characterization of marine and terrestrial DOM in seawater using excitation-emission matrix spectroscopy. Mar. Chem. 1996, 51, 325–346. [Google Scholar] [CrossRef]
  19. Coble, P.G. Marine optical biogeochemistry: The chemistry of ocean color. Chem. Rev. 2007, 107, 402–418. [Google Scholar] [CrossRef]
  20. Kramer, G.; Herndl, G. Photo and bioreactivity of chromophoric dissolved organic matter produced by marine bacterioplankton. Aquat. Microb. Ecol. 2004, 36, 239–246. [Google Scholar] [CrossRef]
  21. Moran, M.A.; Sheldon, W.M.; Zepp, R.G. Carbon Loss and Optical Property Changes during Long-Term Photochemical and Biological Degradation of Estuarine Dissolved Organic Matter. Limnol. Oceanogr. 2010, 45, 1254–1264. [Google Scholar] [CrossRef]
  22. Shimotori, K.; Omori, Y.; Hama, T. Bacterial production of marine humic-like fluorescent dissolved organic matter and its biogeochemical importance. Aquat. Microb. Ecol. 2010, 58, 55–66. [Google Scholar] [CrossRef]
  23. Arai, K.; Wada, S.; Shimotori, K.; Omori, Y.; Hama, T. Production and degradation of fluorescent dissolved organic matter derived from bacteria. J. Oceanogr. 2018, 74, 39–52. [Google Scholar] [CrossRef]
  24. Landa, M.; Blain, S.; Christaki, U.; Monchy, S.; Obernosterer, I. Shifts in bacterial community composition associated with increased carbon cycling in a mosaic of phytoplankton blooms. ISMEJ 2016, 10, 39–50. [Google Scholar] [CrossRef] [PubMed]
  25. Fox, B.G.; Thorn, R.M.S.; Anesio, A.M.; Reynolds, D.M. The in situ bacterial production of fluorescent organic matter; an investigation at a species level. Water Res. 2017, 125, 350–359. [Google Scholar] [CrossRef]
  26. Ni, B.J.; Fang, F.; Xie, W.M.; Sun, M.; Sheng, G.P.; Li, W.H.; Yu, H.Q. Characterization of extracellular polymeric substances produced by mixed microorganisms in activated sludge with gel-permeating chromatography, excitation-emission matrix fluorescence spectroscopy measurement and kinetic modeling. Water Res. 2009, 43, 1350–1358. [Google Scholar] [CrossRef]
  27. Miao, L.; Zhang, Q.; Wang, S.; Li, B.; Wang, Z.; Zhang, S.; Zhang, M.; Peng, Y. Characterization of EPS compositions and microbial community in an Anammox SBBR system treating landfill leachate. Bioresour. Technol. 2018, 249, 108–116. [Google Scholar] [CrossRef]
  28. Bai, Y.; Su, R.; Yao, Q.; Zhang, C.; Shi, X. Characterization of chromophoric dissolved organic matter (CDOM) in the Bohai Sea and the Yellow Sea using Excitation-Emission Matrix Spectroscopy (EEMs) and Parallel Factor Analysis (PARAFAC). Estuaries Coasts. 2017, 40, 1325–1345. [Google Scholar] [CrossRef]
  29. Hou, X.; Liu, S.; Feng, Y. The autofluorescence characteristics of bacterial intracellular and extracellular substances during the operation of anammox reactor. Sci. Rep. 2017, 7, 39289. [Google Scholar] [CrossRef]
  30. Parlanti, E.; Wörz, K.; Geoffroy, L.; Lamotte, M. Dissolved organic matter fluorescence spectroscopy as a tool to estimate biological activity in a coastal zone submitted to anthropogenic inputs. Org. Geochem. 2000, 31, 1765–1781. [Google Scholar] [CrossRef]
  31. Hudson, N.; Baker, A.; Reynolds, D. Fluorescence analysis of dissolved organic matter in natural, waste and polluted waters—A review. River Res. Appl. 2007, 23, 631–649. [Google Scholar] [CrossRef]
  32. Murphy, K.R.; Stedmon, C.A.; Waite, T.D.; Ruiz, G.M. Distinguishing between terrestrial and autochthonous organic matter sources in marine environments using fluorescence spectroscopy. Mar. Chem. 2008, 108, 40–58. [Google Scholar] [CrossRef]
  33. Stedmon, C.A.; Bro, R. Characterizing dissolved organic matter fluorescence with parallel factor analysis: A tutorial. Limnol. Oceanogr. Methods 2008, 6, 572–579. [Google Scholar] [CrossRef]
  34. Hambly, A.C.; Arvin, E.; Pedersen, L.F.; Pedersen, P.B.; Seredyńska-Sobecka, B.; Stedmon, C.A. Characterising organic matter in recirculating aquaculture systems with fluorescence EEM spectroscopy. Water Res. 2015, 83, 112–120. [Google Scholar] [CrossRef] [PubMed]
  35. Gullian-Klanian, M.; Gold-Bouchot, G.; Delgadillo-Díaz, M.; Aranda, J.; Sánchez-Solís, M.J. Effect of the use of Bacillus spp. on the characteristics of dissolved fluorescent organic matter and the phytochemical quality of Stevia rebaudiana grown in a recirculating aquaponic system. Environ. Sci. Pollut. Res. 2021, 28, 26326–36343. [Google Scholar] [CrossRef] [PubMed]
  36. Goto, S.; Tada, Y.; Suzuki, K.; Yamashita, Y. Production and reutilization of fluorescent dissolved organic matter by a marine bacterial strain, Alteromonas macleodii. Front. Microbiol. 2017, 8, 507. [Google Scholar] [CrossRef] [PubMed] [Green Version]
  37. Goto, S.; Tada, Y.; Suzuki, K.; Yamashita, Y. Evaluation of the production of dissolved organic matter by three marine bacterial strains. Front. Microbiol. 2020, 11, 584419. [Google Scholar] [CrossRef] [PubMed]
  38. Logan, N.A.; De Vos, P. Bacillus. In Bergey’s Manual of Systematics of Archaea and Bacteria; John Wiley & Sons, Ltd.: Chichester, UK, 2015; pp. 1–163. [Google Scholar]
  39. Altschul, S.F.; Gish, W.; Miller, W.; Myers, E.W.; Lipman, D.J. Basical Local Alignment Search Tool (BLAST). J. Mol. Biol. 1990, 215, 403–410. [Google Scholar] [CrossRef]
  40. Lane, D. 16S/23S rRNA Sequencing. In Nucleic Acid Techniques in Bacterial Systematics; Stackebrandt, E., Goodfellow, M., Eds.; Wiley: New York, NY, USA, 1991; pp. 115–175. [Google Scholar]
  41. Liu, L.; Ji, M.; Wang, F.; Wang, S.; Qin, G. Insight into the influence of microbial aggregate types on nitrogen removal performance and microbial community in the anammox process—A review and meta-analysis. Sci. Total Environ. 2020, 714, 136571. [Google Scholar] [CrossRef]
  42. Ranganayaki, S.; Mohan, C. Effect of Sodium molybdate on microbial fixation of nitrogen. Zeitschrift für Allgemeine Mikrobiologie 1981, 21, 607–610. [Google Scholar] [CrossRef] [PubMed]
  43. Lowry, O.H.; Rosebrough, N.J.; Farr, A.L.; Randall, R.J. Protein measurement with the Folin phenol reagent. J. Biol. Chem. 1951, 193, 265–275. [Google Scholar] [CrossRef] [PubMed]
  44. Lawaetz, A.J.; Stedmon, C.A. Fluorescence Intensity Calibration Using the Raman Scatter Peak of Water. Appl. Spectrosc. 2009, 63, 936–940. [Google Scholar] [CrossRef] [PubMed]
  45. Pucher, M.; Wünsch, U.; Weigelhofer, G.; Murphy, K.; Hein, T.; Graeber, D. staRdom: Versatile Software for analyzing spectroscopic data of dissolved organic matter in R. Water 2019, 11, 2366. [Google Scholar] [CrossRef] [Green Version]
  46. R Development Core Team. R: A Language and Environment for Statistical Computing; R Foundation for Statistical Computing: Vienna, Austria, 2019. [Google Scholar]
  47. Murphy, K.R.; Stedmon, C.A.; Graeber, D.; Bro, R. Fluorescence spectroscopy and multi-way techniques. PARAFAC. Anal. Methods 2013, 5, 6557–6566. [Google Scholar] [CrossRef] [Green Version]
  48. Stedmon, C.A.; Markager, S. Tracing the production and degradation of autochthonous fractions of dissolved organic matter by fluorescence analysis. Limnol Oceanog. 2005, 50, 1415–1426. [Google Scholar] [CrossRef]
  49. Massicotte, P.; Asmala, E.; Stedmon, C.; Markager, S. Global distribution of dissolved organic matter along the aquatic continuum: Across rivers, lakes and oceans. Sci. Total Environ. 2017, 609, 180–191. [Google Scholar] [CrossRef] [Green Version]
  50. Loiselle, S.A.; Bracchini, L.; Cózar, A.; Dattilo, A.M.; Tognazzi, A.; Rossi, C. Variability in photobleaching yields and their related impacts on optical conditions in subtropical lakes. J. Photochem. Photobiol. B Biol. 2009, 95, 129–137. [Google Scholar] [CrossRef]
  51. Helms, J.; Stubbins, A.; Ritchie, J.D.; Minor, E.C.; Kieber, D.J.; Mopper, K. Absorption spectral slopes and slope ratios as indicators of molecular weight, source, and photobleaching of chromophoric dissolved organic matter. Limnol. Oceanogr. 2009, 53, 955–969. [Google Scholar] [CrossRef] [Green Version]
  52. Li, P.; Jin, H. Utilization of UV-Vis Spectroscopy and Related Data Analyses for Dissolved Organic Matter (DOM) Studies: A Review. Crit. Rev. Environ. Sci. Technol. 2017, 47, 131–154. [Google Scholar] [CrossRef]
  53. Massicotte, P.; Markager, S. Using a Gaussian decomposition approach to model absorption spectra of chromophoric dissolved organic matter. Mar. Chem. 2016, 180, 24–32. [Google Scholar] [CrossRef]
  54. Del Vecchio, R.; Blough, N.V. Photobleaching of chromophoric dissolved organic matter in natural waters: Kinetics and modeling. Mar. Chem. 2002, 78, 231–253. [Google Scholar] [CrossRef]
  55. Huguet, A.; Vacher, L.; Relexans, S.; Saubusse, S.; Froidefond, J.M.; Parlanti, E. Properties of fluorescent dissolved organic matter in the Gironde Estuary. Org. Geochem. 2009, 40, 706–719. [Google Scholar] [CrossRef]
  56. McKnight, D.M.; Boyer, E.W.; Westerhoff, P.K.; Doran, P.T.; Kulbe, T.; Andersen, D.T. Spectrofluorometric characterization of dissolved organic matter for indication of precursor organic material and aromaticity. Limnol. Oceanogr. 2001, 46, 38–48. [Google Scholar] [CrossRef]
  57. Massicotte, P. GitHube.com. Cánada. 2019. Available online: www.pmassicotte.com/eemr/ (accessed on 12 December 2021).
  58. ter Braak, C.J.F. Canonical community ordination. Part I: Basic theory and linear methods. Ecoscience 1994, 1, 127–140. [Google Scholar] [CrossRef]
  59. Murphy, K.R.; Stedmon, C.A.; Wenig, P.; Bro, R. OpenFluor- An online spectral library of auto-fluorescence by organic compounds in the environment. Anal. Methods 2014, 6, 658–661. [Google Scholar] [CrossRef] [Green Version]
  60. Cory, R.M.; McKnight, D.M. Fluorescence Spectroscopy Reveals Ubiquitous Presence of Oxidized and Reduced Quinones in Dissolved Organic Matter. Environ. Sci. Technol. 2005, 39, 8142–8149. [Google Scholar] [CrossRef]
  61. Cawley, K.M.; Ding, Y.; Fourqurean, J.; Jaffé, R. Characterising the sources and fate of dissolved organic matter in Shark Bay, Australia: A preliminary study using optical properties and stable carbon isotopes. Mar. Freshw. Res. 2012, 63, 1098–1107. [Google Scholar] [CrossRef] [Green Version]
  62. Yamashita, Y.; Maie, N.; Briceño, H.; Jaffé, R. Optical characterization of dissolved organic matter in tropical rivers of the Guayana Shield, Venezuela. J. Geophys. Res. Biogeosci. 2010, 115, G1. [Google Scholar] [CrossRef] [Green Version]
  63. Yamashita, Y.; Panton, A.; Mahaffey, C.; Jaffé, R. Assessing the spatial and temporal variability of dissolved organic matter in Liverpool Bay using excitation-emission matrix fluorescence and parallel factor analysis. Ocean. Dyn. 2011, 61, 569–579. [Google Scholar] [CrossRef]
  64. Cohen, E.; Levy, G.J.; Borisover, M. Fluorescent components of organic matter in wastewater: Efficacy and selectivity of the water treatment. Water Res. 2014, 55, 323–334. [Google Scholar] [CrossRef]
  65. Shakil, S.; Tank, S.E.; Kokelj, S.V.; Vonk, J.E.; Zolkos, S. Particulate dominance of organic carbon mobilization from thaw slumps on the Peel Plateau, NT: Quantification and implications for stream systems and permafrost carbon release. Environ. Res. Lett. 2020, 15, 114019. [Google Scholar] [CrossRef]
  66. Lee, S.A.; Kim, T.H.; Kim, G. Tracing terrestrial versus marine sources of dissolved organic carbon in a coastal bay using stable carbon isotopes. Biogeosciences 2020, 17, 135–144. [Google Scholar] [CrossRef] [Green Version]
  67. Kowalczuk, P.; Tilstone, G.H.; Zabłocka, M.; Röttgers, R.; Thomas, R. Composition of dissolved organic matter along an Atlantic Meridional Transect from fluorescence spectroscopy and Parallel Factor Analysis. Mar. Chem. 2013, 157, 170–184. [Google Scholar] [CrossRef] [Green Version]
  68. Murphy, K.R.; Ruiz, G.M.; Dunsmuir, W.T.M.; Waite, T.D. Optimized Parameters for Fluorescence-Based Verification of Ballast Water Exchange by Ships. Environ. Sci. Technol. 2006, 40, 2357–2362. [Google Scholar] [CrossRef]
  69. Kallenbach, C.M.; Frey, S.D.; Grandy, A.S. Direct evidence for microbial-derived soil organic matter formation and its ecophysiological controls. Nat. Commun. 2016, 7, 13630. [Google Scholar] [CrossRef] [PubMed]
  70. Findlay, S.E.; Sinsabaugh, R.L.; Sobczak, W.V.; Hoostal, M. Metabolic and structural response of hyporheic microbial communities to variations in supply of dissolved organic matter. Limnol. Oceanogr. 2003, 48, 1608–1617. [Google Scholar] [CrossRef] [Green Version]
  71. Fellman, J.B.; Hood, E.; Spencer, R.G. Fluorescence spectroscopy opens new windows into dissolved organic matter dynamics in freshwater ecosystems: A review. Limnol. Oceanogr. 2010, 55, 2452–2462. [Google Scholar] [CrossRef]
  72. Hoshino, T.; Takehashi, S.; Fujiwara, M.; Kasuya, T. Typhula maritima, a new species of Typhula collected from coastal dunes in Hokkaido, northern Japan. Mycoscience 2009, 50, 430–437. [Google Scholar] [CrossRef]
  73. Sharma, M.; Kumar, A. Optimization of xylanase secretion from Paenibacillus macquariensis. Curr. Trends Biotechnol. Pharm. 2012, 6, 190–195. [Google Scholar]
  74. Reddy, C.S.K.; Ghai, R.; Kalia, V.C. Polyhydroxyalkanoates: An overview. Bioresour. Technol. 2003, 87, 137–146. [Google Scholar] [CrossRef]
  75. Hansen, A.M.; Kraus, T.E.C.; Pellerin, B.A.; Fleck, J.A.; Downing, B.D.; Bergamaschi, D.A. Optical properties of dissolved organic matter (DOM): Effects of biological and photolytic degradation. Limnol. Oceanogr. 2016, 61, 1015–1032. [Google Scholar] [CrossRef] [Green Version]
  76. Pérez-Fuentes, J.A.; Pérez-Rostro, C.I.; Hernández-Vergara, M.P.; Monroy-Dosta, M.D.C. Variation of the bacterial composition of biofloc and the intestine of Nile tilapia Oreochromis niloticus, cultivated using biofloc technology, supplied different feed rations. Aquac. Res. 2018, 49, 3658–3668. [Google Scholar] [CrossRef]
  77. Veith, B.; Herzberg, C.; Steckel, S.; Feesche, J.; Maurer, K.H.; Ehrenreich, P.; Bäumer, S.; Henne, A.; Liesegang, H.; Merkl, R.; et al. The complete genome sequence of Bacillus licheniformis DSM13, an organism with great industrial potential. Microb. Physiol. 2004, 7, 204–211. [Google Scholar] [CrossRef] [PubMed]
  78. Rey, M.W.; Ramaiya, P.; Nelson, B.A.; Brody-Karpin, S.D.; Zaretsky, E.J.; Tang, M.; de Leon, A.L.; Xiang, H.; Gusti, V.; Clausen, I.G.; et al. Complete genome sequence of the industrial bacterium Bacillus licheniformis and comparisons with closely related Bacillus species. Genome Biol. 2004, 5, r77. [Google Scholar] [CrossRef] [PubMed] [Green Version]
  79. Anandaraj, B.; Vellaichamy, A.; Kachman, M.; Selvamanikandan, A.; Pegu, S.; Murugan, V. Co-production of two new peptide antibiotics by a bacterial isolate Paenibacillus alvei NP75. Biochem. Biophys. Res. Commun. 2009, 379, 179–185. [Google Scholar] [CrossRef] [PubMed]
  80. Abdel-Aziz, S.M.; Hamed, H.A.; Mouafi, F.E.; Abdelwahed, N.A. Extracellular metabolites produced by a novel strain, Bacillus alvei NRC-14: 3. Synthesis of a bioflocculant that has chitosan-like structure. Life Sci. J. 2011, 8, 883–890. [Google Scholar] [CrossRef]
  81. Guéguen, C.; Cuss, C.W. Characterization of aquatic dissolved organic matter by asymmetrical flow field-flow fractionation coupled to UV–Visible diode array and excitation emission matrix fluorescence. J. Chromatog. A 2011, 1218, 4188–4198. [Google Scholar] [CrossRef] [PubMed]
  82. Wang, C.C.; Lee, C.M.; Kuan, C.H. Removal of 2, 4-dichlorophenol by suspended and immobilized Bacillus insolitus. Chemosphere 2000, 41, 447–452. [Google Scholar] [CrossRef]
Figure 1. Exponential growth phase (a) and protein concentration (b) of heterotrophic bacterial species. Species key: Baz = Bacillus azotoformans, Bbd = Bacillus badius, Bcg = Bacillus coagulans, Bcq = Bacillus macquariensis, Bcr = Bacillus cereus, Blch = Bacillus licheniformis, Bmg = Bacillus megaterium, Btoy = Bacillus toyonensis, Pal = Paenibacillus alvei, Pis = Psychrobacillus insolitus, Ppy = Paenibacillus polymyxa-FW (freshwater); Ppy = P. polymyxa-SW (seawater).
Jmse 10 00672 g001
Figure 2. Redundancy analysis (RDA) showing the association between the response of the intracellular (IC) and extracellular (EC) compounds and bacterial species (independent variables) with PARAFAC components and absorbance spectral variables (response variables). Explained variance for axes 1 and 2 are shown in parentheses (pseudo-F = 6.6; p = 0.0001, Monte Carlo test with 9999 permutations). Species key: Baz = Bacillus azotoformans, Bbd = Bacillus badius, Bcg = Bacillus coagulans, Bcq = Bacillus macquariensis, Bcr = Bacillus cereus, Blch = Bacillus licheniformis, Bmg = Bacillus megaterium, Btoy = Bacillus toyonensis, Pal = Paenibacillus alvei, Pis = Psychrobacillus insolitus, Ppy = Paenibacillus polymyxa fw (freshwater); Ppy = P. polymyxa sw (seawater).
Jmse 10 00672 g002
Figure 3. Canonical variant analysis (CVA) based on extracellular (a) and intracellular (b) PARAFAC components and absorbance spectral variables (response variables). Points represent the result of the CVA regression for each strain. Eigenvalues for axes 1 and 2 are shown in parentheses (p = <0.0001). Circles (centroids) = are the multivariate average for each group calculated from the discriminant functions. Species key: Baz = Bacillus azotoformans, Bbd = Bacillus badius, Bcg = Bacillus coagulans, Bcq = Bacillus macquariensis, Bcr = Bacillus cereus, Blch = Bacillus licheniformis, Bmg = Bacillus megaterium, Btoy = Bacillus toyonensis, Pal = Paenibacillus alvei, Pis = Psychrobacillus insolitus, Ppy = Paenibacillus polymyxa fw (freshwater); Ppy = P. polymyxa sw (seawater).
Jmse 10 00672 g003
Table 1. Identification of heterotrophic bacterial species from seawater (SW) and freshwater (FW) based on information of the 16S ribosomal RNA gene.
Strain CodeClosest Phylogenetic NeighborNCBI:TxidSourceIdentity (%)
BazBacillus azotoformans1131731SW100
BbdBacillus badius1455FW99
BcgBacillus coagulans1398FW99
BcqBacillus macquariensis1468 FW100
BcrBacillus cereus226900SW100
BlchBacillus licheniformis279010FW98
BmgBacillus megaterium1348623FW100
BtoyBacillus toyonensis121761FW100
PalPaenibacillus alvei1206781SW99
PisPsychrobacillus insolitus1461FW99
PpyPaenibacillus polymyxa886882FW100
PpyPaenibacillus polymyxa886882SW99
Table 2. Phenotypic characterization of heterotrophic bacterial species.
Test NameB. macquariensisB. badiusB. coagulansB. licheniformisP. insolitusB. megateriumB. cereusP. alveiP. polymyxaP. toyonensisB. azotoformans
Gram+++++++++++
Oxidase+-+ ----+ +
Catalase + + ++++-
Citrate ++ ---+-
Swollen cell+- --+----
Voges–Proskauer--++--+-++-
β-galactosidase---- -
Lysine decarboxylase-+-- -+-+++
Ornithine decarboxylase++-- -++--+
Arginine decarboxylase++++ ++++++
Amygdalin---- +
D-arabinose--+-++-----
Lactose--++-+
Glucose--+-+-+++++
Inositol-----+-----
Mannitol---+-------
Melibious--++ -----
Rhamnose---- +-----
Sorbitol---- +----+
Urea------+---+
Starch++++++++++-
Growth in NaCl 6.5%++-++++++++
(+) = positive result to specific test, (-) = negative result to specific test.
Table 3. Exponential growth function of heterotrophic bacterial species; log10 y (cell mL−1) = Co. exp (−K·t).
BacteriaCf
(Cell mL−1)
Co
(Cell mL−1)
KR2
B. azotoformans8.1968.0130.00370.88
B. badious8.5737.8920.01380.89
B. coagulans8.0668.2530.00350.90
B. macquariensis8.5518.3070.00480.96
B. cereus8.2957.8170.00980.91
B. licheniformis8.5717.8410.00660.90
B. megaterium8.3428.0220.00650.85
B. toyonensis8.0668.0190.00090.97
P. alvei8.3117.5950.01510.98
P. insolitus8.2068.0680.00280.90
P. polymyxa-FW8.1587.8410.00650.89
P. polymyxa-SW8.4417.4480.02130.90
Co = initial concentration, Cf = final concentration K = generation time.
Table 4. Interpretation of the PARAFAC components in the OpenFluor spectral library.
ComponentInterpretationReference
C1Protein-likeCawley et al., [61]
Tryptophan-like, polyphenolsYamashita et al., [62]
Tryptophan-like, polyphenolsYamashita et al., [63]
Peak T, microbialHambly et al., [34]
C2Terrestrial humic-likeCawley et al., [61]
Marine humic-like, peak MYamashita et al., [62]
Humic-likeYamashita et al., [63]
C3Humic-likeCohen et al., [64]
Terrestrial humic/fulvic-likeShakil et al., [65]
Terrestrial humic-likeLee et al., [66]
C4Tryptophan and tyrosine-likeCawley et al., [61]
Peak T, tryptophanKowalczuk et al., [67]
Protein-likeMurphy et al., [68]
Table 5. Mean values of the PARAFAC components (Raman units ± S.E) and fluorescence indices of heterotrophic species after seven hours.
C1C2C3C4FIHIXBIX
Extracellular
compounds
Baz0.47 ± 0.100.52 ± 0.150.22 ± 0.060.39 ± 0.101.67 ± 0.031.32 ± 0.230.82 ± 0.01
Bbd0.67 ± 0.150.49 ± 0.090.18 ± 0.052.79 ± 1.491.39 ± 0.030.78 ± 0.161.04 ± 0.02
Bcg0.50 ± 0.050.51 ± 0.020.18 ± 0.010.88 ± 0.611.55 ± 0.021.21 ± 0.140.91 ± 0.01
Bcq1.64 ± 0.360.33 ± 0.095.48 ± 1.150.49 ± 0.101.52 ± 0.013.50 ± 0.900.63 ± 0.09
Bcr0.32 ± 0.050.29 ± 0.060.13 ± 0.030.14 ± 0.021.45 ± 0.051.06 ± 0.130.96 ± 0.03
Blch0.29 ± 0.030.31 ± 0.050.19 ± 0.040.36 ± 0.131.30 ± 0.011.79 ± 0.170.79 ± 0.02
Bmg4.37 ± 1.092.21 ± 0.482.49 ± 0.671.73 ± 0.441.45 ± 0.041.75 ± 0.330.91 ± 0.04
Btoy0.37 ± 0.020.31 ± 0.030.14 ± 0.020.25 ± 0.051.40 ± 0.071.01 ± 0.100.94 ± 0.04
Pal13.97 ± 4.260.28 ± 0.120.11 ± 0.043.54 ± 1.241.40 ± 0.051.53 ± 0.500.86 ± 0.06
Pis0.63 ± 0.240.53 ± 0.270.28 ± 0.120.42 ± 0.201.39 ± 0.020.94 ± 0.100.95 ± 0.02
Ppy-fw0.48 ± 0.060.46 ± 0.050.23 ± 0.040.37 ± 0.111.40 ± 0.061.13 ± 0.110.90 ± 0.01
Ppy-sw0.40 ± 0.060.43 ± 0.070.28 ± 0.090.57 ± 0.211.35 ± 0.031.63 ± 0.151.00 ± 0.07
Intracellular
compounds
Baz3.05 ± 0.810.17 ± 0.040.14 ± 0.032.18 ± 0.621.33 ± 0.020.30 ± 0.021.14 ± 0.07
Bbd17.81 ± 8.200.26 ± 0.080.25 ± 0.055.91 ± 2.671.38 ± 0.070.60 ± 0.251.25 ± 0.11
Bcg13.97 ± 4.260.17 ± 0.100.11 ± 0.043.54 ± 1.241.65 ± 0.070.13 ± 0.021.53 ± 0.11
Bcq3.59 ± 1.430.83 ± 0.340.47 ± 0.141.79 ± 0.561.97 ± 0.161.75 ± 0.950.73 ± 0.11
Bcr0.89 ± 0.240.28 ± 0.080.08 ± 0.010.42 ± 0.071.61 ± 0.100.89 ± 0.090.90 ± 0.11
Blch4.71 ± 1.260.20 ± 0.020.10 ± 0.011.05 ± 0.291.62 ± 0.040.25 ± 0.051.39 ± 0.06
Bmg1.80 ± 0.620.35 ± 0.110.19 ± 0.081.25 ± 0.311.65 ± 0.080.78 ± 0.080.87 ± 0.08
Btoy1.27 ± 0.330.32 ± 0.100.20 ± 0.060.79 ± 0.181.84 ± 0.141.08 ± 0.330.75 ± 0.10
Pal3.14 ± 1.610.12 ± 0.030.07 ± 0.021.12 ± 0.451.30 ± 0.100.42 ± 0.111.15 ± 0.19
Pis2.77 ± 0.680.24 ± 0.070.09 ± 0.022.17 ± 0.541.16 ± 0.020.31 ± 0.011.07 ± 0.09
Ppy-fw5.56 ± 1.580.18 ± 0.040.15 ± 0.021.30 ± 0.381.22 ± 0.230.94 ± 0.100.95 ± 0.02
Ppy-sw1.71 ± 0.510.14 ± 0.030.06 ± 0.010.46 ± 0.111.41 ± 0.080.49 ± 0.151.16 ± 0.10
Species key: Baz = Bacillus azotoformans, Bbd = Bacillus badius, Bcg = Bacillus coagulans, Bcq = Bacillus macquariensis, Bcr = Bacillus cereus, Blch = Bacillus licheniformis, Bmg = Bacillus megaterium, Btoy = Bacillus toyonensis, Pal = Paenibacillus alvei, Pis = Psychrobacillus insolitus, Ppy = Paenibacillus polymyxa-FW (freshwater); Ppy = P. polymyxa-SW (seawater).
Table 6. Mean values (±S.E) of the spectral slope measurements of heterotrophic species after seven hours.
a350E2/E3S275–295S350–400SR
Extracellular
compounds
Baz52.47 ± 18.84121.4 ± 19.660.75 ± 0.060.39 ± 0.0740.89 ± 9.35
Bbd182.66 ± 69.4667.53 ± 11.900.57 ± 0.120.18 ± 0.0699.54 ± 17.39
Bcg34.67 ± 2.25149.58 ± 6.550.80 ± 0.020.57 ± 0.0234.43 ± 2.00
Bcq51.17 ± 15.78134.29 ± 26.060.63 ± 0.070.21 ± 0.0572.33 ± 8.75
Bcr24.90 ± 7.92133.6 ± 14.490.77 ± 0.040.56 ± 0.0522.45 ± 5.63
Blch14.84 ± 3.15202.35 ± 11.830.98 ± 0.160.77 ± 0.1816.64 ± 3.57
Bmg136.67 ± 85.94138.99 ± 11.040.76 ± 0.040.33 ± 0.0253.84 ± 3.43
Btoy30.43 ± 5.42145.29 ± 19.070.73 ± 0.030.62 ± 0.0627.38 ± 1.30
Pal47.77 ± 10.76118.15 ± 13.270.63 ± 0.050.72 ± 0.0442.38 ± 6.66
Pis40.29 ± 4.97153.77 ± 19.471.04 ± 0.060.15 ± 0.02113.6 ± 0.01
Ppy-fw153.23 ± 91.6689.33 ± 14.690.59 ± 0.080.38 ± 0.0850.88 ± 12.71
Ppy-sw189.06 ± 96.4763.91 ± 10.970.48 ± 0.090.21 ± 0.0693.33 ± 32.45
Intracellular
compounds
Baz21.27 ± 2.716.62 ± 0.730.06 ± 0.010.01 ± 0.0017.26 ± 1.48
Bbd55.17 ± 21.8110.44 ± 2.880.06 ± 0.010.03 ± 0.029.86 ± 1.89
Bcg29.43 ± 5.926.39 ± 0.080.04 ± 0.000.01 ± 0.008.27 ± 0.40
Bcq13.17 ± 3.2610.28 ± 1.250.07 ± 0.010.01 ± 0.0010.44 ± 1.38
Bcr5.40 ± 1.576.02 ± 0.620.05 ± 0.010.01 ± 0.0011.15 ± 1.37
Blch13.72 ± 3.537.40 ± 0.360.05 ± 0.000.01 ± 0.007.67 ± 0.36
Bmg3.39 ± 0.5311.70 ± 2.580.08 ± 0.010.02 ± 0.0112.01 ± 1.64
Btoy8.33 ± 1.8215.50 ± 3.850.08 ± 0.010.02 ± 0.0010.20 ± 1.33
Pal14.65 ± 5.398.97 ± 1.090.07 ± 0.010.01 ± 0.0013.45 ± 1.80
Pis2.77 ± 0.680.24 ± 0.070.09 ± 0.022.17 ± 0.541.16 ± 0.02
Ppy-fw22.76 ± 4.146.38 ± 0.530.04 ± 0.000.01 ± 0.0010.80 ± 0.79
Ppy-sw9.97 ± 2.255.86 ± 0.460.04 ± 0.000.02 ± 0.015.39 ± 0.98
Species key: Baz = Bacillus azotoformans, Bbd = Bacillus badius, Bcg = Bacillus coagulans, Bcq = Bacillus macquariensis, Bcr = Bacillus cereus, Blch = Bacillus licheniformis, Bmg = Bacillus megaterium, Btoy = Bacillus toyonensis, Pal = Paenibacillus alvei, Pis = Psychrobacillus insolitus, Ppy = Paenibacillus polymyxa-FW (freshwater); Ppy = P. polymyxa-SW (seawater).
Table 7. Discriminant variables of species selected from the canonical variant analysis (CVA) by stepwise forward regression.
VariablesR2 PartialFPr > Fʎ WilksVar (%)
Extracellular
Fraction
C30.75915.998<0.00010.24165.78
S 350–4000.68410.813<0.00010.07620.80
E2/E30.6418.759<0.00010.0277.47
C10.6248.001<0.00010.0102.81
FI0.4974.670<0.00010.0051.41
S275–2950.4203.3540.0020.0030.82
C20.4013.0390.0040.0020.49
HIX0.4744.0100.0000.0010.26
C40.3892.7820.0070.0010.16
SR0.5224.674<0.00010.0000.08
BIX0.4263.1020.0030.0000.04
Intracellular
Fraction
FI0.5006.445<0.00010.44144.23
BIX0.4575.361<0.00010.22022.13
SR0.3783.8130.0000.12012.01
a3500.3753.7040.0000.0747.47
S 275–2950.3383.1120.0020.0474.67
C30.2942.5040.0110.0313.09
HIX0.2662.1400.0290.0222.18
S 350–4000.2561.9980.0430.0161.60
TP = total protein concentration, FI = fluorescence index, BIX = biological index, SR = slope ratio, E2/E3 = a250/a265; C1, C2, C3, C4 = PARAFAC components.
Publisher’s Note: MDPI stays neutral with regard to jurisdictional claims in published maps and institutional affiliations.

