
Long-Term Benefits of Coastline Ecological Restoration in China

1
Ocean College, Zhejiang University, Zhoushan 316021, China
2
Hainan Institute, Zhejiang University, Sanya 572019, China
*
Author to whom correspondence should be addressed.
J. Mar. Sci. Eng. 2022, 10(4), 541; https://doi.org/10.3390/jmse10040541
Submission received: 30 March 2022
/
Accepted: 12 April 2022
/
Published: 14 April 2022
(This article belongs to the Special Issue Monitoring and Assessing the Changing Coastal Ecosystem in Response to Global Change)
Abstract
:Coastline ecological restoration is a critical approach for improving the coastal ecological environment and natural disaster mitigation capacity. Zhejiang Province, with the longest coastline in China, has carried out a three-year action of coastline remediation and restoration, expecting to complete the 300-km coastline restoration by 2020 as part of China’s coastline restoration project. We developed a cost–benefit framework synthesizing the ecosystem services (ES) analysis pattern and input-output approach to evaluate Zhejiang’s coastline ecological restoration projects. The results showed that the average value of ecosystem services (VES) of coastline restoration in Zhejiang was approximately 11,829 yuan/m, which was lower than the average VES of natural coastline. Obviously, damaged natural coastline could cause VES degradation, which cannot make up for the loss in a short time. In an optimistic scenario, coastline ecological restoration projects would deliver enormous well-being to Zhejiang and even China. Our results suggested that making decisions should be based on the net value after accounting for costs (NES), because ignoring costs might mislead planners to overstate the perceived benefits. The study provided a realistic data basis and method for coastline restoration projects in terms of the design, implementation and effectiveness evaluation to achieve sustainable development.
1. Introduction
The coastline is a spatial carrier for the development of the marine economy in coastal areas and an essential platform for protecting the marine environment and maintaining the ecological balance of the coastal zone [1]. With the rapid economic and social development of China’s coastal areas, the intensity of near-shore sea and coastline developments is increasing. In the development process, people focus on the direct consumption value, while ignoring the value of ecosystem service (VES). As a result, many environmental problems have arisen, and coastline ecological restoration is imperative. Coastline ecological restoration is not just a matter of repairing the coastline, but also involves helping the recovery of a destroyed ecosystem. Therefore, restoration of damaged coastlines has, not only economic significance, but also ecological significance. From 2016 to 2019, the central government of China has arranged a total of 6.89 billion yuan in funds for the protection of islands and sea areas, and has supported 28 coastal cities to carry out the “Blue Bay” remediation action [2]. The implementation of the action includes coastline ecological restoration projects, recovery of coastline ecological functions, and optimization of the ecological security barrier system. Since the ecological measurement is still tricky and there are no actual data to support government decision-making, the importance of ecosystem services is ignored in decision-making, which results in the destruction of natural resources and the ecological environment [3].
Along with implementing coastline ecological restoration projects throughout the country, it can yield substantial ecological value. The ecosystem services may range from biodiversity conservation, landscape entertainment function, natural disaster protection, and so on, most of which are “invisible”. These extensive complex and unclear objectives of value assessment remain underrecognized, thus making monetizing them quite tricky [3]. However, it needs to be converted to economic value to account for ecological value. Emerging studies have suggested that from the perspective of ecological economics, estimating VES is a powerful tool for incorporating an ecosystem approach into coastal management [4,5]. That is essential for achieving ecological and sustainable development [6]. At present, some of the studies that include the indirect and non-use value applied various methods for evaluating them, including market value method, replacement cost, opportunity cost, and so on [7]. In order to realize the reasonable transformation of VES, the study constructs a value accounting system of the ecosystem services according to Yan et al. [8], and uses a framework for monetary accounting on ecosystem services valuation.
The cost of ecological restoration is enormous, because it usually begins after the environmental degradation is so severe that it is expensive to reverse it [9]. Furthermore, ecological restoration involves a considerable cost in terms of labor and time. The cost of ecological restoration can generally include three categories: implementation cost, opportunity cost, transaction cost, and possibly follow-up monitoring and management cost [10]. Therefore, the uncertainty of restoration cost and feasibility will hinder the decision to ecologically restore the damaged marine ecosystem [11]. Although research on ecosystem services has become one of the hotspots and critical issues of ecology and economics [12]. However, most scholars had ignored the cost of ecological restoration projects when they evaluated the VES, which will inevitably exaggerate the VES and lead planners to exaggerate the economic significance of relevant measures needed to maintain or restore the ecosystem [13]. If planners had fully considered the cost, many of these expensive projects could be avoided or realized at a lower ecological cost [14]. In conclusion, it is necessary to estimate the benefit with costs in mind when evaluating ecological restoration projects, thereby making it more likely that the project achieves the goal of coordinating the marine ecological environment protection and the sustainable development of the regional economy.
To provide technical support for coastline management and sustainability, we performed a case study to assess both VES and the cost provided by the coastline ecological restoration in Zhejiang Province. Moreover, we suggested that the government make decisions based on the net value after accounting for costs (NES) because ignoring costs might mislead planners to overstate the perceived benefits. In this study, we used the quantitative method in ecological compensation to quantify the cost resulting from the project during the construction period. In addition, this paper established a monetary accounting framework for VES of coastline ecological restoration projects, which classified the ecosystem services (ES) to regulating, supporting and cultural services. To understand the economic significance of China’s ecological restoration programs, we estimated the VES of coastline ecological restoration across China. We also predicted the aggregate value of the restored coastline ecosystem over the next 30 years, which can provide solid proof for the local government to continue implementing coastline ecological restoration projects.
2. Materials and Methods
2.1. Study Areas
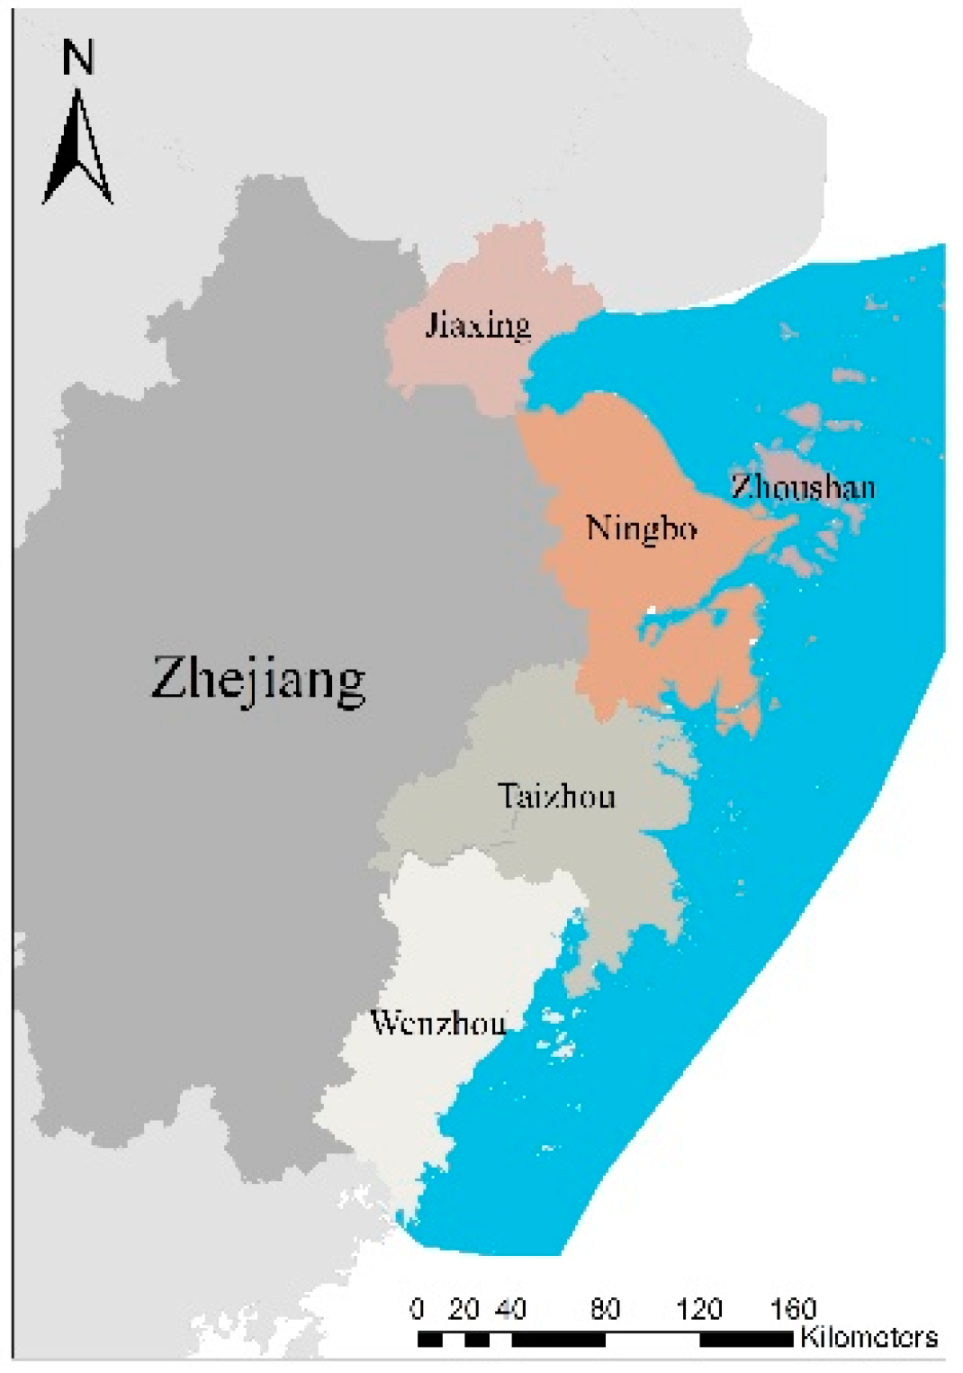
Zhejiang Province possesses abundant coastline resources and the longest coastline nationwide. The length of the original natural coastlines and natural restoration or restoration of silt coastlines in Zhejiang is 654 km and 117 km, respectively. Among the original natural coastlines, the bedrock coastlines account for 624 km, and sandy coastlines account for 29 km [15]. By 2020, Zhejiang Province will complete the ecological restoration of the province’s 300 km of coastline to ensure that the province’s mainland natural coastline retention rate is no less than 30%. The three-year remediation and restoration of the coastline in Zhejiang Province is in accord with respecting, complying with, and protecting nature with the concept of ecology as the priority and will contribute to the building of marine ecological civilization. Tasks of the length of coastline ecological restoration in Zhejiang are 110.07 km, 60 km, 9.3 km, 92.22 km, and 71 km for Ningbo, Wenzhou, Jiaxing, Zhoushan, and Taizhou, respectively (Figure 1). According to the classification of coastlines and actual conditions, the natural coastlines after remediation and restoration are generally silt coastlines and sandy coastlines. Therefore, only these two kinds of coastlines are analyzed in the study.
2.2. Integrated Framework for Analyzing Costs and Benefits of Coastline Ecological Restoration Projects
The implementation of the CBA is encouraged by organizations such as OECD [16] to achieve economic efficiency and sound public investment, and the inclusion of environmental impacts in analysis. In the study, cost-benefit analysis (CBA) covered the total costs and benefits of the project in an attempt to put monetary values on environmental impact. In addition, CBA is conducive to casting light on the feasibility of ecological restoration projects and their contribution to human well-being [16]. Thus, CBA is supposed to be a helpful tool that can be used to assist in public environmental policymaking. CBA is preferable to other forms of economic evaluations because it allows for the inclusion of previously overlooked/non-market elements in measuring social welfare accounting. However, relatively few CBA studies have been conducted on ecological restoration projects, which attributed to missing meaningful and complete data on the benefits and costs accruing from ecological restoration projects. In the study, it was used to demonstrate the economic return on investment of coastline ecological restoration projects. Our research cataloged the costs and benefits that mattered most to the stakeholders and applied appropriate direct and indirect methods to monetize all of the costs and potential benefits. In addition, we also estimated the net present value (NPV) and selected social discount rates to predict streams of benefits over the next 30 years. A benefit–cost ratio (BCR) was also developed as potential indicator for advisable environmental management and protection actions. The core theoretical formulas of cost–benefit analyses in this paper were as follows:
When we estimated the , such as regulating, supporting, and cultural services, total costs of the project () should not be ignored [13]. The study used a net ecosystem services value () to represent the actual benefits after considering any costs in the project:
In the coastline remediation and restoration process, the social service benefits initially provided by environmental resources are reduced or replaced by another service. The welfare or benefits sacrificed by the social benefits are called the opportunity cost of the project [17]. Therefore, where was divided into direct costs () and indirect costs, while indirect costs were divided into corporate opportunity costs (), resident opportunity costs (), and government opportunity costs () referring to Li and Ge [18] and Hu et al. [19].
The enterprise opportunity cost primarily included two aspects in Zhejiang. One was the loss caused by closure and shutdown of enterprise, , and the other was the loss caused by corporate fines, .
In the formula, i indicates the type of enterprise closure and R indicates the average revenue of type i enterprise. j indicates the type of enterprises to be punished, and indicates the fines of j enterprises.
The resident opportunity cost, , primarily includes the loss brought to farmers by reducing the area of aquafarm,, and the extra cost brought to residents by remediation and punishment of aquafarm, .
In the formula, S indicates that the maricultural area should be rectified, and D indicates that the output value of maricultural per unit area in Zhejiang was 263,800 yuan/ha, derived from “Fishery Statistics Yearbook 2019”. Moreover, i indicates the primary measures for remediation of pond tailwater, including the construction of biological filter dam, installation of salt-tolerant plant floating beds, and installation of aeration facilities. E is the unit price of each facility, in which the biological filter dam, ecological floating bed, and aeration facilities are 230 yuan /m3, 100 yuan /m2, and 150 yuan/piece, respectively.
Due to the flexibility of law enforcement in Zhejiang, most of these have rectified themselves and passed the audit of the Department of Environment. Consequently, the Zhejiang provincial government has not suffered apparent corporate tax losses, and the government opportunity cost () can be ignored.
The marine ecosystem delivers a large amount of welfare to human society by providing different services, such as supporting, provisioning, cultural, and regulating services [20]. We applied the ecosystem services framework to estimate the ecological benefits of the project from three aspects, including ecosystem regulating services, cultural services, and supporting services. The valuation model of ES referred to the evaluation system of coastal zone ecological restoration effect established by Zhang et al. [21], and weights of a, b and c were obtained through the research of Zhang et al. [21].
In the formula, a represents the value of regulating services, b represents the value of cultural services, and c represents the value of supporting services.
Since the project with long-term environmental effects, the study discounted the future environmental impact into the NPV to evaluate the benefits of the coastline ecological restoration project. According to the NDRC-MS, the short- and medium-term social discount rate is 8%. The social discount rate is lower for projects with more extended return periods, but not less than 6% [22]. This study assumed that the project’s return periods were 5, 10, and 30 years, and the corresponding discount rates were 8%, 8%, and 6%. However, considering the long-term effect of the project, the late management costs cannot be ignored. The net-present total cost should include all total cost (C) and annual management cost components of up 2.5% of the C [23]. The BCR of coastline restoration was then calculated for 30 years following Equation (4), adapted from Su et al. [24].
where PV is the cumulative present value, t is the year of calculation, B is the total annual benefits, C is the total initial cost, and r is the discount rate.
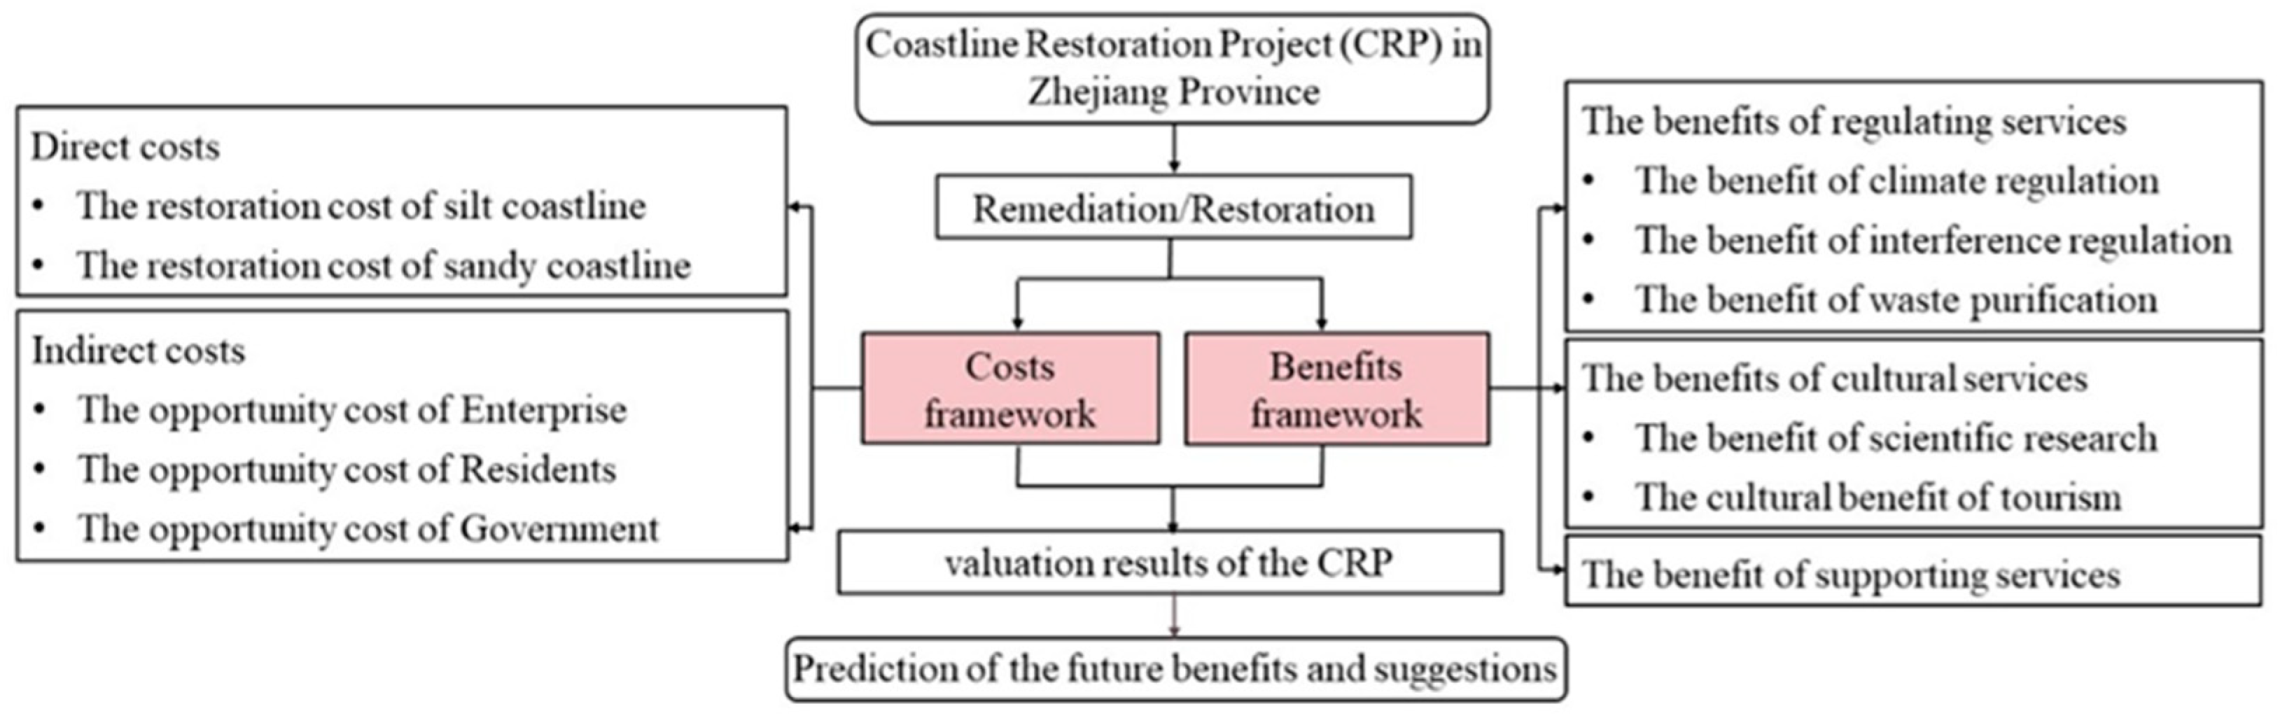
In conclusion, we proposed the analyzing framework of costs and benefits for coastline ecological restoration projects (Figure 2). Because traditional evaluation methods ignored costs, policymakers mistakenly believed that ecological restoration projects should focus on the most favorable resource conditions, the advantage of the framework is that it thoroughly considered the costs and benefits associated with coastline ecological restoration projects. Thereby, it revealed optimal projects for policymakers when making decisions.
2.3. Cost Estimates
2.3.1. Direct Cost Estimates
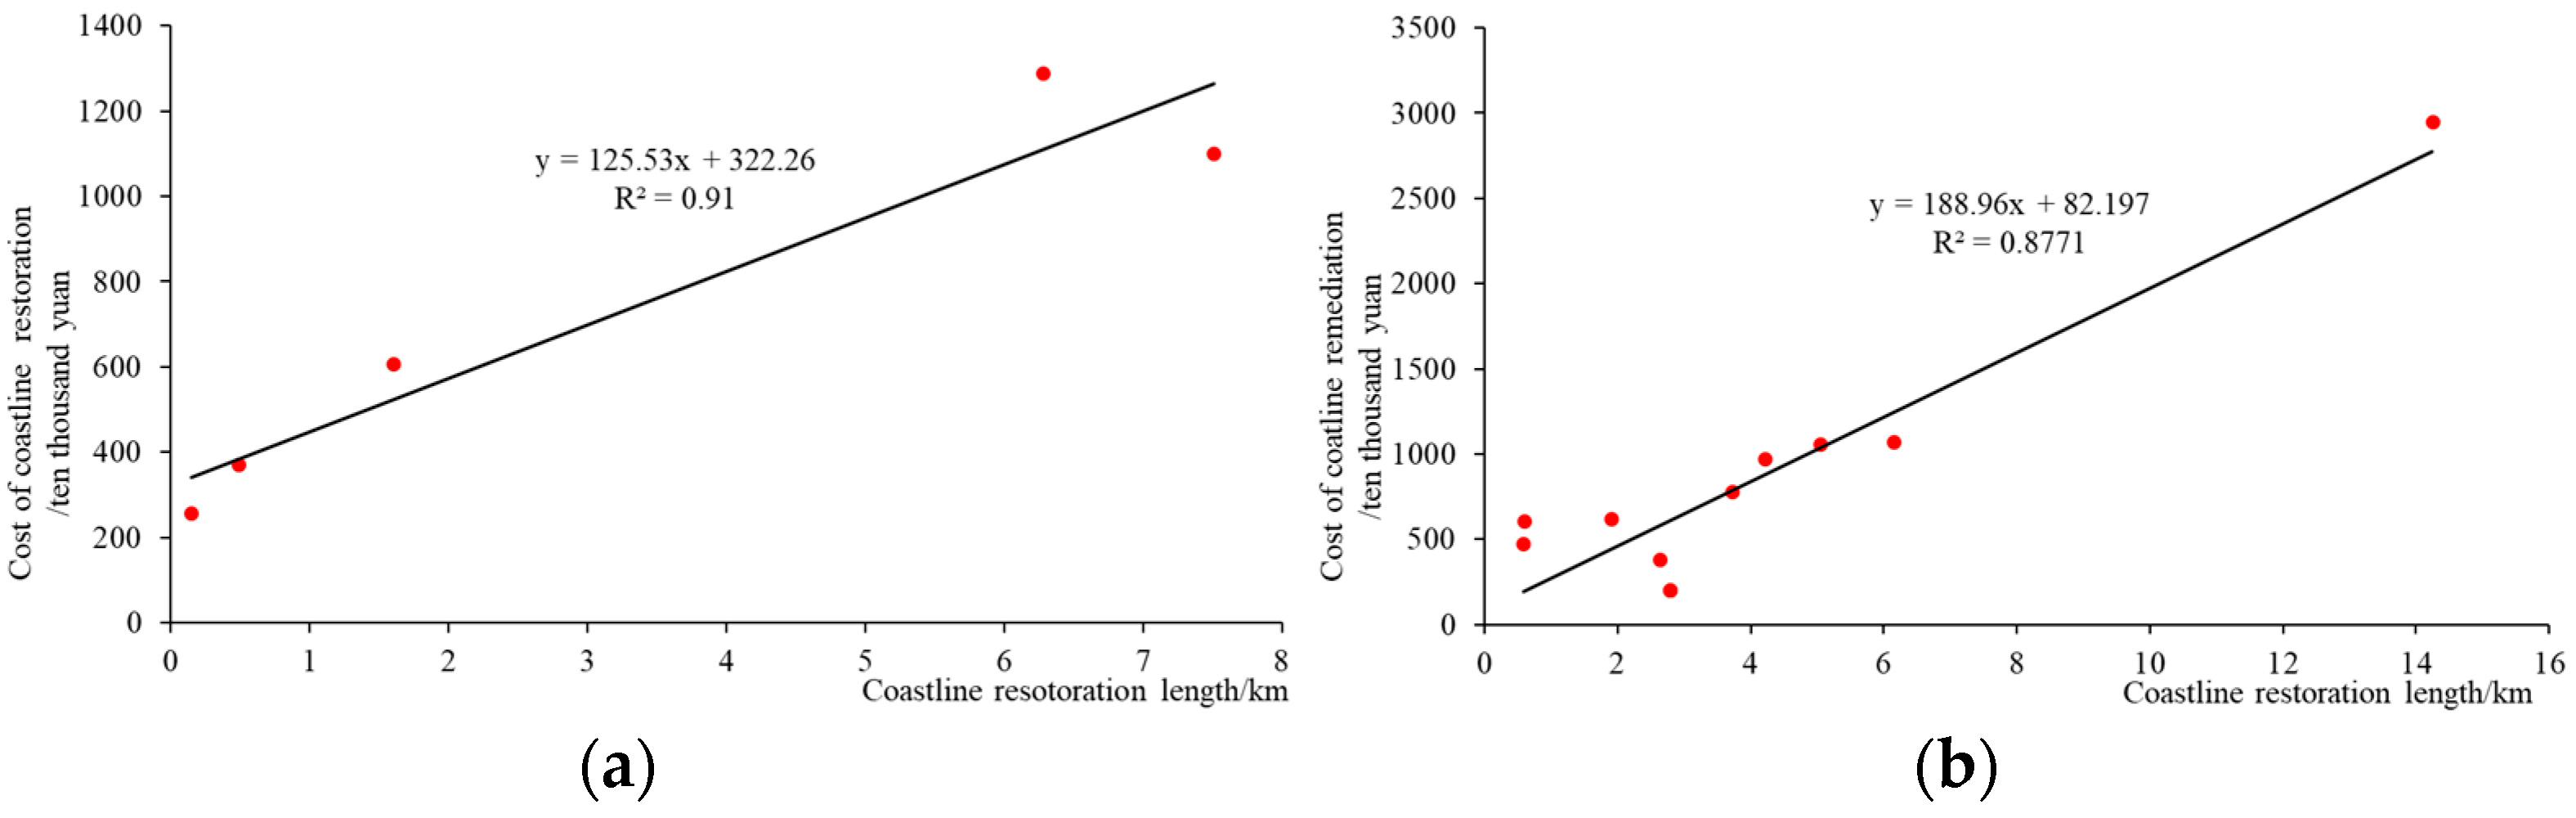
The cost of coastline ecological restoration in Zhejiang refers to the direct costs incurred in restoring and rebuilding the ecological landscape of the coastline, such as cleaning up rubbish, waste, dismantling old wharves, dredging projects in harbors, constructing coastal protection dikes, coastal maintenance, planting mangroves and so on. Different types of coastlines have different ways of restoring. In the study, the information of different coastline restoration projects can be collected through the government procurement website, including the type, length, and cost of coastline restoration (Table A1). Furthermore, there was a correlation (linear regression; R2 = 0.88 and R2 = 0.91) between the cost of coastline restoration projects and length of sandy coastline restoration and silt coastline restoration, respectively. As shown in Figure A1, the per cost of sandy and silt coastline restoration was 125.53 × yuan/km and 188.96 × yuan/km. Based on the statistically fitting formulas, the project’s direct costs in Zhejiang’s five coastal cities were provided in Table 1.
2.3.2. Indirect Cost Estimates
In economics, opportunity cost refers to the maximum potential benefits from other options lost by taking one option. For example, measures to protect the coastline ecological environment, e.g., dismantling abandoned factories, returning farmland to forests, rectifying illegal maricultural, and tax-cutting, will bring losses to enterprises, residents and, government. Therefore, the indirect opportunity cost in Zhejiang primary included enterprise opportunity cost, resident opportunity cost, and government opportunity cost. According to the blacklist of corporate environmental violations announced by Zhejiang, Zhejiang has eliminated or closed 21 enterprises involved in the sea and punished 40 enterprises involved in the sea within three years. Based on Formula (3), the enterprise opportunity cost in each city was calculated as shown in Table 2. In terms of resident opportunity cost, 10,019 hectares of mariculture was neatened in Zhejiang within three years. Thus, resident opportunity cost can be obtained through Formula (4).
2.4. Benefit Estimates
In this paper, the VES of coastline ecological restoration in Zhejiang was assessed by combining the research results of Costanza et al. [25] and other ES benefits transfers functions. The benefits of regulating services mainly included climate regulation, flood protection, and waste purification. The benefits principally related to coastal resource conservation measures were assessed using the formulas in Table 3. In order to maintain the tidal flats resources and biological communities in coastal zones, the “Three-year Action Plan for Coastline Remediation and Restoration in Zhejiang Province” pointed out that it should choose representative wetlands for reed planting in Ningbo, Zhoushan, and Jiaxing; choose areas with suitable climate and soil for planting mangroves in Taizhou and Wenzhou. Wetland vegetation not only has the climate regulation benefits of carbon sequestration, oxygen production, and maintaining the virtuous cycle of air but also has the benefits of reducing property losses as the first barrier of coastal shelterbelt and the waste purification benefits for the environment. Climate-related hazards, specifically droughts, floods, and storms, are responsible for the largest number of people affected by disasters and significant economic losses. According to the “Three-year Action Plan for Coastline Remediation and Restoration in Zhejiang Province,” upgrading disaster-prevention coastlines was one of the main directions in the project. It played an essential role in promoting the construction of a comprehensive protection system with synergistic effects of coastal ecology and disaster risk reduction. In the study, the benefit of flood protection services can measure the effectiveness of disaster risk reduction by coastlines. This will provide us with a new framework for advancing disaster risk reduction from the perspective of ecosystem services.
The benefits of supporting services include the benefits of a natural ecological coastline that provides much-needed habitat and shelter for shallow marine creatures. The benefits relating to cultural services include two aspects: scientific research services and tourist entertainment. The scientific research service refers to the hard value that the ocean can bring broad enough research objects in time, space, and dimension for scientific research, promoting social progress and benefiting humanity. Zhejiang boasts a wealth of coastal tourism resources. This aims to assess the additional tourism value of natural shorelines after the restoration.

Table 3.
Assessment system and formulas for calculating the value of ecosystem services (VES) in Zhejiang Province.
Table 3.
Assessment system and formulas for calculating the value of ecosystem services (VES) in Zhejiang Province.
| Type of Benefit | Formula | Parameter Description | ||
|---|---|---|---|---|
| Regulating services benefits | climate regulation | reed | indicates that net primary productivity of the plant is 3.975 kg m2 a−1 [26] ; is coverage area of the plant(m2); 32 and 44 are molecular weights of O2 and CO2, respectively; 0.614 is the conversion coefficient of CO2 into net primary productivity; | |
| Mangrove forest | indicates that the annual CO2 release of the ecosystem is 4.75 t/hm2 [27] indicates that the cost of industrial oxygen production is 400 yuan/t [28]. | |||
| flood protection service | ; is 23.49% for the disaster prevention and mitigation effect of coastal defense forest [29]. | |||
| waste purification | reed | V4 = N × S × B1 + P × S × B2 | S is the area of wetland in the study area; N and P are the removal rates of wetland nitrogen and phosphorus per unit area; B1 and B2 are the cost of treating nitrogen and phosphorus per unit area [30]. N and P take 3.98 t/ hm2 and 1.68 t/hm2 [31] respectively. B1 and B2 take 2 yuan /t. | |
| Mangrove forest | is the price at which the industry absorbs CO2, which is RMB600/t; 60% represents ratio of the value of mangroves purifying sulfur dioxide to its total purifying value [32]. | |||
| Supporting services benefits | is the primary productivity per unit area, which mangrove takes 458 gc/(m2 a) [33] and reed takes 2475 gc/ (m2 a) [26]. Conversion efficiency E is 10% [34]. is 1:5.52 [35]. is 22.5% [36]. | |||
| Cultural services benefits | scientific research service | is 357,600 yuan [37]. | ||
| tourism entertainment | Please refer to the attached Table A2 for the specific formula system [38]. | |||
The cumulative planting area of mangroves in Zhejiang reached 1700 hectares in 2018 [39]. Compared to 2017, the mangrove area has increased by 360 hectares one year after the coastline ecological restoration project. According to the “2018 Zhejiang Province Natural Resources Bulletin”, in 2018, 65.9 km of coastline was ecologically restored in Zhejiang, so the average1 km of coastline restoration requires 5.46 hectares of mangroves. Because of limited data, we assumed the planting area of reed for the project in Zhejiang that taking the length of silt coastline as planting length. According to the coastline ecological restoration plan of Zhoushan city, the planting width of reed was supposed to be 10 m.
3. Results
The study presented a comprehensive analysis of the costs and benefits for the project and calculated the net value of ecosystem services (NES), which was the value that remained after subtracting the associated costs from VES for the project. The total initial cost was 3.77 billion yuan, of which the costs of the project in Ningbo, Wenzhou, Jiaxing, Zhoushan, and Taizhou were 1.51, 0.85, 0.03, 0.19, 1.19 billion yuan, respectively. Environment costs and benefits often accrued in the long-term. For projects with long-term environmental impacts, such as those related to ecosystem damages, it is recommended to use a time scale of more than 100 years for economic assessment of the impacts [40]. However, because of uncertainty to the long-term analysis, this study calculated the VES brought by the project in 30 years.
As shown in Table 4, the annual VES at the municipal level was highest in Ningbo, followed by Zhoushan, Taizhou, Wenzhou, and Jiaxing. The direct economic cost of coastline restoration in the five coastal cities was reported in Table 1. Due to the limited data availability, this study evaluated the direct cost, only using the considerable linear fitting results on coastline length and direct costs according to the coastline restoration bidding information published on the government website. Detailed calculations of direct costs were presented in Table A1. The opportunity cost of enterprises and residents in the study area was shown in Table 2. As the problem of illegal aquaculture in Jiaxing and Zhoushan was not prominent, the opportunity cost of the residents under this project was relatively low and can be ignored.
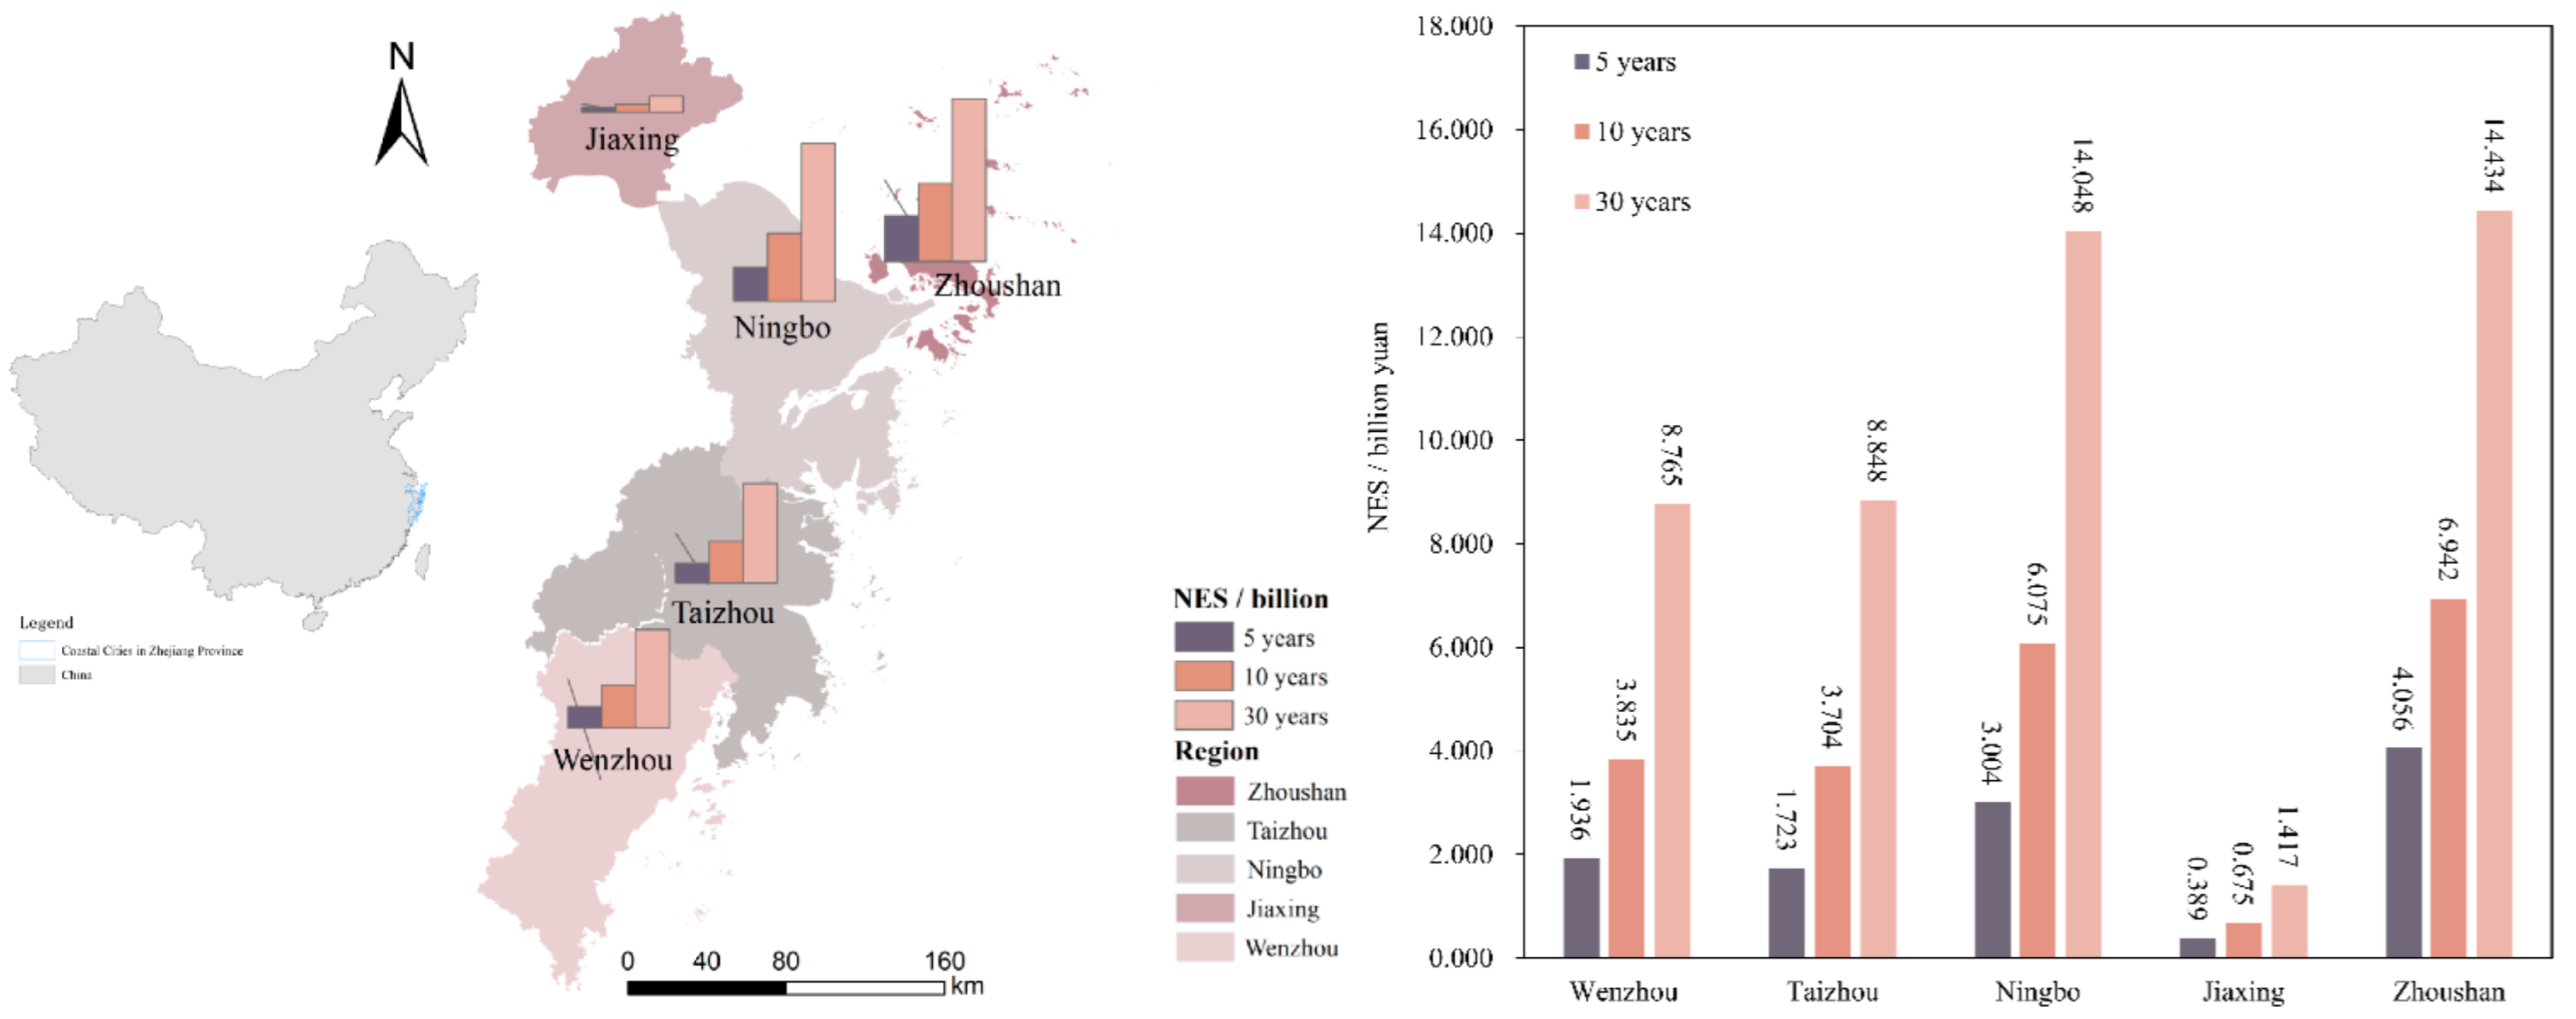
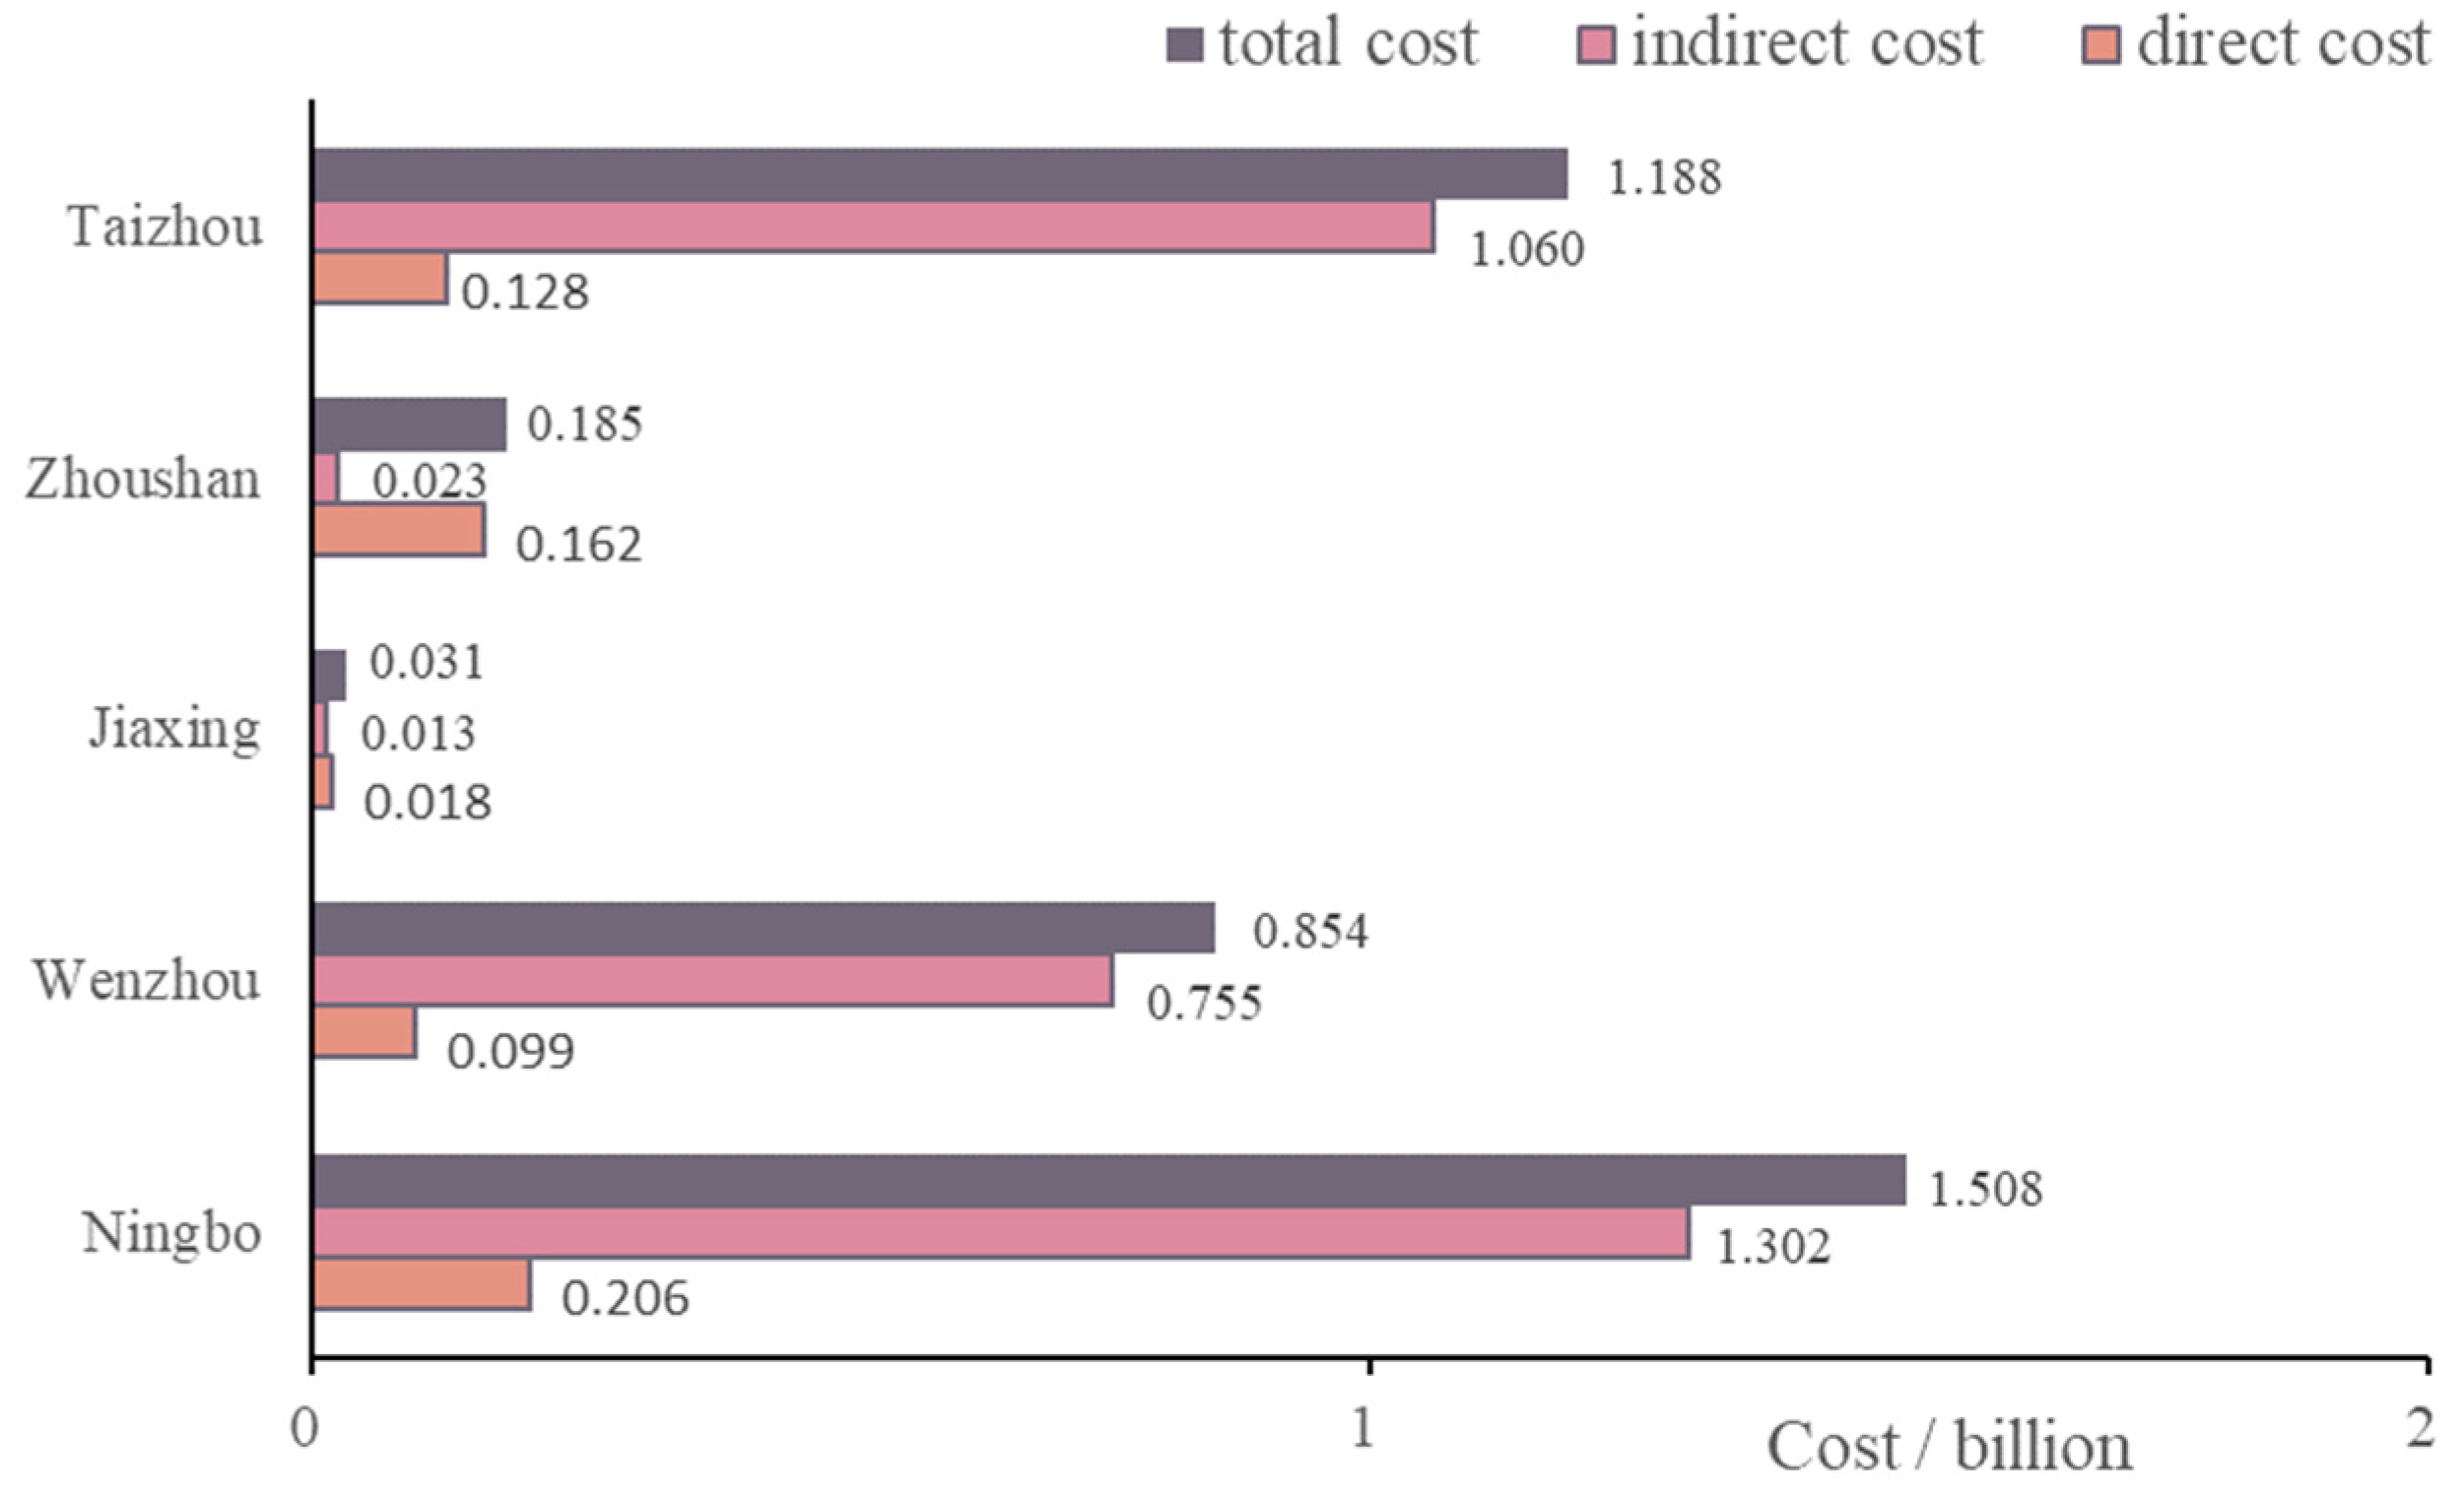
The values of costs, VES, NES, and BCR, aggregated over the years in the project were shown in Table 5. It can be observed that the three-year coastline remediation and restoration project in Zhejiang Province would produce huge ecological benefits for Zhejiang in the next 5 to 30 years. Table 5 also shown that the input-output efficiency that is BCR in Zhoushan, was the highest, followed by Jiaxing, Wenzhou, Ningbo, and Taizhou. However, Jiaxing received the lowest VES and NES in the project, related to the shorter length of coastline to be restored. In the short term, the VES order in Zhejiang was: Ningbo > Zhoushan > Taizhou > Wenzhou > Jiaxing. In the long run, the VES order in Zhejiang was: Zhoushan > Ningbo > Wenzhou > Taizhou > Jiaxing. When costs were accounted for (i.e., when they are subtracted from VES), the order of the net present value of ecosystem services (NES) was: Zhoushan > Ningbo > Wenzhou > Taizhou > Jiaxing (Figure 3). To achieve sustainable development and ecological restoration, China’s government must base decisions on NES, not VES, to ensure that they account for the associated costs. Figure 4 shown that the order of total costs in the study area was: Ningbo > Taizhou > Wenzhou > Zhoushan > Jiaxing, which was related to their indirect cost, mainly resident opportunity costs.
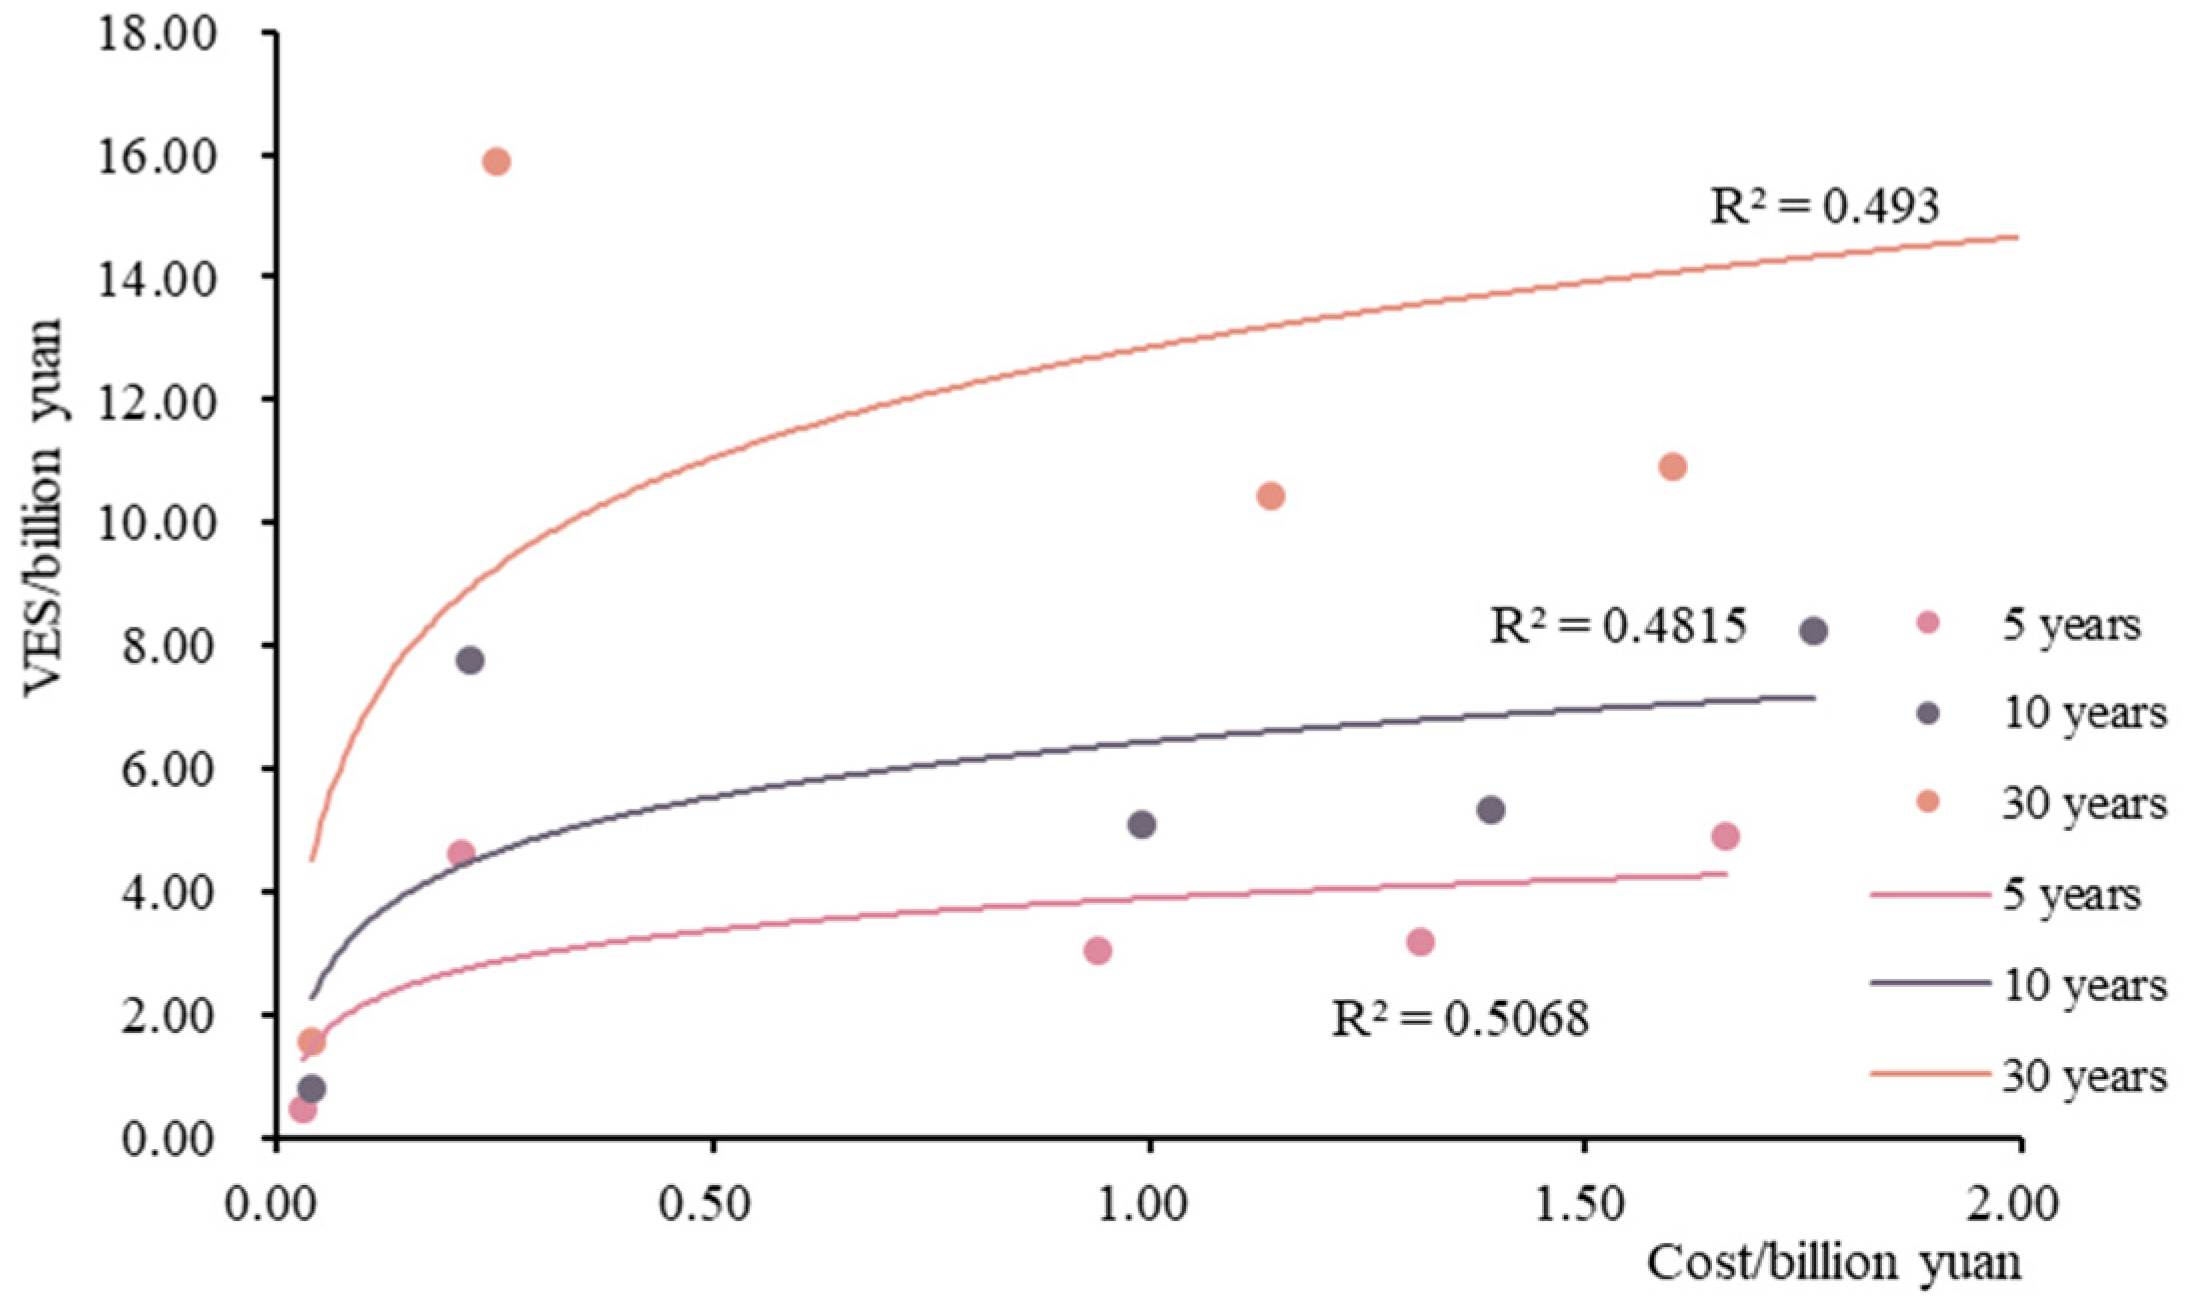
As shown in Figure 5, there was a logarithmic relationship between the cost of coastline ecological restoration and the VES. From the general trend, the higher cost of government investment in coastline ecological restoration was, the higher VES was. However, with the increase of cost input, the growth rate of VES slowed down. That shown that coastline restoration projects can generate high profits with sufficient capital, but excessive input will lead to low output efficiency. It is recommended that according to the specific situation of coastline ecological restoration, the government should control the input cost in order to obtain high income and ensure a high yield efficiency.
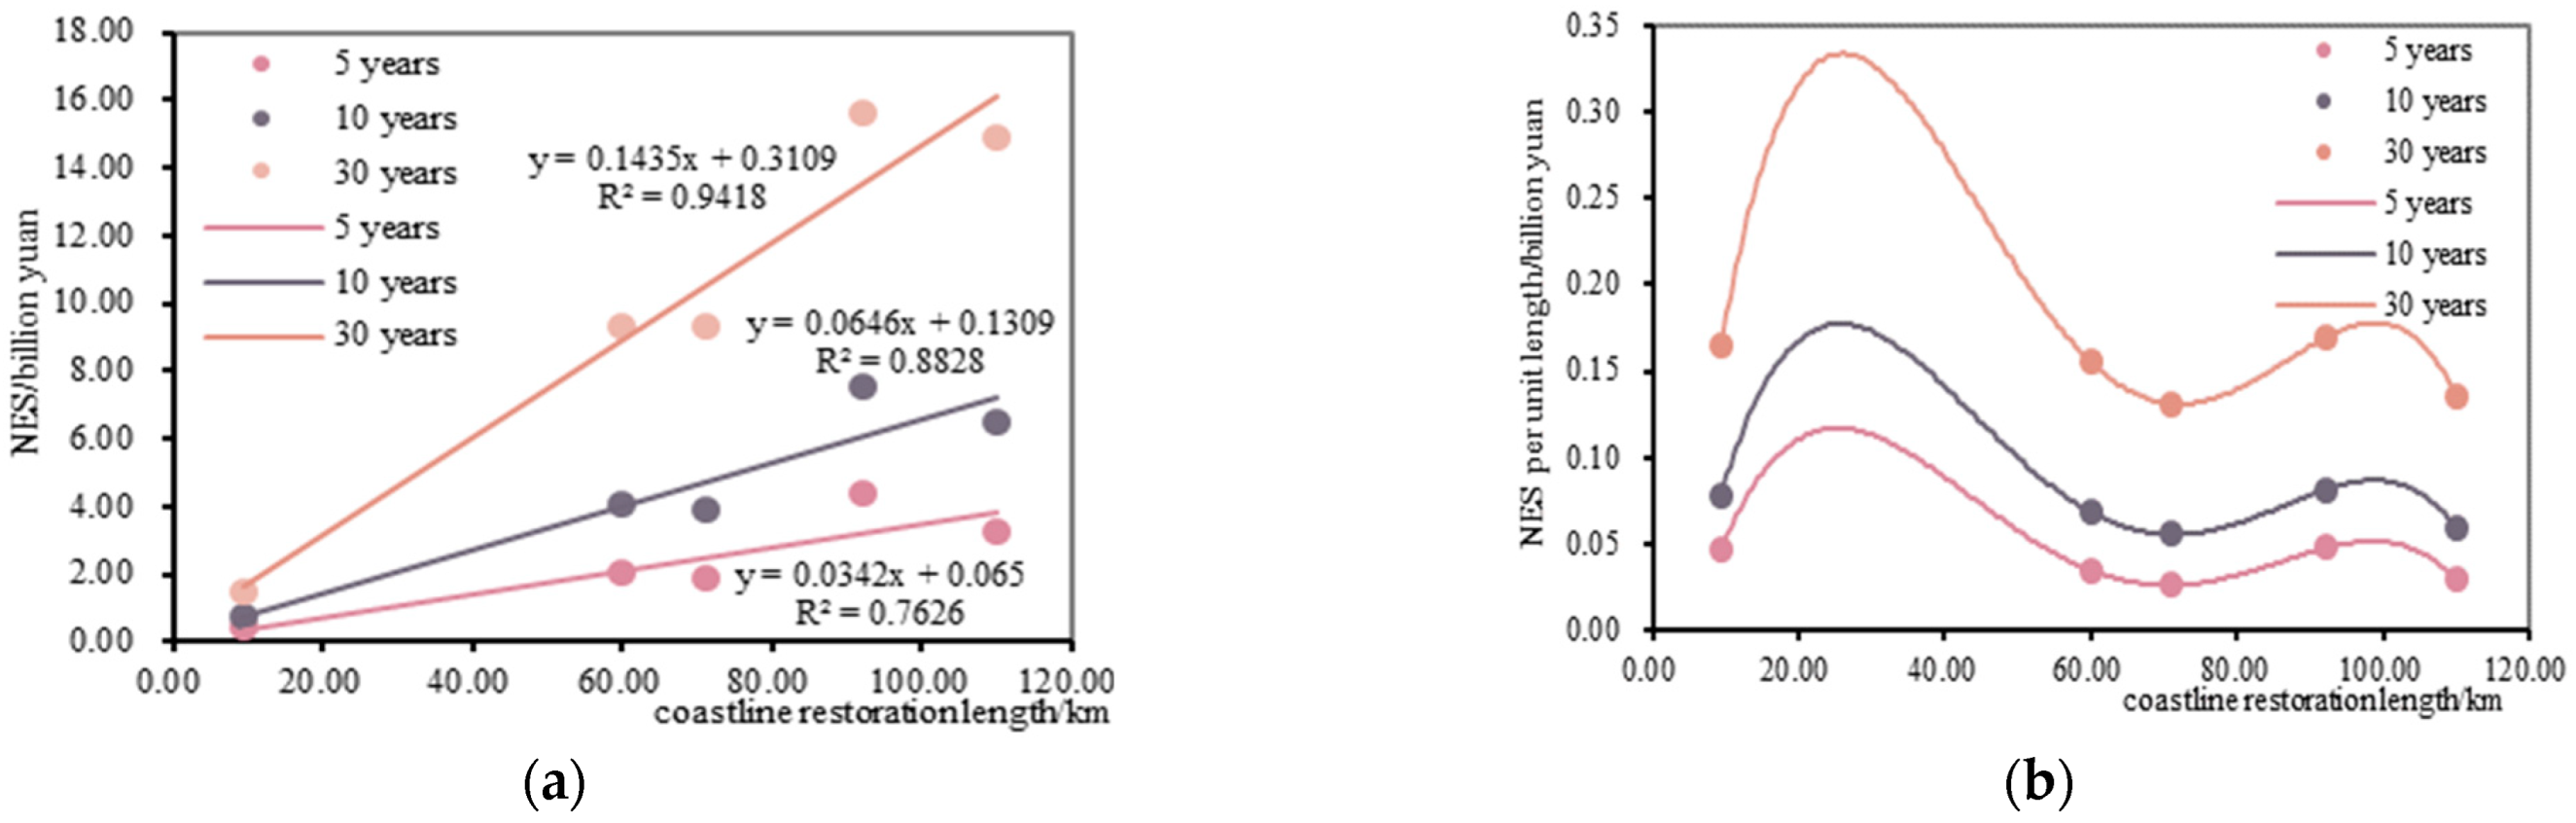
In the five cities, a positive NES value meant that the three-year coastline restoration project in Zhejiang could generate significant benefits and continue to bring benefits to society. It was observed in Figure 6a that there is a positive correlation between the coastline restoration length, and the NES obtained and the relationship became more significant over time. Considering the correlation of coastline ecological restoration per unit length (Figure 6b), it can be seen that short coastlines to be restored within a certain range produce high NES, which was a cost-effective protection method for specific small areas. With the increase of coastline restoration length, the systematicity and regional integrity of coastline were enhanced, and the tourism and cultural value, flood protection value, and other benefits also increased when the ecological benefit was raised gradually. In this stage, NES per unit length also increased slightly with increasing coastline restoration length. Nevertheless, when the length of coastline restoration was too long, many areas with great ecological damage would be preferentially selected, which required more investment of money and time. Therefore, blindly increasing the length of coastline restoration may reduce NES per unit length. To sum up, the way to obtain the best benefits was to plan proper areas and lengths of coastline ecological restoration to maintain the systematic integrity of ecosystems without excessive expansion. These results can provide an economic justification and suggestions for implementing ecological restoration projects (Figure 5 and Figure 6).
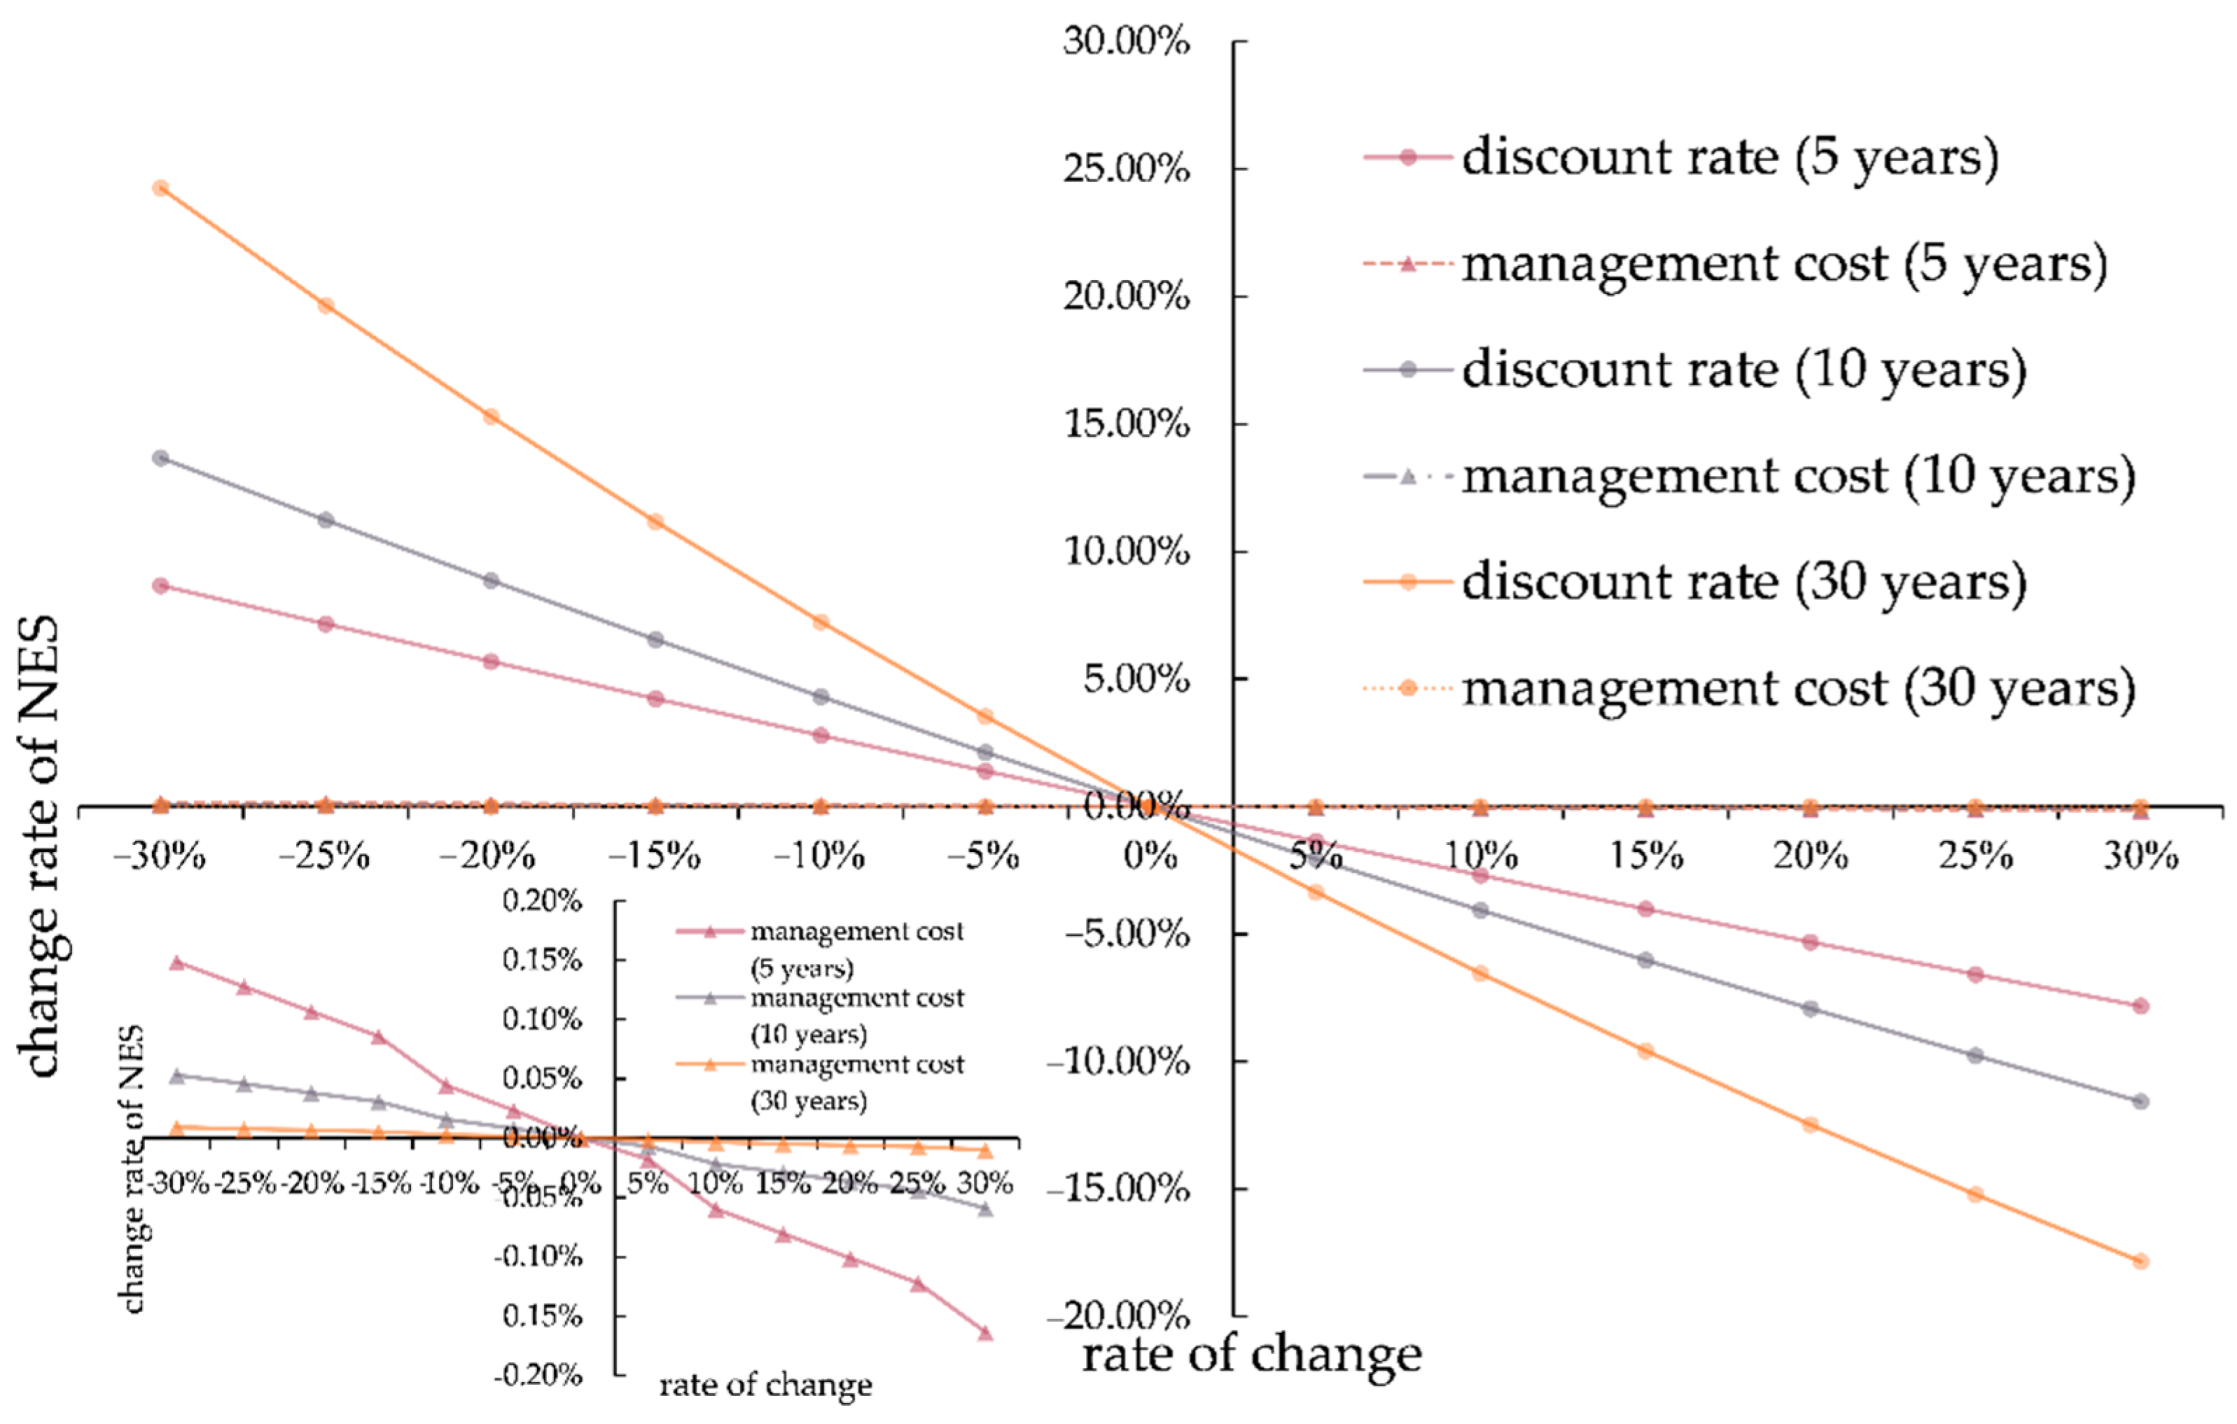
A one-factor-at-a-time (OAT) method was used for sensitivity analysis in the study. Figure 7 shows the cases where sensitive factors of NES had value change on the based value, and its increment of percentage change was . It can be seen from Figure 7 that the change rate of NES presented a linear growth trend, and the greater the slope of the NES change rate was, the higher sensitivity of sensitive factors was. From the comparison of discount rate trend lines of 5 years and 10 years, it can be concluded that the sensitivity order of discount rate was prior to the period of investment return. Thus, the sensitivity degree of three sensitive factors affecting NES was in the order of discount rate, return period, and management cost. When the three influencing factors changed, NES was still optimistic, and a high yield could still be achieved. Making sensitivity analysis of sensitive factors to NES can provide helpful information on the robustness of the NES to critical assumptions concerning variables.
4. Discussion
4.1. Predicting the Benefits of National Coastline Ecological Restoration Projects
The ecological exploitation and utilization of marine resources have become the strategic consensus of most coastal countries globally, and China is also among them. Since 2016, the government has allocated a total of 6.89 billion yuan for the island and marine protection funds to support coastal cities in carrying out coastline ecological restoration projects which improved the structural integrity and functional stability of the coastline ecosystem and enhanced the ability to resist marine disasters [41]. By the end of 2018, China had restored about 1000 km of coastline. Based on paper results and the length of coastline ecological restoration, we predicted that the VES of coastline ecological restoration projects in China would be 47.23, 79.40, and 162.79 billion yuan, respectively, over the next 5, 10, and 30 years. Compared with Zhejiang, the NES of the nationwide coastline ecological restoration projects have increased faster. The results proved that large-scale coastline ecological restoration projects had potential profitability and were expected to gain good benefit if properly managed. It is of great significance to explore the monetization of coastline ecological value as an essential input to cost-benefit analysis (CBA) of implementing coastline ecological restoration projects and promoting sustainable marine economy development.
4.2. Discussion on the Ecological Restoration Project in Zhejiang Province
The object of the coastline ecological restoration project is the natural coastline, and the main task is to lay the foundation for building coastal tourism city clusters and promote the coordinated development of the blue economy and marine ecological environment. The average VES of the coastline restoration was approximately 11,829 yuan/m, which was lower than that of in natural coastline with 48,128 yuan/m [42]. That indicated that a damaged natural coastline would cause VES degradation, and the ecological restoration effect cannot make up for the loss in a short time. In addition, Li [38] calculated the benchmark prices for different coastlines that were fishery coast (14,051 yuan/m), tourism and entertainment coast (211.7 yuan/m), and industrial coast (24,528 yuan/m). Among them, the VES of coastline restoration mainly used for coastal tourism studied in this paper was close to the tourism and entertainment coast value calculated by Li [38]. It can be seen that the fundamental value scale of this paper was reliable. From the evaluation results, the effect of the project was primary reflected in supporting services and cultural services. Moreover, the five coastal cities in Zhejiang had a high value of tourism and entertainment, which could provide better environmental resources for coastal ecological ecotourism development. At the same time, it also shown that the internal relationship between environmental protection and economic development was not contradictory but complementary and can be transformed into each other. That is also illustrated in the study of Chen [43]. Understanding the economic value of ecosystem services can guide policymaking and decisions. That is essential to the sustainable development of tourism and aquaculture in the coastal zone of Zhejiang Province.
Comparing the annual benefits of the project (Table 4) with the total cost (Table 5), it was found that the ecological benefits generated by the project in Zhejiang did not immediately make up for the capital cost invested in the project. That indicated that ecological restoration benefits could not make up for the loss caused by continuous degradation of the entire coastal zone in a short time. Zhang et al. [21] also identified a lag in the ecological restoration of damaged coastlines. It will take a long time to explain the benefit of coastline ecological restoration. Furthermore, it can be seen from Figure 3 that the coastal ecosystem, after being restored in Zhejiang, would have sustained high output in the future, which would far exceed the costs within five years. The study provided substantial proof and examples for what had lost when the coastal ecosystem was the recession and degraded, which was necessary for framing policy thinking and subsequent formulation despite not being a substitute for policy. In addition, the results in the study illustrated that VES contributed to improving human well-being far exceeded cost over the next 30 years, which accorded with the guiding decision-making principle of CBA [16]. This coastal natural endowment matters for sustainable development in the future because it delivers different benefits to human well-being through ecosystem services. For this reason, coastline ecological restoration is worth supporting and praising objectively. However, management of the coastal zone must not be terminated by the end of the project period. Of course, that would increase administrative costs, which need to be trade-offs between costs and benefits.
Additionally, Ningbo and Zhoushan benefited the most from the project. The main reason was that not only investment cost of the project was lower than that of other cities, but the two cities had the higher value for tourism and leisure. It was also related to the length of the ecological restoration coastline. From the perspective of BCR, Jiaxing and Zhoushan had the best economic performance with low input but high output, while Taizhou had the worst economic performance. Taizhou should learn from Jiaxing and Zhoushan to reduce the input, especially resident opportunity costs. Cost-benefit analysis (CBA) provided valuable information about the positive NES of coastline ecological restoration projects that potentially investable economic resources. That can provide a beneficial scientific reference for the design and implementation of future investment in coastline ecological restoration projects or public policies. It is recommended that institutionalizing the carrying out CBA and making individual, authoritative institutions responsible for carrying out CBA before and after implementing public environment projects might have significant benefits.
4.3. Synergistic Effects of Coastal Ecology and Disaster Risk Reduction
It is well known that healthy ecosystems contribute to environmental disaster risk reduction through their ecosystem services (ES), which regulating and supporting services are related to disaster risk reduction [44]. The restored coastal shelter forest ecosystem’s disaster prevention and mitigation value was as the regulation value of flood protection in Table 4. The ecological disaster-prevention benefits of Zhejiang’s coastline after restoration were 0.002 billion yuan per year, equal 0.009, 0.016, and 0.033 billion yuan over the next 5, 10, and 30 years. Ningbo and Zhoushan had the highest disaster-prevention benefits, accounting for 38% and 25.36% of the total benefits, respectively. Followed by Taizhou, Wenzhou and Jiaxing, accounted for 21.05%, 11.71%, and 3.54% of the total benefit. By planting flat tidal vegetation to eliminate waves and promote sanitation, the impact of marine disasters has been reduced to a certain extent, and the value of coastline ecological disaster reduction functions has been enhanced. At the same time, it obtained significant ecological benefits such as carbon sequestration, purification, and interception of pollutants, and providing habitat for marine organisms. Therefore, coastal engineering with the ecological restoration as the protection concept can improve the ability to withstand marine disasters such as typhoons and storm surges to a certain extent and achieve the sustainable development goals of combining disaster prevention, and mitigation benefits, ecological benefits and economic benefits [45]. Additionally, ecological restoration was developed earlier in the world. In the future, the construction of an ecological coastal zone in China needs to improve the theoretical system further, introduce advanced technologies, establish a survey database [46].
4.4. Discussion on Limitations in the Study
In conducting ES value transfers, the study was based on the valuation databases collected from past research. Thus, some subjectivity and uncertainty were almost inevitable. In order to make this dissimilarity affected valued acceptable, the study selected valuation benchmarks that were geographical proximity to the study sites when processing benefits transfer of regulating services and supporting services. In addition, the benefit valuation of tourism entertainment considered each study area’s actual socioeconomic differences, which reduced the degree of transfer error considerably. However, the benefit of scientific research using the benefit transfer method without adjusting and accuracy and quality of the original studies can give rise to the inaccuracy of varying degrees of magnitude. These were also limitations in the study. The objective of the study was to provide an initial assessment of the policy value as an essential input to CBA. Thus, a relatively low level of accuracy was acceptable [16].
In addition, one of the limitations of the study was the lack of further research on restoration measures and actual restoration effects. For example, in the process of vegetation restoration, large-scale planting of species may lead to poor restoration effects without considering the degradation mechanism and ecological characteristics of the local ecosystem. Furthermore, simple environmental restoration measures adopted in coastline ecological restoration projects, such as sea dredging, control maricultural and planting single species, are likely to cause similar restoration results in different areas. These restoration measures may alter hydrodynamic conditions and upset the local ecological balance, resulting in new stresses on the ecosystem [2]. We attempted to evaluate the feedback, but ecosystem feedback tended to take a long time and there were no dedicated data sets of long-term monitoring. It is recommended that the government should pay attention to the key links such as the late monitoring and result feedback of coastline ecological restoration projects.
We were also limited by the lack of available data for social and economic benefits of the project. Except for quantifying the VES, the assessment of social and economic benefits should also be considered as a crucial part of the future [47]. The social benefits of the projects can be evaluated from the perspectives of improvement of the living environment, enhancement of city image, and optimization of surrounding marine industrial structure [48]. Because the projects have high public welfare and the profit point is not clear, the calculation of economic benefits is neglected. Nevertheless, quantitative analysis of the comprehensive benefits of the projects can enable stakeholders to directly understand the gains and losses of coastline ecological restoration works, improve the public awareness of marine environmental issues and provide feedback to decision-makers through public participation. That analysis remained a challenge for future research.
5. Conclusions
The cumulative anthropogenic pressures and impacts have caused inestimable loss to the sustainable development of society and economic around coastal areas. Based on summarizing the previous classification and estimation of costs and ES, this study constructed the calculation method of cost and VES for coastline ecological restoration projects. Moreover, it was applied to analyze the coastline ecological restoration project in Zhejiang, which provided a realistic data basis for Zhejiang’s coastal management to achieve sustainable environment-society-economy development. Over the three-year period of the project, Zhejiang has invested a total of 3.77 billion yuan and the total continuing value of ecosystem services (VES) were 16.18, 27.20, and 55.77 billion yuan over the next 5, 10, and 30 years, respectively. Although the study has shown that the cost of coastline ecological restoration in Zhejiang was usually high, the potential economic well-being was profitable. It meant that the future return rate on coastline ecological restoration projects would be substantial.
Moreover, we also calculated the NES to understand the economic significance of the project. In order to achieve a combination of environmental, ecological restoration with sustainable socio-economic development, the government must make decisions based on NES rather than VES. Positive NES and economic feasibility were a good beginning for accelerating investments and capital financing. Benefit–cost ratio (BCR) was the starting point for recording the economic feasibility of coastline ecological restoration projects and providing of evidence that, in the long run, benefits resulting from the projects would far outweigh the costs.
Author Contributions
Y.Z., G.Y., H.L. contributed to data collection and processing, figures drawing, results analysis and manuscript writing. G.Y. checked the data, text, etc., and then make important revisions to the manuscript. All authors have read and agreed to the published version of the manuscript.
Funding
This work was supported by National Natural Science Foundation of China (NSFC, grant No.42176216), the Science Technology Department of Zhejiang of China (No.2022C15008), the Key Laboratory of Marine Ecosystem Dynamics, Ministry of Nature Resources (No. MD202001) and Fujian Provincial Key Laboratory of Marine Ecological Conservation and Restoration (No.2021003).
Institutional Review Board Statement
Not applicable.
Informed Consent Statement
Not applicable.
Data Availability Statement
All data are available from the corresponding author upon reasonable request. Indicator input data are also available from the sources and links presented in the article or Appendix A.
Conflicts of Interest
The authors declared that there are no conflict of interest.
Appendix A
Table A1.
The data used to calculate the direct cost, including types of the coastline, length of the coastline, area and aggregate investment.
Table A1.
The data used to calculate the direct cost, including types of the coastline, length of the coastline, area and aggregate investment.
| Types of Coastlines | The Length of the Coastline | Aggregate Investment | |
|---|---|---|---|
| Coastline Length (km) | Area | (Million Yuan) | |
| sandy coastline | 0.15 | Dongtou Xishantou | 2.56 |
| 0.49 | Ruian Tongpan island | 3.71 | |
| 6.28 | Mamu north side coastline | 12.89 | |
| 7.51 | Jintang Northern Coastline | 11.00 | |
| 1.60 | Anchor Bay Coastline | 607.00 | |
| Silt coastline | 2.78 | Yuhuan Xuan Men | 2.04 |
| 2.64 | Zhoushan Daishan Island | 3.80 | |
| 3.72 | Zhoushan South Xiaowan | 7.81 | |
| 14.24 | Zhoushan Big Cat Island | 29.50 | |
| 2.78 | Yuhuan Xuanmen | 2.04 | |
| 5.05 | Zhoushan Pingyanpu | 10.60 | |
| 6.14 | east side of the fishing port bridge | 10.75 | |
| 1.90 | the northern side of Xue’ao | 6.20 | |
| 0.58 | Yuhuan Huaneng Power Plant | 4.75 | |
| 4.22 | Huanghe Island in Wudi County | 9.74 | |
| 0.60 | Naozhou Island | 6.11 | |
Table A2.
Evaluation system of tourism and recreation benefits after coastline reconstruction in Zhejiang province.
Table A2.
Evaluation system of tourism and recreation benefits after coastline reconstruction in Zhejiang province.
| Formula | Parameter Description |
|---|---|
| is the coastline reference price, L is the length of the coastline, W is the coastline value correction factor and the coastline for tourism and leisure is 14,051 yuan/m. | |
| is the added value coefficient of coastline occupation. | |
| is the coefficient of social factors. | |
| means shore for leisure and tourism. |
Figure A1.
The correlation scatter plot of coastline restoration length and aggregate investment. (a) Relationship between the length of sandy coastline restoration and aggregate investment; (b) Relationship between the length of silt coastline restoration and aggregate investment (Data sources are in Table A1).

References
- Liu, L.; Xu, W.; Yue, Q.; Teng, X.; Hu, H. Problems and countermeasures of coastline protection and utilization in China. Ocean. Coast. Manag. 2018, 153, 124–130. [Google Scholar] [CrossRef]
- Yu, X.Q.; Yu, J. Policy development, current problems and recommendations for coastal ecological restoration in China. Chin. Fish. Econ. 2020, 38, 8–16. [Google Scholar]
- Nan, N.; Wang, S.; Liu, Y.X. Ecosystem service value assessment: Research progress and prospect. Chin. J. Ecol. 2021, 1, 233–244. [Google Scholar]
- Arkema, K.K.; Verutes, G.M.; Wood, S.A.; Clarke-Samuels, C.; Rosado, S.; Canto, M.; Rosenthal, A.; Ruckelshaus, M.; Guannel, G.; Toft, J.; et al. Embedding ecosystem services in coastal planning leads to better outcomes for people and nature. Proc. Natl. Acad. Sci. USA 2015, 112, 7390–7395. [Google Scholar] [CrossRef] [PubMed] [Green Version]
- Luisetti, T.; Turner, R.K.; Bateman, I.; Morse-Jones, S.; Adams, C.; Fonseca, L. Coastal and marine ecosystem services valuation for policy and management: Managed realignment case studies in England. Ocean. Coast. Manag. 2011, 54, 212–224. [Google Scholar] [CrossRef]
- Yan, F.Q.; Wang, X.G.; Su, F.Z. Ecosystem service changes in response to mainland coastline movements in China: Process, pattern, and trade-off. Ecol. Indic. 2020, 116, 106337. [Google Scholar] [CrossRef]
- Zhou, P.; Zhou, T.; Peng, S.L. Measurement modalities and mythologies of ecosystem services Valuation. Acta Ecol. Sin. 2019, 15, 5379–5388. [Google Scholar]
- Chen, S.; Zhang, Z.; Ma, Y.; Shi, H.; Ma, A.; Zheng, W.; Wang, Q. Program for Service Evaluation of Marine Ecosystems in China Waters. Adv. Earth Sci. 2006, 11, 1127–1133. [Google Scholar]
- Crookes, D.J.; Blignaut, J.N.; De Wit, M.P.; Esler, K.J.; Le Maitre, D.C.; Milton, S.J.; Mitchell, S.A.; Cloete, J.; De Abreu, P.; Fourie, H.; et al. System dynamic modelling to assess economic viability and risk trade-offs for ecological restoration in South Africa. J. Environ. Manag. 2013, 120, 138–147. [Google Scholar] [CrossRef] [Green Version]
- Wainaina, P.; Minang, P.A.; Gituku, E.; Duguma, L. Cost-Benefit Analysis of Landscape Restoration: A Stocktake. Land 2020, 9, 465. [Google Scholar] [CrossRef]
- Bayraktarov, E.; Saunders, M.I.; Abdullah, S.; Mills, M.; Beher, J.; Possingham, H.P.; Mumby, P.J.; Lovelock, C.E. The cost and feasibility of marine coastal restoration. Ecol. Appl. 2015, 26, 1055. [Google Scholar] [CrossRef] [PubMed]
- Gong, J.; Yan, L.L.; Xu, C.X.; Guo, Q.H. A comparative analysis of research hotspots on ecosystem services between China and the United States in the past 30 years: Based on bibliometric research. Acta Ecol. Sin. 2020, 40, 3537–3547. [Google Scholar]
- Cao, S.; Yu, Z.; Zhang, J.; Feng, F.; Xu, D.; Mu, X. Cost–benefit analysis of ecosystem services in China. Ecol. Eng. 2018, 125, 143–148. [Google Scholar] [CrossRef]
- Mittermeier, R.A.; Mittermeier, C.G.; Brooks, T.M.; Pilgrim, J.D.; Konstant, W.R.; da Fonseca, G.A.B.; Kormos, C. Wilderness and biodiversity conservation. Proc. Natl. Acad. Sci. USA 2003, 100, 10309–10313. [Google Scholar] [CrossRef] [PubMed] [Green Version]
- Wang, Q.; Liu, B.; Xiang, H. Study on Comprehensive Management and Control Strategies of Natural Coastal Lines in Zhejiang Province. J. Green Sci. Technol. 2019, 8, 21–25. [Google Scholar]
- OECD. Cost-Benefit Analysis and the Environment: Further Developments and Policy Use; OECD Publishing: Paris, France, 2018. [Google Scholar]
- Lu, C.X.; Zhang, Y.J.; Cheng, S.K.; Xie, G.D. Analysis on opportunity cost of Daliushu Project in Yellow River. J. Hydraul. Eng. 2003, 10, 124–128. [Google Scholar]
- Li, C.; Ge, Y.X. Water Ecological Compensation Cost Accounting of Background of Sustainable Development. Reform 2013, 11, 106–112. [Google Scholar]
- Hu, H.C.; Cao, H.; Hao, Z.J. Research on the Method of Determining Ecological Compensation Standard. Value Eng. 2018, 3, 100–103. [Google Scholar]
- TEEB. The Economics of Ecosystems and Biodiversity: Ecological and Economic Foundations; Kumar, P., Ed.; Earthscan: London, UK; Washington, DC, USA, 2010. [Google Scholar]
- Zhang, Q.F.; Bai, J.; Ma, Y.Y.; Gao, W.S.; Tu, J.B. Research on the method for evaluating ecological restoration effect in the coastal zone of Tianjin. Mar. Environ. Sci. 2019, 5, 782–789. [Google Scholar]
- Ministry of Construction, National Development and Reform Commission. Economic Evaluation Method and Parameters for Construction Project, 3rd ed.; China Planning Press: Beijing, China, 2006. [Google Scholar]
- De Groot, R.S.; Blignaut, J.; Van Der Ploeg, S.; Aronson, J.; Elmqvist, T.; Farley, J. Benefits of investing in ecosystem restoration: Investing in ecosystem restoration. Conserv. Biol. 2013, 27, 1286–1293. [Google Scholar] [CrossRef] [Green Version]
- Su, J.; Friess, D.A.; Gasparatos, A. A meta-analysis of the ecological and economic outcomes of mangrove restoration. Nat. Commun. 2021, 12, 5050. [Google Scholar] [CrossRef] [PubMed]
- Costanza, R.; d’Arge, R.; de Groot, R.; Farber, S.; Grasso, M.; Hannon, B.; Limburg, K.; Naeem, S.; O’Neill, R.V.; Paruelo, J.; et al. The value of the world’s ecosystem services and natural capital. Nature 1997, 387, 253–260. [Google Scholar] [CrossRef]
- Mei, X.Y.; Zhang, X.F. Carbon storage and fixation by a typical wetland vegetation in Changjiang River Estuary—A case study of Phragmites australis in east beach of Chongming Island. Chin. J. Eco-Agric. 2008, 2, 269–272. [Google Scholar] [CrossRef]
- Yu, H.B. Benefit Analysis and Strategy Study on Mangrove Introduction and Afforestation in South Zhejiang Province. Master’s Thesis, Ningbo University, Ningbo, China, 2011; p. 4. [Google Scholar]
- Gao, J.; Yuan, Z.; Liu, X.; Xia, X.; Huang, X.; Dong, Z. Improving air pollution control policy in China—A perspective based on cost–benefit analysis. Sci. Total Environ. 2016, 543, 307–314. [Google Scholar] [CrossRef] [PubMed]
- Zhang, J.; Shen, G.; Chen, C.; Jiao, J.; Gao, H.; Gan, H.; Wu, C.; Zhu, J.; Yuan, W.; Jiang, B. Ecosystem Services and Their Valuation of Muddy Coastal Backbone Forest Belt of Protection in Zhejiang province. J. Zhejiang For. Sci. Technol. 2014, 3, 51–56. [Google Scholar]
- Yu, J. Study of Ecological Value and Ecological Compensation of Wetland in Yellow River Delta Nature Reserve. Master’s Thesis, Shandong Normal University, Jinan, China, 2015; p. 6. [Google Scholar]
- Jin, X.C.; Jiang, X.; Xu, Y.H. Seasonal variation of dissolved nitrogen and phosphorus in sediments in northeast part of Lake Taihu. China Environ. Sci. 2006, 4, 409–413. [Google Scholar]
- Han, W.D.; Gao, X.M.; Lu, C.Y. The Ecological Values of Mangrove Ecosystems in China. Ecol. Sci. 2000, 1, 40–46. [Google Scholar]
- He, B.Y.; Fan, H.Q.; Wang, M.; Lai, T.H.; Wang, W.Q. Species diversity in mangrove wetlands of China and its causation analyses. Acta Ecol. Sin. 2007, 11, 4859–4870. [Google Scholar]
- Glover, R.S.; Tait, R.V. Elements of marine ecology: An introductory course. Q. Rev. Biol. 1981, 2, 377. [Google Scholar] [CrossRef]
- Ren, G.C.; Yang, D. Estimation of Direct Non-economic Loss Caused by Red Tide Disaster in Maritime Space of Zhejiang. Heilongjiang Agric. Sci. 2011, 3, 113–115. [Google Scholar]
- Lu, Z.B.; Du, Q.; Yang, Y.M. Estimation of suitable cultivable area and nutrient capacity of shellfish in Xiamen coastal waters. J. Oceanogr. Taiwan Strait 1999, 2, 3–5. [Google Scholar]
- Tang, Z.W.; Cheng, J.L.; Yue, Y.; Chen, Y.M. Accumulations and risks of heavy metals in the sediments from 8 typical lakes in Wuhan, China. J. Lake Sci. 2009, 1, 61–68. [Google Scholar]
- Li, W.J. Research on the Coastline Valuation. Ph.D. Thesis, China University of Geosciences, Wuhan, China, 2016; p. 5. [Google Scholar]
- Chen, Q.X.; Yang, S.; Wang, J.W.; Zhen, J.; Deng, R.J. Development history and discussion of mangrove forest in Zhejiang Province. J. Zhejiang Agric. Sci. 2019, 7, 1177–1181. [Google Scholar]
- O’Mahony, T. Cost-Benefit Analysis and the environment: The time horizon is of the essence. Environ. Impact Assess. Rev. 2021, 89, 106587. [Google Scholar] [CrossRef]
- Ji, D.W.; Tian, H.J.; Wang, Y.J.; Pan, S. The Progress and Management Suggestions for Coastal Zone Renovation and Restoration Project. Ocean. Dev. Manag. 2016, 5, 87–90. [Google Scholar]
- Hu, P.; Yang, L.J. Preliminary Study on the Evaluation Method of Coastline Ecological Value. Price Theory Pract. 2019, 10, 133–136. [Google Scholar]
- Chen, H.J. The ecosystem service value of maintaining and expanding terrestrial protected areas in China. Sci. Total Environ. 2021, 5, 146768. [Google Scholar] [CrossRef]
- Walz, Y.; Janzen, S.; Narvaez, L.; Ortiz-Vargas, A.; Woelki, J.; Doswald, N.; Sebesvari, Z. Disaster-related losses of ecosystems and their services. Why and how do losses matter for disaster risk reduction? Int. J. Disaster Risk Reduct. 2021, 63, 102425. [Google Scholar] [CrossRef]
- Fan, H.Q. An Ecological Pattern of Sea Dyke Maintenance by Mangroves and Assessment of Its Benefits along Guangxi Coast. Guangxi Sci. 1995, 04, 48–52. [Google Scholar]
- Xu, W.; Tao, A.F.; Liu, J.H.; Chen, C.; Yu, F.; Zhang, Z.Y. The Enlightenment of international Coastal Zone Ecological protection China’s Ecological Sea Dike Construction. Ocean. Dev. Manag. 2019, 10, 12–15. [Google Scholar]
- Tang, D.H.; Xia, Z.; Cui, Z.A.; Gan, H.Y.; Hou, J.M.; Liu, X.J. Progress and Prospect of marine environmental impact assessment and ecological restoration. Coast. Eng. 2020, 39, 1–12. [Google Scholar]
- Ouyang, Y.R.; Dai, J.J.; Wu, Y.J. Study on the performance evaluation indicator system for marine ecological restoration projects. J. Appl. Oceanogr. 2021, 1, 91–99. [Google Scholar]
Figure 1.
The study areas in Zhejiang Province of China. Zhejiang’s five coastal cities are Jiaxing, Ningbo, Zhoushan, Taizhou, and Wenzhou.
Figure 1.
The study areas in Zhejiang Province of China. Zhejiang’s five coastal cities are Jiaxing, Ningbo, Zhoushan, Taizhou, and Wenzhou.

Figure 2.
The analyzing framework of costs and ecosystem services (ES) for the three-year coastline ecological restoration project in the coastal cities of Zhejiang.
Figure 2.
The analyzing framework of costs and ecosystem services (ES) for the three-year coastline ecological restoration project in the coastal cities of Zhejiang.

Figure 3.
The net ecosystem services value (NES) of five coastal cities over the next 30 years after the project in Zhejiang Province.
Figure 3.
The net ecosystem services value (NES) of five coastal cities over the next 30 years after the project in Zhejiang Province.

Figure 4.
The initial costs including both direct and indirect cost invested in the project by the five coastal cities of Zhejiang (Wenzhou, Taizhou, Ningbo, Jiaxing and Zhoushan).
Figure 4.
The initial costs including both direct and indirect cost invested in the project by the five coastal cities of Zhejiang (Wenzhou, Taizhou, Ningbo, Jiaxing and Zhoushan).

Figure 5.
The correlation scatter plot of costs (including total initial cost and management cost) and value of ecosystem services (VES).
Figure 5.
The correlation scatter plot of costs (including total initial cost and management cost) and value of ecosystem services (VES).

Figure 6.
The correlation scatter plot of coastline restoration length and (a) NES; (b) NES per unit coastline restoration length.
Figure 6.
The correlation scatter plot of coastline restoration length and (a) NES; (b) NES per unit coastline restoration length.

Figure 7.
Sensitivity analysis for discount rate, management cost and period of investment return to NES. The red, gray and yellow lines indicate 5, 10, and 30 years periods of investment return, respectively. Circle markers indicate the discount rate and the triangle markers indicate management cost.

Table 1.
Direct cost of the coastline ecological restoration project in five coastal cities of Zhejiang.
Table 1.
Direct cost of the coastline ecological restoration project in five coastal cities of Zhejiang.
| Region | Total Length of Coastline Restoration (km) | Length of Silt Coastline Restoration (km) | Cost of Silt Coastline Restoration | Length of Sandy Coastline Restoration (km) | Cost of Sandy Coastline Restoration | Total Cost |
|---|---|---|---|---|---|---|
| Ningbo | 110.07 | 100.52 | 19,076.46 | 9.55 | 1521.07 | 20,597.53 |
| Wenzhou | 60.00 | 30.71 | 5885.16 | 29.29 | 3999.03 | 9884.19 |
| Jiaxing | 9.30 | 9.30 | 1839.53 | 0.00 | 0.00 | 1839.53 |
| Zhoushan | 92.22 | 66.49 | 12,646.15 | 25.73 | 3552.15 | 16,198.29 |
| Taizhou | 71.00 | 55.19 | 10,510.90 | 15.81 | 2306.89 | 12,817.79 |
According to the statistical results about coastline types in Zhejiang, the ratio of the sandy coastline lengths and the silt coastline lengths are obtained, and the length of the silt and sandy coastline ecological restoration for each city is calculating according to the same ratio. The types of coastline restoration in Zhoushan include silt coastline, bedrock coastline, and sandy coastline. In order to facilitate the calculation and comparison, the study merges the length of the bedrock coastline ecological restoration to the length of the sandy coastline ecological restoration.
Table 2.
Indirect cost of the coastline ecological restoration project in five coastal cities of Zhejiang.
Table 2.
Indirect cost of the coastline ecological restoration project in five coastal cities of Zhejiang.
| Region | Total Cost | ||
|---|---|---|---|
| Ningbo | 3822 | 126,381.72 | 130,203.72 |
| Jiaxing | 1290 | 0.00 | 1290 |
| Wenzhou | 220 | 37,664.83 | 75,549.65 |
| Zhoushan | 2323 | 0.00 | 2323 |
| Taizhou | 5418 | 100,538.51 | 105,956.51 |
The data on the enterprise opportunity cost comes from the “Zhejiang Environmental Illegal Blacklist” published by the Zhejiang Provincial Ministry of Ecological Environment. We can obtain the situation of shutting down and punishing enterprises in each city within three years. The data of Resident opportunity cost derived from the “China Ocean Yearbook” and “Zhejiang Province Implementation of the Central Environmental Protection Inspector Feedback Rectification Implementation Report.” The estimation of fish pond restoration cost came from the “Funding Subsidy and Acceptance Measures for the Treatment of Tail Water from Seawater Pond Aquaculture in Yueqing City.” The government opportunity cost was ignored.
Table 4.
The valuation results of the VES in Zhejiang’s five coastal cities after the coastline ecological restoration project.
Table 4.
The valuation results of the VES in Zhejiang’s five coastal cities after the coastline ecological restoration project.
| Region | |||||||
|---|---|---|---|---|---|---|---|
| Climate Regulation | Flood Protection | Waste Purification | Scientific Research | Tourism and Entertainment | |||
| Wenzhou | 63.70 | 27.71 | 2.52 | 6.36 | 75,889.45 | 14.24 | 76,003.98 |
| Taizhou | 114.49 | 49.80 | 4.52 | 6.36 | 79,161.23 | 25.59 | 79,361.98 |
| Ningbo | 88.37 | 90.71 | 0.11 | 6.36 | 122,722.2 | 46.13 | 122,953.88 |
| Jiaxing | 8.18 | 8.39 | 0.01 | 6.36 | 11,414.40 | 4.27 | 11,441.61 |
| Zhoushan | 58.45 | 60.00 | 0.08 | 6.36 | 115,346.30 | 30.51 | 115,501.70 |
Table 5.
The cumulative ecosystem services values (VES), cumulative costs, cumulative net values of ecosystem services (NES) over the return periods, discount rates and BCR for the study areas included in our analysis based on the above data results.
Table 5.
The cumulative ecosystem services values (VES), cumulative costs, cumulative net values of ecosystem services (NES) over the return periods, discount rates and BCR for the study areas included in our analysis based on the above data results.
| Region | Year | Discount Rate | VES/Billion Yuan | Cost/Billion Yuan | NES/Billion Yuan | BCR |
|---|---|---|---|---|---|---|
| Wenzhou | 5 years | 8% | 3.03 | 0.94 | 2.09 | 3.24 |
| 10 years | 8% | 5.10 | 0.99 | 4.11 | 5.13 | |
| 30 years | 6% | 10.46 | 1.14 | 9.32 | 9.14 | |
| Taizhou | 5 years | 8% | 3.17 | 1.31 | 1.86 | 2.42 |
| 10 years | 8% | 5.33 | 1.39 | 3.94 | 3.83 | |
| 30 years | 6% | 10.92 | 1.60 | 9.32 | 6.83 | |
| Ningbo | 5 years | 8% | 4.91 | 1.66 | 3.25 | 2.96 |
| 10 years | 8% | 8.25 | 1.76 | 6.49 | 4.68 | |
| 30 years | 6% | 16.92 | 2.03 | 14.89 | 8.34 | |
| Jiaxing | 5 years | 8% | 0.46 | 0.03 | 0.43 | 13.76 |
| 10 years | 8% | 0.77 | 0.04 | 0.73 | 27.71 | |
| 30 years | 6% | 1.57 | 0.04 | 1.53 | 38.40 | |
| Zhoushan | 5 years | 8% | 4.61 | 0.21 | 4.40 | 22.13 |
| 10 years | 8% | 7.75 | 0.22 | 7.53 | 35.09 | |
| 30 years | 6% | 15.90 | 0.25 | 15.65 | 62.76 |
Publisher’s Note: MDPI stays neutral with regard to jurisdictional claims in published maps and institutional affiliations. |
© 2022 by the authors. Licensee MDPI, Basel, Switzerland. This article is an open access article distributed under the terms and conditions of the Creative Commons Attribution (CC BY) license (https://creativecommons.org/licenses/by/4.0/).
Share and Cite
MDPI and ACS Style
Zhang, Y.; Lin, H.; Ye, G. Long-Term Benefits of Coastline Ecological Restoration in China. J. Mar. Sci. Eng. 2022, 10, 541. https://doi.org/10.3390/jmse10040541
AMA Style
Zhang Y, Lin H, Ye G. Long-Term Benefits of Coastline Ecological Restoration in China. Journal of Marine Science and Engineering. 2022; 10(4):541. https://doi.org/10.3390/jmse10040541
Chicago/Turabian StyleZhang, Yaowen, Haoli Lin, and Guanqiong Ye. 2022. "Long-Term Benefits of Coastline Ecological Restoration in China" Journal of Marine Science and Engineering 10, no. 4: 541. https://doi.org/10.3390/jmse10040541
Note that from the first issue of 2016, this journal uses article numbers instead of page numbers. See further details here.