Article

Effects of Land Use/Land Cover Changes on Carbon Storage in North African Coastal Wetlands

1
Geophysics and Natural Hazards Laboratory, GEOPAC Research Center, Scientific Institute, Mohammed V University in Rabat, Rabat 10000, Morocco
2
Faculty of Sciences, Mohammed V University in Rabat, 4 Avenue Ibn Battota, B.P. 1014, Rabat 10000, Morocco
3
Louisiana Universities Marine Consortium, 8124 Highway 56, Chauvin, LA 70344, USA
*
Author to whom correspondence should be addressed.
J. Mar. Sci. Eng. 2022, 10(3), 364; https://doi.org/10.3390/jmse10030364
Submission received: 28 December 2021 / Revised: 25 February 2022 / Accepted: 26 February 2022 / Published: 4 March 2022
(This article belongs to the Special Issue Coastal Wetlands)

Abstract

:
Healthy wetlands are among the most effective sinks for carbon on the planet, and thus contribute to mitigate climate change. However, in North Africa, coastal wetlands are under high pressure especially from urban sprawl and tourism development, due to the rapid population growth and migration. This paper analyzed the effects of land use/land cover changes on carbon stocks, over 20 years, in six North African coastal wetlands, and estimated the economic value of the carbon sequestered during the considered period. The methodology used combined remote sensing and modeling. The results showed that among the six studied sites, only two (Moulouya and Moulay Bouselham) showed an increase in stored carbon and therefore are potential carbon sinks. In turn, the other four showed a more or less significant loss of carbon, which will likely be released into the atmosphere. The underlying processes that drive changes in carbon dynamics are mainly urban expansion and land use conversion, which often occurs at the expense of the natural habitats surrounding the wetlands. Understanding these processes can provide valuable decision-making information for land use planning, wetlands conservation and carbon reduction policies.

1. Introduction

Coastal wetlands are among the most productive and biologically diverse ecosystems in the world [1], generally ranked second behind tropical rainforests. As such, they provide multiple goods and services, including food provisioning, climate regulation, flood protection, freshwater storage, hydrological balance, water purification, recreation and tourism, that contribute to the well-being of humanity and poverty reduction [2,3,4,5,6,7]. Coastal wetlands, particularly in the Mediterranean and North Africa region, are important for helping to mitigate climate change as they help to manage extreme weather events through buffering floods and coastal storm-surges and providing water in droughts [8]. Consequently, the development of methods and mapping tools for quantifying ecosystem services (ES) is increasingly seen as a priority for the implementation of measures to protect or rehabilitate coastal wetlands [9]. It can also help raise awareness of the non-market values of the provided services [10,11,12,13].
Wetlands are also important for many biogeochemical processes [13,14], and without wetlands, the cycles of water, carbon and nutrients would be altered. The high productivity of these systems removes CO2 from the atmosphere [15,16], while the depositional capacity of many of them, coupled with slow rates of organic matter decomposition, can create large reservoirs of carbon that are, in some cases, stable for long periods of time [17]. Therefore, due to their high primary productivity and carbon stock potential, wetlands are considered a cost-effective response to lower the CO2 density and mitigate climate change [9,10].
The carbon stored by coastal ecosystems is coined as ‘coastal blue carbon’. This is the organic carbon fixed by coastal plants, including salt marshes, mangroves and seagrasses [7,18,19,20]. In recent years, blue carbon research has been rising gradually and numerous studies all over the world have quantified the carbon stored in the sediment of vegetated coastal habitats [18,21,22,23,24,25,26,27]. According to [18], the carbon sink capacity of these coastal ecosystems is approximately 10 times more than that of terrestrial ecosystems.
Healthy wetlands are therefore among the most effective sinks for carbon on the planet, and thus contribute to mitigate climate change [15]. However, wetlands are one of the most fragile and threatened ecosystems and are highly vulnerable to climate and non-climate forcing [28]. Draining wetlands or reducing their water resources can result in the release of large amounts of stored carbon, transforming them from carbon sinks to carbon sources. According to [27], the earth loses about 50% of coastal blue carbon due to anthropogenic and climate change impacts.
In the Mediterranean region, the pressure on coastal wetlands is likely to intensify in the coming decades due to increased demand for land and water and to climate change impacts [29,30,31]. On the south shore, in particular, desertification and the search for better employment opportunities, have pushed rural populations to migrate to coastal cities, increasing the already existing pressures on coastal space and resources. Indeed, the coastal strip is increasingly populated and built up, threatening the functioning, even the existence of coastal wetlands [32]; it is generally recognized that wetlands lost to development lose their functions and services, often irreversibly [33].
Furthermore, the full value of the benefits provided by these ecosystems, particularly in North Africa, is often not reflected in policy decisions, due to the lack of information and knowledge of this value, which hinders effective decision-making regarding investments, conservation efforts and management [34,35]. Understanding the critical importance of wetlands for mitigating the effects of climate change is therefore crucial, in particular in the North African region [36], where blue carbon storage capacity has not been documented well. The few existing studies were carried out in coastal lakes of Egypt [37].
Several methods have been used to quantify coastal carbon. These include carbon flux measurements, carbon pool measurements, manipulative experiments and modeling [38,39]. Tang et al. [39] analyzed the advantages and disadvantages of these quantitative methods and showed that (i) although useful for understanding the mechanisms and processes of carbon stock evolution, carbon flux measurements are complex, with potential large errors, and will not give information on the contributions of different carbon fluxes to the carbon stock; (ii) measurement of changes in soil or sediment requires cored soil samples and stratification age and carbon content using radioisotopes methods; (iii) field manipulative experiments are very costly; and (iv) model research often use easily measurable parameters as inputs, such as meteorological factors, vegetation structures and other data that can be obtained from remote sensing. The Blue Carbon Initiative report on “Methods for assessing carbon stocks and emissions factors in mangroves, tidal salt marshes, and seagrass meadows” [38] has also raised a number of impediments that prevent carrying out such studies; one of them is that field surveys can be very costly, difficult and/or hazardous. For this reason, and in some developing countries such as in North Africa, the use of remote sensing can provide unique and valuable information on coastal ecosystem extent, vegetation structure and land use change over time [40]. Klemas [41] also stated that one of the key advantages of remote sensors is that they can assess long-term LULC changes faster, more completely and at lower cost per unit area than field or ship surveys.
The most widely used model is the InVest Carbon Storage and Sequestration model (InVEST-CSS), coupled with remote sensing, which allows to quantify the amount of carbon sequestered in a landscape [27,39]. This model has many advantages, such as open-source software use to map and value the goods and services; it is applicable across the globe; a flexible scale; and biophysical and economic outputs.
The present paper aims to analyze the effects of land use/land cover (LULC) changes on carbon stocks on a regional scale. For this, six coastal wetlands, which differ physically and ecologically, as well as in terms of human impacts, have been selected in North Africa (Morocco, Algeria and Tunisia). The objectives of this work are (1) to measure the LULC area change over the last two decades (1999 to 2019); (2) to identify and quantify the carbon stocks in per-unit type of habitat; (3) to quantify the spatial distribution and dynamic variation of carbon stocks in response to LULC change; and (4) to estimate the economic value of the carbon sequestered over time. Results from this study are valuable for national carbon accounting programs and for monitoring climate mitigation and adaptation strategies. They also will help prioritize the conservation and restoration efforts of coastal wetlands.

2. Materials and Methods
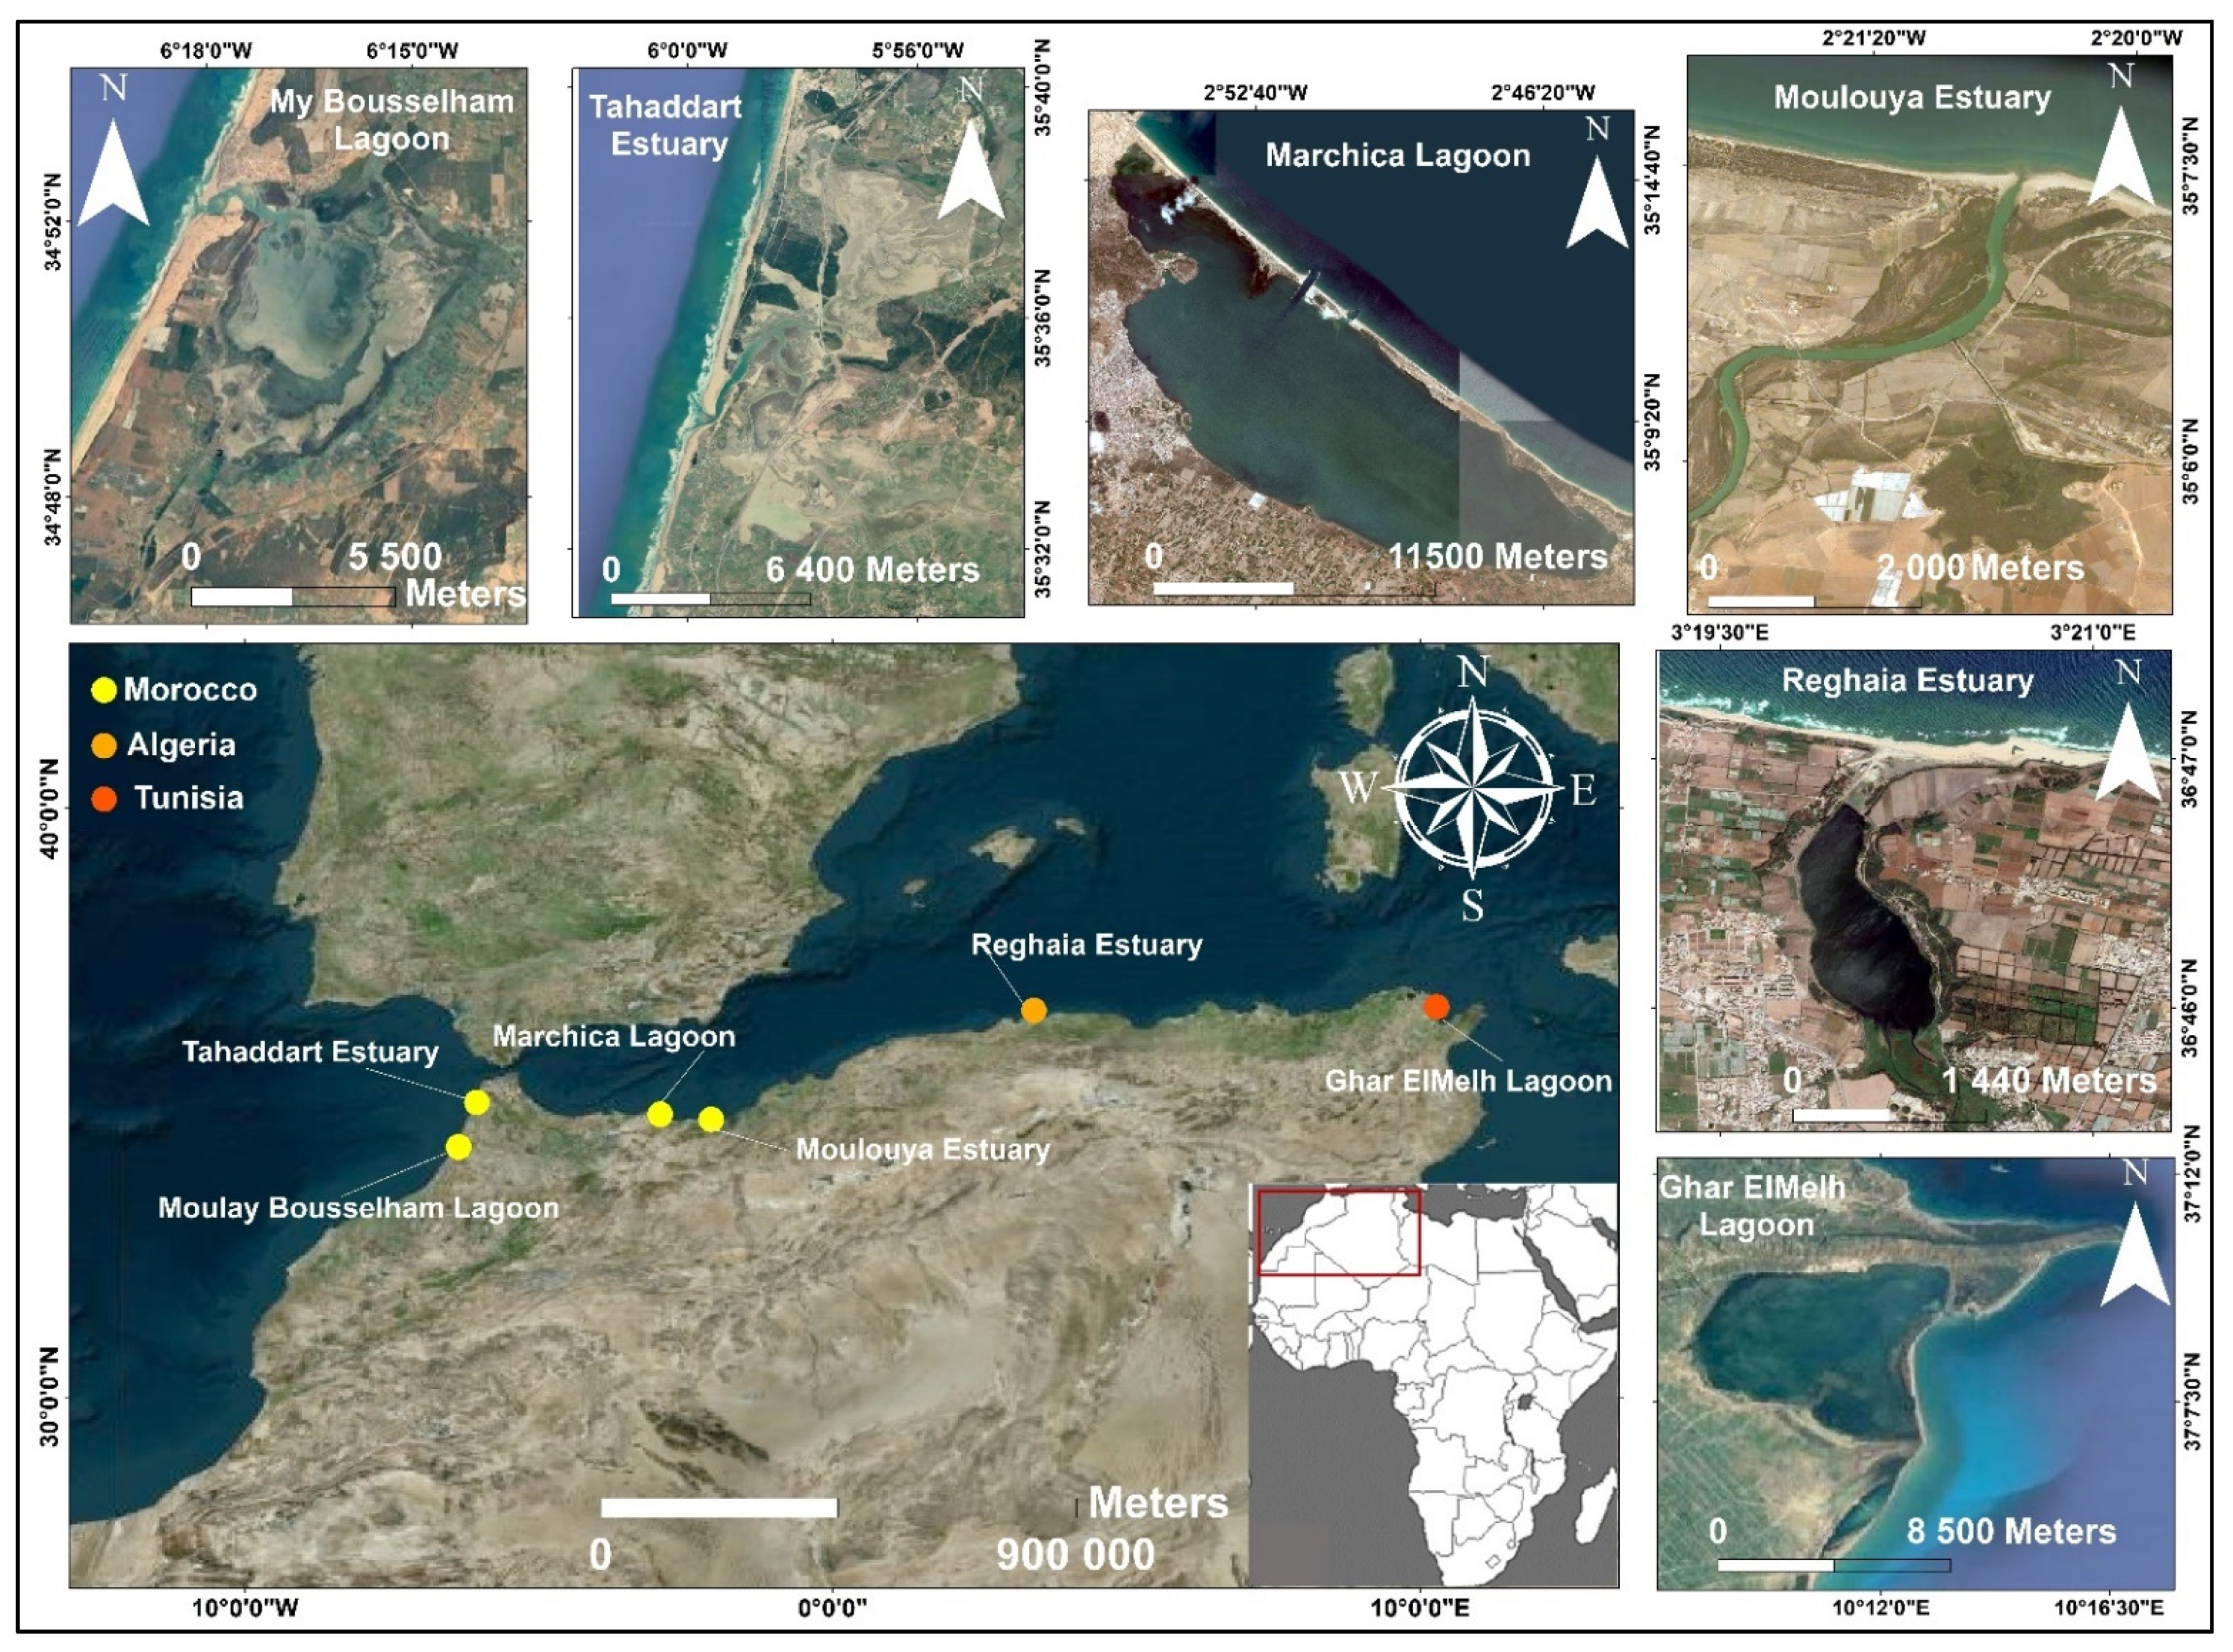
2.1. Study Area

This study covered a range of six coastal wetlands: three lagoons (Moulay Bouselham, Marchica and Ghar El Melh) and three estuaries (Tahaddart, Moulouya and Reghaia), located in northwestern Africa (Figure 1). They belong to two distinct oceanographic regions, the Mediterranean Sea and the Atlantic Ocean, and also fall under distinct geomorphological regimes such as flooded river valleys or back-barrier coastal wetlands. The surface area varies between 30 km2 for the Moulouya wetland and 115 km2 for the Marchica lagoon. The climate is characterized by a semi-arid Mediterranean type, with markedly irregular precipitations and two distinct seasons: the cold and wet season, where precipitation is relatively high and the temperature is low; and a hot and dry season, with marginal precipitations and high temperatures. Finally, the selected sites differ somewhat by their ecological characteristics, but share similar economic activities and human pressures (Table 1). The availability of data on North African wetlands was also a determining factor in the choice of these sites. All of the six wetlands are Ramsar-designated sites and are also recognized by national regulations as sites of biological and ecological interest.

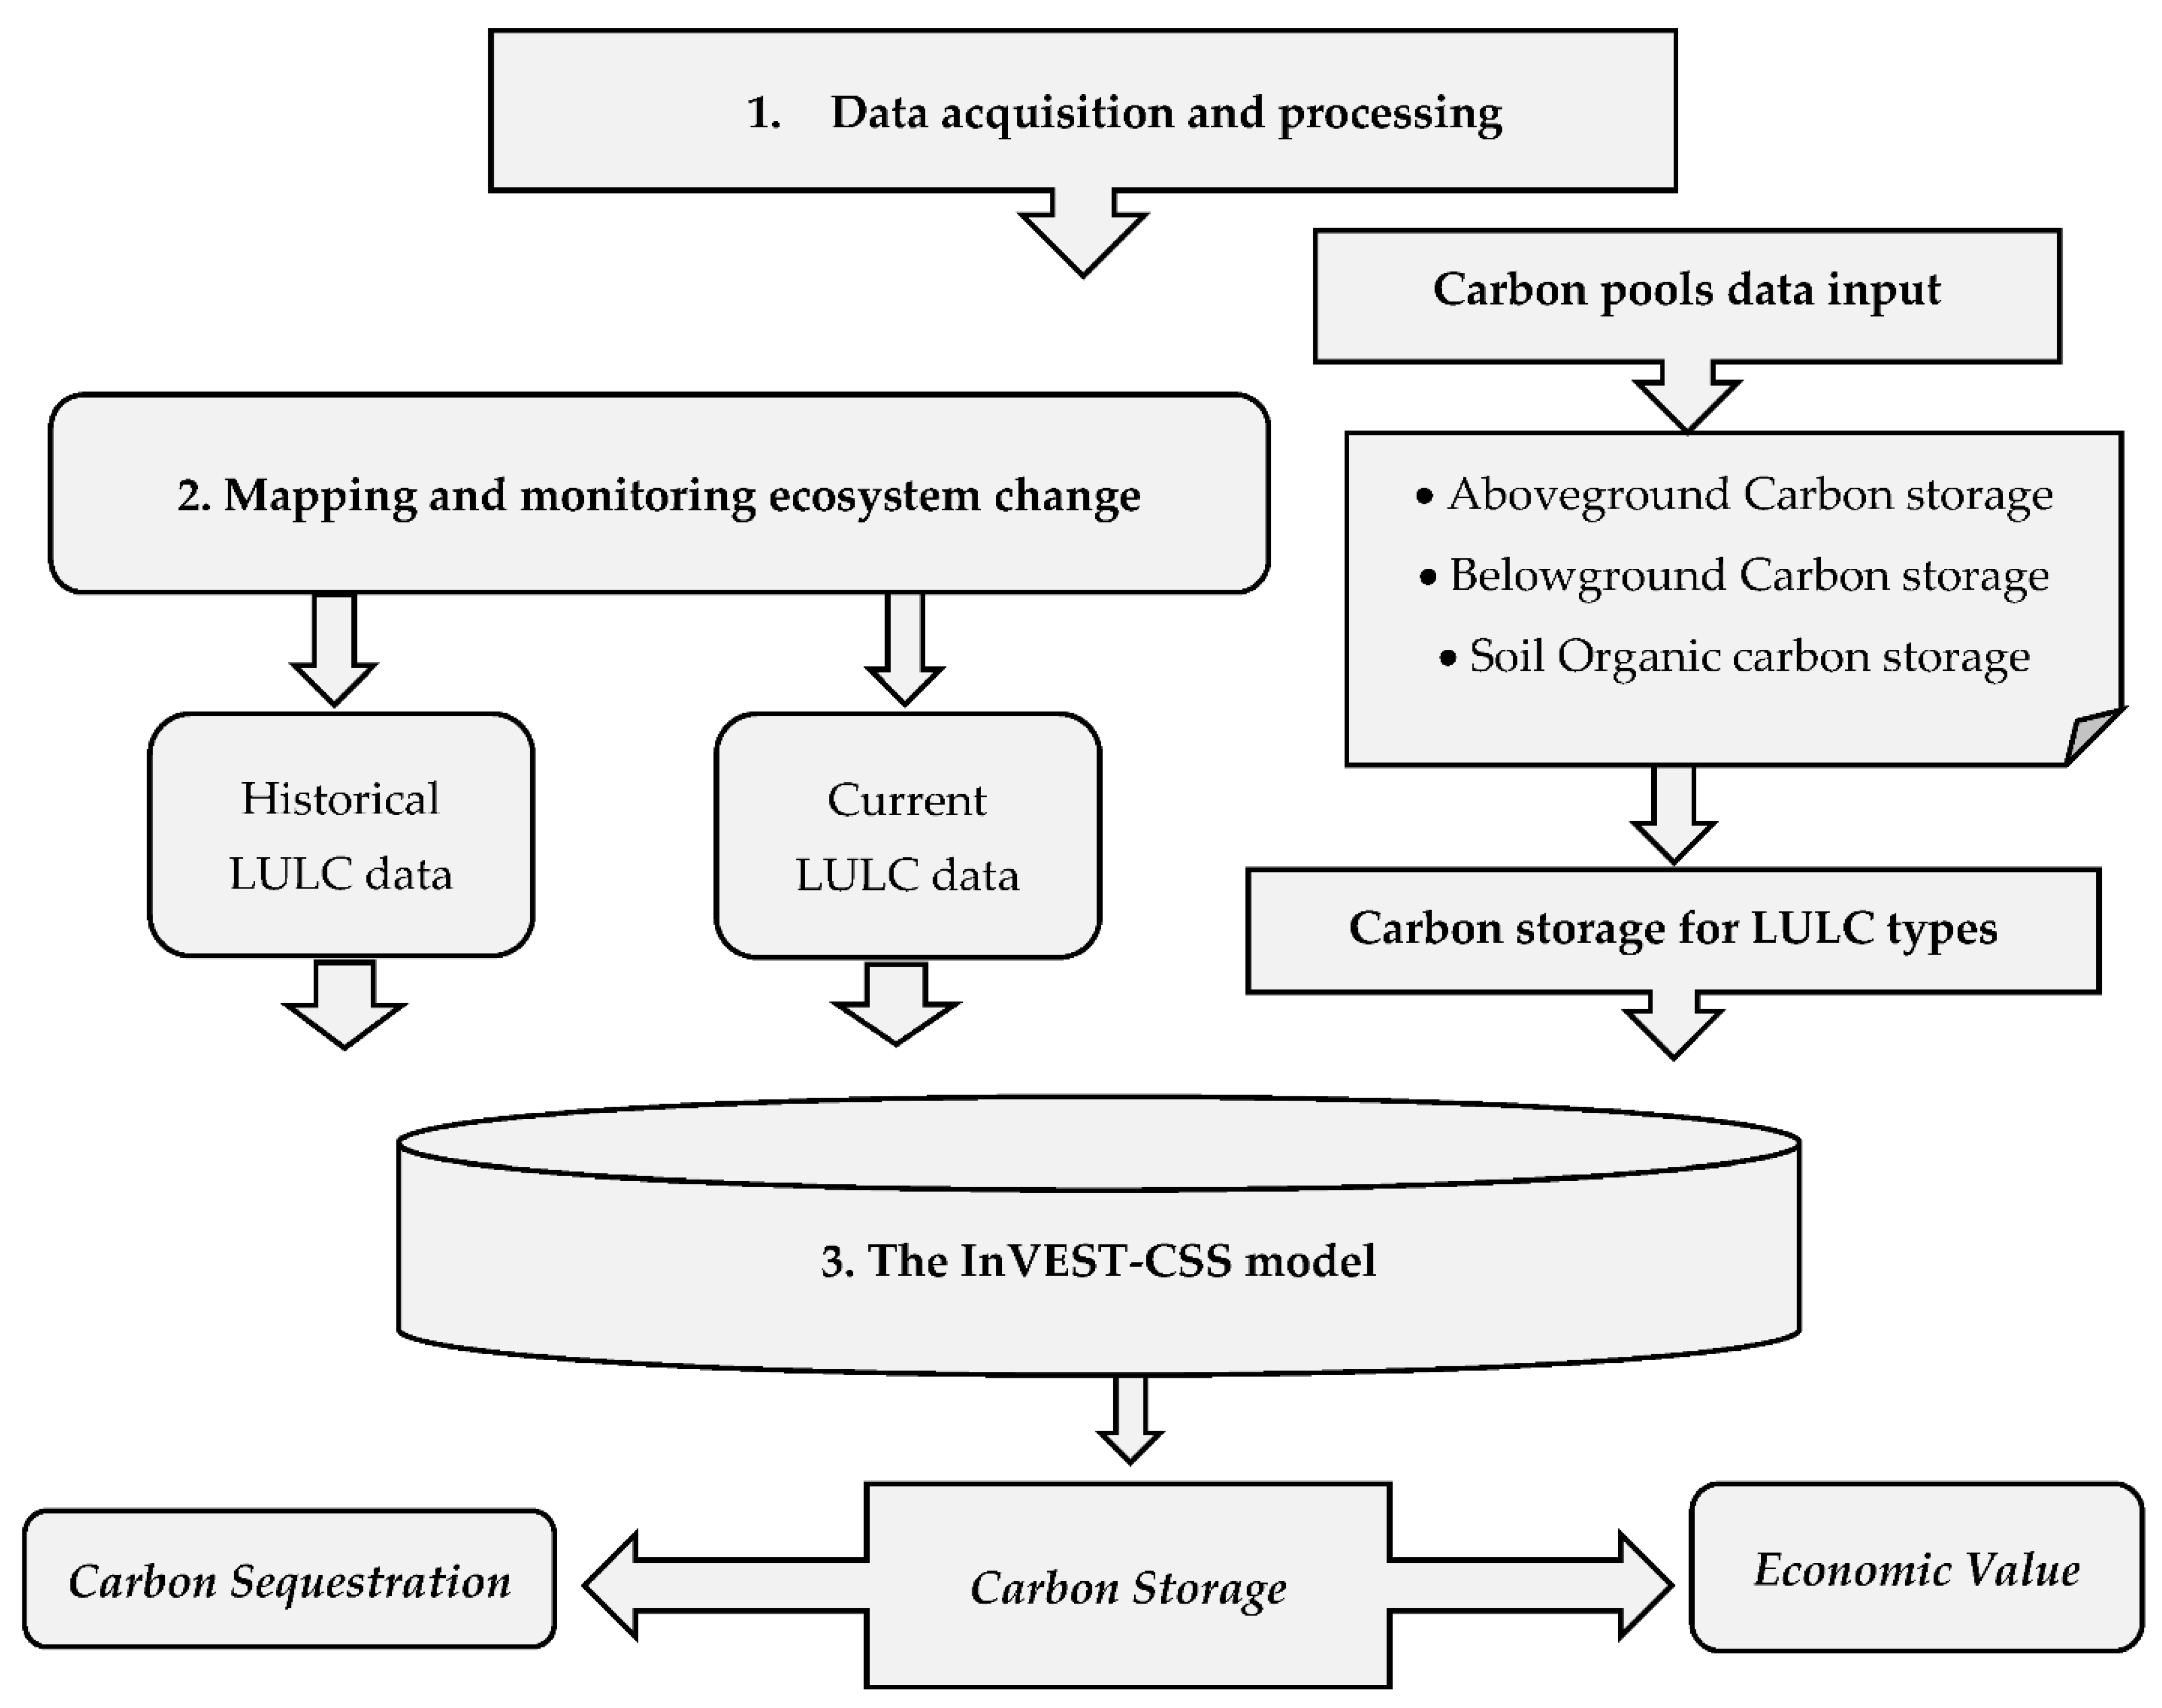
2.2. Methodological Approach

The methodological approach used in this study is based on the combination of remote sensing and modeling. Figure 2 illustrates the flowchart of the main steps used in this approach. The first step aims to determine the data acquisition and processing, and the second step is devoted to mapping the historical and current land use/land cover (LULC) and defining carbon density data. This information is necessary to estimate the carbon stocks in the different habitats of the studied wetlands, using the “Integrated Valuation of Environmental Services and Tradeoffs” (InVEST) carbon storage and sequestration (CSS) model [42,43,44], which is the third step. Findings allow to show the dynamics of carbon stocks over time in response to LULC changes and then to estimate the carbon sequestration potential. The InVEST-CSS model also allowed to quantify the marginal value of carbon storage and sequestration in the studied wetlands.

2.3. Data Acquisition and Processing

InVEST model required (i) data on land use and land cover changes over time, which were obtained by visual interpretation of two high-resolution satellite images (Google Earth and Landsat Thematic Mapper); and (ii) data on carbon in four carbon pools aboveground biomass, belowground biomass, soil biomass, and dead carbon matter [45,46,47]. To estimate carbon storage in each grid cell, the maps of land use/land cover types were associated with the carbon pools. Data were processed using the thematic mapper for the maps of 1999 and the orthophotos of 2019. The carbon pools included the aboveground biomass and encompasses all living plants above the soil; the belowground biomass comprises the living roots of all the aboveground biomass; the soil organic matter contains the organic components of the soil; and the dead organic carbon includes the litter and lying and standing dead wood. The values of carbon density in the different LULC habitats used in this study were collected from InVEST database and related research from the literature. The data sources used in this study are listed in Table 2.

2.4. Mapping and Monitoring Ecosystem Change

The delimitations we used for each site in this study are those defined by Ramsar, which include the whole areas of conservation and international interest. The LULC maps of 1999 and 2019 were extracted from the Ramsar website (https://rsis.ramsar.org/, accessed on 24 June 2021), and combined with the orthophotos of high-resolution Google satellite images for 2019 and the Landsat Thematic Mapper images for 1999, along with the field-trip mapping. The maps were classified using the “Supervisor” classification tool and were digitalized using a geographic information system (GIS). To measure the accuracy of the classification results, we used the Kappa coefficient test developed by Rosenfield and Fitzpatrick-Lins [59], for which the average equals 0.95. The images were selected during similar tidal ranges in order to avoid the tidal fluctuations affecting the water body surface change, especially in the Atlantic coastal wetlands.
To homogenize the LULC in the different study areas, the landscape patterns were subdivided into six LULC types: Water Bodies (including fresh, brackish and salt water), Unused Land (including bare land), Cultivated Land (including grassland and cultivated land), Forest Land (including alluvial forests and all types of forests), Natural Land (including the intertidal mud flats and salt marshes), and Built-up Land (including the rural and urban built-up area, touristic infrastructure and industrial areas).

2.5. The InVEST-CSS Model

The InVEST-CSS Model is a geospatial modeling tool, widely used to assess the impacts of land use changes on carbon storage over time [27]. It was developed by Stanford University in the framework of the Natural Capital Project [16,46] and was applied across the globe by different authors [27,42,43,44,45,60,61,62,63]. The CSS model considers changes in the amount of atmospheric carbon dioxide resulting from changes in land use generated by human activities. These changes can affect the significant carbon storage and sequestration potential of coastal ecosystems, including wetlands. The model uses a simplified carbon cycle approach by summing the carbon stored in different carbon pools; then by integrating the carbon density data in the four considered pools (aboveground biomass, belowground biomass, soil organic carbon and dead organic matter) with LULC changes, the model allows to quantify the net changes in carbon stocks over time [64].
The values of carbon density in different LULC habitats used in this study were collected from the InVEST database and related research from the literature [54,55,56,57]. Carbon sequestration, expressed in megagram per hectare (Mg/ha), is calculated as the difference between the carbon stocks in 2019 and those in 1999.
To calculate the carbon density, we used the Equation (1):
C = Ci × Ai
where Ci is the carbon storage (Mg/ha) for LULC habitat i, and Ai the area of the LULC habitat.
Then the model calculates the total carbon storage in a given study area (TC) in the current time (2019) and in the past time (1999) following Equation (2):
TC = ∑Ca,b,s,d
where Ca is the carbon storage density of the aboveground biomass, Cb the carbon storage density of the belowground biomass, Cs the carbon storage density of the soil biomass, and Cd the carbon storage density of the dead organic matter for each LULC habitat.
Carbon sequestration is calculated as the difference between the carbon stocks over time (Equation (3)). It can only be calculated if carbon stocks increase over time:
Cseq = TC2 − TC1
where Cseq represents the carbon sequestration in megagram per hectare (Mg/ha) for the LULC habitat, TCs2 is the carbon storage in the LULC habitat of 2019 and TCs1 is the carbon storage in the LULC habitat i of 1999.
The social cost of carbon (SCC), which represents the incremental impact of emitting an additional ton of carbon dioxide, or the benefit of slightly reducing emissions [65,66], was also calculated using the InVEST-CSS model [67,68,69]. Estimating the SCC is a complex exercise as it requires a lot of data and information [58], not available in this study. This is why we used estimates from the literature. According to the High-Level Commission on Carbon Prices, the international scientific consensus estimates that the optimal prices to drive transformational change, in line with the Paris agreement, are between 40 and 80 USD/tCO2 eq in 2020 and USD 50–100 per ton by 2030 [70]. We thus used an average price of 60 and 75 USD/tCO2 eq by 2020 and 2030, respectively, based on a 1.5% discount rate.

3. Results

The application of InVEST model allowed to obtain three explicit and descriptive results in response to LULC changes between 1999 and 2019: carbon stocks, carbon sequestration and the net present value of the carbon sequestration for the studied time period. The major transformations in land use/cover change in the study areas were characterized in the five habitats (water bodies, built-up areas, cultivated land, agriculture land, and unused land).

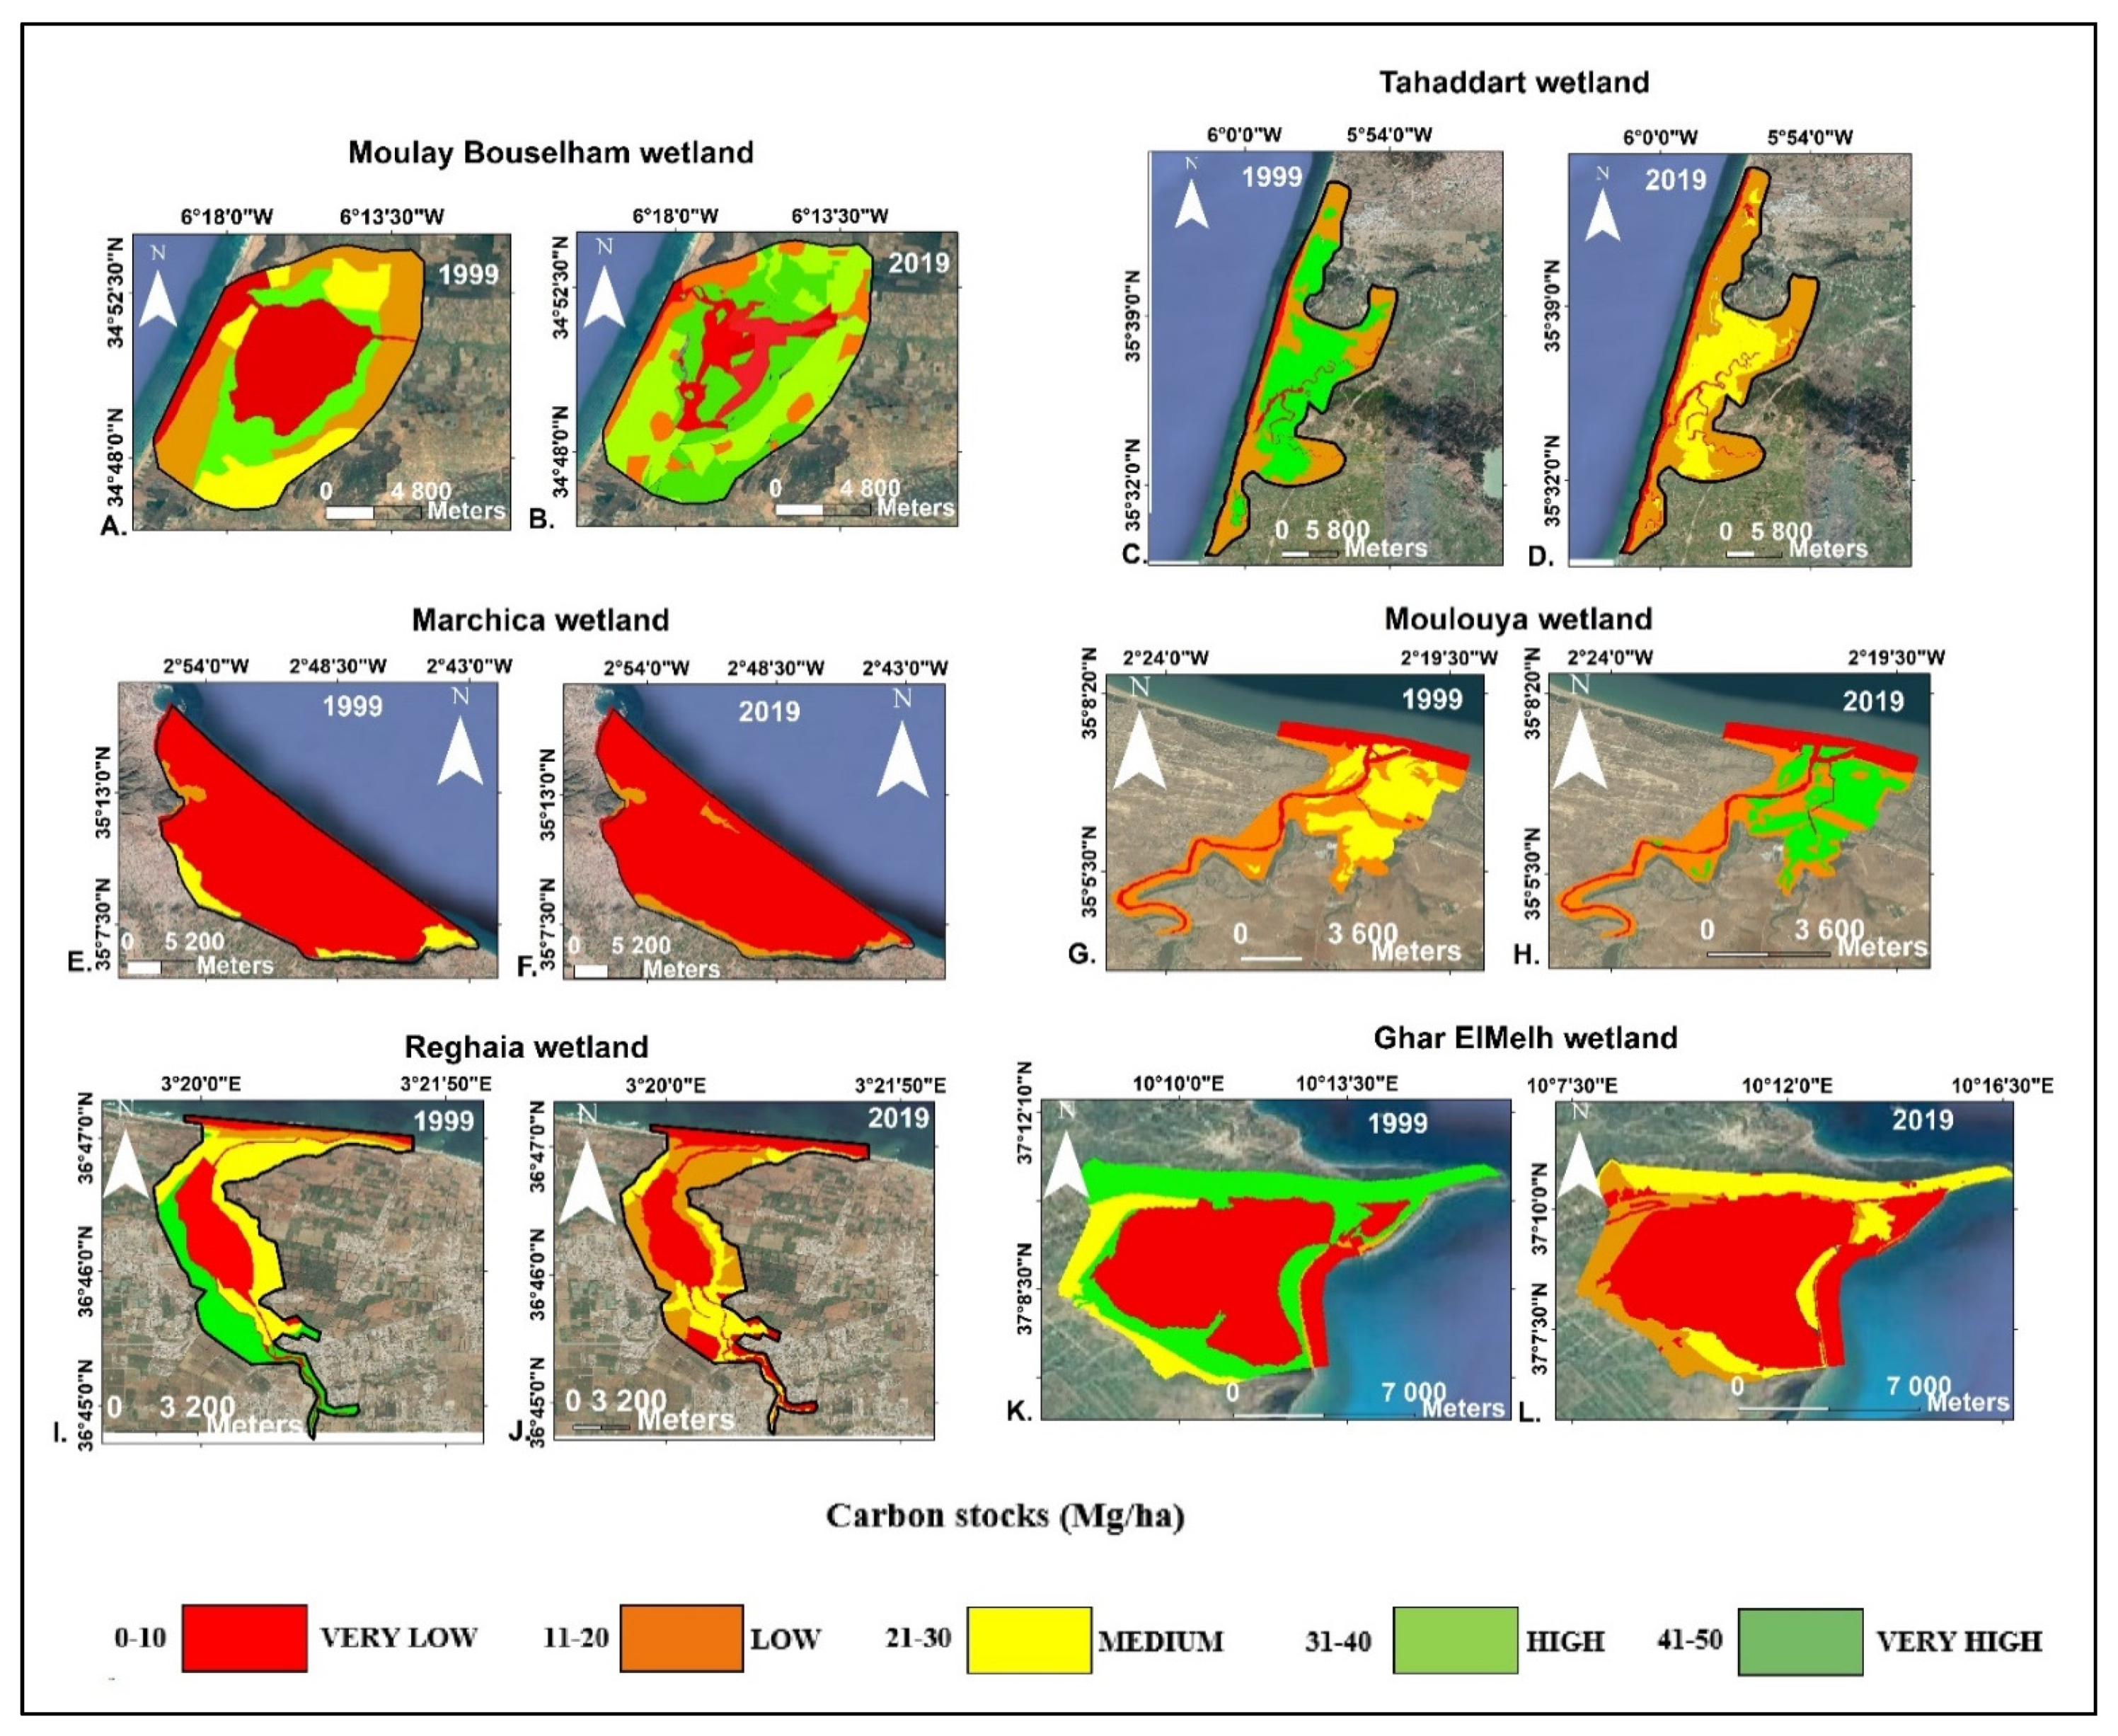
3.1. LULC Changes between 1999 and 2019

The comparison of the LULC between 1999 and 2019 in the considered wetlands, showed that overall, almost all the wetlands have undergone important changes over the two last decades, except the Moulouya that appears relatively unchanged.

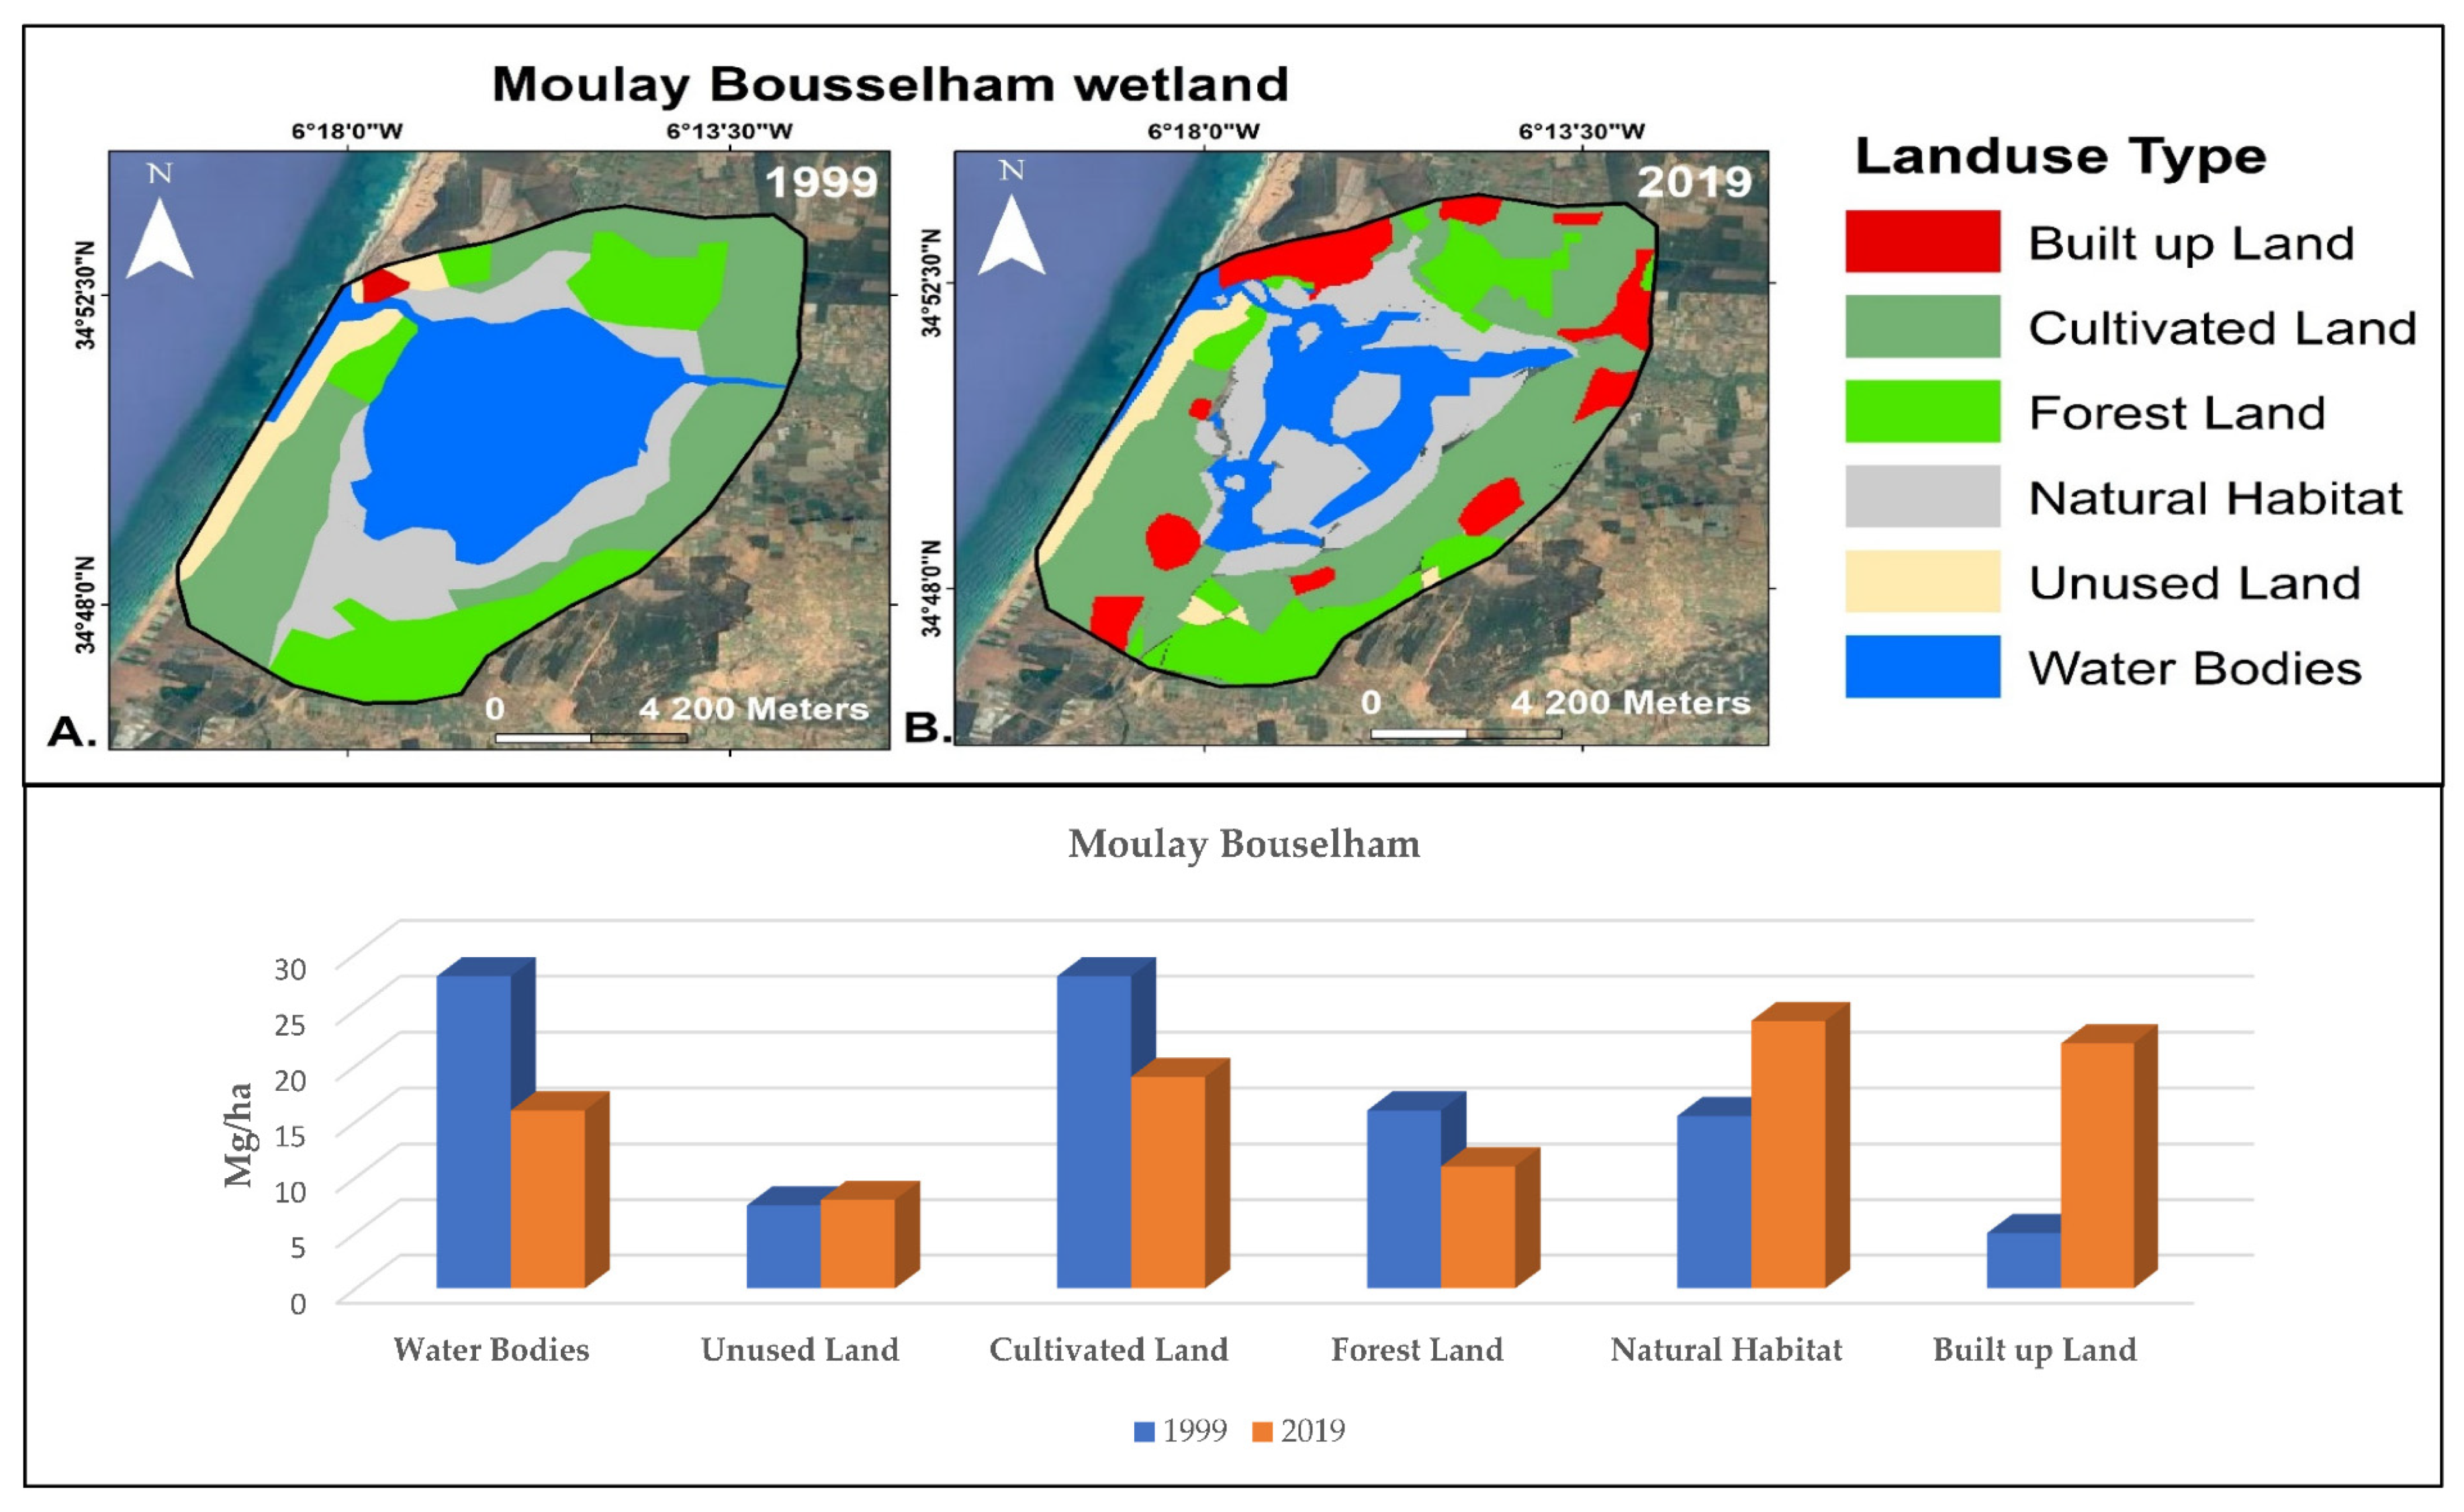
3.1.1. Moulay Bouselham Wetland

The LULC changes in Moulay Bouselham (Figure 3) show a decrease in the area for three units, namely in descending order: the water bodies, the cultivated land and the forest land, and an increase in two units: the built-up area and the natural habitat.
The most significant LULC change in this wetland is clearly the built-up area, which increased 4.4 times over a period of 20 years. Indeed, population growth and tourism development generated significant urbanization around the lagoon to the detriment of cultivated lands and forests whose areas have decreased by approximately 32% compared to their areas of 1999. Regarding the water bodies, they decreased by almost 43%; this is probably due to the significant siltation that the lagoon has experienced in recent decades. Towards the east, the Wadi Drader, which drains the marly hills of the Prerif, brings back large quantities of suspended sediment, which formed a prograding delta clearly visible on the images; and towards the south, the artificial Nador canal, which drains the clayey plain of Gharb, entrains the siltation of the southern part of the lagoon. The progressive filling of the lagoon has been reported by several authors [71,72,73]. More recently, Karim [74] showed that between 1984 and 2015, the water surface area dropped by 17% (1.6 km2) and its volume by 50% (530,000 m3). The natural habitats unit shows an increase probably linked to the decrease in water bodies, which left muddy lands overgrown with algae or halophyte vegetation.

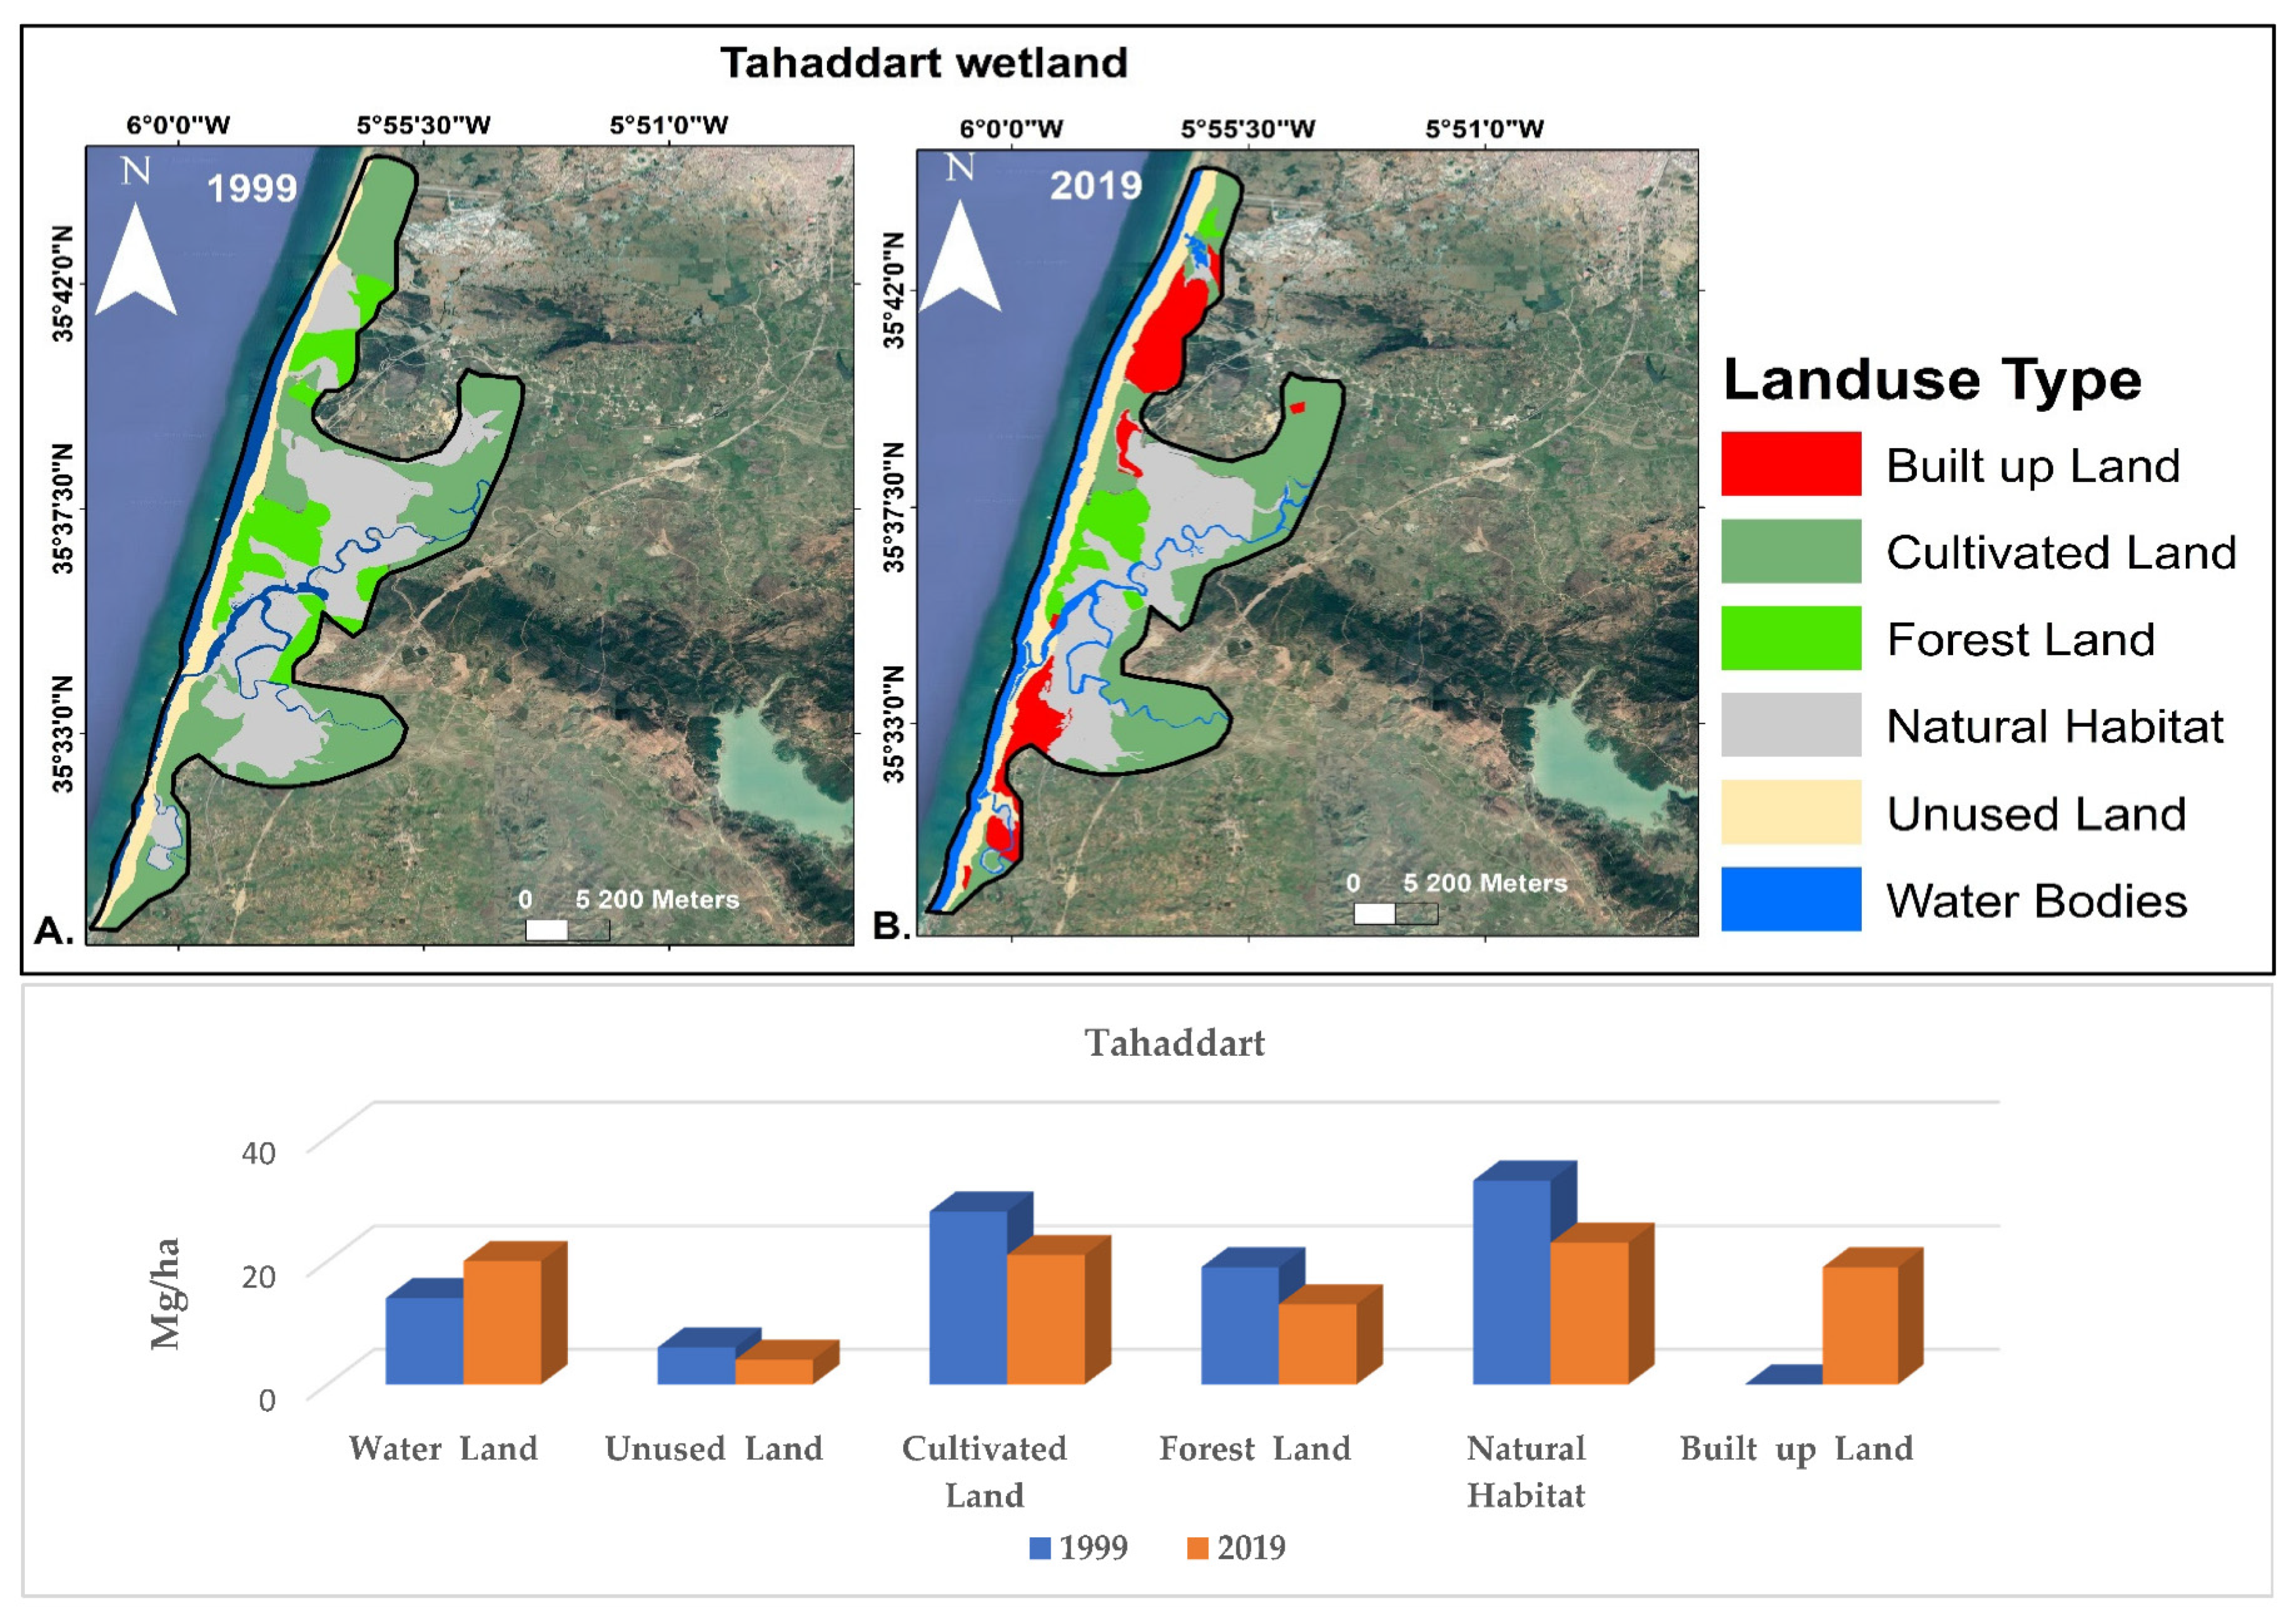
3.1.2. Tahaddart Wetland

The analysis of LULC changes in Tahaddart wetland shows a decrease in almost all the units between 1999 and 2019 except the built-up area, which shows a sharp increase, and the water bodies with a slight increase (Figure 4).
These changes are linked to the fact that the Tangier-Asilah prefecture, to which the Tahaddart wetland belongs, has experienced significant development in the last decade, especially in terms of infrastructures with the construction of the thermal power plant, the motorway and the high-speed rail line, and the urban development, particularly for tourism in the northern and southern parts of the coastline [75]. This development explains the significant increase in the built-up area, to the detriment of the cultivated lands and the natural habitats [76,77]. The decrease in forests is related to the clearings carried out for the needs of urban expansion [52]. Regarding the water bodies, the slight increase in their area could probably be explained by the coastline retreat that was observed after the construction of the ‘Ibn Battouta’ and ‘April 9′ dams, and which resulted in a coastal erosion estimated at 1.7 m/year [52]. Data on local subsidence and sea level rise due to climate change are unfortunately unavailable in this area, but these could presumably also contribute to coastal erosion and an increase in submerged land.

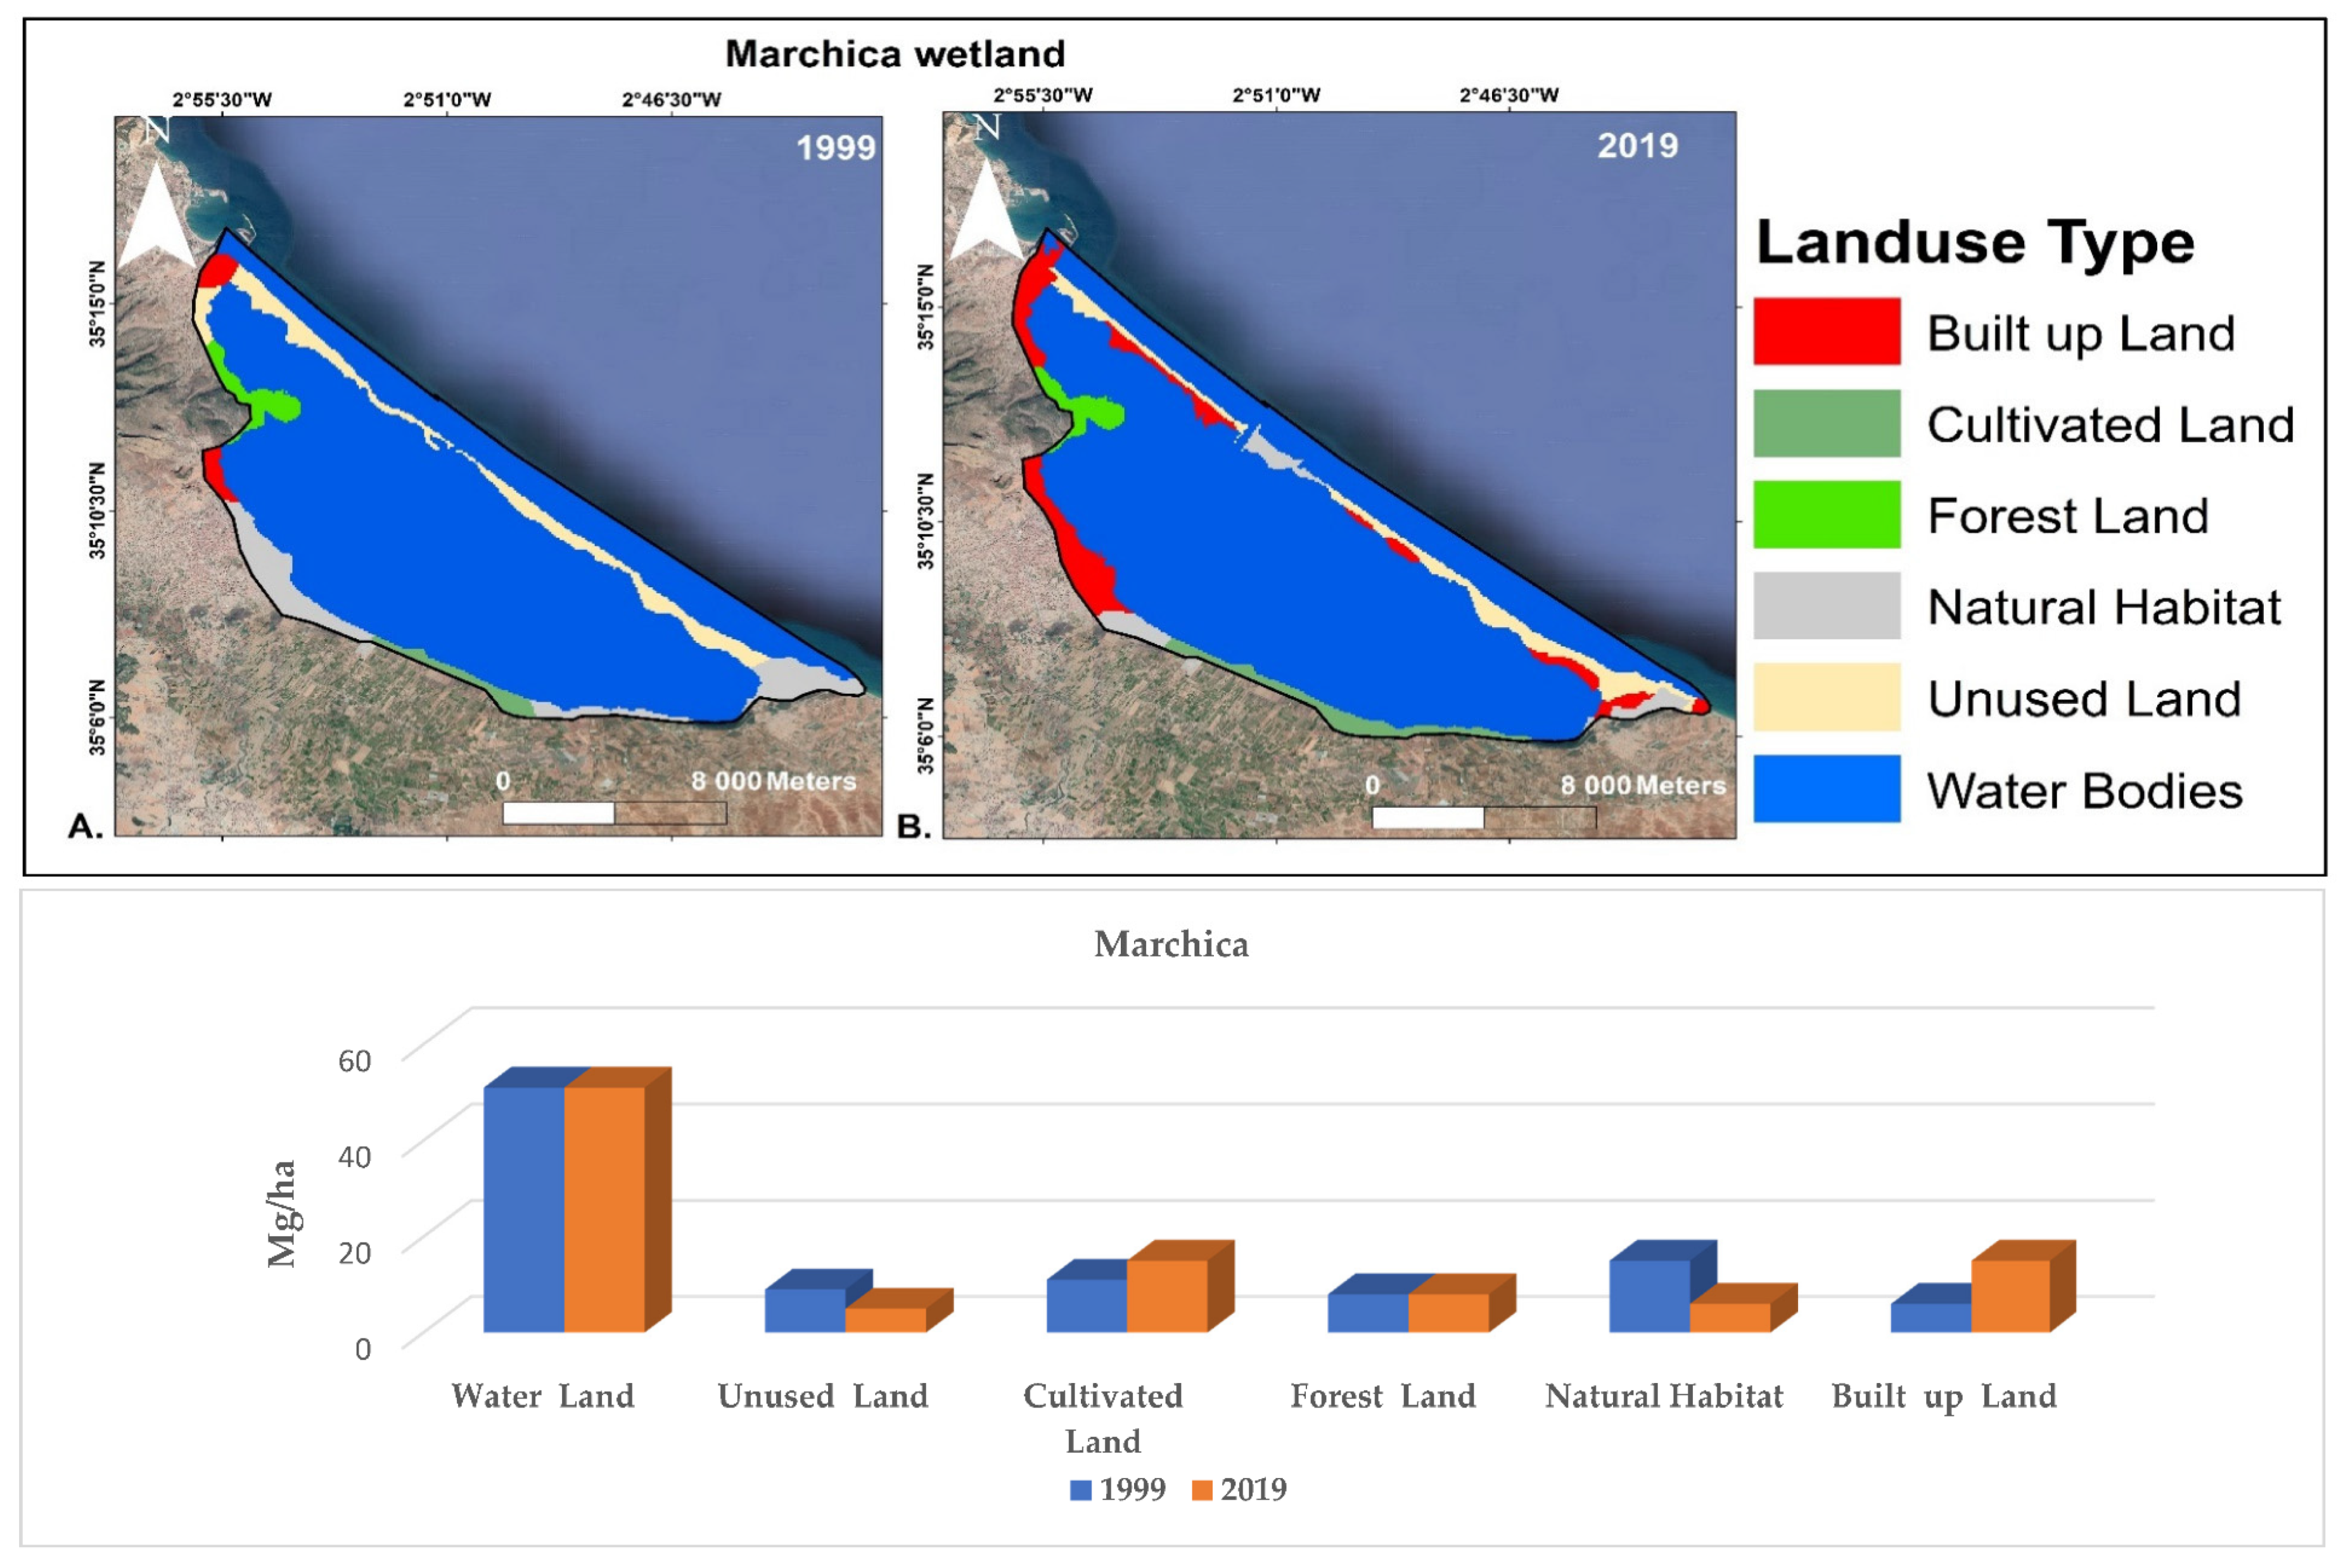
3.1.3. Marchica Wetland

The LULC changes in the Marchica lagoon (Figure 5) show also a significant increase in the built-up area—2.5 times greater in 2019 compared to 1999—and an equivalent decrease in natural habitats. The city of Nador and its surroundings, located on the shore of the lagoon, have undergone an urban boom in recent decades, due to population growth and to the inflow of money from Moroccan residents abroad who prefer to invest in building construction. In addition, Marchica has now become the flagship resort for tourism in the Moroccan Mediterranean with many tourism developments, including residences, hotels, golf courses and a marina [31,78]. New constructions replaced the natural habitats, which have lost almost 50% of their surface area during the last two decades. The increase in agricultural lands at the expense of the natural and unused lands is related to the high demand for food to meet the needs of a growing population.

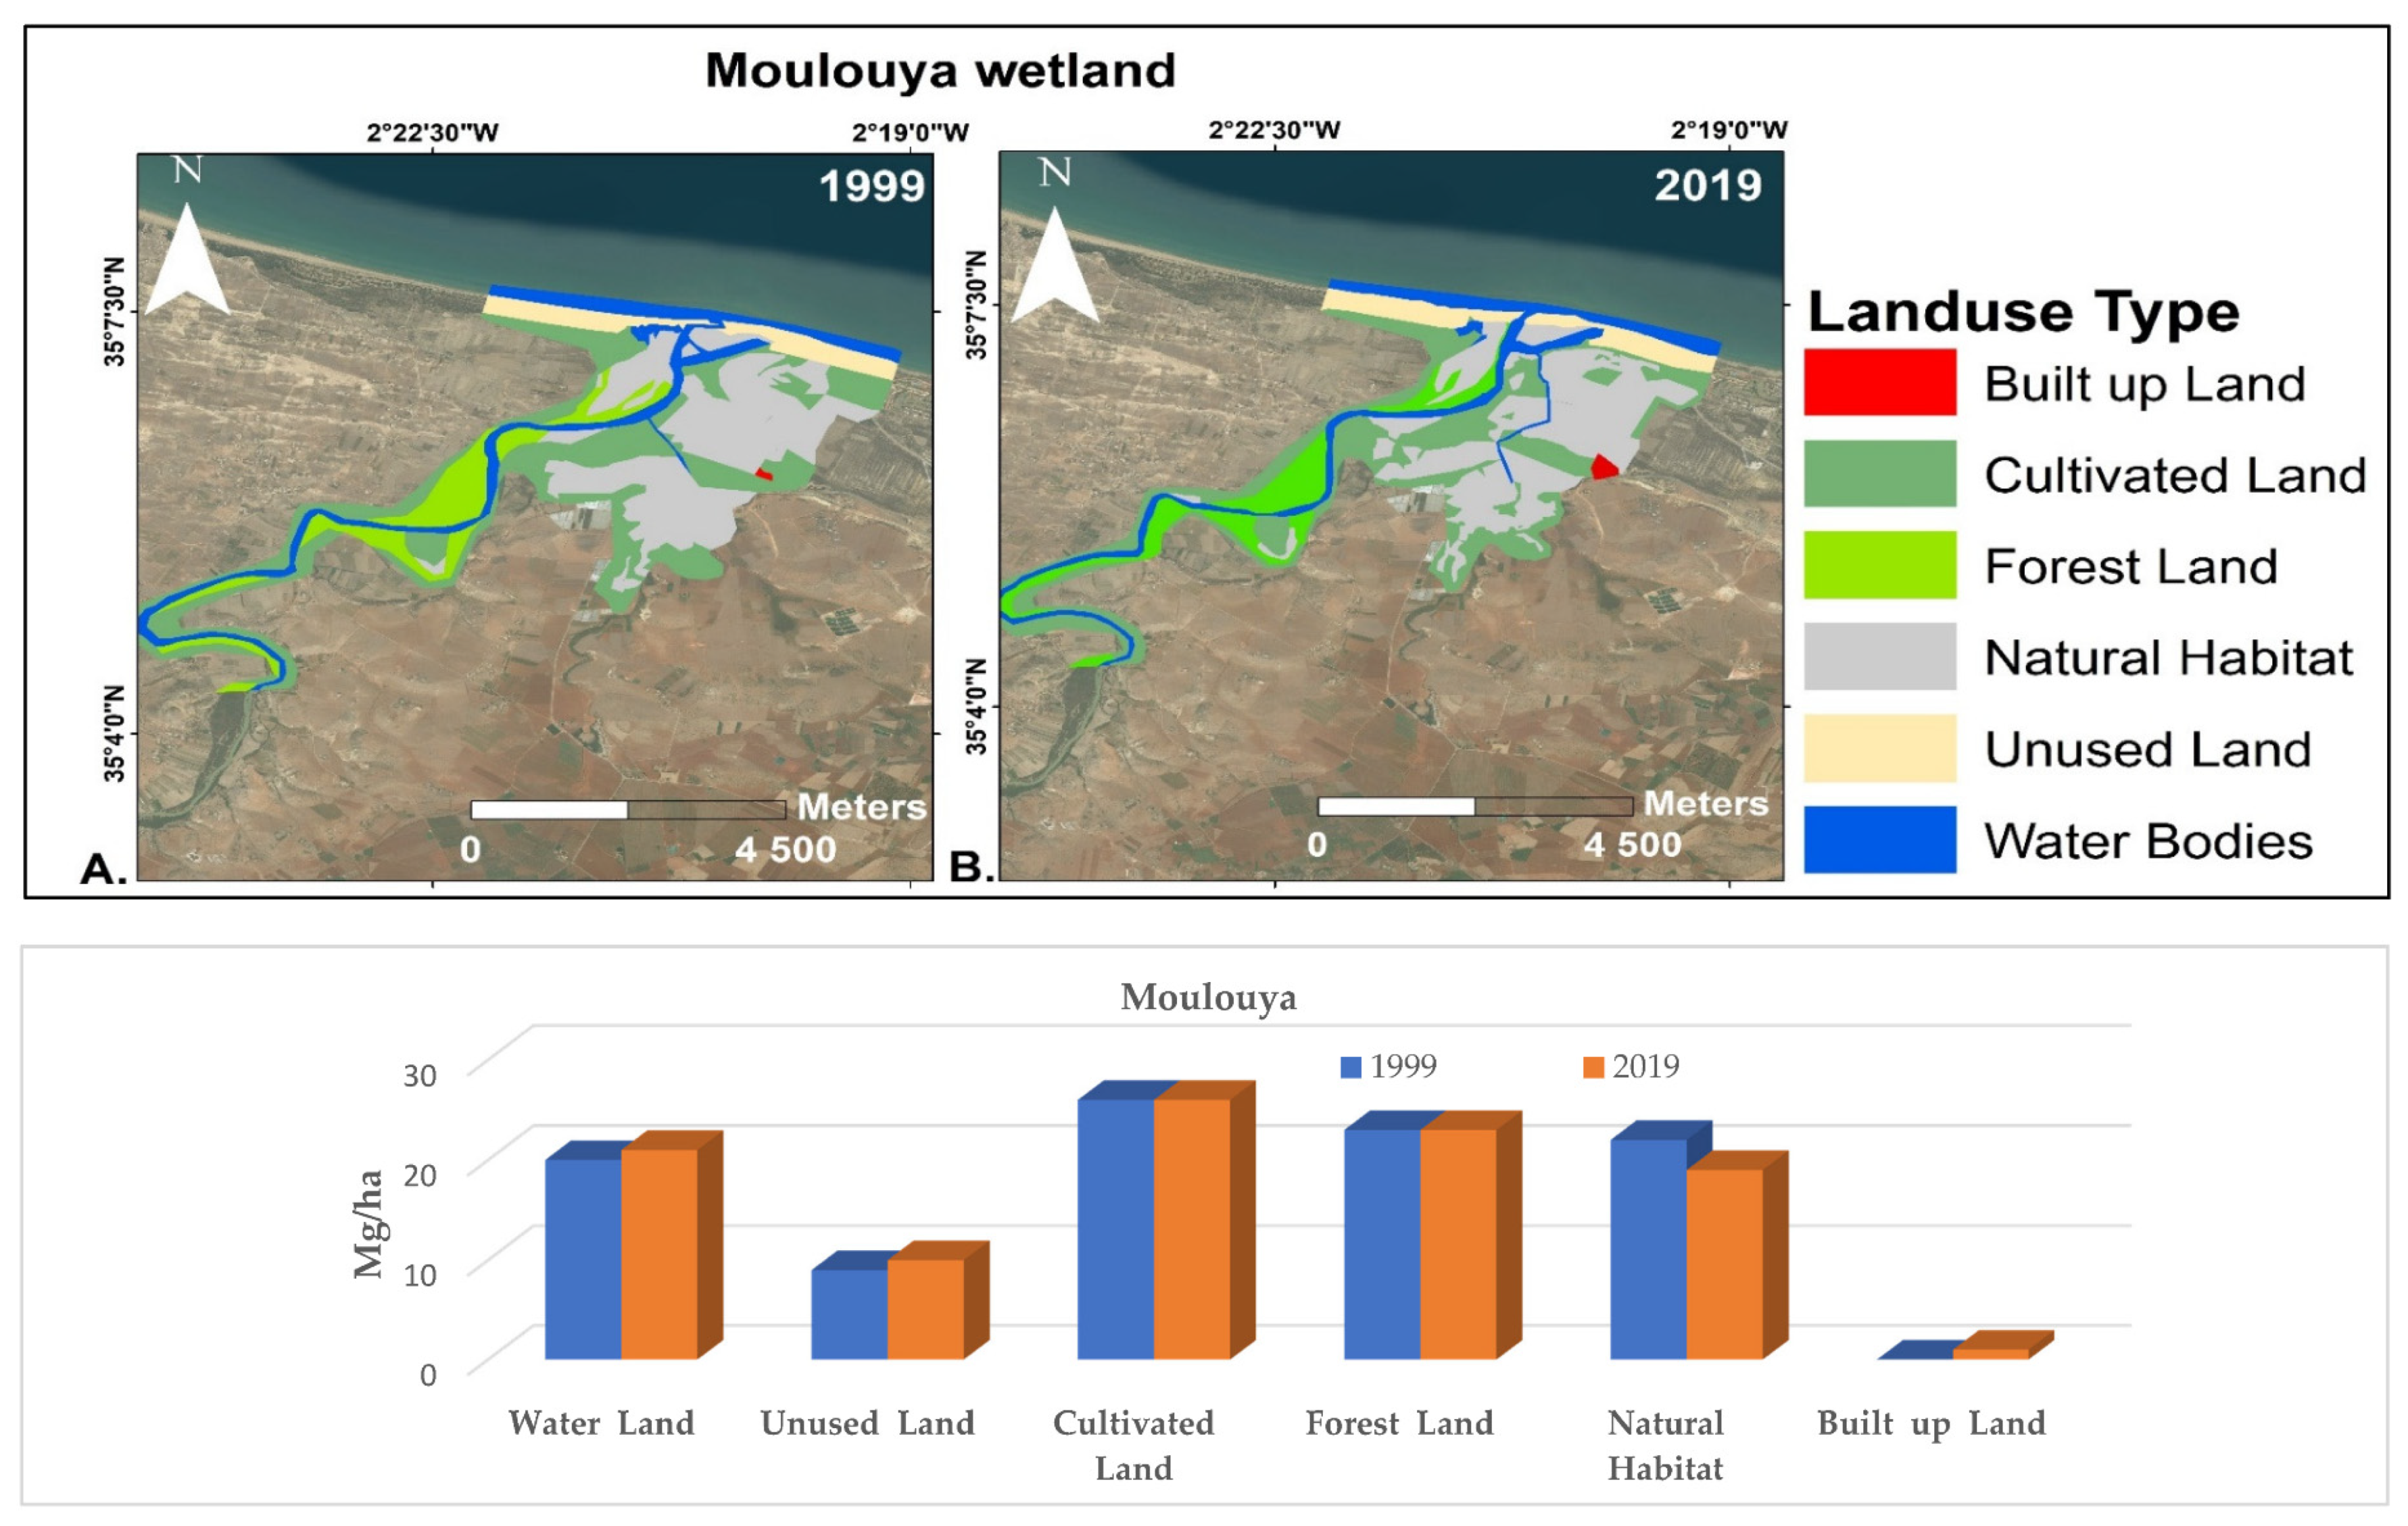
3.1.4. Moulouya Wetland

The comparison of the 1999 LULC with that of 2019 in the Moulouya wetland shows very slight changes over the past two decades (Figure 6). This Ramsar site has been preserved so far, with just a few constructions, including road infrastructure. However, the extension of the Saïdia seaside resort to the immediate east of Moulouya threatens the integrity of this wetland [32]. Indeed, the flows of tourists, exceeding the carrying capacity of the site, visiting the wetland each summer degrade the natural habitats. In addition, the programming of the construction of a new dam on one of the tributaries of the Moulouya river risks completely drying up the environmental flow and then compromising the ecosystem services provided by the wetland and its biodiversity.

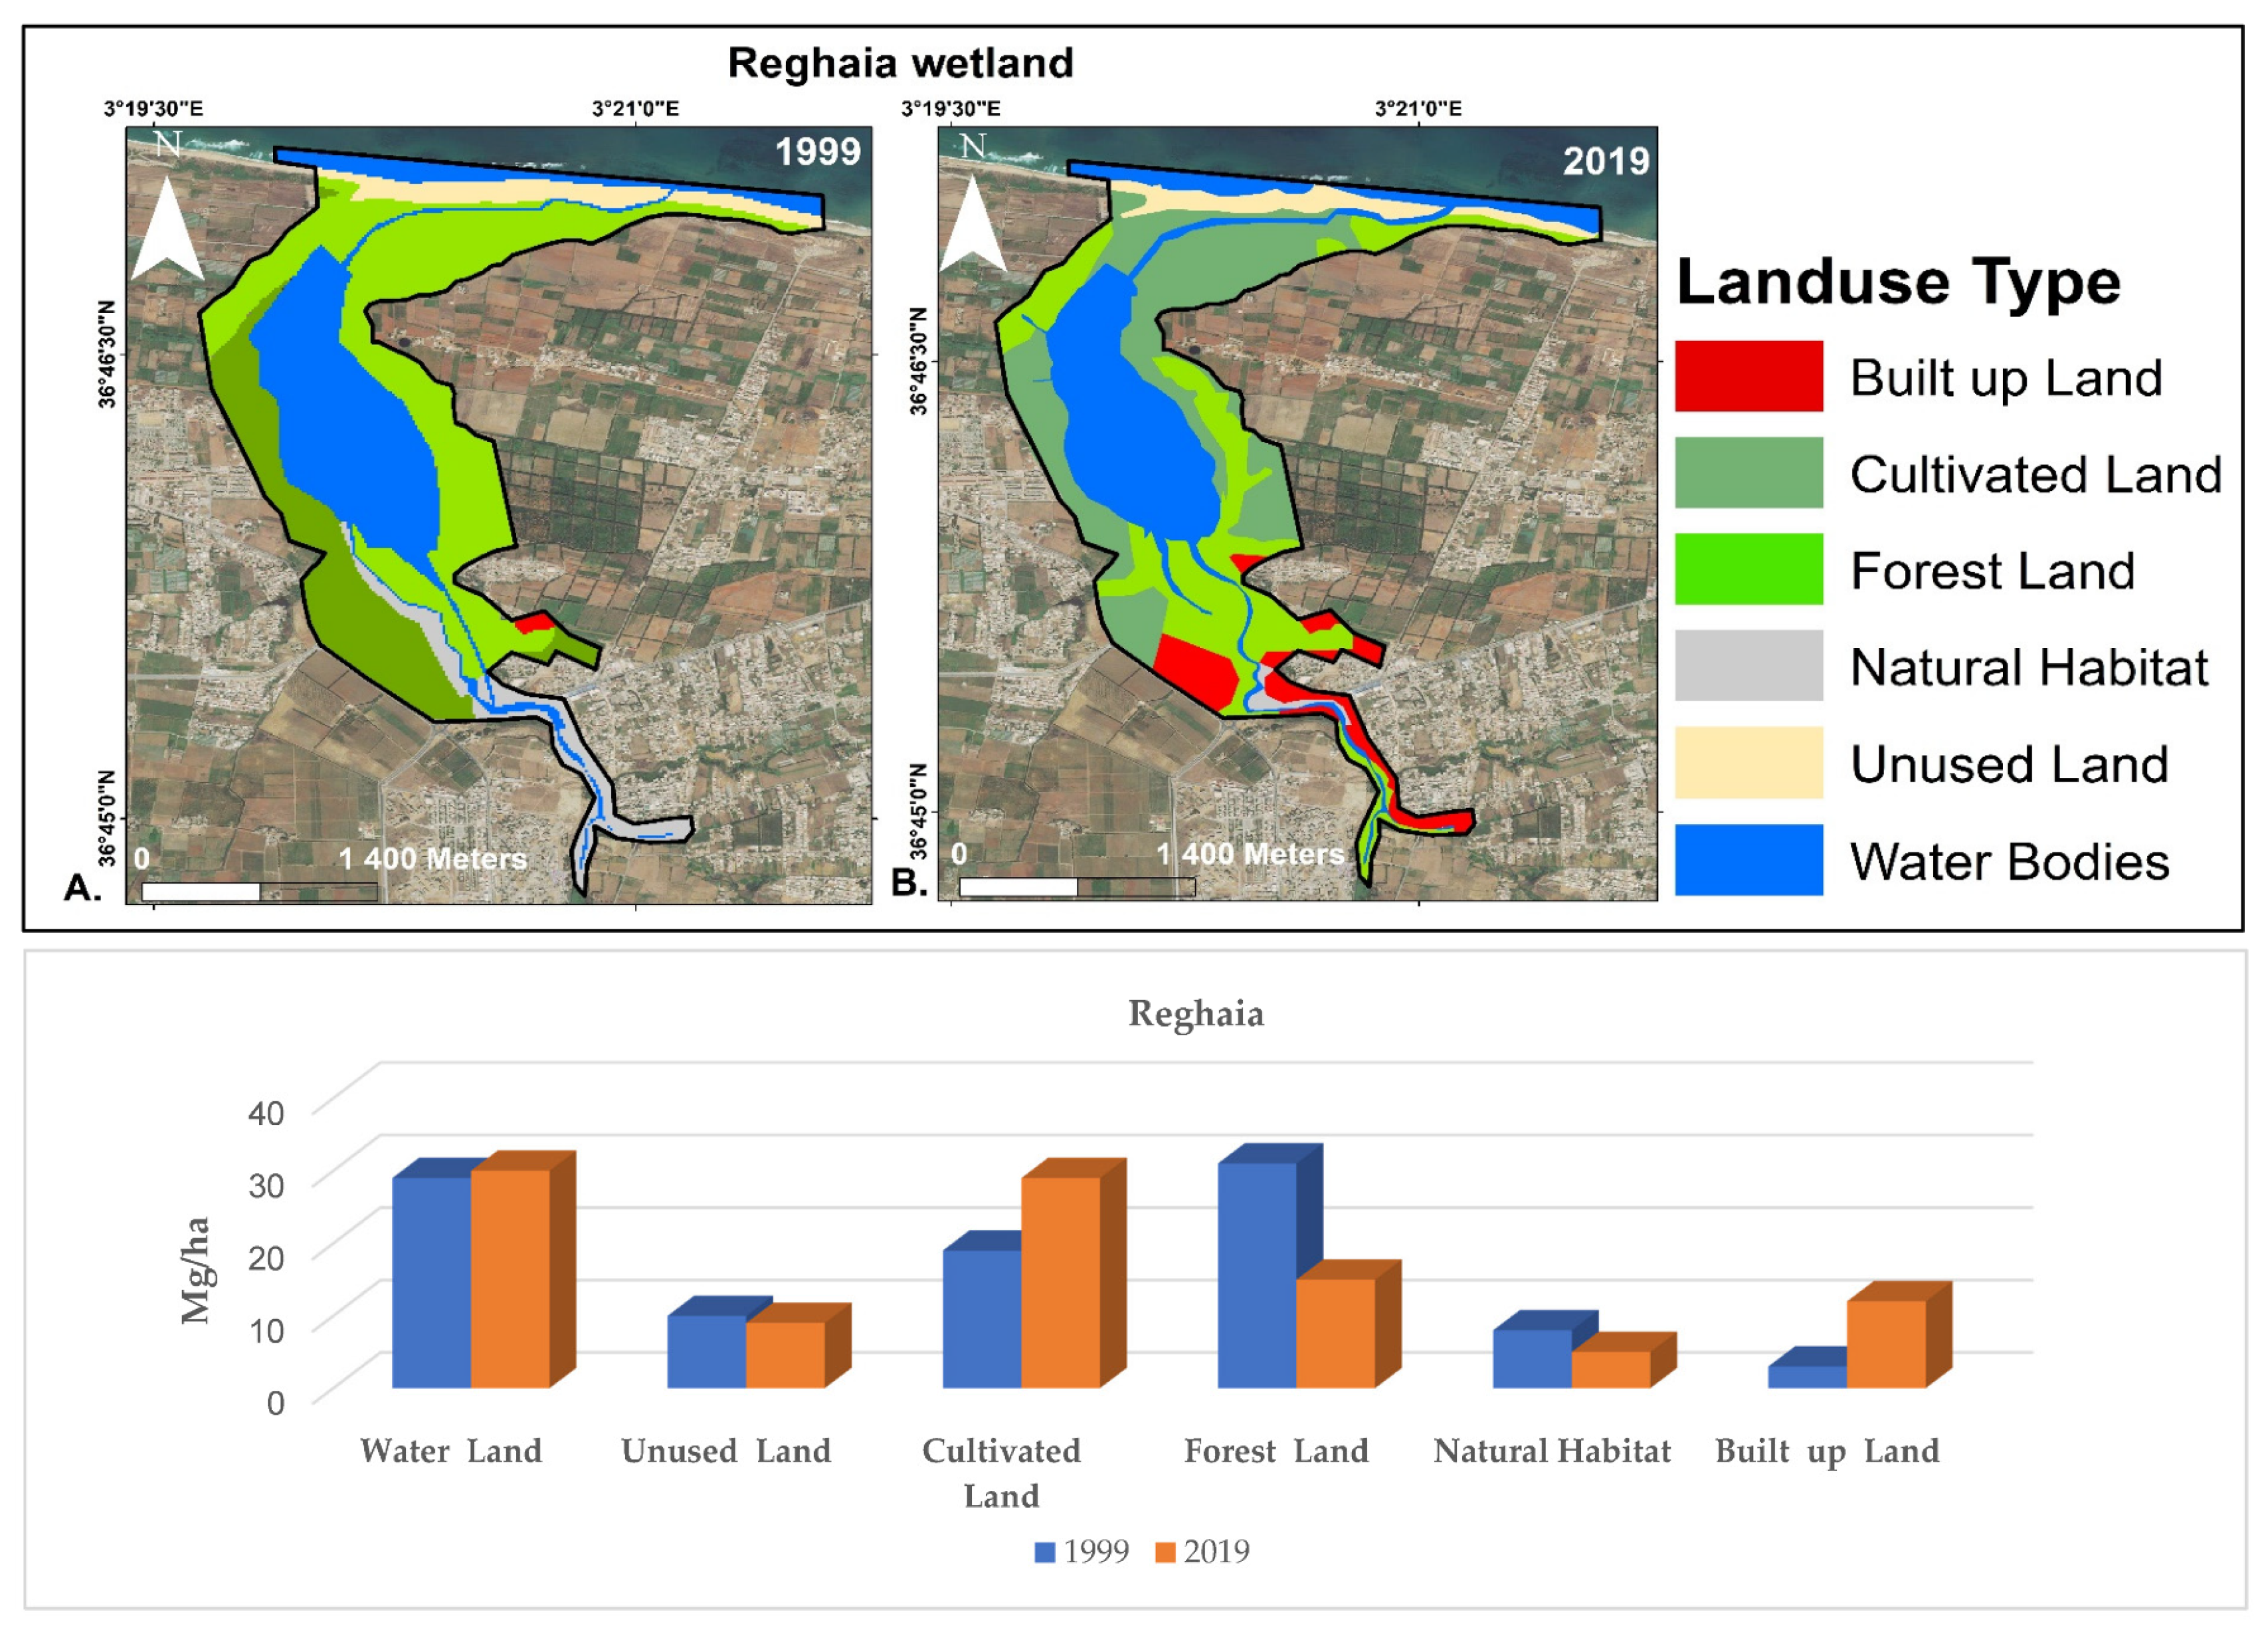
3.1.5. Reghaia Wetland

The comparison of the two maps (Figure 7) shows that LULC has undergone several changes between 1999 and 2019. It is especially the built surface that increased the most (4 times more), to the detriment of the forests, which decreased by half. The increase in cultivated land was probably also due to land clearing and deforestation. Previous studies [79,80] have already reported that natural vegetation has declined since 1972, and that most of the marshes east of the Reghaia channel have been drained for agricultural purposes. Indeed, the Reghaia lake provides water for the irrigation of more than 1500 ha of agricultural land. At the same time, the pressure of urbanization is becoming stronger on the areas initially dedicated to agriculture.

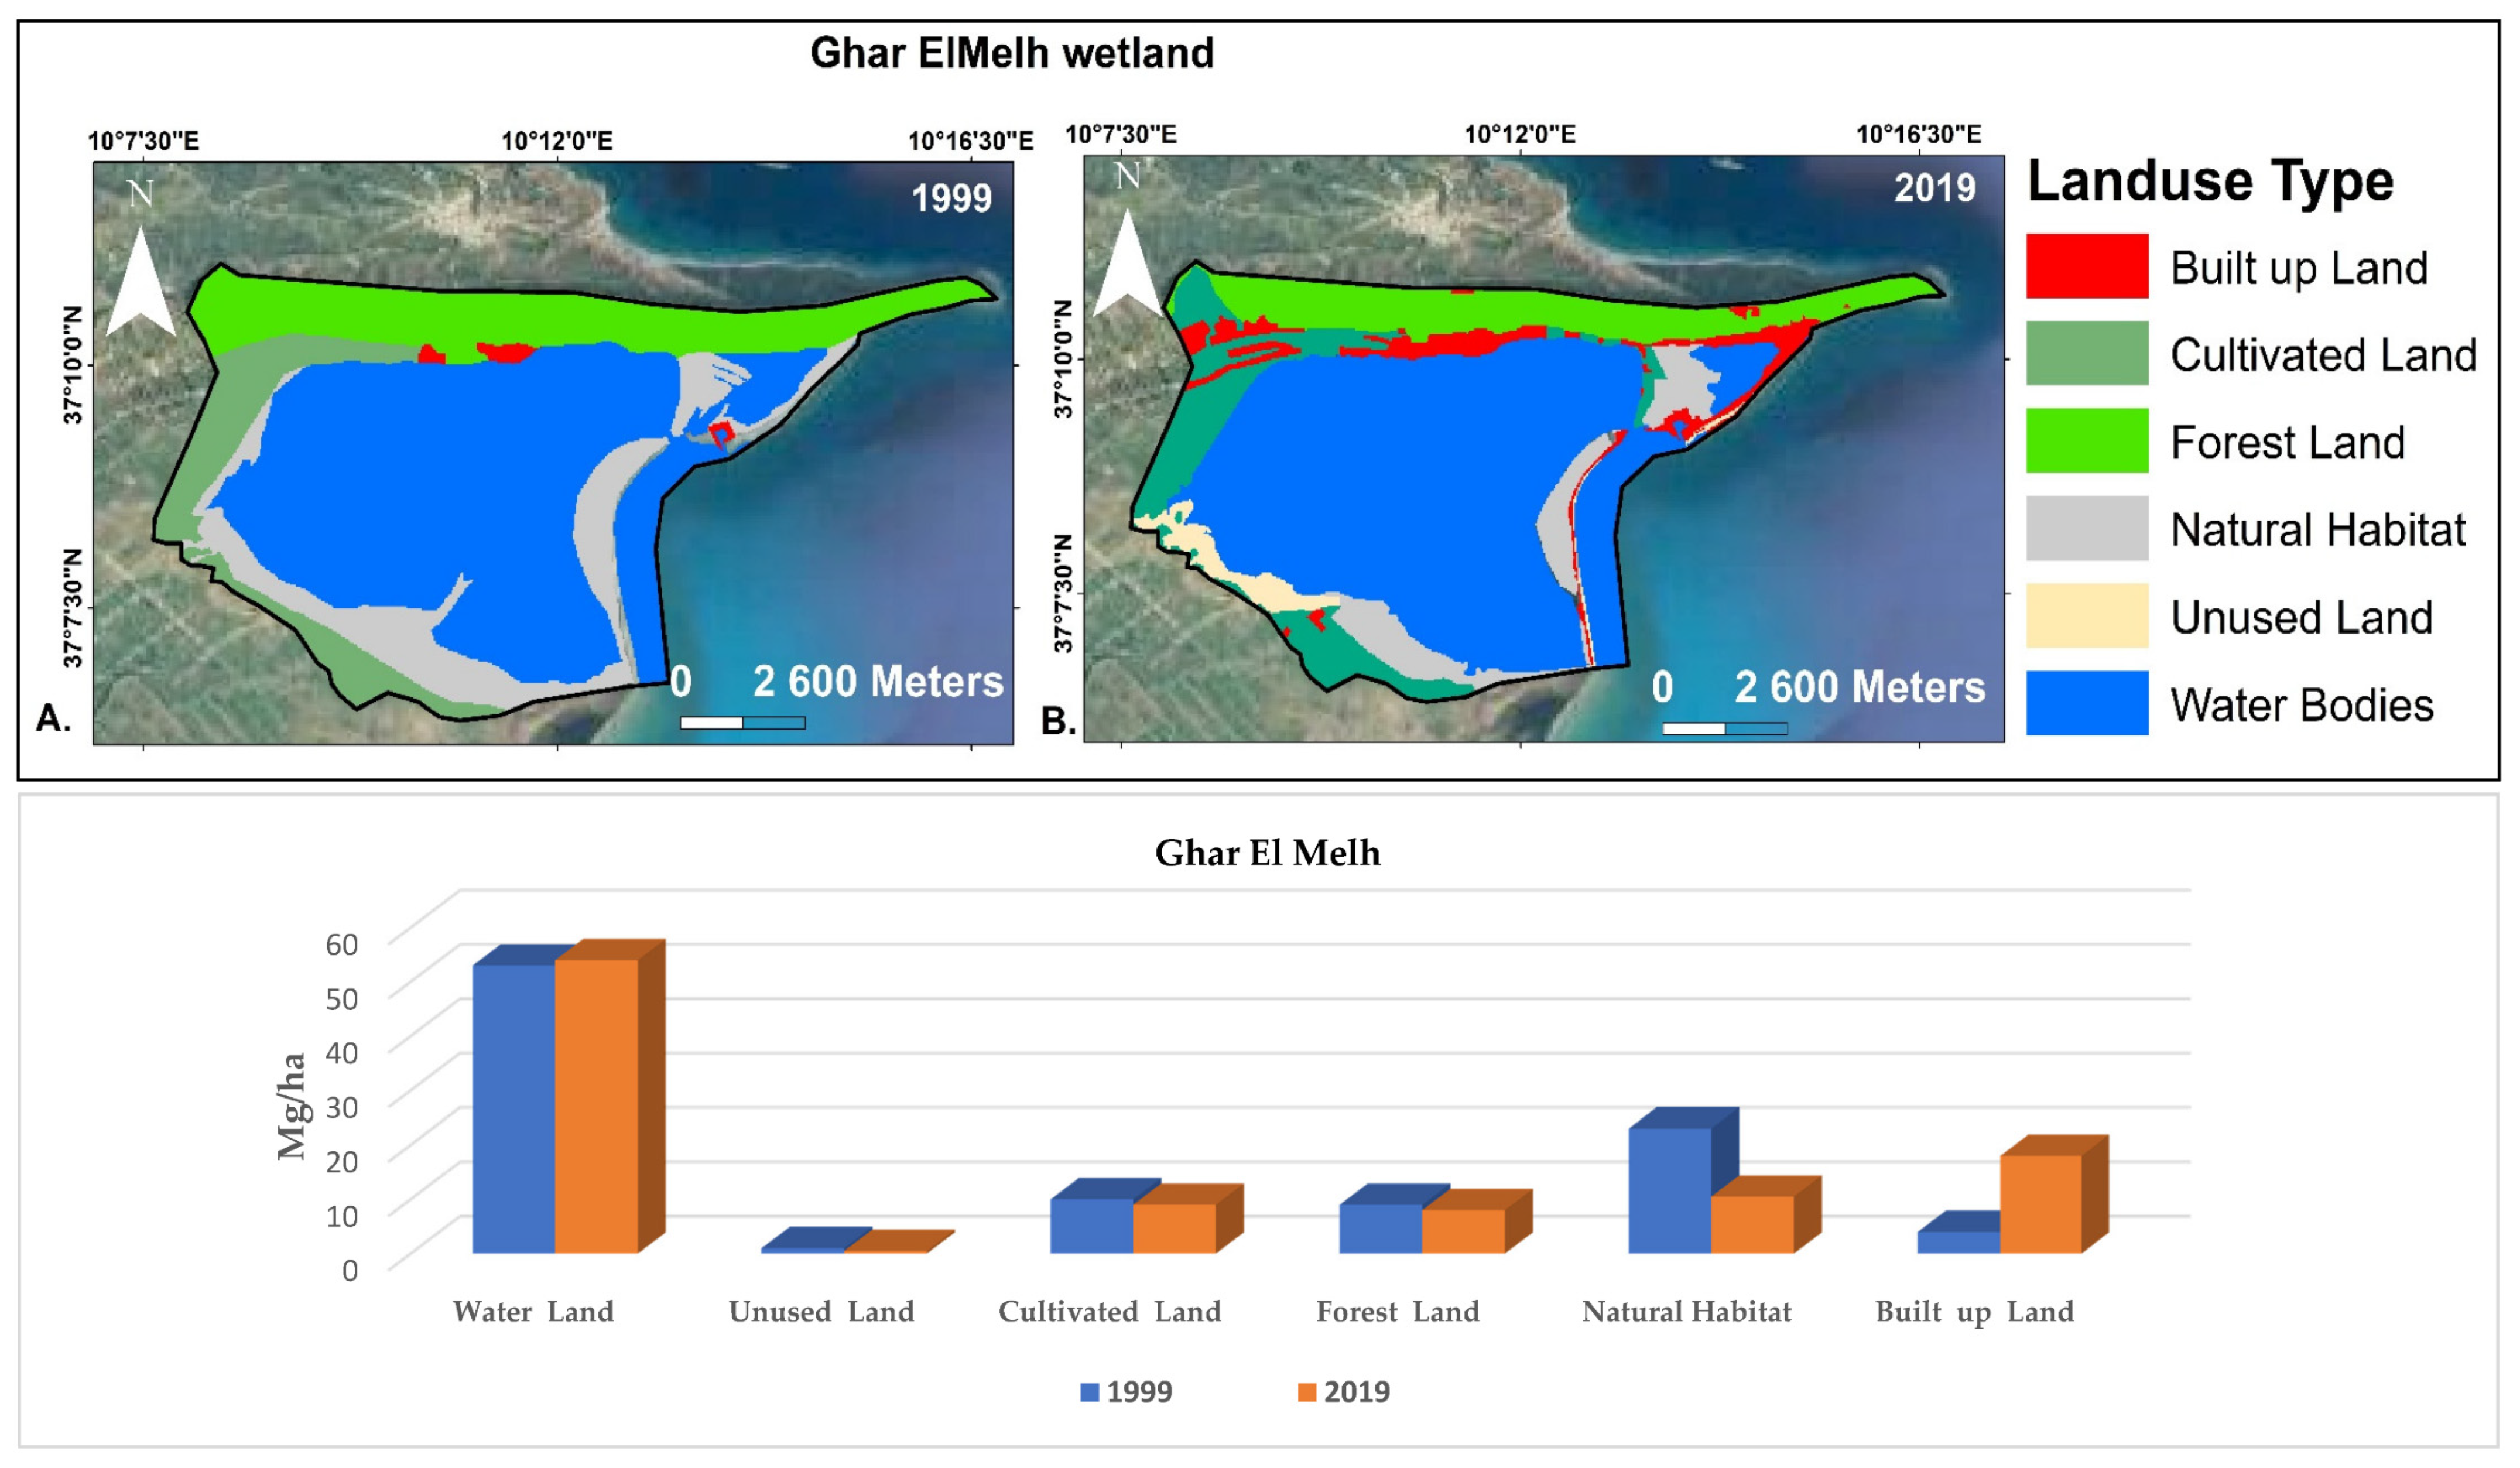
3.1.6. Ghar El Melh Wetland

Like in the other wetlands, the LULC change in Ghar El Melh consisted of a significant increase in the built-up area between 1999 and 2019, which has been multiplied 4.5 times, and a halving of bare land and natural habitats. The water body, cultivated land and forest units remained more or less the same over this period of time (Figure 8).
The Ghar El Melh lagoon is an aesthetically attractive area for tourism and coastal development. As a result, it has been drained in some places for the construction of new urban infrastructure and tourism-related facilities, which explains the sharp increase in built-up areas over the past 20 years. Most of this development has occurred mainly in the northern and eastern parts of the lagoon rim. Regarding the natural habitats, dominated by seagrasses and benthic animals [81,82], the total area has dropped by more than half and was replaced by built lands in the eastern part of the studied site and along the coastline. IUCN and WWF-NA [83] reported also that most of the region’s natural habitats have been significantly altered and degraded, and in the plain, wherever the soils are not too saline, the land has been converted to agriculture or housing.

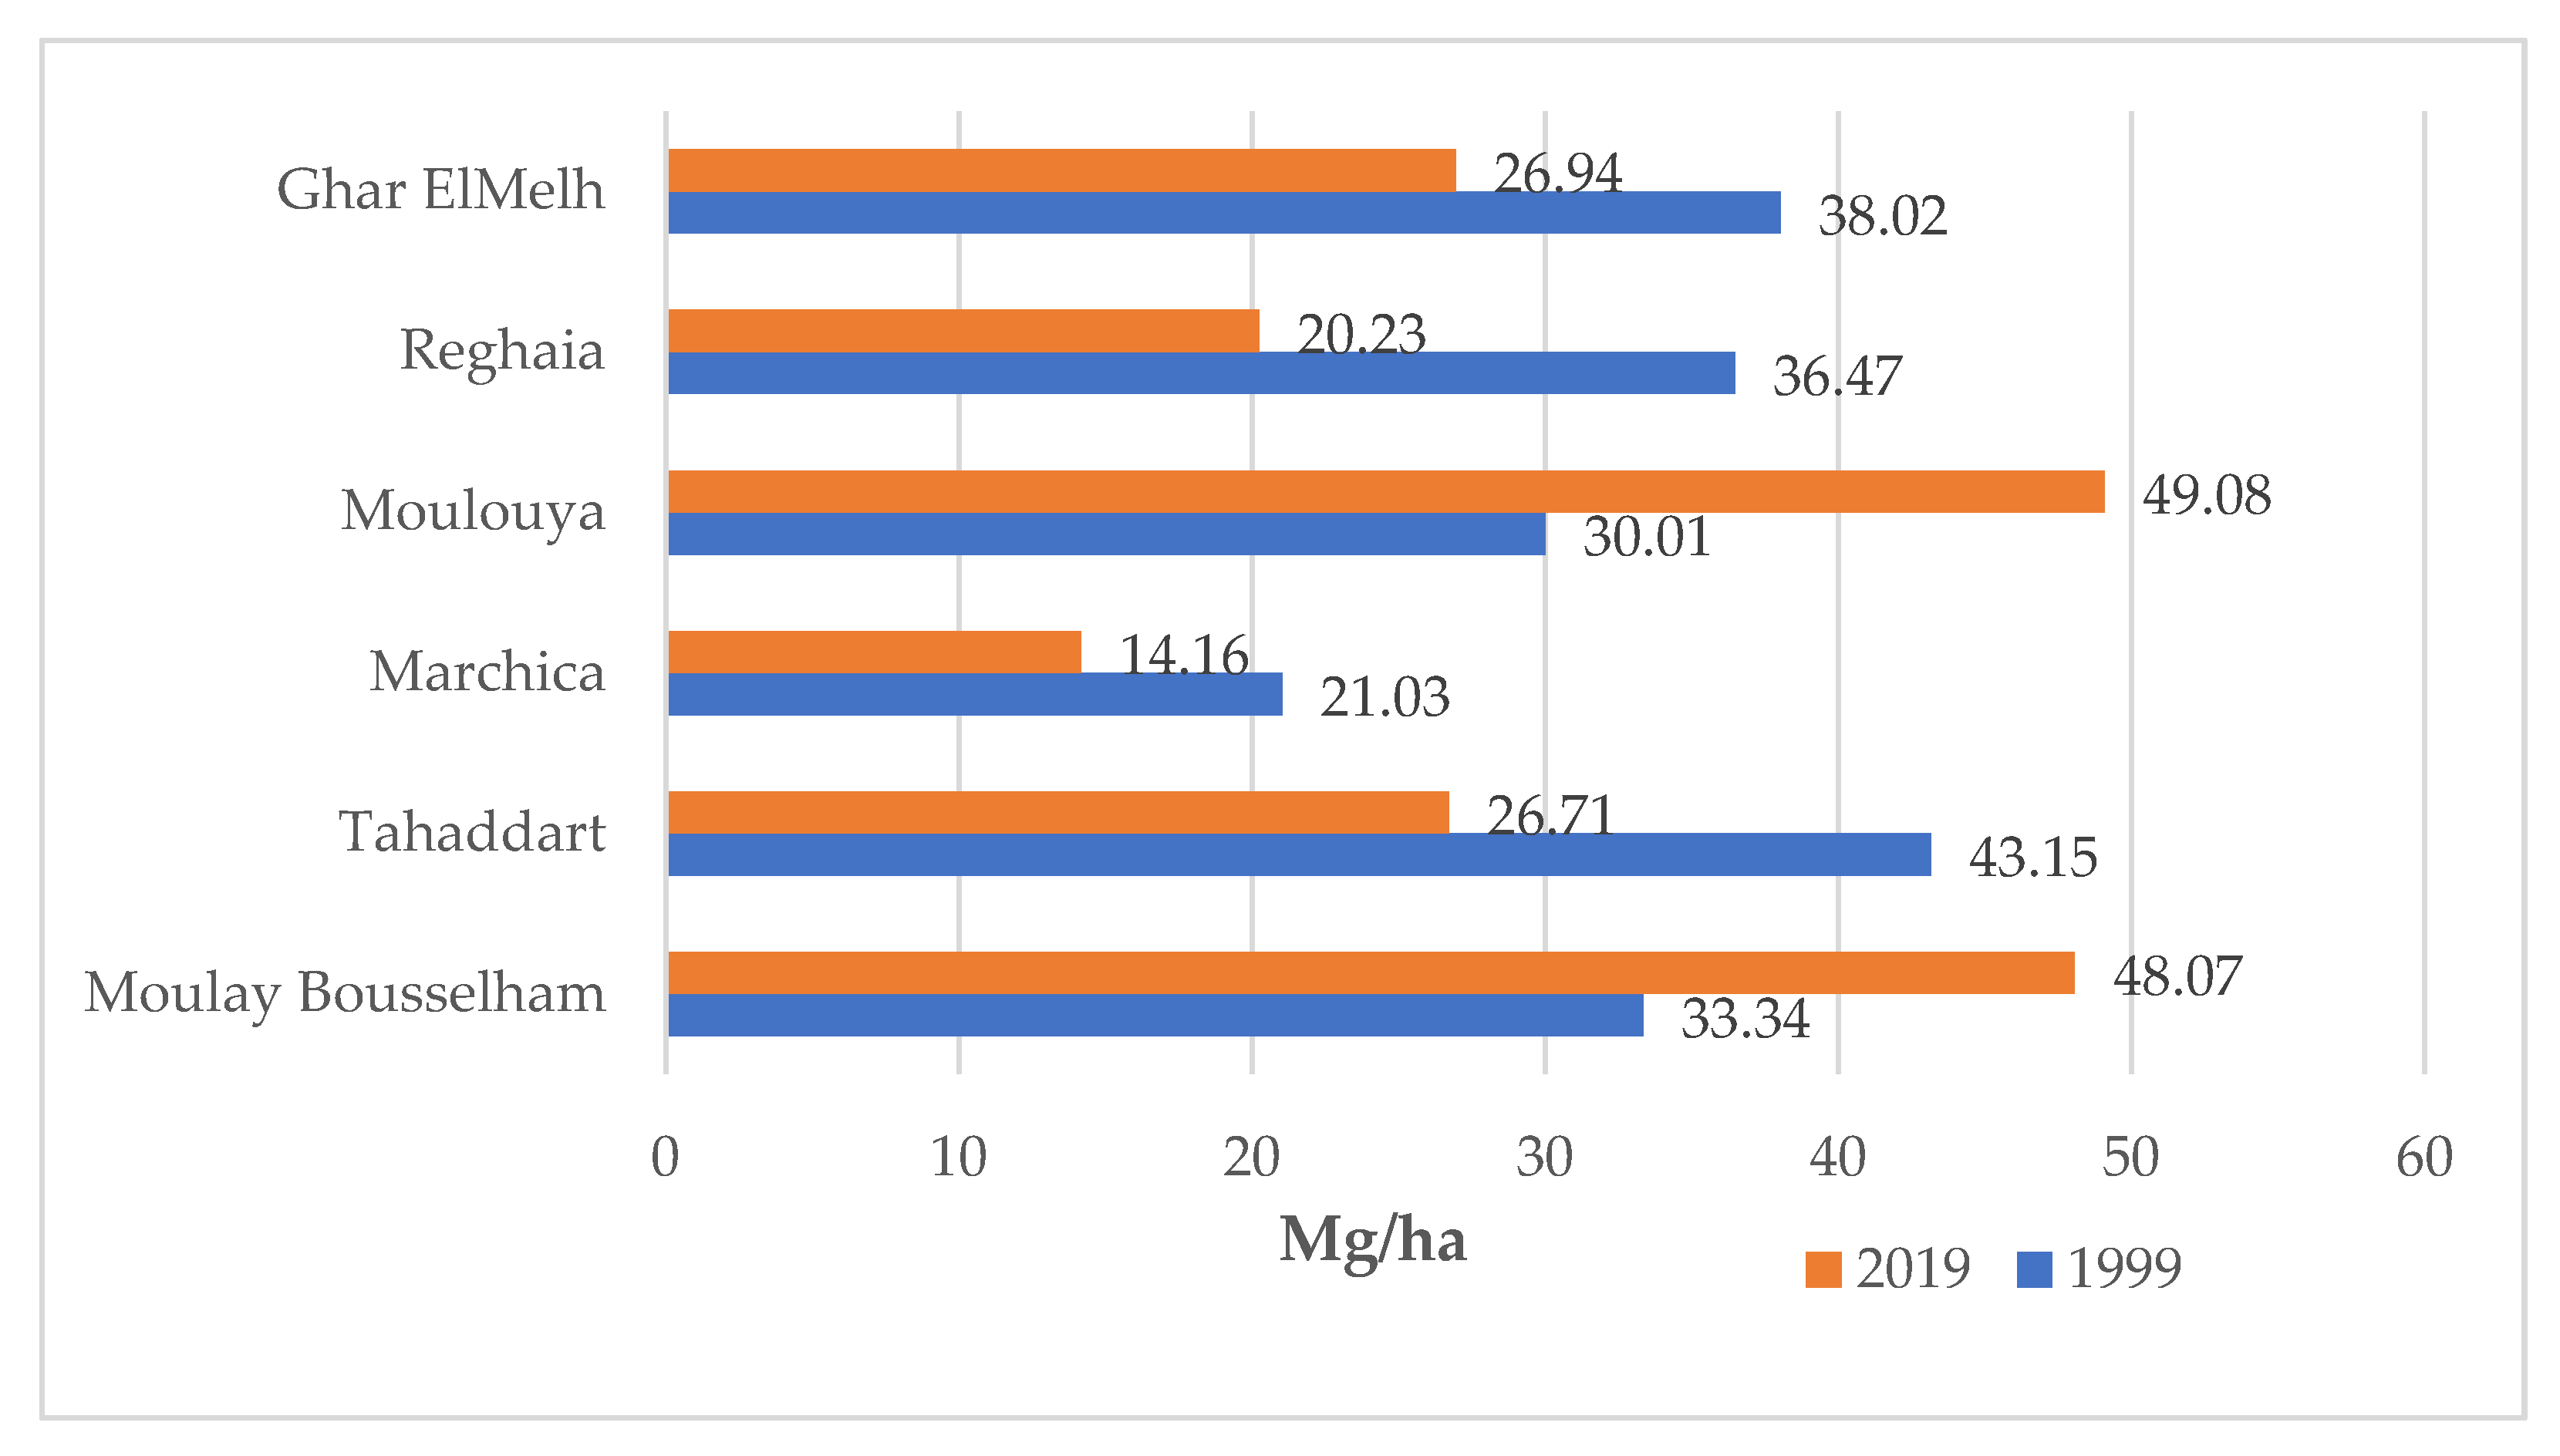
3.2. Valuation and Dynamics of Carbon Stocks in Response to LULC Changes

Carbon stocks, estimated from the InVEST model, showed values ranging from zero to 275 Mg/ha, depending on the different LULC types and the different pools in each case study. The highest stocks per hectare were found in Tahaddart, followed by Ghar El Melh and Reghaia, while the lowest stocks were observed in the Marchica lagoon. It is mainly the forests that show the highest values, especially in their aboveground biomass and soils. Whereas in Tahaddart, it is the natural habitats that show the highest stocks in the same pools, and in Marchica it is the cultivated lands that store the most carbon. Regarding the built-up areas, as expected, the values were overall zero to very low in 1999, with a slight increase in 2019, notably at Ghar El Melh, Reghaia and Moulay Bouselham.
The comparison of carbon storage between 1999 and 2019 in the studied wetlands (Figure 9 and Figure 10) shows that with the exception of Moulouya and Moulay Bouselham, which show an increase in carbon storage (64% an 44% respectively), the four other sites show a loss of carbon stored, in descending order: Ghar El Melh, Marchica, Tahaddart and Reghaia. Carbon storage losses occurred mainly in forests, and unsurprisingly, in sites where forest areas were converted into built or cultivated land, namely, in Reghaia and to a lesser extent in Moulay Bouselham and Ghar El Melh. The carbon gains observed at Moulay Bouselham are probably due to the extension of natural habitats in 2019. Moulouya is the wetland that accumulates the most carbon during the analyzed period, probably due to its preservation from human pressures, in particular the land speculation and tourist development that characterized the seaside resort of Saïdia, immediately to the east of the wetland. The highest annual carbon accumulation rate (0.95 Mg/unit area/yr) occurs in Moulouya, while the highest emission rate occurs in Tahaddart and Reghaia (0.82 and 0.81 Mg/unit area/yr, respectively).
The damages associated with the marginal carbon emission is estimated using the social cost of carbon (SCC) (Table 3), expressed as the value (in USD) of the total damages from emitting one ton of CO2 into the atmosphere.
LULC changes in most of the wetlands (Tahaddart, Reghaia, Ghar El Melh and Marchica) led to the emission into the atmosphere of a more or less significant amount of carbon, which represent a social cost between a maximum of 29,592 USD and a minimum of 12,366 USD. Conversely, Moulouya and Moulay Bouselham turned out to be carbon sinks of 19.07 and 14.73 Mg per unit area, respectively, between 1999 and 2019. The sequestration of this carbon in different habitats and pools represents significant benefits that could be added to the overall benefits expected from local policies for these wetlands. Indeed, the SCC is a pricing instrument used in cost–benefit analysis to quantify the effect of management policies on climate change due to changes in greenhouse gas emissions and to stimulate emission reductions in line with the Paris Agreement [84].

4. Discussion

The main goal of this research was to analyze the dynamics of carbon stocks in response to LULC changes in six North African coastal wetlands using the InVEST model, to estimate the economic value of carbon sequestration and thereby inform policy related to wetlands management.

4.1. Effects of LULC Changes on Carbon Dynamics

The results showed that over the past 20 years, changes in land use have had a large impact on carbon storage in the studied wetlands. In most of the sites, these changes led to a loss in carbon sequestration, and hence probably to its emission into the atmosphere. This is the case for Tahaddart, Marchica, Reghaia and Ghar ElMelh. In general, and as reported in the literature, the main cause of the carbon storage loss is related to the loss of wetland habitats or the conversion of natural ecosystems, which are known by their potential to store carbon [85,86], due to built-up land [87,88,89]. The main underlying process associated with land transformation in most of the studied wetlands was urban expansion, which is mainly induced by population growth. Besides, agricultural activities also contributed substantially to LULC changes. Our findings support previous international literature [27,45,87,88,89,90] on the fact that healthy wetlands are effective sinks for carbon and that their encroachment through urban expansion increased the loss of carbon storage. This study also showed that less anthropized sites, such as the Moulouya wetland, store more carbon and therefore deserve to be protected from coastal development that is detrimental to their sustainability. It is obviously important for the North African countries to develop their coasts, but not at the expense of the wetlands that provide them with many goods and services.

4.2. Implications for Coastal Wetlands Management

Assessment of carbon stock dynamics in North African coastal wetlands reflected serious conflict between coastal development and conservation of natural habitats. Understanding the underlying processes that drive the changes in these dynamics can provide valuable decision-making information for carbon management in these wetlands.
North African countries are characterized by their rapid urban population growth in coastal areas as a result of rising populations and increasing migration, and it is predicted that this trend will continue in the future [91,92]. Since the coastal plains and lowlands, where wetlands are located, are also the most suitable for agriculture and urbanization, they have suffered significant changes over the last decades due to the agricultural intensification and coastal development. This land use conversion often occurs at the expense of the natural habitats surrounding the wetlands, as reported in other places [44,87]. Urban expansion near coastal wetlands is also driven by tourism, which, when poorly managed, can lead to deep degradation of these ecosystems [93]. If this trend continues, coastal wetlands will eventually become a built environment depriving riparian populations of their important ecosystem services [94], including their potential to sequester carbon and thus mitigate the effects of climate change. Therefore, North-African coastal wetlands need urgent attention from the relevant stakeholders in order to protect them from encroachment for residential and agricultural purposes.
Although significant efforts have been devoted to coastal zones protection in recent years in Algeria, Morocco and Tunisia, the full value of coastal wetlands and their potential role in climate mitigation are still in their infancy, and are often not reflected in policy and development decisions. Moreover, none of these three countries considered this possible contribution in terms of climate mitigation in their Intended Nationally Determined Contribution (INDCs) submitted so far. Further efforts are still needed to fully integrate coastal carbon stocks as part of the country’s portfolio of solutions to mitigate climate change, since carbon credits could be traded on the carbon market [95].
In addition, better carbon management of coastal wetlands will also provide co-benefits to local communities and biodiversity, thus creating a win–win situation [96]. One of the most significant opportunities for North African countries to contribute to global mitigation efforts is thus to include coastal wetlands in their national carbon inventories and to conduct wetlands conservation as Nationally Appropriate Mitigation Actions (NAMAs). At national level, coordinated effort should be made by the relevant stakeholders for effective implementation and enforcement of laws and regulations that protect wetlands.

4.3. Study Limitations

The major limitation in this study was the lack of detailed and reliable data on carbon density in different pools of the studied sites. The most crucial lack, which could lead to inaccuracies in the total estimate of carbon storage, was the absence of data on what is called the “blue carbon” in these coastal wetlands. Data and information on future land cover change and the effect of discount rate on the social cost of carbon remain important research needs, to better understand the carbon dynamics over time.

5. Conclusions

Understanding past changes in LULC provides crucial information for policy decisions on future land use planning, ecosystem management and climate regulation. The release of blue carbon in most of the North African coastal wetlands due to land reclamation in the past 20 years has resulted in a large degradation of their ecosystem services. Therefore, appropriate regulations on coastal development and protection/rehabilitation of these wetlands are needed, as they will certainly help to sequester and store blue carbon and reduce the release of carbon dioxide into the atmosphere. Our findings should be further improved by making more accurate estimates of carbon loss from coastal wetlands by carrying out field measurements to validate the used model. The biggest gap in improving studies of blue carbon in North Africa is the lack of data on the density of carbon in different pools and different sites. Countries must consider building databases and inventories to ensure regular monitoring of the dynamics of their carbon stocks.
Even if still preliminary and marred by several uncertainties, these findings could help policymakers to prioritize conservation strategies, in order to preserve and enhance carbon storage and sequestration services and fight against climate change. Carbon sequestering ecosystems are increasingly becoming a part of the international dialogue in climate mitigation discussions. Therefore, North African countries should consider this opportunity to further develop scientific knowledge on wetland ecosystems as potential sinks (or sources) of carbon, in order to include them in their national carbon accounting programs. This knowledge will support monitoring climate mitigation and adaptation strategies, and will also help promote the conservation and restoration efforts of coastal wetlands.

Author Contributions

Conceptualization, R.A. and M.S.; methodology, R.A.; software, R.A.; validation, A.S.K. and M.S.; formal analysis, R.A.; investigation, R.A. and B.O.; resources, R.A. and B.O.; data curation, R.A.; writing—original draft preparation, R.A. and M.S.; writing—review and editing, R.A., A.S.K. and M.S.; visualization, R.A.; supervision, N.M. and M.S.; project administration, N.M.; funding acquisition, A.S.K. All authors have read and agreed to the published version of the manuscript.

Funding

This research received no external funding.

Institutional Review Board Statement

Not applicable.

Informed Consent Statement

Not applicable.

Data Availability Statement

Data available on request.

Acknowledgments

We thank the Joe W. & Dorothy Dorsett Brown Foundation for supporting the publication of this work. A Kolker thanks the US State Department’s Fulbright program and the Moroccan American Commission for Educational and Cultural Exchange for this support of his involvement in this research.

Conflicts of Interest

The authors declare no conflict of interest.

References

  1. Barbier, E.B.; Hacker, S.D.; Kennedy, C.; Koch, E.W.; Stier, A.C.; Silliman, B.R. The value of estuarine and coastal ecosystem services. Ecol. Monogr. 2011, 81, 169–193. [Google Scholar] [CrossRef]
  2. Costanza, R.; Ralph, A.; Rudolf, D.G.; Stephen, F.; Grasso, M.; Hannon, B.; Limburg, K.; Naeem, S.; O’Neill, R.V.; Paruelo, J.; et al. The value of the world’s ecosystem services and natural capital. Nature 1997, 387, 253–260. [Google Scholar] [CrossRef]
  3. MEA. Ecosystems and Human Well-Being: Wetlands and Water; World Resources Institute: Washington, DC, USA, 2005; p. 5. [Google Scholar]
  4. Schuyt, K.D. Economic consequences of wetland degradation for local populations in Africa. Ecol. Econ. 2005, 53, 177–190. [Google Scholar] [CrossRef]
  5. Barbier, E.B. Progress and challenges in valuing coastal and marine ecosystem services. Rev. Environ. Econ. Policy 2012, 6, 1–19. [Google Scholar] [CrossRef] [Green Version]
  6. Lopes, R.; Videira, N. Valuing marine and coastal ecosystem services: An integrated participatory framework. Ocean Coast. Manag. 2013, 84, 153–162. [Google Scholar] [CrossRef]
  7. Howard, J.; Sutton-Grier, A.; Herr, D.; Kleypas, J.; Landis, E.; Mcleod, E.; Pidgeon, E.; Simpson, S. Clarifying the role of coastal and marine systems in climate mitigation. Front. Ecol. Environ. 2017, 15, 42–50. [Google Scholar] [CrossRef]
  8. PAP/RAC. The Governance of Coastal Wetlands in the Mediterranean, Handbook; Shipman, A., Rajković, B., Split, Ž., Eds.; PAP/RAC: Split, Croatia, 2019. [Google Scholar]
  9. Daily, G.C.; Matson, P.A. Ecosystem Services: From theory to implementation. Proc. Natl. Acad. Sci. USA 2008, 105, 9455. [Google Scholar] [CrossRef] [Green Version]
  10. McInerny, G.J.; Chen, M.; Freeman, R.; Gavaghan, D.; Meyer, M.; Rowland, F.; Spiegelhalter, D.J.; Stefaner, M.; Tessarolo, G.; Hortal, J. Information visualization for science and policy: Engaging users and avoiding bias. Trends Ecol. 2014, 29, 148–157. [Google Scholar] [CrossRef] [Green Version]
  11. Malinga, R.; Gordon, L.J.; Jewitt, G.; Lindborg, R. Mapping ecosystem services across scales and continents—A review. Ecosyst. Serv. 2015, 13, 57–63. [Google Scholar] [CrossRef]
  12. Depellegrin, D.; Pereira, P.; Misiunė, I.; Egarter-Vigl, L. Mapping ecosystem services potential in Lithuania. Int. J. Sust. Dev. World Ecol. 2016, 23, 441–455. [Google Scholar] [CrossRef]
  13. Newton, A.; Brito, A.C.; Icely, J.; Derolez, V.; Clara, I.; Angus, S.; Schernewski, G.; Inácio, M.; Lillebø, A.I.; Sousa, A.I.; et al. Assessing, quantifying and valuing the ecosystem services of coastal lagoons. J. Nat. Conserv. 2018, 44, 50–65. [Google Scholar] [CrossRef]
  14. Sousa, A.I.; Lillebø, A.I.; Risgaard-Petersen, N.; Pardal, M.A.; Caçador, I. Denitrification: An ecosystem service provided by salt marshes. Mar. Ecol. Prog. Ser. 2013, 448, 79–92. [Google Scholar] [CrossRef] [Green Version]
  15. Mitsch, W.J.; Bernal, B.; Nahlik, A.M.; Mander, U.; Zhang, L.; Anderson, C.J.; Jørgensen, S.E.; Brix, H. Wetlands, carbon, and climate change. Landsc. Ecol. 2012, 28, 583–597. [Google Scholar] [CrossRef]
  16. Tallis, H.T.; Ricketts, T.; Guerry, A.D.; Wood, S.A.; Sharp, R.; Nelson, E.; Chaplin-Kramer, R. InVEST 2.6.0 User’s Guide. Stanford: The Natural Capital Project; InVEST: Stanford, CA, USA, 2013. [Google Scholar]
  17. Hopkinson, C.S.; Cai, W.-J.; Hu, X. Carbon sequestration in wetland dominated coastal systems—A global sink of rapidly diminishing magnitude. Curr. Opin. Environ. Sustain. 2012, 4, 186–194. [Google Scholar] [CrossRef]
  18. Mcleod, E.; Chmura, G.L.; Bouillon, S.; Salm, S.; Björk, M.; Duarte, C.M.; Lovelock, C.E.; Schlesinger, H.W.; Silliman, B.R. A blueprint for blue carbon: Toward an improved understanding of the role of vegetated coastal habitats in sequestering CO2. Front. Ecol. Environ. 2011, 7, 362–370. [Google Scholar] [CrossRef]
  19. Huang, G.; Chen, D.; Li, T.; Wu, F.; van der Maaten, L.; Weinberger, K.Q. Multi-scale dense convolutional networks for efficient prediction. arXiv 2017, arXiv:1703.09844. [Google Scholar]
  20. Ward, R.D. Carbon sequestration and storage in Norwegian Arctic coastal wetlands: Impacts of climate change. Sci. Total Environ. 2020, 748, 141343. [Google Scholar] [CrossRef]
  21. Kennedy, R.; Yang, Z.; Cohen, W.B. Detecting trends in forest disturbance and recovery using yearly Landsat time series: LandTrendr—Temporal segmentation algorithms. Remote Sens. Environ. 2010, 114, 2897–2910. [Google Scholar] [CrossRef]
  22. Alongi, D.M.; de Carvalho, N.A.; Amaral, A.L.; da Costa, A.; Trott, L.A.; Tirendi, F. Uncoupled surface and belowground soil respiration in mangroves: Implications for estimates of dissolved inorganic carbon export. Biogeochemistry 2012, 109, 151–162. [Google Scholar] [CrossRef]
  23. Atwood, T.B.; Witt, A.; Mayorga, J.; Hammill, E.; Sala, E. Global Patterns in Marine Sediment Carbon Stocks. Front. Mar. Sci. 2020, 7, 165. [Google Scholar] [CrossRef]
  24. Biddoccu, M.; Ferraris, S.; Opsi, F.; Cavallo, E. Long-term monitoring of soil management effects on runoff and soil erosion in sloping vineyards in Alto Monferrato (North-West Italy). Soil Till. Res. 2016, 155, 176–189. [Google Scholar] [CrossRef]
  25. Gullström, M.; Lyimo, L.D.; Dahl, M.; Samuelsson, G.S.; Eggertsen, M.; Anderberg, E.; Rasmusson, L.M.; Linderholm, H.W.; Knudby, A.; Bandeira, S.; et al. Blue carbon storage in tropical seagrass meadows relates to carbonate stock dynamics, plant-sediment processes and landscape context: Insights from the Western Indian Ocean. Ecosystems 2018, 21, 551–566. [Google Scholar] [CrossRef] [Green Version]
  26. Shields, M.R.; Bianchi, T.S.; Mohrig, D.; Hutchings, J.H.; Kenney, W.F.; Kolker, A.S.; Curtis, J.H. Carbon storage in the Mississippi River delta enhanced by environmental engineering. Nat. Geosci. 2017, 10, 846–851. [Google Scholar] [CrossRef]
  27. Li, Y.; Qiu, J.; Li, Z.; Li, Y. Assessment of Blue Carbon Storage Loss in Coastal Wetlands under Rapid Reclamation. Sustainability 2018, 10, 2818. [Google Scholar] [CrossRef] [Green Version]
  28. Laurance, W.F.; Dell, B.; Turton, S.M.; Lawes, M.J.; Hutley, L.B.; McCallum, H.; Dale, P.; Bird, M.; Hardy, G.; Prideaux, G.; et al. The 10 Australian ecosystems most vulnerable to tipping points. Biol. Conserv. 2011, 144, 1472–1480. [Google Scholar] [CrossRef]
  29. Cramer, W.; Guiot, J.; Fader, M.; Garrabou, J.; Gattuso, J.B.; Iglesias, A.; Lange, M.A.; Lionello, P.; Llasat, M.C.; Paz, S.; et al. Climate change and interconnected risks to sustainable development in the Mediterranean. Nat. Clim. Change 2018, 8, 972–980. [Google Scholar] [CrossRef] [Green Version]
  30. Mediterranean Wetlands Outlook 2: Solutions for Sustainable Mediterranean Wetlands; Tour du Valat: Arles, France, 2018.
  31. El Mahrad, B.; Abalansa, S.; Newton, A.; Icely, J.D.; Snoussi, M.; Kacimi, I. Social-environmental analysis for the management of coastal lagoons in North Africa. Front. Environ. Sci. 2020, 8, 37. [Google Scholar] [CrossRef]
  32. Aitali, R.; Snoussi, M.; Kasmi, S. Coastal development and risks of flooding in Morocco: The cases of Tahaddart and Saidia coasts. J. Afr. Earth Sci. 2020, 164, 103771. [Google Scholar] [CrossRef]
  33. Mitsch, W.J.; Gosselink, J.G. The value of wetlands: Importance of scale and landscape setting. Ecol. Econ. 2000, 35, 25–33. [Google Scholar] [CrossRef]
  34. Folkersen, M.V. Ecosystem valuation: Changing discourse in a time of climate change. Elsevier J. Ecosyst. Serv. 2018, 29, 1–12. [Google Scholar] [CrossRef] [Green Version]
  35. Flayou, L.; Snoussi, M.; Raji, O. Evaluation of the economic costs of beach erosion due to the loss of the recreational services of sandy beaches—The case of Tetouan coast (Morocco). J. Afr. Earth Sci. 2021, 182, 104257. [Google Scholar] [CrossRef]
  36. Satta, A.; Puddu, M.; Venturini, S.; Giupponi, C. Assessment of coastal risks to climate change related impacts at the regional scale: The case of the Mediterranean region. Int. J. Disast. Risk Reduct. 2017, 24, 284–296. [Google Scholar] [CrossRef]
  37. Eid, E.M.; Keshta, A.E.; Shaltout, K.H.; Baldwin, A.H.; El-Din, S.; Ahmed, A. Carbon sequestration potential of the five Mediterranean lakes of Egypt. Fundam. Appl. Limnol./Arch. Hydrobiol. 2017, 190, 87–96. [Google Scholar] [CrossRef]
  38. Howard, J.; Hoyt, S.; Isensee, K.; Telszewski, M.; Pidgeon, E. (Eds.) Coastal Blue Carbon: Methods for Assessing Carbon Stocks and Emissions Factors in Mangroves, Tidal Salt Marshes, and Seagrasses; Conservation International; Intergovernmental Oceanographic Commission of UNESCO; International Union for Conservation of Nature: Arlington, VA, USA, 2014; Available online: https://www.thebluecarboninitiative.org/manual/ (accessed on 19 April 2021).
  39. Tang, J.; Ye, S.; Chen, X.; Yang, H.; Sun, X.; Wang, F.; Wen, Q.; Chen, S. Coastal blue carbon: Concept, study method, and the application to ecological restoration. Sci. China Earth Sci. 2018, 61, 637–646. [Google Scholar] [CrossRef]
  40. El Mahrad, B.; Newton, A.; Icely, J.D.; Kacimi, I.; Abalansa, S.; Snoussi, M. Contribution of Remote Sensing Technologies to a Holistic Coastal and Marine Environmental Management Framework: A Review. Remote Sens. 2020, 12, 2313. [Google Scholar] [CrossRef]
  41. Klemas, V. Remote sensing of emergent and submerged wetlands: An overview. Int. J. Remote Sens. 2013, 34, 6286–6320. [Google Scholar] [CrossRef]
  42. Polasky, S.; Nelson, E.; Pennington, D.N.; Johnson, K. The impact of land-use changes on ecosystem services, biodiversity and returns to landowners: A case study in the state of Minnesota. Environ. Resour. Econ. 2011, 48, 219–242. [Google Scholar] [CrossRef]
  43. Sieber, J.; Pons, M. Assessment of urban ecosystem services using ecosystem services reviews and GIS-based tools. Procedia Eng. 2015, 115, 53–60. [Google Scholar] [CrossRef] [Green Version]
  44. He, C.; Zhang, D.; Huang, Q.; Zhao, Y. Assessing the potential impacts of urban expansion on regional carbon storage by linking the LUSD-urban and InVEST models. Environ. Model. Softw. 2016, 75, 44–58. [Google Scholar] [CrossRef]
  45. Nelson, E.; Mendoza, G.; Regetz, J.; Polasky, S.; Tallis, H.; Cameron, D.R.; Chan, K.M.A.; Daily, G.C.; Goldstein, J.; Kareiva, P.M.; et al. Modeling multiple ecosystem services, biodiversity conservation, commodity production, and tradeoffs at landscape scales. Front. Ecol. Environ. 2009, 7, 4–11. [Google Scholar] [CrossRef]
  46. Tallis, H.; Polasky, S. Assessing multiple ecosystem services: An integrated tool for the real world. In Natural Capital: Theory and Practice of Mapping Ecosystem Services; Karvera, P., Tallis, H., Ricketts, T.H., Daily, G.C., Polasky, S., Eds.; Oxford University Press: Oxford, UK, 2011; pp. 34–52. [Google Scholar]
  47. Qiu, J.X.; Turner, M.G. Spatial interactions among ecosystem services in an urbanizing agricultural watershed. Proc. Natl. Acad. Sci. USA 2013, 110, 149–154. [Google Scholar] [CrossRef] [PubMed] [Green Version]
  48. Dakki, M. Diagnosis for Wetland Management in Northeast Morocco—Sebkha Bou Areg (Nador Lagoon). Medwetcoast-Morocco, Rapports de l’Institut Scientifique Rabat. 2003. Available online: http://vinc.s.free.fr/IMG/MWC_Maroc_ZH_BouAreg.pdf (accessed on 10 January 2017).
  49. Qninba, A.; Benhoussa, A.; El Agbani, M.A.; Dakki, M.; Thévenot, M. Etude phénologique et variabilité interannuelle d’abondance des Charadriidés (Aves, Charadrii) dans un site Ramsar du Maroc: La Merja Zerga. Bull. Inst. Sci. Rabat Sect. Sci. De La Vie 2006, 28, 35–47. [Google Scholar]
  50. Benhoussa, A.; Dakki, M.; Qninba, A.; El Agbani, M.A. Habitats d’un site Ramsar côtier du Maroc, la Merja Zerga: Approches typologiques et cartographique. Humed. Mediterráneos 1999, 1, 75–82. [Google Scholar]
  51. Snoussi, M.; Ouchani, T.; Niazi, S. Vulnerability assessment of the impact of sea-level rise and flooding on the Moroccan coast: The case of the Mediterranean eastern zone. Coast. Shelf Sci. 2008, 77, 206–213. [Google Scholar] [CrossRef]
  52. Achab, M. Les plages et les vasières des environs des embouchures des oueds Tahaddart et Gharifa (NW du Maroc: Dynamique morphosédimentaire et impact des aménagements sur leur évolution récente. In Proceedings of the Fifth International Symposium on Sandy Beaches, Rabat, Morocco, 19–23 October 2009; pp. 1–12. [Google Scholar]
  53. Béjaoui, B.; Ottaviani, E.; Barelli, E.; Ziadi, B.; Dhib, A.; Lavoie, M.; Gianluca, C.; Turki, S.; Solidoro, C.; Aleya, L. Machine learning predictions of trophic status indicators and plankton dynamic in coastal lagoons. Ecol. Indic. 2018, 95, 765–774. [Google Scholar] [CrossRef]
  54. Eggleston, H.S.; Buendia, L.; Miwa, K.; Ngara, T.; Tanabe, K. IPCC Guidelines for National Greenhouse Gas Inventories; Institute for Global Environmental Strategies: Hayama, Japan, 2006; Volume 2, pp. 48–56. [Google Scholar]
  55. Moussadek, R.; Mrabet, R.; Dahan, R.; Zouahri, A.; El Mourid, M.; Ranst, E.V. Tillage system affects soil organic carbon storage and quality in Central Morocco. Appl. Environ. Soil Sci. 2014, 2014, 654796. [Google Scholar] [CrossRef]
  56. Oubrahim, H.; Boulmane, M.; Bakker, M.R.; Augusto, L.; Halim, M. Carbon storage in degraded cork oak (quercus suber forests on flat lowlands in Morocco. iForest-Biogeosci. For. 2014, 9, e1–e13. [Google Scholar] [CrossRef]
  57. Hinson, A.L.; Feagin, R.A.; Eriksson, M.; Najjar, R.G.; Herrmann, M.; Bianchi, T.S.; Kemp, M.; Hutchings, J.A.; Crooks, S.; Boutton, T. The spatial distribution of soil organic carbon in tidal wetland soils of the continental United States. Glob. Change Biol. 2017, 23, 5468–5480. [Google Scholar] [CrossRef]
  58. High-Level Commission on Carbon Prices; Report of the High-Level Commission on Carbon Prices; License: Creative Commons Attribution CC BY 3.0 IGO; World Bank: Washington, DC, USA, 2017.
  59. Rosenfield, G.H.; Fitzpatrick-Lins, K. A coefficient of agreement as a measure of thematic classification accuracy. Photogramm. Eng. Remote Sens. 1986, 52, 223–227. [Google Scholar]
  60. Bagstad, K.J.; Semmens, D.J.; Waage, S.; Winthrop, R. A comparative assessment of decision-support tools for ecosystem services quantification and valuation. Ecosyst. Serv. 2013, 5, 27–39. [Google Scholar] [CrossRef]
  61. Leh, M.D.K.; Matlock, M.D.; Cummings, E.C.; Nalley, L.L. Quantifying and mapping multiple ecosystem services change in west Africa. Agric. Ecosyst. Environ. 2013, 165, 6–18. [Google Scholar] [CrossRef]
  62. Zhou, C.H.; Mao, Q.Y.; Xu, X.; Fang, C.M.; Luo, Y.M.; Li, B. Preliminary analysis of C sequestration potential of blue carbon ecosystems on Chinese coastal zone. Sci. Sin. Vitae 2015, 46, 475–486. [Google Scholar]
  63. Sharps, K.; Masante, D.; Thomas, A.; Jackson, B.; Redhead, J.; May, L.; Prosser, H.; Cosby, B.; Emmett, B.; Jones, L. Comparing strengths and weaknesses of three ecosystem services modelling tools in a diverse UK river catchment. Sci. Total Environ. 2017, 584, 118–130. [Google Scholar] [CrossRef] [Green Version]
  64. Tao, Y.; Li, F.; Wang, R.; Zhao, D. Effects of land use and cover change on terrestrial carbon stocks in urbanized areas: A study from Changzhou, China. J. Clean. Prod. 2015, 103, 651–657. [Google Scholar] [CrossRef]
  65. Newbold, S.; Griffiths, C.; Moore, C.; Wolverton, A.; Kopits, E. The “Social Cost of Carbon” Made Simple; National Center for Environmental Economics, US Environmental Protection Agency: Washington, DC, USA, 2009. [Google Scholar]
  66. Tol, R.S.J. Social cost of carbon for (almost) every country. Energy Econ. 2019, 83, 555–566. [Google Scholar] [CrossRef]
  67. Pendleton, L.; Donato, D.C.; Murray, B.C.; Crooks, S.; Jenkins, W.A.; Sifleet, S.; Craft, C.; Fourqurean, J.W.; Kauffman, J.B.; Marba, N.; et al. Estimating Global ‘‘Blue Carbon’’ Emissions from Conversion and Degradation of Vegetated Coastal Ecosystems. PLoS ONE 2012, 7, 35–42. [Google Scholar] [CrossRef] [PubMed] [Green Version]
  68. Melaku Canu, D.; Ghermandi, A.; Nunes, P.; Lazzari, P.; Cossarini, G.; Solidoro, C. Estimating the value of carbon sequestration ecosystem services in the Mediterranean Sea: An ecological economics approach. Glob. Environ. Change 2015, 32, 87–95. [Google Scholar] [CrossRef] [Green Version]
  69. Nordhaus, W. Estimates of the social cost of carbon: Concepts and results from the DICE-2013R model and alternative approaches. J. Assoc. Environ. Resour. Econ. 2014, 1, 273–312. [Google Scholar] [CrossRef]
  70. OECD. The Social Cost of Carbon. In Cost-Benefit Analysis and the Environment: Further Developments and Policy Use; OECD Publishing: Paris, France, 2018. [Google Scholar] [CrossRef]
  71. Carruesco, C. Genèse et évolution à l’holocène de trois Lagunes de la façade Atlantique: Moulay Bousselham, Oualidia (Maroc) et Arcachon (France); Thèse Université de Bordeaux: Bordeaux, France, 1989. [Google Scholar]
  72. Ahmed, M.H.; El Leithy, B.M.; Thompson, J.R.; Flower, R.J.; Ramdani, M.; Ayache, F.; Hassan, S.M. Application of remote sensing to site characterisation and environmental change analysis of North African coastal lagoons. Hydrobiologia 2009, 622, 147–171. [Google Scholar] [CrossRef]
  73. Ayache, F.; Thompson, J.R.; Flower, R.J.; Boujarra, A.; Rouatbi, F.; Makina, H. Environmental characteristics, landscape history and pressures on three coastal lagoons in the southern mediterranean region: Merja zerga Morocco, ghar el melh Tunisia and lake manzala Egypt. Hydrobiologia 2009, 622, 15–43. [Google Scholar] [CrossRef]
  74. Karim, M.; Maanan, M.; Maanan, M.; Rhinane, H.; Rueff, H.; Baidder, L. Assessment of water body change and sedimentation rate in Moulay Bousselham wetland, Morocco, using geospatial technologies. Int. J. Sediment Res. 2018, 34, 65–72. [Google Scholar] [CrossRef]
  75. Chattou, Z. Tanger à la croisée de nouvelles recompositions territoriales et de mobilités transnationales. Méditerranée 2011, 1, 133–138. [Google Scholar] [CrossRef]
  76. Taaouati, M.; Anfuso, G.; Nachite, D. Morphological characterization and evolution of Tahaddart littoral spit, Atlantic coast of Morocco. Coast. Res. Libr. 2015, 12, 289–306. [Google Scholar]
  77. Rifai, N.; Khattabi, A.; Moukrim, S.; Arahou, M.; Rhazi, L. Évaluation de la dynamique de l’occupation du sol dans la zone humide Ramsar de Tahaddart. Rev. D’écologie 2018, 73, 142–152. [Google Scholar]
  78. García-Ayllón, S. Integrated management in coastal lagoons of highly complexity environments: Resilience comparative analysis for three case-studies. Ocean Coast. Manag. 2017, 143, 16–25. [Google Scholar] [CrossRef]
  79. Zagonari, F. An Optimization Model for Integrated Urban Planning: Development and Application to Algeria’s Reghaïa and Heraoua Municipalities. Environ. Manag. 2011, 47, 937. [Google Scholar] [CrossRef]
  80. Ministère de l’aménagement du territoire et de l’environnement. Plan Côtier de Reghaia; PAP/RAC/Medpartnership Programme: Algiers, Algeria, 2015; p. 54. [Google Scholar]
  81. Romdhane, M.S. Lagune de Ghar el Melh: Milieu, Peuplement, Exploitation. Ph.D. Thesis, Faculté des Sciences de Tunis, Tunis, Tunisia, 1985. [Google Scholar]
  82. Added, A. Biogeochemical cycle of Org-C, Tot-N and Tot-S in the sediment of the Ghar El Melh Lagoon north of Tunisia. J. Mar. Syst. 2001, 30, 139–154. [Google Scholar] [CrossRef]
  83. IUCN; WWF-NA. Characterisation and Conservation Assessment of Terrestrial Biodiversity at Ghar El Melh; IUCN Centre for Mediterranean Cooperation: Malaga, Spain, 2021; p. 58. [Google Scholar]
  84. Markandya, A.; Sampedro, J.; Smith, S.J.; Dingenen, R.V.; Pizarro-Irizar, C.; Arto, I.; Gonzalez-Eguino, M. Health co-benefits from air pollution and mitigation costs of the Paris Agreement: A modelling study. Lancet Planet. Health 2018, 2, 126–433. [Google Scholar] [CrossRef] [Green Version]
  85. Laffoley, D.A.; Grimsditch, G. The Management of Natural Coastal Carbon Sinks; IUCN: Gland, Switzerland, 2009. [Google Scholar]
  86. Lau, W.W.Y. Beyond carbon: Conceptualizing payments for ecosystem services in blue forests on carbon and other marine and coastal ecosystem services. Ocean Coast. Manag. 2013, 83, 5–14. [Google Scholar] [CrossRef]
  87. Jiang, W.; Deng, Y.; Tang, Z.; Lei, X.; Chen, Z. Modelling the potential impacts of urban ecosystem changes on carbon storage under different scenarios by linking the CLUE-S and the InVEST models. Ecol. Model. 2017, 345, 30–40. [Google Scholar] [CrossRef]
  88. Yim, J.; Kwon, B.-O.; Nam, J.; Hwang, J.H.; Choi, K.; Khim, J.S. Analysis of forty years long changes in coastal land use and land cover of the Yellow Sea: The gains or losses in ecosystem services. Environ. Pollut. 2018, 241, 74–84. [Google Scholar] [CrossRef] [PubMed]
  89. Ma, T.; Li, X.; Bai, J.; Ding, S.; Zhou, F.; Cui, B. Four decades’ dynamics of coastal blue carbon storage driven by land use/land cover transformation under natural and anthropogenic processes in the Yellow River Delta, China. Sci. Total Environ. 2019, 655, 741–750. [Google Scholar] [CrossRef] [PubMed]
  90. Zhao, S.Q.; Liu, S.G.; Sohl, T.; Young, C.; Werner, J. Land use and carbon dynamics in the southeastern United States from 1992 to 2050, Environ. Res. Lett. 2013, 8, 044022. [Google Scholar] [CrossRef] [Green Version]
  91. United Nations. World Population Prospects 2019; Department of Economic and Social Affairs: New York, NY, USA, 2019; Available online: https://population.un.org/wpp/ (accessed on 5 June 2020).
  92. UNEP/MAP; Plan Bleu. State of the Environment and Development in the Mediterranean; United Nations Environment Program: Nairobi, Kenya, 2020. [Google Scholar]
  93. Coutts, A.M.; Tapper, N.J.; Beringer, J.; Loughnan, M.; Demuzere, M. Watering our cities the capacity for Water Sensitive Urban Design to support urban cooling and improve human thermal comfort in the Australian context. Prog. Phys. Geogr. 2013, 37, 2–28. [Google Scholar] [CrossRef]
  94. Ekumah, B.; Armah, F.O.; Afrifa, E.K.A.; Aheto, D.W.; Odoi, J.O.; Afitiri, A.R. Assessing land use and land cover change in coastal urbanwetlands of international importance in Ghana using Intensity Analysis. Wetl. Ecol. Manag. 2020, 28, 271–284. [Google Scholar] [CrossRef]
  95. Plan Vivo. The Plan Vivo Standard for Community Payments for Ecosystem Services Programmes. In Restore America’s Estuaries, and Silvestrum; VM0033 Methodology for Tidal Wetland and Seagrass Restoration. In Verified Carbon Standard; Edinburgh. 2013. Available online: https://www.planvivo.org (accessed on 25 June 2021).
  96. Herr, D.; Landis, E. Coastal Blue Carbon Ecosystems. Opportunities for Nationally Determined Contributions; Policy Brief; IUCN: Gland, Switzerland; Washington, DC, USA, 2016. [Google Scholar]
Figure 1. Location of the selected study sites.
Jmse 10 00364 g001
Figure 2. Flowchart of the method used in this study.
Jmse 10 00364 g002
Figure 3. Maps and percentages of LULC changes in Moulay Bouselham between 1999 and 2019: (A) LULC change of 1999; (B) LULC change of 2019.
Jmse 10 00364 g003
Figure 4. Maps and percentages of LULC changes in Tahaddart between 1999 and 2019: (A) LULC change of 1999; (B) LULC change of 2019.
Jmse 10 00364 g004
Figure 5. Maps and percentages of LULC changes in Marchica between 1999 and 2019: (A) LULC change of 1999; (B) LULC change of 2019.
Jmse 10 00364 g005
Figure 6. Maps and percentages of LULC changes in Moulouya between 1999 and 2019: (A) LULC change of 1999; (B) LULC change of 2019.
Jmse 10 00364 g006
Figure 7. Maps and percentages of LULC changes in Reghaia between 1999 and 2019: (A) LULC change of 1999; (B) LULC change of 2019.
Jmse 10 00364 g007
Figure 8. Maps and percentages of LULC changes in Ghar El Melh between 1999 and 2019: (A) LULC change of 1999; (B) LULC change of 2019.
Jmse 10 00364 g008
Figure 9. Estimated carbon stocks in the studied sites in response to LULC changes between 1999 and 2019.
Jmse 10 00364 g009
Figure 10. Wetlands carbon stock. (A) Moulay Bousselham carbon stock of 1999;(B) Moulay Bousselham carbon stock of 2019; (C) Tahaddart carbon stock of 1999; (D) Tahaddart carbon stock of 2019; (E) Marchica carbon stock of 1999; (F) Marchica carbon stock of 2019; (G) Moulouya carbon stock of 1999; (H) Moulouya carbon stock of 2019; (I) Reghaia carbon stock of 1999; (J) Reghaia carbon stock of 2019; (K) Ghar El Melh carbon stock of 1999; (L) Ghar El Melh carbon stock of 2019.
Jmse 10 00364 g010
Table 1. Main characteristics of the study areas.
Wetland NameMoulay BouselhamTahaddartMoulouyaMarchicaReghaiaGhar ElMelh
TypeLagoonDrowned River ValleyEstuaryLagoonDrowned River ValleyLagoon
Surface45 km2140 km230 km2115 km28.42 km231 km2
Protection statusRamsar site
SIBE * area
Ramsar site
SIBE area
Ramsar site
SIBE area
Ramsar site
SIBE area
Ramsar siteRamsar site
Main economic activitiesAgriculture/TourismAgricultureAgricultureTourism/
Fisheries
AgricultureTourism
Main PressuresUrbanization
Siltation
UrbanizationDammingUrbanizationDeforestation
Urbanization
Urbanization
Plants speciesZostera marina,
Spartina maritima,
Sarcocornia perennis,
Puccinella font-queri
Salicornia
Typhae
Halophiles
Juncus
Arthrocnemum;
Inula;
Tamarix
Limonium cymuliferum
Paspalum vaginatum,
Ruppia maritima,
Typhae
Scirpus lacustris;
Eucalyptus camaldulensis;
Typha latifolia;
Iris pseudocorus
halophile de Salicornia et
d’Arthrocnemum.
Phragmites,
Ruppia;
Salicornia sp.
Spartina sp., Salicornia sp.,
Ruppia cirrhosa;
Zostera noltii
* SIBE: Site of biological and ecological interest (Moroccan designation).
Table 2. Data used for the CBC modeling.
DataDescriptionData Sources
LULC Data
Historical LULCAcquisition date (30 December 1999)The Landsat thematic mapper and Google Earth ImagesLandsat Thematic Mapper, Google Earth (https://rsis.ramsar.org/, accessed on 24 June 2021) [48,49,50,51,52,53]
Current LULCAcquisition date (30 October 2019)
Carbon storage for LULC types
Carbon densityThe average of carbon storage in different poolsInVEST-Data
[16,54,55,56,57]
Economic value of 1 ton of carbonSocial cost of carbon (SCC)InVEST-CSS model and data from [58].
Table 3. Economic value of the carbon sequestrated or emitted.
Carbon Stocks 1999
(Mg/ha)
Carbon Stocks 2019
(Mg/ha)
Sequestration (+)/Emission (−)
(Mg/ha)
SCC (USD)
20202030
Moulouya30.0149.08+19.0734,32642,907
My Bouselham33.3448.07+14.7326,51433,142
Tahaddart43.1526.71−16.44−29,592−36,990
Reghaia36.4720.23−16.24−29,232−36,540
Ghar ElMelh38.0226.94−11.08−19,944−24,930
Marchica21.0314.16−6.87−12,366−15,457
Publisher’s Note: MDPI stays neutral with regard to jurisdictional claims in published maps and institutional affiliations.

