Article

Effect of the Printing Angle on the Microstructure and Tensile Performance of Iron-Reinforced Polylactic Acid Composite Manufactured Using Fused Filament Fabrication

by
Sofiane Guessasma
1,* and
Sofiane Belhabib
2
1
INRAE, Research Unit BIA UR1268, Rue Geraudiere, 44316 Nantes, France
2
Mechanical and Production Engineering Department, Nantes Université, IUT, 2 Av. du Professeur Jean Rouxel, 44470 Carquefou, France
*
Author to whom correspondence should be addressed.
J. Manuf. Mater. Process. 2024, 8(2), 65; https://doi.org/10.3390/jmmp8020065
Submission received: 31 January 2024 / Revised: 16 March 2024 / Accepted: 19 March 2024 / Published: 27 March 2024

Abstract

:
This work emphasizes an innovative approach utilizing 3D imaging technology based on synchrotron radiation to assess the microstructure of second-phase iron particles and the porous structure within 3D-printed PLA/magnetic iron composites at different printing angles. The study examines how these observations relate to the material’s ductility when processed using fused filament fabrication. In particular, this study examines the impact of one processing parameter, specifically the printing angle, on the microstructure and mechanical behaviour of a polylactic acid (PLA)–iron (PLI) composite designed for magnetic actuation. Fused filament fabrication is employed to produce PLI tensile specimens, with varied printing angles to create different layups. X-ray microtomography is utilized to analyse the microstructure, while tensile mechanical properties are evaluated for all composites, with findings discussed in relation to printing angle conditions. Scanning Electron Microscopy is used to examine the fractography of broken specimens. Results indicate that the printing angle significantly influences the tensile properties and mechanical anisotropy of 3D-printed PLI composites, with an optimal 45°/45° layup enhancing tensile performance. These findings suggest that 3D-printed PLI composites offer a cost-efficient means of producing bio-sourced, light-adaptive materials with intricate magnetic actuation capabilities. By quantifying the modulation of mechanical properties based on printing parameters that influence microstructural arrangement, the research sheds light on a novel aspect of composite material characterization.

1. Introduction

Additive Manufacturing (AM) has become a groundbreaking technology that has gained considerable attention in recent years [1,2]. It offers significant potential for producing highly complex technical components with precision, layer by layer, based on digital models [3]. AM allows for localized material deposition, enabling customized parts with minimal reliance on traditional tooling [4,5,6]. This capability has led to the development of novel materials like adaptive materials [7]. With its rapid fabrication cycle, AM finds applications across diverse sectors including bioengineering, aeronautics, civil engineering, prototyping, automotive, the food industry, and art [8,9,10,11,12]. The broad adoption of AM can be attributed to its varied processes, enabling the printing of a wide array of materials. Notably, Fused Filament Fabrication (FFF) stands out as a popular and cost-effective method for printing polymeric structures [13,14].
In recent decades, PLA (polylactic acid) and ABS (acrylonitrile–butadiene–styrene) have emerged as primary filament materials for additive manufacturing [15,16].
Research, exemplified by Ahn et al. [17], has underscored the importance of part orientation in creating anisotropic behaviour in ABS-printed materials. Advancements in FFF have focused on high-performance feedstock materials [18], including ceramic-based composites [19], and carbon fibre-reinforced composites [20,21,22], to address typical loss in mechanical performance due to process-generated porosity. These contributions well demonstrate that the value added by the use of a second-phase material can be compromised if proper printing conditions are not considered.
Metal-reinforced polymers have also garnered interest [21], with studies like Buj-Corral et al.’s [23] investigation into the porosity effects in copper-reinforced PLA. Additionally, Martinez et al. [24] explored the 3D printing technology to develop iron-filled PLA for microwave absorption applications. Török et al. [25] delved into the relationship between fused filament manufacturing parameters and the mechanical performance of various metal-reinforced PLA composites, incorporating copper, steel, and iron fillers. Both Buchanan et al. and Kumar et al. [26,27] studied the effect of process conditions such as infill density, layer height, and print speed on the properties of iron–PLA composite. This study concluded on the possible optimisation of the printing process such as the print time by decreasing the infill density, increasing layer height, and increasing print speed.
To be efficient, magnetic actuation needs to be performed under low mechanical stress due to the low generated magnetic fields [28]. In this research, we explore the potential of FFF to develop adaptative composite materials capable of magnetic actuation. Adaptative composites are composites capable of changing their properties ‘adapting’ according to external stimuli. Typical examples of these are shape memory alloys [29] and hygromorphs [30]. The primary focus of this research lies in identifying the processing parameters that facilitate a suitable decrease in mechanical properties by examining how the printing angle affects the mechanical characteristics of PLA/magnetic iron composites. The modulation of the mechanical performance is mainly guided by the magnetic actuation application. However, this modulation is bounded by connectivity of the solid phase, the mechanical stability required for handing and the threshold imposed by in-service specifications. Among the large number of printing conditions that can be used to control the modulation of the mechanical performance, some are not suitable to generate large actuation. For instance, the part orientation has to be chosen to allow a proper load transfer. As shown by Sood et al. [31], load transfer is significantly altered in the direction of building. This means that filament arrangements need to be planned normally to the building direction. The printing temperature can generate also a modulation on the stretchability and strength [32], but the extent of this modulation can be limited, especially for composite filaments [33]. Another key processing parameter is the infill rate. Although this parameter is easy to tune, the mastering of the deformation mechanisms depends significantly on the type of unit cell used for the infill [34]. In order to understand the effect of the printing angle on the generated microstructures, 3D imaging technique based on X-ray microtomography is used. Imaging techniques play a pivotal role in the 3D microstructural characterization of 3D-printed materials [35], offering valuable insights into their internal architecture and properties including defects [36]. One of the most innovative methods utilized in this domain is synchrotron radiation-based 3D imaging [37]. This advanced technique provides unparalleled resolution and depth penetration, allowing for precise visualization of intricate microstructures. It has been successfully used to characterise second-phase distribution and porous structure within composites [38]. Additionally, X-ray microtomography (XMT) is commonly employed for non-destructive 3D imaging of internal structures with high spatial resolution. By rotating the sample and capturing X-ray projections from multiple angles, XMT enables the reconstruction of a detailed 3D representation of the material’s microstructure [39]. These imaging techniques not only aid in understanding the relationships between microstructure and mechanical properties but also facilitate the optimisation of printing parameters for enhanced material performance and functionality. It is used in this study to gain deeper understanding of the effect of the printing angle on the microstructure and tensile properties of PLA–iron 3D-printed composite.

2. Experimental Layout

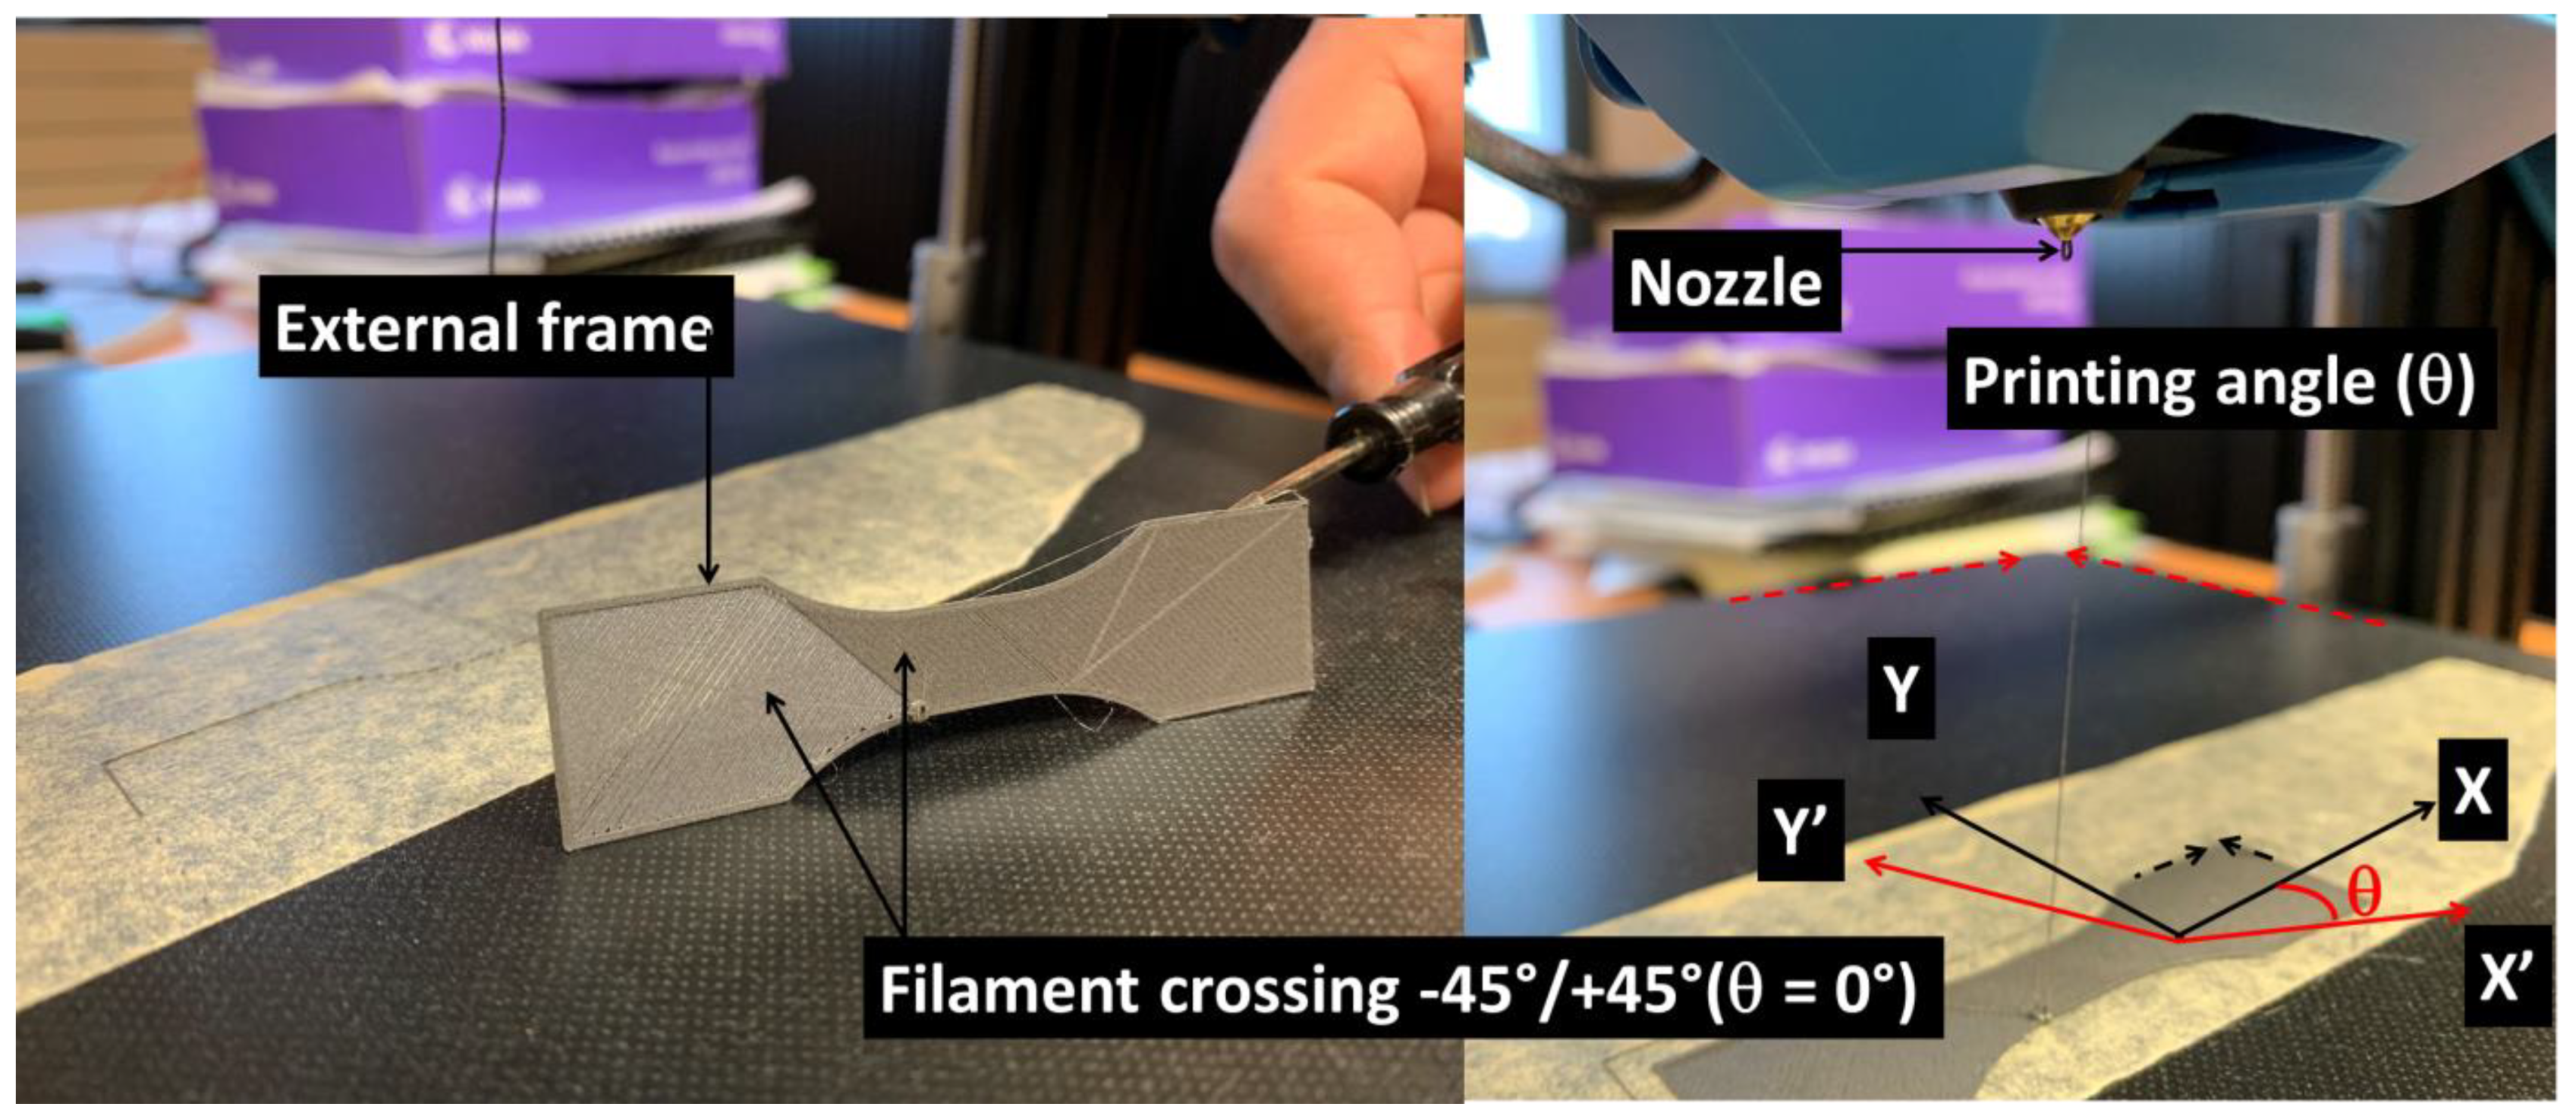
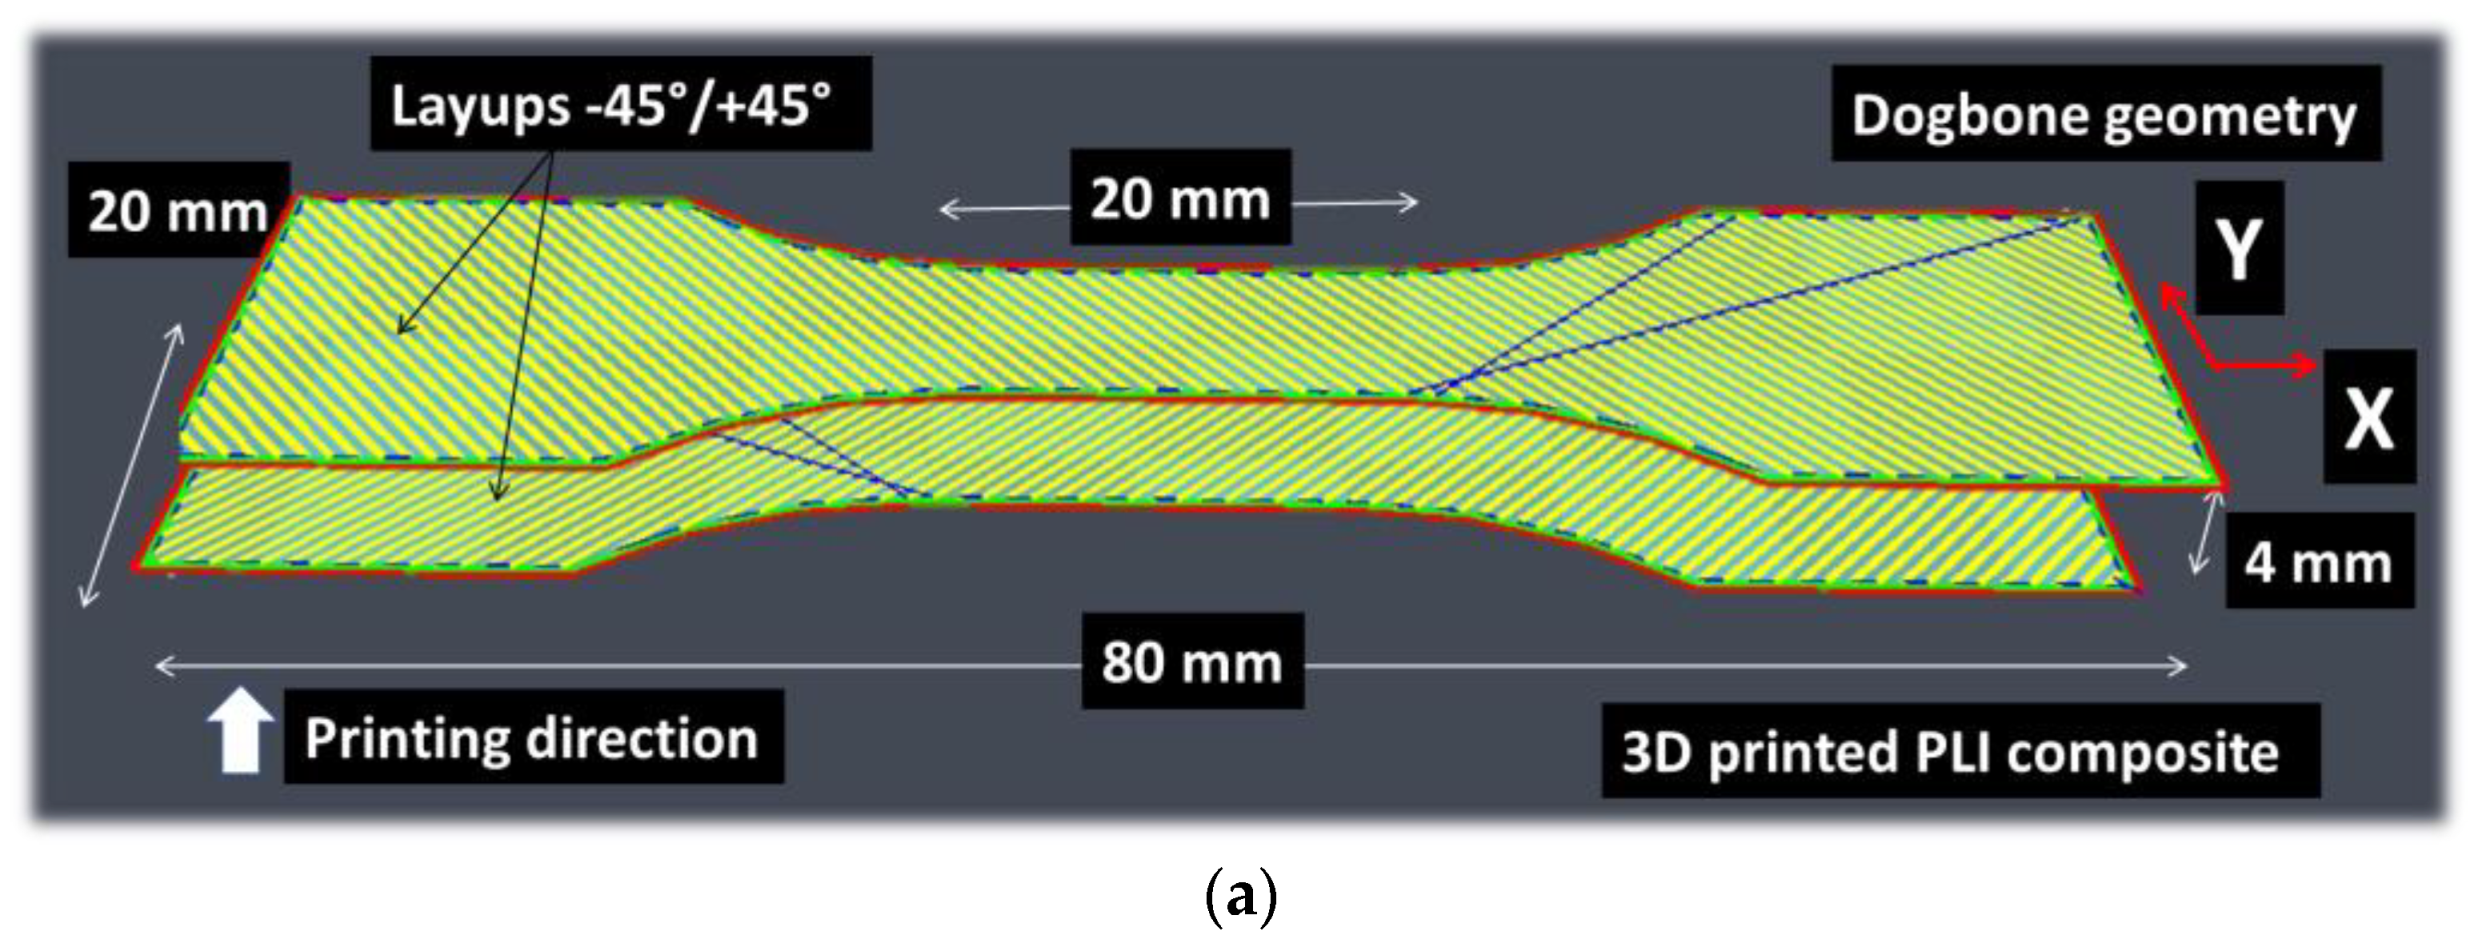
2.1. Process and Materials

The filament employed as feedstock material for FFF is a 1.75 mm diameter PLA modified with rustable magnetic iron, sourced from the Protopasta company (Vancouver, WA, USA). This PLA matrix is reinforced by ferromagnetic metal powder with a maximum particle size of 0.25 mm, resulting in an overall filament density of 1.85 g/cm3. The PLI filament possesses a melting point of 155 °C. Optimal printing conditions for this filament involve a temperature exceeding 192 °C, a bed temperature of 60 °C, and a printing speed ranging between 20 and 30 mm/s. The FFF equipment used is a commercial printer named Anycubic 4Max allowing a positioning accuracy of 12.5 µm in X’/Y’ directions and 2.5 µm in the Z direction. Figure 1 shows an overview of the printing process. The tested specimens exhibit a dog-bone-like geometry with dimensions of 80 mm × 20 mm × 4 mm, where the gauge area width is fixed at 10 mm. Specimen geometry adheres to the ISO 527-1/-2 standard [40] for tensile testing (Figure 2). The printing parameters are shown in Table 1.
The other parameters include a retraction speed of 60 mm/s, retraction distance of 45 mm, shell thickness of 1.2 mm, no bottom/top thickness, travel speed of 60 mm/s, 100% flow rate (i.e., the amount of extruded material is multiplied by the flow rate), no support, and no platform adhesion raft. All slicing processes are conducted using Cura 3.6 from Ultimaker (Utrecht, The Netherlands).
The processing parameter under investigation in this study is the printing angle (θ), a parameter that enables the adjustment of layups and is presumed to govern the mechanical anisotropy of the printed structures (Figure 1). Four θ levels are chosen: 0°, 15°, 30°, and 45°, corresponding to layups of −45°/+45°, −30°/+60°, −15°/+75°, and 0°/+90°, respectively [41]. A total of 4 (replicates) × 4 (printing conditions) = 16 samples are printed, and for each condition (typically, 4 replicates per condition). According to the scheme shown in Figure 1, the printing direction is perpendicular to the length and width of the sample. This means that there is no need for support material to be added as the curvature of the dog-bone geometry lies within the plane of construction. In addition, the printing angle illustrated in Figure 1 affects the microstructural arrangement within the plane of construction, as it reflects the mismatch between the main axis attached to the building platform with respect to those attached to the printed sample. The printing of all samples is carried out sequentially by printing a first series of angles from 0° to 45° then repeating the sequence for the other replicates. The randomisation of the trials is not a key concern based on a previous study that demonstrates the reproducibility of the 3D printing results even for a small number of replicates [41]. This statement is, however, bounded by proper maintenance of the printing equipment.
These layups allow the control of the filament arrangement within the raster, as shown in Figure 1. The combination of the in-plane filament arrangement (printing angle) and the laying effect (layer height) tunes both the process-induced porosity and the anisotropic mechanical performance of PLI material.

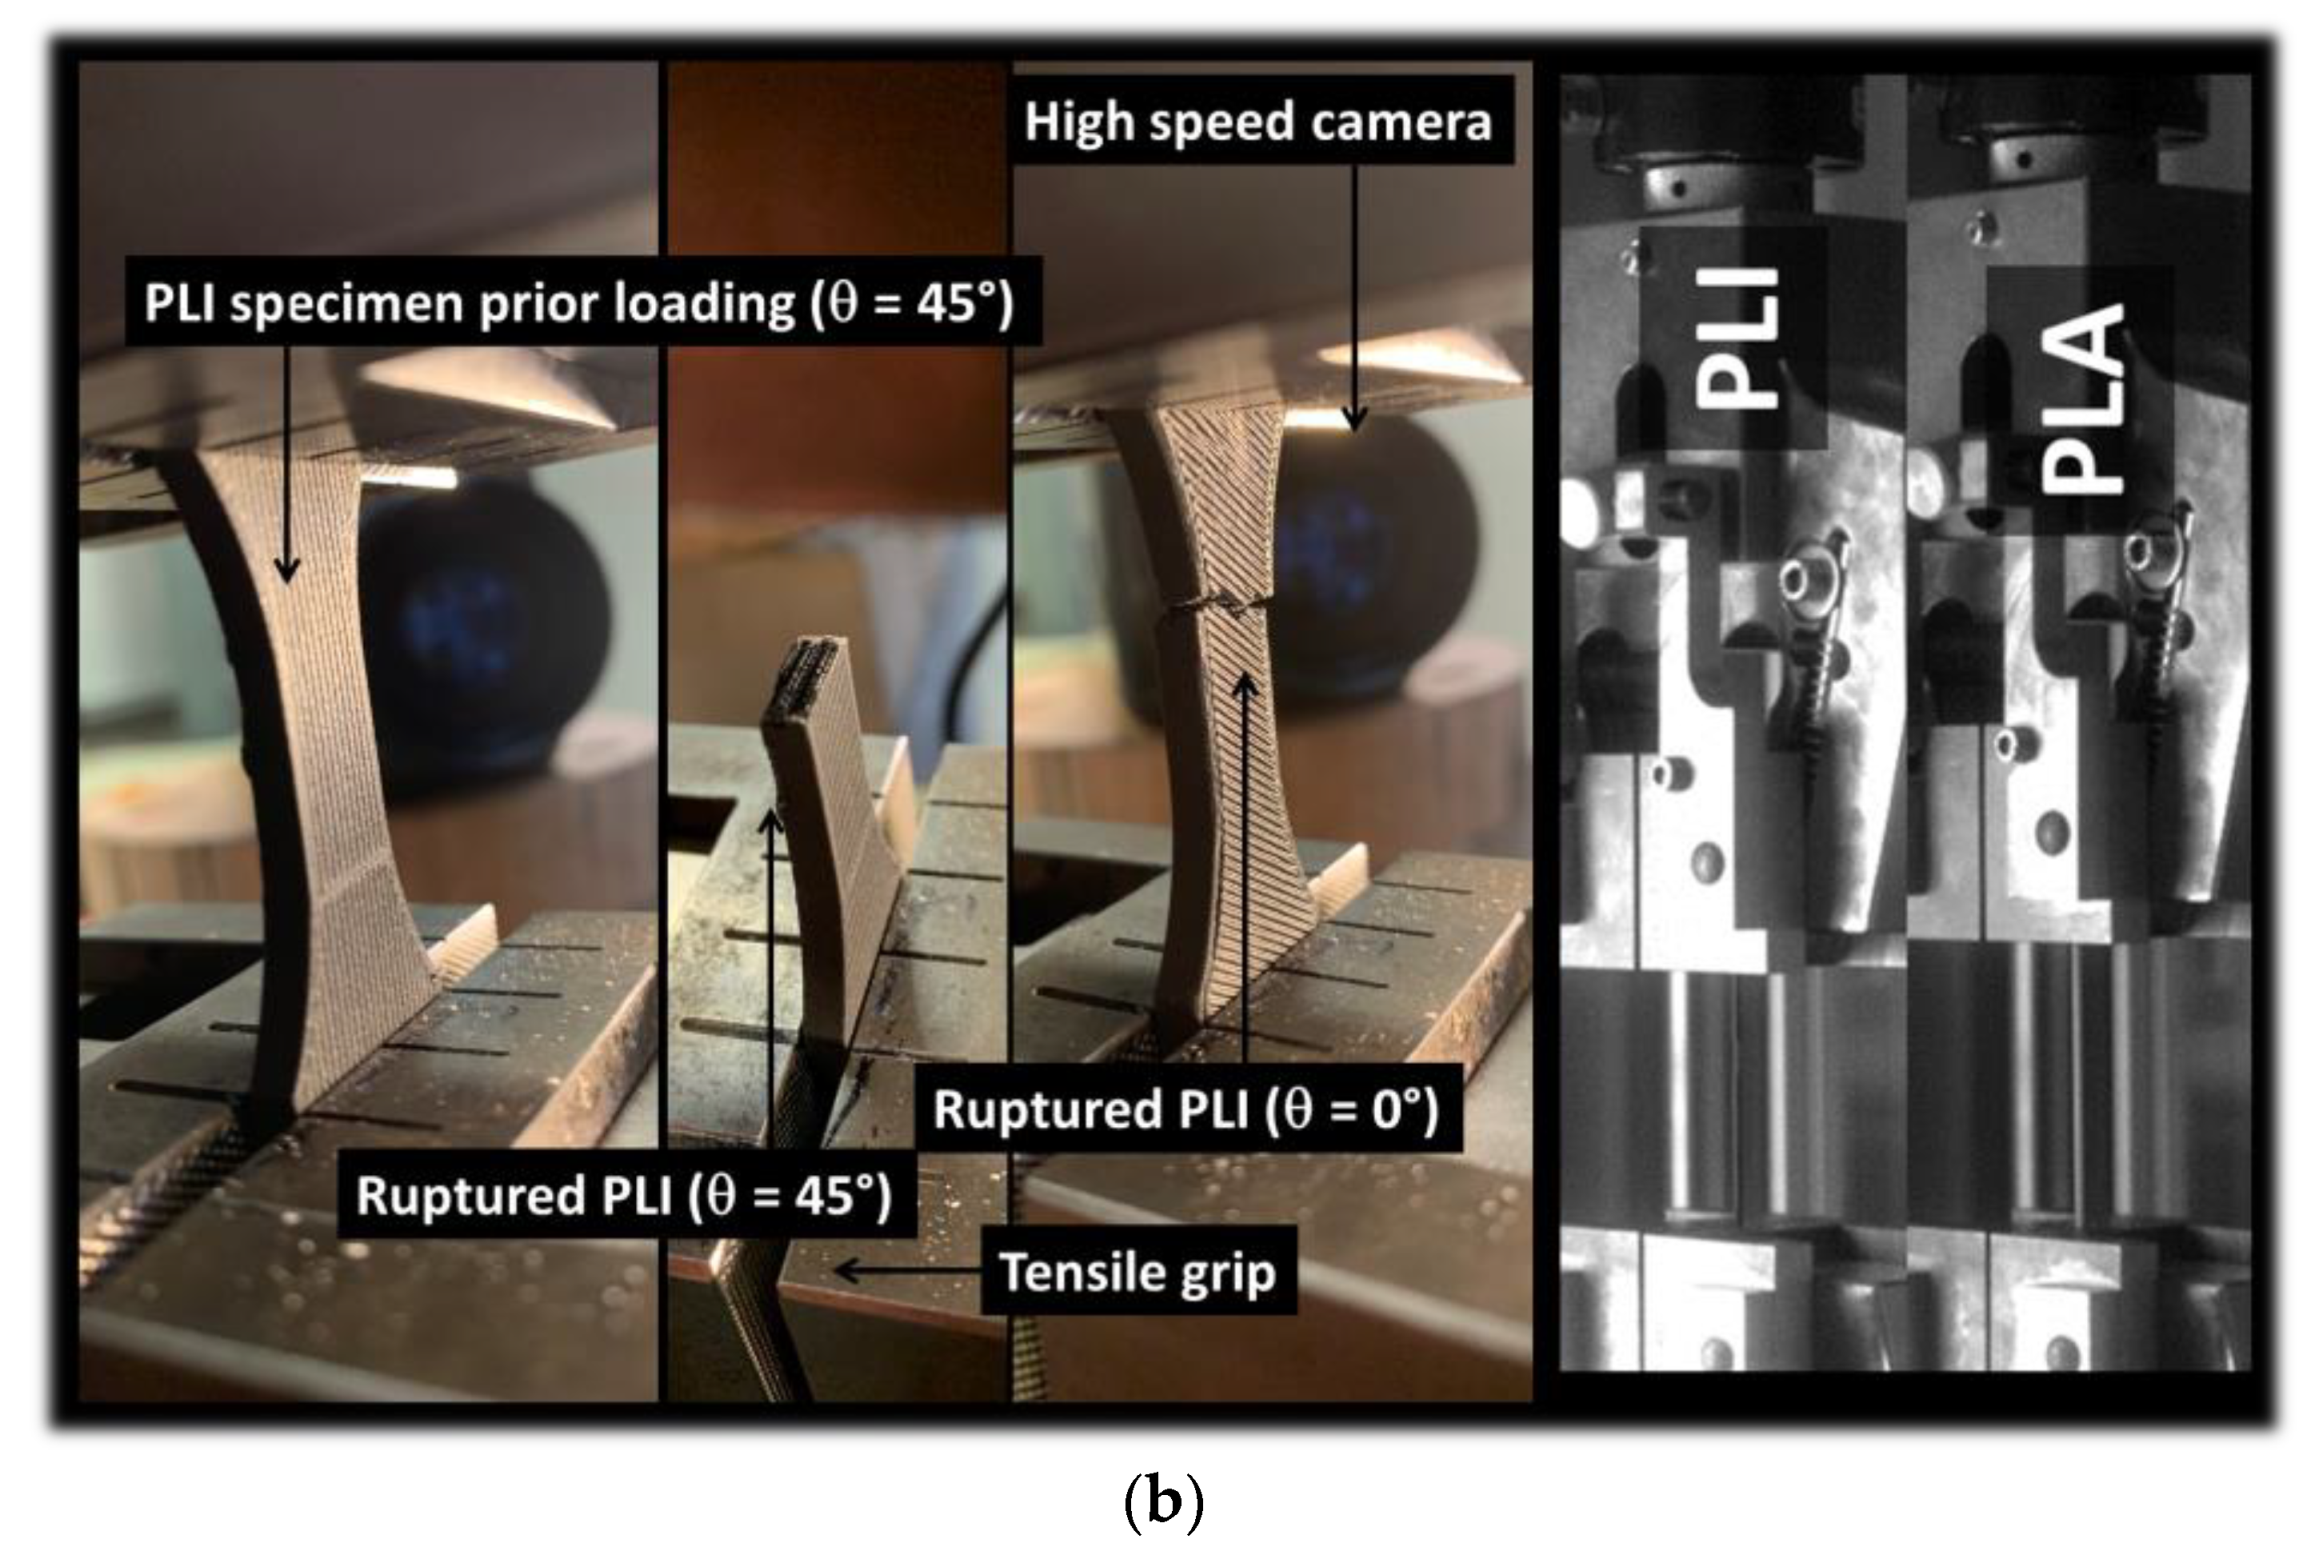
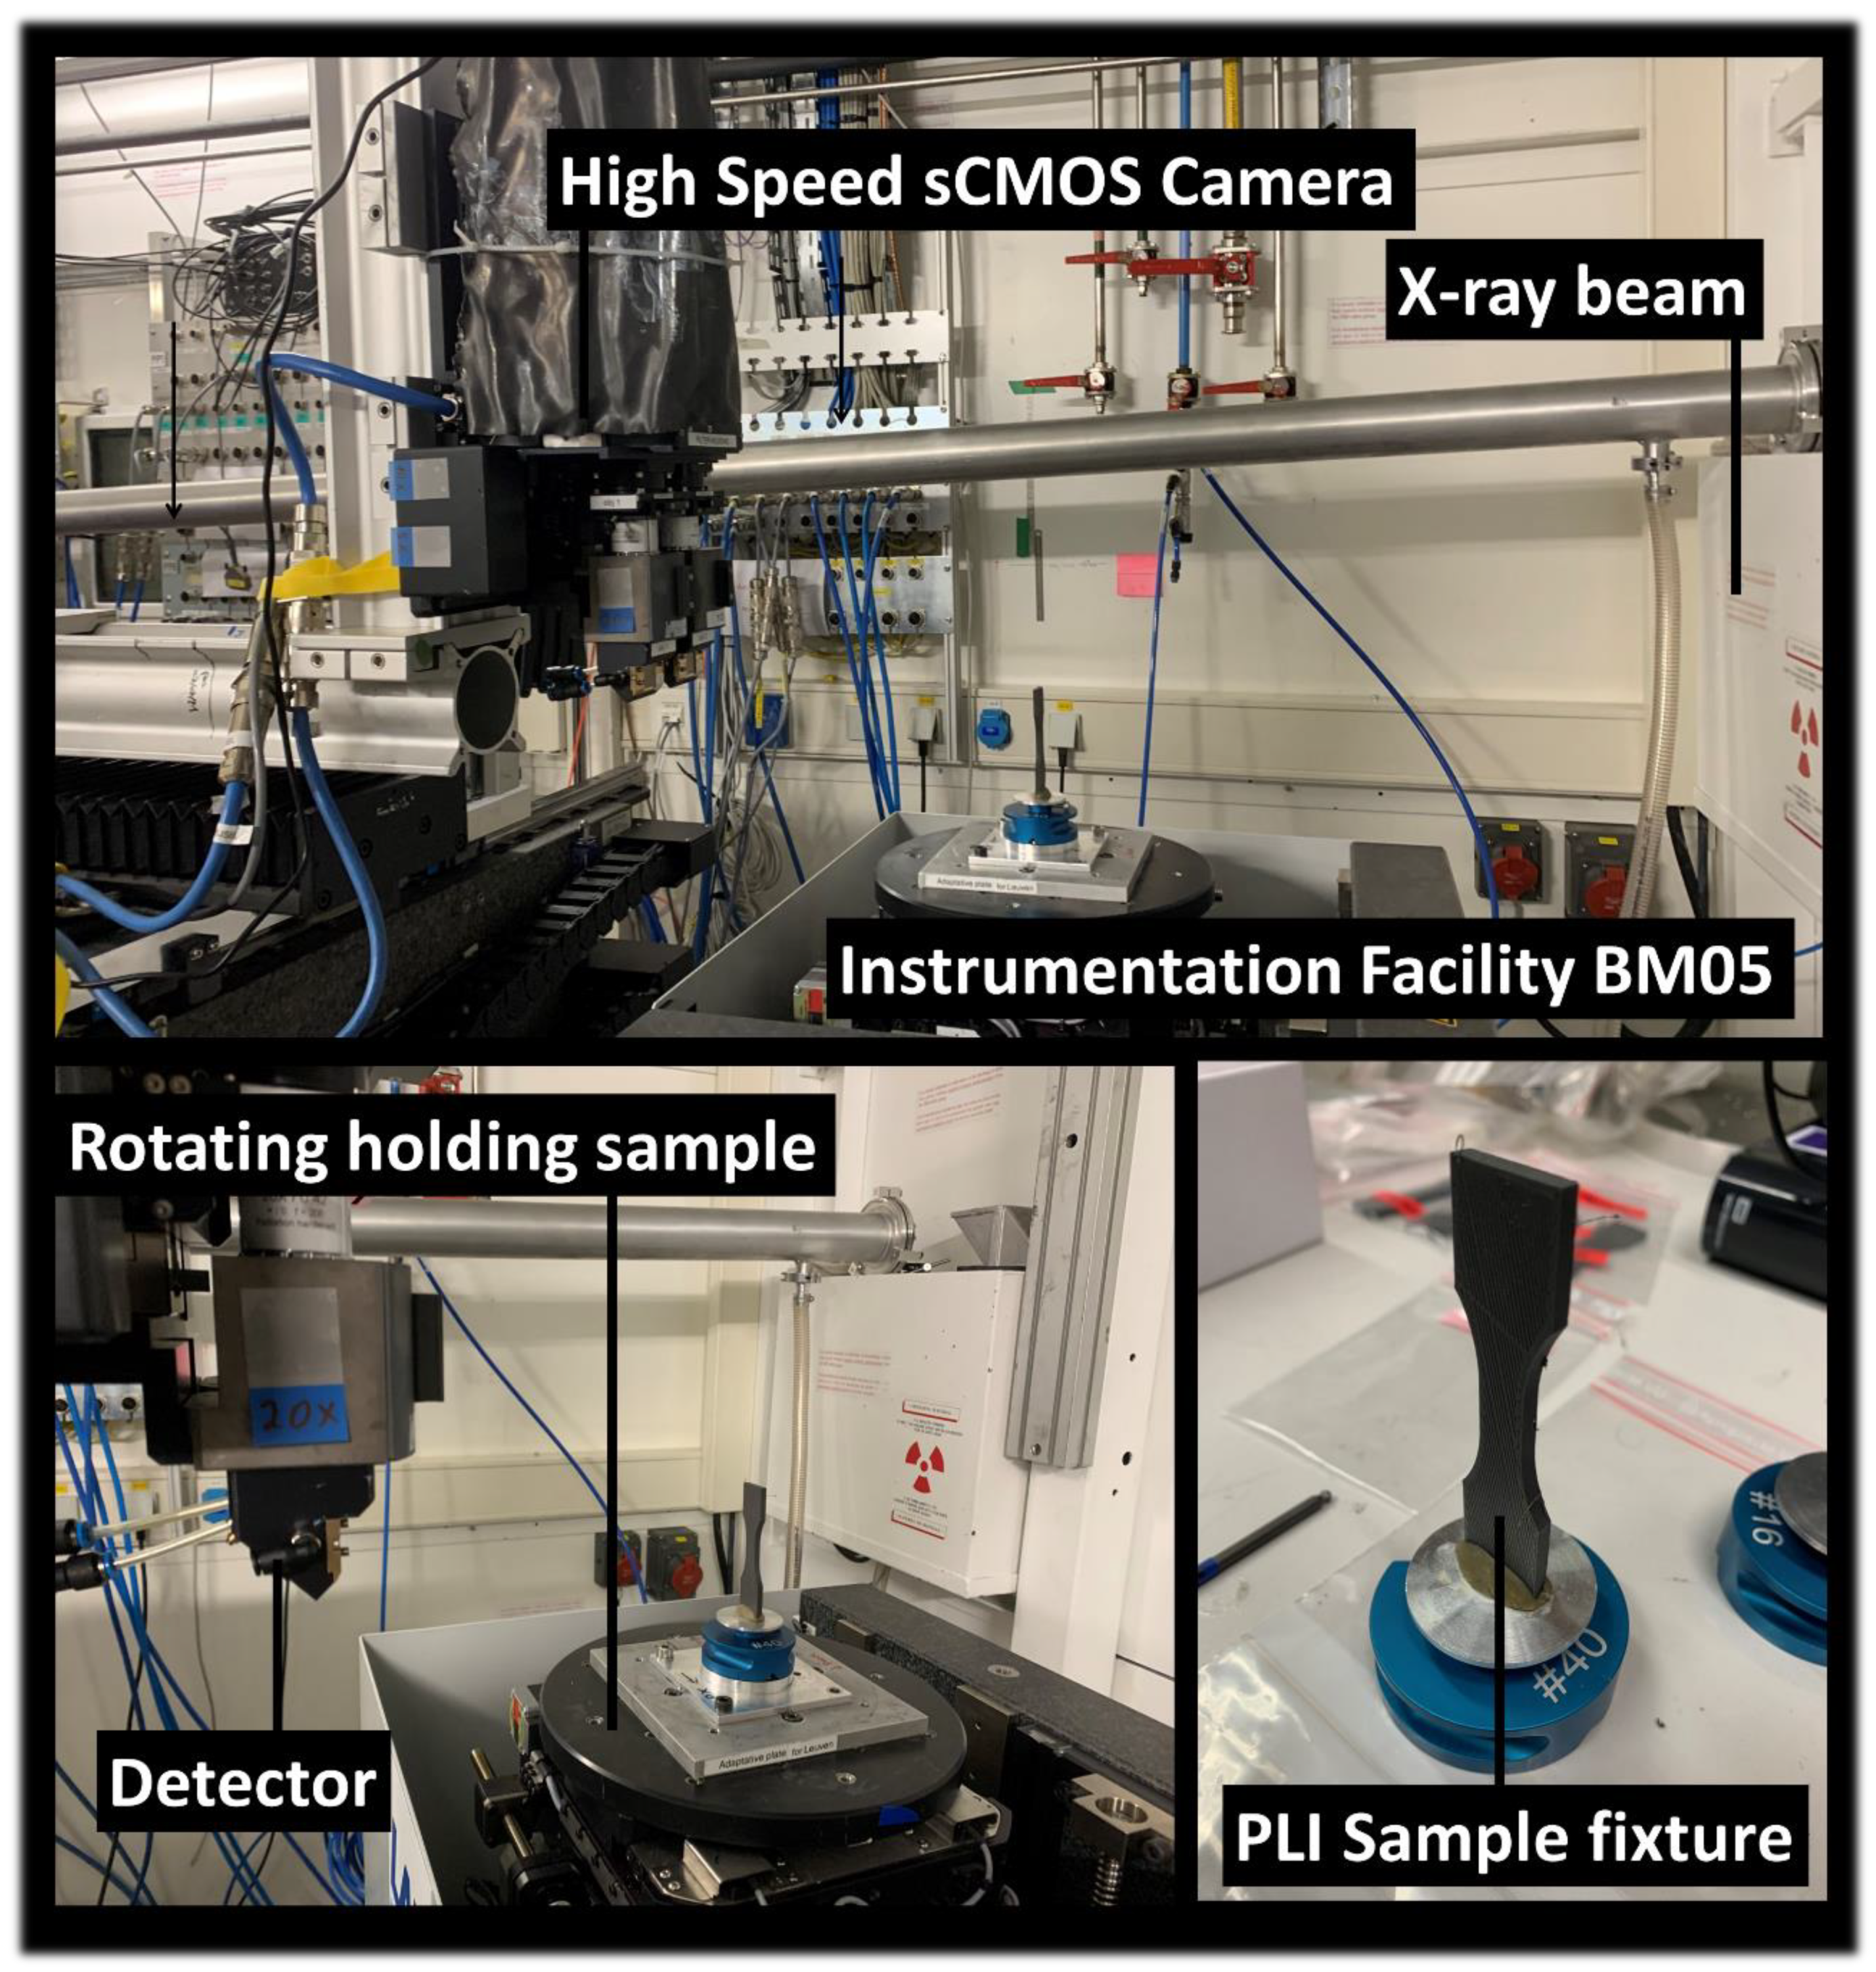
2.2. Characterisation Techniques

All tensile specimens are tested using a Zwick/Roell universal machine equipped with a 10 kN load cell (Figure 2b). Tensile loading is carried out until material failure at a displacement rate of 5 mm/min. Prior to testing, all samples are weighed using a precision scale, and the main dimensions are measured to derive the volume. These data are used to correlate the density f D   of all samples to the printing conditions.
The tensile testing is performed on replicates in sequential order according to the replicate number. The average engineering constants are determined, including tensile strength, Young’s modulus, and elongation at break. The same testing setup is used to evaluate the tensile performance of as-received PLI filaments. Also, the same universal loading machine is used for these experiments to avoid errors related to the use of different machines (Figure 2b). The as-received PLI filaments can be fairly approximated as cylinders with a diameter of 1.75 mm and a gauge length of 45 mm.
Deformation sequences are observed using an optical high-speed camera from Photonline (Phantom V7.3). The entire loading sequence is recorded in full frame (800 × 600 pixels) at a moderate speed of 50 fps (frames per second).
The X-ray microtomography technique is utilized for three-dimensional imaging of PLA/iron samples at the ESRF beamline BM5 in Grenoble, France (Figure 3). The acquisition parameters include a 97 kV energy, a 360° scan range, a 1396 mm working distance, 5000 radiographic images, 101 reference images, 100 dark images, 2048 × 800 pixels detector resolution, 0.015 s count time, 0.0015 s latency time, and a 3.04 µm voxel size. A back-projection reconstruction algorithm is employed to obtain the tomograms, with Paganin filtering added for optimal phase retrieval of phase-contrast images. To maintain sufficient resolution at the specified voxel size, two successive acquisitions along the height of the sample are conducted, doubling the acquired volume. The typical tomogram resolution is thus 3856 × 3856 × 1600 voxels, covering an acquired volume of 11.72 × 11.72 × 4.86 mm3. In order to compare the ultrastructure of the filament prior to and after printing, the same image acquisition technique is used for the characterisation of the as-received PLA–iron filament. A sample of about 4.5 mm in height is acquired under a voxel size of 3.2 µm. Image analysis is performed using ImageJ software V1.54from NIH (Bethesda, MD, USA), encompassing image processing tasks such as brightness calibration, conversion to 256 grey-level images, segmentation, 3D rotation, and filtering using opening and closing operators. Additionally, background elimination, phase content determination, anisotropy assessment, and size distribution calculations are part of the image analysis process.

3. Results

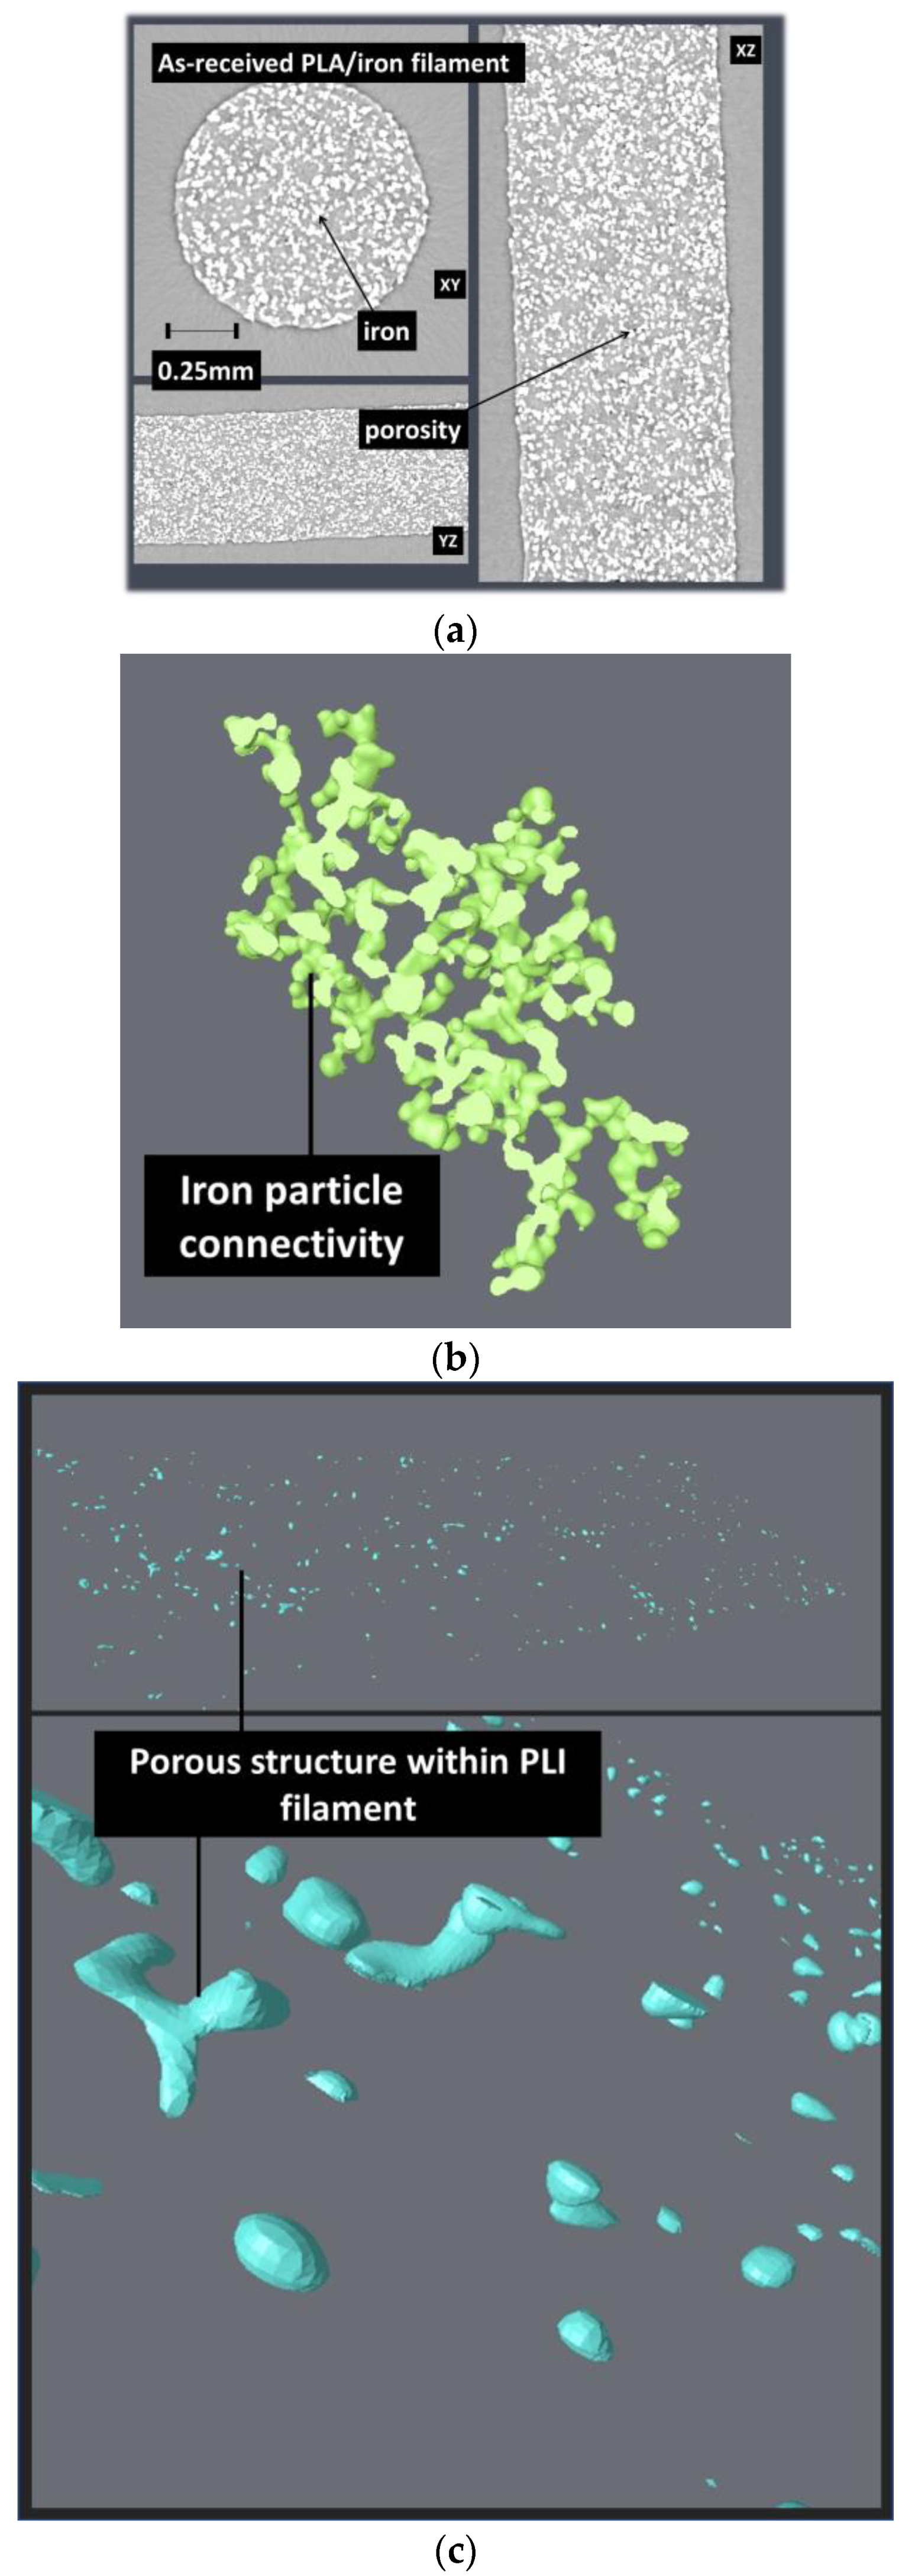
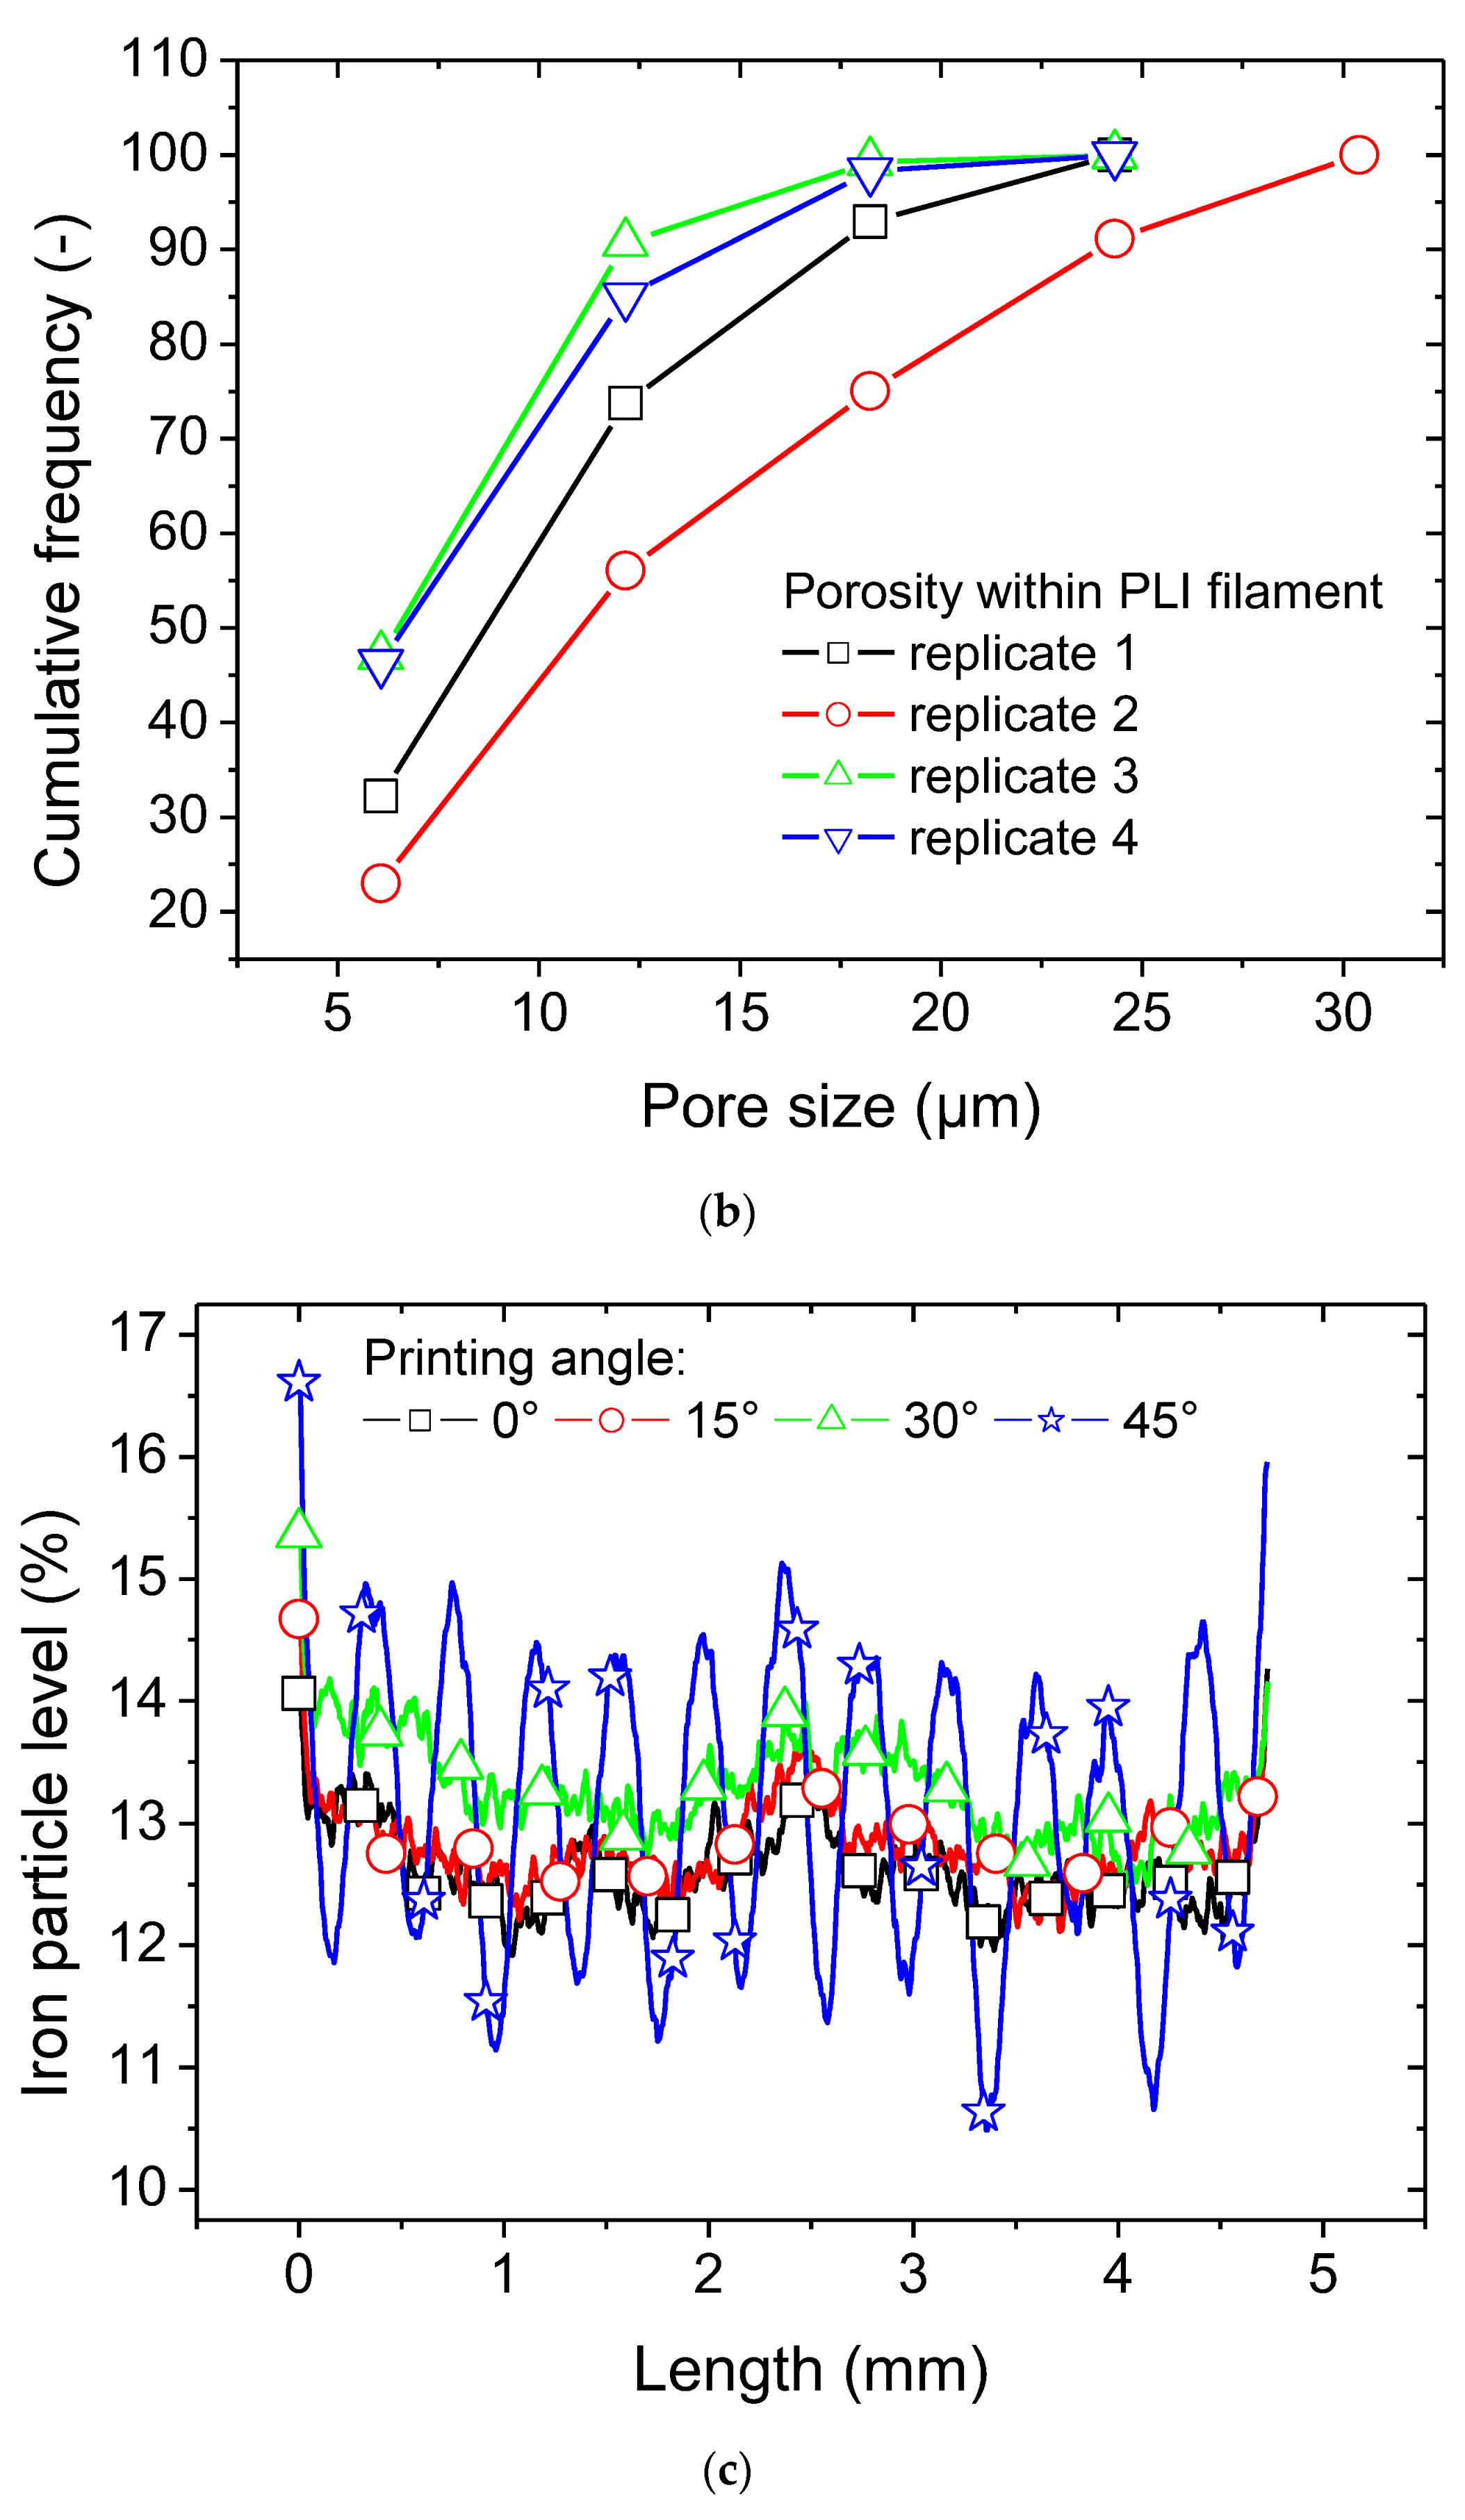
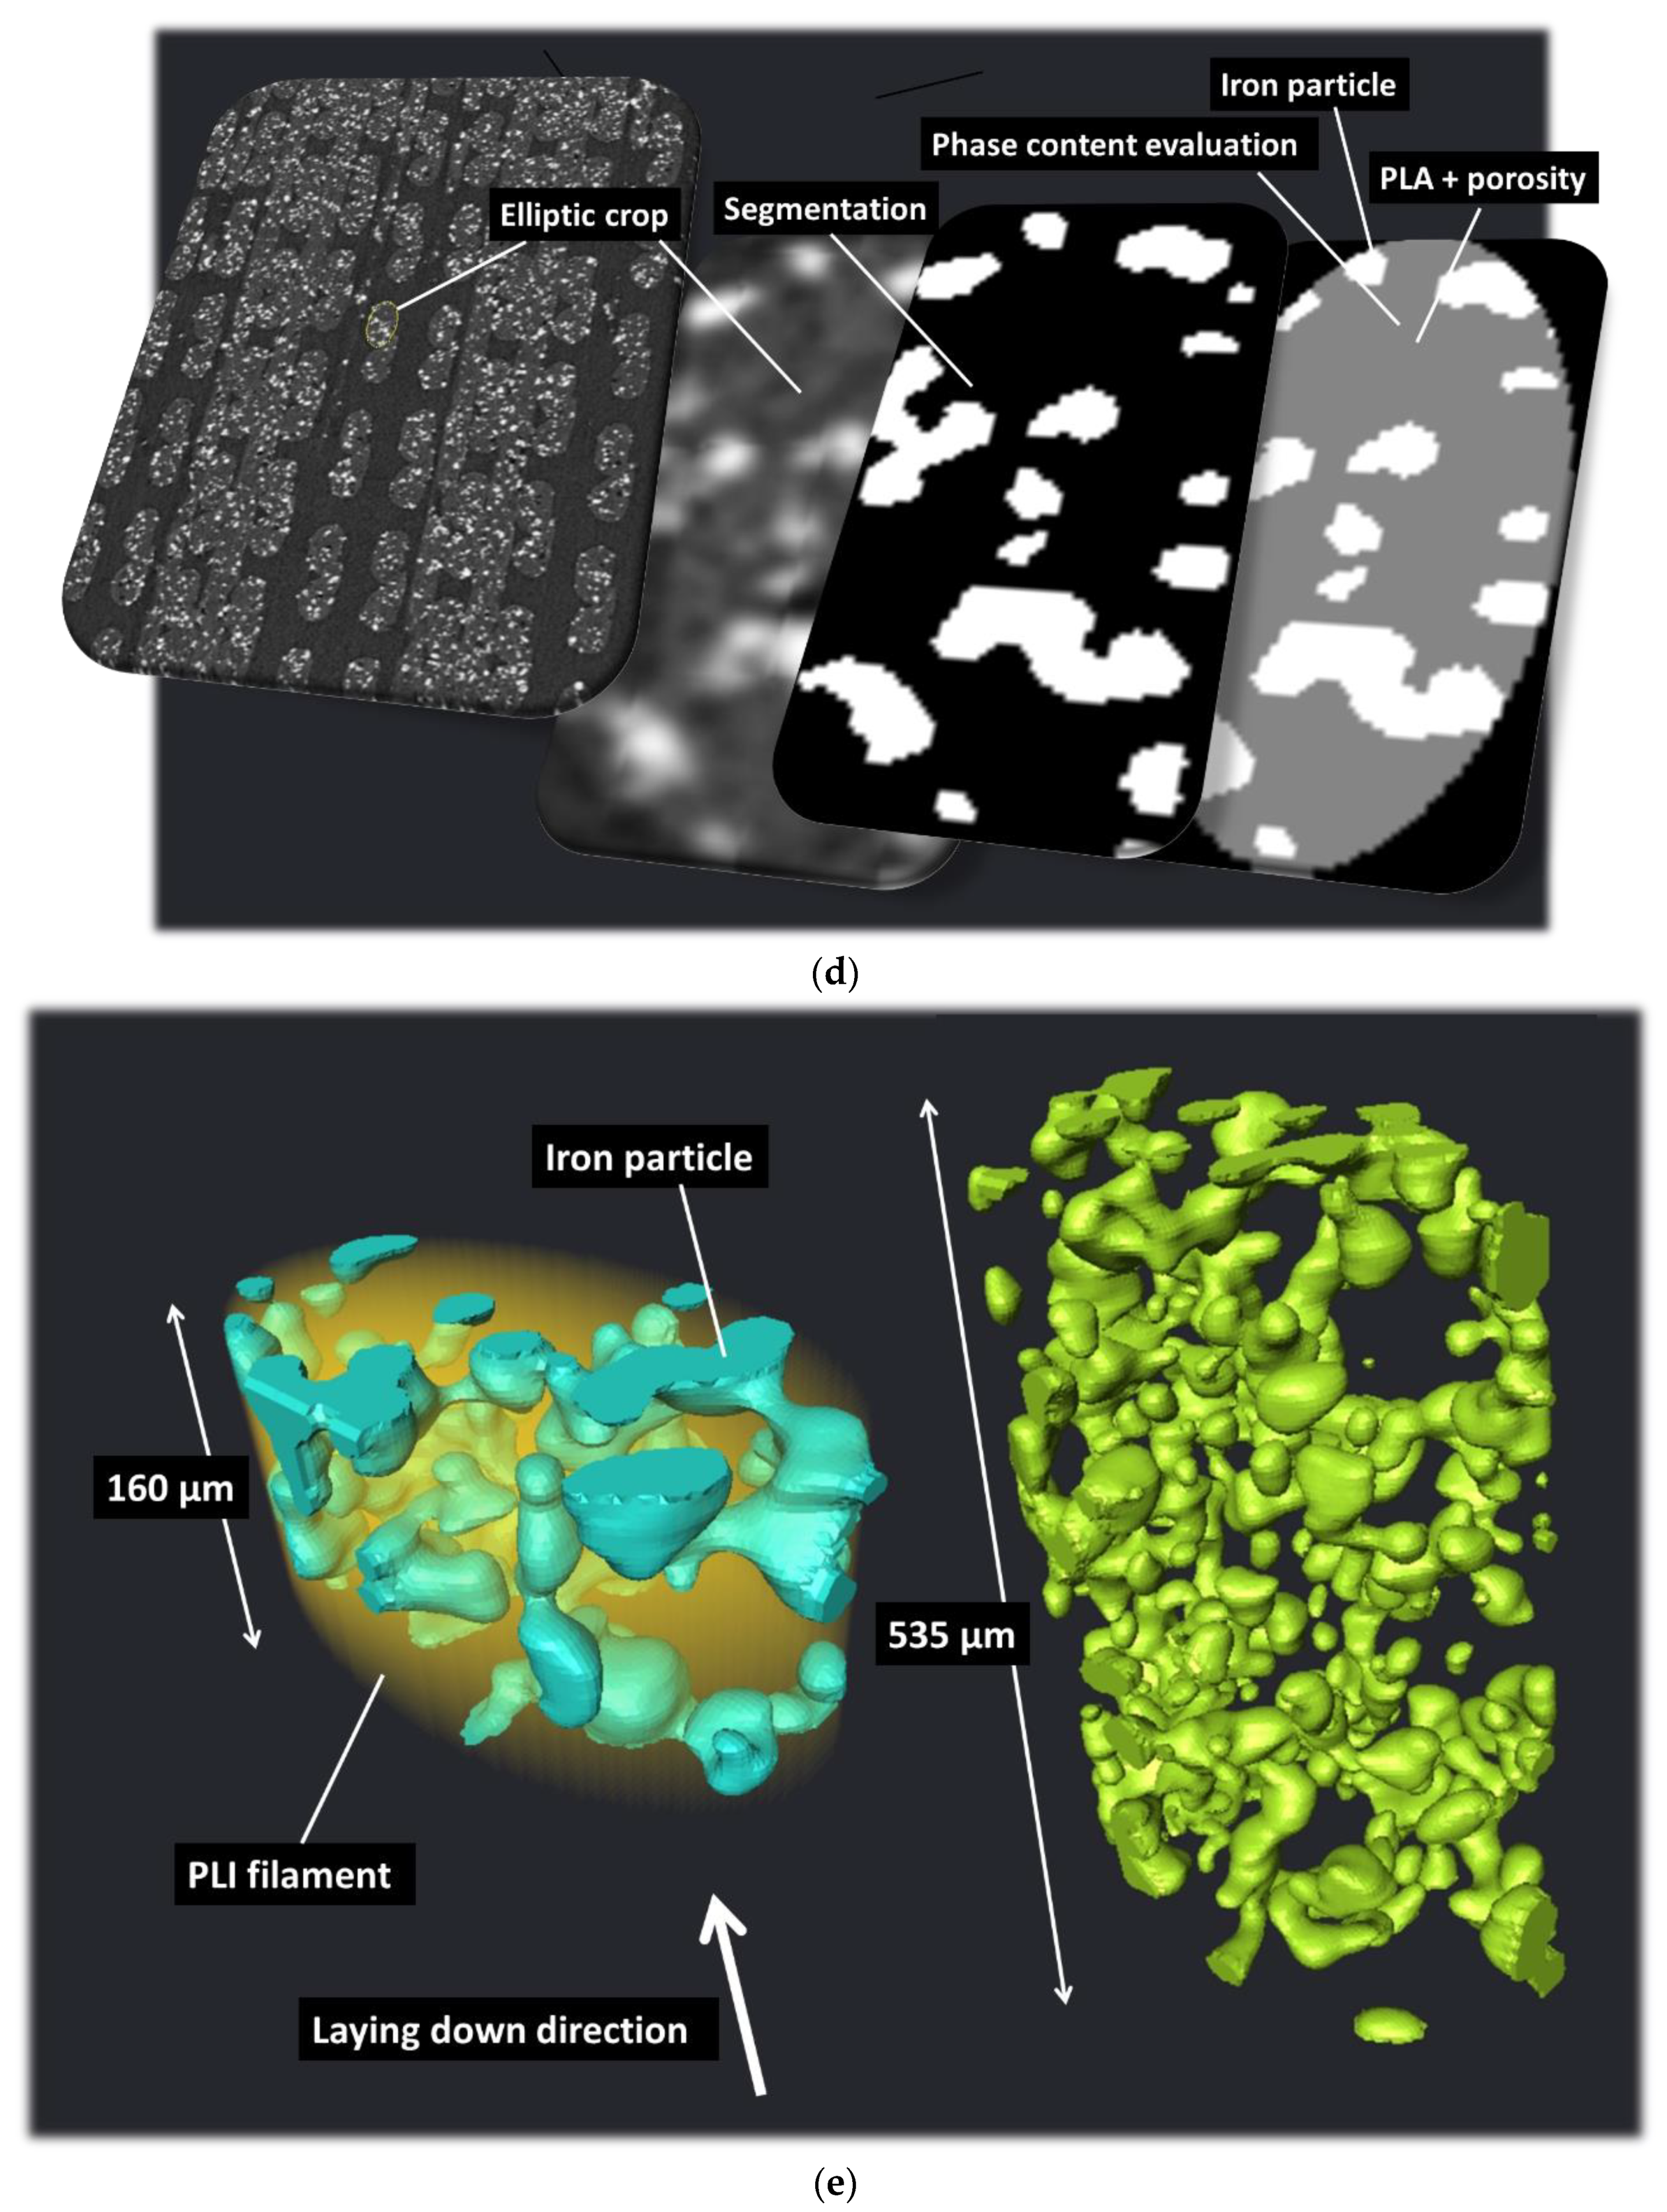
3.1. Ultrastructure of As-Received PLI Filament

Figure 4 shows cross-sectional views of the as-received filament prior to the printing process. These cross sections highlight the presence of a large number of small iron particles as well as minor porosity that is generated by the extrusion process of the filament. In addition, a surface roughness can be depicted through the XZ and YZ views, which is mainly triggered by the presence of the second-phase particles. Applying a grey-level threshold of 96 allows the isolation of the surface roughness from the rest of the sample. The average roughness measured for the as-received PLI filament is 10 ± 1.9 µm. A closer analysis of the iron phase shows that despite its apparent connectivity, the average volume content is 27 ± 0.3% (Figure 4b). The iron phase connectivity measured as the ratio between the largest connecting feature and the total population of iron particles is close to only 6%.
Figure 4c shows also that the porosity within the filament is small. The average content is 1.14 ± 0.04%. This porosity is genuine to the extrusion process of the filament and has a limited connectivity.

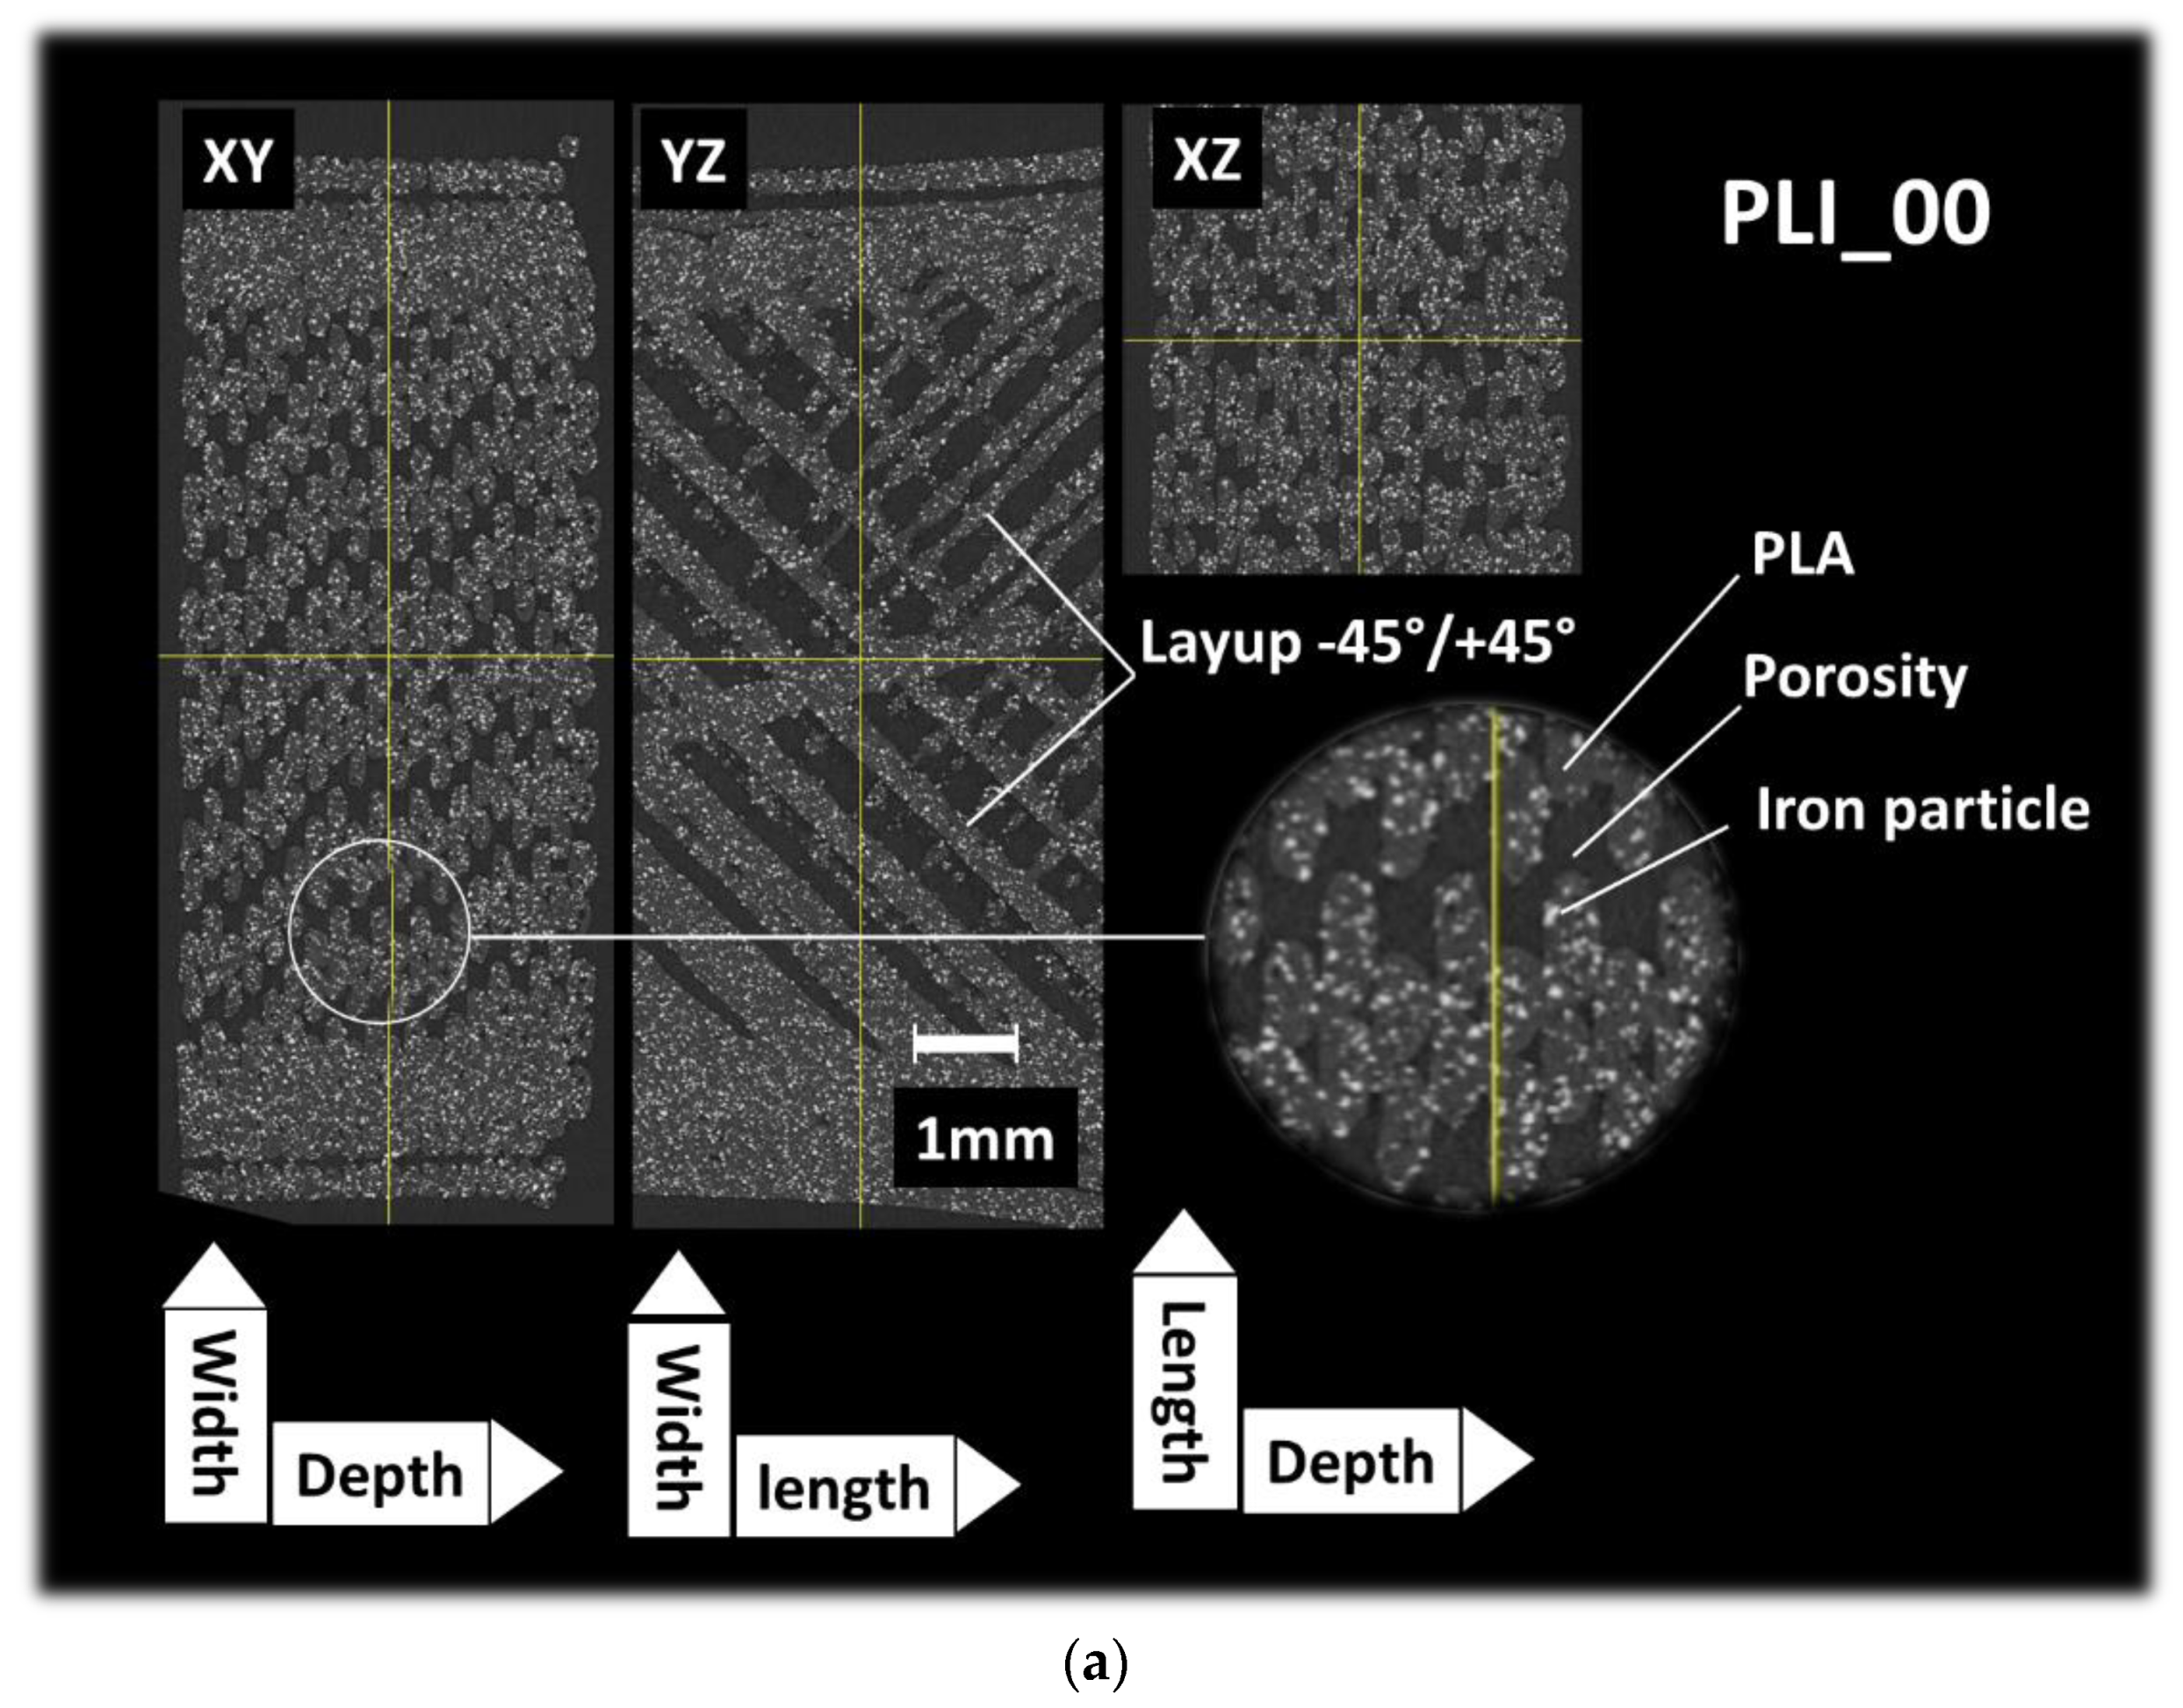
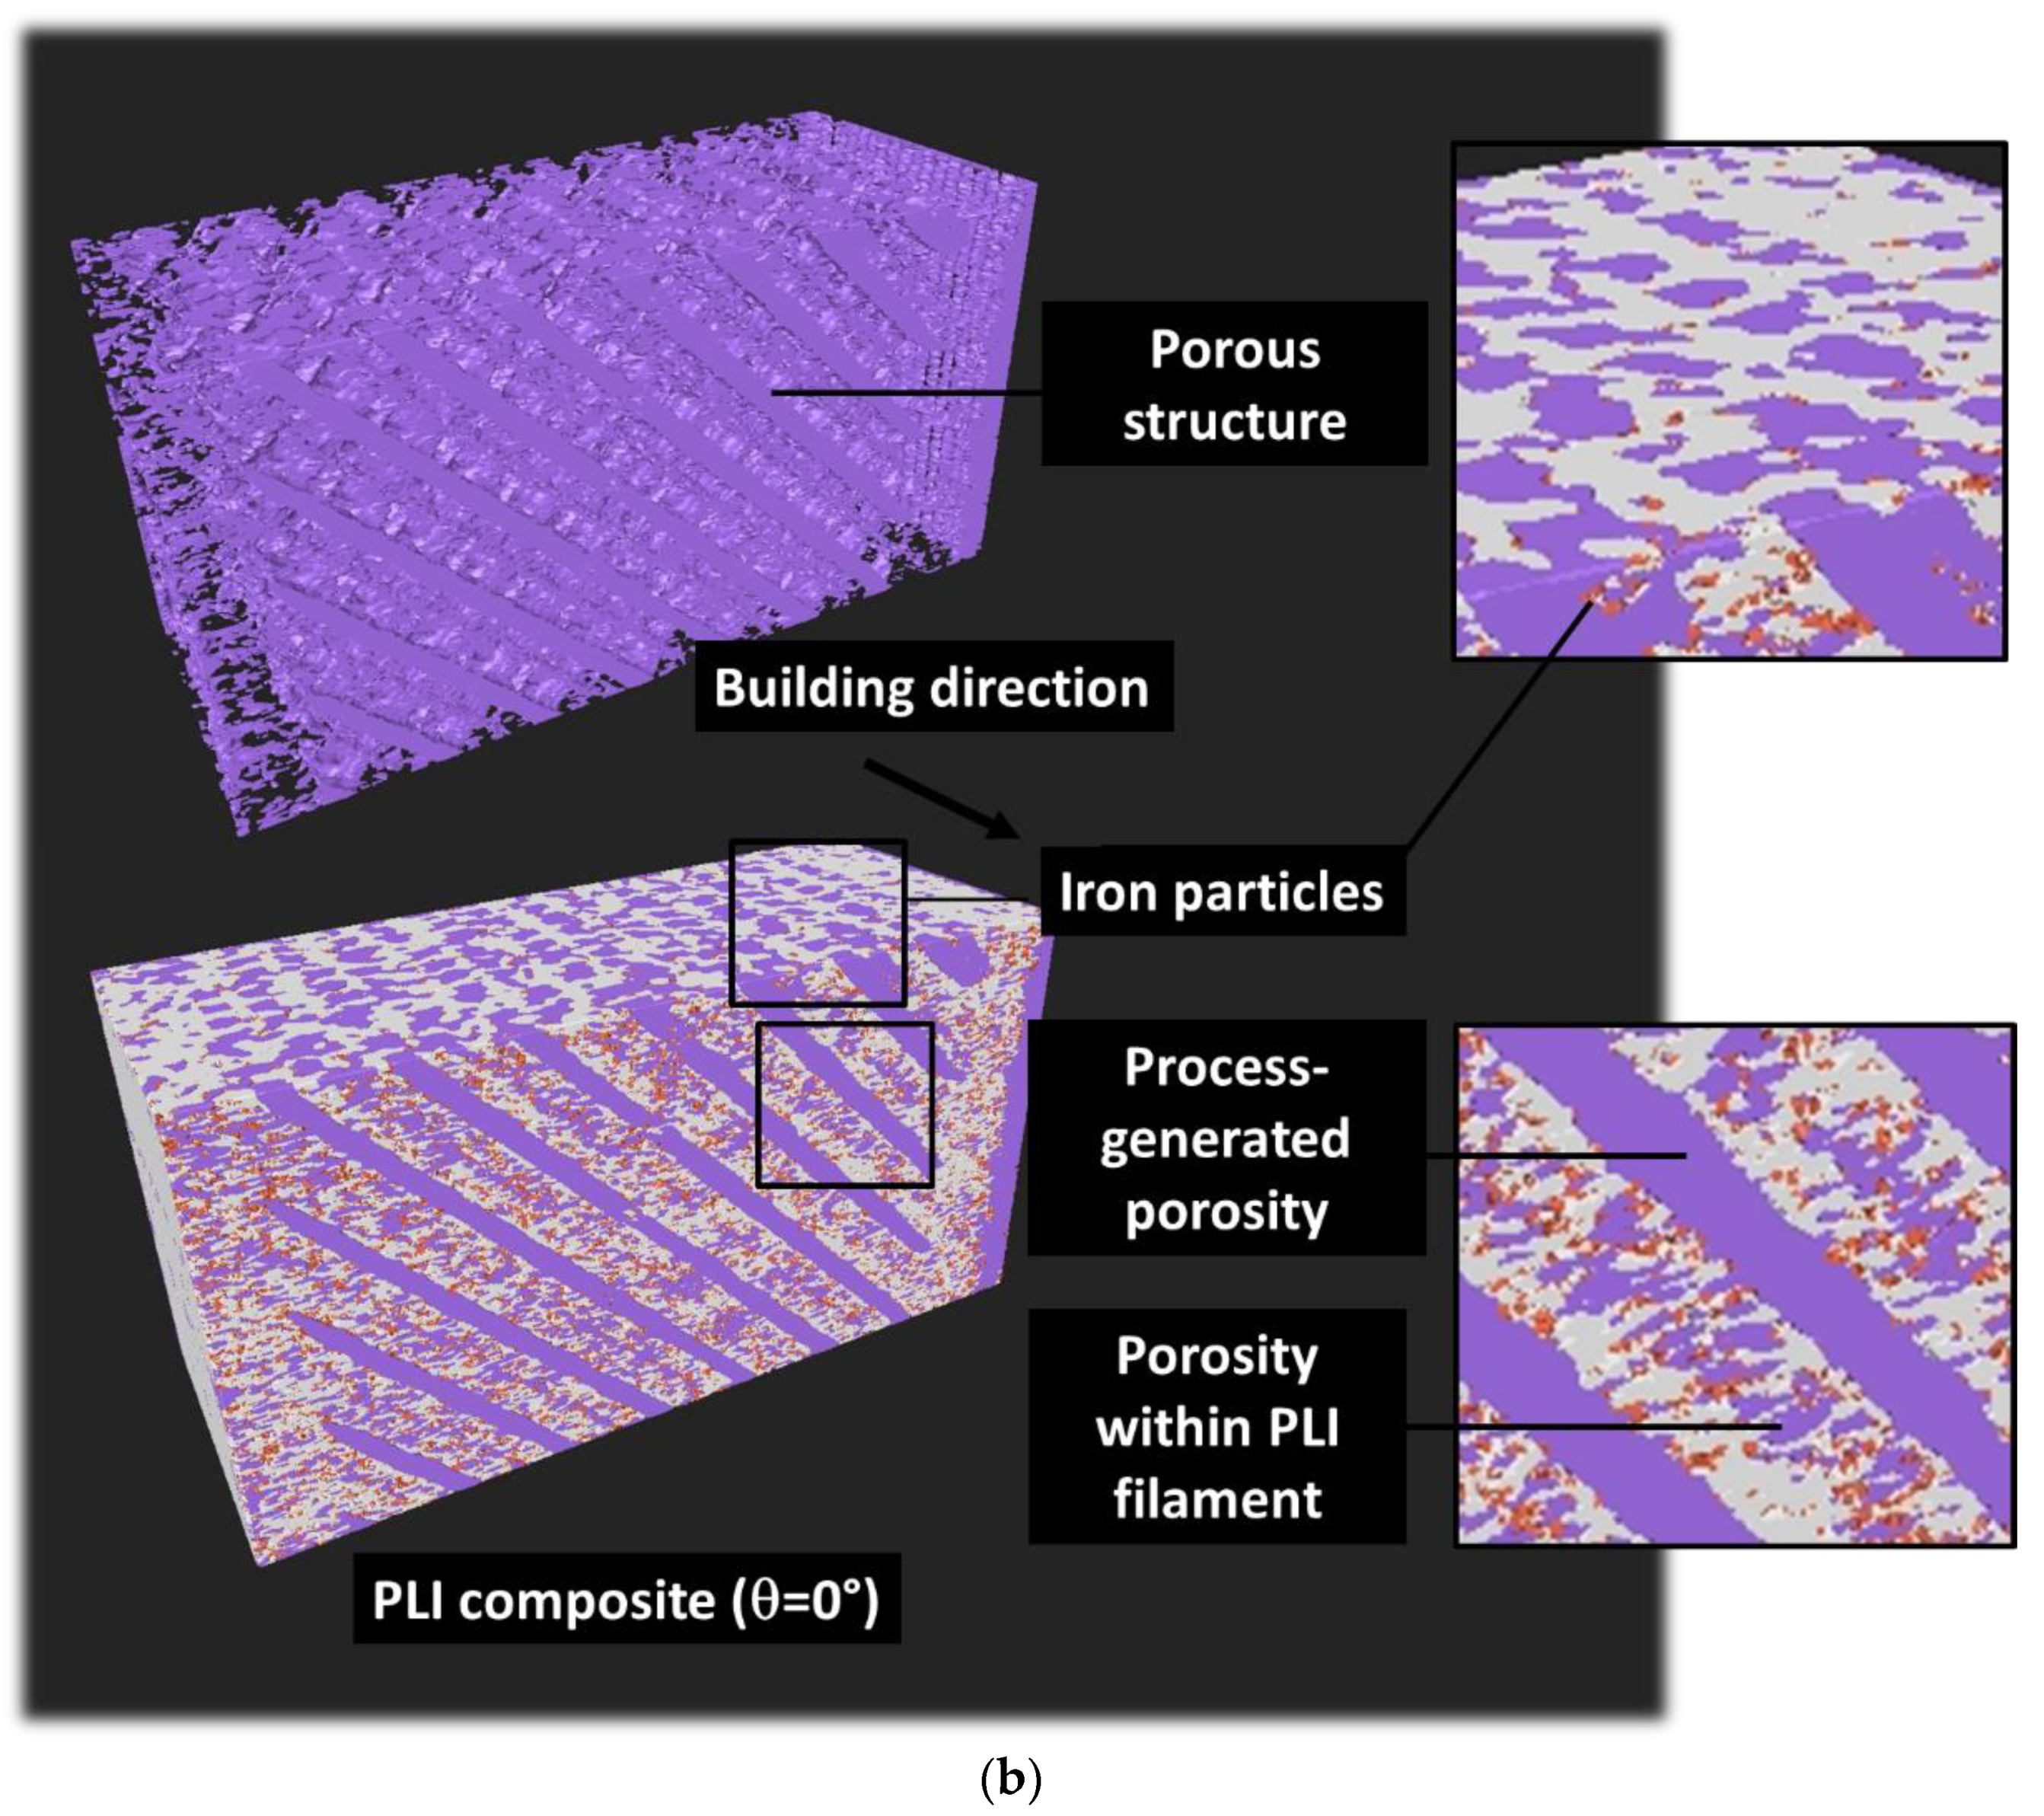
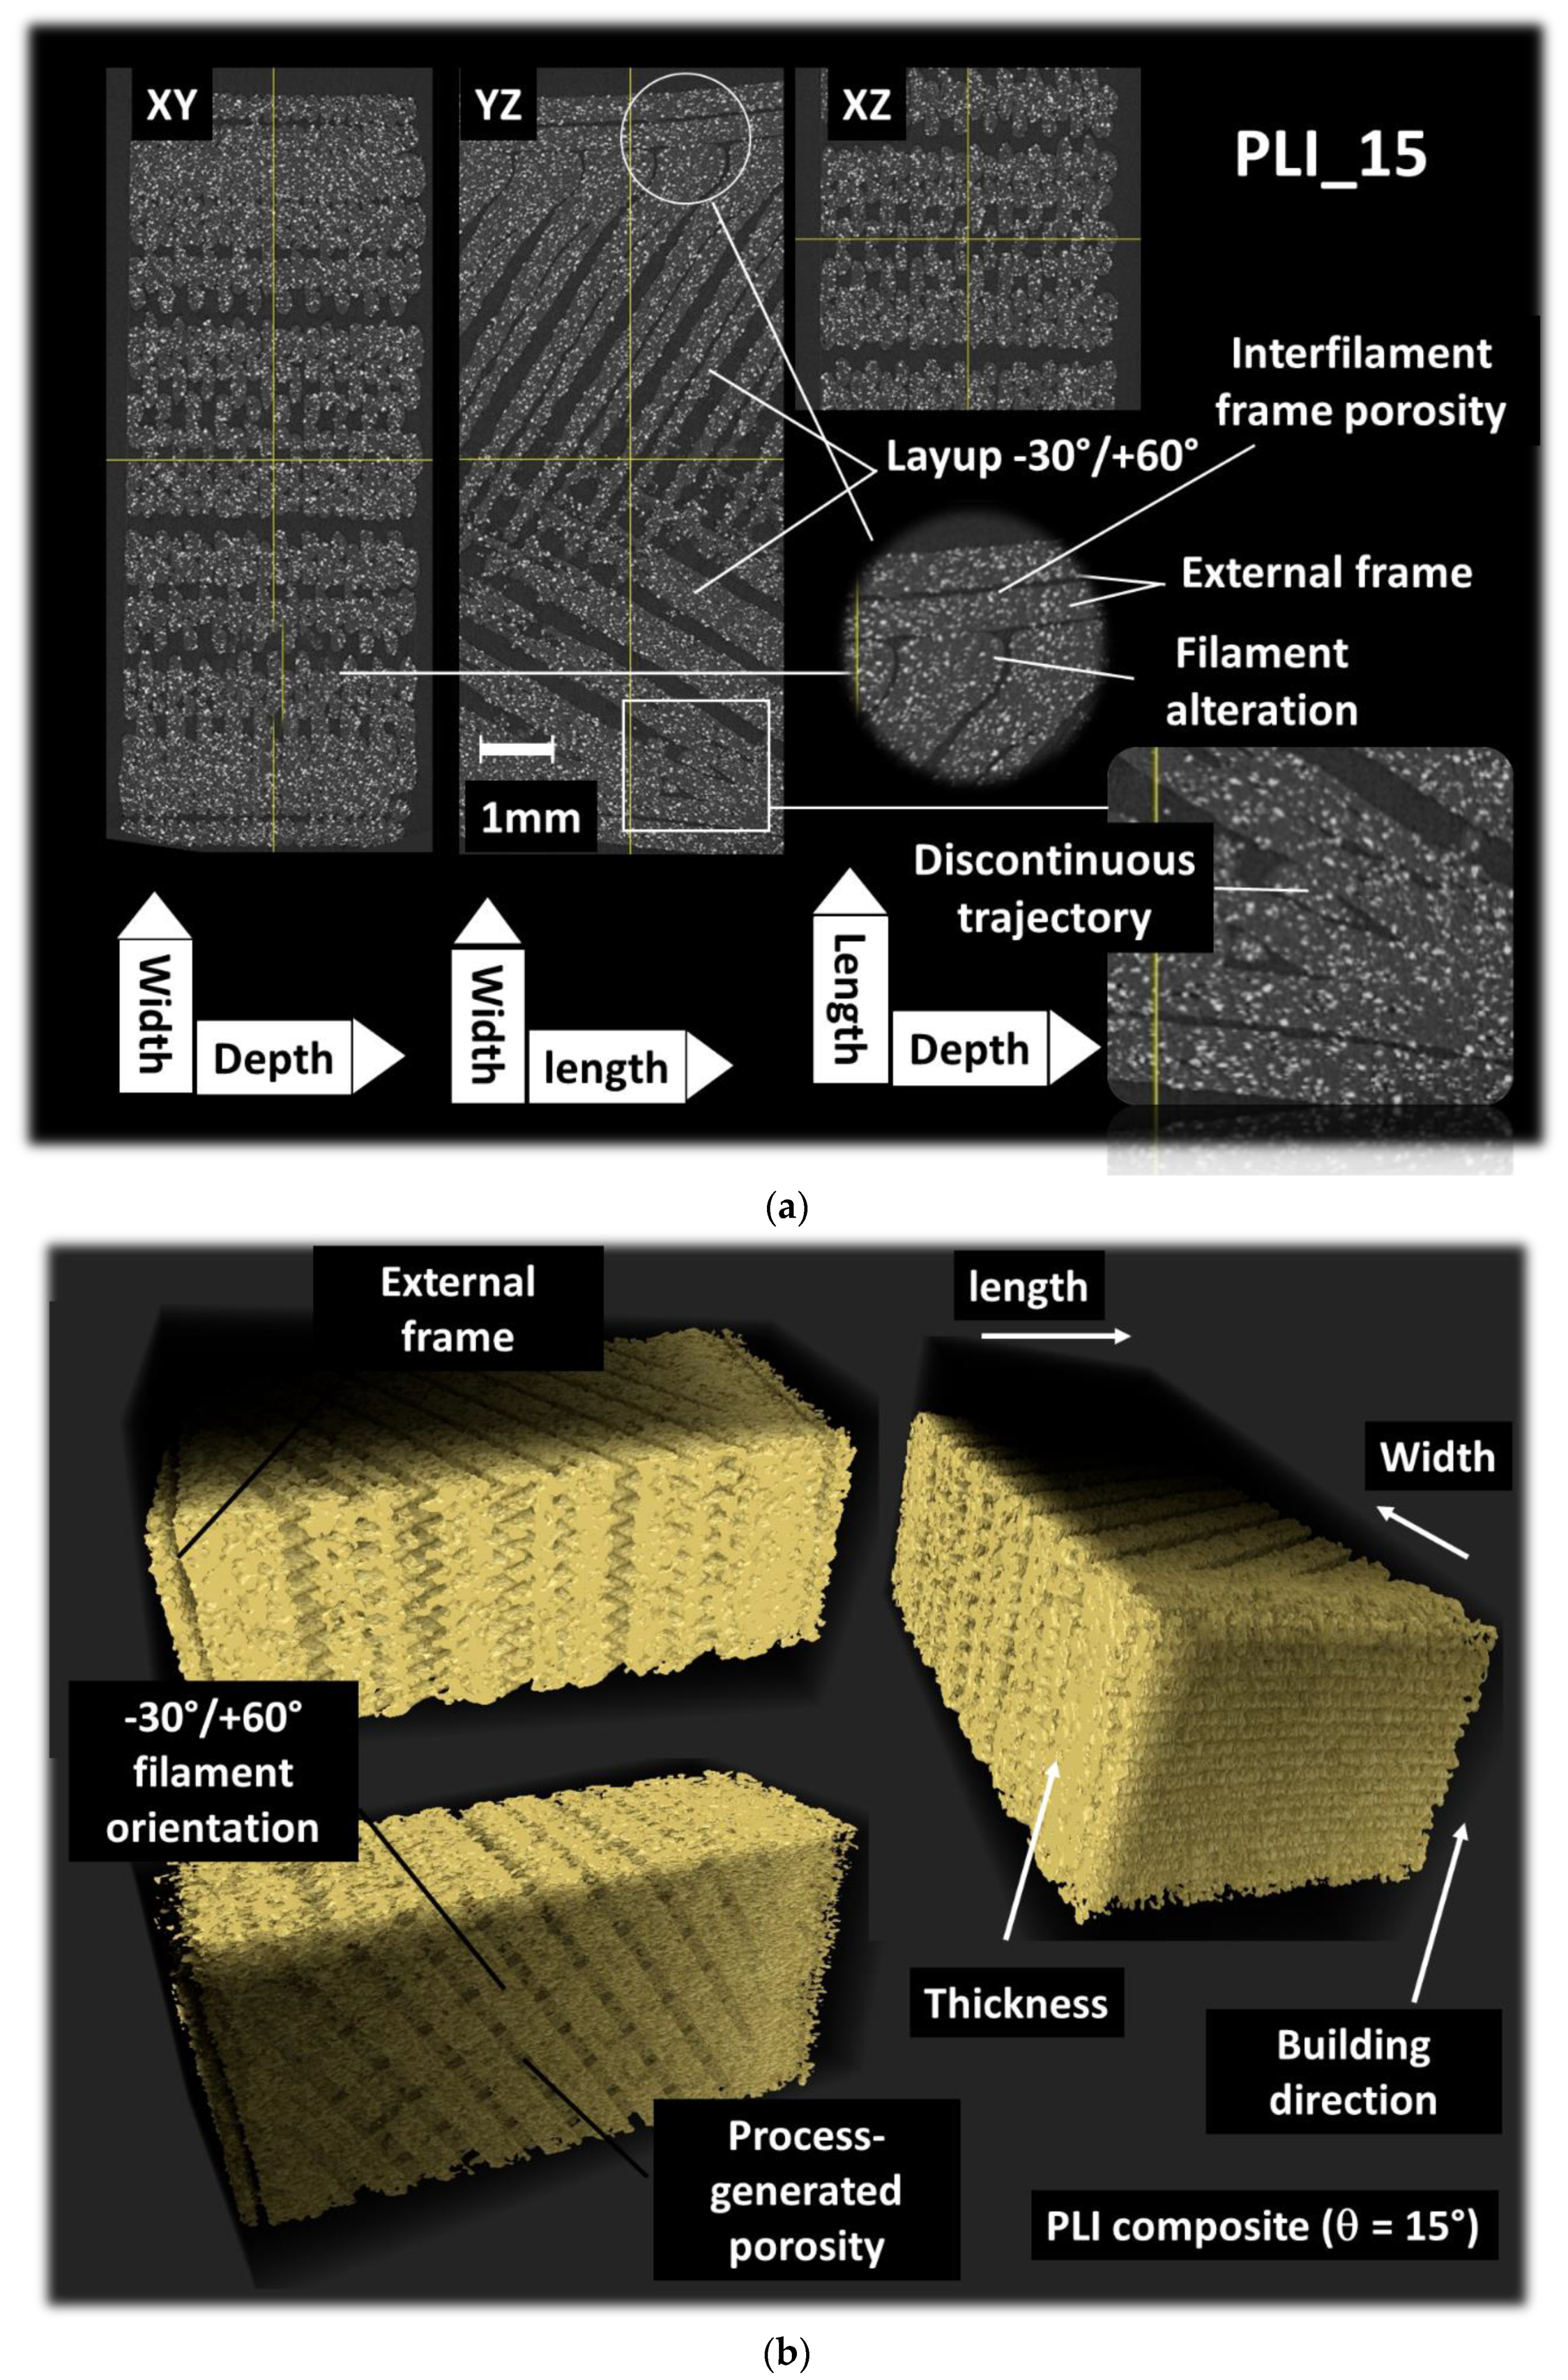
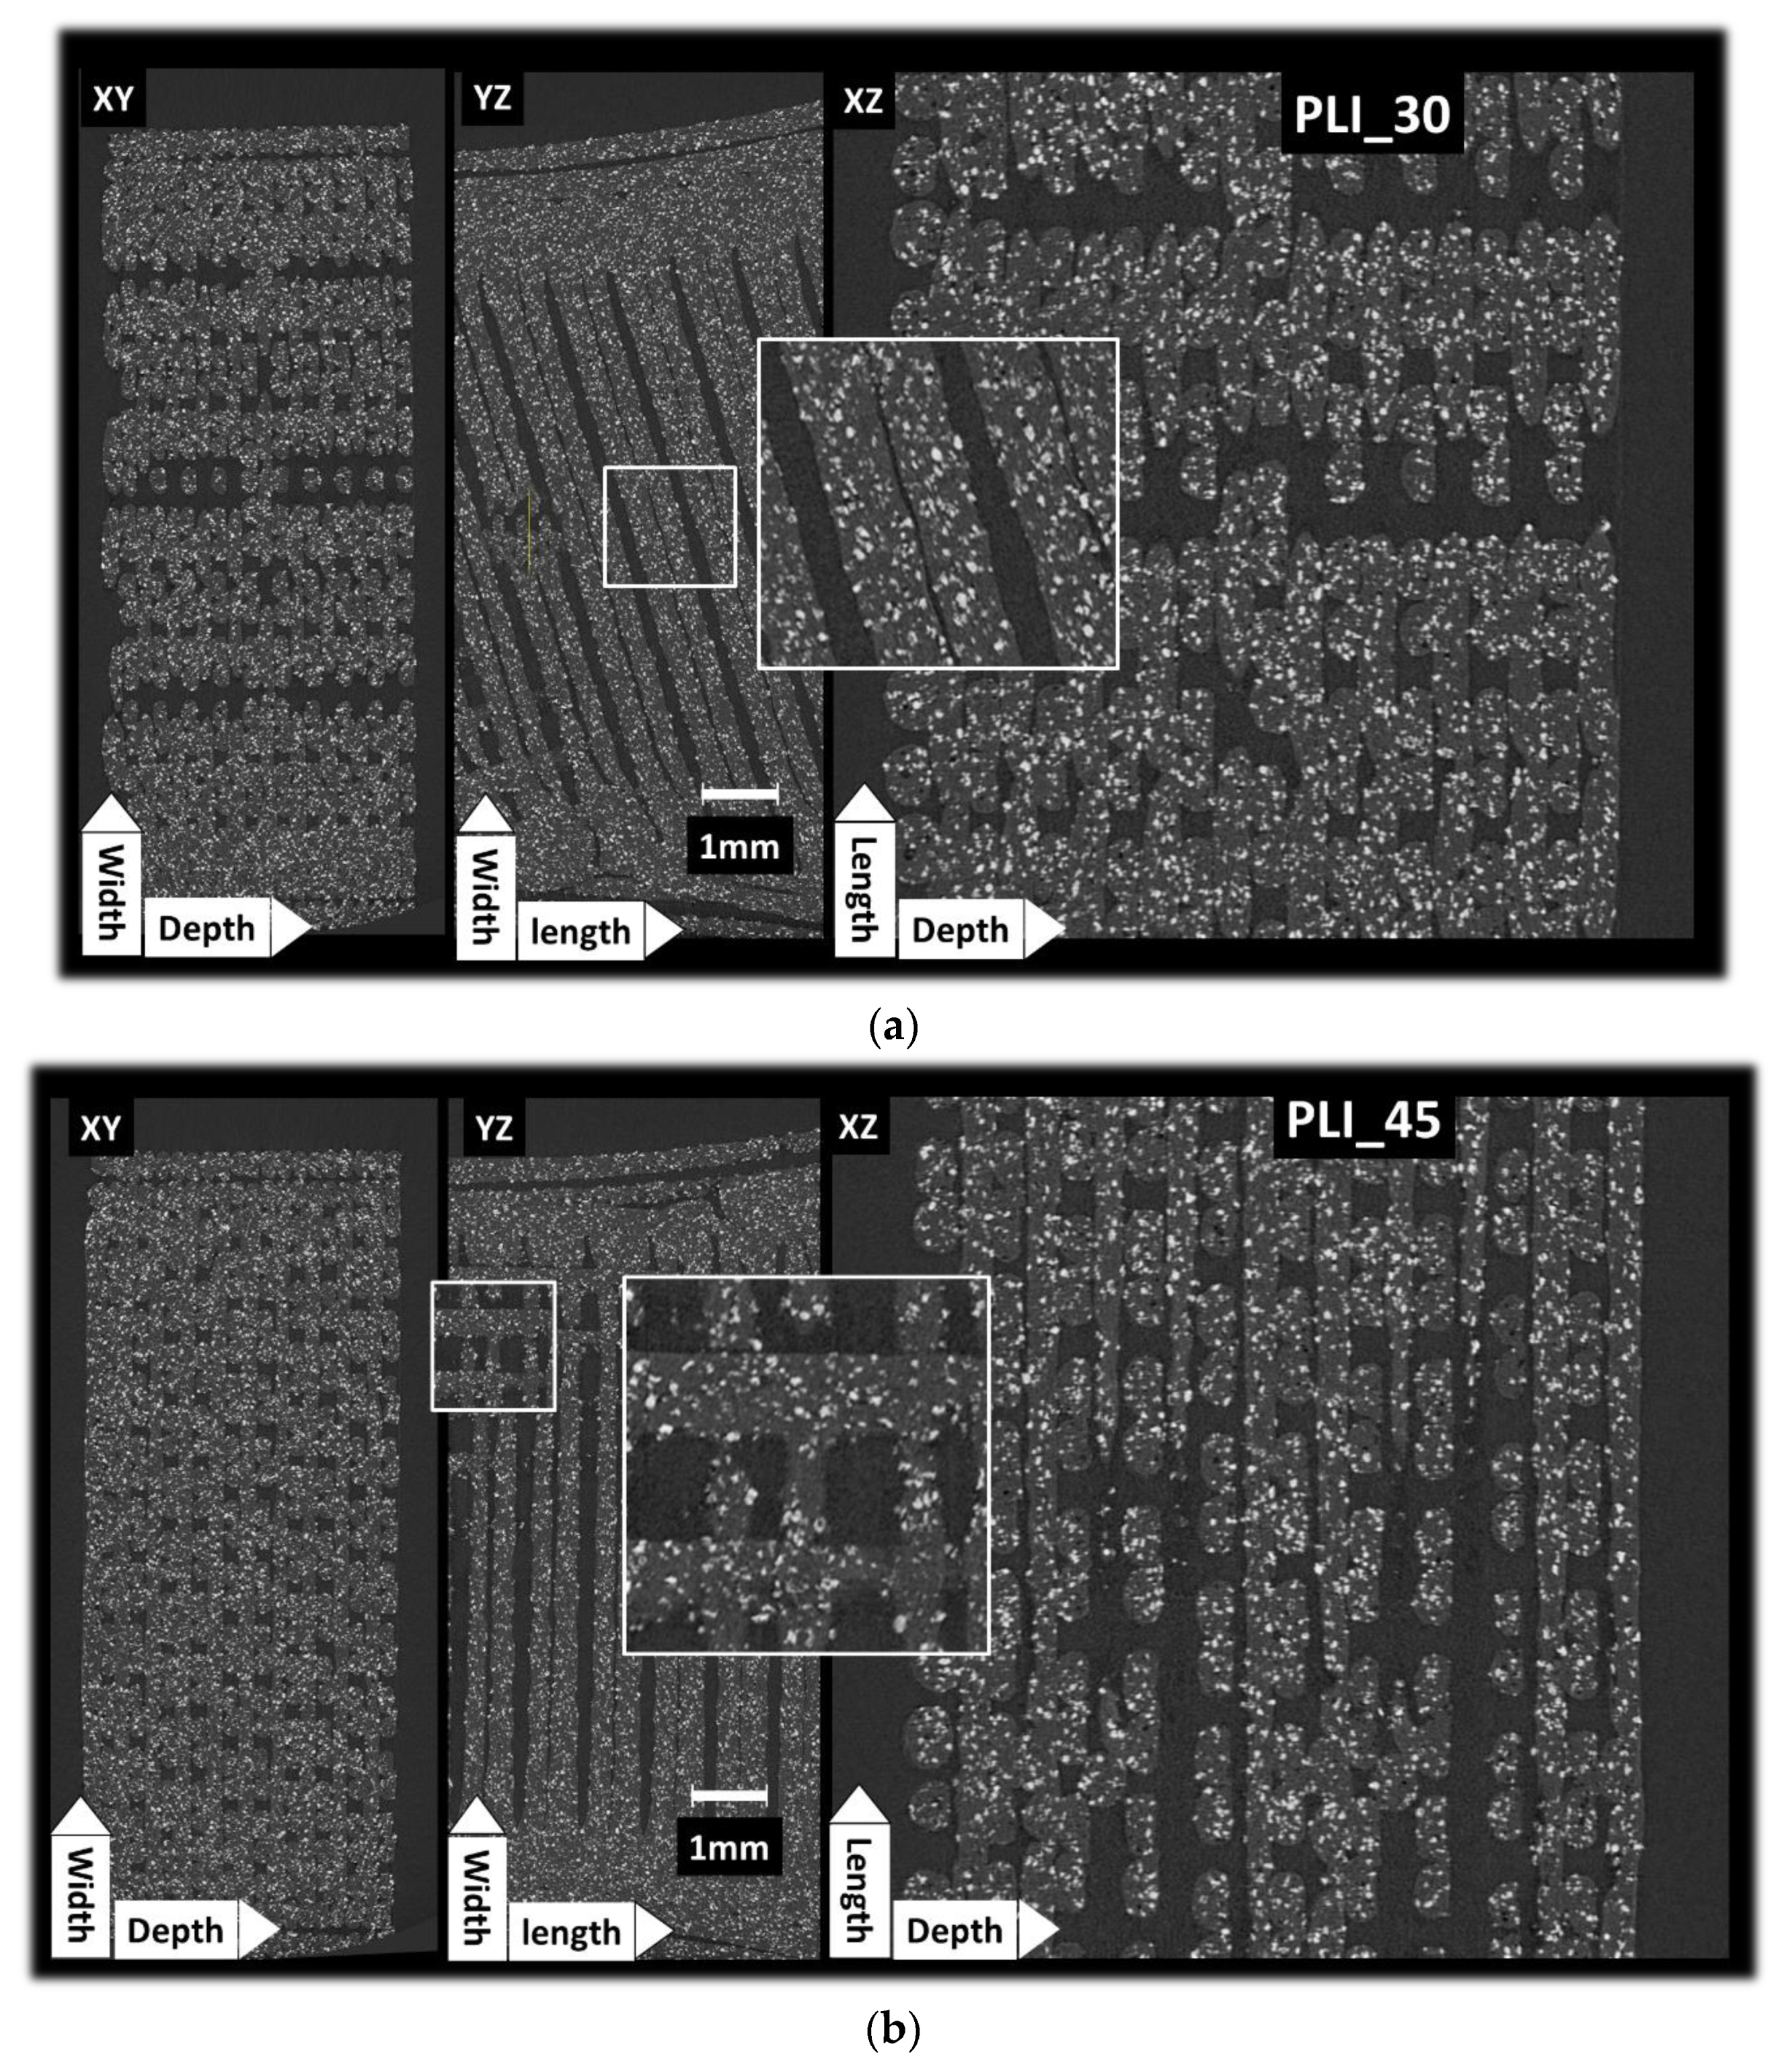
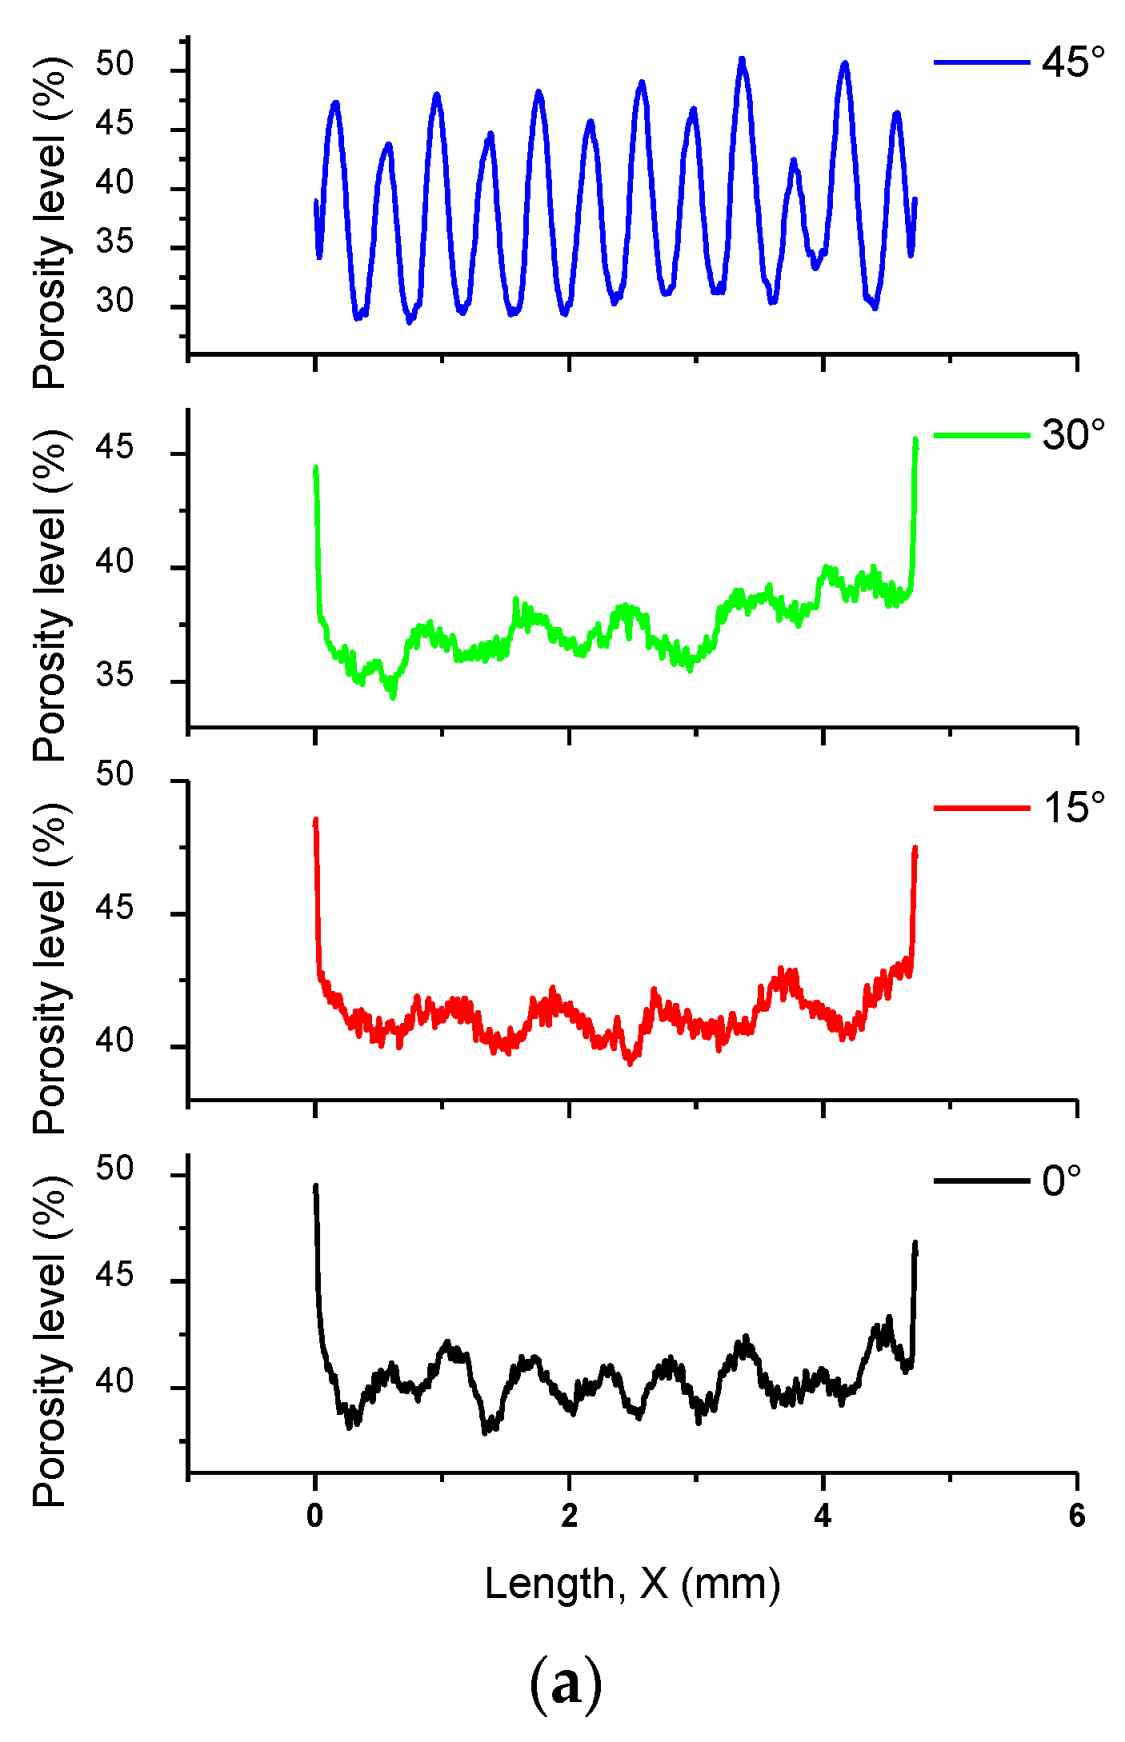
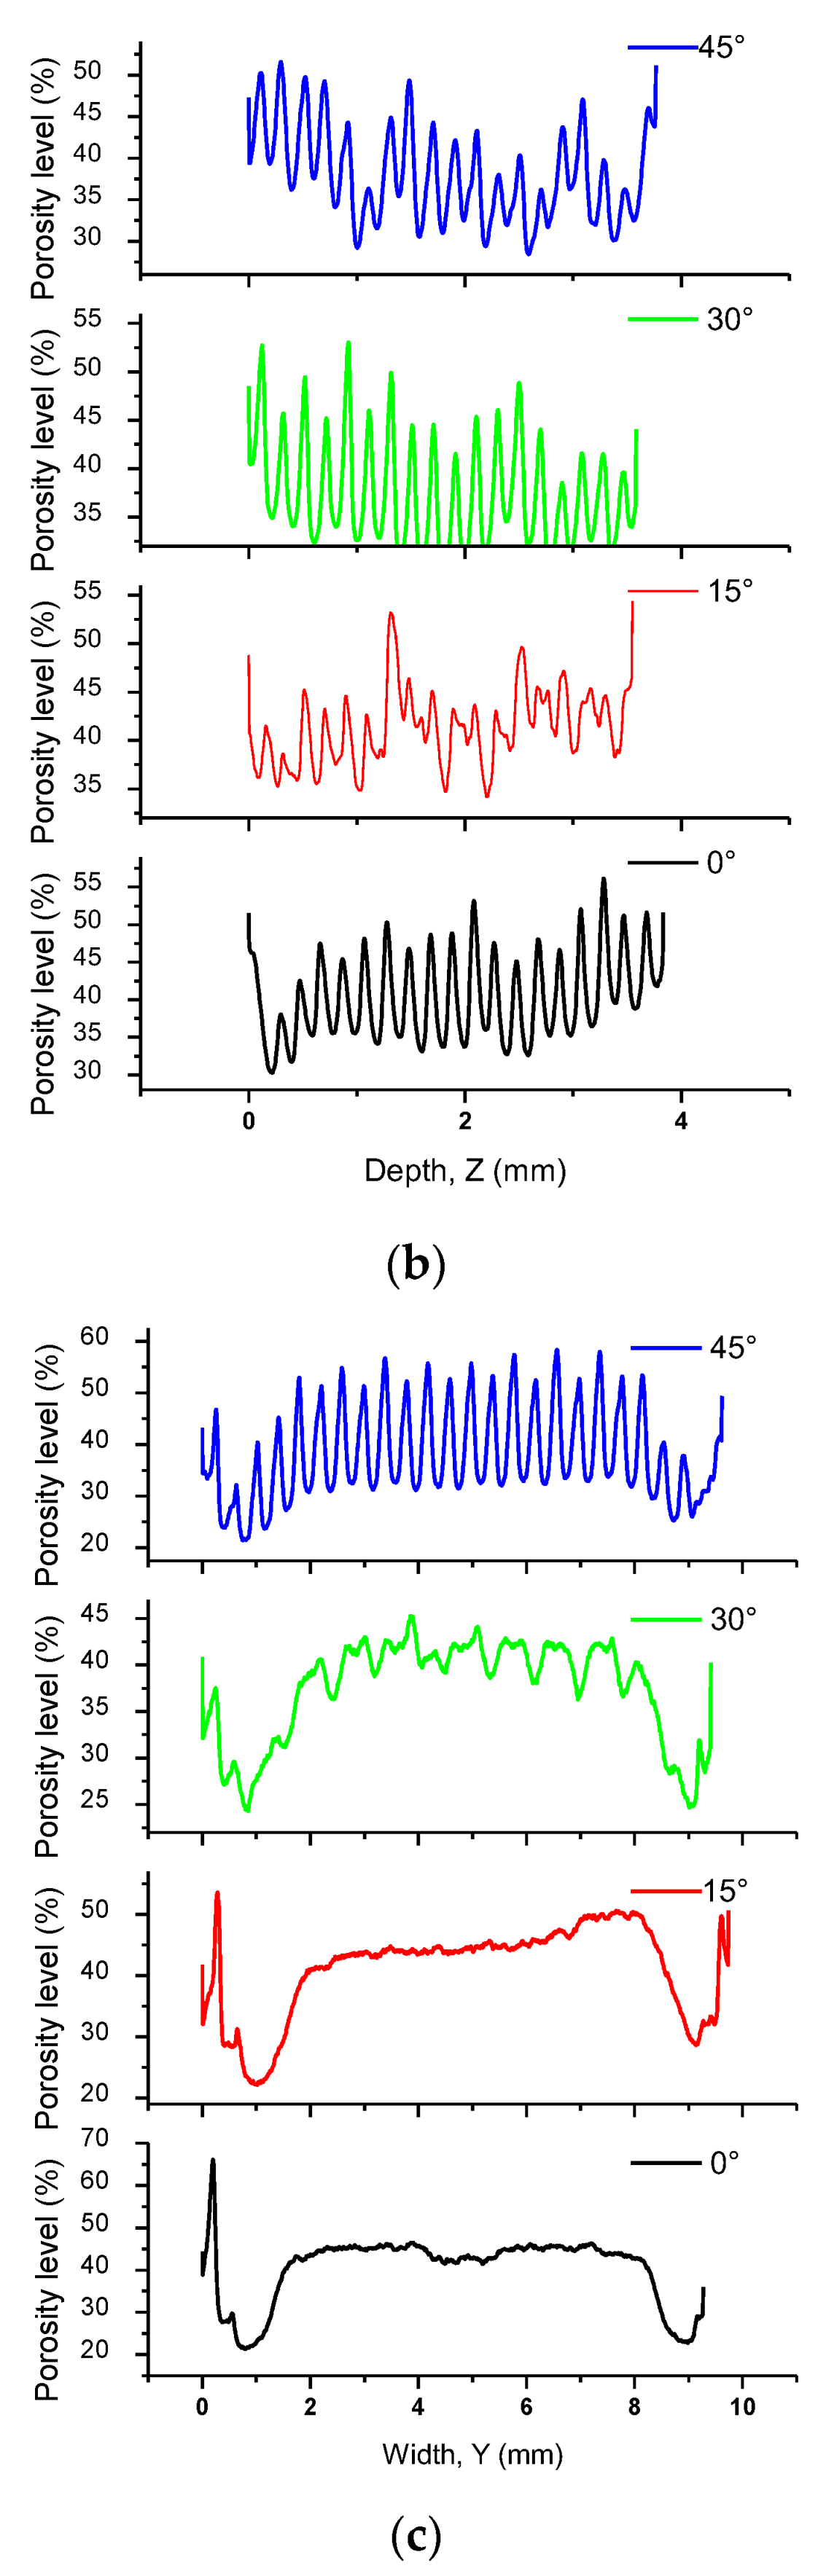
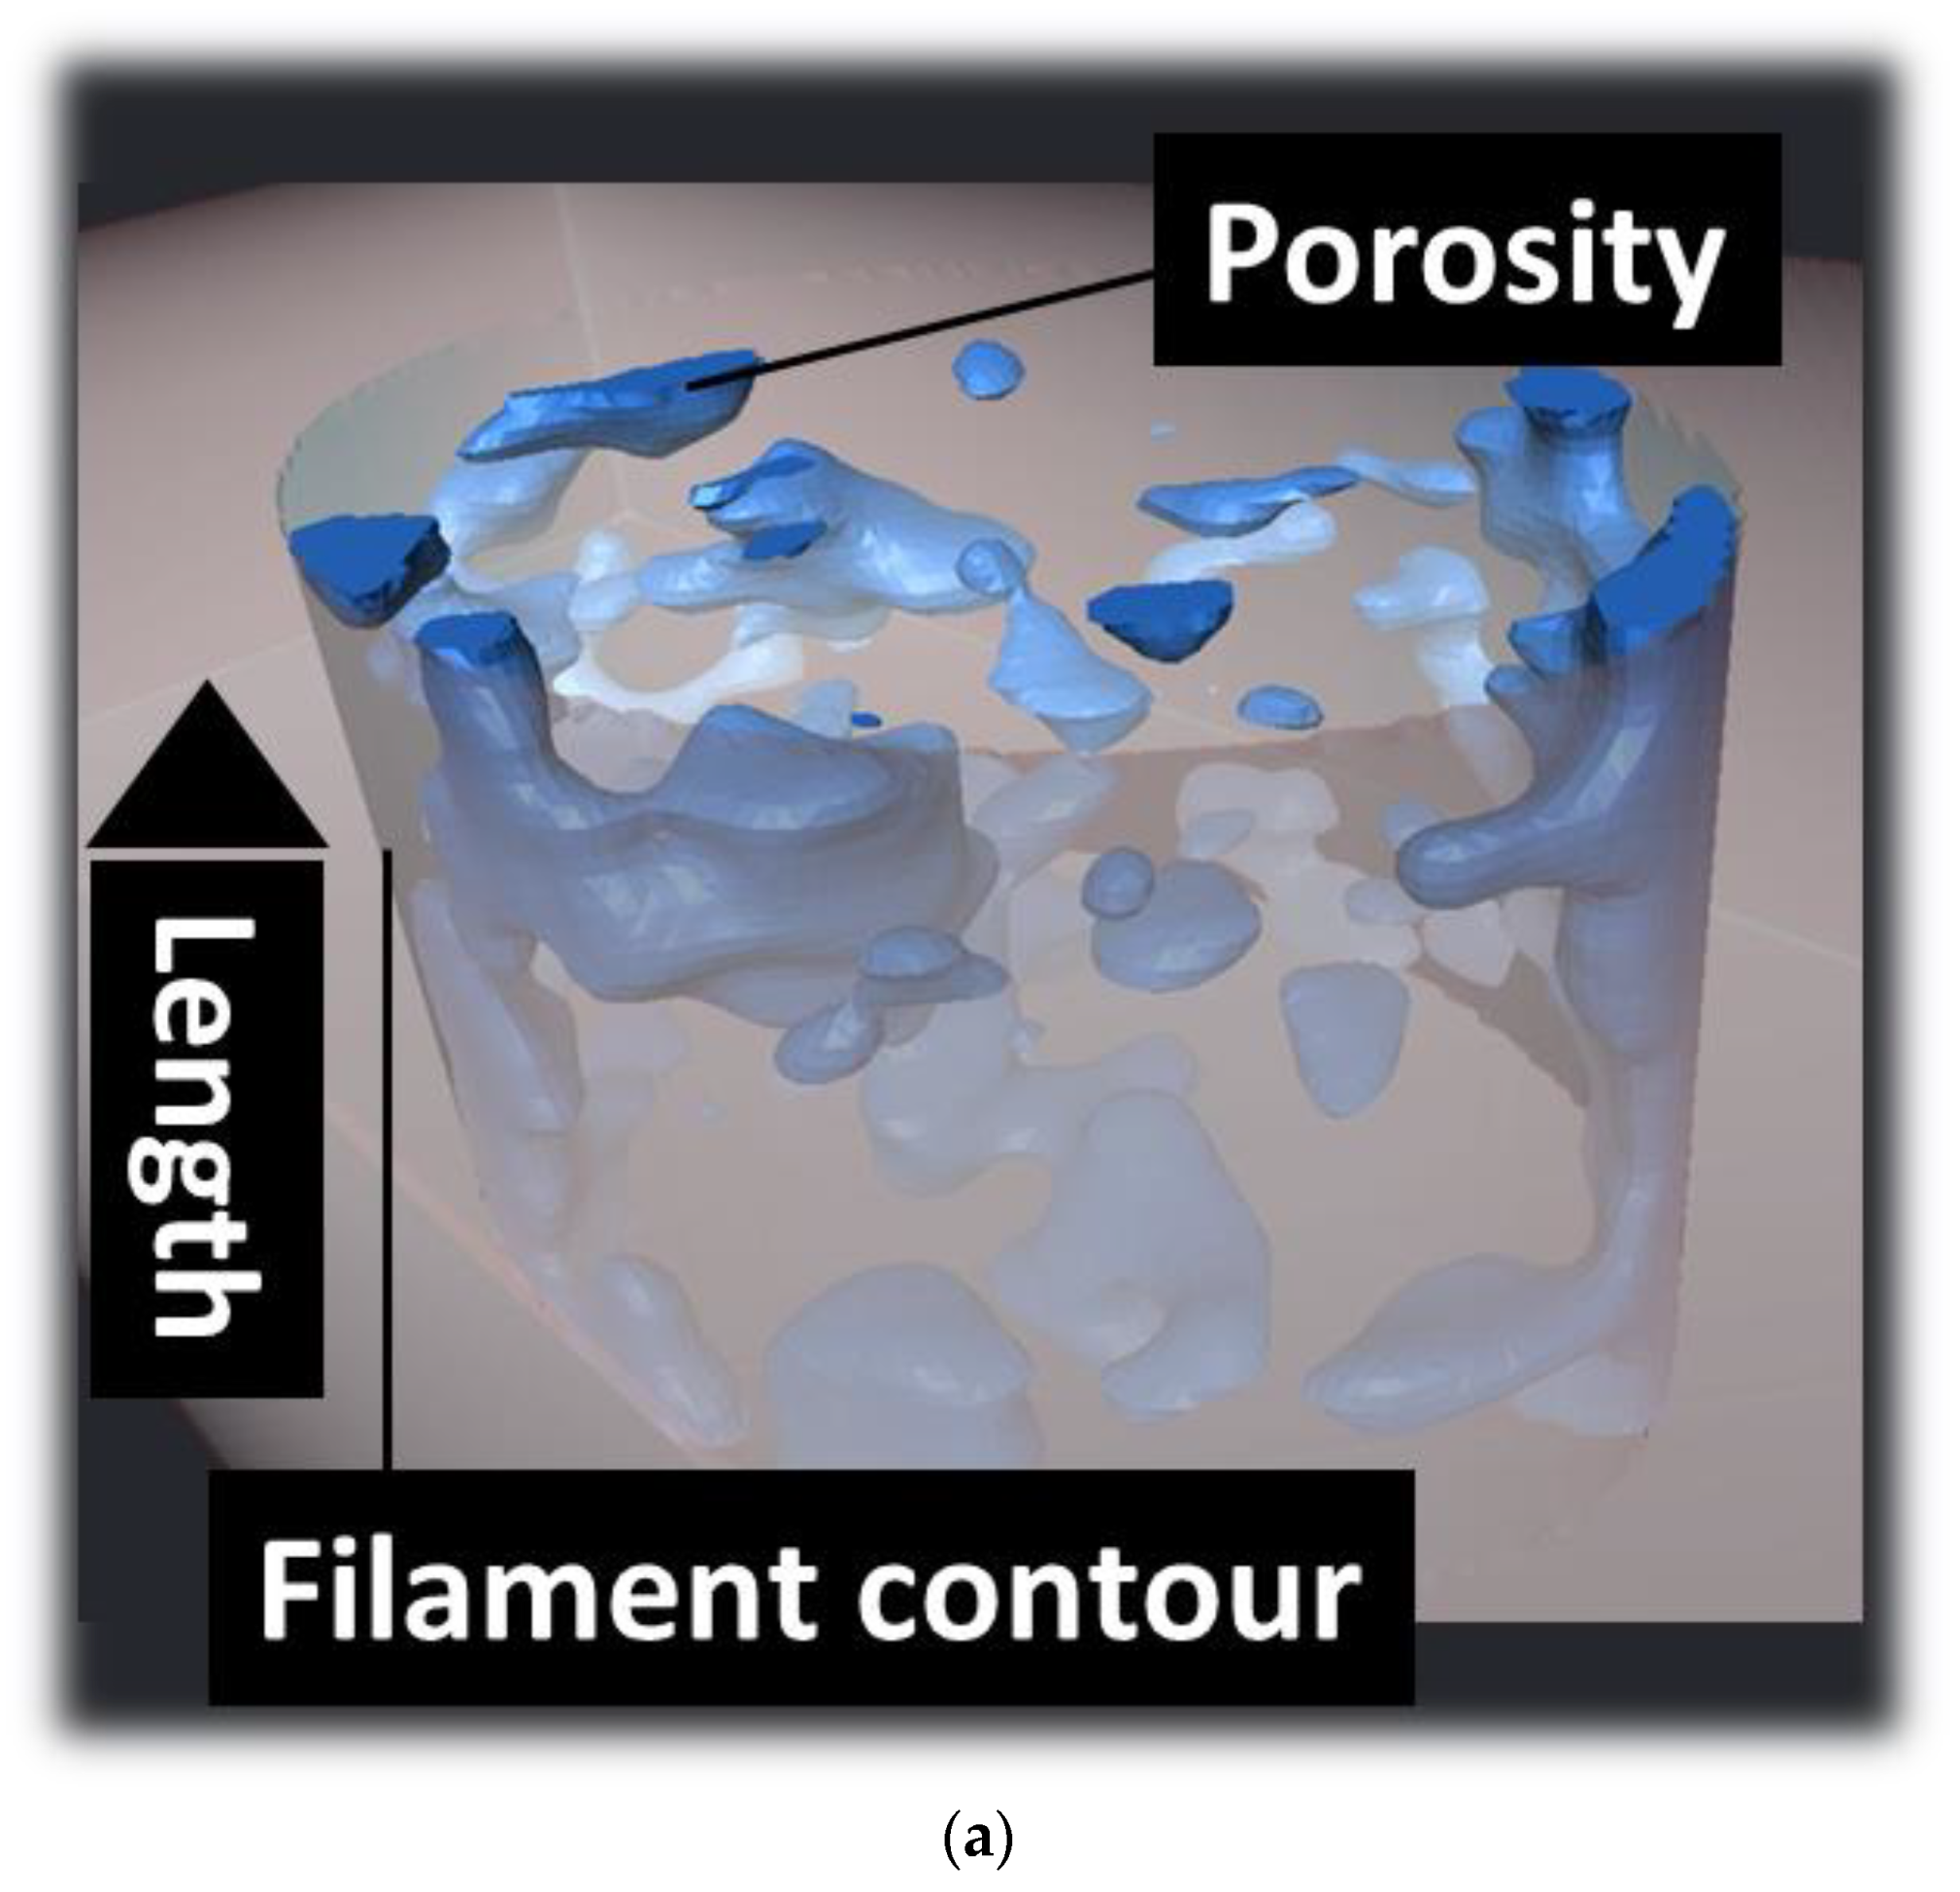
3.2. Effect of Processing Conditions on 3D Microstructure of PLI Composites

Analysis of the microstructure generated thanks to varied printing angle as a main process parameter is depicted in Figure 5. It must be mentioned that in order to obtain the effect of the printing angle on the microstructural arrangement, both external frame and core structures are considered. The central part of the dog bone generated layups that depend on the printing angle, while the external frame, common in most slicing procedures, allows to study the connectivity between the periphery and the core of the printed PLI structure. Figure 5 displays orthogonal perspectives of the PLI_00 composite, printed at a 0° angle. These perspectives result from merging two consecutive tomograms obtained along the specimen’s height. The Region of Interest typically measures 4.0 × 10 × 4.7 mm3. The microstructure reveals key characteristics related to three distinct phases with varying densities: the PLA matrix, magnetic iron particles, and porosity. These phases can be discerned through a double-segmentation process. The XY plane view highlights the primary features of Fused Filament Fabrication (FFF), showcasing in-plane discontinuities associated with the filament layup. Indeed, among the large number of process parameters, the printing angle fully controls the core of the printed PLI composites.
For the PLI_00 sample at a printing angle of 0° (θ = 0°), two main filament orientations emerge within the specimen: +45° and −45° relative to the primary dimension (length) of the sample. The spatial distribution of iron particles appears uniform without any discernible preferred orientation. Views in the XY and YZ planes reveal two main types of porosities: one associated with the raster, termed core porosity, and the other linked to the connection between the raster and external frame. Upon conversion to an 8-bit image, applying a first threshold at 60 allows the isolation of the porous structure from the rest of the specimen (Figure 5b). A second threshold at 140 separates the iron particles from the remaining phases.
Upon closer inspection of the porosity structure, it becomes apparent that the core porosity can be categorized as process-induced porosity, and there is porosity within the filament. The latter is likely to be present prior to the printing process. The process-induced porosity is found more tuneable using different values of the printing angle.
Figure 6a presents analogous orthogonal perspectives of the PLI sample, this time with a printing angle of 15°. Similar mesoscopic porosity is observed, but discerning its magnitude relative to the 0° printing angle is challenging. Much like the previous case, process-induced porosity significantly impacts the cohesion of the core structure. The porosity within the frame, composed of two filaments aligned in the primary direction of the specimen, is also accentuated. The necking effect results in a disruption along this direction.
Furthermore, a change in the tool trajectory near the specimen’s edge introduces a deceleration that modifies the lateral dimensions of the filaments. Lastly, the altered printing angle reveals regions where the print resolution falls short of adequately filling the space with filaments as small as the nozzle diameter of 0.4 mm.
Figure 6b illustrates perspective views of the porous structure within the entire Region of Interest (ROI) under a printing angle of 15°. On the right side, surface porosity aligned with the building direction contributes to the rough finishing surface of the sample, serving as an indicator of the construction direction. On the left side, noticeable distinctions are evident in the morphology of porosities within the frame and the core of the specimen. The former results from changes in filament orientation relative to the raster, while the latter is associated with filament crossings following the sequence of −30°/+60° (as observed in the perspective view at the bottom of Figure 6b).
Figure 7 presents cross-sectional views for the remaining conditions, specifically when θ = 30° and θ = 45°. A notable characteristic emerges from the analysis of all samples, including those with different printing angles. This distinctive feature is emphasised in Figure 7a as the asymmetric discontinuity within the raster generated during the printing process. The asymmetry is attributed to the overestimation of the offset along the length of the specimen when the nozzle travels between two adjacent filaments. It has a direct effect on the porosity morphology and extent. This is a direct effect of the filament crossing, as shown in Figure 1, for which the printing angle significantly affects the filament packing within the plane of construction.
The microstructural analysis results for θ = 45° are depicted in Figure 7b. This figure highlights a unique filament arrangement where half of the filaments within the core are fully aligned with the loading direction. No distinct orientation of iron particles can be observed for both cases. Only small clustering can be observed, which does not alter the homogeneity of the iron particle spatial distribution.
Additional analysis is performed to assess the anisotropic spatial distribution of the PLI phases, encompassing iron- and process-generated porosity in relation to the process conditions. Axial porosity profiles are investigated for all the examined printing angles. These profiles involve counting the black voxels associated with the porosity phase in a specific direction, normalized with respect to the length, depth, or width, depending on the orientation of the sample. For example, the porosity profile along the depth direction is obtained as follows:
f j % = i , k = 1 D X × D Z 1 γ i j k / 255 / D X × D Z
where f j represents the porosity level in the Y-direction at the jth position, specifically along the depth or construction direction ( D X , D Z ) being the total number of voxels in the X- and Z-directions, corresponding to the height of the specimen). γ i j k denotes the grey level associated with the voxel at coordinates i, j, k. For each voxel, the grey level is either 255, corresponding to the solid phase, including the PLA matrix and iron particles, or 0, representing porosity.
Figure 8 provides more detailed quantitative insights into the porosity distribution through axial porosity profiles. In Figure 8a, the results of the porosity profiles along the length direction are illustrated. The overall porosity content remains consistent at 39%, regardless of the printing angle. Thus, the fixed processing conditions allow a stable porosity content to be achieved even if the printing angle is varied in a wide range. However, when determined through weight and volume measurements, this value is approximately 30%. The average density of the 3D-printed PLI is consistently 1.3 ± 0.22 g/cm3, irrespective of the printing angle. Given the as-received PLI density of 1.85 g/cm3, the relative density of the printed samples is approximately 0.70.
The markedly uneven profiles along the length of the sample reveal a periodicity in the positions of porosity, consistent with a grid-like porous structure (as depicted in Figure 8a). Although the 45° printing angle yields the lowest average porosity level (as indicated in Table 2), it also exhibits the highest variation in axial porosity levels along the length. The peak values reach levels close to 51%, while the lowest values are as low as 30%. The 30° printing condition also displays significant variation, followed by the remaining printing angles in a descending order. At this juncture, it can be inferred that the larger the printing angle, the greater the perturbation in the porosity profile. This variability can have a notable impact on stress localisation, particularly with a substantial modulation of the porosity level across a short length, as small as 200 µm.
Throughout the depth, significant peaks are not evident for the 45° printing angle (Figure 8b). All samples demonstrate a consistent variation in porosity levels, ranging from 30% to 55%. This serves as evidence for the uniformity of the printing process across the specimen’s depth, regardless of the printing angle.
Porosity profiles along the width of the specimen (Figure 8c) reveal the existence of interfilament porosity within the external frame, as illustrated in Figure 6a. The porosity level peaks at values as high as 65%. In proximity to the specimen’s edges at 1 mm and 9 mm, low porosity levels indicate connectivity between the raster and the frame. In the core of the specimens, the sequencing results in a periodic filament arrangement, where the spaces between adjacent filaments contribute to the observed porosity trend between 2 and 8 mm. It is worth noting that the porous structure appears notably jagged for a printing angle of 45°, while for the remaining conditions, the porosity level trend seems more stable. It can be concluded at this stage that even if the overall effect of the printing angle is not evident on the porosity content, it has a significant influence on the variability of the process-induced porosities.
Figure 9 shows a closer view of the main features within the PLI filament. Figure 9a shows the porosity morphology and spatial distribution within the filament. There is no direct relationship between the laying down process and the pore morphology. The elliptical shape of the PLI extruded filament is due to the difference between the layer height (0.2 mm) and the nozzle diameter (0.4 mm). The shape factor representing the ratio between the semi-lengths is 0.65 ± 0.06. The porosity content within the filament exhibits a low discrepancy as well, with an average value close to 24 ± 4%. This value is significant compared to the residual porosity found in the as-received filament (Figure 4). Based on the assessment of size distribution depicted in Figure 9b, the pores exhibit a monomodal distribution, with an average size of 12.00 ± 2.54 µm. The entire range of distribution is confined within 5 to 30 µm. Additionally, the 3D labelling-derived pore connectivity reveals a nearly equal ratio, approximately 95 ± 2%.
Analysis of the iron particle content is performed by imposing a threshold of 107 to all grey-level images and achieving binary images. The axial profiles of iron particle content can be retrieved as follows:
I j % = i , k = 1 D X × D Z γ i j k / 255 / D X × D Z
where I j represents the iron particle content in the Y-direction at the jth position, specifically along the depth or construction direction ( D X , D Z ) being the total number of voxels in the X- and Z-directions, corresponding to the height of the specimen). γ i j k denotes the grey level associated with the voxel at coordinates i, j, k. For each voxel, the grey level is either 255, corresponding to the iron phase, or 0, including the PLA matrix and porosity.
Figure 9c shows the axial profiles along a sample length of iron particle content for all printing conditions. The axial profiles exhibit the same trend as the porosity level shown in Figure 8a. The sample exhibits an uneven iron content profile along its length, indicating a periodicity in the positions of iron particles that corresponds to filament arrangement within the raster. The average iron particle content does not depend on the printing angle. Its average value is 13.0 ± 0.3. Despite the 45° printing angle resulting in the same iron particle content, it also shows the highest variation in axial iron content levels. The iron content ranges from a peak of close to 16.5% to a minimum of 10.5%. The 30° printing condition also demonstrates high variation in iron content along the length, but the extent is much lower compared to 45°. This suggests that larger printing angles lead to greater perturbations in filament arrangement, which in turn significantly tunes the iron content.
The iron volume content retrieved from the segmentation process is an effective content as the 3D-printed PLI is an airy structure. In order to have a precise value of the iron content within the PLI filament itself, further processing is undertaken based on elliptic crops that are performed on the filaments. The elliptical cropping is selected based on the result of the laying down of the filaments, as shown in Figure 9c. Based on the quantitative analysis of the volume content of iron particle content, this content is stable irrespective of the printing condition around 18.5 ± 2.2%. The iron content in the printed PLI is lower than the iron content in the as-received filament (Figure 4). The decrease represents about 32%, which can be attributed to the difference in material flowability between the PLA matrix and iron second phase during the laying down process. Figure 9e shows that such a content of iron particles allows a connectivity of about 22 ± 2.3%. This small connectivity is mostly due to the globular morphology of iron particles, as shown in Figure 9e. It is, however, larger than the iron particle connectivity found in the as-received PLI filament, which confirms the smaller amount of iron particles obtained during the printing process.

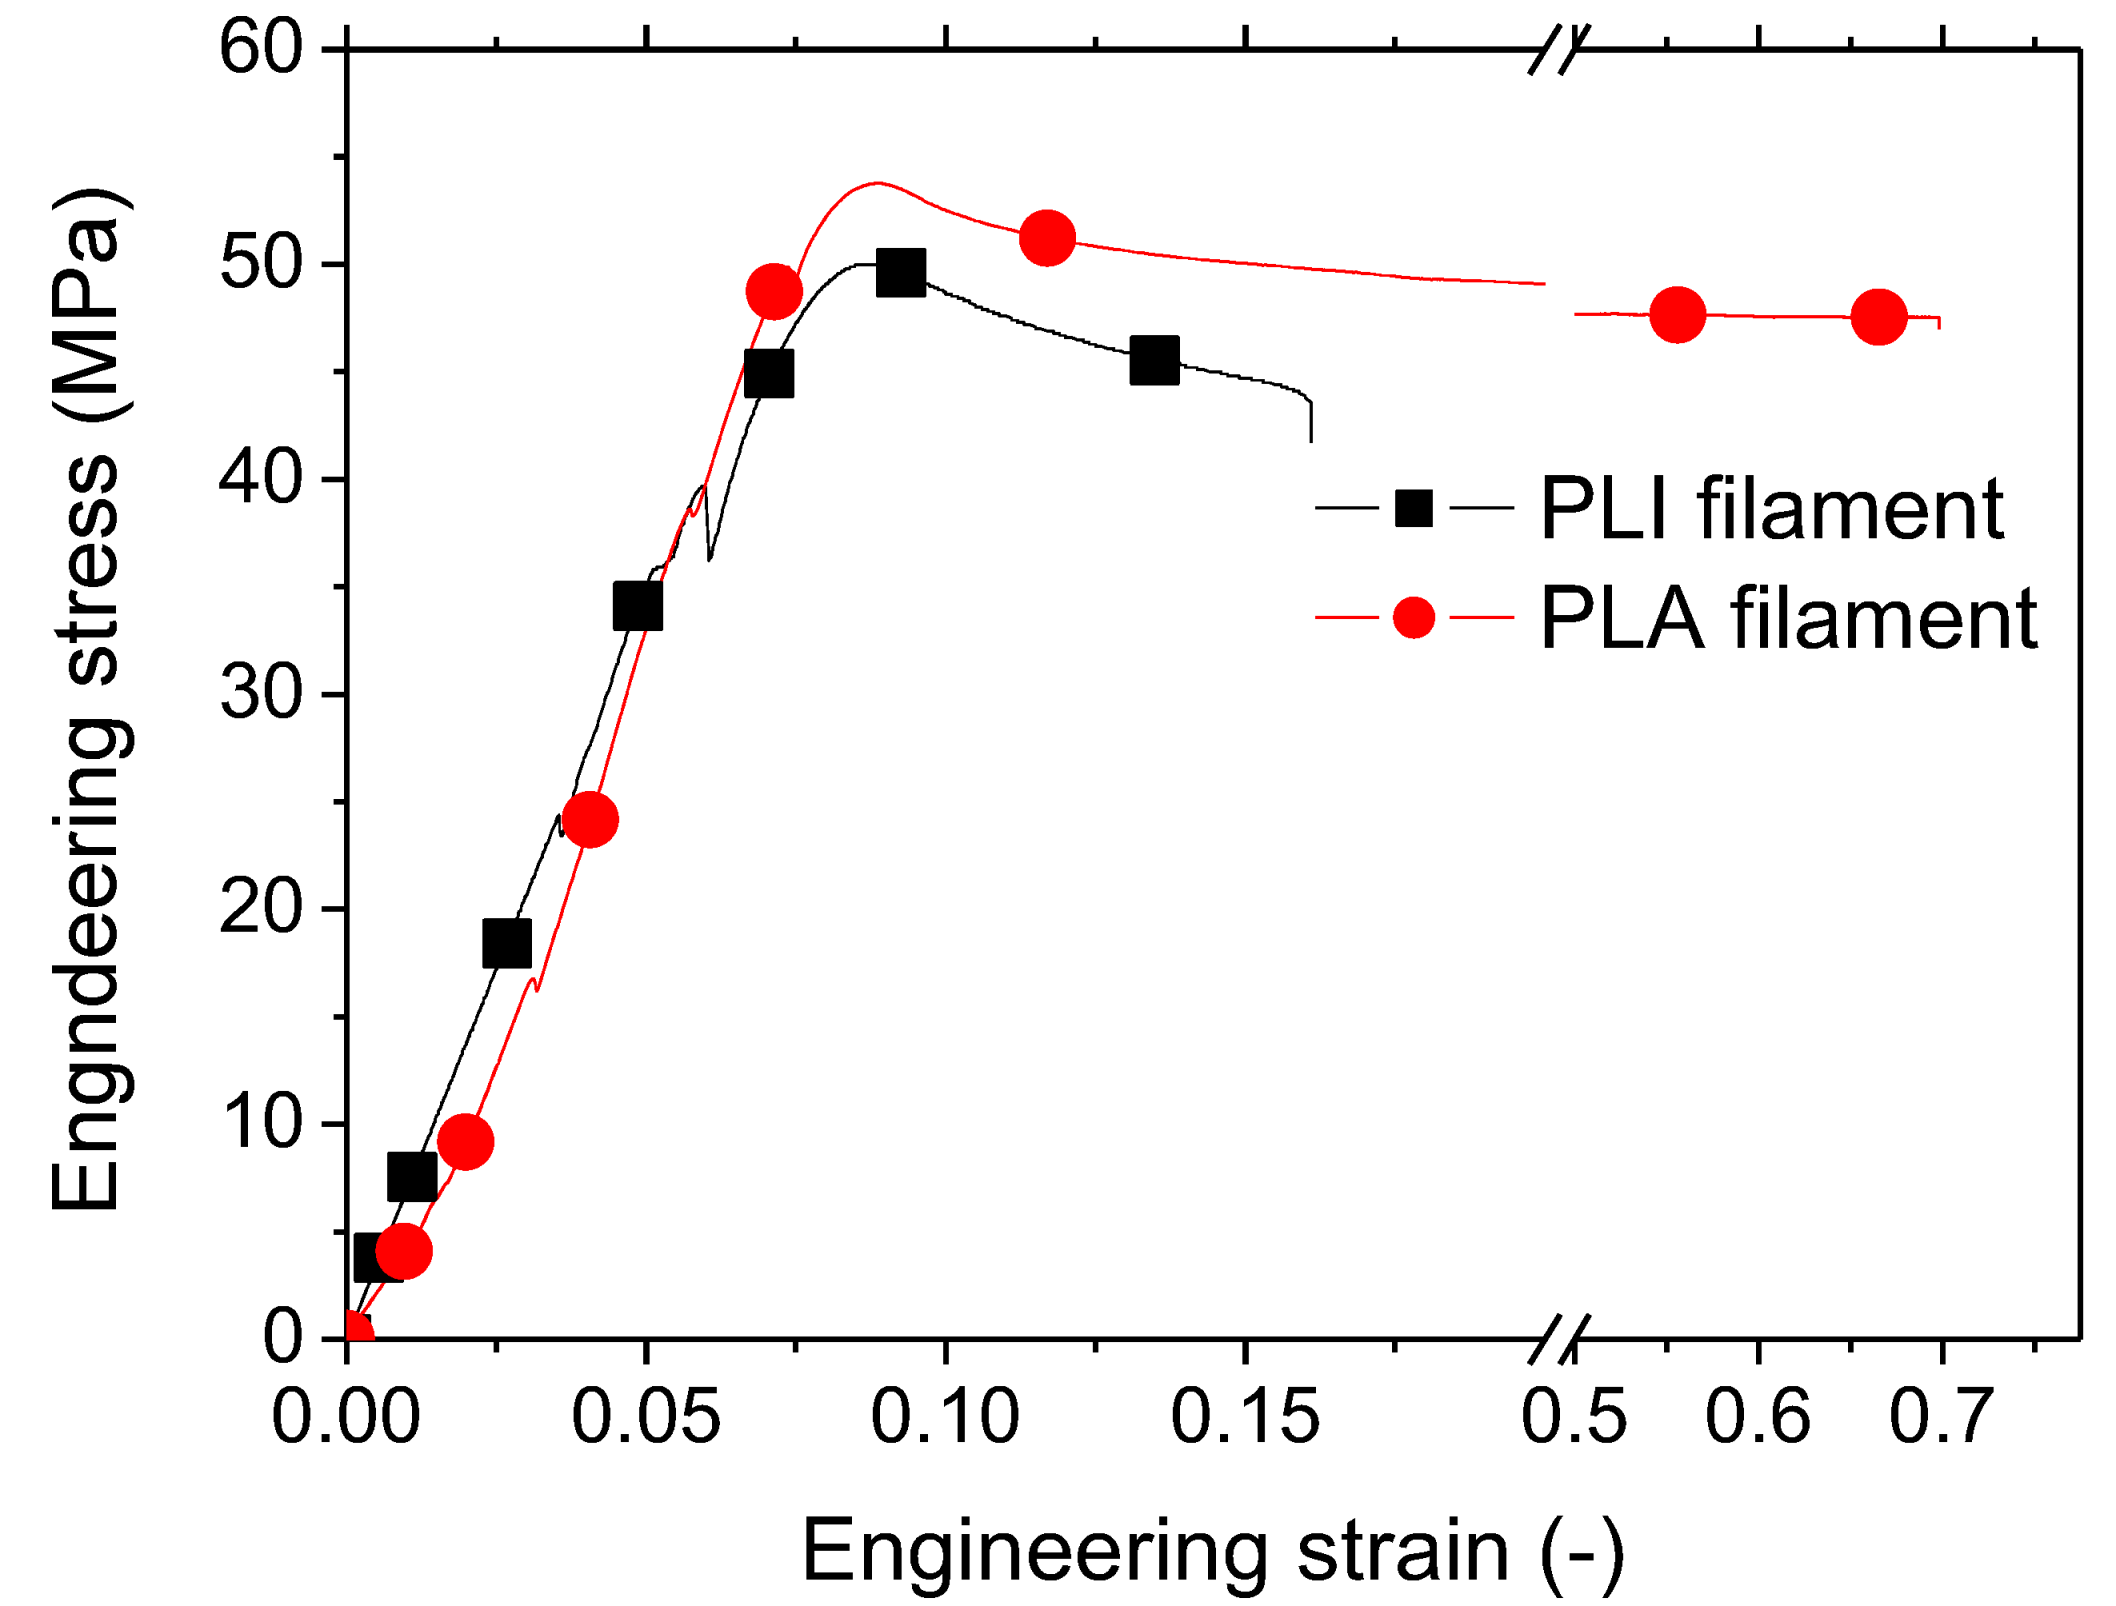
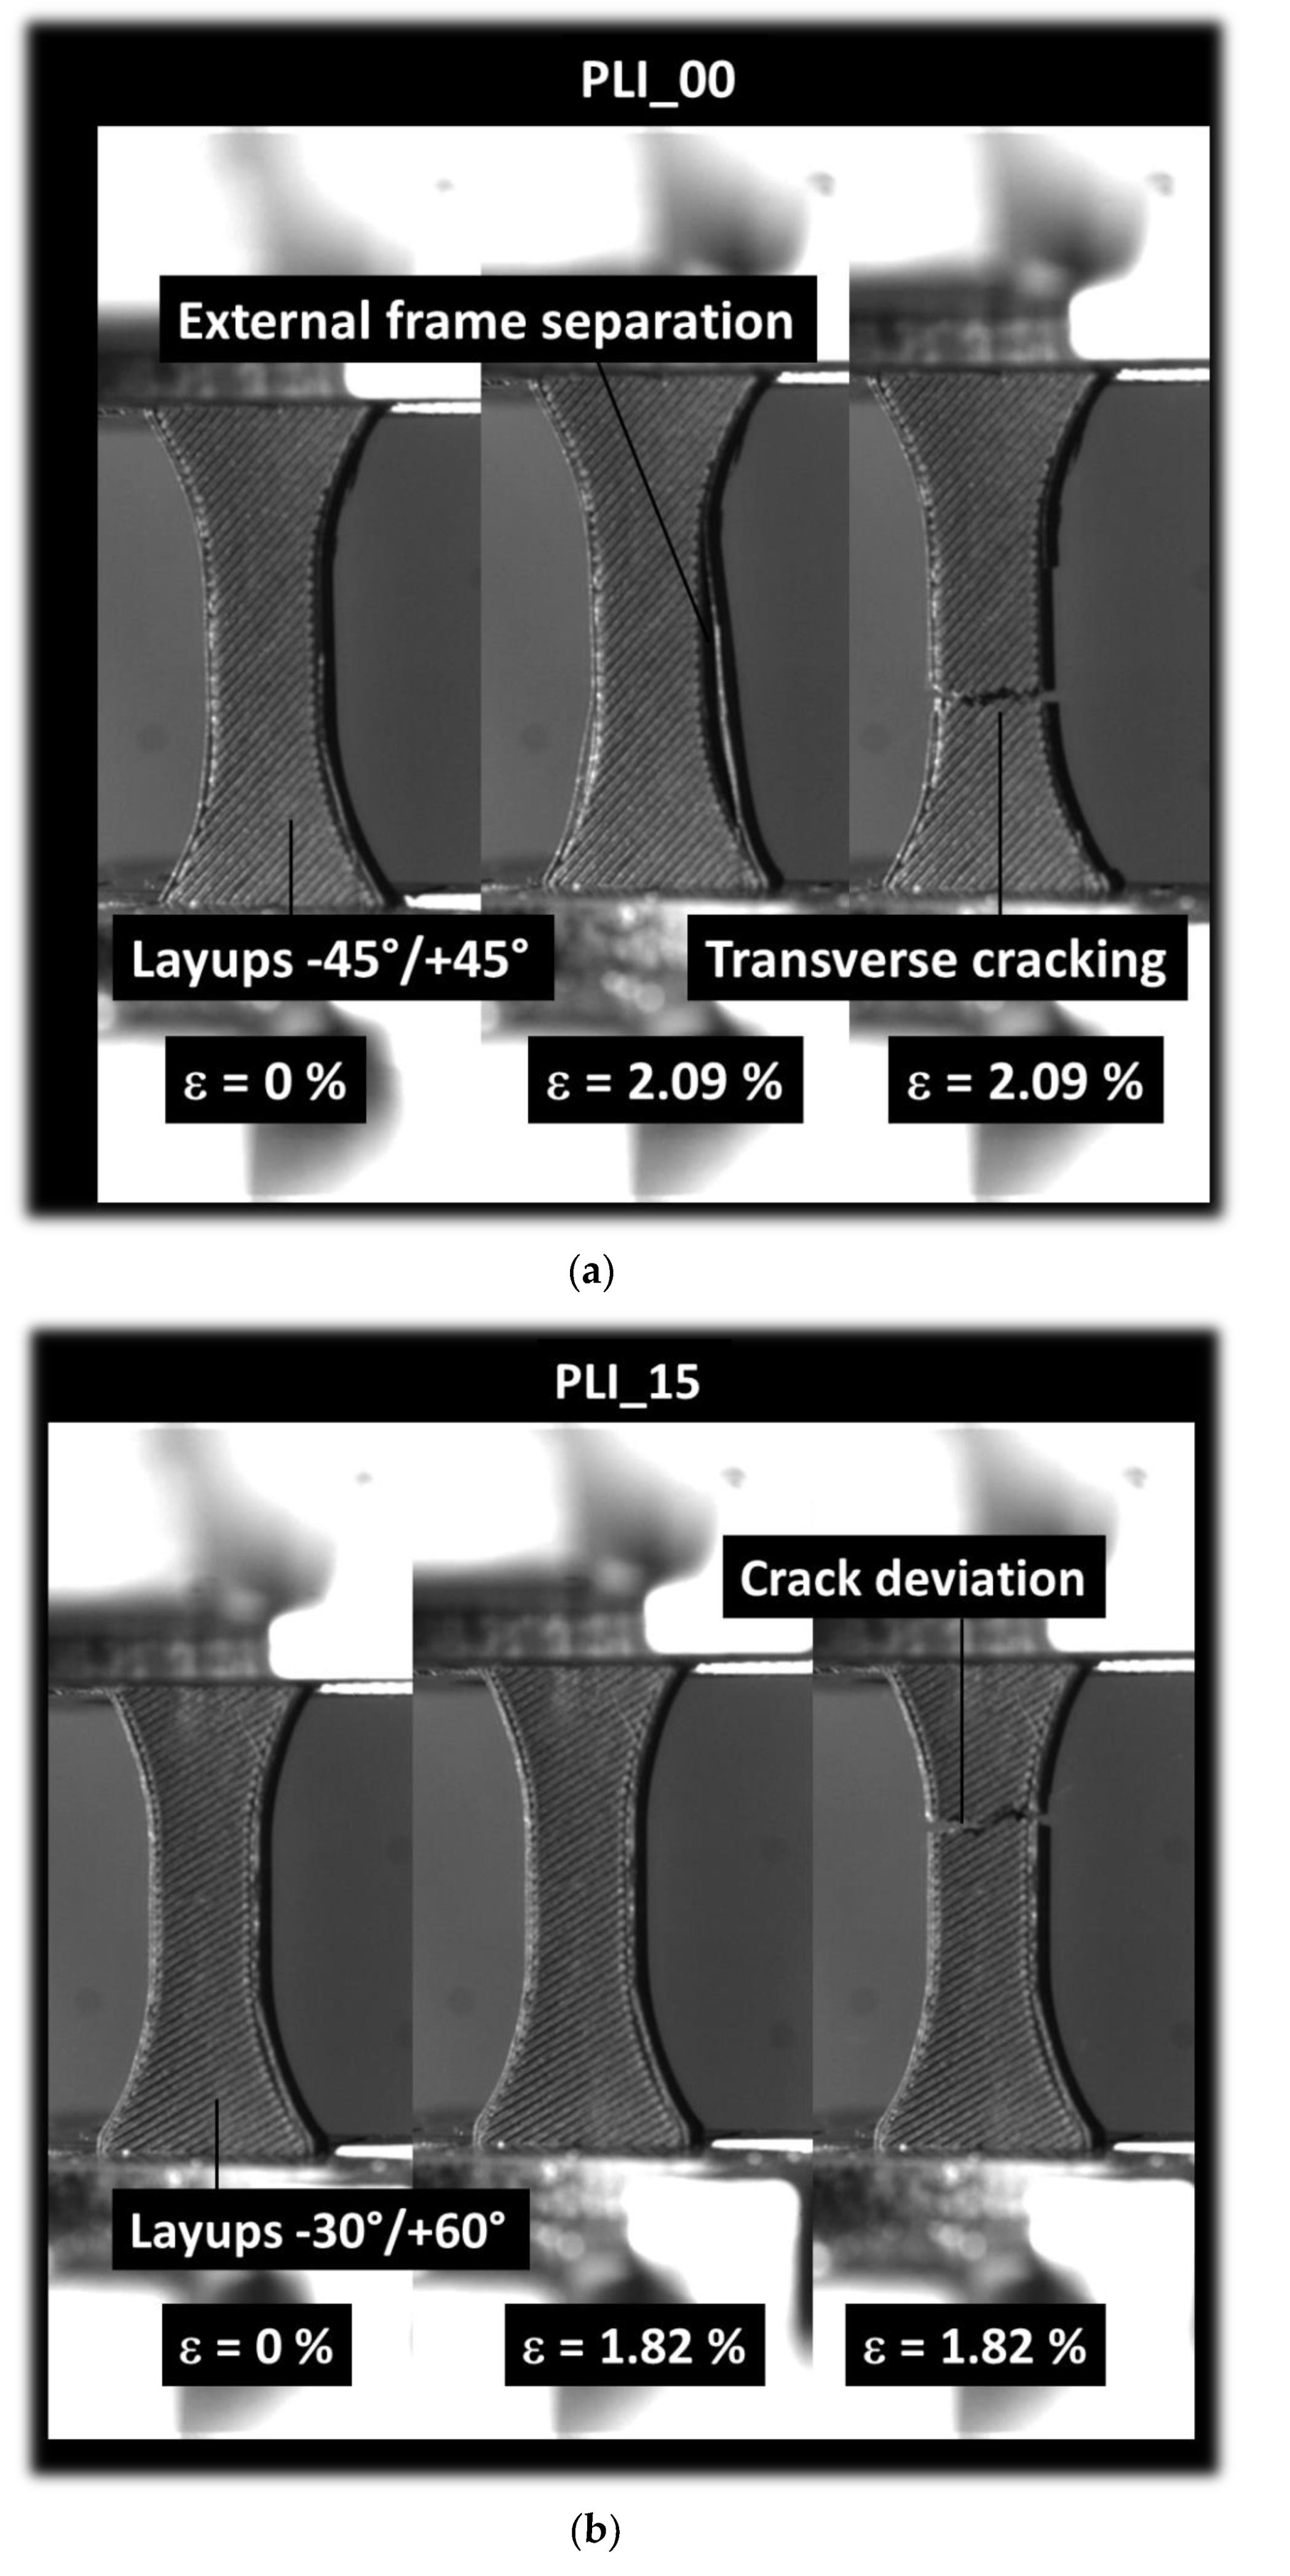
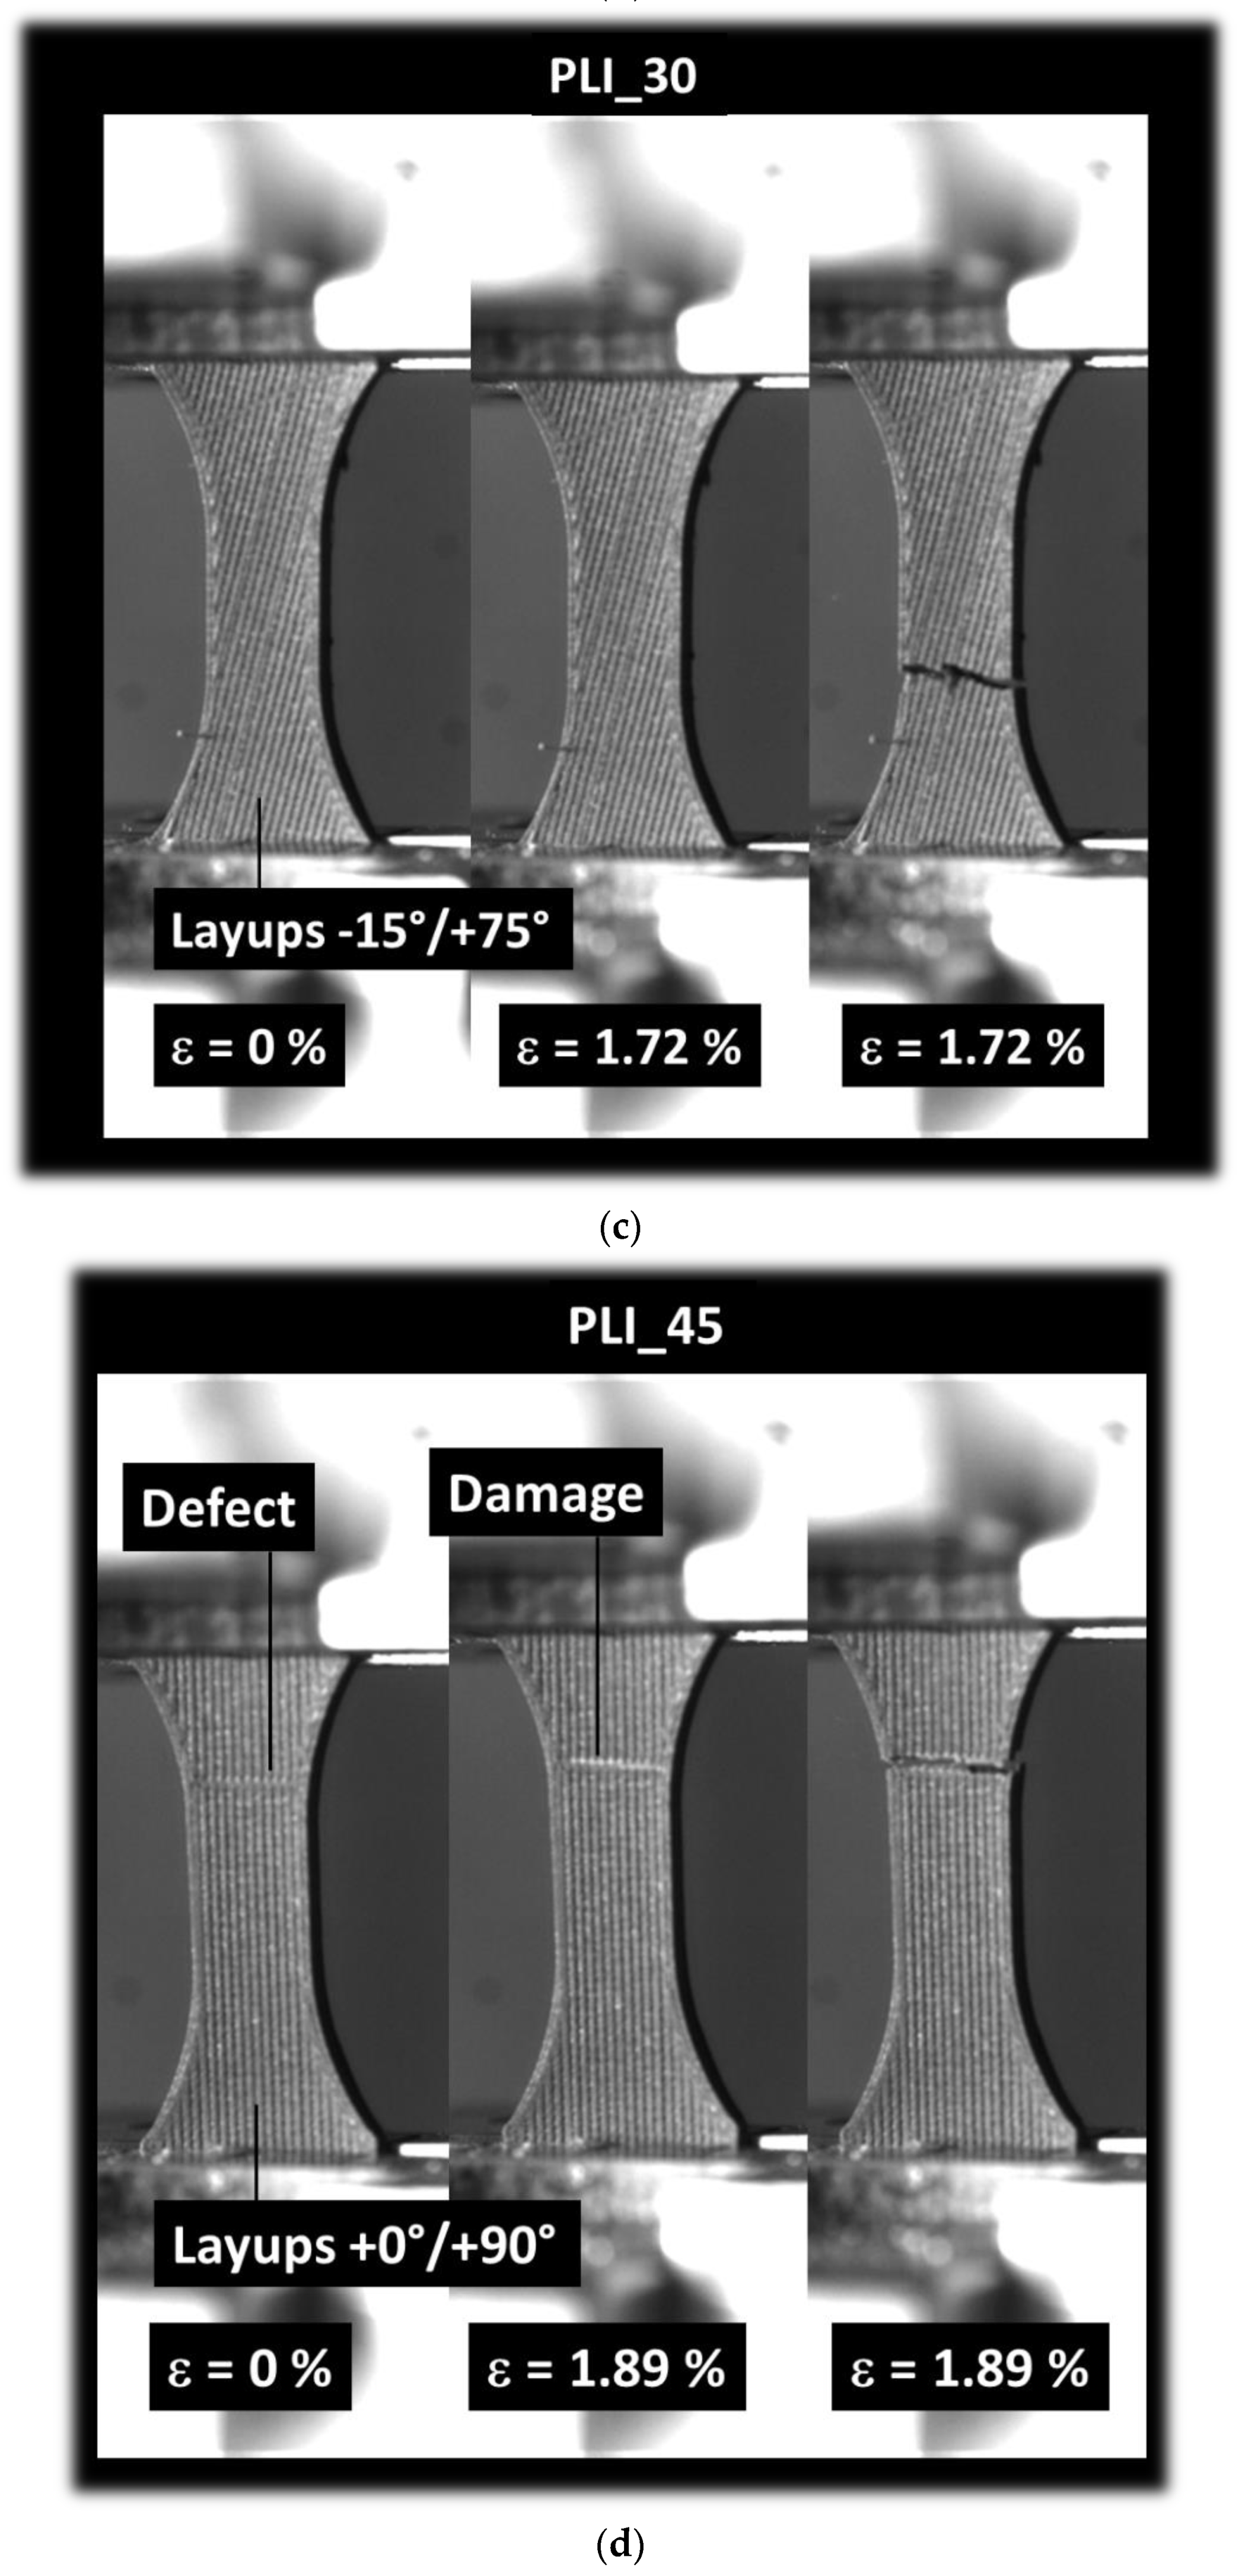
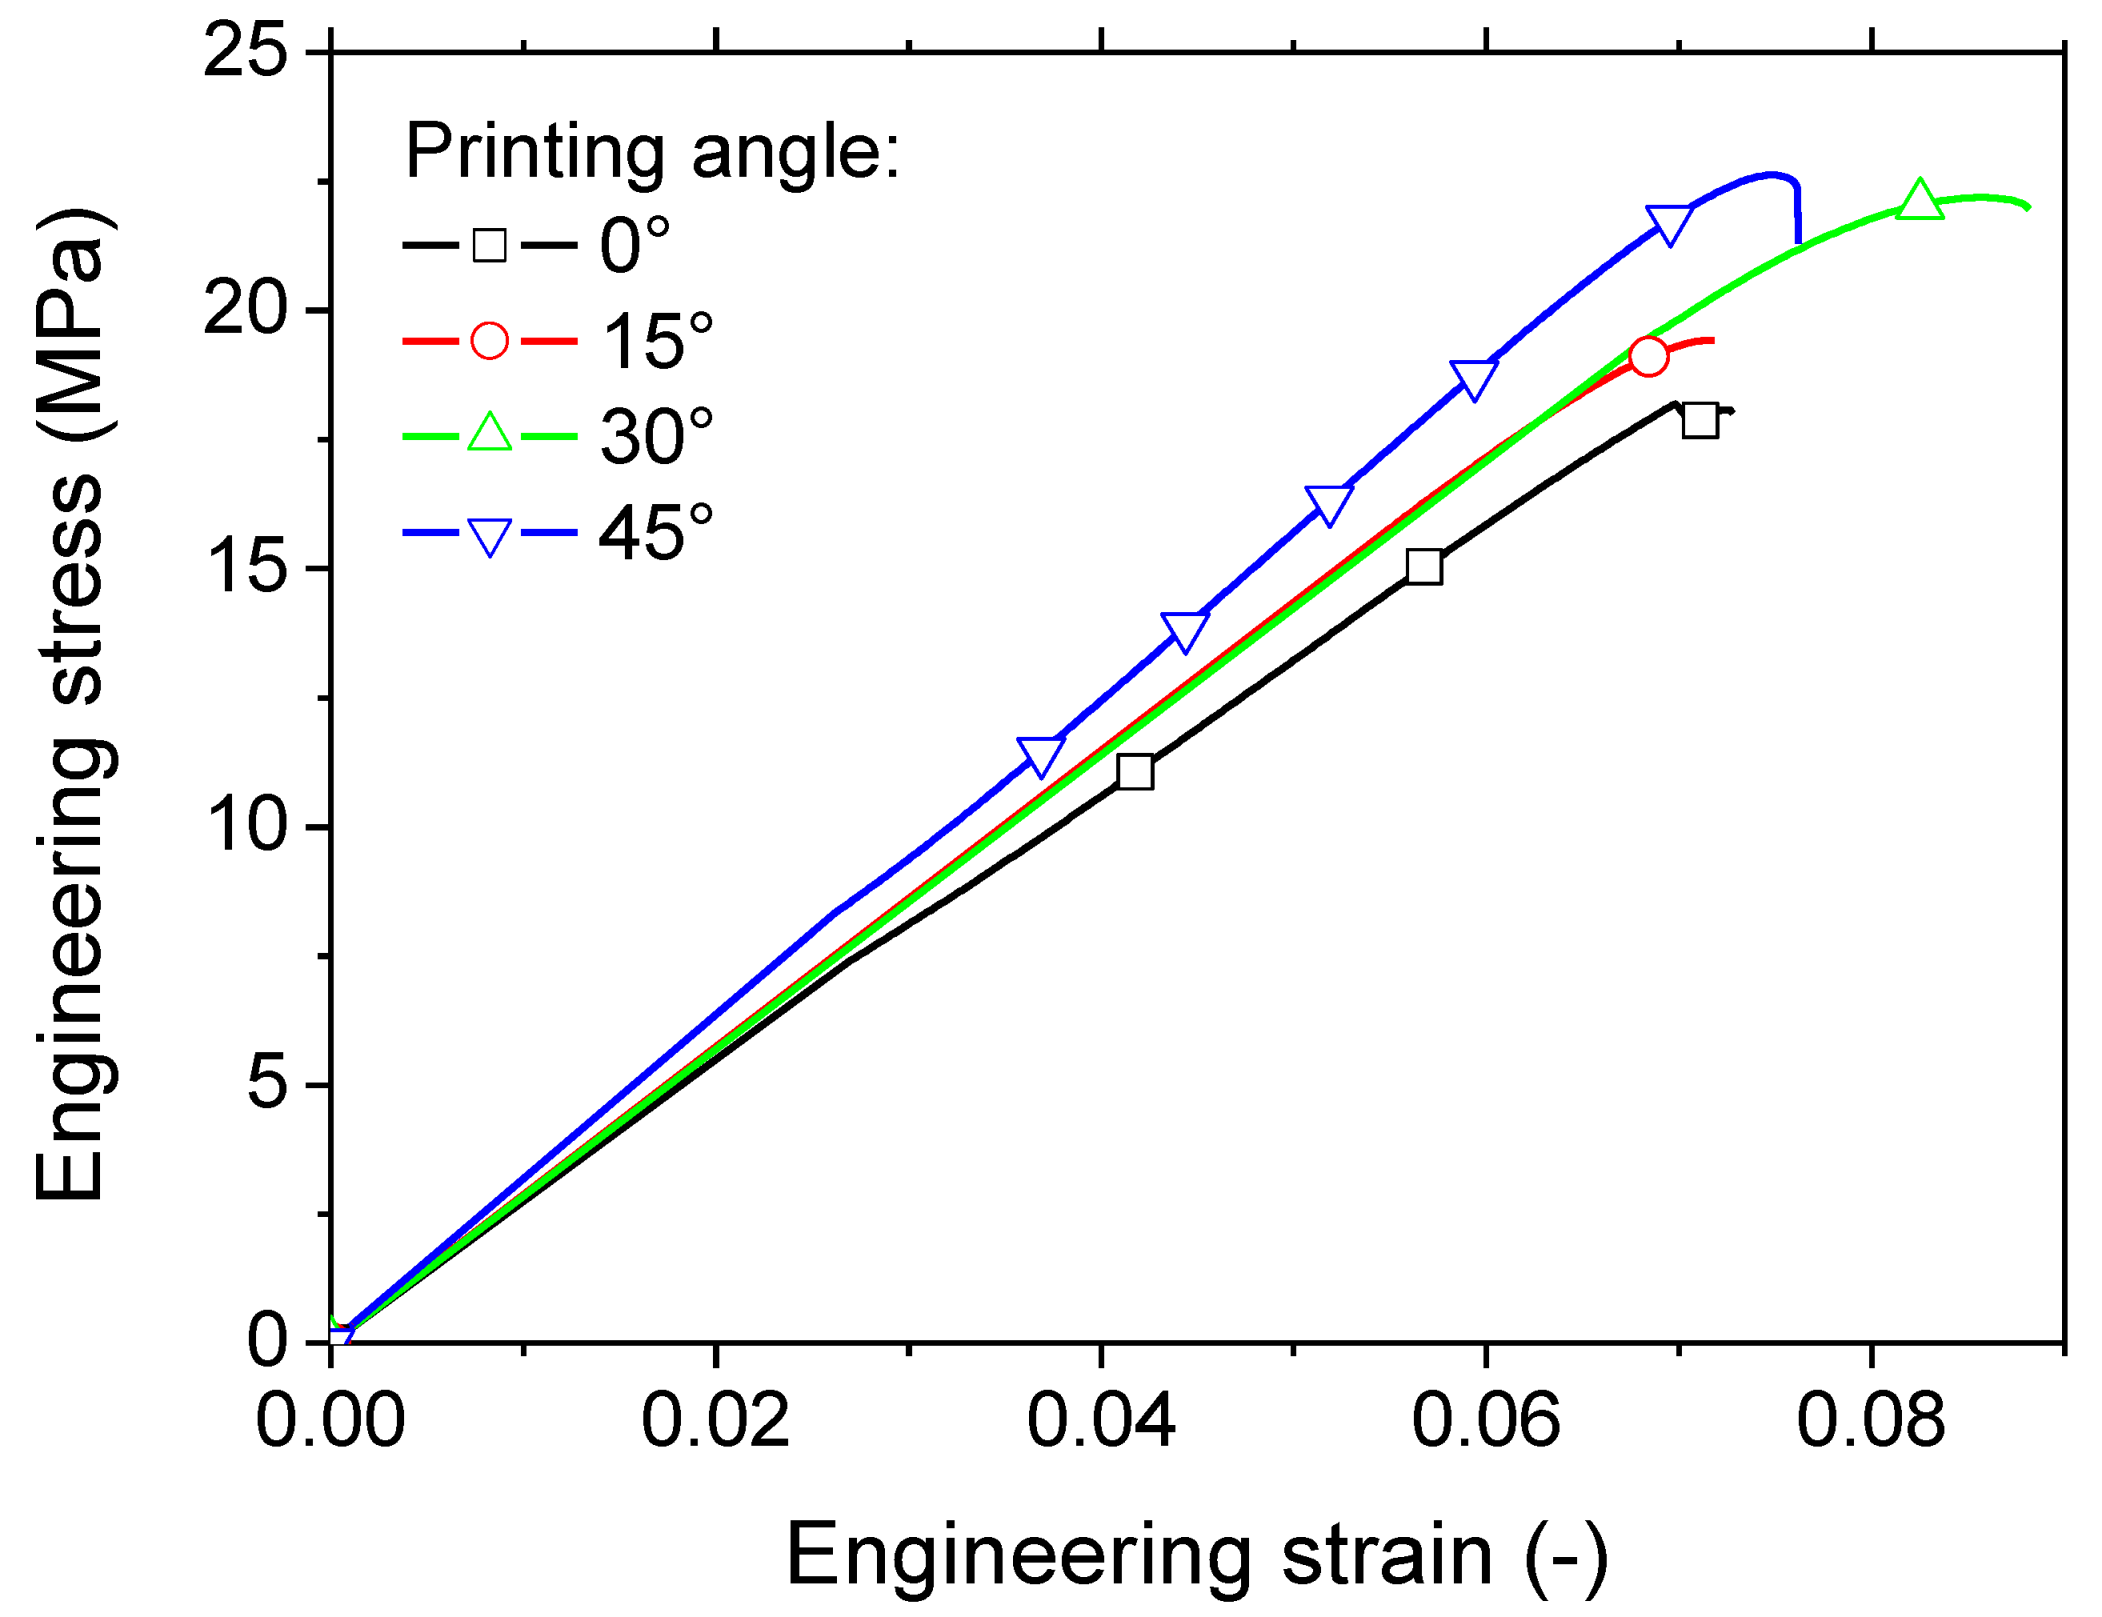
3.3. Mechanical Results

Figure 10 illustrates the tensile response of the as-received PLI filament, with a comparison to the typical tensile response of PLA based on former research results from the authors [42]. The trend captured for as-received PLI filament is typical of all replicates, as suggested by the good repeatability in the tensile behaviour (refer to Table 2 for achieved standard deviation).
The PLI filament displays an elastic–plastic behaviour, characterized by a phenomenon of contraction or constriction before rupture. This constriction is due to the behaviour of the PLA matrix. The tensile response of PLI reveals abrupt drops in tensile force, possibly attributed to interfacial effects, considering the significant dispersion of iron particles and the presence of porosities within the filaments acting as stress concentrators. These two factors combined may induce microcracking or diffuse damage, resulting in sudden changes in force magnitude.
Comparing the performance of PLI to PLA in Figure 10, it is evident that the reinforcement expected from iron particles is not observed due to the lack of mechanical transfer, manifested by the abrupt changes in PLI reaction force during tensile loading.
The stiffness reduction is substantial at 39% when iron particles are added to the PLA filament formulation, assuming no significant differences in the grades of PLA in both filaments. On average, variations in elongation at break and tensile strength of the as-received PLI compared to PLA as-received filament are −6% and −71%, respectively.
Figure 11 illustrates the fracture characteristics of PLI material printed throughout the sample thickness with a printing angle set at 0°. It is worth mentioning that the captured sequence highlights the main stages of deformation, including sample at the largest extension prior to rupture and the snapshot of the ruptured sample. The images are acquired at a faster rate compared to the loading response. So, the same engineering strain levels are depicted at the rupture event, although one is related to the maximum engineering stress prior to rupture and the second corresponds to the complete rupture of the sample. This orientation aligns with a building direction parallel to the sample thickness (horizontal orientation). The image captures the limited extension of the sample before rupture, revealing an overall quasi-brittle behaviour. The cracking process is notably swift, and the accumulation of damage is scarcely discernible.
Within the construction plane defined by the sample width and length, the impact of filament layup becomes evident. In the case of the 0° printing angle (Figure 11a), distinct crack deviation toward −45° is observable, due to a significant shearing. However, the inherent brittleness of the specimen constrains substantial deviation, emphasizing a predominant opening mode. Additionally, besides the cracking behaviour, frame desoldering is noted, stemming from the uniaxial deformation of the filaments composing the external frame—specifically those oriented in the loading direction. The remaining filaments within the raster experience a combination of uniaxial and shearing forces.
When a printing angle of 15° is employed, a comparable cracking behaviour is noted, with the crack deviation now following a lower angle of −30° or 60° (Figure 11b). This alteration in crack deviation aligns with the initial filament orientation within the layup, as depicted in Figure 11b. It is worth noting that a reduced degree of stretching is observed in this scenario when compared to the printing angle of 0°.
Increasing the printing angle further to 30° results in a layup that is closely oriented toward the transverse direction, as illustrated in Figure 11c. This orientation makes it more favourable for transverse cracks to propagate throughout the external frame. Despite this, a noticeable change in the course of the main crack is observed, allowing the fracture to evolve in a mixed mode with two main crack angles: −15° and 75°.
When the printing angle is set at 45° (Figure 11d), there is a significant likelihood of witnessing full unstable transverse cracking due to the presence of discontinuities oriented perpendicularly to the loading direction. In this scenario, cracking occurs predominantly under a full opening mode.
The tensile behaviour of various conditions is further elaborated in Figure 12 through the examination of engineering stress–engineering strain curves. All tested samples demonstrate elastic characteristics with a modest plastic phase. The extent of plasticity is comparatively restrained when compared to the tensile behaviour of the original PLA or PLI filaments. The elastic-like behaviour can be attributed to the porosity induced during the manufacturing process, as discussed in Figure 5, Figure 6 and Figure 7. The incorporation of iron particles, which exhibit percolation trend, appears to have a detrimental effect on the ductility of the 3D-printed PLI.
The 3D-printed composite with a printing angle of 45° is identified as the top performer, enhancing both strength and stiffness while minimising the material’s stretching capacity. This can be elucidated by the significant alignment of filaments in the loading direction, as depicted in Figure 7. A more quantitative evaluation of the impact of the printing angle is summarised in Table 2. Key engineering parameters, such as Young’s modulus (EY), tensile strength (σT), and elongation at break (εR), are derived from the tensile responses of 3D-printed PLI samples.
Stiffness test results unveil a performance decline ranging from −52% for the optimal printing angle (θ = 45°) to −61% for the least favourable one (θ = 0°). Similar trends are observed for strength, displaying a reduction ranging from approximately −55% to −71% depending on the printing condition. The only engineering parameter that remains relatively unchanged is the elongation at break, experiencing only a 3% decrease for a printing angle of 0°. However, this value notably increases to 52% for the superior condition (θ = 45°). The contrast between printing conditions can be interpreted as a trade-off between the enhancement of stiffness and the reduction of elongation at break.
Relative to the decline in mechanical performance compared to filament properties, the density of PLI composites experiences a reduction ranging from 18% to 42%, contingent on the specific printing condition. This decrease is linked to the porosity induced during the manufacturing process.

4. Main Discussion

X-ray microtomography proves to be a robust technique to distinguish between iron second phase, PLA, and voids. Indeed, Figure 5, Figure 6 and Figure 7 demonstrate that the contrast between the phases is significant. Even if the PLI composite has an average density of 1.3 ± 0.22 g/cm3, PLA has a density close to 1.25 g/cm3, while iron density is 7.874 g/cm3. This represents more than five times the density of PLA.
With regards to the analysis of the effect of processing conditions on the 3D microstructure of PLI composites, both Figure 5 and Figure 6 highlight that the microstructure attributes such as the pore connectivity and orientation are closely dependent on the printing angle even if the change is as small as 15°. The analysis of the printed samples with θ = 45° demonstrates a particular anisotropic filament arrangement where half of the filaments are aligned with the loading direction. This means that in the case of a uniaxial loading, load transfer can be modulated between shear and uniaxial tension. This statement is valid when the part orientation is not varied, as in this case. Indeed, as shown by Sood et al. [31], load transfer is more altered when the part is printed vertically, namely when loading direction is aligned with building direction.
It is worth noting a significant difference between density-based and X-ray microtomography-based measurements of porosity. Despite this contrast, both methods exhibit similar trends with an increase in the printing angle. An automatic fitting procedure is applied to compare the result of both methods. The fitting procedure exploits a minimum number of parameters to relate the porosity content to the printing angle using both microstructural evaluation and density measurement results.
In the case of density-based measurement, the following linear correlation is obtained:
f D % = 41.7 0.005 × θ ° ; R 2 = 0.98
For microtomography-based measurement, the linear approximation of porosity content with respect to the printing angle is expressed as:
f T % = 40.9 0.06 × θ ° C ; R 2 = 0.64
This discrepancy can be attributed to two main reasons:
A slight overlap between the grey levels, particularly around the void contours, due to the solid phase and voids, influencing the outcome of image processing.
Density measurements are conducted on the entire sample, while image processing is performed on the central part of the sample. Equations (3) and (4) represent the outcome of the processing conditions considering only one variable, namely the printing angle.
Variability due to the geometry of the sample may affect the difference between X-ray-based and density measurement results, for instance close to the clamping area, where filament trajectory is different from the core of the specimen.
The tensile testing of the PLI filament demonstrates a significant shrinkage in the elongation at break. The notable reduction in elongation at break can be explained by the percolation of iron particles promoting interfacial damage, leading to a reduction in ultimate properties. However, the impact on tensile strength appears to be minor in the presence of iron particles. Similar occurrences of local damage have been observed in other types of PLA composites used as feedstock materials in Fused Filament Fabrication (FFF), such as PLA–wood, PLA–hemp, and PLA–flax fibres [43,44,45].
The 3D-printed PLI composites exhibit a similar behaviour to PLA filaments reinforced with materials sharing a significant contrast in terms of elasticity performance with PLA or when the quality of the interface between the PLA matrix and the reinforcement is weak. This is the case for PLA reinforced with carbon fibres [34] or bio-sourced fillers [33,45]. These filaments share the same effect of filament layup on deformation mechanisms, namely cracking under predominant opening mode due to a specimen’s inherent brittleness. Although a combination of shear and uniaxial deformation is maintained in this case, the limited stretchability does not allow 0° to be the best performing condition. This result contrasts with results achieved for single polymers such as ABS. For instance, Dawoud et al. [46] showed that a printing angle of 0° offers the best tensile strength, while in the present case, the optimal printing angle seems to be 45°. In terms of overall effect of process-induced porosity on the tensile performance of PLI, the present results confirm the leading role of process-induced porosity as shown in the review work of Tao et al. [47]. However, this effect does not discriminate between the printing angles and, in turn, can only explain the tendencies with respect to tensile strength and stiffness if the relative orientation of these porosities with respect to the loading direction is considered.

5. Conclusions

The research findings highlight that PLA/iron composite produced via fused filament fabrication exhibits reduced ductility compared to the original filament, regardless of processing conditions. X-ray microtomography results allowed a sufficient contrast to quantify iron, void contents, and distributions within the 3D-printed PLA/iron composite. This technique allowed the determination of an iron content of 19%, the formation of two distinct types of porosities at varying length scales. The porosity level of 24% is reached within the filament, while it ranges from 37% to 41% across the filament, depending on the printing conditions.
This study also concludes that, similarly to most composite filaments reinforced with secondary-phase particles, the PLA/iron filament experiences a significant decrease in stiffness (approximately 39%) compared to pure PLA filament, while maintaining a suitable tensile strength at 51 MPa. This allows control of magnetic actuation more easily based on a reduced stiffness to maximum displacement ratio. The porosity introduced during printing substantially reduces both stiffness and tensile strength, reaching levels as low as 259 MPa and 15 MPa, respectively. Moreover, the printing angle, the main processing condition studied, has a secondary effect on adjusting these engineering constants. A 45° printing angle, aligning half of the filaments with the loading direction, yields the highest tensile performance, and significant modulation of cracking behaviour is observed across the entire range of printing angles. However, the limited elongation at break limits the largest extension possible under elasticity behaviour for magnetic actuation, leaving more space for consideration of other printing parameters as key control of magnetic actuation. A parameter under consideration is the infill ratio, thought to prompt nonlinear yet controlled stretchability in iron/PLA composites. This aspect will be explored in future research endeavours.

Author Contributions

Conceptualization, S.G. and S.B.; methodology, S.G. and S.B.; software, S.G. and S.B.; validation, S.G.; formal analysis, S.G. and S.B.; investigation, S.G. and S.B.; resources, S.G. and S.B.; data curation, S.G. and S.B.; writing—original draft, S.G.; writing—review and editing, S.B. All authors have read and agreed to the published version of the manuscript.

Funding

This research received no external funding.

Data Availability Statement

Data are contained within the article.

Conflicts of Interest

The authors declare no conflicts of interest.

References

  1. Prathyusha, A.L.R.; Raghu Babu, G. A review on additive manufacturing and topology optimization process for weight reduction studies in various industrial applications. Mater. Today Proc. 2022, 62, 109–117. [Google Scholar] [CrossRef]
  2. Praveena, B.A.; Lokesh, N.; Buradi, A.; Santhosh, N.; Praveena, B.L.; Vignesh, R. A comprehensive review of emerging additive manufacturing (3D printing technology): Methods, materials, applications, challenges, trends and future potential. Mater. Today Proc. 2022, 52, 1309–1313. [Google Scholar]
  3. Guessasma, S.; Zhang, W.; Zhu, J.; Belhabib, S.; Nouri, H. Challenges of additive manufacturing technologies from an optimisation perspective. Int. J. Simul. Multidiscip. Des. Optim. 2016, 6, A9. [Google Scholar] [CrossRef]
  4. Rasiya, G.; Shukla, A.; Saran, K. Additive manufacturing-a review. Mater. Today Proc. 2021, 47, 6896–6901. [Google Scholar] [CrossRef]
  5. Beaman, J.J.; Bourell, D.L.; Seepersad, C.C.; Kovar, D. Additive manufacturing review: Early past to current practice. J. Manuf. Sci. Eng. 2020, 142, 110812. [Google Scholar] [CrossRef]
  6. Conner, B.P.; Manogharan, G.P.; Martof, A.N.; Rodomsky, L.M.; Rodomsky, C.M.; Jordan, D.C.; Limperos, J.W. Making sense of 3-d printing: Creating a map of additive manufacturing products and services. Addit. Manuf. 2014, 1–4, 64–76. [Google Scholar] [CrossRef]
  7. Zhang, A.; Wang, F.; Chen, L.; Wei, X.; Xue, M.; Yang, F.; Jiang, S. 3D printing hydrogels for actuators: A review. Chin. Chem. Lett. 2021, 32, 2923–2932. [Google Scholar] [CrossRef]
  8. Germaini, M.-M.; Belhabib, S.; Guessasma, S.; Deterre, R.; Corre, P.; Weiss, P. Additive manufacturing of biomaterials for bone tissue engineering—A critical review of the state of the art and new concepts. Prog. Mater. Sci. 2022, 130, 100963. [Google Scholar] [CrossRef]
  9. Monteiro, H.; Carmona-Aparicio, G.; Lei, I.; Despeisse, M. Energy and material efficiency strategies enabled by metal additive manufacturing—A review for the aeronautic and aerospace sectors. Energy Rep. 2022, 8, 298–305. [Google Scholar] [CrossRef]
  10. Siacor, F.D.C.; Chen, Q.; Zhao, J.Y.; Han, L.; Valino, A.D.; Taboada, E.B.; Caldona, E.B.; Advincula, R.C. On the additive manufacturing (3D printing) of viscoelastic materials and flow behavior: From composites to food manufacturing. Addit. Manuf. 2021, 45, 102043. [Google Scholar] [CrossRef]
  11. Wiese, M.; Kwauka, A.; Thiede, S.; Herrmann, C. Economic assessment for additive manufacturing of automotive end-use parts through digital light processing (dlp). CIRP J. Manuf. Sci. Technol. 2021, 35, 268–280. [Google Scholar] [CrossRef]
  12. Dörfler, K.; Dielemans, G.; Lachmayer, L.; Recker, T.; Raatz, A.; Lowke, D.; Gerke, M. Additive manufacturing using mobile robots: Opportunities and challenges for building construction. Cem. Concr. Res. 2022, 158, 106772. [Google Scholar] [CrossRef]
  13. Jadhav, A.; Jadhav, V.S. A review on 3D printing: An additive manufacturing technology. Mater. Today Proc. 2022, 62, 2094–2099. [Google Scholar] [CrossRef]
  14. Mohd Pu’ad, N.A.S.; Abdul Haq, R.H.; Mohd Noh, H.; Abdullah, H.Z.; Idris, M.I.; Lee, T.C. Review on the fabrication of fused deposition modelling (fdm) composite filament for biomedical applications. Mater. Today Proc. 2020, 29, 228–232. [Google Scholar] [CrossRef]
  15. Al-Ghamdi, K.A. Sustainable fdm additive manufacturing of abs components with emphasis on energy minimized and time efficient lightweight construction. Int. J. Lightweight Mater. Manuf. 2019, 2, 338–345. [Google Scholar] [CrossRef]
  16. Subramaniam, S.R.; Samykano, M.; Selvamani, S.K.; Ngui, W.K.; Kadirgama, K.; Sudhakar, K.; Idris, M.S. 3D printing: Overview of pla progress. AIP Conf. Proc. 2019, 2059, 020015. [Google Scholar] [CrossRef]
  17. Ahn, S.H.; Montero, M.; Odell, D.; Roundy, S.; Wright, P.K. Anisotropic material properties of fused deposition modeling abs. Rapid Prototyp. J. 2002, 8, 248–257. [Google Scholar] [CrossRef]
  18. Wickramasinghe, S.; Do, T.; Tran, P. Fdm-based 3D printing of polymer and associated composite: A review on mechanical properties, defects and treatments. Polymers 2020, 12, 1529. [Google Scholar] [CrossRef] [PubMed]
  19. Sun, J.; Ye, D.; Zou, J.; Chen, X.; Wang, Y.; Yuan, J.; Liang, H.; Qu, H.; Binner, J.; Bai, J. A review on additive manufacturing of ceramic matrix composites. J. Mater. Sci. Technol. 2022, 38, 1–16. [Google Scholar] [CrossRef]
  20. Valvez, S.; Santos, P.; Parente, J.M.; Silva, M.P.; Reis, P.N.B. 3D printed continuous carbon fiber reinforced pla composites: A short review. Procedia Struct. Integr. 2020, 25, 394–399. [Google Scholar] [CrossRef]
  21. Valino, A.D.; Dizon, J.R.C.; Espera, A.H.; Chen, Q.; Messman, J.; Advincula, R.C. Advances in 3D printing of thermoplastic polymer composites and nanocomposites. Prog. Polym. Sci. 2019, 98, 101162. [Google Scholar] [CrossRef]
  22. Raju, R.; Manikandan, N.; Binoj, J.S.; Palanisamy, D.; Arulkirubakaran, D.; Thejasree, P.; Pavan Kalyan, A.; Subhash Reddy, G. Optimization and performance evaluation of pla polymer material in situ carbon particles on structural properties. Mater. Today Proc. 2021, 39, 223–229. [Google Scholar] [CrossRef]
  23. Buj-Corral, I.; Sivatte-Adroer, M. An experimental investigation about the dimensional accuracy and the porosity of copper-filled pla fused filament fabrication parts. Metals 2023, 13, 1608. [Google Scholar] [CrossRef]
  24. Martinez, L.; Palessonga, D.; Roquefort, P.; Chevalier, A.; Maalouf, A.; Ville, J.; Laur, V. Development of a high temperature printable composite for microwave absorption applications. AIMS Mater. Sci. 2021, 8, 739–747. [Google Scholar] [CrossRef]
  25. Török, J.; Törökova, M.; Duplakova, D.; Murcinkova, Z.; Duplak, J.; Kascak, J.; Karkova, M. Advanced configuration parameters of post processor influencing tensile testing pla and add-mixtures in polymer matrix in the process of fdm technology. Appl. Sci. 2021, 11, 6212. [Google Scholar] [CrossRef]
  26. Buchanan, R.; Kumar Dasari, J.; Fidan, I.; Allen, M.; Bhattacharya, I. Knowledge base development for mechanical properties and energy consumption of iron-pla composite filaments in additive manufacturing. In Proceedings of the 2022 International Solid Freeform Fabrication Symposium, Austin, TX, USA, 25–27 July 2022; pp. 183–205. [Google Scholar]
  27. Kumar, J.; Huseynov, O.; Fidan, I.; Rajabali, M. Developing additively manufactured iron powder-filled pla composites. In Proceedings of the 34th Annual International Solid Freeform Fabrication Symposium—An Additive Manufacturing Conference, Austin, TX, USA, 14–16 August 2022; pp. 204–225. [Google Scholar]
  28. Moradi, M.; Lalegani Dezaki, M.; Kheyri, E.; Rasouli, S.A.; Aghaee Attar, M.; Bodaghi, M. Simultaneous fdm 4d printing and magnetizing of iron-filled polylactic acid polymers. J. Magn. Magn. Mater. 2023, 568, 170425. [Google Scholar] [CrossRef]
  29. Mohd Jani, J.; Leary, M.; Subic, A.; Gibson, M.A. A review of shape memory alloy research, applications and opportunities. Mater. Des. 2014, 56, 1078–1113. [Google Scholar] [CrossRef]
  30. Reyssat, E.; Mahadevan, L. Hygromorphs: From pine cones to biomimetic bilayers. J. R. Soc. Interface 2009, 6, 951–957. [Google Scholar] [CrossRef] [PubMed]
  31. Sood, A.K.; Ohdar, R.K.; Mahapatra, S.S. Parametric appraisal of mechanical property of fused deposition modelling processed parts. Mater. Des. 2010, 31, 287–295. [Google Scholar] [CrossRef]
  32. Frunzaverde, D.; Cojocaru, V.; Ciubotariu, C.-R.; Miclosina, C.-O.; Ardeljan, D.D.; Ignat, E.F.; Marginean, G. The influence of the printing temperature and the filament color on the dimensional accuracy, tensile strength, and friction performance of fff-printed pla specimens. Polymers 2022, 14, 1978. [Google Scholar] [CrossRef]
  33. Guessasma, S.; Belhabib, S.; Nouri, H. Understanding the microstructural role of bio-sourced 3D printed structures on the tensile performance. Polym. Test. 2019, 77, 105924. [Google Scholar] [CrossRef]
  34. Guessasma, S.; Belhabib, S. Infill strategy in 3D printed pla carbon composites: Effect on tensile performance. Polymers 2022, 14, 4221. [Google Scholar] [CrossRef]
  35. Markl, D.; Zeitler, J.A.; Rasch, C.; Michaelsen, M.H.; Müllertz, A.; Rantanen, J.; Rades, T.; Bøtker, J. Analysis of 3D prints by x-ray computed microtomography and terahertz pulsed imaging. Pharm. Res. 2016, 34, 1037–1052. [Google Scholar] [CrossRef]
  36. Guessasma, S.; Nouri, H.; Roger, F. Microstructural and mechanical implications of microscaled assembly in droplet-based multi-material additive manufacturing. Polymers 2017, 9, 372. [Google Scholar] [CrossRef]
  37. Shin, S.; Kim, M.W.; Jin, K.H.; Yi, K.M.; Kohmura, Y.; Ishikawa, T.; Je, J.H.; Park, J. Deep 3D reconstruction of synchrotron x-ray computed tomography for intact lungs. Sci. Rep. 2023, 13, 1738. [Google Scholar] [CrossRef]
  38. Ayadi, A.; Nouri, H.; Guessasma, S.; Roger, F. Large-scale x-ray microtomography analysis of fiber orientation in weld line of short glass fiber reinforced thermoplastic and related elasticity behavior. Macromol. Mater. Eng. 2016, 301, 907–921. [Google Scholar] [CrossRef]
  39. Swolfs, Y.; Morton, H.; Scott, A.E.; Gorbatikh, L.; Reed, P.A.S.; Sinclair, I.; Spearing, S.M.; Verpoest, I. Synchrotron radiation computed tomography for experimental validation of a tensile strength model for unidirectional fibre-reinforced composites. Compos. Part A Appl. Sci. Manuf. 2015, 77, 106–113. [Google Scholar] [CrossRef]
  40. ISO 527-1:2019; Plastics Determination of tensile properties Part 1: General principles. ISO: Geneva, Switzerland, 2019.
  41. Guessasma, S.; Belhabib, S.; Nouri, H.; Ben Hassana, O. Anisotropic damage inferred to 3D printed polymers using fused deposition modelling and subject to severe compression. Eur. Polym. J. 2016, 85, 324–340. [Google Scholar] [CrossRef]
  42. Guessasma, S.; Belhabib, S.; Altin, A. On the tensile behaviour of bio-sourced 3D-printed structures from a microstructural perspective. Polymers 2020, 12, 1060. [Google Scholar] [CrossRef]
  43. Bhagia, S.; Bornani, K.; Agrawal, R.; Satlewal, A.; Ďurkovič, J.; Lagaňa, R.; Bhagia, M.; Yoo, C.G.; Zhao, X.; Kunc, V.; et al. Critical review of fdm 3D printing of pla biocomposites filled with biomass resources, characterization, biodegradability, upcycling and opportunities for biorefineries. Appl. Mater. Today 2021, 24, 101078. [Google Scholar] [CrossRef]
  44. Kariz, M.; Sernek, M.; Obućina, M.; Kuzman, M.K. Effect of wood content in fdm filament on properties of 3D printed parts. Mater. Today Commun. 2018, 14, 135–140. [Google Scholar] [CrossRef]
  45. Guessasma, S.; Belhabib, S.; Nouri, H. Microstructure and mechanical performance of 3D printed wood-pla/pha using fused deposition modelling: Effect of printing temperature. Polymers 2019, 11, 1778. [Google Scholar] [CrossRef] [PubMed]
  46. Dawoud, M.; Taha, I.; Ebeid, S.J. Mechanical behaviour of abs: An experimental study using fdm and injection moulding techniques. J. Manuf. Process. 2016, 21, 39–45. [Google Scholar] [CrossRef]
  47. Tao, Y.; Kong, F.; Li, Z.; Zhang, J.; Zhao, X.; Yin, Q.; Xing, D.; Li, P. A review on voids of 3D printed parts by fused filament fabrication. J. Mater. Res. Technol. 2021, 15, 4860–4879. [Google Scholar] [CrossRef]
Figure 1. Overview of the printing process showing the selected process parameter, namely the printing angle (θ). The printing angle is the angle between Cartesian axes attached to the printer (X’, Y’) and the sample (X, Y).
Jmmp 08 00065 g001
Figure 2. Overview of the sample geometry and testing protocol. (a) Slicing view of the PLA/iron (PLI) composite geometry, (b) tensile testing of as-received PLI filaments and 3D-printed PLI composites under optical recording.
Jmmp 08 00065 g002aJmmp 08 00065 g002b
Figure 3. X-ray microtomography setup at BM05 beam line (Synchrotron radiation facility ESRF).
Jmmp 08 00065 g003
Figure 4. X-ray microtomography results related to as-received PLI filament prior to the printing process. (a) Orthogonal views underlying the ultrastructure of PLI composite filament, (b) 3D view of the iron particle distribution; (c) 3D view of the porous structure.
Jmmp 08 00065 g004
Figure 5. X-ray microtomography results. (a) Orthogonal views underlying the microstructure of 3D-printed PLI composite for a printing angle of 0° (θ = 0°-sample PLI_00), (b) 3D view of the porous structure.
Jmmp 08 00065 g005aJmmp 08 00065 g005b
Figure 6. X-ray microtomography results. (a) Orthogonal views underlying the microstructure of 3D-printed PLI composite for a printing angle of 15° (θ = 15°-sample PLI_15), (b) 3D view of the porous structure.
Jmmp 08 00065 g006
Figure 7. X-ray microtomography results: Comparison between orthogonal views underlying the microstructure of 3D-printed PLI composites as a function of the printing angle (a) θ = 30°, (b) θ = 45°.
Jmmp 08 00065 g007
Figure 8. Profiles depicting axial porosity levels as a function of the printing angle and along (a) the length, (b) construction (depth) direction, and (c) width direction.
Jmmp 08 00065 g008aJmmp 08 00065 g008b
Figure 9. Zoom-in on main features within the PLI filament. (a) porous structure, (b) pore size distribution, (c) iron particles volume content profiles, (d) volume content of iron particles determination within the PLI filament, (e) connectivity of iron particles within PLI filament.
Jmmp 08 00065 g009aJmmp 08 00065 g009bJmmp 08 00065 g009c
Figure 10. Tensile response of PLI filament compared to PLA.
Jmmp 08 00065 g010
Figure 11. Optical recording of deformation sequences for all PLI 3D-printed samples in relation to the printing angle: (a) θ = 0°, (b) θ = 15°, (c) θ = 30°, (d) θ = 45°.
Jmmp 08 00065 g011aJmmp 08 00065 g011b
Figure 12. Tensile performance of PLI composites as a function of the printing angle.
Jmmp 08 00065 g012
Table 1. Summary of the main printing parameters. θ: printing angle; ϕ: nozzle diameter; h: layer height; v: printing speed; TP: bed temperature; TB: bed temperature.
Sampleθ (°)ϕ (mm)h (mm)v (mm/s)TP (°C)TB (°C)
PLI_0000.40.23021060
PLI_15150.40.23021060
PLI_30300.40.23021060
PLI_45450.40.23021060
Table 2. The mechanical characteristics of a 3D-printed PLI composite in relation to the printing angle. ρ: density, f: porosity level, EY: Young’s modulus, σT: tensile strength, εR: elongation at break based on engineering strain.
Materialθ (°)ρ (g/cm3)f * (%)EY (MPa)σT (MPa)εR (-)
PLA as received-1.24 ± 0.0001092 ± 13654.0 ± 0.00.55 ± 0.18
PLI as received-1.85 ± 0.0023.6 ± 4.2672 ± 3751.1 ± 0.80.16 ± 0.01
PLI_0001.07 ± 0.2540.4 ± 0.4259 ± 014.8 ± 4.80.15 ± 0.03
PLI_15151.25 ± 0.0041.1 ± 0.5286 ± 019.4 ± 0.00.07 ± 0.00
PLI_30301.34 ± 0.1337.4 ± 1.1284 ± 2620.4 ± 2.60.07 ± 0.02
PLI_45451.52 ± 0.1237.7 ± 0.6321 ± 522.7± 0.10.08 ± 0.00
* The porosity level measured in the entire acquired volume.
Disclaimer/Publisher’s Note: The statements, opinions and data contained in all publications are solely those of the individual author(s) and contributor(s) and not of MDPI and/or the editor(s). MDPI and/or the editor(s) disclaim responsibility for any injury to people or property resulting from any ideas, methods, instructions or products referred to in the content.

