
Study of Tailored Hot Stamping Process on Advanced High-Strength Steels

Department of Mechanical Engineering, Mathematics & Management Engineering, Politecnico of Bari, Via Orabona, 4, 70125 Bari, Italy
*
Author to whom correspondence should be addressed.
J. Manuf. Mater. Process. 2022, 6(1), 11; https://doi.org/10.3390/jmmp6010011
Submission received: 4 December 2021
/
Revised: 12 January 2022
/
Accepted: 14 January 2022
/
Published: 18 January 2022
Abstract
:Ultra-high-strength steels (UHSS) combined with tailor-stamping technologies are increasingly being adopted in automotive body production due to crashworthiness improvements and part weight reduction, which meet safety and energy saving demands. Recently, USIBOR®2000 (37MnB5) steel has been added to the family of UHSS. This new material allows higher performance with respect to its predecessor USIBOR®1500 (22MnB5). In this work, the two steels are compared for the manufacturing of an automotive B-Pillar by press-hardening with a tailored tool tempering approach. A Finite Element (FE) model has been developed for the numerical simulation of thermomechanical cycles of the press-hardening process. The FE-simulations have been performed with the aim of obtaining soft zones in the part, by varying the quenching time and the temperature of heated tools. The effects of these parameters on the mechanical properties of the part have been experimentally evaluated thanks to hardness and tensile tests performed on specimens subjected to the numerical thermo-mechanical cycles using the Geeble-3180 physical simulator. The results show that for both UHSS, an increase in quenching time leads to a decrease in hardness up to a threshold value, which is lower for the USIBOR®1500. Moreover, higher mechanical resistance and lower elongation at break values are derived for the USIBOR®2000 steel than for USIBOR®1500 steel.
1. Introduction
Automotive components design include crashworthiness and high strength to weight ratio requirements, in order to meet safety and energy-saving demands. For these needs, several ultra-high-strength steels (UHSS) as well as tailor stamping technologies were developed, allowing the production of parts with soft and high-strength zones. Compared to light alloys parts, these solutions have lower cost and higher ultimate tensile strength; they are, therefore, used in anti-intrusion applications for automotive structures that must guarantee performance in terms of high resistance and toughness.
One of the most used steels in the automotive field, especially for the design of body-in-white components, is the quenchable boron steel 22MnB5, commercialized by ArcelorMittal steelmaker as USIBOR®1500, which after hot stamping has an ultimate tensile strength equal to 1500 MPa and an elongation break equal to 7%. USIBOR®2000 steel has recently been proposed, which, thanks to a higher carbon content, guarantees an ultimate tensile strength up to 2000 MPa and an elongation break at least of 5–6%. Compared with existing hot stamping solutions, 10 to 15 percent weight saving is obtained.
Recent studies focus on the mechanical and technological properties comparison between USIBOR®2000 steel and the predecessor, USIBOR®1500. G. Huang et al. [1] characterized the elongation of these two steels in various stress states to build the fracture locus. R. Valentini et al. [2] carried out permeation tests to characterize the two press-hardened steels to establish a correlation between ultimate tensile strength and critical hydrogen concentration. T. Taylor et al. [3] compared the performance of the hot stamping process of the two steels showing that USIBOR®2000 has a yield strength up to 1400 MPa and an ultimate tensile strength up to 2000 MPa.
The press-hardening process of a quenchable steel is a thermo-mechanical sheet metal-forming process in which the blank is heated to austenitization temperature, and forming occurs with the steel is in an austenite state and then the subsequent quenching in the forming tools allows a martensite microstructure [4]. An improvement of USIBOR®2000 steel mechanical properties was observed using the press-hardening process. Therefore, recent works are studying how the percentage of alloying elements modify the tensile strength and the phase transition [5]. T. Taylor and John McCulloch [6] studied the effects of part boundary conditions on microstructural evolution during the press-hardening process.
Current industrial and academic research is giving considerable attention to improving the process, to produce parts with locally varying mechanical properties (tailored properties) [7]. However, to the best of the authors’ knowledge, the bibliography regarding the use of this new grade of steel for tailored applications involving a microstructural change is lacking. There are two categories of tailored technologies: tailored blank technologies in which different sheet steels or different sheet thick are exploited to produce different mechanical (or structural) properties, and tailored process technologies in which different heat treatment within the hot-stamping process are exploited to produce different microstructures and mechanical properties from a single sheet steel. The following technologies belong to the first category: tailor-welded blank (TWB), tailor-rolled blank (TRB) and patchwork blank (PB), while the tailored blank heating (TBH) and tailored tool tempering (TTT) technologies belong to the second category.
Tailored blank technologies increase the production costs; moreover, different local blank thickness can complicate blank heating as well as quenching of the formed part, as regions of different gauges heat and cool at different rates, as demonstrated by [8,9] for tailor-welded blank and patchwork blank technologies. TBH and TTT technologies are more feasible to obtain a tailored part. Tailored blank heating involves heating some regions of the blank above the Ac3 temperature and thus obtaining a fully austenitic microstructure, while other regions are maintained at temperatures below Ac3, gaining a ferritic–austenitic microstructure. In this way, during the quenching of the formed part, regions in austenite state have higher strength due to the martensitic transformation. The partially austenitized regions, on the other hand, have greater ductility due to the ferritic-martensitic microstructure. To achieve press-hardening with a TBH approach, the only industrially practiced method is shielding with ceramic or stainless steel masks. However, recent research is trying to find alternative methods such as ovens with several parallel chambers (separated by an insulating wall) [10].
In the press-hardening with TTT approach, the blank is heated above the Ac3 temperature, while formed part regions are differently cooled in the quenching phase. Tools adjacent to regions required with higher strength (strength area of the part) must have lower temperature allowing martensitic transformation, while tools adjacent to regions with greater ductility (ductile area of the part) are maintained at a higher temperature to favor bainitic transformation during the quenching phase. In particular, cartridge heaters are inserted in tools to obtain a bainitic microstructure, while cooling channels are placed in tools to obtain a martensitic microstructure.
Press-hardening is a thermo-mechanical forming process, which also includes steel phase transformations. To support the process design phase, in recent years, several thermo-mechanical-metallurgical Finite Element (FE) software have been developed. These software, which need material data such as hardening curves, Forming Limit Curves (FLC) and continuous cooling transformation phase diagram (CCT), allow the investigation of part formability as well as the time evolution of material hardness and microstructure. In this work, the press-hardening with TTT approach is chosen to investigate differences between USIBOR®1500 and USIBOR®2000 in the manufacturing of an automotive B-Pillar. Using the commercial FE software AutoForm R8, a FE model has been developed with the aim to obtain thermo-mechanical cycles imposed in the part area where greater ductility is required, by varying process parameters of the quenching phase (in particular the quenching time and the temperature of the heated tools). In the AutoForm R8 material library, only data on USIBOR®1500 steel are available. The hardening curves of USIBOR®2000 steel in the austenite state have been modelled by performing a tensile test with the Gleeble-3180 system at different temperatures and strain rates. Using the Gleeble system, thermo-mechanical cycles obtained by FE simulation on USIBOR®1500 and USIBOR®2000 steel specimens have been then physically simulated.
After physical simulation tests, specimens have been subjected to hardness tests, tensile tests and metallographic analysis. Tensile tests have been supported by the Aramis 3D system to evaluate the elongation at break in the specimen center, where thermo-mechanical cycle has been imposed in each physical simulation test.
Varying the temperature of the heated tools in the range of 430–500 °C, the obtained results show that hardness of the ductile area of the part is about 50–60% of that of strength area, with a local elongation at break of about 30–40% for USIBOR®1500 steel and 23–26% for USIBOR®2000 steel. The comparison in terms of quenching time shows that the press-hardening process with a tailored tool tempering approach is very attractive for the industrial manufacturing of parts in USIBOR®1500 steel (quenching times in the range of 5–20 s). The more hardenability of USIBOR®2000 steel suggests better performance when tailored blank heating approach is adopted.
2. Materials and Methods
Because of its mechanical strength after the hot stamping process, this new generation of UHSS is well suited for an entire range of structural parts. Table 1 and Table 2 show the chemical composition and the mechanical properties of the USIBOR®2000 and USIBOR®1500 steel, respectively.
In the paper, these two materials are compared in the application of press-hardening with TTT approach. In particular, the study focuses on the analysis of mechanical properties of the ductile area of a B-Pillar used as a case study. The adopted methodology is described in the following points:
- i.
- Design on the Gleeble-3180 physical simulator of an experimental procedure for the high-temperature mechanical characterization of USIBOR®2000 steel and for the physical simulation of thermomechanical cycles on USIBOR®1500 and USIBOR®2000 steel specimens; thermomechanical cycles are those imposed in the B-Pillar during the TTT-press-hardening process simulation. The procedure has been initially implemented for the definition of the hardening curves of USIBOR®2000 steel; the mechanical characterization has been carried out with the material in austenitic phase, varying testing temperatures (750 °C, 800 °C, 850 °C) and strain rates (0.01/s, 0.1/s, 1/s).
- ii.
- Definition of thermomechanical cycles through numerical simulation. Using the commercial software AutoForm R8, a FE model has been developed to simulate the TTT-press-hardening process of the B-Pillar. The model has been implemented using data from both USIBOR®1500 and USIBOR® 2000 steels. A simulation plan has been carried out for each steel by varying process parameters of the quenching phase (in particular, the quenching time and the temperature of the heated tools). Finally, a post-processing phase has been designed to obtain, from the simulation results, the thermomechanical cycles in a specific area of the B-Pillar.
- iii.
- Post-forming characterization. Thermomechanical cycles have been physically simulated on USIBOR®2000 and USIBOR®1500 steel specimens. These specimens have been then analyzed through hardness tests. Finally, the process conditions with minimum hardness have been investigated performing tensile tests, while metallographic observations have been carried out to verify the results obtained.
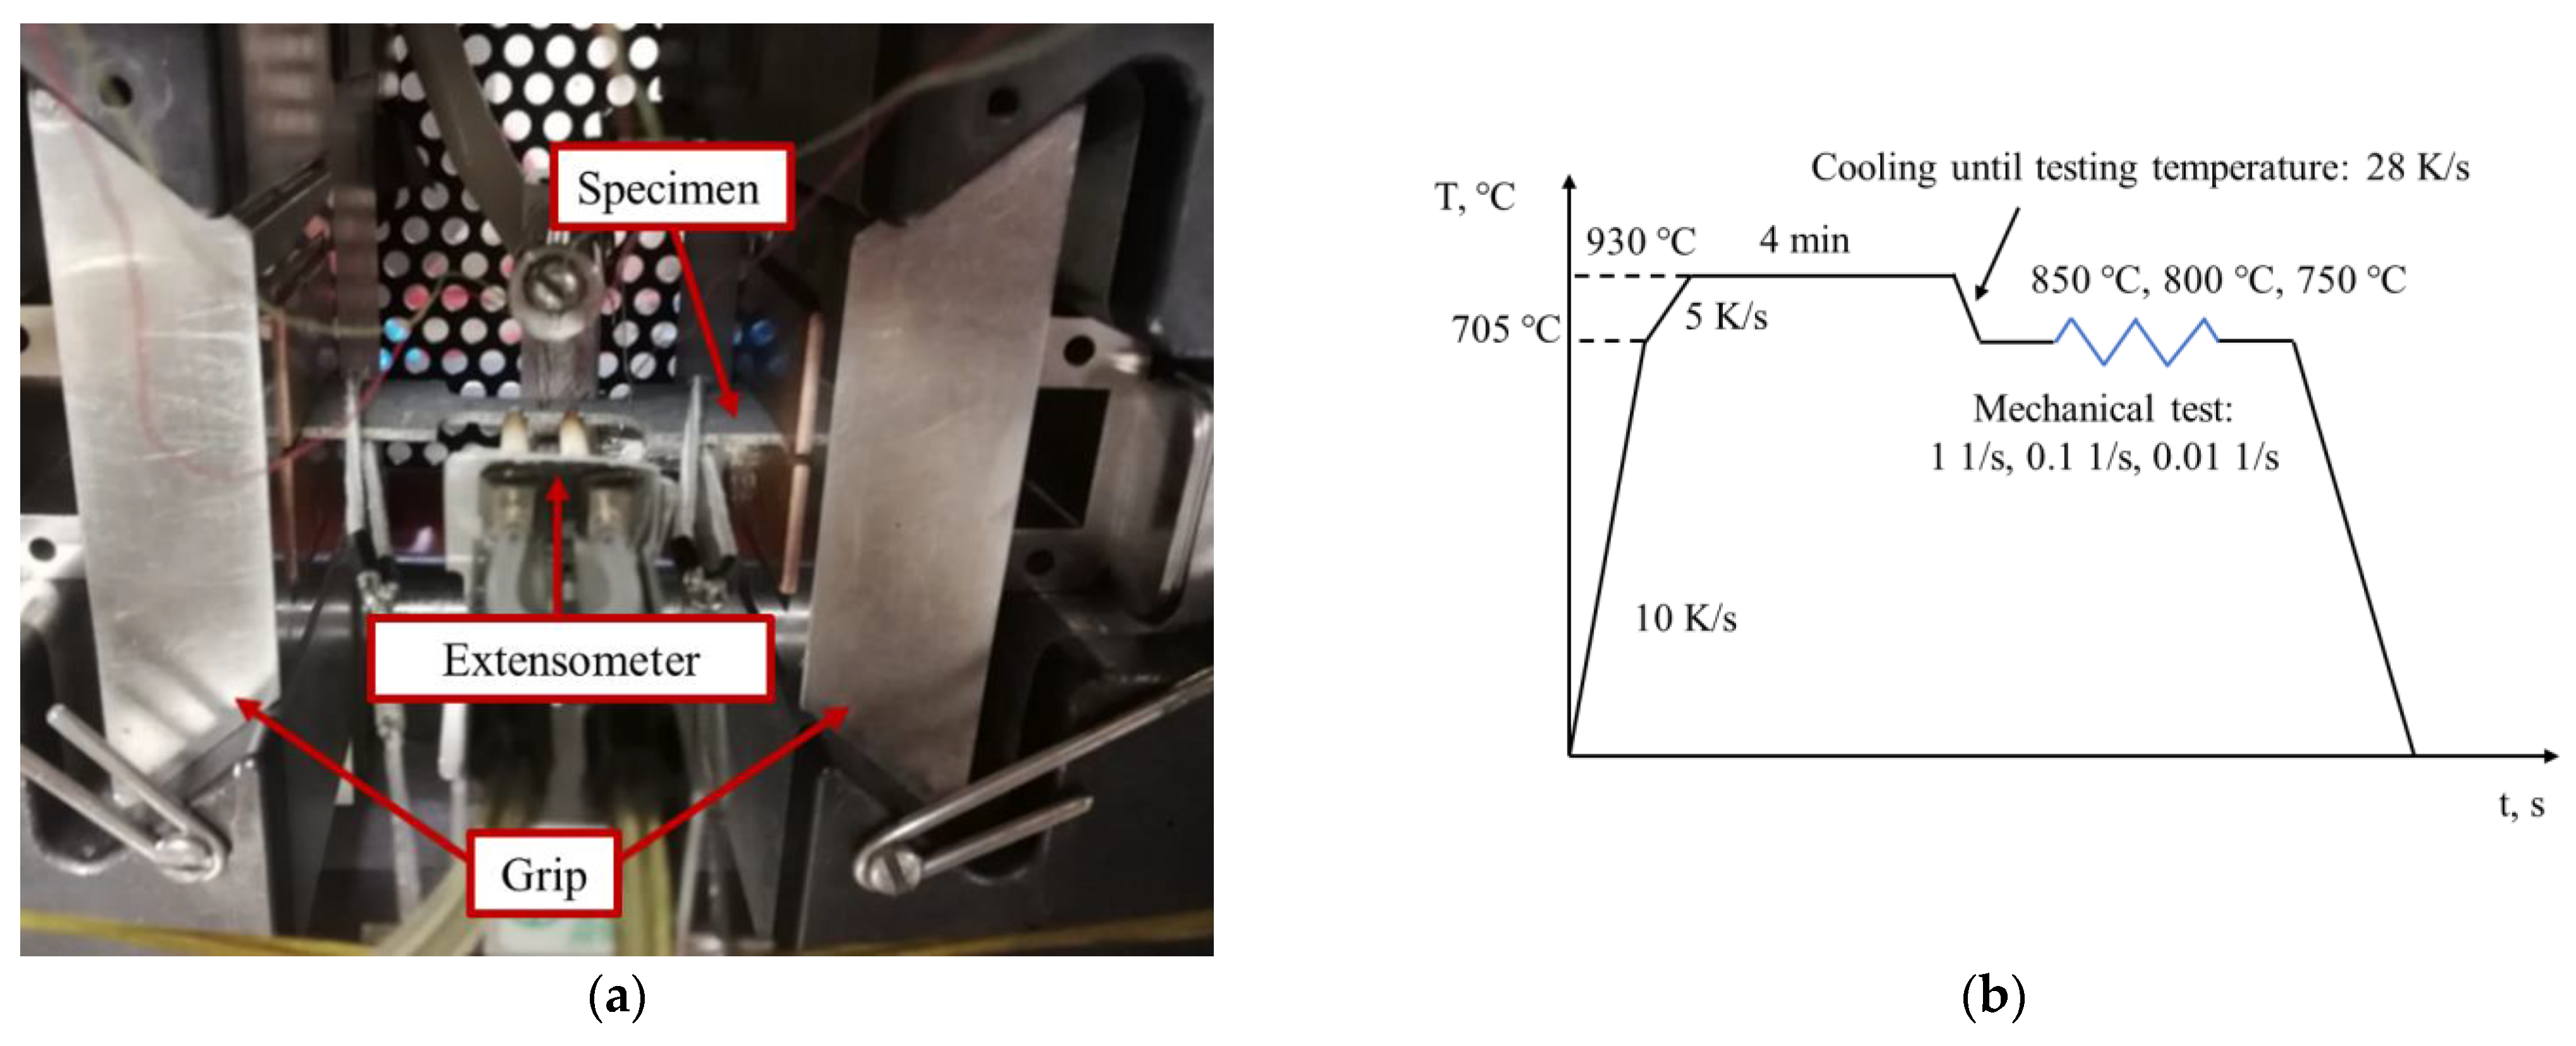
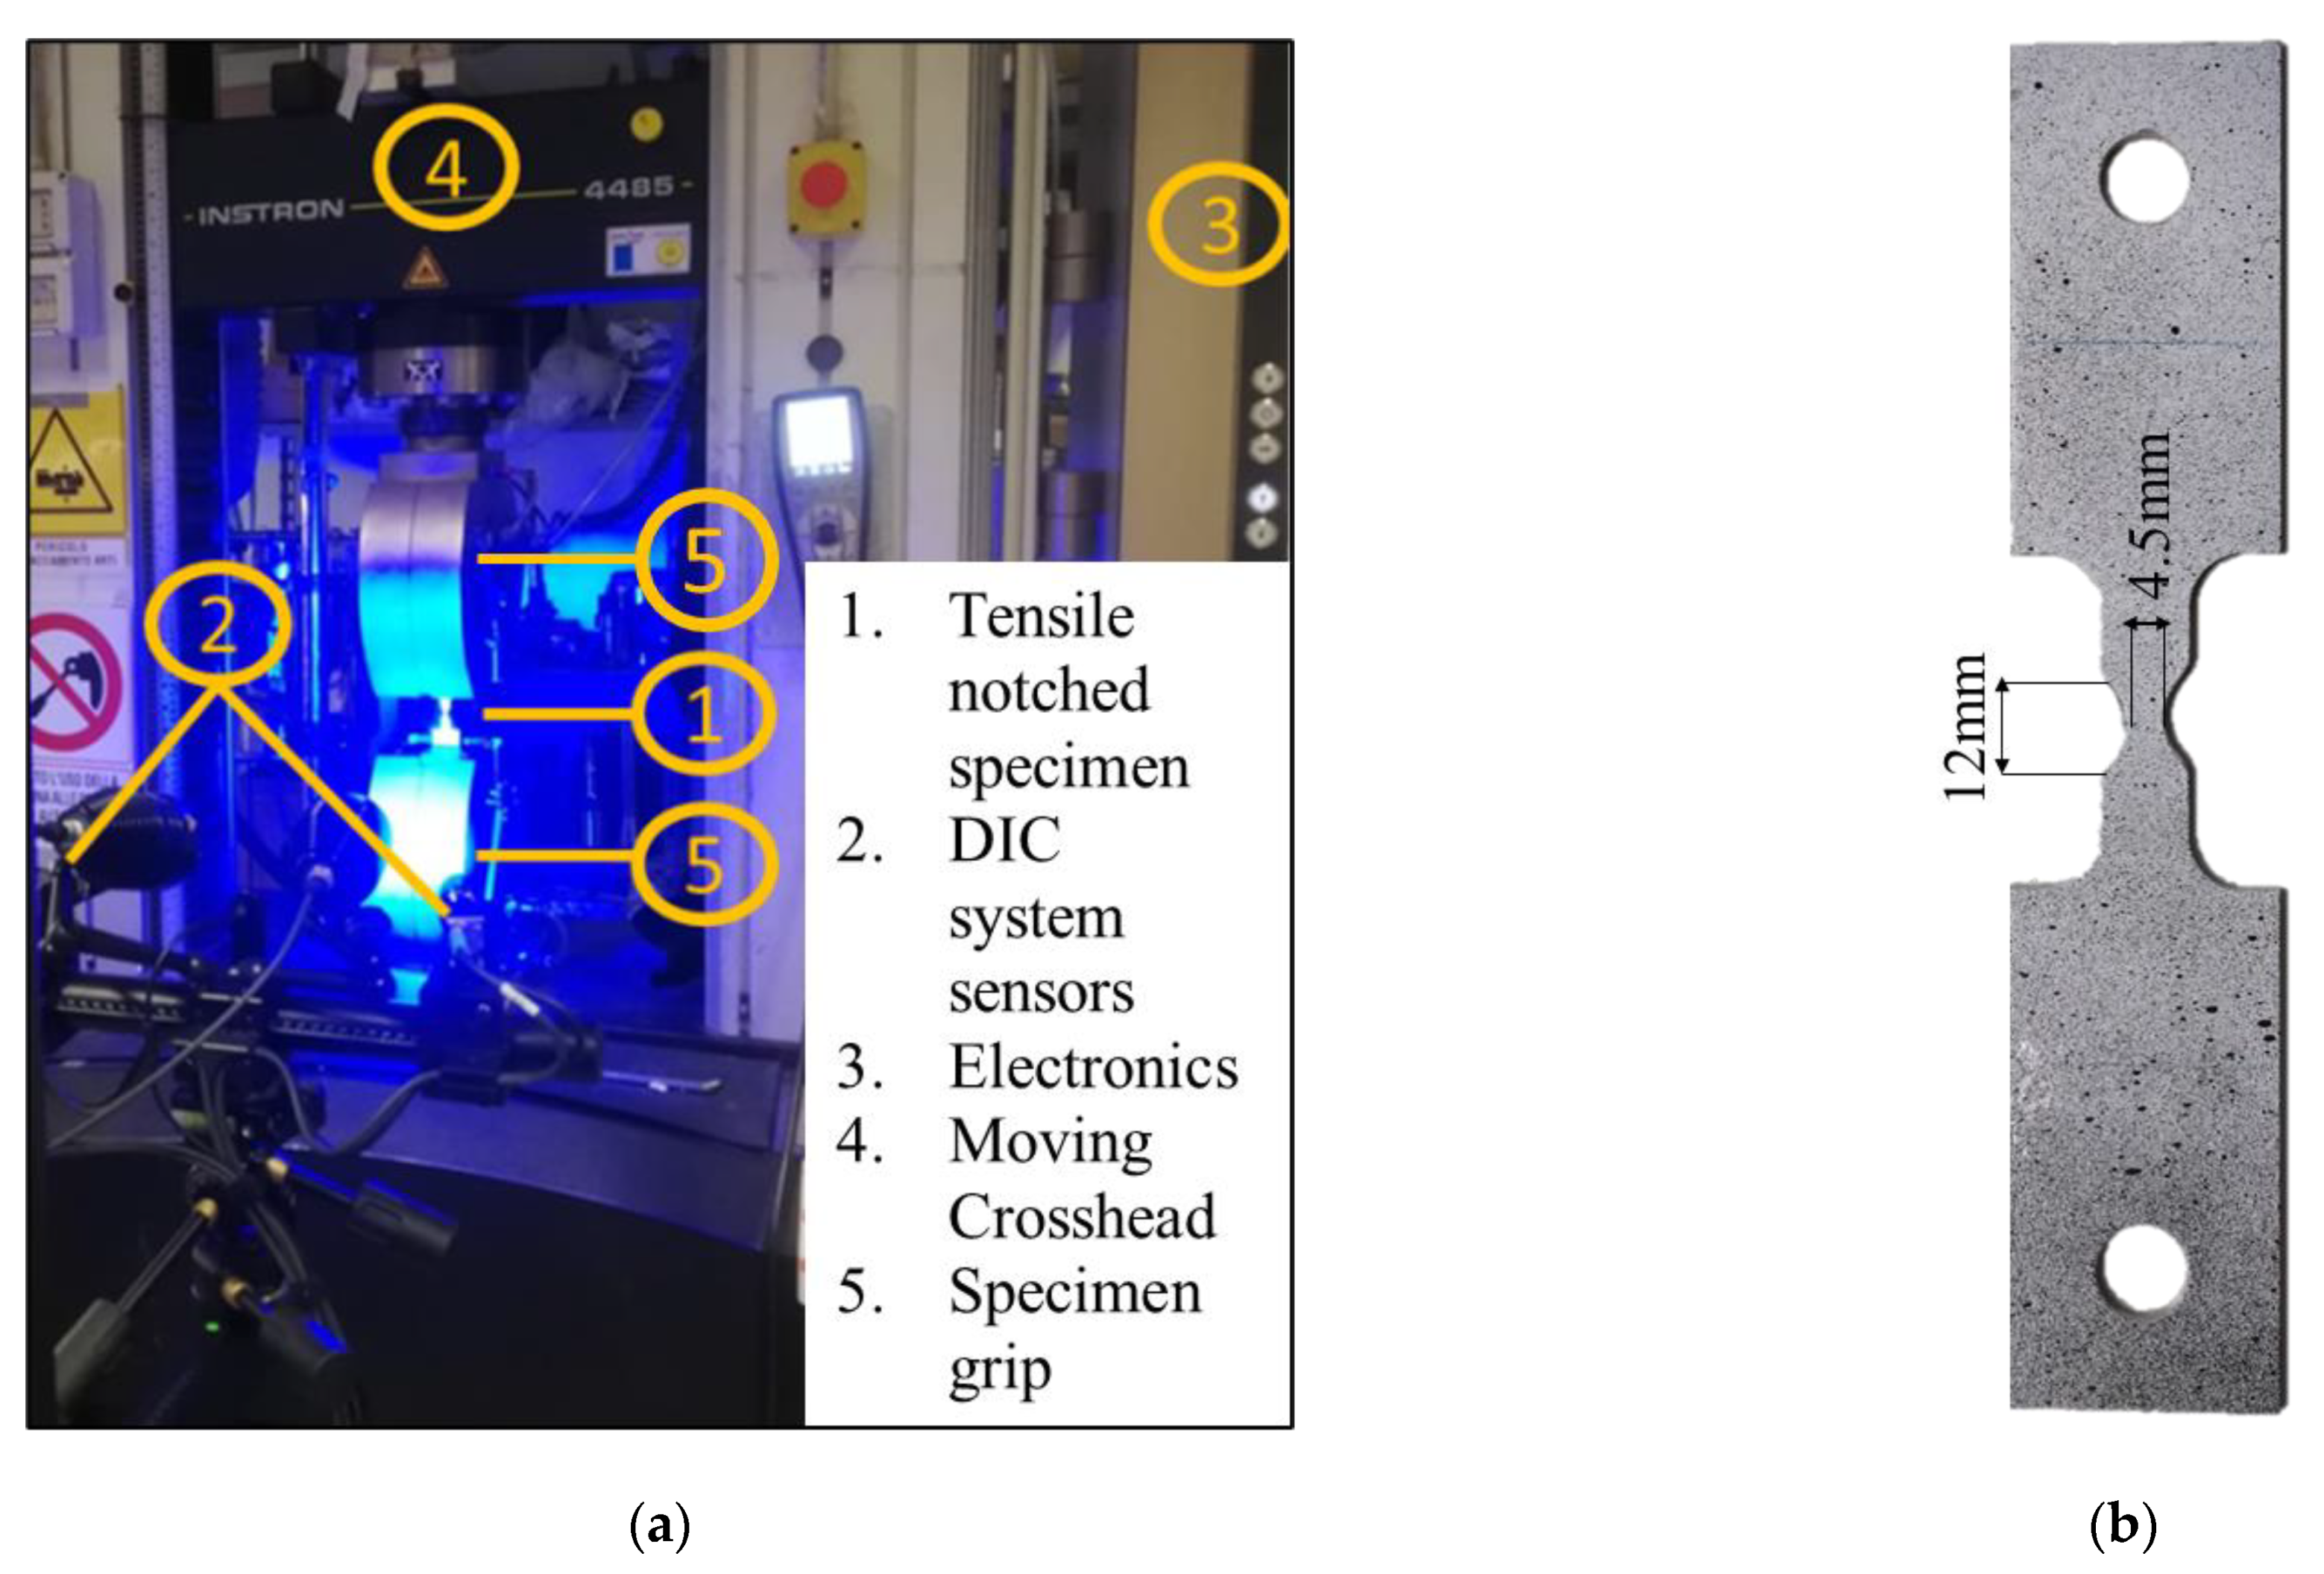
The procedure designed on the Gleeble system has been finalized to the definition of the experimental setup and the design of the specimen geometry. The adopted experimental setup is shown in Figure 1a. The specimen is clamped in a vacuum chamber using copper grips. A NiCr–NiSi thermocouple spot welded at the center of the specimen is used to ensure that the specimen temperature cycle follows the set temperature. Moreover, tests are assisted by the extensometer, HZT071, which is characterized by alumina rods in contact with specimen for lengthwise measurement of the strain in the central hot zone of the specimen (gauge length is 10 mm) in which a reduced thermal gradient is present. In the material characterization of USIBOR®2000 steel the temperatures of 850 °C, 800 °C and 750 °C as well as the strain rates of 1 s−1, 0.1 s−1 and 0.01 s−1 have been investigated. These values are chosen considering temperature and strain rate ranges observed during the numerical simulation of the drawing operation of the TTT-press-hardening process. A scheme of the imposed thermo-mechanical cycles is shown in Figure 1b.
The specimens are initially heated until 705 °C with a heating rate of 10 K/s, and then heated to the austenitization temperature (930 °C) with a heating rate of 5 K/s. Finally, the specimens are soaked for 4 min at the austenitization temperature. After the austenitization phase, specimens are cooled to the test temperature; the specimen is maintained at the deformation temperature for few seconds to achieve a uniform temperature distribution and, finally, tensile tests take place. After deformation, the specimens are cooled to room temperature.
The choice of the heating rates, the austenitization temperature and the soaking time at this temperature is made based on the work of Jing Zhou et al. [11] for the 22MnB5 steel. The cooling rate from 930 °C to the test temperature is chosen to guarantee a material characterization in the austenitic field, preventing the formation of ferrite and pearlite before isothermal deformation. Preliminary tests have shown that a cooling rate of 25 K/s is enough to characterize the material in austenitic field even at the lowest temperature and strain rate investigated. The respect of this cooling rate without the use of forced air has been obtained performing the specimen design with a FE model developed in COMSOL Multiphysics [12].
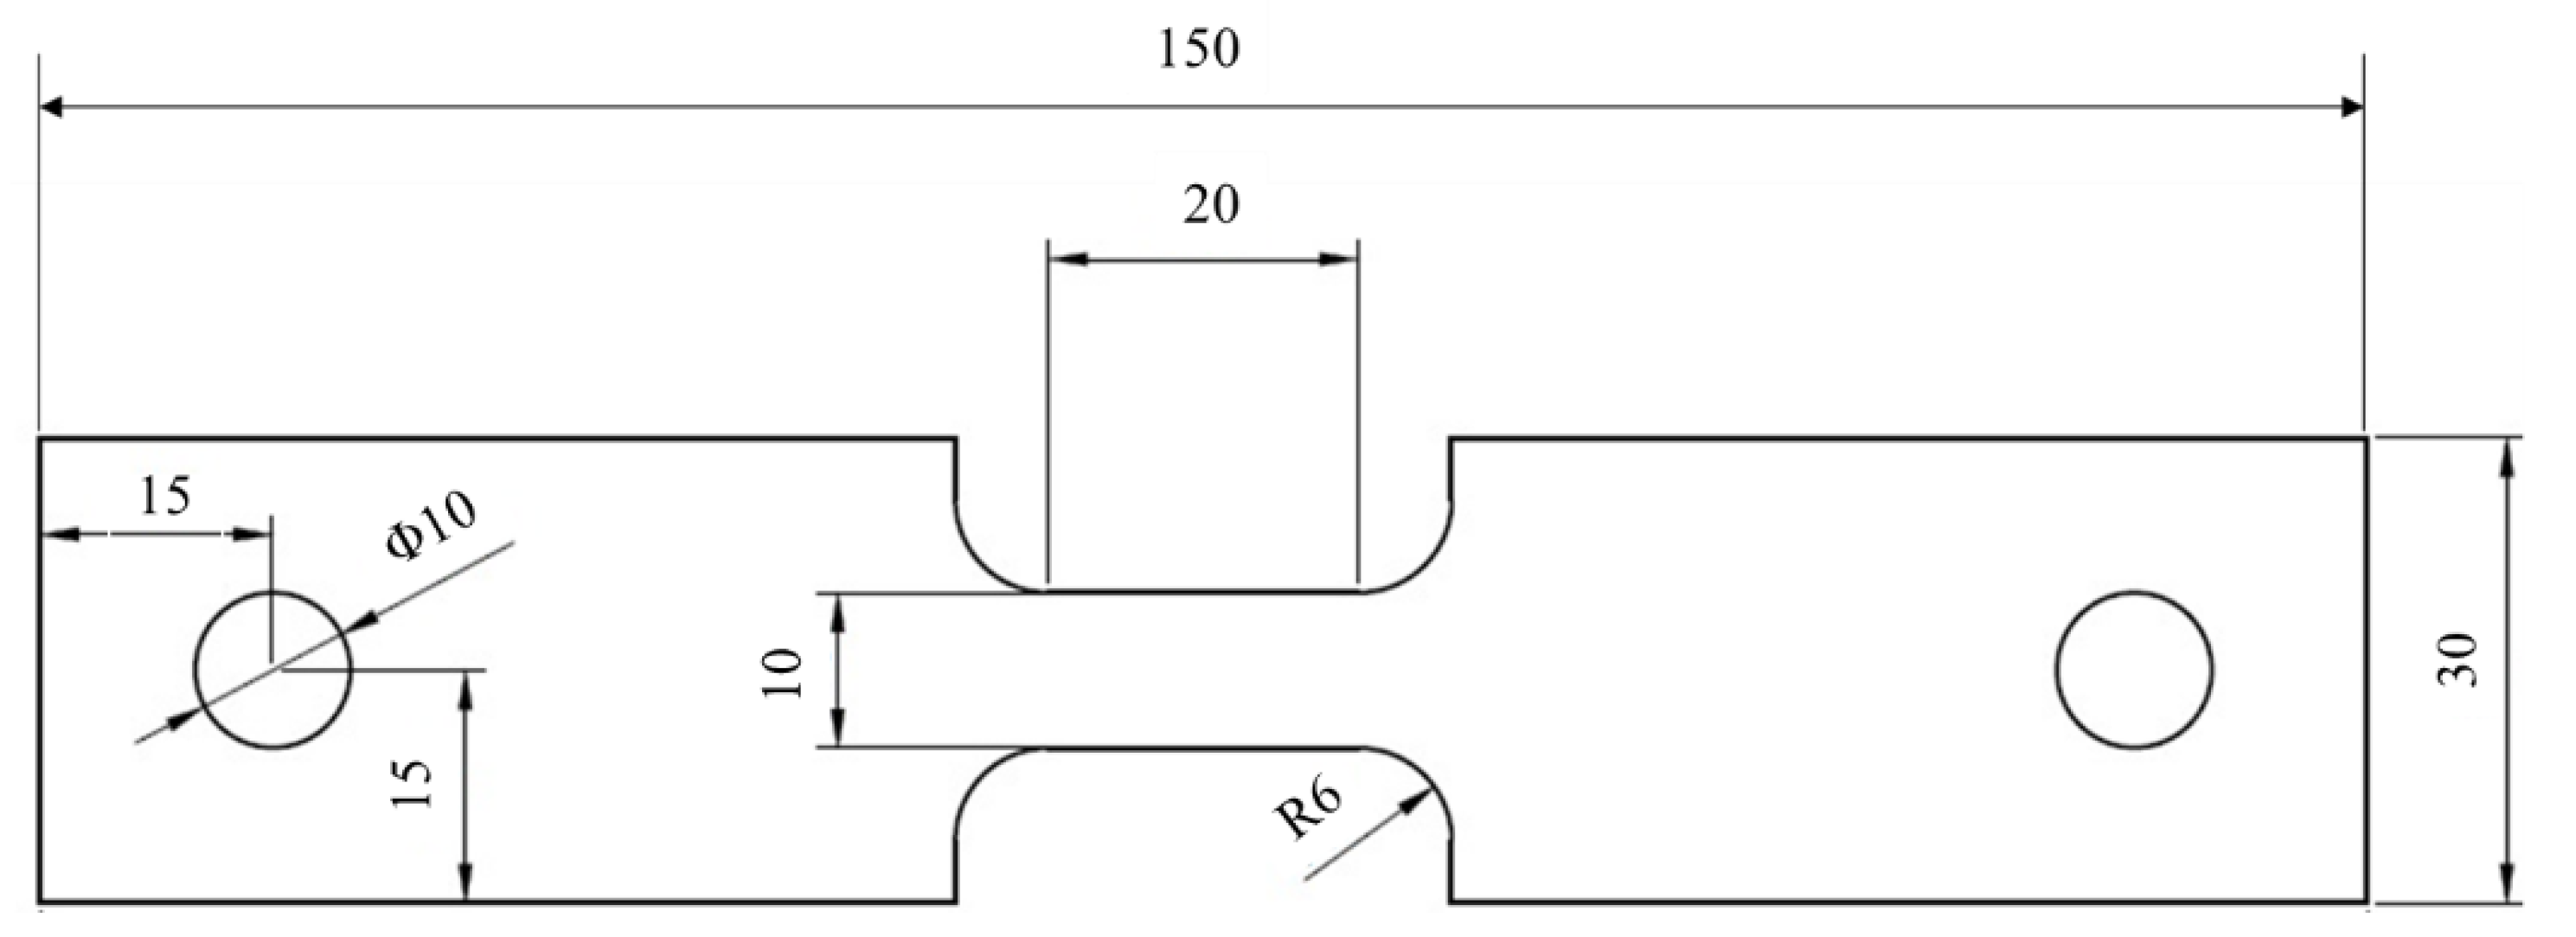
The geometry of specimens used in the physics simulation tests is shown in Figure 2. This geometry allows cooling rates of approximately 28 K/s and a thermal gradient in the gauge length of about 4 K/mm.
The Gleeble setup adopted to reproduce thermomechanical cycles obtained by numerical simulation has been the same as that used for the hot tensile tests (Figure 1a). On the specimens used for physical simulation in addition to the central control thermocouple (TC2), two other thermocouples have been welded at a distance from the center of 10 mm and 15 mm, respectively (TC3 and TC4), along the longitudinal specimen axis.
The modeling phase of the TTT-press-hardening process has been carried out using the commercial Finite Element (FE) AutoForm R8 software. Initially, the part geometry surfaces have been uploaded. Then, the following operations of the production line have been defined: heating of the blank, transport of the blank from furnace to the press, drawing, quenching, cooling in air of the quenched part and finally trimming. Finally, input data of each operations are defined and passed to AutoForm-Incremental Solver. This includes also information on the process parameters of the quenching operation.
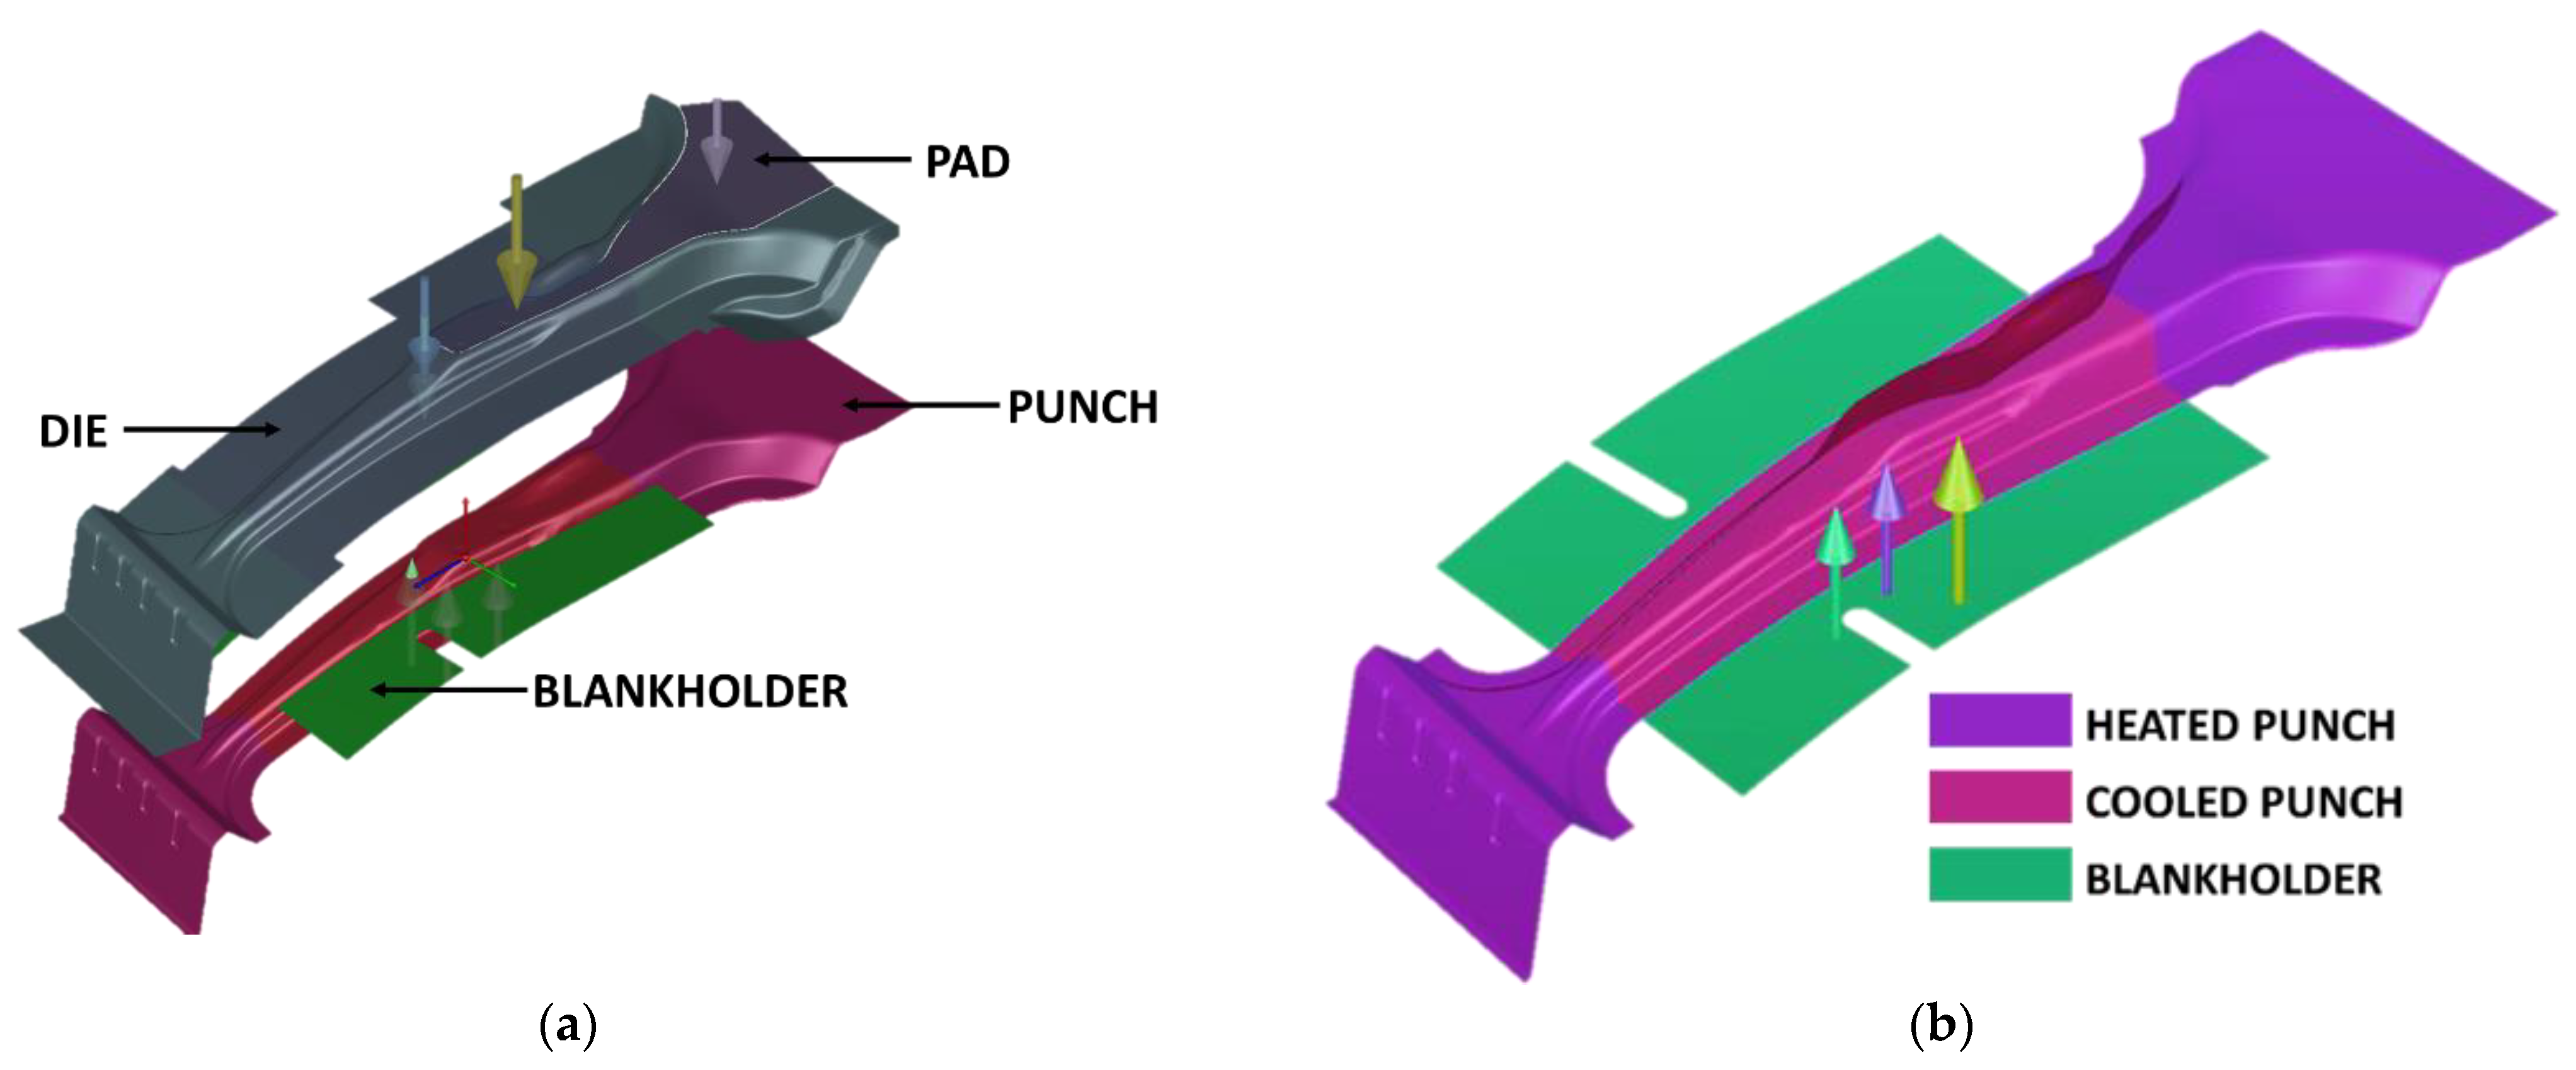
Regarding tool temperatures, Figure 3 shows the forming tools used for the hot stamping of the automotive B-Pillar investigated as a case study.
The die is an upper tool and it moves during the hot forming process. On the contrary, the punch is a lower tool and it is fixed. The pad is an upper tool and it has been added to help keep the blank in place. The pad and the blank holder are defined as gap controlled, while the die and the punch are defined as rigid tools. Furthermore, the contact between tools and blank is modelled as ideally adapted, which means that the temperature distribution is more homogenous.
In order to obtain, in the same part, zones with high strength (strength zone) and with high ductility (ductile zone), tool temperatures have been differentiated. In particular, the temperature of tools in contact with the strength zone is set at 80 °C (cold tools), with the aim to obtain a martensitic microstructure during the part quenching. On the contrary, the temperature of the tools in contact with the ductile zone is set at higher temperature (hot tools), with the aim to obtain a bainitic microstructure during the part quenching. Cold and hot tools temperature have been maintained constant during simulation. Moreover, the temperature of hot tools has been varied from 430 °C to 500 °C to analyze the effect of hot tools temperature on the hardness of the ductile zone. Figure 3b shows for example the heated and cooled regions of the punch.
The other process parameter that has been varied to understand its influence on the hardness of the ductile zone at the end of the process is the quenching time; which has been varied from 5 s to 250 s. Finally, Table 3 shows the process parameters that have been kept constant in all the numerical simulations of TTT-press-hardening process of the B-Pillar investigated.
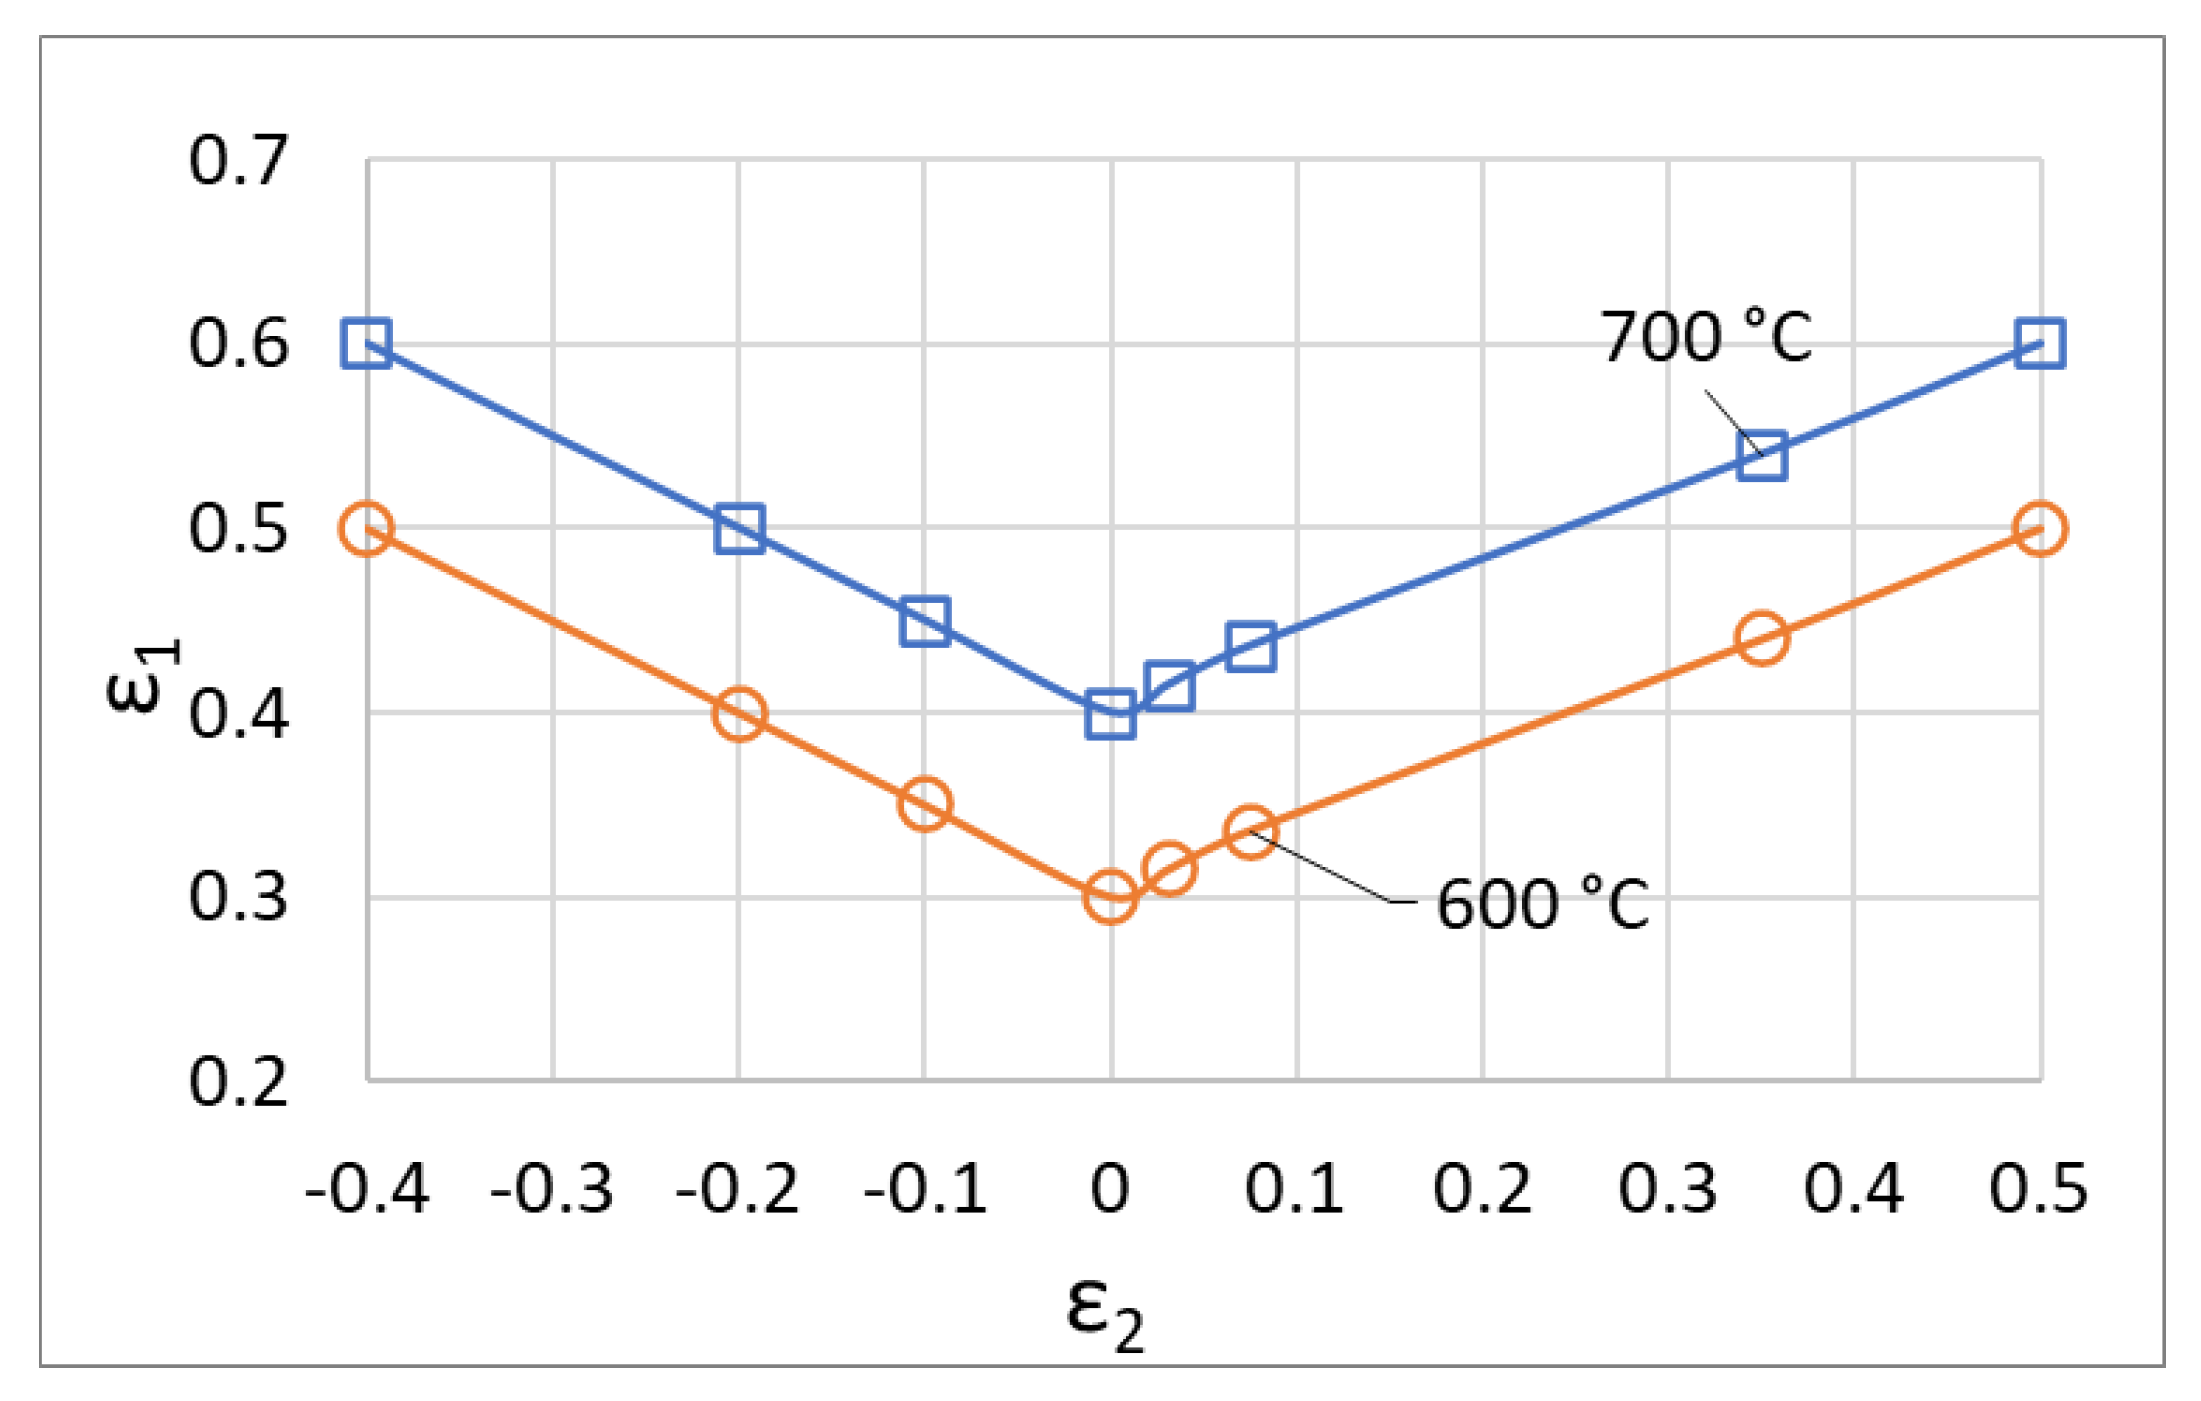
Numerical simulations have been performed using material data from USIBOR®1500 and USIBOR®2000 steels. For the USIBOR®1500, the material data has been imported from the AutoForm library material database [13]. Figure 4 shows for example the Formability Limit Curves (FLC), Table 4 reports the thermal data and Table 5 exhibits the thermo-physical properties of each microstructural phase. There is no data for USIBOR®2000 steel in the AutoForm library materials database. The hardening curves have been defined using tensile tests performed with the Gleeble system (Section 3). The forming limit curves are highlighted in Figure 5, while thermal data and thermo-physical properties of the microstructures are approximated to those of USIBOR®1500 steel (Table 4 and Table 5). The Hill 48 model has been used for the yield surface of the two steels; considering, however, that deformation occurs at high temperature after complete austenization, an isotropic behavior of the material has been assumed (r0 = r45 = r90 = 1). Due to the assumptions made, the comparison of post-forming properties between the two steels has been only based on the results of physical simulation.
In the post-forming characterization phase, the thermomechanical cycles obtained by FE simulation varying the quenching time and hot tool temperature, have been physically reproduced on USIBOR®2000 and USIBOR®1500 steel specimens (Figure 2). These specimens have been then subjected to Vickers hardness tests using a Qness hardness tester, after grinding and polishing of the specimen surface. The hardness tests have been carried out along the longitudinal axis of the specimen adopting a load of 2 kg, a dwell time of 5 s and a pitch between two consecutive tests of 1 mm. For each hot tool temperature analyzed, process conditions with the minimum hardness in the specimen center have been physically reproduced again on USIBOR®2000 and USIBOR®1500 steel specimens. These specimens have been initially machined and then subjected to uniaxial tensile tests, using Instron 4485 universal testing machine. Tensile tests have been assisted by the Digital Image Correlation (DIC) system ARAMIS 3D (provided by GOM), with the aim to measure the elongation at break of the material close to the specimen center (where the control thermocouple has been spot welded). The specimens machining before tensile tests has been realized to favor plastic deformation and fracture in the specimen center. This solution has been adopted to determine mechanical properties in the Heat Affected Zone of welded joints [14,15]. The experimental setup used for uniaxial tensile tests is reported in Figure 6a, while the machined specimen is highlighted in Figure 6b. Before the tensile test, the specimens have been sprayed with a white matte layer to avoid reflection and then with a random distribution of small black points, so that the resulting pattern (speckle) could thus be recognized by the two DIC cameras as a virtual grid.
3. Results and Discussion
3.1. Material Model Defonition for USIBOR®2000
The USIBOR®2000 hardening curves have been obtained using the Gleeble-3180 physical simulator, performing tensile tests at different temperatures and strain rates. The temperatures and strain rates investigated have been chosen with the aim to realize hot stamping when the steel is in the austenitic phase.
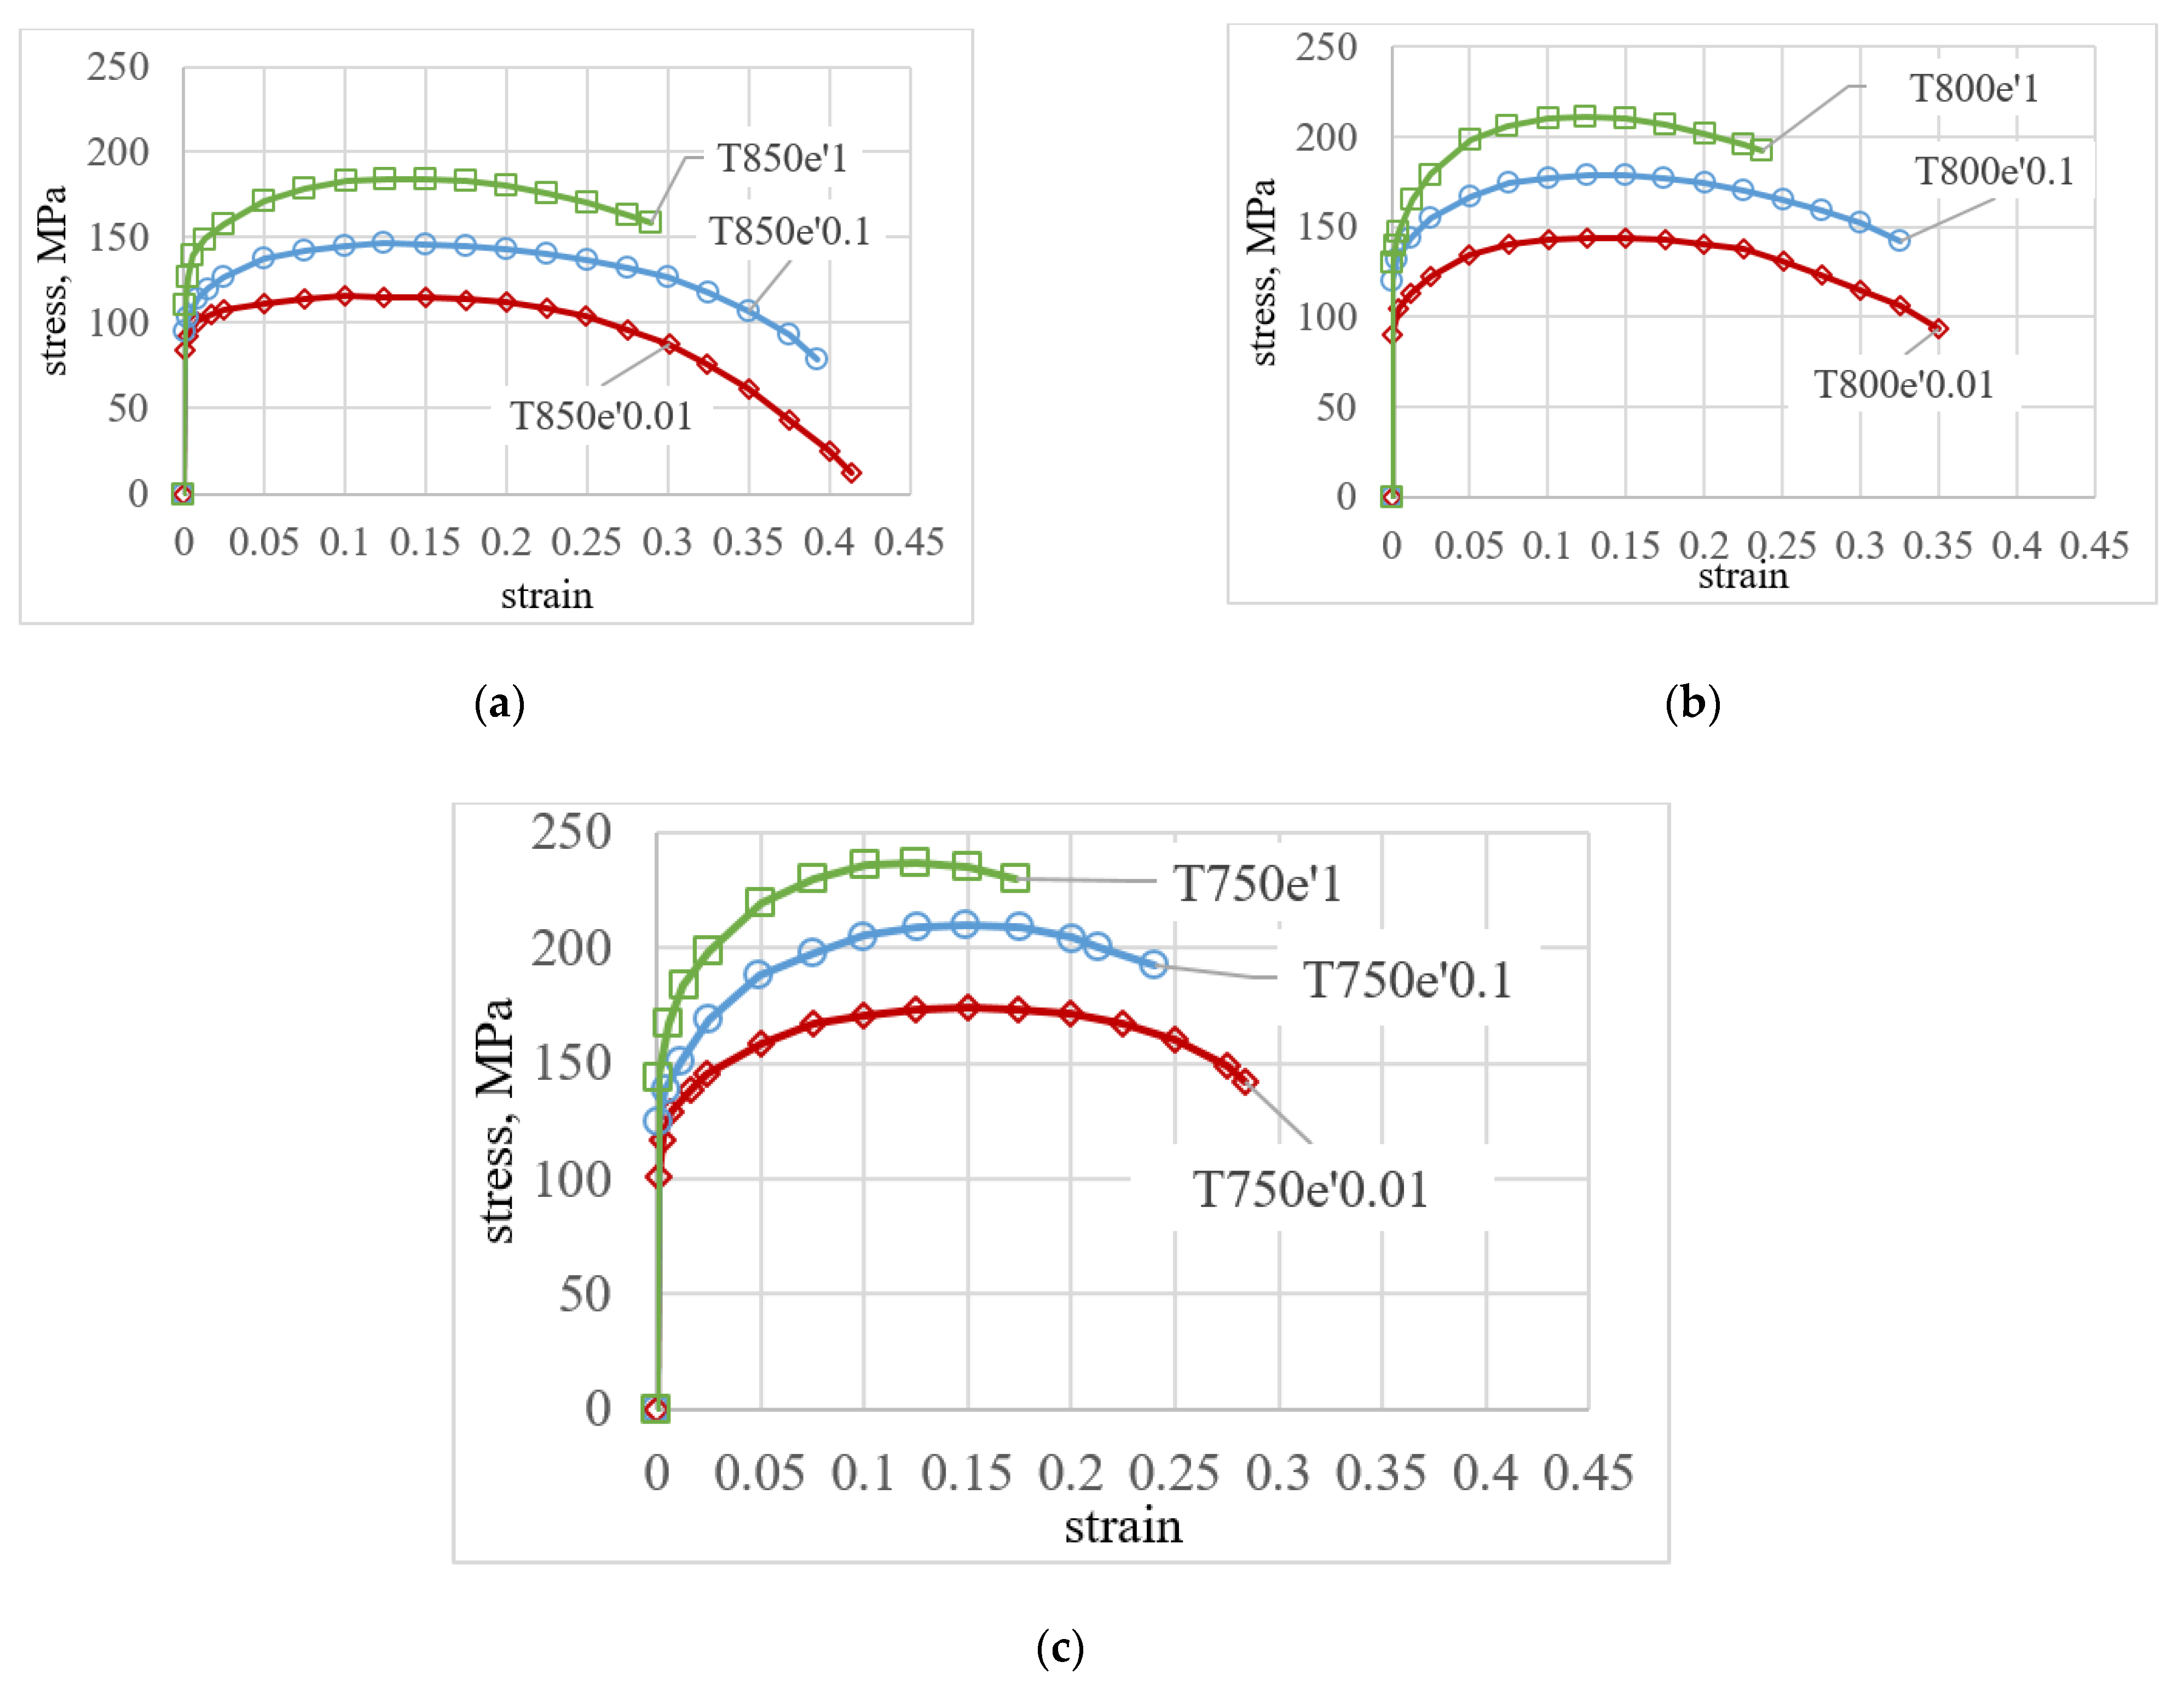
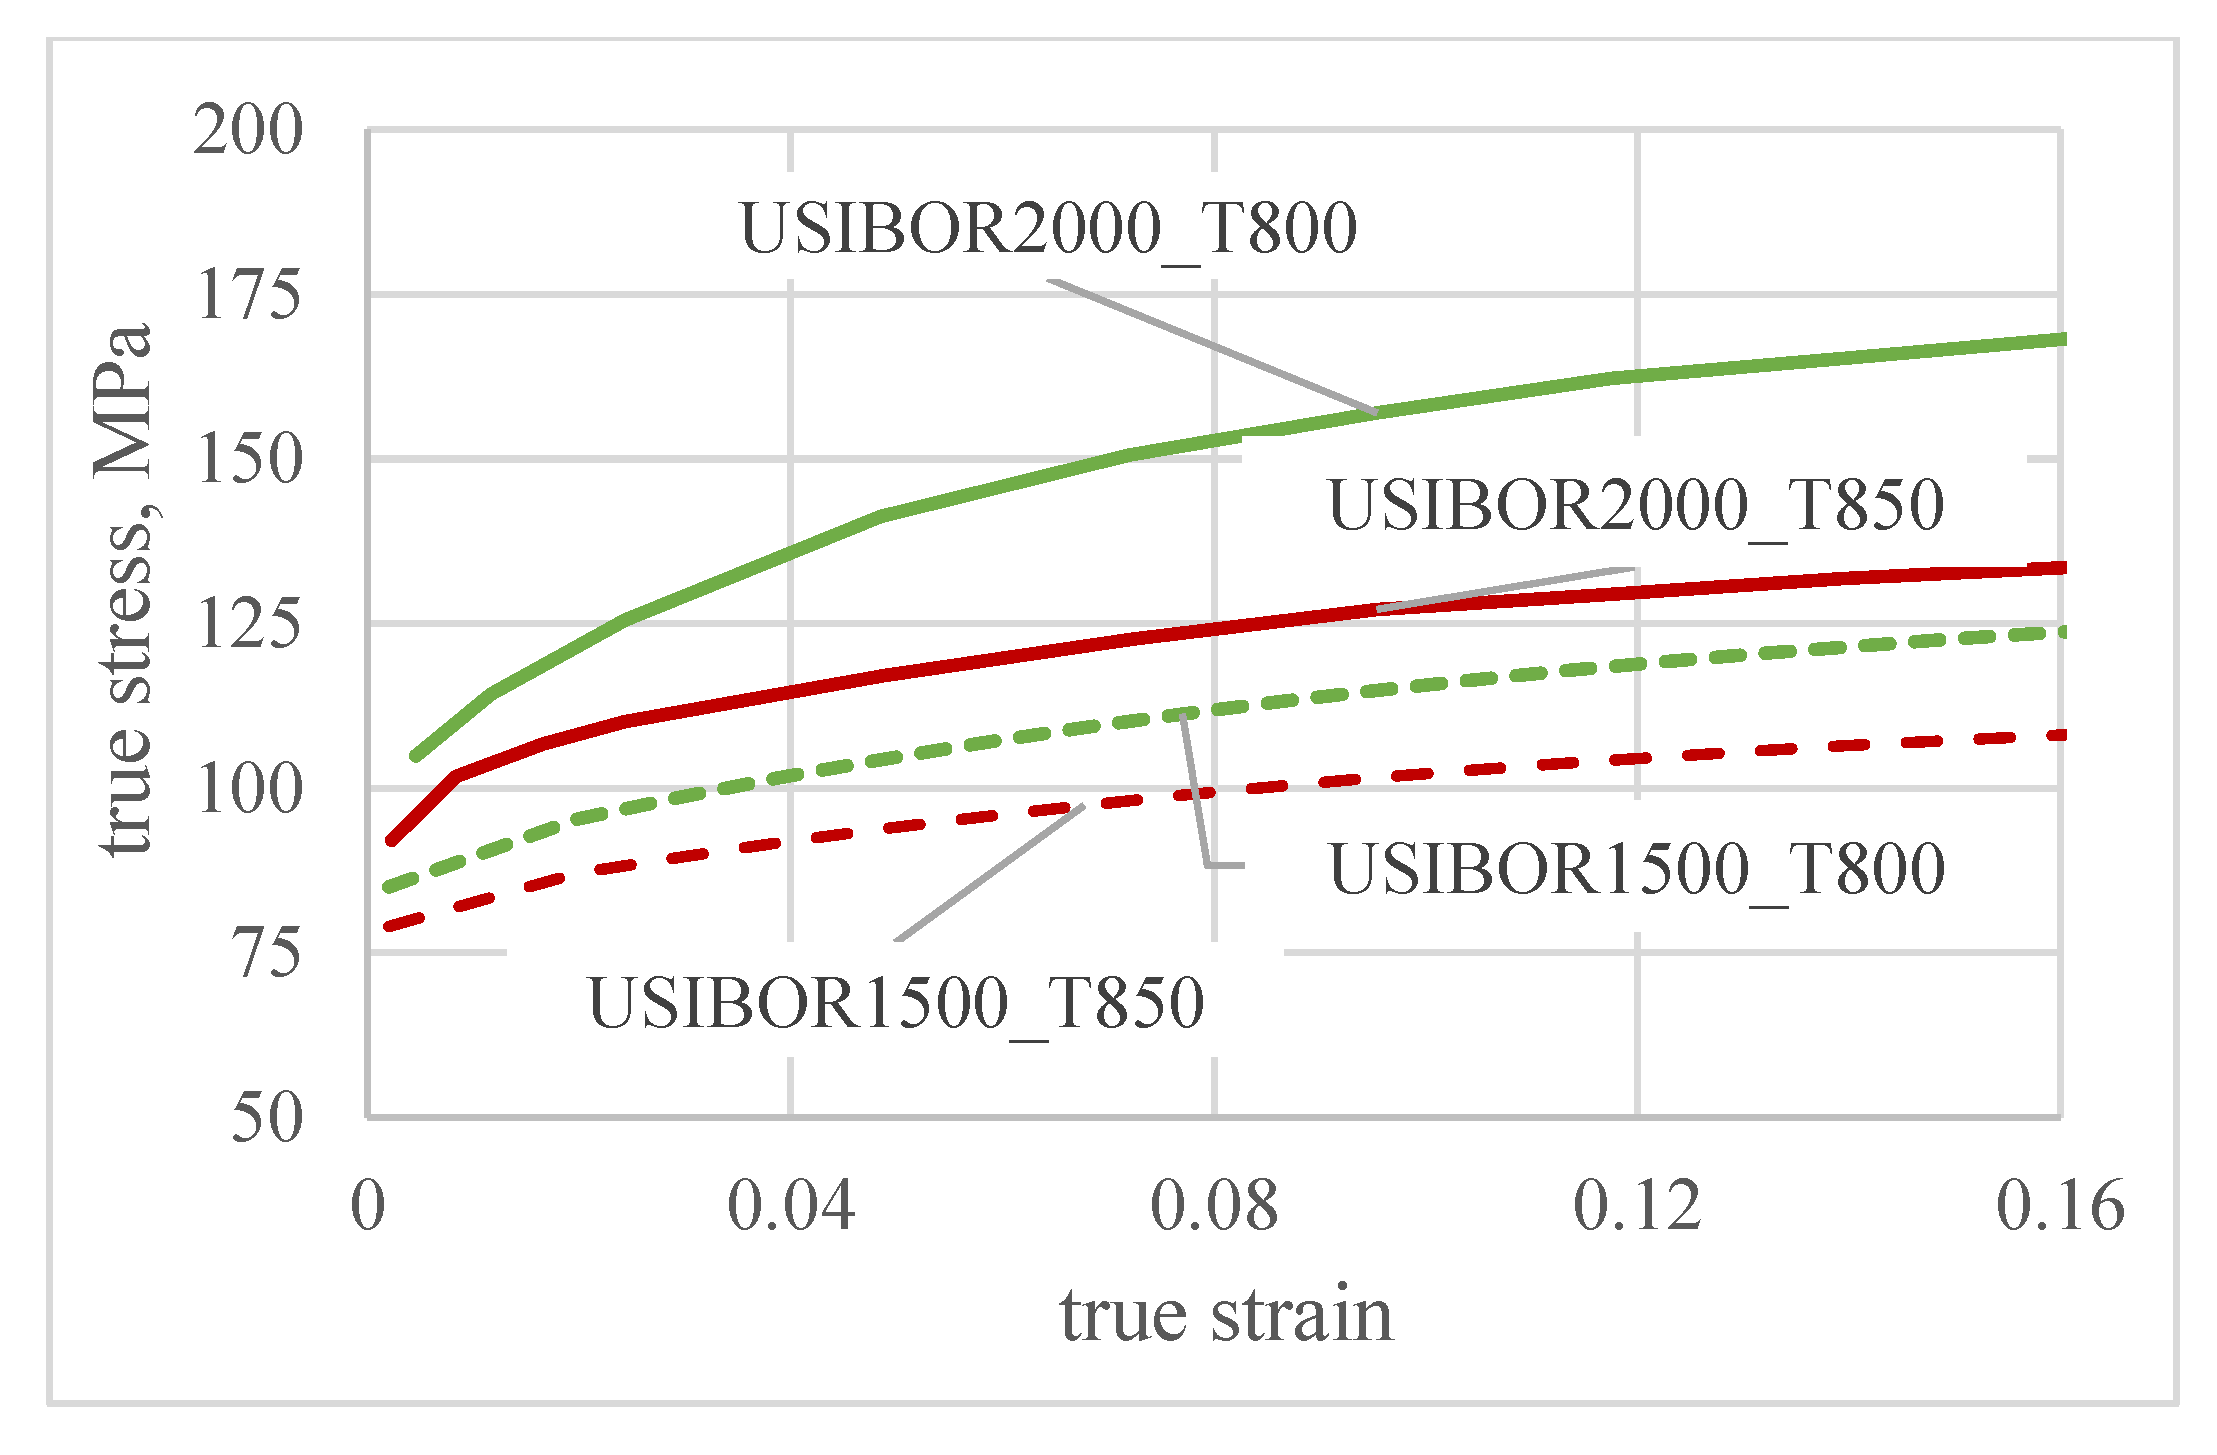
Figure 7 shows the stress–strain curves obtained. These results confirm a significant effect of temperature and strain rate on steel strength and deformability. In particular, an increase in test temperatures as well as a decrease in strain rates determine a decrease in the steel strength parameters (yield stress and ultimate tensile strength), as well as an increase in the steel elongation. The stress–strain curves shown in Figure 7 have been used to model by points the steel hardening curves, which have been defined in AutoForm using its Material Generator interface [13]. Figure 8 shows the hardening curves of USIBOR®2000 steel that have been modelled at a strain rate of 0.01 s−1 and at different temperatures (800 °C and 850 °C). In the range of true strains highlighted in the figure, which includes the true strains experienced in the case study, softening effects overcome those of hardening with the increasing of test temperature and with the decreasing of strain rate. The same Figure 8 shows some hardening curves of USIBOR®1500 steel that are stored in the AutoForm database. With the same temperature and strain rate, the comparison highlights the greater strength of USIBOR®2000 steel due to the higher carbon content present in the austenite solid solution.
3.2. Numerical Simulation of the Press-Hardening Process with TTT Approach
The numerical simulation of the press-hardening process with the TTT approach highlighted the possibility of stamping the B-Pillar without formability defects, for both steels investigated. The simulation performed using USIBOR®1500 steel made it possible to analyze the results in terms of microstructure and hardness at the end of the cooling in air of the quenched part. It has been observed that with a tool temperature equal to 80 °C, there are no problems in guaranteeing a completely martensitic structure in the strength zone of B-Pillar for all quenching times investigated. In the ductile zone of the B-Pillar, on the other hand, the results are influenced both by the temperature of the hot tools and by the quenching time. It has been observed that in this case, part of the bainitic transformation occurs during the quenching operation and part during cooling in the air of the B-Pillar. For low quenching times, however, it is observed that during the cooling in the air, the residual austenite can also be transformed into martensite; in this case, the final structure foreseen by the FE model is bainitic–martensitic.
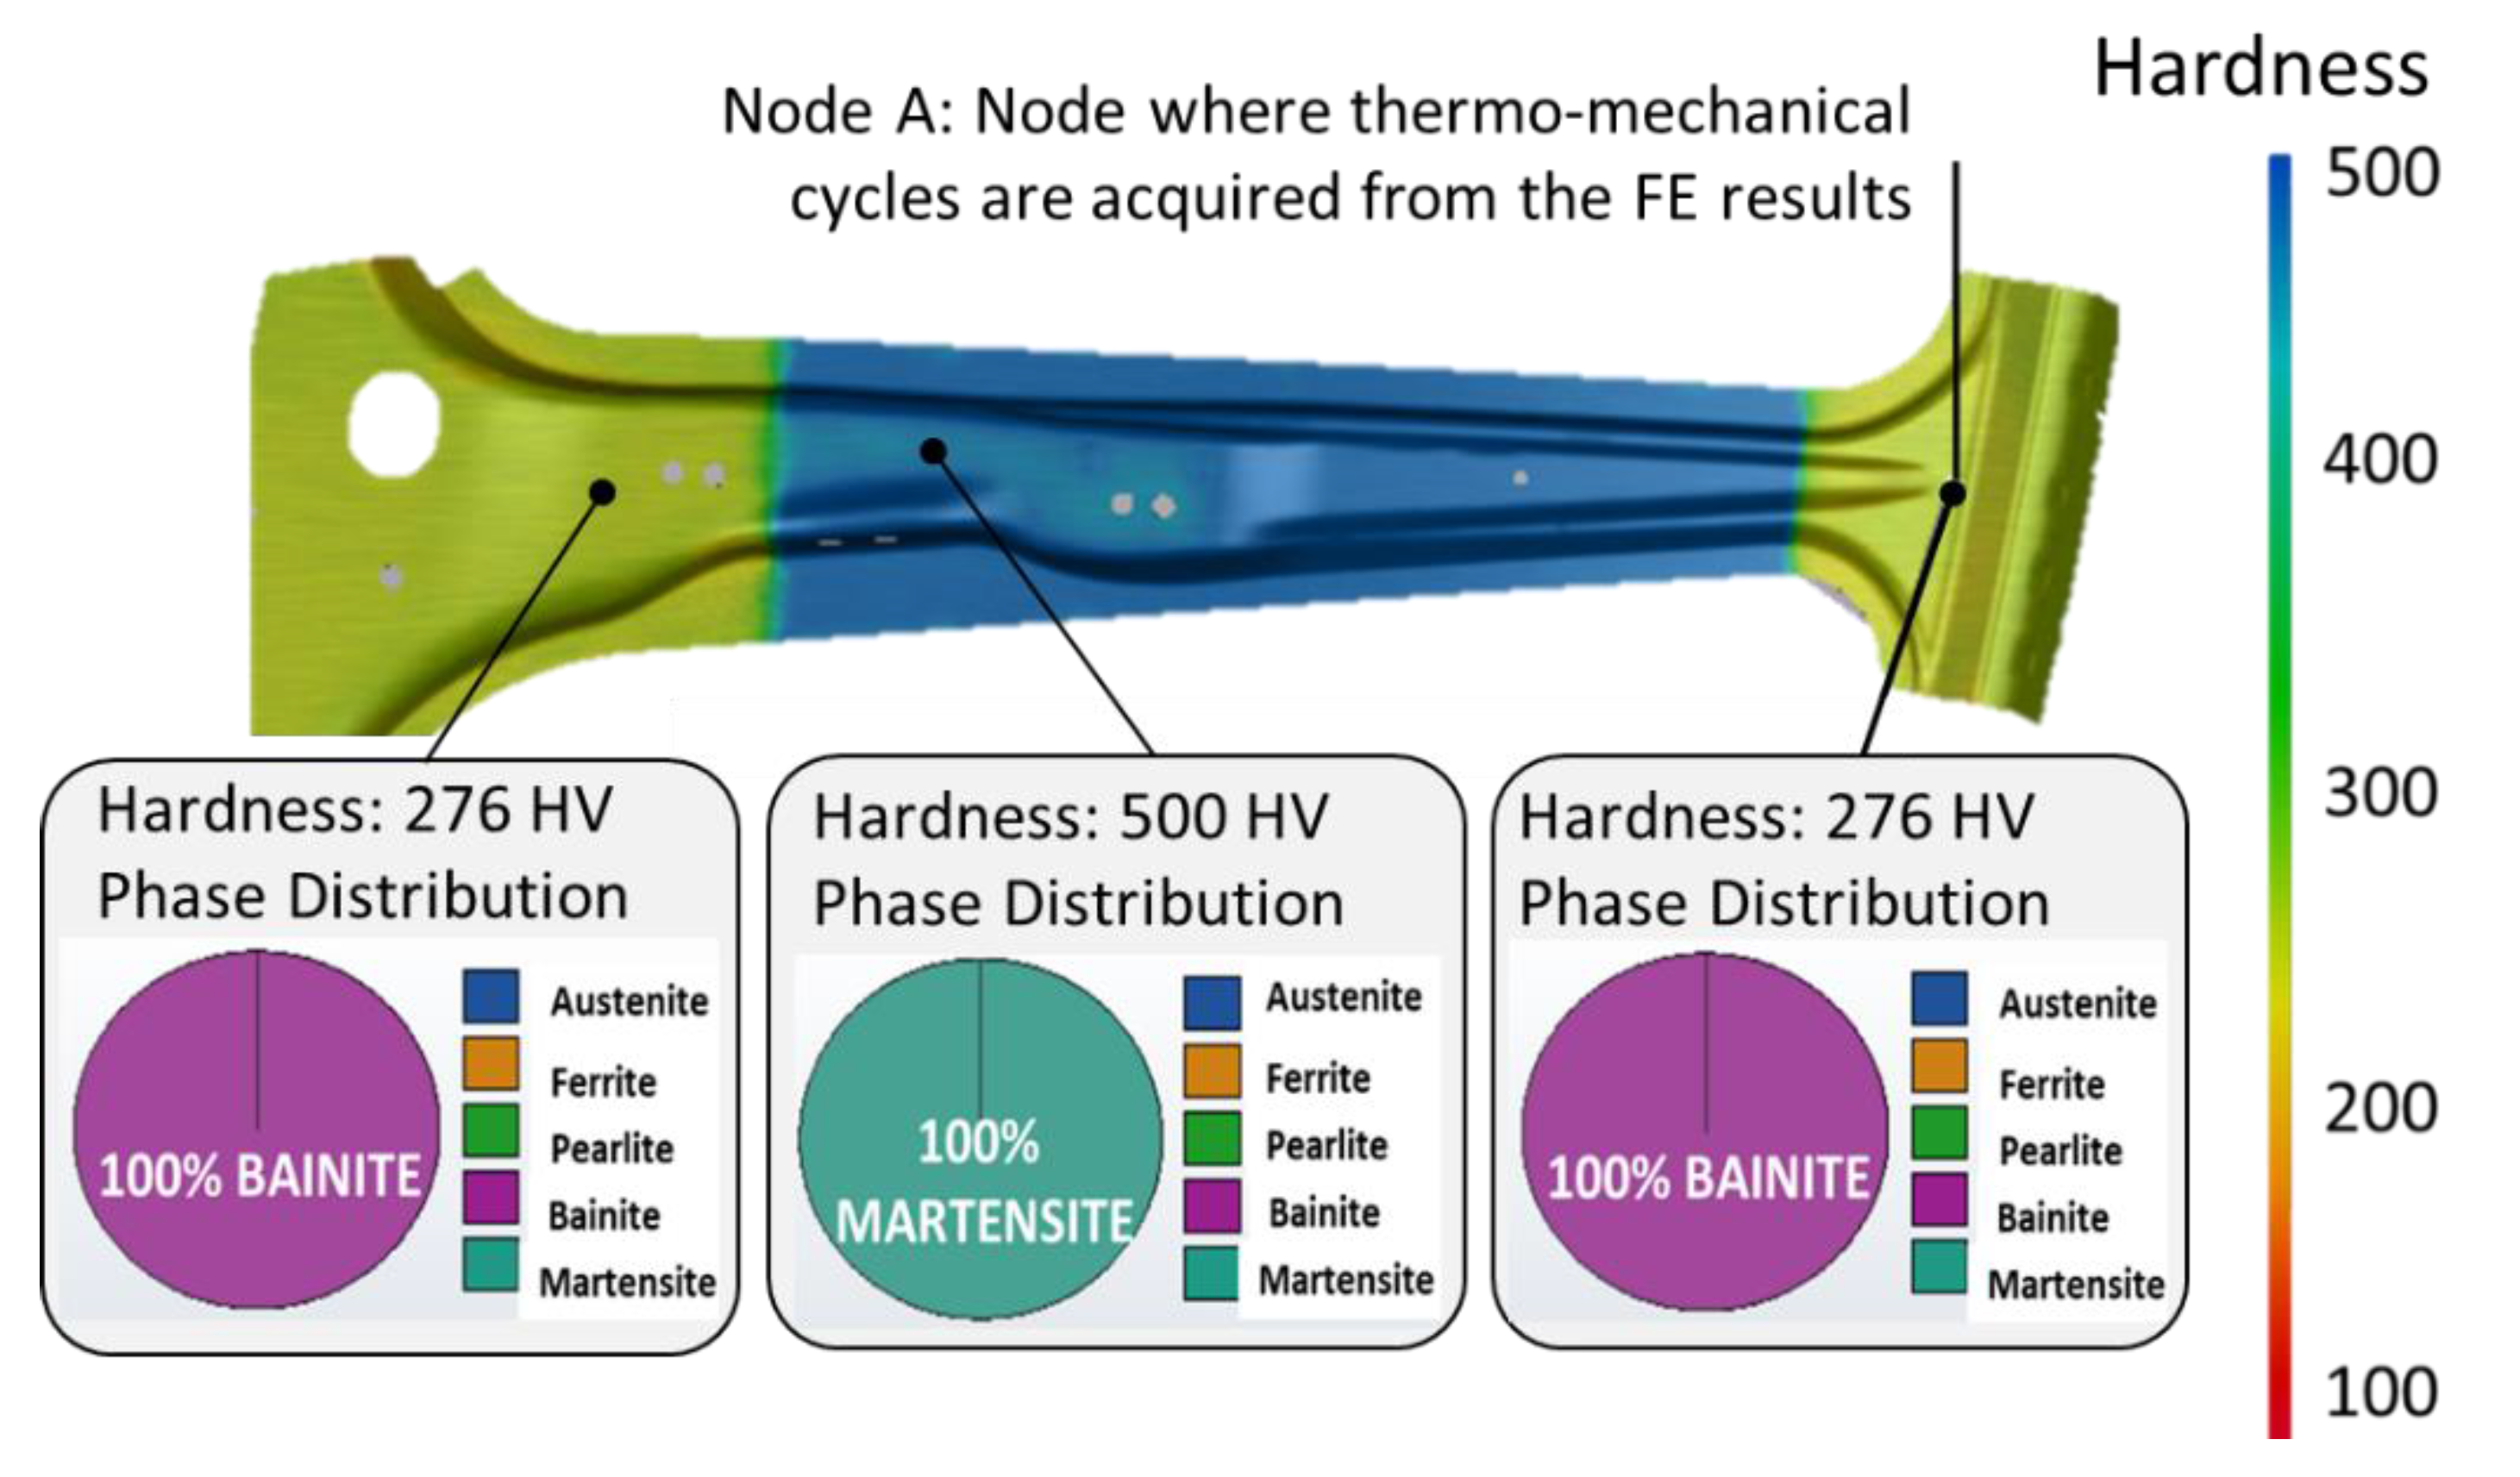
Figure 9 highlights the results obtained by assuming a hot tool temperature of 500 °C and a quenching time of 50 s. It should be noted that in these conditions, the strength zone of the B-Pillar is completely martensitic, reaching a hardness of 500 HV, while the ductile zone of the part is completely bainitic with a hardness of 276 HV.
In the post-processing phase of the FE results, it is possible to obtain the evolution of parameters of interest in specific points of the B-Pillar. With the aim of physically simulating the thermo-mechanical cycle imposed with the FE simulation, the attention has been focused on node A highlighted in Figure 9, which can be considered representative of the ductile zone of the B-Pillar. Node A is sufficiently far from holes or boundaries that could increase the heat exchange during the cooling in the air of the part, with the effect of increasing the cooling rate and obtaining a martensite structure.
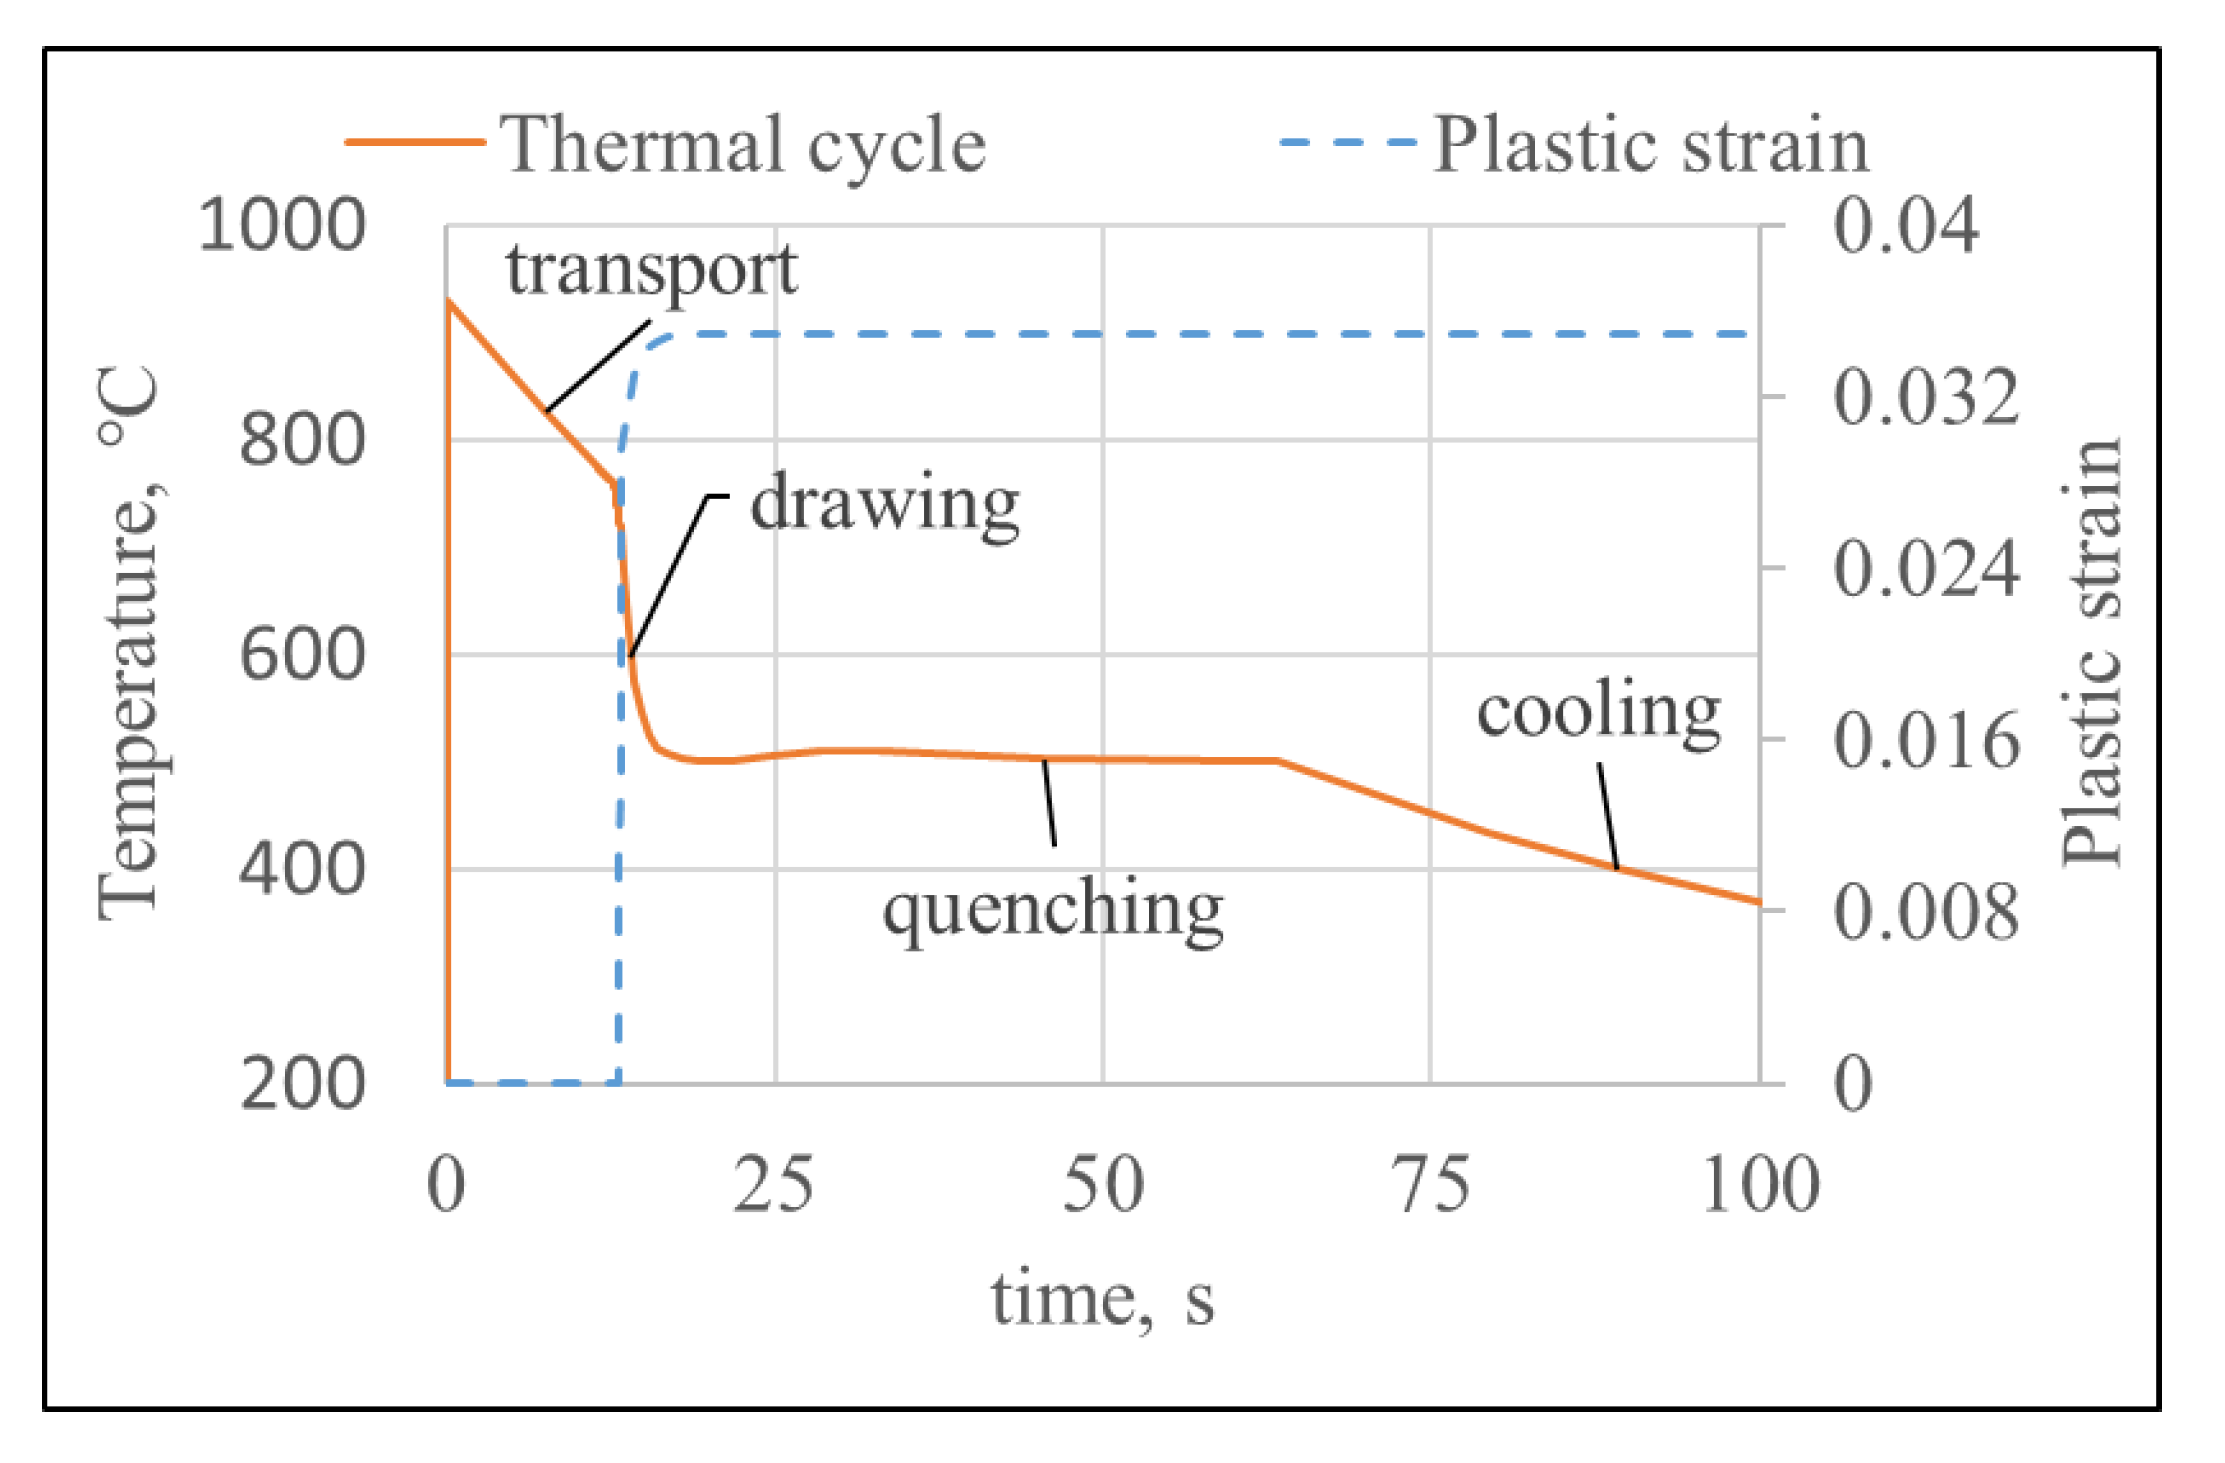
For all the simulations performed varying quenching time and temperature of the heated tools, the thermo-mechanical cycles in the node shown in Figure 9 have been post-processed and extracted from the numerical results. As an example, Figure 10 shows a thermo-mechanical cycle (time evolution of temperature and plastic equivalent strain) that has been acquired in node A with the FE simulation performed using USIBOR®1500 steel data, a temperature of the heated tools equal to 500 °C and a quenching time equal to 50 s. It is possible to observe some phases of the press-hardening process with the TTT approach. In particular, the transport phase (transport of the blank from the furnace to the press), the drawing and quenching phases (the blank is deformed plastically and is then quenched in the heated tools) and finally the cooling in the air of the quenched part (the piece comes out of the press and is cooled in the air until it reaches an ambient temperature). As highlighted before, the cooling in the air can contribute to microstructure transformation because if quenching time is not enough to transform all austenite into bainite, the residual austenite can continue to transform in bainite and eventually in martensite.
3.3. Physical Simulation of Thermo-Mechanical Press-Hardening Cycles
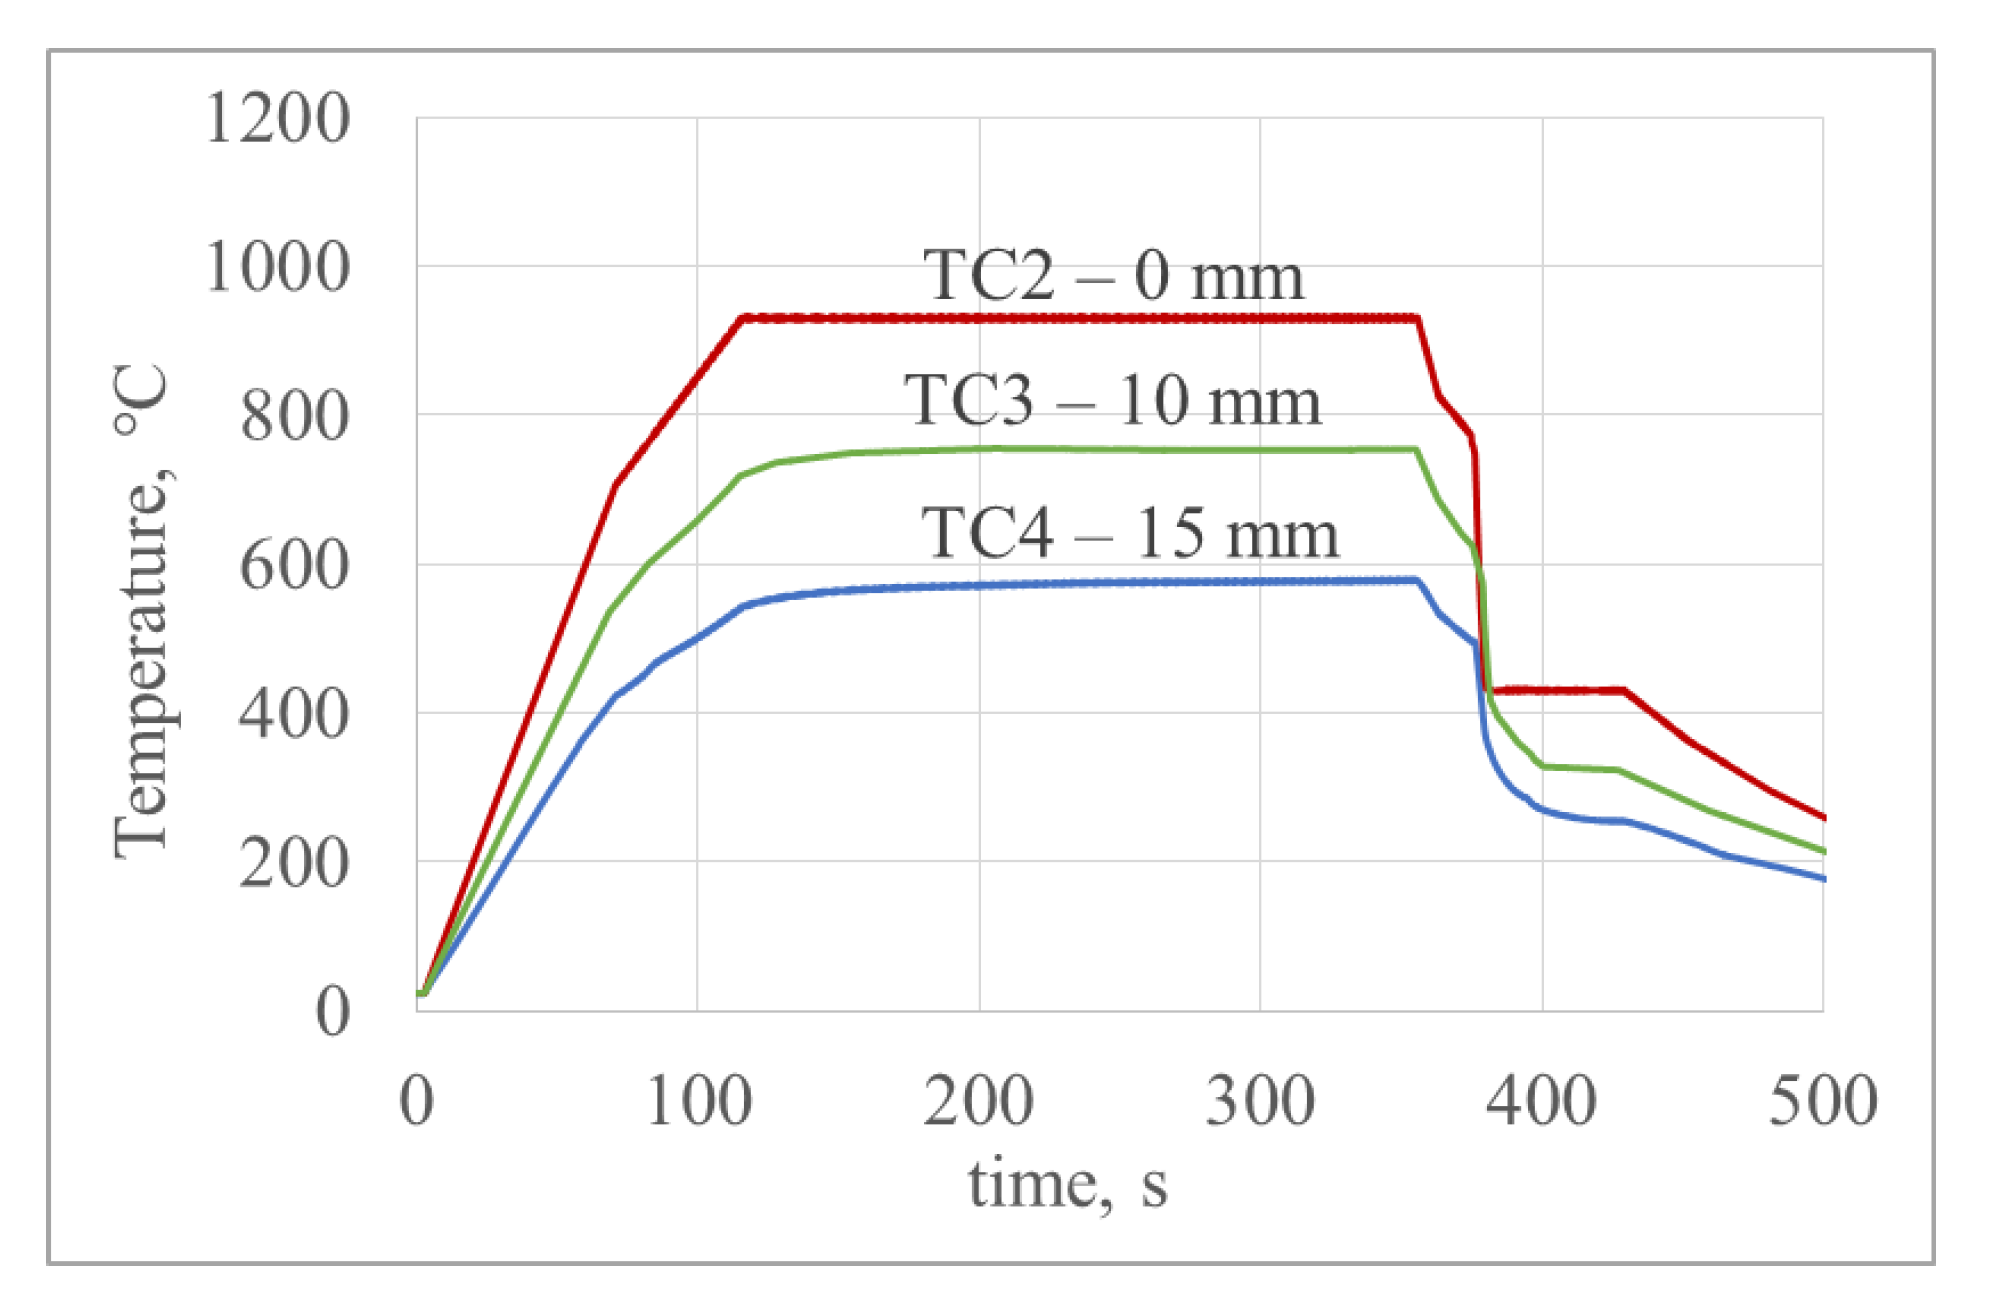
Thermo-mechanical cycles obtained from FE results have been then set up in the Gleeble system for physical simulation tests on USIBOR®1500 and USIBOR®2000 steel specimens. In the initial conditions both steels have a ferric-pearlitic microstructure, furthermore the heating phase to reach 930 °C has been carried out according to the thermal cycle shown in Figure 1b. The results of the Gleeble tests made it possible to verify the thermal cycle set in the control thermocouple and to explore thermal cycles achieved by the other thermocouples welded on the specimen surface at different distances from the control thermocouple. Due to the cooling of the water–glycol solution in the gripping system, with increasing distance from the specimen center, similar thermal cycles to the set one, but with lower heating temperatures, are observed. Figure 11 shows the thermal cycles recorded by the thermocouples in the physical simulation test on a USIBOR®2000 steel specimen, in the condition with temperature of the heated tools equal to 430 °C and quenching time equal to 20 s (T430tq20 condition). These results confirm the heating temperature decreasing with the increasing of the distance from the specimen center along the longitudinal axis direction. It can, therefore, be highlighted that at approximately 10 mm away from the specimen center, the maximum temperature reached during the heating phase is lower than that of the complete austenitization of both steels, which means that in the same Gleeble test the hot stamping on a blank with the initial microstructure is also physically simulated.
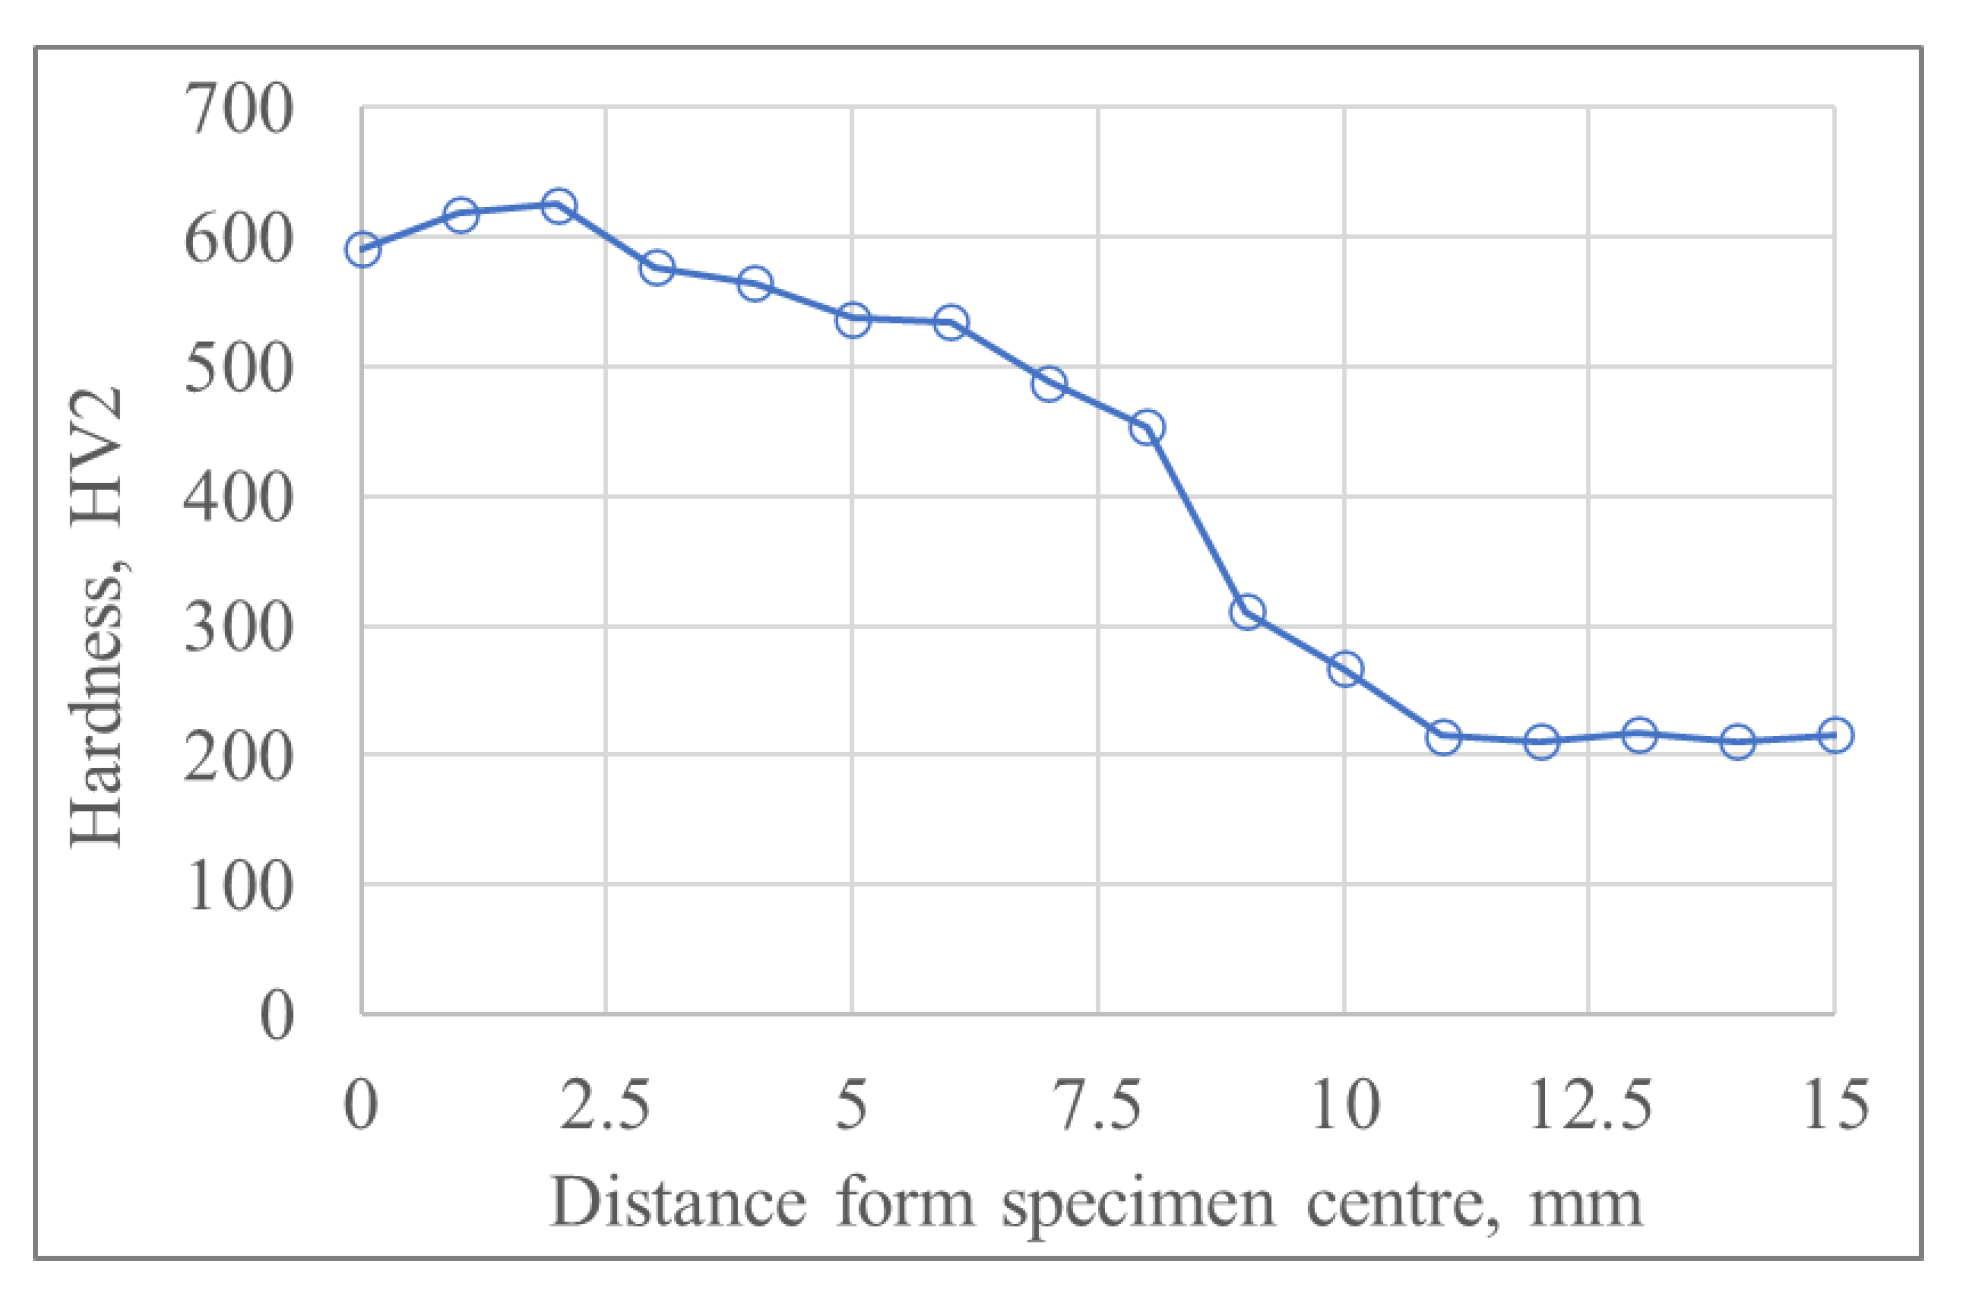
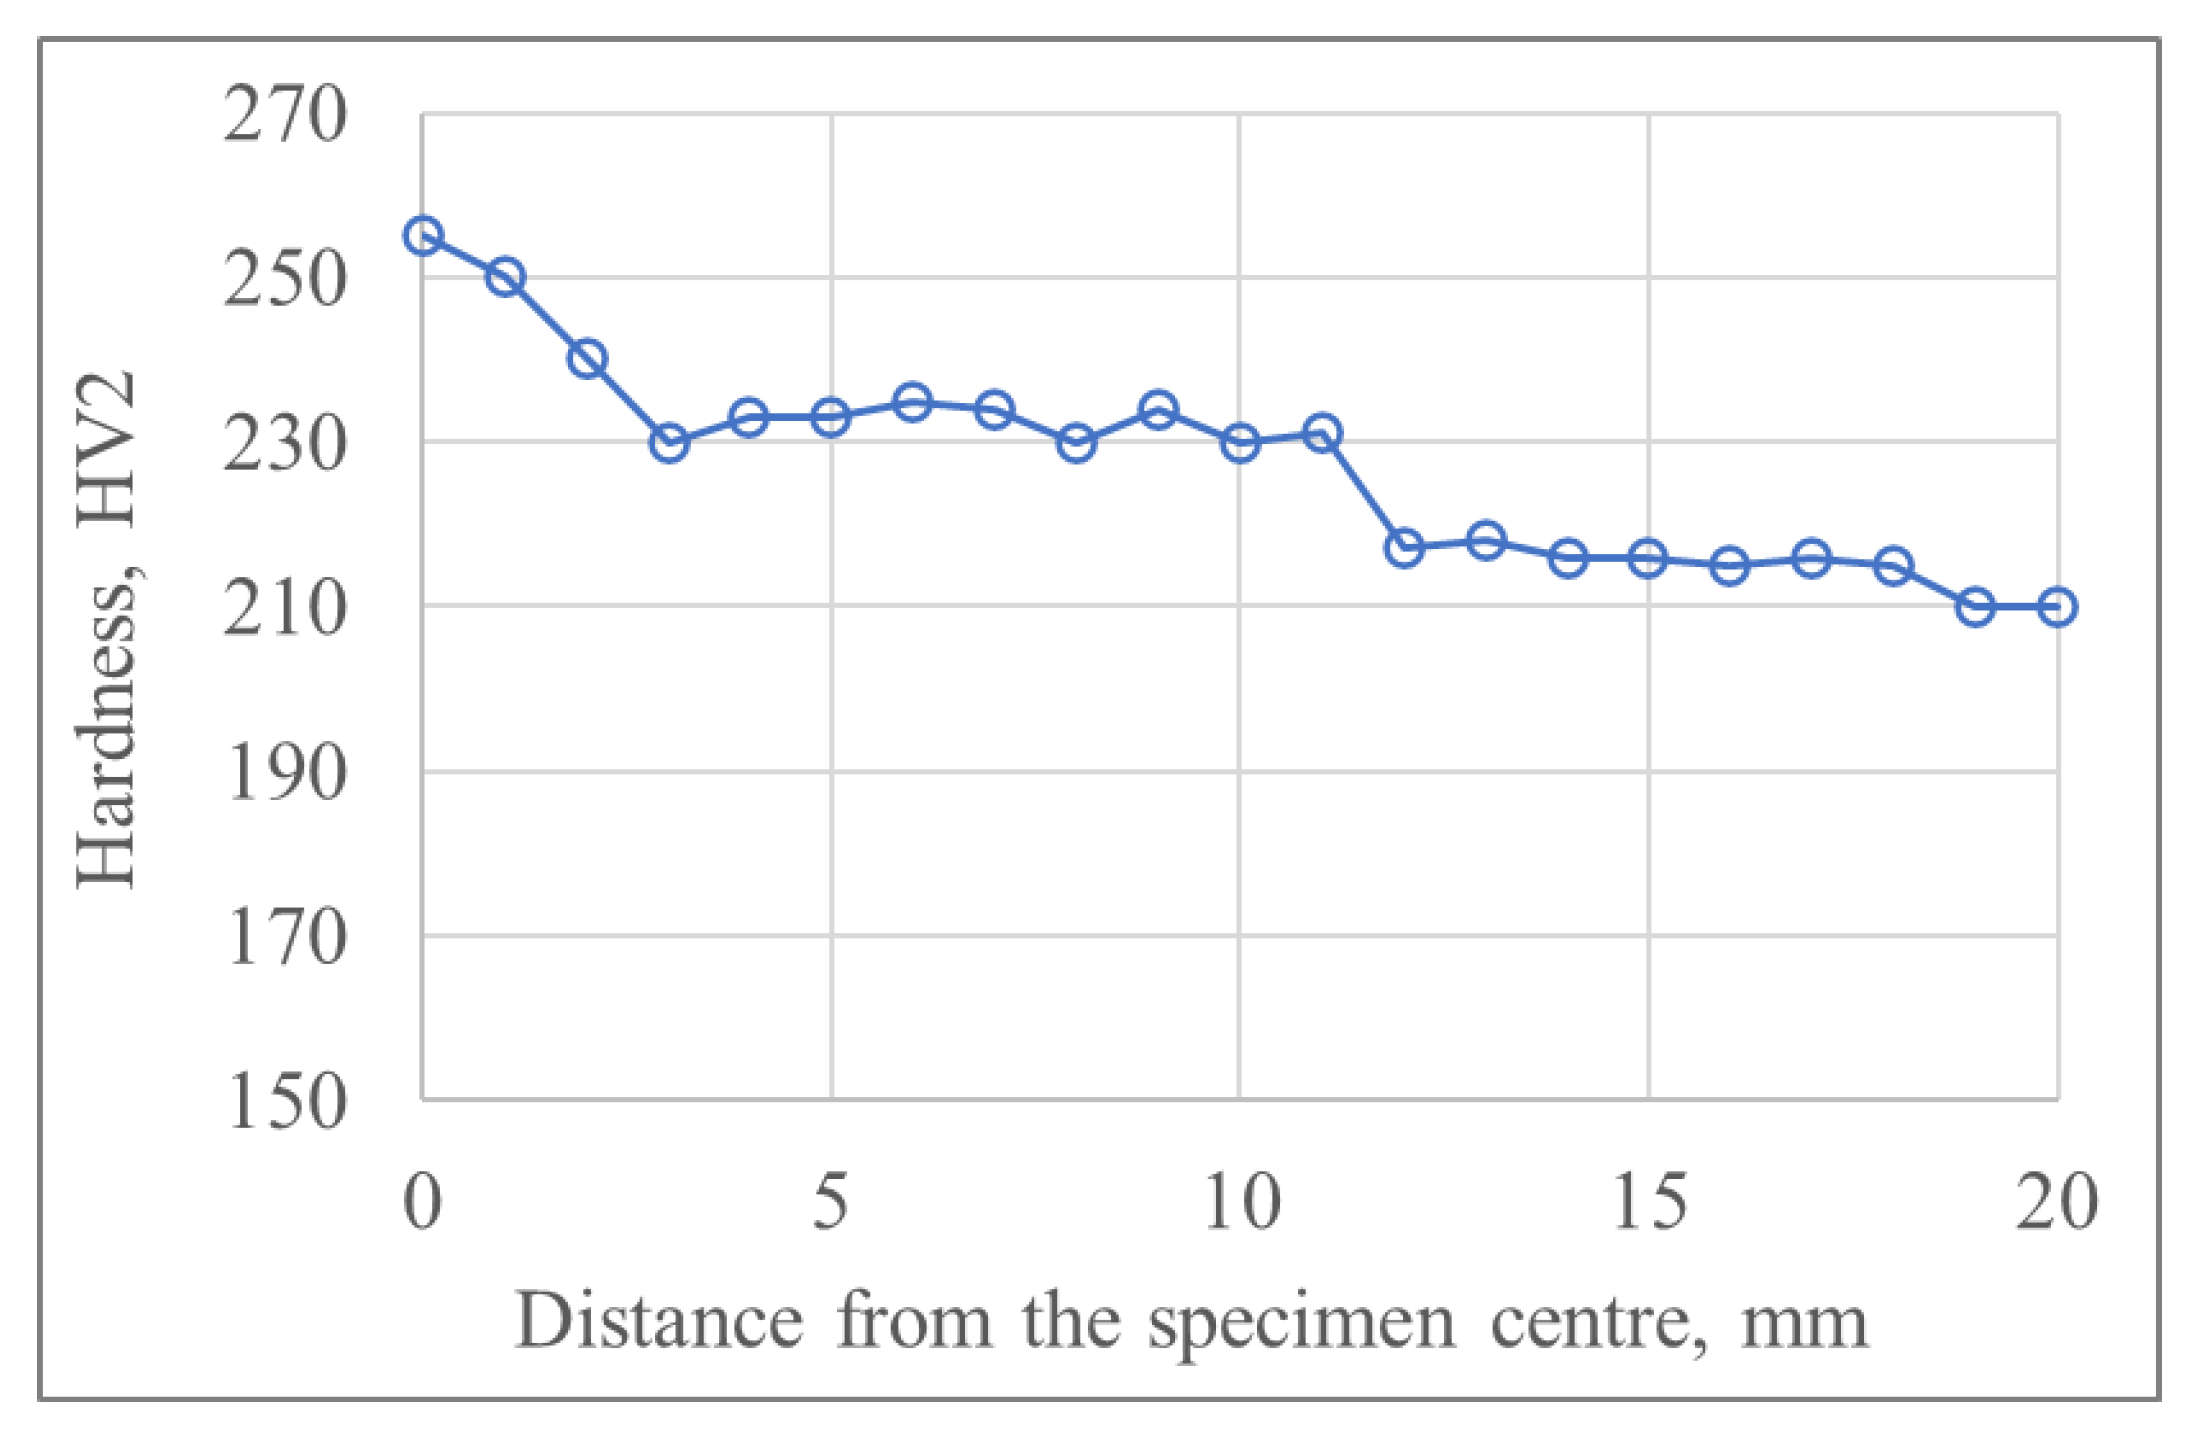
The effect of the reduction in the heating temperature with the increase in the distance from the specimen center can be highlighting analyzing the hardness profile (hardness as a function of distance from the specimen center), which has been measured along the specimen longitudinal axis after the physical simulation test. Figure 12 shows the hardness profile achieved in a USIBOR®2000 steel specimen physically simulated with the T430tq20 condition. It can be seen that within approximately 2.5 mm from the specimen center, the hardness can be considered constant, highlighting a negligible temperature gradient in the specimen central area. Moving towards cooled grips, the hardness value decreases up to a constant value that corresponds to the hardness value in the supply state (ferritic–pearlitic microstructure) for the USIBOR®2000 (~215 HV). Only in the specimen center does the thermo-mechanical cycle recorded coincide with the set one; therefore, only the hardness value close the central point has been used to analyze the effect of the thermo-mechanical cycle set. These considerations can also apply to the USIBOR®1500 steel specimens.
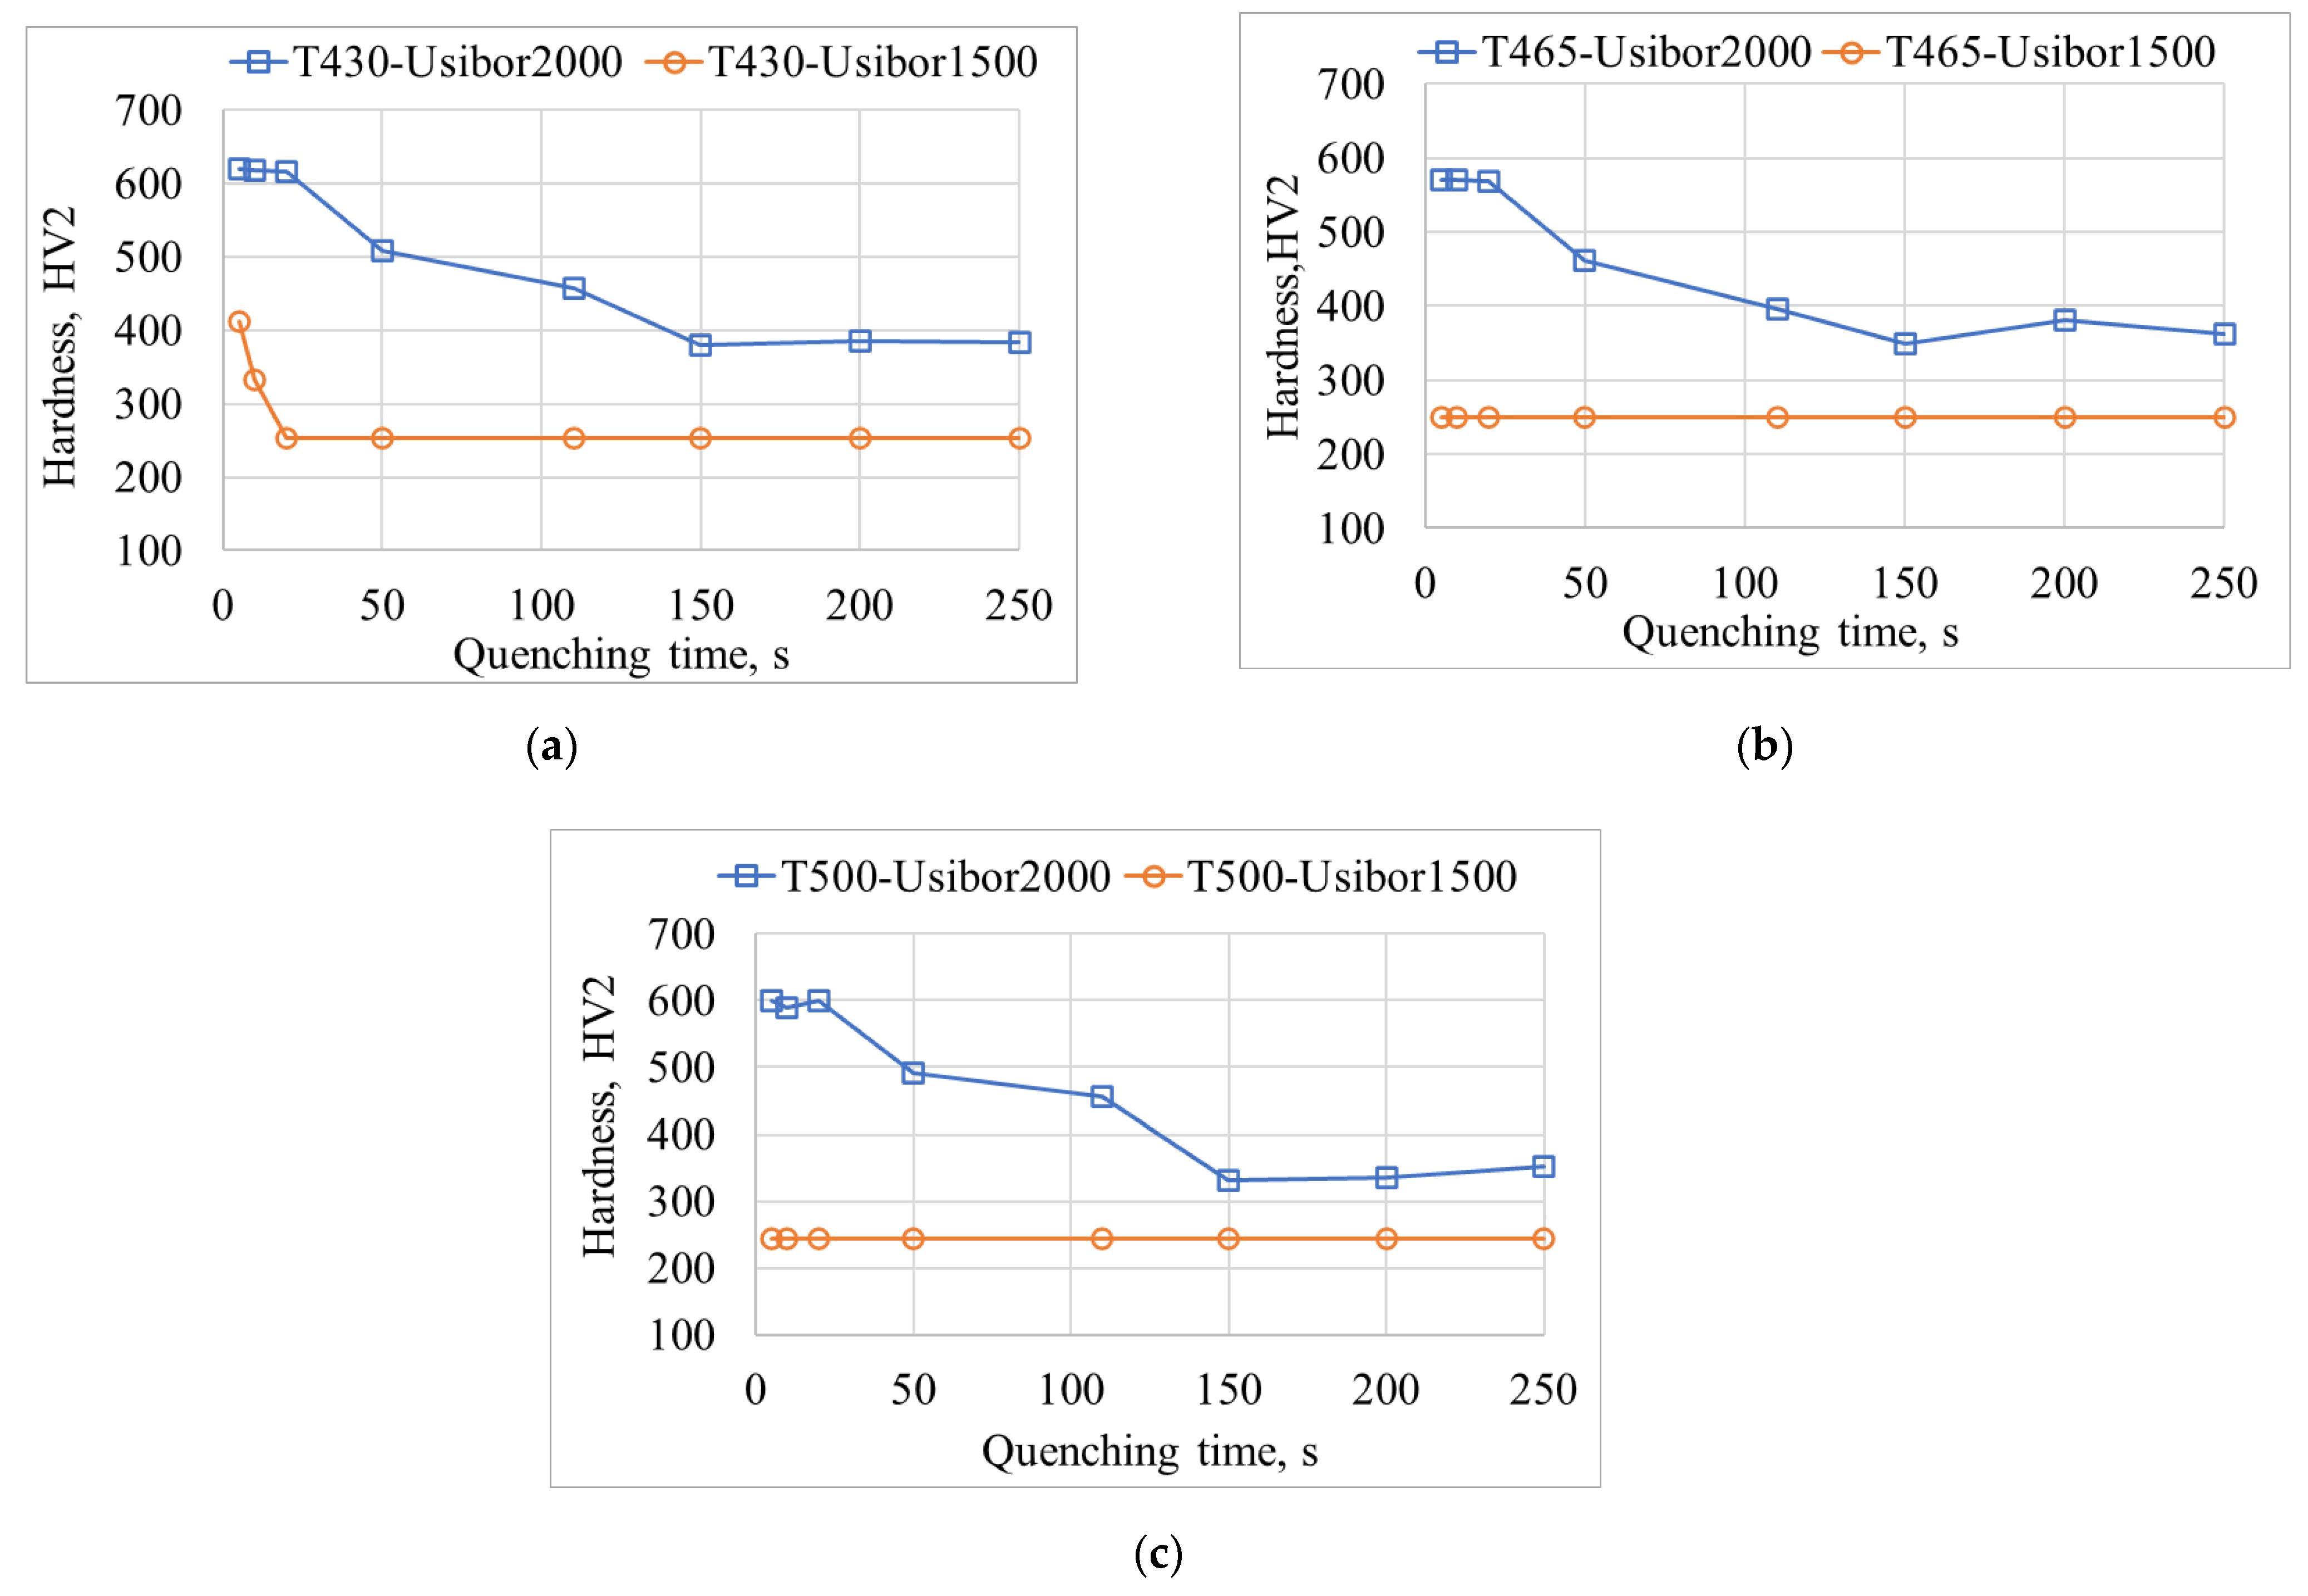
By averaging five hardness values measured on the specimen surface closed to the specimen center, the graphs in Figure 13 can be plotted. In particular, Figure 13a–c shows hardness values of the specimen center for different quenching times and a temperature of the heated tools equal to 430 °C, 465 °C and 500 °C, respectively. The hardness is an indicative parameter of the microstructure. Therefore, it can be assume that as the hardness value decreases, the percentage of transformed martensite decreases and the bainite percentage increases. When the hardness value remains constant, it can be supposed that there has been a near-complete bainitic transformation (greater softening).
By observing the behavior of the USIBOR®1500, the minimum hardness is obtained for quenching times of 20 s when the temperature of heated tools is 430 °C (orange curve with circular markers in Figure 13a). When the temperature of the heated tools is equal to 465 °C or 500 °C, the minimum hardness is reached earlier, for quenching times of 5 s (orange curve with circular markers in Figure 13b,c). In fact, the higher the temperature of the heated tools, the higher the part’s metal temperature at the end of the quenching phase and the lower the cooling rate during the air-cooling phase, leading to the complete bainitic transformation.
For the USIBOR®2000, however, it is observed that the hardness remains constant, starting from a quenching time of 150 s (blue curve with square markers in Figure 13a–c).
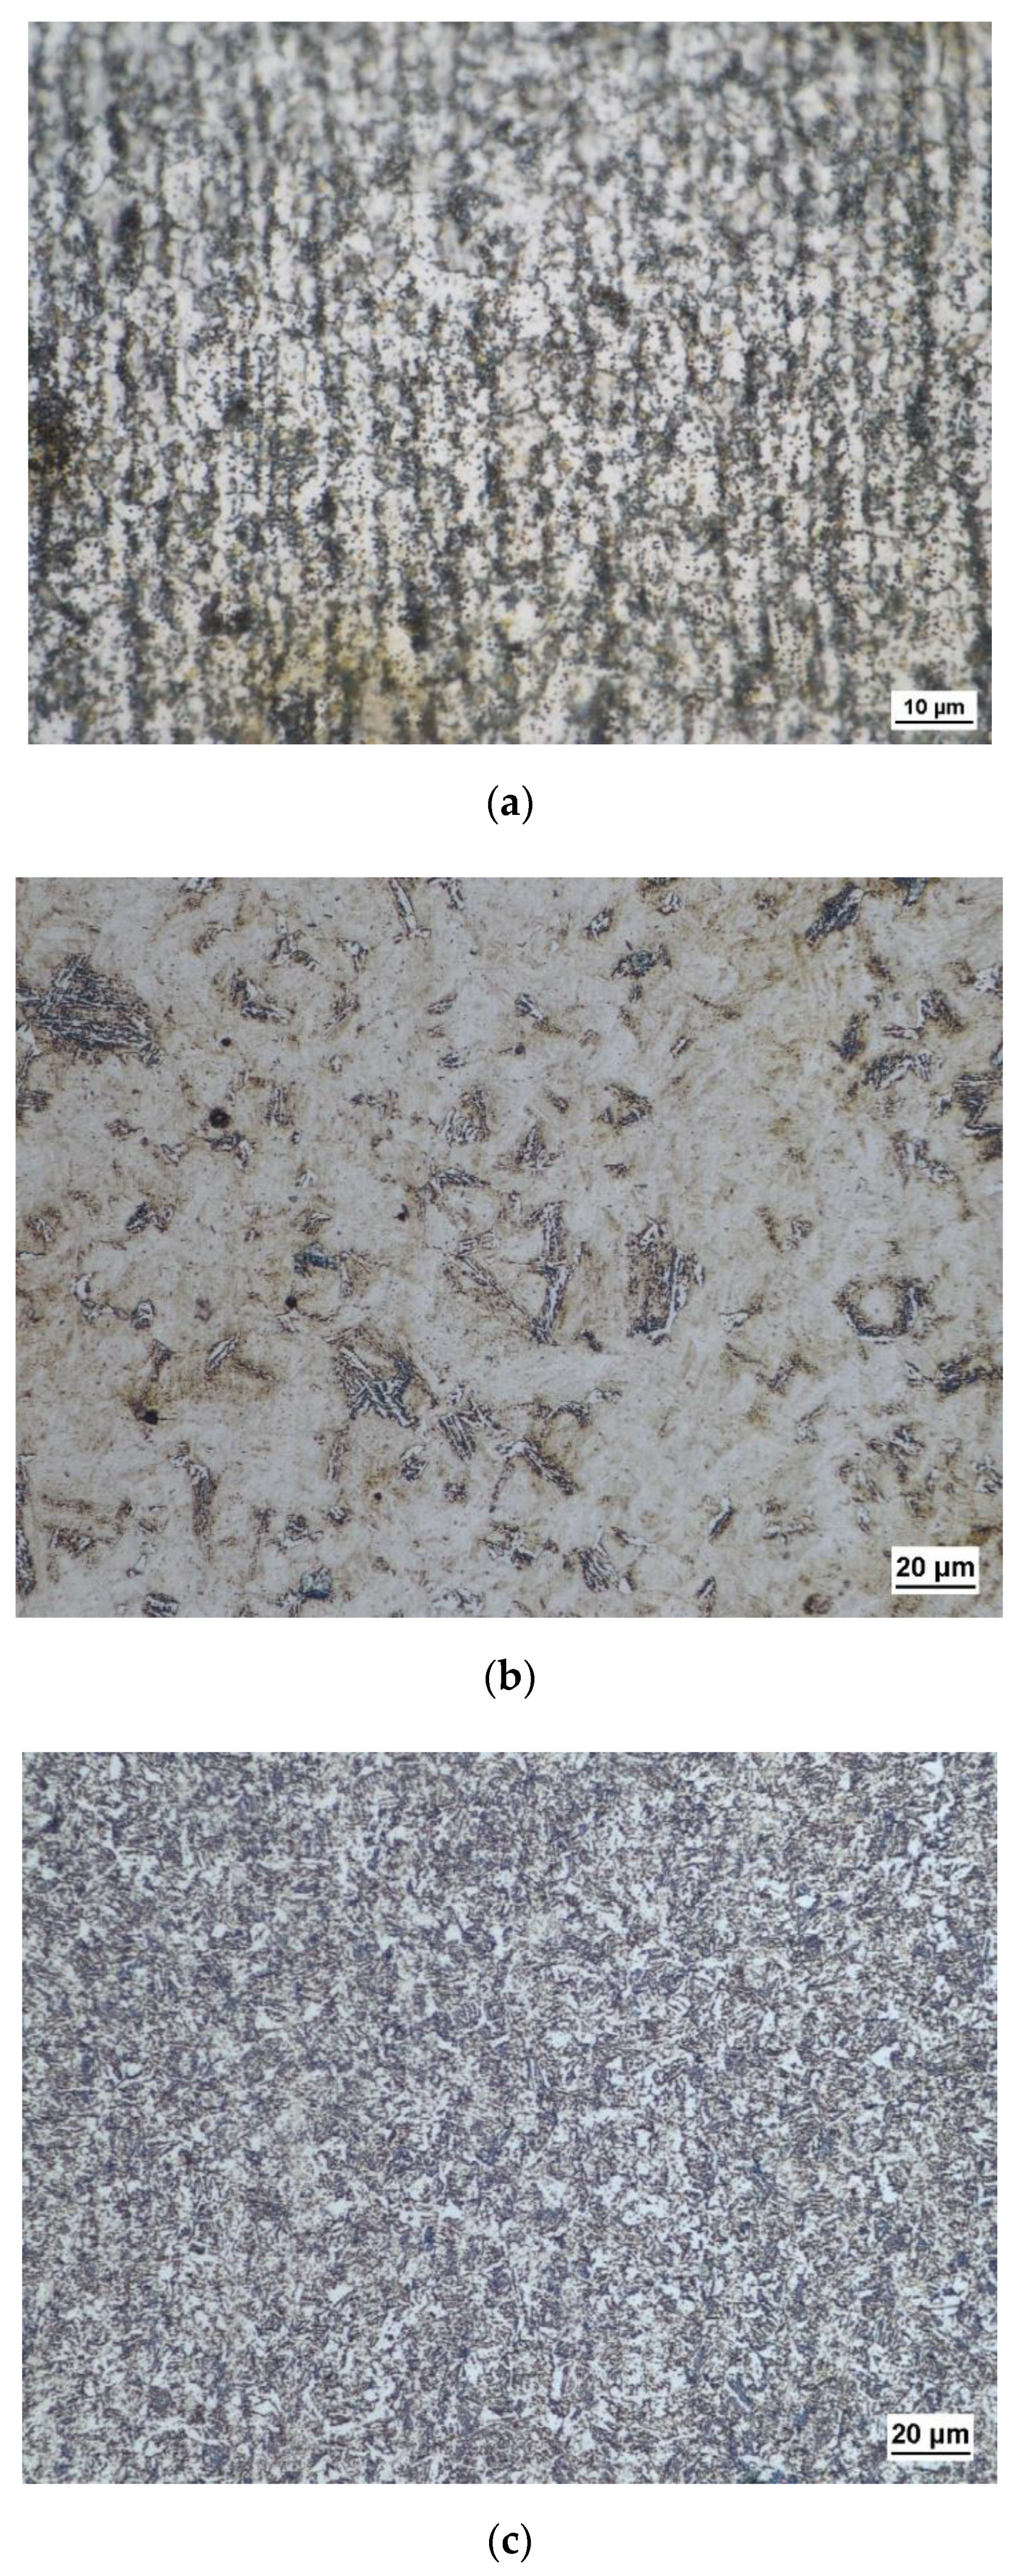
The observation of metallographic samples confirms the interpretation of the obtained hardness results. Figure 14 shows some micrographs obtained observing USIBOR®2000 steel metallographic samples with a Nikon Ig_ma200In optical microscope. Figure 14a refers to the steel in the supply state. Figure 14b,c have been obtained in the specimens’ center after physical simulation of the thermomechanical cycles corresponding to an hot tool temperature of 500 °C and quenching times of 20 s (Figure 14b) and 250 s (Figure 14c). Micrographs have been obtained by etching metallographic samples for 18–20 s in a 4% picral etchant (4 gm dry picric acid in 100 mL ethanol). In the thermomechanical cycle carried out with a quenching time of 20 s, the ferritic–pearlitic structure oriented in the rolling direction observed in Figure 14a is transformed into a predominantly martensitic structure with small islands of residual austenite (Figure 14b). With a quenching time of 250 s (Figure 14c), on the other hand, a predominantly bainitic structure is observed.
The results shown in Figure 13 highlight that USIBOR®2000 steel hardness is always greater than that of the USIBOR®1500 steel. The higher hardness before the bainitic transformation is given by the higher percentage of martensite (for the higher hardenability) and by the higher hardness of the martensite (for the higher percentage of carbon). By comparing, however, the value of the quenching time at which the two steels reach the near-complete bainitic transformation, it is possible to state that the greater softening is reached earlier for the USIBOR®1500. This is a consequence of the shifting of the CCT (continuous cooling transformation) curves at higher transformation times. This shift is observed by comparing the CCT curves of 22MnB5 obtained in [16,17,18] and the CCT curves of 37MnB5 described in the work of [18].
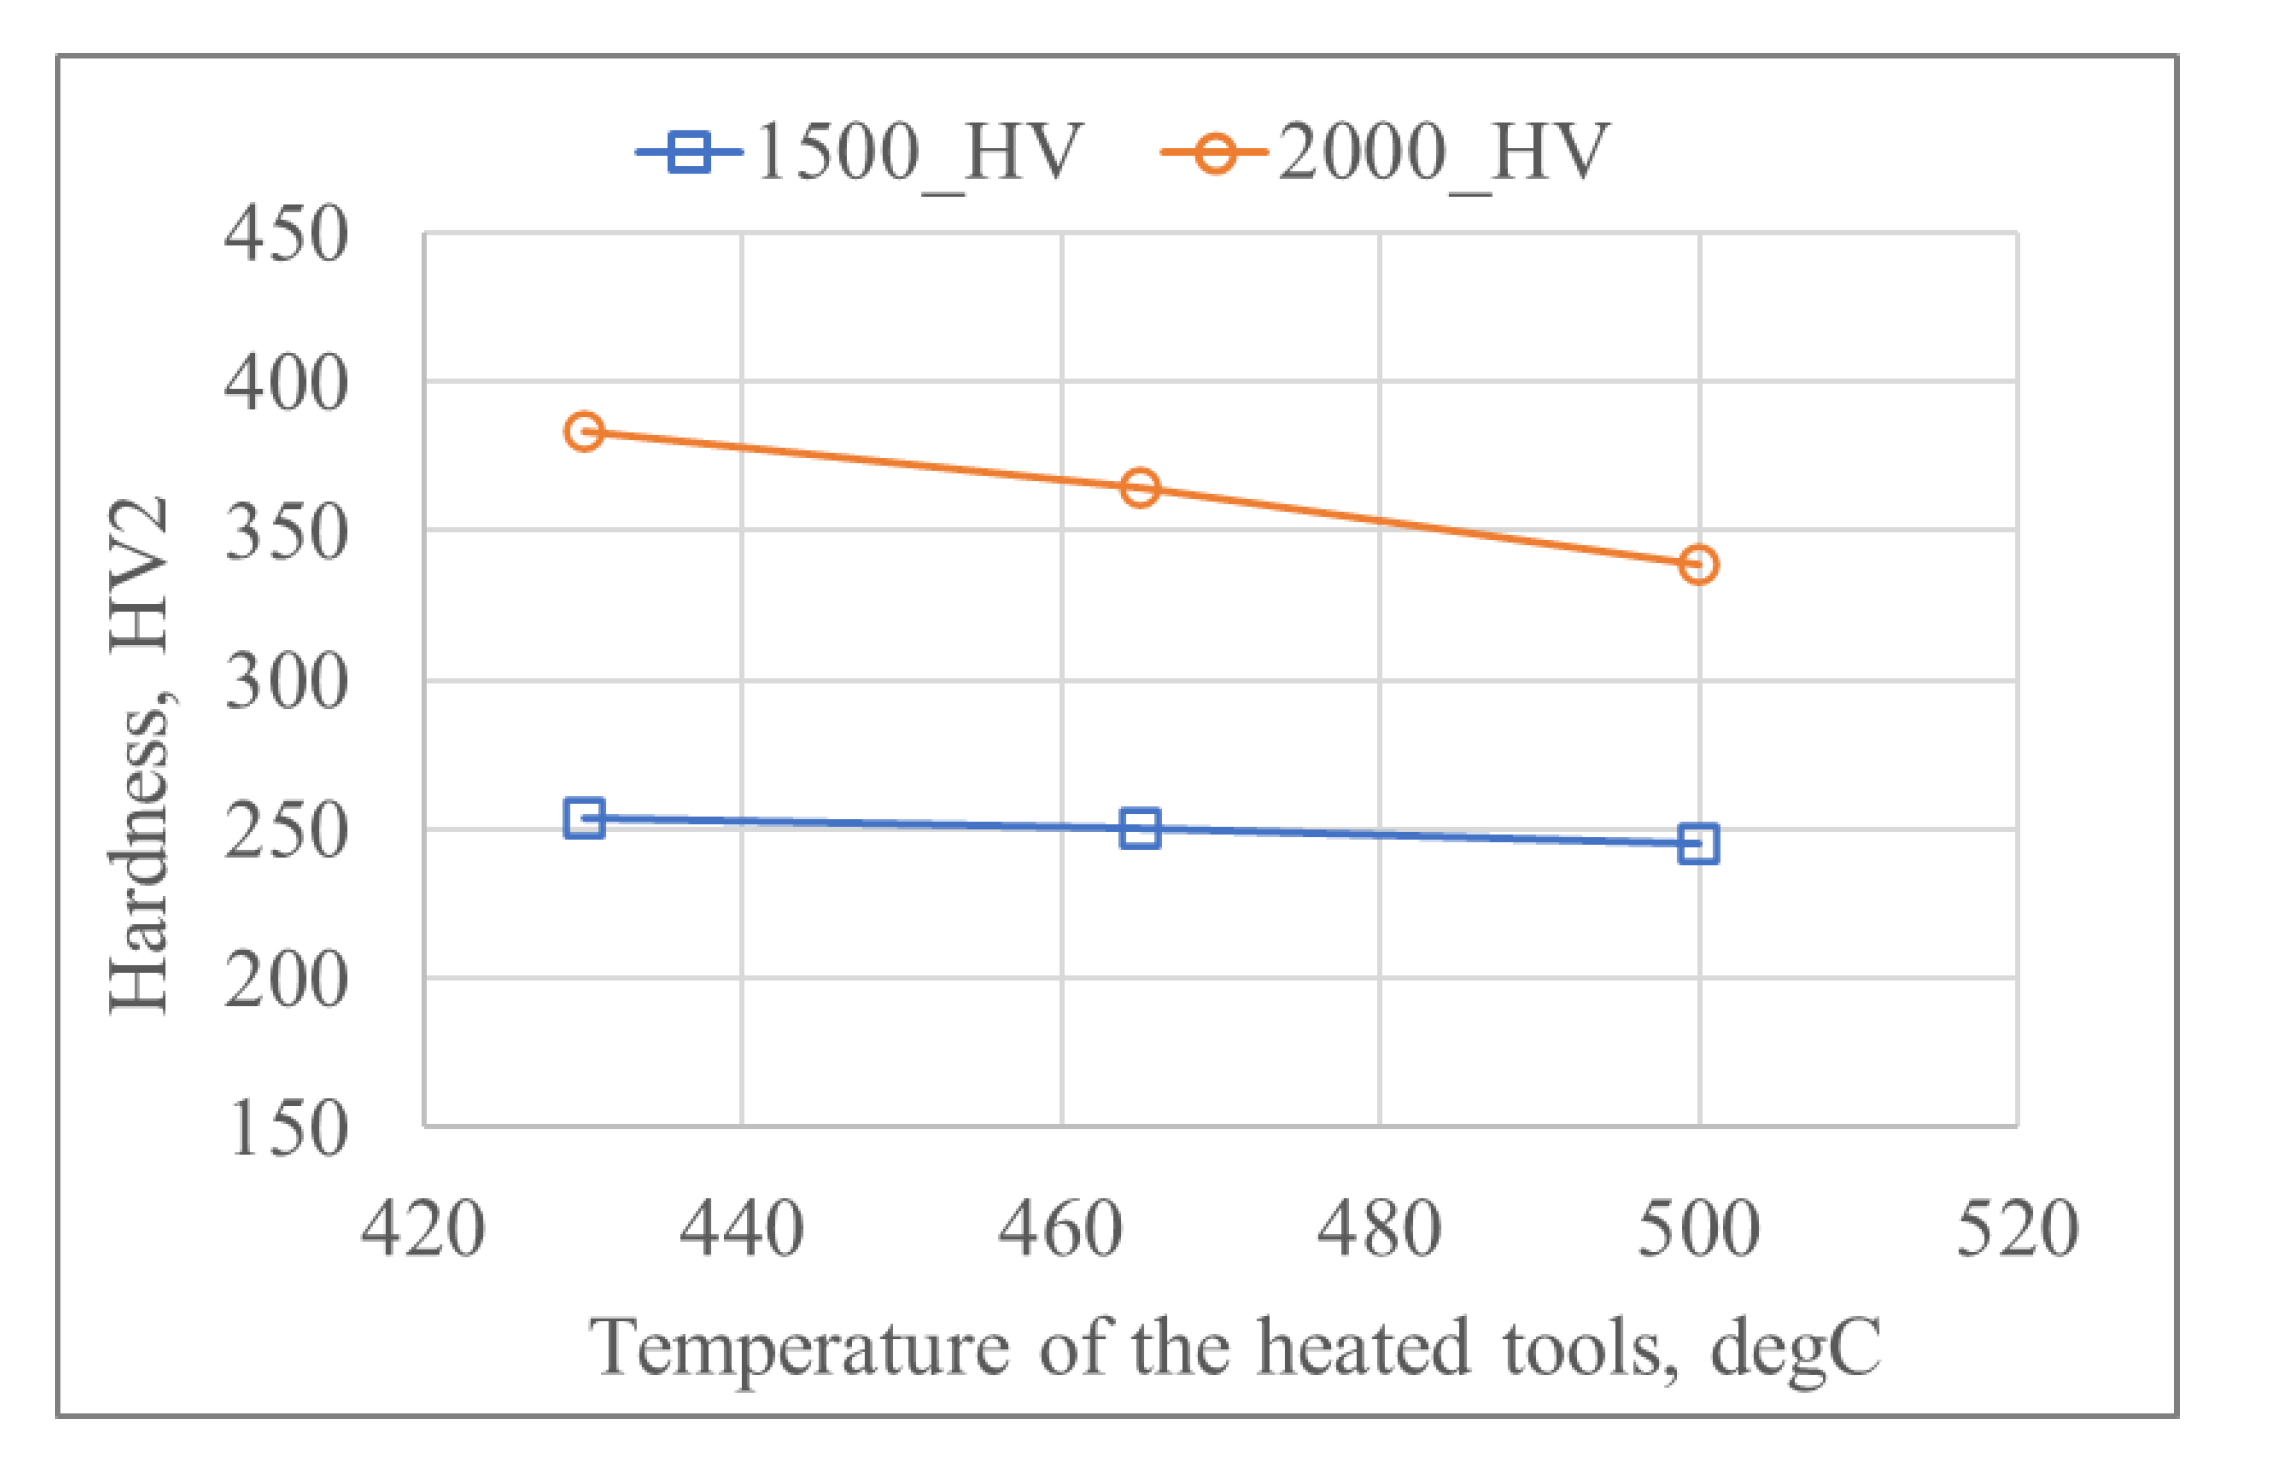
Further considerations can be made by analyzing the minimum hardness value (higher softening) as a function of temperature of heated tools for both steels (Figure 15); in particular the hardness values of the USIBOR®2000 steel are an average of the tests at quenching time equal to 150 s, 200 s and 250 s. It is possible to observe that hardness decreases with the increase in the temperature of the heated tools, especially for USIBOR®2000 steel. This can be justified by the variation of morphology of the bainitic microstructure with the transformation temperature. The hardness differences between the two UHSS at each temperature of the heated tool can be justified again due to the greater carbon percentage of the USIBOR®2000 steel.
The models developed in AutoForm are thermal–mechanical–metallurgical models; therefore, it is possible to estimate the hardness value and the percentages of microstructural phases at the end of each operation of the production line, at least for USIBOR®1500 steel. The results shown in Figure 9 highlights a good agreement with those obtained experimentally with the physical simulation of the thermomechanical cycle corresponding to a temperature of the heated tools of 500 °C and a quenching time of 20 s. In node A, taken as a reference, a hardness of 267 HV is recorded. The percentage error of the experimental result with respect to the FE one is about of 5%. In correspondence with node A, Figure 9 also shows the pie diagram of the microstructural percentages. From this pie chart, it is observed that the complete bainitic transformation actually took place.
With the aim of also comparing the two UHSS steels in terms of elongation at break in the condition of greater softening, the Gleeble thermo-mechanical cycles in the conditions that guarantee the minimum hardness are repeated to subsequently perform tensile tests. For all temperatures of the heated tools investigated, the physically simulated thermo-mechanical cycles are those relating to a quenching time equal to 200 s for the USIBOR®2000 and equal to 20 s for the USIBOR®1500.
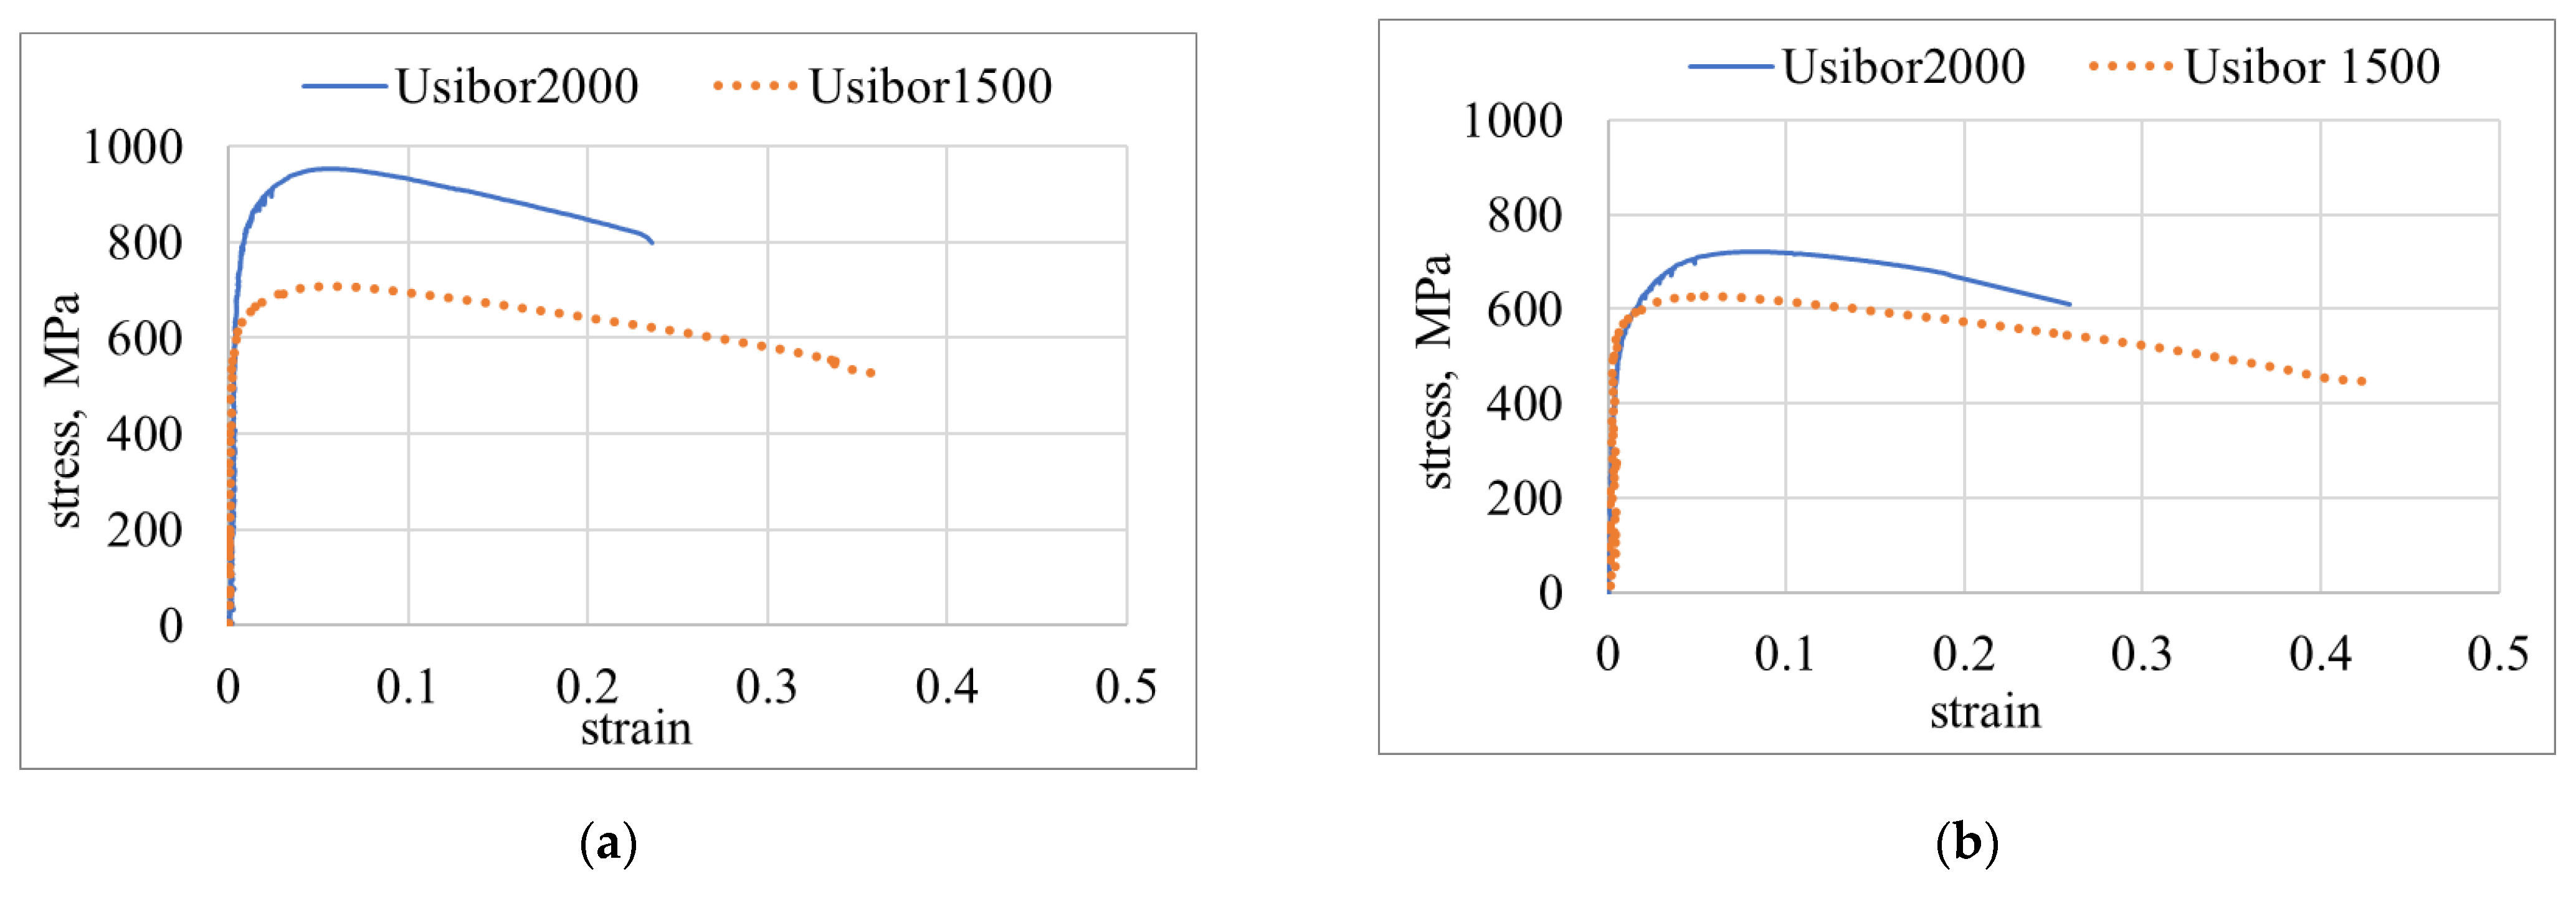
The stress–strain curves obtained are compared in Figure 16. Only the extremes values of the temperatures of the heated tools investigated are shown: 430 °C (Figure 16a) and 500 °C (Figure 16b). From the graphs in Figure 16, as expected, a greater ultimate tensile strength as well as a lower elongation is observed for the USIBOR®2000 compared to the USIBOR®1500. Furthermore, for both investigated steel, by reducing the temperature of heated tools, there is an increase in mechanical strength and a decrease in the strain at the fracture.
The results shown in Figure 16 show that the ductile zone of the B-Pillar in USIBOR®1500 steel has elongations greater than 30% and 40% by varying the temperature of the heated tool from 430 °C to 500 °C. The sufficiently low quenching time used is interesting for an industrial application of the press-hardening process with the TTT approach. The ductile zone of the Pillar in USIBOR®2000 steel shows a more contained increase in elongation, but always greater than 20%. However, due to the higher hardenability of USIBOR®2000 steel, quenching time is excessive.
Observing the hardness profile shown in Figure 12, a reduction in the quenching time could be obtained by differentiating the blank heating temperature (following a TBH approach), since at 10 mm from the specimen center a hardness of about 270 HV is reached (equivalent to the hardness value obtained on the USIBOR®1500 in the condition of complete bainitic transformation). The physical simulation of the corresponding hot stamping process is designed with a heating phase up to 750 °C, a tool temperature of 80 °C and a quenching time equal to 20 s. Imposing this new thermal cycle in the central point of USIBOR®2000 steel specimen, the hardness profile obtained after physical simulation confirms about 250 HV in the specimen center (Figure 17), while tensile test shows an elongation of about 20%. This elongation value is lower than those obtained with the TTT approach with a quenching time of 200 s, probably due the lower microstructure homogeneity obtained with the partial austenitization of the steel in the supply state (Figure 14a).
This solution requires more in-depth analysis, but it is potentially of interest for the industrial production of part in USIBOR®2000 steel by press-hardening with a TBH approach.
4. Conclusions
This work compares the steels with different hardenability USIBOR®1500 and USIBOR®2000 in the industrial application of a press-hardening process with a TTT approach. The press-hardening of a B-Pillar has been chosen as a case study, characterized by the need to have areas with a more ductile bainitic microstructure and an area with a more strength martensitic microstructure. The study is performed using a numerical-experimental approach. In particular, a Finite Element (FE) model has been developed in AutoForm for the numerical process simulation of a B-Pillar. The design of the FE model has been supported by a preliminary experimental activity aimed at modeling the hardening curves of the USIBOR®2000 steel, as they are not present in the simulation software library. Using Gleeble 3180 system, specimens have been heated up to the steel austenitization temperature and then rapidly cooled at the temperatures of 750 °C, 800 °C and 850 °C with the aim to characterize the austenitic phase of the steel; for each testing temperature, the strain rates of 0.01 s−1, 0.1 s−1, 1 s−1 have been investigated. The hardening curves obtained confirm that material strength reduces with the increase in testing temperature and the decrease in strain rate, while softening effects are more evident at higher testing temperatures and lower strain rates. Moreover, by comparing the hardening curves of the two steels, it is observed that the USIBOR®2000 steel has a higher mechanical strength at the same strain rate and testing temperature. Preliminary simulations of the B-Pillar press-hardening process showed that the need to have a bainitic microstructure in the ductile areas of the piece is conditioned by the process parameters of the hardening phase of the B-Pillar production line. In particular, the quenching time (in the range 20–250 s) and the temperature of the heated tools (in the range 430–500 °C) have been studied for both steels. For each FE simulation, the thermo-mechanical cycle in a node of the part ductile area has been post-processed and imposed by the Gleeble system on the central point of USIBOR®1500 and USIBOR®2000 steel specimens. After the physical simulation tests, tensile tests, hardness tests and metallographic analyzes have been performed. The obtained results allow us to draw the following conclusions:
- For each temperature of the heated tools, increasing the quenching time the hardness reduces until it reaches a constant value. Considering steel hardness as representative of its microstructure, it can be stated that a near-complete bainitic transformation is achieved when hardness reaches a constant value. For the USIBOR®1500 steel, the constant hardness value is obtained for quenching times of 20 s when the temperature of heated tools is 430 °C, while when the quenching tool temperature is of 465 °C or 500 °C, the constant hardness value is reached earlier, even for quenching times of 5 s. The reduction in quenching time at higher temperature of the heated tools is justified by the higher part temperature at the end of quenching phase, contributing to the predominant bainitic transformation of residual austenite during the in air-cooling of the quenched part, before reaching the martensite start temperature. On the other hand, for the USIBOR®2000 steel, the constant hardness value is measured for quenching time of 150 s, independently from the temperature of heated tools investigated. The higher quenching time for the near-complete bainitic transformation of USIBOR®2000 steel is justified by its greater carbon content and then its greater hardenability.
- In correspondence of the greater softening, the hardness of USIBOR®2000 steel is higher than that of USIBOR®1500 steel, but in terms of softening of the ductile zone of the B-Pilar with respect the strength zone, results are comparable (50% for the USIBOR®1500 steel, while in the range 55–60% for the USIBOR®2000 steel). The higher mechanical strength of USIBOR®2000, due to its greater carbon percentage, has been confirmed by tensile tests. The same tests highlighted a sensible elongation increase in the ductile zone with respect to the strength zone. Tensile tests on USIBOR®1500 shows elongations that are greater than 30% and 40% by varying the temperature of the heated tool from 430 °C to 500 °C, while USIBOR®2000 steel shows a more contained increase in elongation, but always greater than 20%.
- By comparing quenching time in correspondence of the minimum constant hardness value, USIBOR®1500 steel shows values in the range of 5–20 s, by varying the temperature of the heated tools from 500 °C to 430 °C. These results are very attractive for the industrial manufacturing of parts in USIBOR®1500 steel using a press-hardening process with a TTT approach. Due to the higher hardenability of USIBOR®2000 steel, quenching time observed are excessive (about 150 s for each temperature of the heating tools analyzed).
- Physical simulation of USIBOR®2000 steel specimens showed that softening of P-Pillar areas with short quenching times, could be obtained by differentiating the blank heating temperature (following a TBH approach). Assuming a heating phase up to 750 °C, a tool temperature of 80 °C and a quenching time equal to 20 s, the experimental results show a ductile zone of about 250 HV and an elongation of about 20%.
- Finally, physical simulation combined with numerical simulation proved to be a valid tool for designing the press-hardening process. The proposed approach allows us to reproduce in a laboratory and in small samples the same thermo-mechanical cycles that are realized on the industrial production line in specific zones of the part. The subsequent tensile and hardness tests on the samples aim to predict the mechanical properties of the post-forming component. In this way, there is a saving in terms of costs and waste.
Author Contributions
Conceptualization, M.E.P.; methodology, M.E.P. and L.T.; software, M.E.P.; investigation, M.E.P. and L.T.; resources, M.E.P. and L.T.; data curation, M.E.P.; formal analysis, M.E.P. and F.R.G.; writing—original draft preparation, M.E.P.; writing—review and editing, M.E.P. and L.T.; supervision, L.T.; project administration, L.T.; funding acquisition, L.T. All authors have read and agreed to the published version of the manuscript.
Funding
This research was funded by MIUR-Ministero dell’Istruzione dell’Università e della Ricerca (PICO&PRO project—COD.ID.ARS01_01061).
Institutional Review Board Statement
Not applicable.
Informed Consent Statement
Not applicable.
Acknowledgments
The authors are grateful to MIUR (PICO&PRO project) for funding this research. The authors would like also to acknowledge AutoForm and Fiat Research Centre (CRF) for the technical support in numerical and physical simulations. Finally, the authors wish to thank the engineer Paolo Posa for his support in laboratory activities.
Conflicts of Interest
The authors declare no conflict of interest.
References
- Huang, G.; Tihay, K.; Sriram, S.; Weber, B.; Dietsch, P.; Cornette, D. Fracture characterization of AHSS using two different experimental methods. IOP Conf. Ser. Mater. Sci. Eng. 2018, 418, 012080. [Google Scholar] [CrossRef] [Green Version]
- Valentini, R.; Tedesco, M.M.; Corsinovi, S.; Bacchi, L.; Villa, M. Investigation of mechanical tests for hydrogen embrittlement in automotive PHS steels. Metals 2019, 9, 934. [Google Scholar] [CrossRef] [Green Version]
- Taylor, T.; Fourlaris, G.; Evans, P.; Bright, G. New generation ultrahigh strength boron steel for automotive hot stamping technologies. Mater. Sci. Technol. 2013, 30, 818–826. [Google Scholar] [CrossRef]
- Karbasian, H.; Tekkaya, A.E. A review on hot stamping. J. Mater. Process. Technol. 2010, 210, 2103–2118. [Google Scholar] [CrossRef]
- Liu, S.; Long, M.; Zhang, S.; Zhao, Y.; Zhao, J.; Feng, Y.; Chen, D.; Ma, M. MaM Study on the prediction of tensile strength and phase transition for ultra-high strength hot stamping steel. J. Mater. Res. Technol. 2020, 9, 14244–14253. [Google Scholar] [CrossRef]
- Taylor, T.; McCulloch, J. Effect of Part/Die Boundary Conditions on Microstructural Evolution during Hot Stamping 2000 MPa Class Boron Steel. Steel Res. Int. 2018, 89, 1700495. [Google Scholar] [CrossRef]
- Merklein, M.; Wieland, M.; Lechner, M.; Bruschi, S.; Ghiotti, A. Hot stamping of boron steel sheets with tailored properties: A review. J. Mater. Process. Technol. 2016, 228, 11–24. [Google Scholar] [CrossRef]
- Georgiadis, G.; Tekkaya, A.; Weigert, P.; Weiher, J.; Kurz, H. Investigations on the Manufacturability of Thin Press Hardened Steel Components. Procedia CIRP 2014, 18, 74–79. [Google Scholar] [CrossRef] [Green Version]
- Lei, C.; Xing, Z.; Xu, W.; Hong, Z.; Shan, D. Hot stamping of patchwork blanks: Modelling and experimental investigation. Int. J. Adv. Manuf. Technol. 2017, 92, 2609–2617. [Google Scholar] [CrossRef]
- Boeke, J.; Krogmeier, J.; Reinhold, P. Continuous Furnace Used in the Production of Vehicle Components, eg B-Columns, Comprises Two Zones Lying Opposite Each Other and Separated from Each Other by a Thermal Insulating Separating Wall. Germany Patent DE10256621B3, 12 March 2002. [Google Scholar]
- Zhou, J.; Wang, B.-Y.; Huang, M.-D.; Cui, D. Effect of hot stamping parameters on the mechanical properties and microstructure of cold-rolled 22MnB5 steel strips. Int. J. Miner. Met. Mater. 2014, 21, 544–555. [Google Scholar] [CrossRef]
- Palmieri, M.E.; Lorusso, V.D.; Tricarico, L. Laser-induced softening analysis of a hardened aluminum alloy by physical simulation. Int. J. Adv. Manuf. Technol. 2020, 111, 1503–1515. [Google Scholar] [CrossRef]
- AutoForm R8 Software Manual, Release R8; AutoForm Engineering GmbH: Freienbach, Switzerland, 7 December 2018.
- Javaheri, E.; Lubritz, J.; Graf, B.; Rethmeier, M. Mechanical Properties Characterization of Welded Automotive Steels. Metals 2019, 10, 1. [Google Scholar] [CrossRef] [Green Version]
- Zhang, Z.; Hauge, M.; Thaulow, C.; Ødegård, J. A notched cross weld tensile testing method for determining true stress–strain curves for weldments. Eng. Fract. Mech. 2002, 69, 353–366. [Google Scholar] [CrossRef]
- Naderi, M.; Durrenberger, L.; Molinari, A.; Bleck, W. Constitutive relationships for 22MnB5 boron steel deformed isothermally at high temperatures. Mater. Sci. Eng. A 2008, 478, 130–139. [Google Scholar] [CrossRef]
- Xu, Y.; Ji, Q.; Yang, G.; Bao, S.; Zhao, G.; Miao, X.; Mao, X. Effect of Cooling Path on Microstructures and Hardness of Hot-Stamped Steel. Metals 2020, 10, 1692. [Google Scholar] [CrossRef]
- Naderi, M.; Bleck, W. Hot Stamping of Ultra High Strength Steels; Lehrstuhl und Institut für Eisenhüttenkunde: Aachen, Germany, 2008. [Google Scholar]
Figure 1.
(a) Setup for Gleeble tests; (b) Scheme of thermo-mechanical cycles imposed on Gleeble system.
Figure 1.
(a) Setup for Gleeble tests; (b) Scheme of thermo-mechanical cycles imposed on Gleeble system.

Figure 2.
Geometry of specimen in USIBOR®2000 for hot tensile test with Gleeble system.

Figure 3.
(a) Forming tools modeled in AutoForm; (b) Punch modeled in heated and cooled parts.

Figure 4.
FLCs for USIBOR®1500.

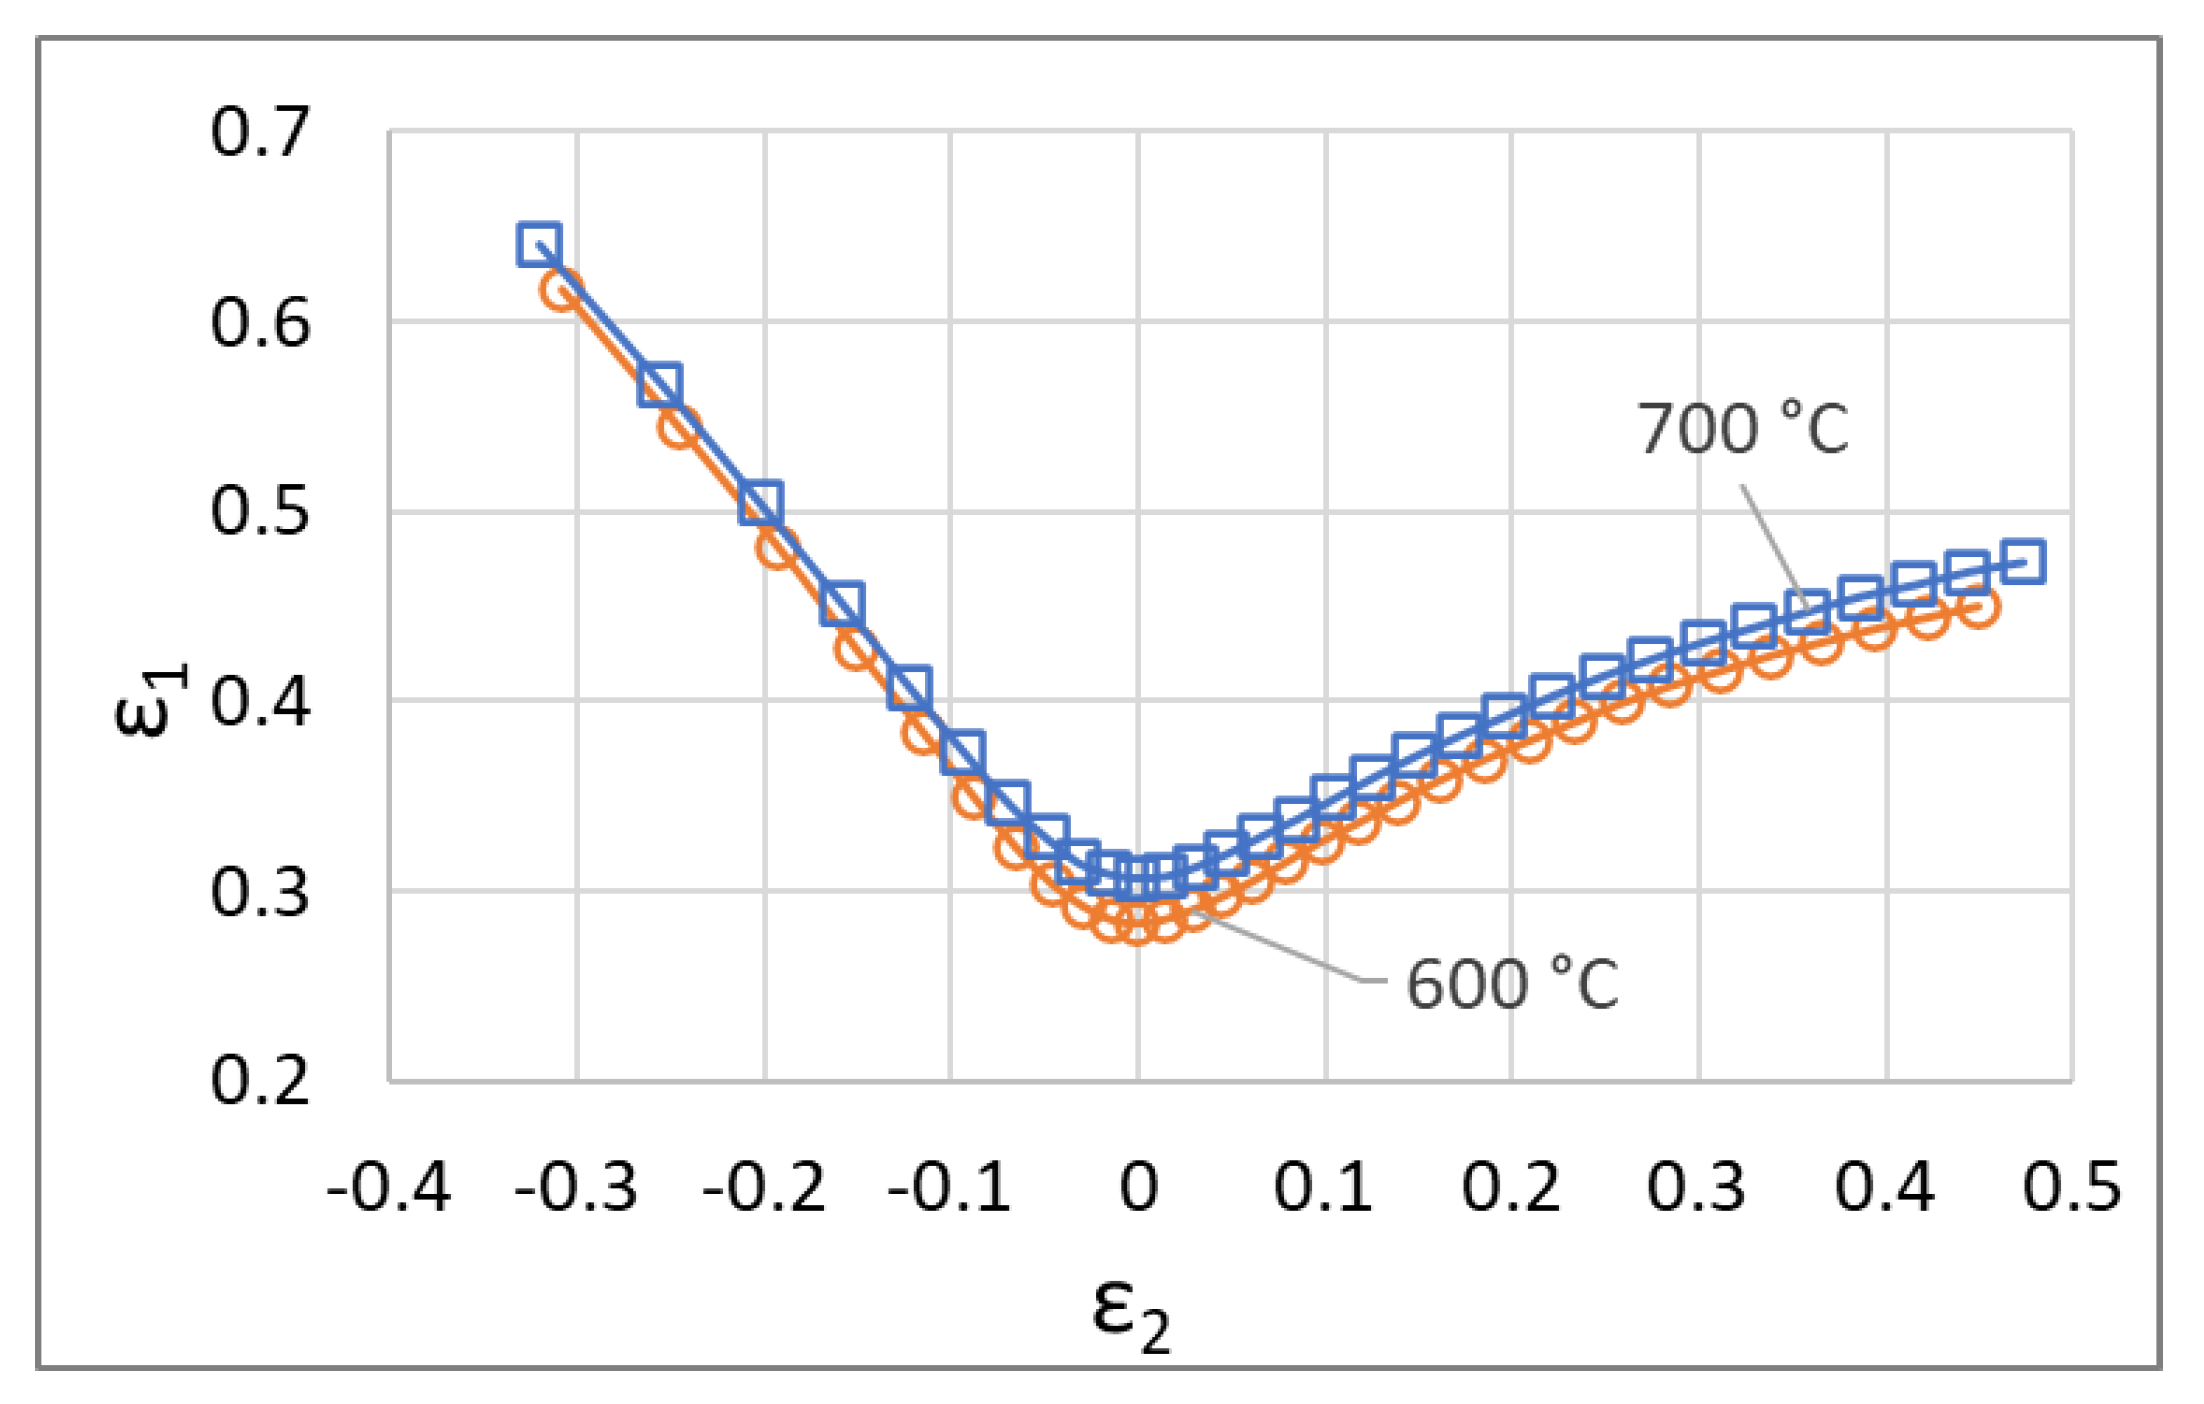
Figure 5.
FLC for USIBOR®2000.

Figure 6.
(a) Experimental equipment for uniaxial tensile test; (b) speckled notched specimen.

Figure 7.
Stress–strain curves of USIBOR®2000 under different strain rate (1 s−1, 0.1 s−1, 0.01 s−1) for different test temperatures: (a) 850 °C, (b) 800 °C, (c) 750 °C.
Figure 7.
Stress–strain curves of USIBOR®2000 under different strain rate (1 s−1, 0.1 s−1, 0.01 s−1) for different test temperatures: (a) 850 °C, (b) 800 °C, (c) 750 °C.

Figure 8.
True stress–strain curves of the USIBOR®1500 and the USIBOR®2000 for a strain rate of 0.01 s−1 and temperatures of 800 °C and 850 °C.
Figure 8.
True stress–strain curves of the USIBOR®1500 and the USIBOR®2000 for a strain rate of 0.01 s−1 and temperatures of 800 °C and 850 °C.

Figure 9.
Distribution of the desired microstructure on the component at the end of the process (FE model with the USIBOR®1500 material for temperature of heated tools of 500 °C and quenching time of 50 s).
Figure 9.
Distribution of the desired microstructure on the component at the end of the process (FE model with the USIBOR®1500 material for temperature of heated tools of 500 °C and quenching time of 50 s).

Figure 10.
Example of a thermo-mechanical cycle extracted from FE model for USIBOR2000 with quenching time of 50 s and tool temperature of 500 °C.
Figure 10.
Example of a thermo-mechanical cycle extracted from FE model for USIBOR2000 with quenching time of 50 s and tool temperature of 500 °C.

Figure 11.
Thermal cycles recorded by the thermocouples during the Gleeble tests on USIBOR®2000 specimen in the condition of temperature of heated tools equal to 430 °C and quenching time 20 s.
Figure 11.
Thermal cycles recorded by the thermocouples during the Gleeble tests on USIBOR®2000 specimen in the condition of temperature of heated tools equal to 430 °C and quenching time 20 s.

Figure 12.
Hardness values along longitudinal direction of USIBOR®2000 specimen for the condition of temperature of heated tools equal to 430 °C and quenching time equal to 20 s.
Figure 12.
Hardness values along longitudinal direction of USIBOR®2000 specimen for the condition of temperature of heated tools equal to 430 °C and quenching time equal to 20 s.

Figure 13.
(a). Hardness values for different quenching time at temperature of 430 °C; (b) Hardness values for different quenching time at temperature of 465 °C; (c) Hardness values for different quenching time at temperature of 500 °C.
Figure 13.
(a). Hardness values for different quenching time at temperature of 430 °C; (b) Hardness values for different quenching time at temperature of 465 °C; (c) Hardness values for different quenching time at temperature of 500 °C.

Figure 14.
(a) Microstructure of USIBOR®2000 steel in the supply state (1000×). (b) Microstructure of the USIBOR®2000 steel obtained in the specimen central point with the T500tq20 condition (1000×). (c) Microstructure of the USIBOR®2000 steel obtained in the specimen central point with the T500tq250 condition (1000×).

Figure 15.
Hardness trend as a function of temperature of heated tools in the condition of greater softening.
Figure 15.
Hardness trend as a function of temperature of heated tools in the condition of greater softening.

Figure 16.
(a) Stress–strain curves for the two UHSS in the condition of heated tools temperature of 430 °C; (b) Stress–strain curves for the two UHSS in the condition of heated tools temperature of 500 °C.
Figure 16.
(a) Stress–strain curves for the two UHSS in the condition of heated tools temperature of 430 °C; (b) Stress–strain curves for the two UHSS in the condition of heated tools temperature of 500 °C.

Figure 17.
Hardness trend along the longitudinal direction of the specimen in USIBOR®2000 (Gleeble thermal cycle of TBH approach).
Figure 17.
Hardness trend along the longitudinal direction of the specimen in USIBOR®2000 (Gleeble thermal cycle of TBH approach).


Table 1.
Chemical composition for USIBOR®2000 and USIBOR®1500, wt-%.
| Material | C | Mn | Si | B | Fe |
|---|---|---|---|---|---|
| USIBOR®2000 | 0.36 | 0.80 | 0.80 | 0.005 | balanced |
| USIBOR®1500 | 0.25 | 1.4 | 0.4 | 0.005 | balanced |
Table 2.
Mechanical properties for USIBOR®2000 and USIBOR®1500.
| Material | Yield Strength (MPa) | Tensile Strength (MPa) | Elongation at Break A50 [2] (%) |
|---|---|---|---|
| USIBOR®2000 | ≥1400 | ≥1800 | 6 |
| USIBOR®1500 | ≥1050 | ≥1400 | 7 |
Table 3.
Values of process parameters adopted during FE simulation of TTT-press-hardening process.
| Process Parameters | Values |
|---|---|
| Friction coefficient | 0.4 |
| Transport time (s) | 7.5 |
| Forming velocity (mm/s) | 200 |
| Temperature of blank (°C) | 930 |
| Quenching force (kN) | 1.2 × 10⁴ |
Table 4.
Thermal properties for USIBOR®1500.
| Properties | Values |
|---|---|
| 4.37 | |
| 32 |
Table 5.
Physical properties for each microstructural phase.
| Properties | Values for AUSTENITE | Values for FERRITE | Values for BAINITE | Values for MARTENSITE |
|---|---|---|---|---|
| Expansion coefficient (1/K) | 2.20 × 10⁻⁵ | 1.5 × 10⁻⁵ | 1.5 × 10⁻⁵ | 1.1 × 10⁻⁵ |
| Start temperature (°C) | 850 | 780 | 550 | 400 |
| End temperature (°C) | 950 | 550 | 400 | 200 |
| Transformation strain | −0.008 | 0.008 | 0.008 | 0.008 |
| - | 539 | 563 | 563 | |
| Trans plastic coefficient | - | 0.00015 | 0.0001 | 9 × 10⁻⁵ |
Publisher’s Note: MDPI stays neutral with regard to jurisdictional claims in published maps and institutional affiliations. |
© 2022 by the authors. Licensee MDPI, Basel, Switzerland. This article is an open access article distributed under the terms and conditions of the Creative Commons Attribution (CC BY) license (https://creativecommons.org/licenses/by/4.0/).
Share and Cite
MDPI and ACS Style
Palmieri, M.E.; Galetta, F.R.; Tricarico, L. Study of Tailored Hot Stamping Process on Advanced High-Strength Steels. J. Manuf. Mater. Process. 2022, 6, 11. https://doi.org/10.3390/jmmp6010011
AMA Style
Palmieri ME, Galetta FR, Tricarico L. Study of Tailored Hot Stamping Process on Advanced High-Strength Steels. Journal of Manufacturing and Materials Processing. 2022; 6(1):11. https://doi.org/10.3390/jmmp6010011
Chicago/Turabian StylePalmieri, Maria Emanuela, Francesco Rocco Galetta, and Luigi Tricarico. 2022. "Study of Tailored Hot Stamping Process on Advanced High-Strength Steels" Journal of Manufacturing and Materials Processing 6, no. 1: 11. https://doi.org/10.3390/jmmp6010011