Article

Overmolding of Hybrid Long and Short Carbon Fiber Polypropylene Composite: Optimizing Processing Parameters

by
Cahyo Budiyantoro
1,2,
Heru S. B. Rochardjo
1,* and
Gesang Nugroho
1
1
Department Mechanical and Industrial Engineering, Universitas Gadjah Mada Yogyakarta, Yogyakarta 55281, Indonesia
2
Department of Mechanical Engineering, Universitas Muhammadiyah Yogyakarta, Yogyakarta 55183, Indonesia
*
Author to whom correspondence should be addressed.
J. Manuf. Mater. Process. 2021, 5(4), 132; https://doi.org/10.3390/jmmp5040132
Submission received: 30 October 2021 / Revised: 28 November 2021 / Accepted: 3 December 2021 / Published: 8 December 2021

Abstract

:
Injection overmolding was used to produce hybrid unidirectional continuous-short carbon fiber reinforced polypropylene. Polypropylene pellets containing short carbon fibers were melted and overmolded on unidirectional carbon fibers, which act as the core of the composite structure. Four factors were varied in this study: fiber pretension applied to unidirectional fibers, injection pressure, melting temperature, and backpressure used for melting and injecting the composite pellet. This study aimed to evaluate the effect of these factors on fiber volume fraction, flexural strength, and impact strength of the hybrid composite. The relationship between factors and responses was analyzed using Box–Behnken Response Surface Methodology (RSM) and analysis of variance (ANOVA). Each aspect was divided into three levels. There were 27 experimental runs carried out, with three replicated center points. The results showed that the injection molding process parameters had no significant effect on the fiber’s volume fraction. On the other hand, melting temperature and fiber pretension significantly affected impact strength and flexural strength.

1. Introduction

Structural composites with a thermoplastic matrix can be formed by reinforcing short fibers or continuous fibers. Short fibers are more widely used as reinforcement due to the short processing time and ease of fabrication in complex shapes [1]. Short fibers play a role in resisting impact loads but have structural irregularities that make it challenging to meet the need for other mechanical properties such as tensile and flexural properties. Continuous fiber reinforcement is closely associated with tensile and flexural strength. Hybridization of discontinuous and continuous fiber reinforcement is essential for structural composites subjected to a combination of loading conditions [2,3].
Hybrid fiber reinforced thermoplastic composites can be made by the overmolding method, which is a development of the injection molding technique suitable for mass production. The heterogeneous interface between continuous fibers and short fibers reinforcement in the hybrid structure is formed when the short fiber reinforced pellet is melted and injected against a continuous fiber composite surface during the overmolding process. Commonly, hybridization by the overmolding method is carried out in two steps. The first step is the fabrication of a continuous fibrous composite layer by compression molding or thermoforming. This layer is then placed in an injection mold and overmolded by melted resin, which carries short fibers to cover the surface of the first layer [4,5]. The two-stage overmolding process raises several problems, such as long cycle times, residual stresses on each component, the need for groove design between components, and the possibility of deformation of the first component due to injection pressure of the second component [6].
The injection process parameters govern the flow of plastic melt containing short fiber into the mold. The processing parameters determine the fiber’s orientation, length after filling, and fiber content flowing into the cavity [7]. The process parameters set include injection pressure, cylinder heating temperature, holding pressure and time, cooling temperature and time, injection speed, and back pressure [8]. Setting high barrel temperature and high injection pressure is favourable for plastic melt to flow into the cavity and carry a more significant number of short fibers. The injection pressure must be appropriately adjusted so that no damage occurs on the fibers. The settings for barrel temperature depend on the material of the matrix resin. Higher barrel temperatures can reduce the viscosity of the melt; it helps the melt penetrate the first overmolding component easier. However, setting temperatures that exceed the limit can cause resin degradation. Backpressure at the plasticization stage functions to increase the mixing effect of short fiber composites; this parameter is expected to increase the distribution of short fibers. Backpressure can positively influence the impact properties of the composite but, on the other hand, can trigger resin degradation and fiber damage [9]. Backpressure and barrel temperature were also reported to have significant variance on impact strength due to the ease of fiber distribution. For short fiber-continuous fiber hybrid composite products, optimizing the processing parameters is an important issue for obtaining high flexural and impact properties and short fiber content in the product.
For the continuous fibers reinforced composite, its structural strength analysis often assumes that the fibers are in a straight state, while the condition of wavy fibers can occur. This assumption can cause misprediction in evaluating the compressive properties of unidirectional fiber composites [10]. The two most common causes of waviness are residual stresses caused by resin solidification and local buckling of fibers throughout processing. Several tests with three-point bending showed that fiber waviness reduces the flexural strength of the composite; flexural strength is a function of amplitude and wavelength of fiber’s waviness [11]. A composite beam exhibits compressive stresses on the load side and suffers tensile stresses on the other side when subjected to bending. The compressive/tensile strength ratio in structural composites requires the development of pretension in which the initial stress is applied to the structural reinforcement in order to optimize its performance and strength. Pretension on the reinforcement can increase the compressive strength and minimize the tensile effect on the other side [12,13]. Applying pretension on fibers and maintaining the condition throughout the solidification process minimizes fiber misalignment in composites [14].
Regarding impact loads, most studies do not consider the application of pretension to composites before impact [15]. There has been little research into the effect of impact loading on composite pre-tensioning, especially with respect to composites manufactured by the injection molding method. This condition cannot describe the actual load condition experienced by the composite during its service life. Pickett et al. [16] proved that preloading of composites had a significant effect on the impact response, while Whittingham et al. [17] stated that prestress did not affect the impact behavior of composites. In structural composites, pre-tensioning can be carried out by placing fibers in the mold and pulling with high tensile forces before resin is injected [18]. However, fiber pretension is typically applied to filament winding and pultrusion processes. In manufacturing structural composites using the injection molding method, fiber pretension has not been carried out. A suitable pretension methodology is required for the injection molding to produce a uniform fiber prestress and maintain it throughout the solidification process.
In this study, hybrid fiber-reinforced polypropylene composites were made by using the injection overmolding method. The composite comprises unidirectional carbon fiber and is overmolded by a polypropylene pellet containing short carbon fiber. The various injection process parameters for injecting short fiber pellets include melting temperature, injection pressure, and backpressure. In unidirectional fiber, pretension is provided before overmolding. The mold was designed so that the unidirectional carbon fiber is in an asymmetrical position with respect to the neutral axis of the specimen’s cross section. Each parameter factor is divided into three levels: low, medium, and high. This research study aims to determine the effect of process parameters on the flexural and impact properties of the composite and to obtain a combination of processing parameters that can produce maximum flexural properties, impact properties, and fiber volume fraction. The relationship between processing factors and responses was analyzed by using the Box–Behnken Design-Response Surface Method and ANOVA.

2. Experimental

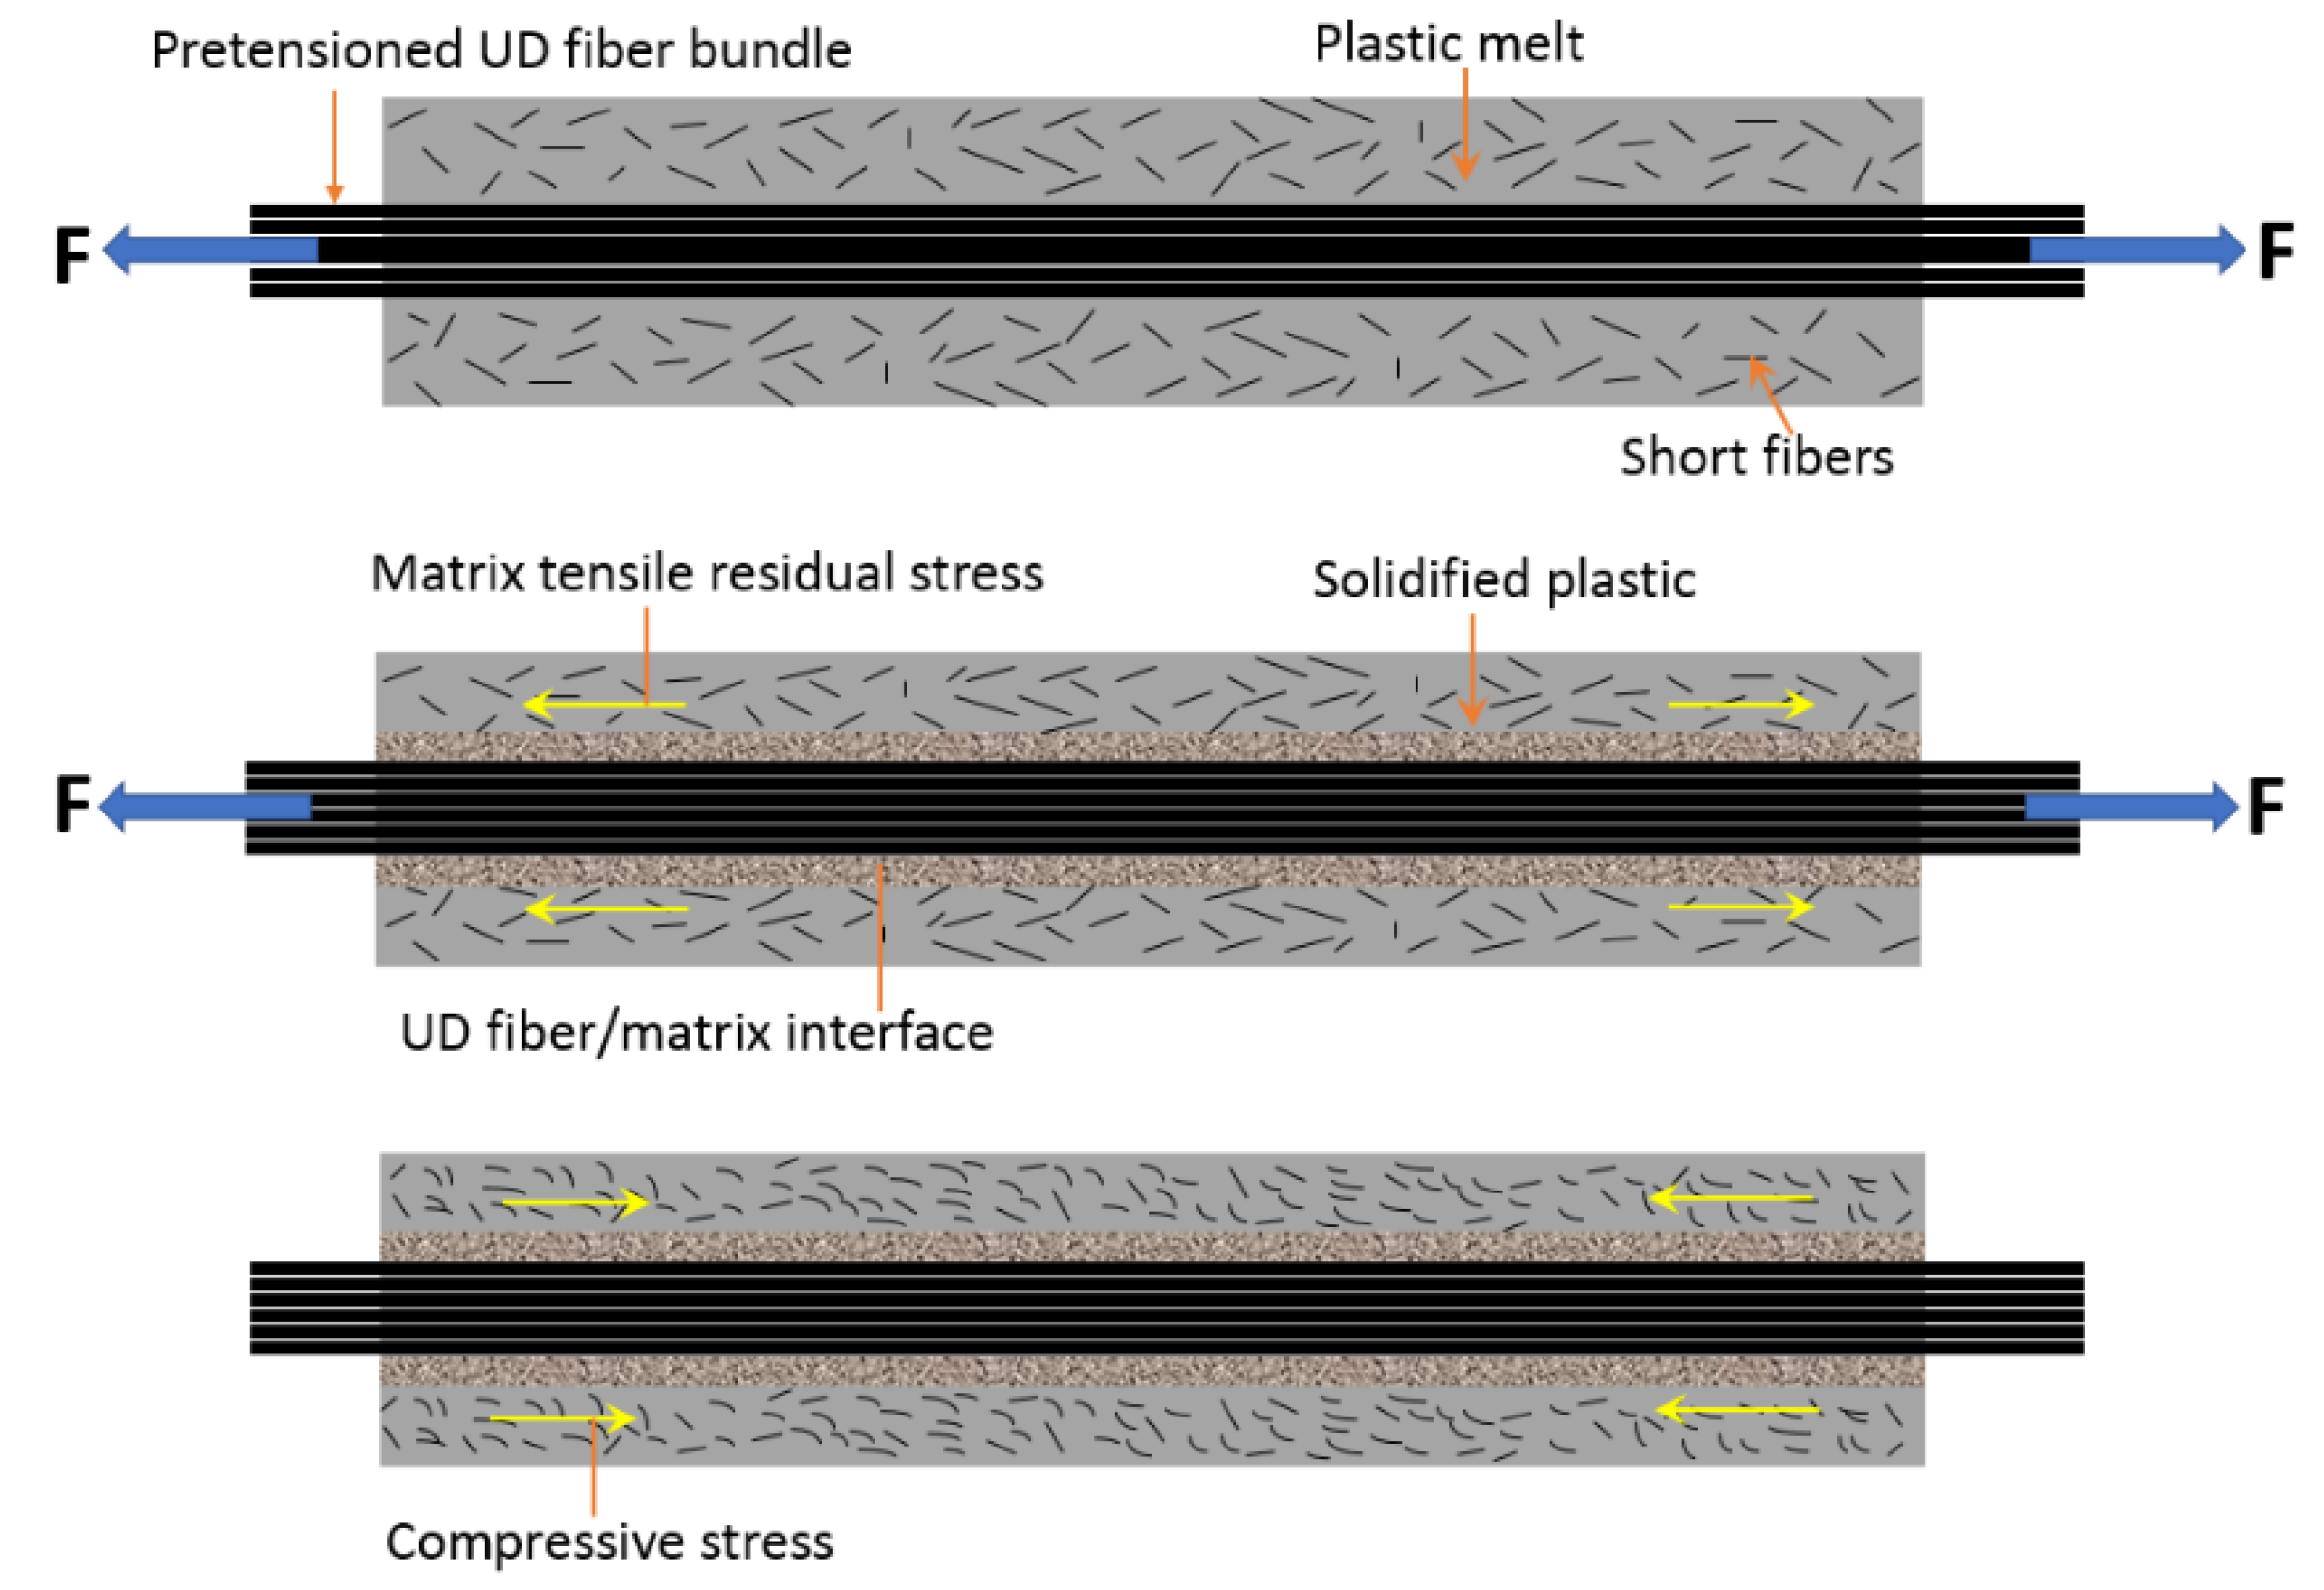
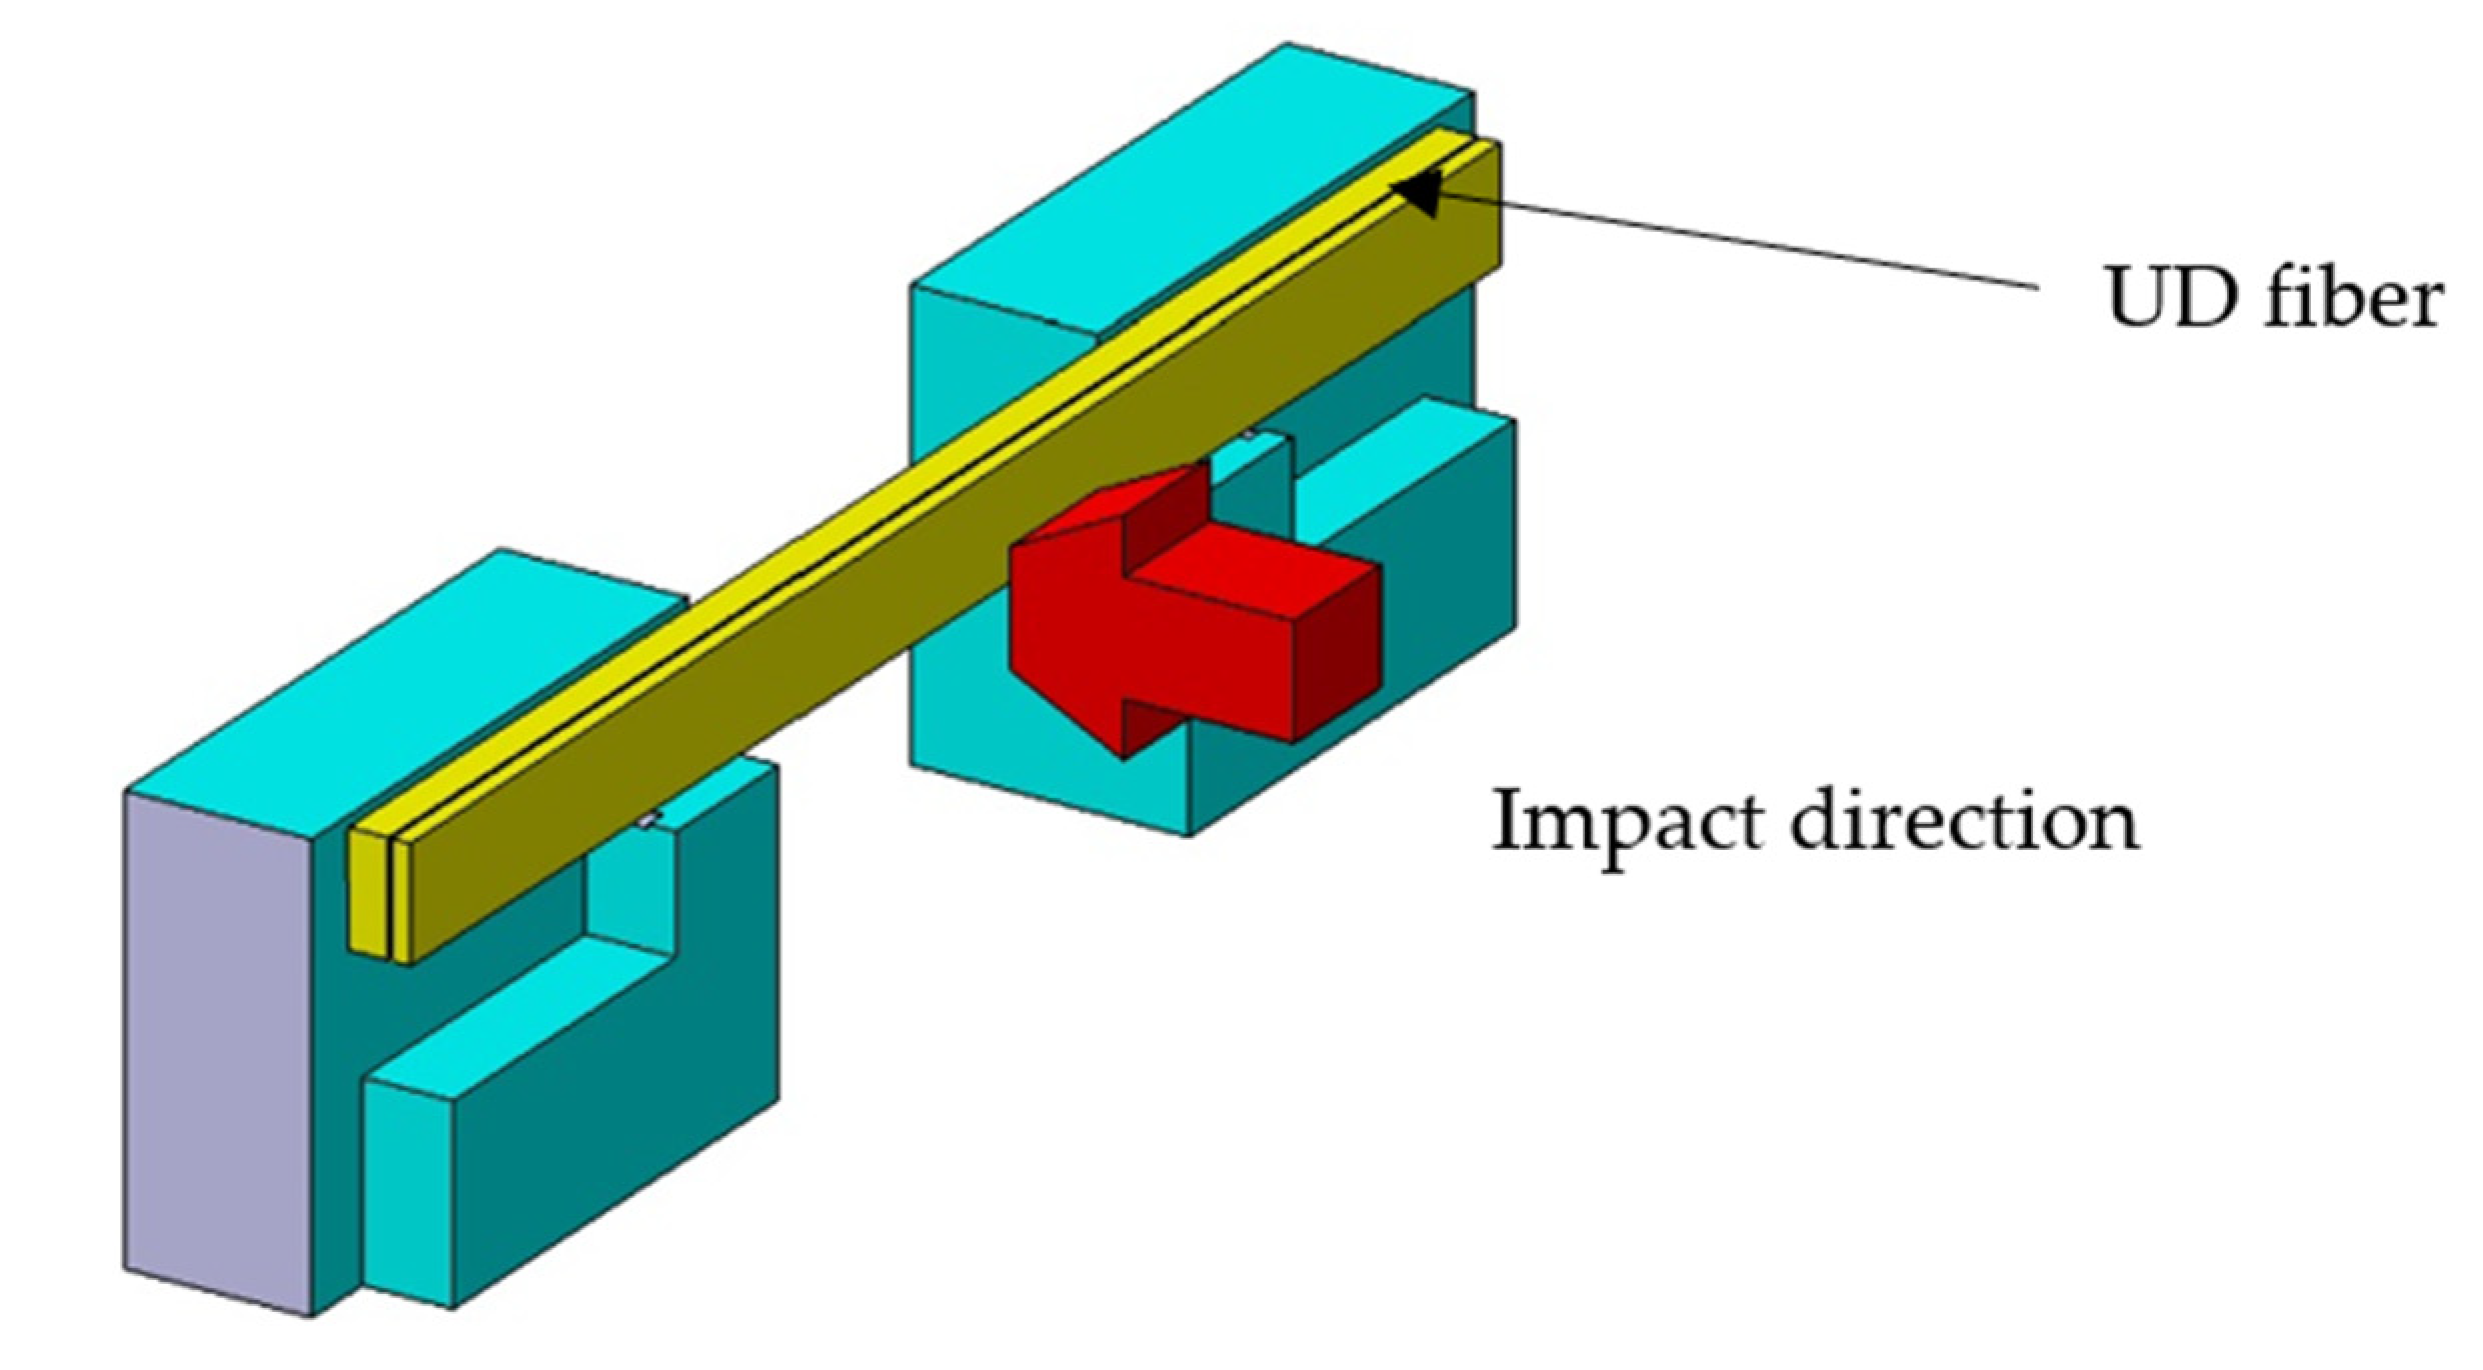
2.1. Fiber Pretension Principle

Several methods have been developed for fiber pre-tensioning, including the dead load method [19], V-slot mechanical tightening method [20], filament winding, hydraulic cylinder prestress rig [21], and horizontal pulling machine [22]. The latter method was used in this study with some modifications when assembled on an overmold.
Principally, prestressed unidirectional fiber composites can be made by applying a preload to unidirectional fiber before plastic melt injection. The preload is maintained until the plastic melt solidifies completely, after which the load is released. Preload release causes elastic contraction of the fibers and releases residual tensile stresses from the matrix due to solidification. However, this condition can induce compressive stress with respect to the matrix that contains short fibers. The principle of the fiber pretension condition is shown in Figure 1. Compressive stress in the matrix will inhibit crack formation through the matrix, preventing the formation of matrix cracks in the composite and enhancing the mechanical properties of high content-matrix composites [14].
Based on a rule of mixtures, the effect of fiber pretension on matrix residual stresses in composites can be theoretically predicted [21]. The theory uses the following assumptions: (1) ideal fiber/matrix bonding, (2) the fiber and matrix are isotropic linear elastic materials, and (3) the properties of the matrix and fiber are temperature independent. In the matrix, the final residual strain is defined by the following:
ε m = σ p × V f E 11 + Δ T . α 11
where σp is the given fiber pretension, Vf is the fiber volume fraction, E11 is the composite Young’s modulus in the fiber orientation, α11 is the thermal expansion coefficient of composite in the fiber direction, and ∆T is the temperature difference. From the point of view of the research variables, the equation shows that residual strain can be reduced by increasing fiber pretension and reducing the matrix’s temperature difference.
Mostafa et al. [23] developed equations to determine residual stresses in the constituents of fiber pre-tensioned composites. Equation (2) is used to calculate the residual stress of fiber, and Equation (3) is used for calculating the residual stress of the matrix:
σ f r e s = ( 1 1 1 + ( E f E m ) ( 1 V f V f ) ) × σ p
σ m r e s = ( 1 ( E f E m ) + ( 1 V f V f ) ) × σ p
where Ef is the fiber’s elastic modulus, and Em is the matrix’s elastic modulus. These equations can be used only for a composite system with 0 < Vf < 1. According to the two equations above, residual stress is strongly influenced by pretension and fiber volume fraction.
When a flexural load is applied to a pre-tensioned composite, the tensile residual stress in the fibers must proceed to zero before subjecting a flexural load. This condition is expected to increase the compressive strength of the composite.

2.2. Materials

The matrix material comprises Cosmoplene AW564 high impact polypropylene copolymer, produced under license by Sumitomo Chemical Co., Tokyo, Japan. It has the properties of medium flow, high stiffness, and high impact copolymer grade [24]. Both short fiber and unidirectional fiber reinforcement used carbon fiber T700SC 12K [25], made by Toray, Tokyo, Japan. Liquid nitrogen was used for unidirectional carbon fiber surface treatment. Table 1 shows the properties of the involved materials.

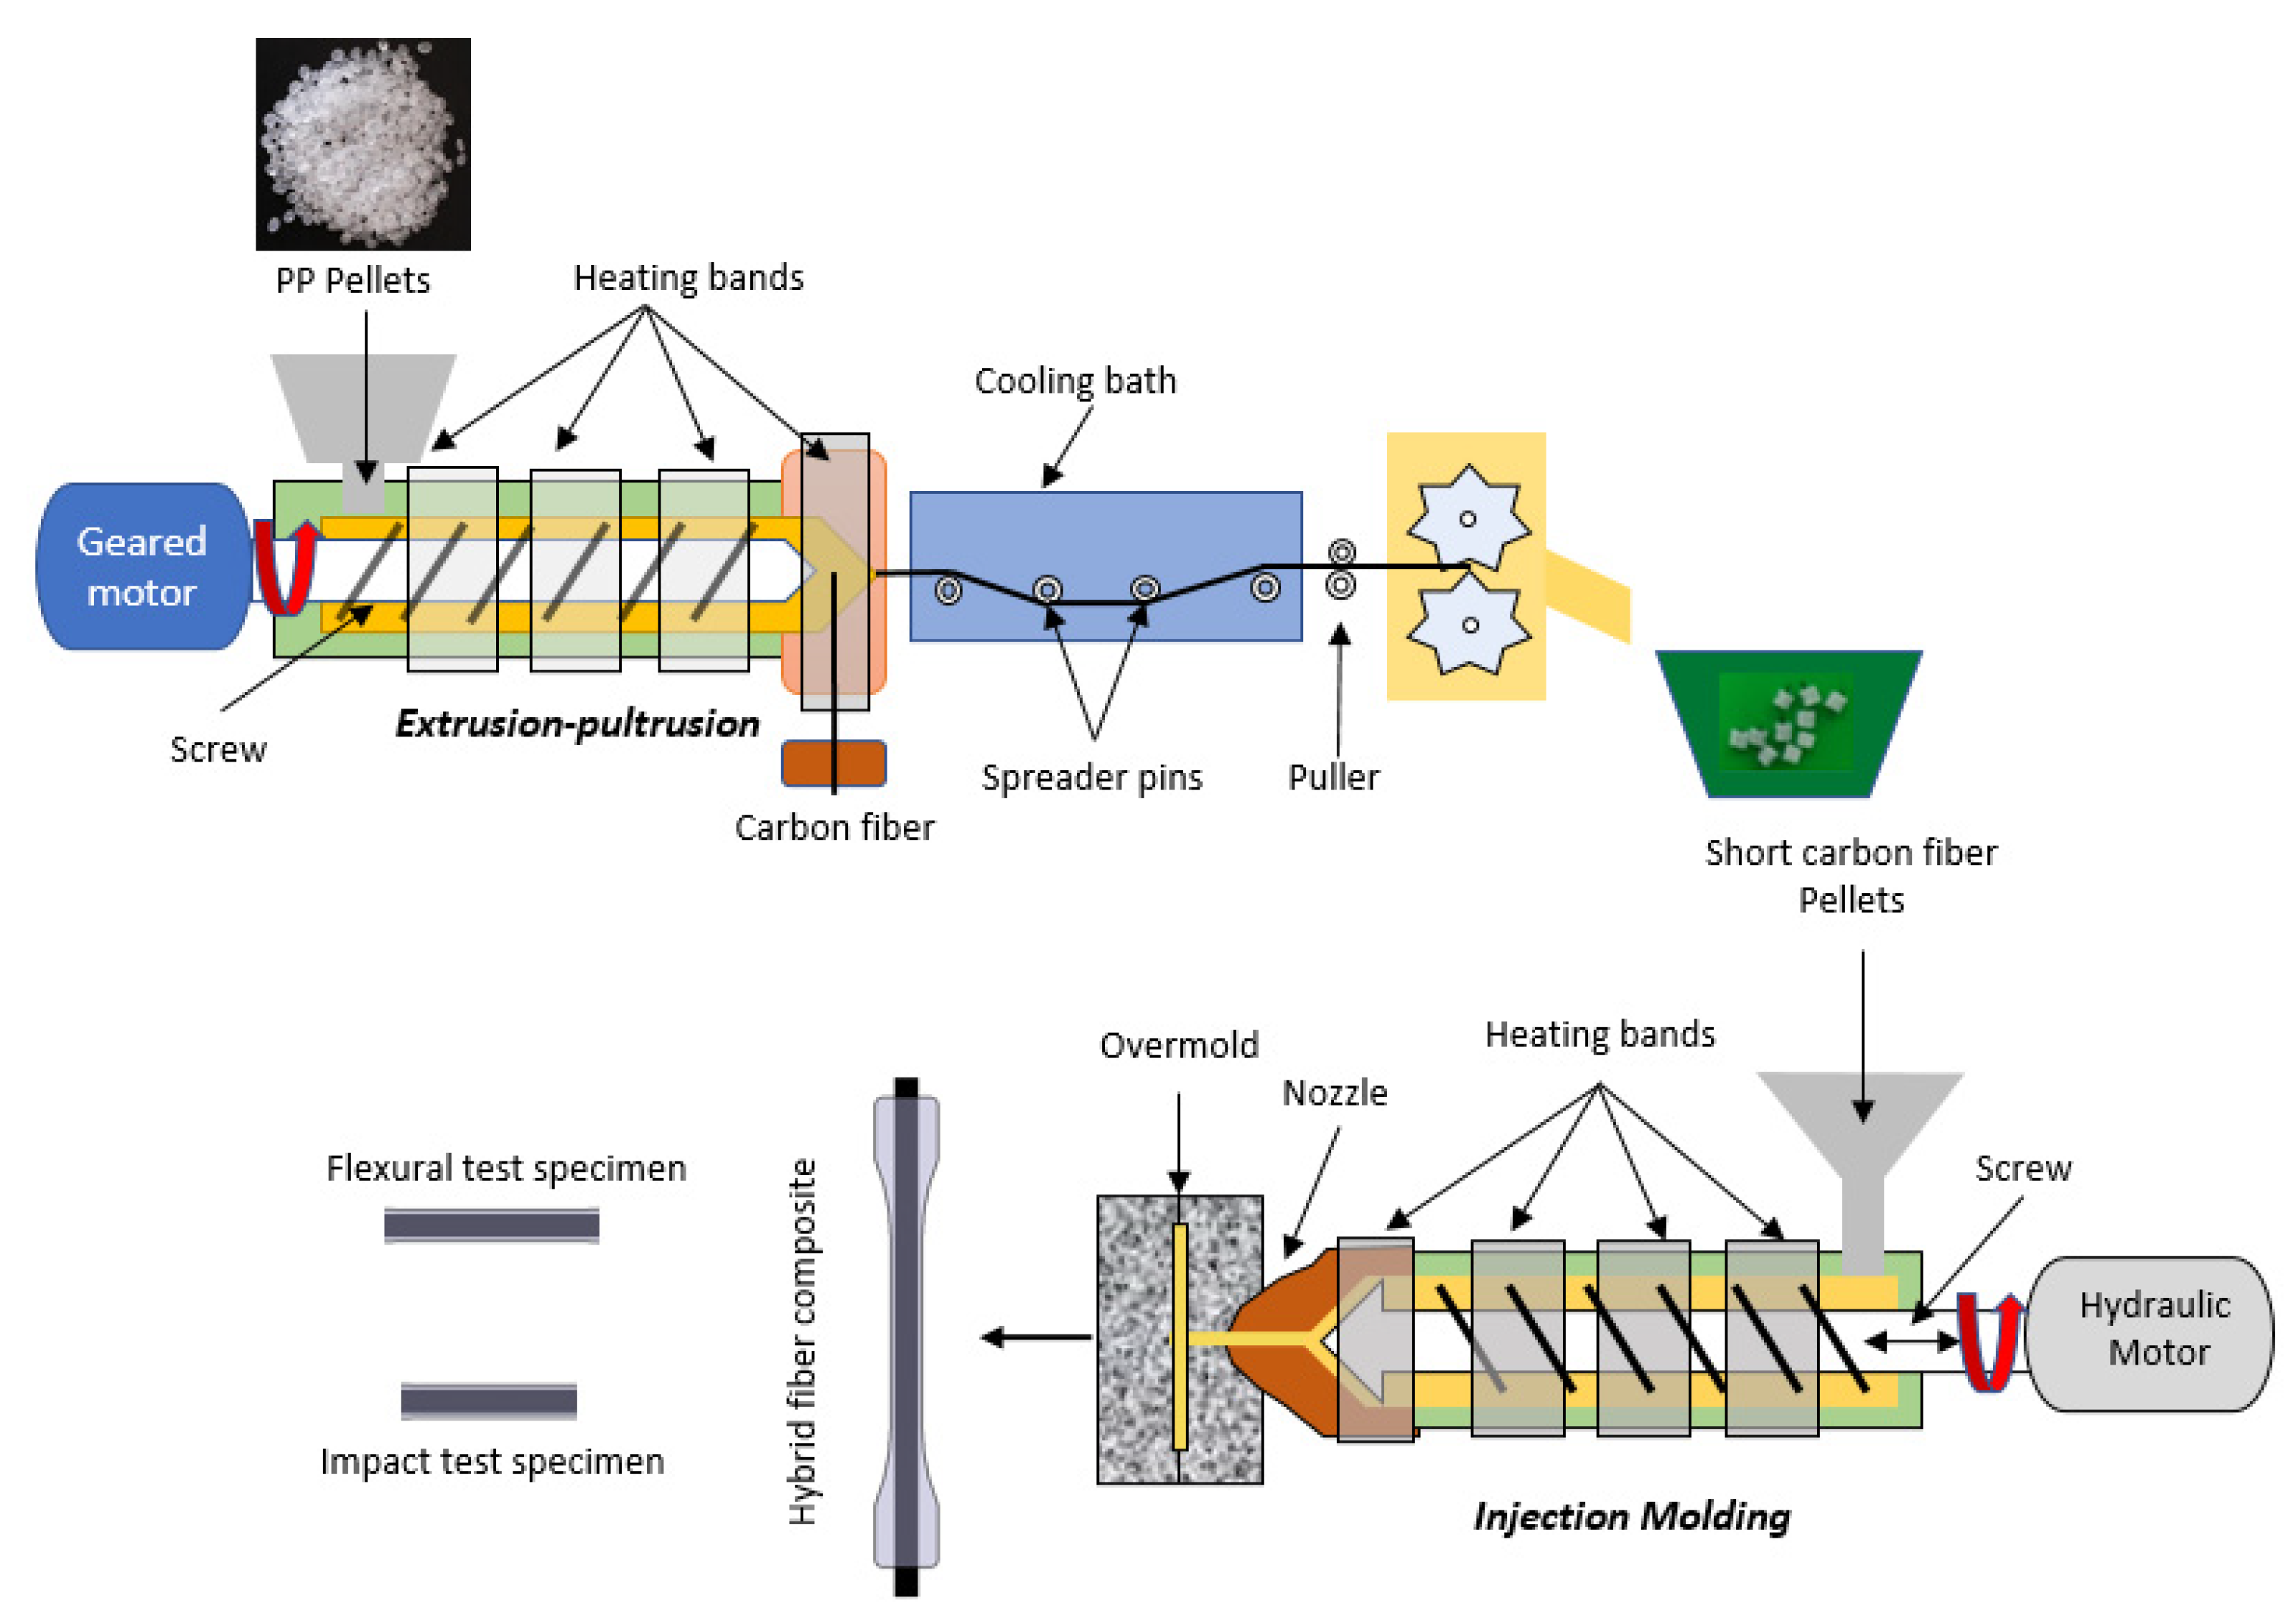
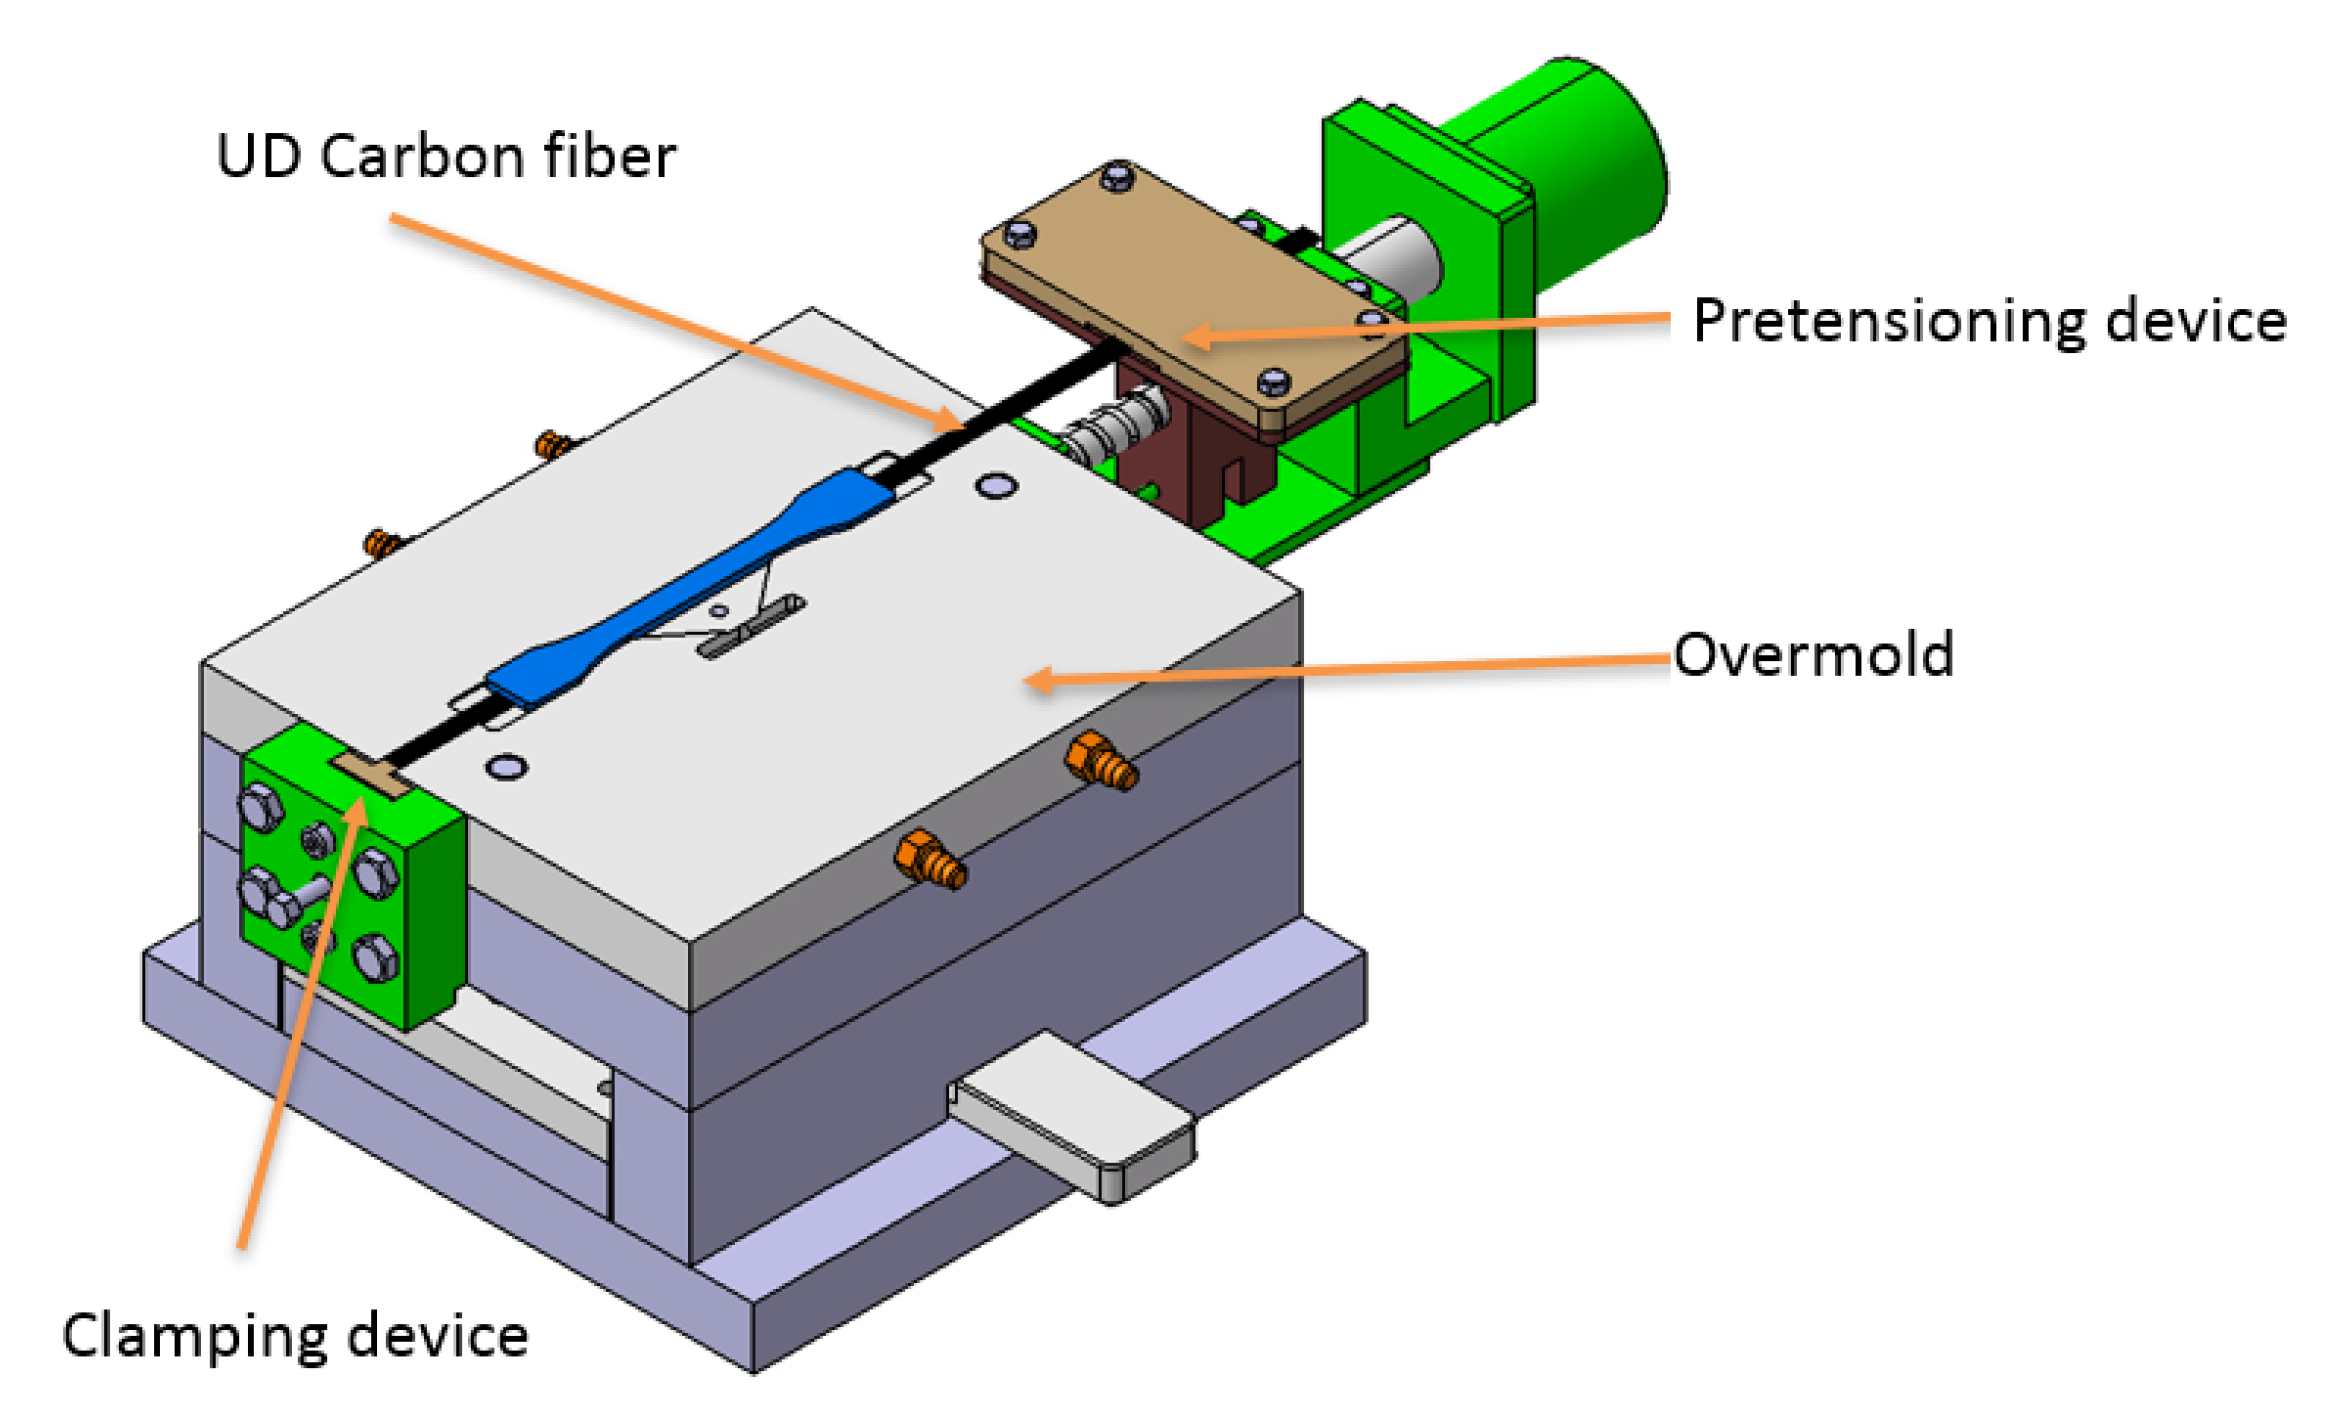
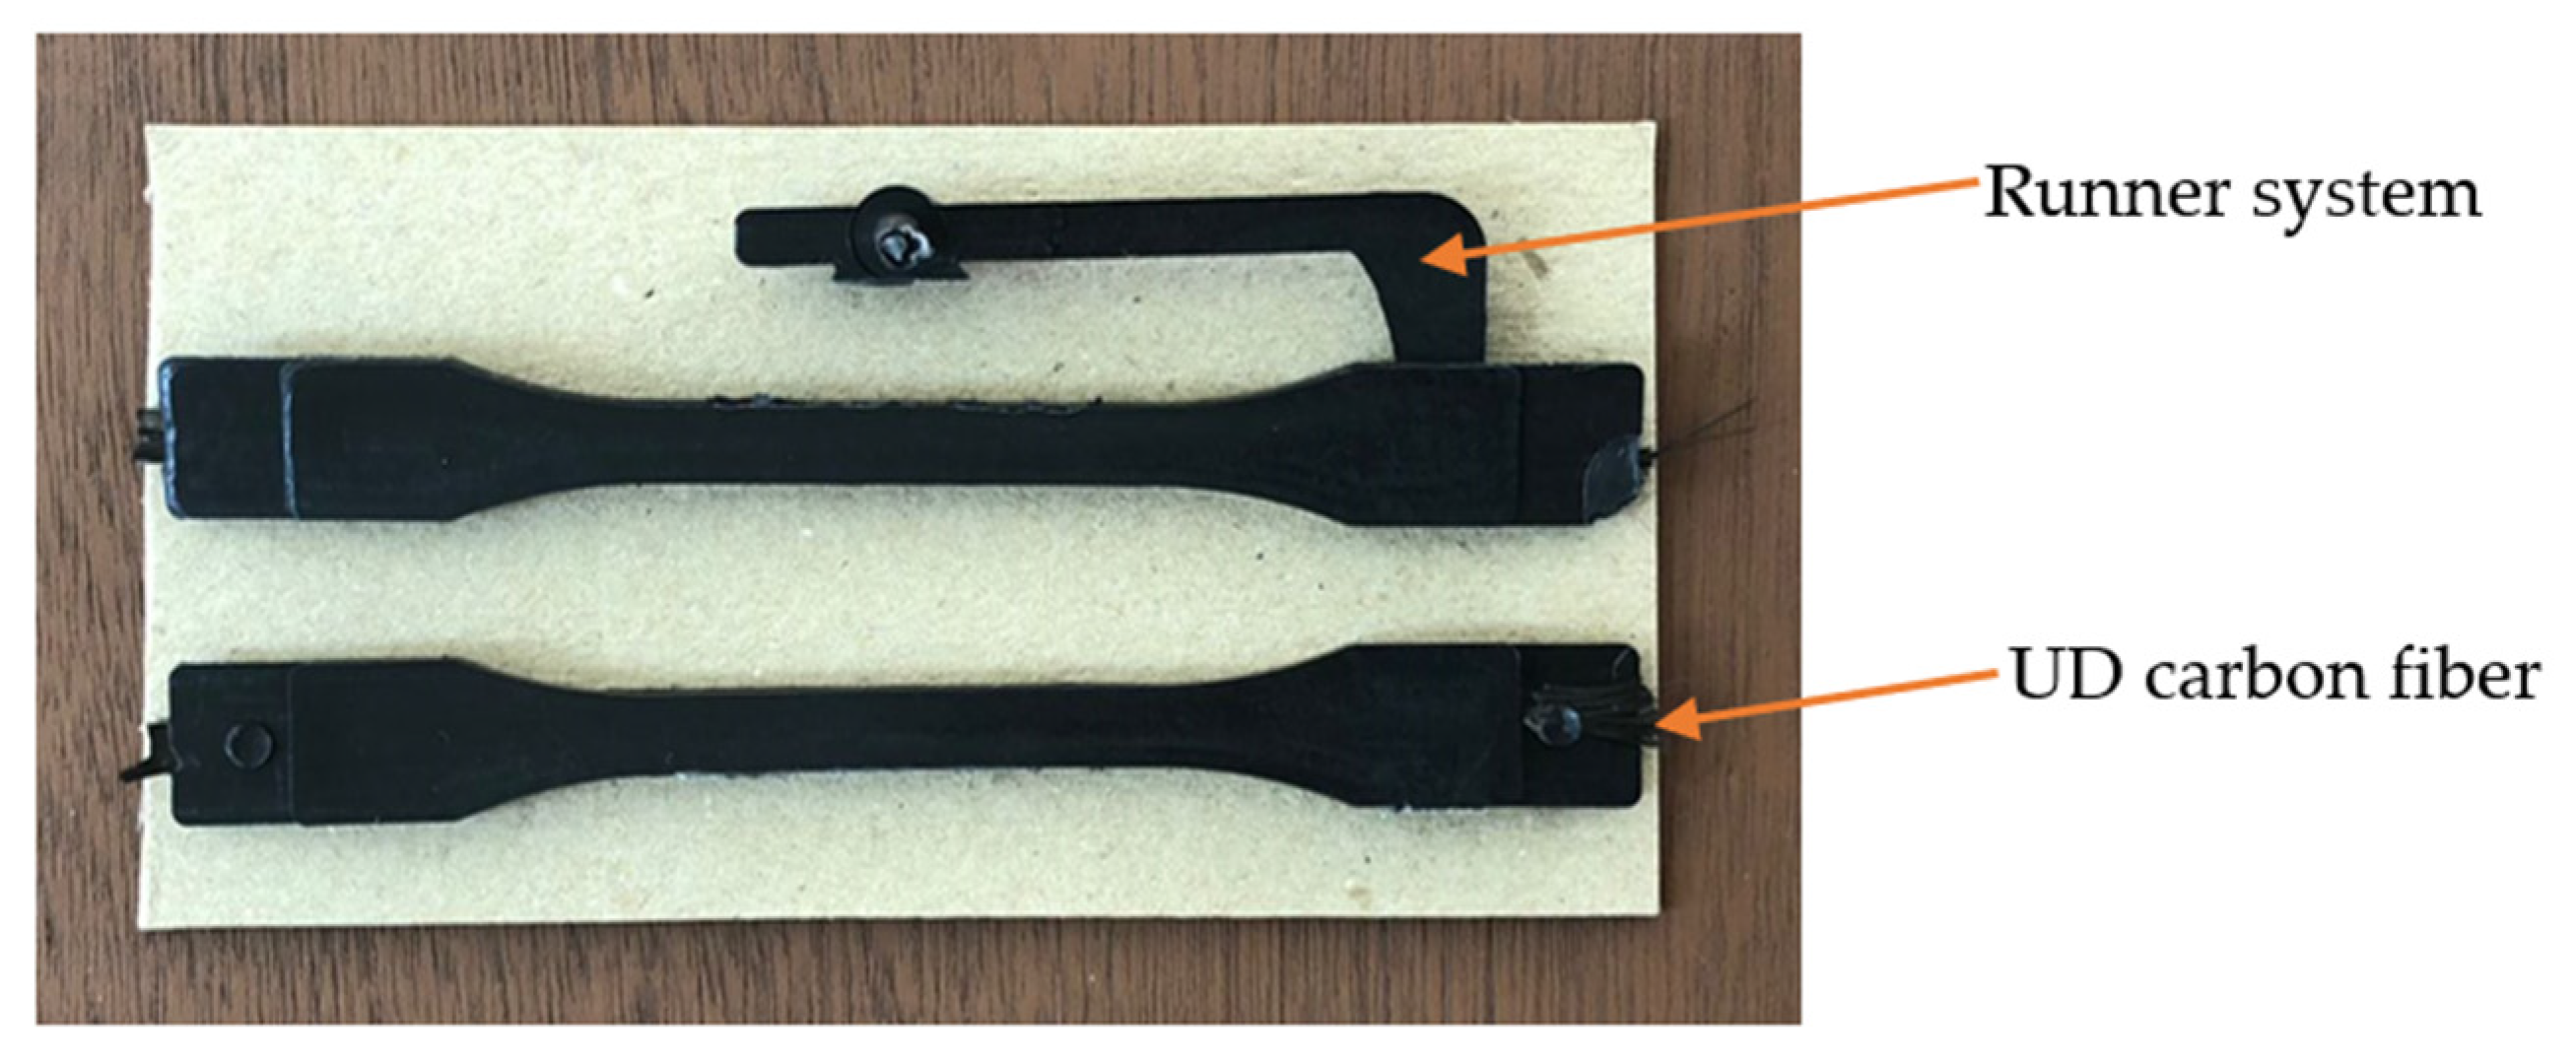
2.3. Preparation of Hybrid Overmolded Specimens

Figure 2 shows the production steps of hybrid fiber overmolded composite. The extrusion–pultrusion method was used to produce carbon fiber reinforced polypropylene filament [26]. This process was able to produce composite filaments with an average fiber volume fraction of 16.2%. The short fiber pellets were cut out of the filament with a cutting length of 2–3 mm. The pellet was fed through the hopper of the injection molding machine; then, by rotating the screw, the pellet was plasticized and transported to the nozzle. The screw rotation then stopped, and the melted matrix containing short fiber was injected into the mold and overmolded onto the pre-tensioned unidirectional fiber. Three injection parameters varied, and they are listed as follows: injection pressure, melting temperature, and backpressure. The hydraulic injection pressure varied by 100 bar, 120 bar, and 140 bar, respectively. In this case, injection pressure is measured from the hydraulic pressure that moves the screw from the rear side. The melting temperature was adjusted according to the plastic manufacturer’s recommendation and varied by 190 °C, 210 °C, and 230 °C. At a defined screw rotation of 40 rpm, the backpressure varied from 5 bar, 10 bar, and 15 bar [9]. Several other process parameters were set constant, as shown in Table 2.
Carbon fiber was cut to 350 mm to allow sufficient passage for pretension clamping for unidirectional reinforcement. Both short and unidirectional fibers had been surface treated with liquid nitrogen for 10 min to improve fibers and matrix bonding properties. Surface treatment of carbon fiber with liquid nitrogen had been proven to produce high interfacial shear strength (IFSS) of carbon fiber-reinforced polypropylene [27]. The unidirectional fiber was mounted on a mold equipped with a pretension device, as shown in Figure 3. The mold was mounted on a 70-ton clamping capacity Meiki injection molding machine. One end of the fiber was clamped on the clamp, while the other end was pulled with varying tension: 8%, 21%, and 33% of the ultimate strength of fiber, respectively [23,28]. Pretension is obtained by static loading, since the cross-section area of the carbon fiber bundle is 7 mm × 7 μm = 0.049 mm2; then, the load applied to the fiber was 20 N, 50 N, and 80 N, respectively.
Four factors were divided into three levels (low, middle, and high), as displayed in Table 3. Melting temperature, injection pressure, and back pressure are controllable injection parameters that govern the flow behavior of the matrix containing short fiber, while pretension influences the role of unidirectional fiber. These factors and levels are arranged in the experimental design, as shown in Table 4. The experimental design was carried out with 27 trials, and each trial comprised five repetitions. In general, a complete combination of four factors and three levels will require 34 trials or equal to 81 trials. When all possible combinations of the levels and the factors are investigated, it is called a full factorial experiment. There is a possibility to reduce the number of trials by using a fractional factorial experiment. Table 4 lists the design of the experiment determined by the Box–Behnken Design. This model calculated 27 experimental runs consisting of 24 distinct runs and three replications (centre point). The centre point consists of the middle level of each factor; it appears three times in Table 4. Adding a few centre points in the experimental design can increase the probability of detecting significant factors and estimate the variability (or pure error). The group of experiments are generated randomly with the help of statistical software (Design-Expert 11 from Stat-Ease Inc., Minneapolis, MN, USA).

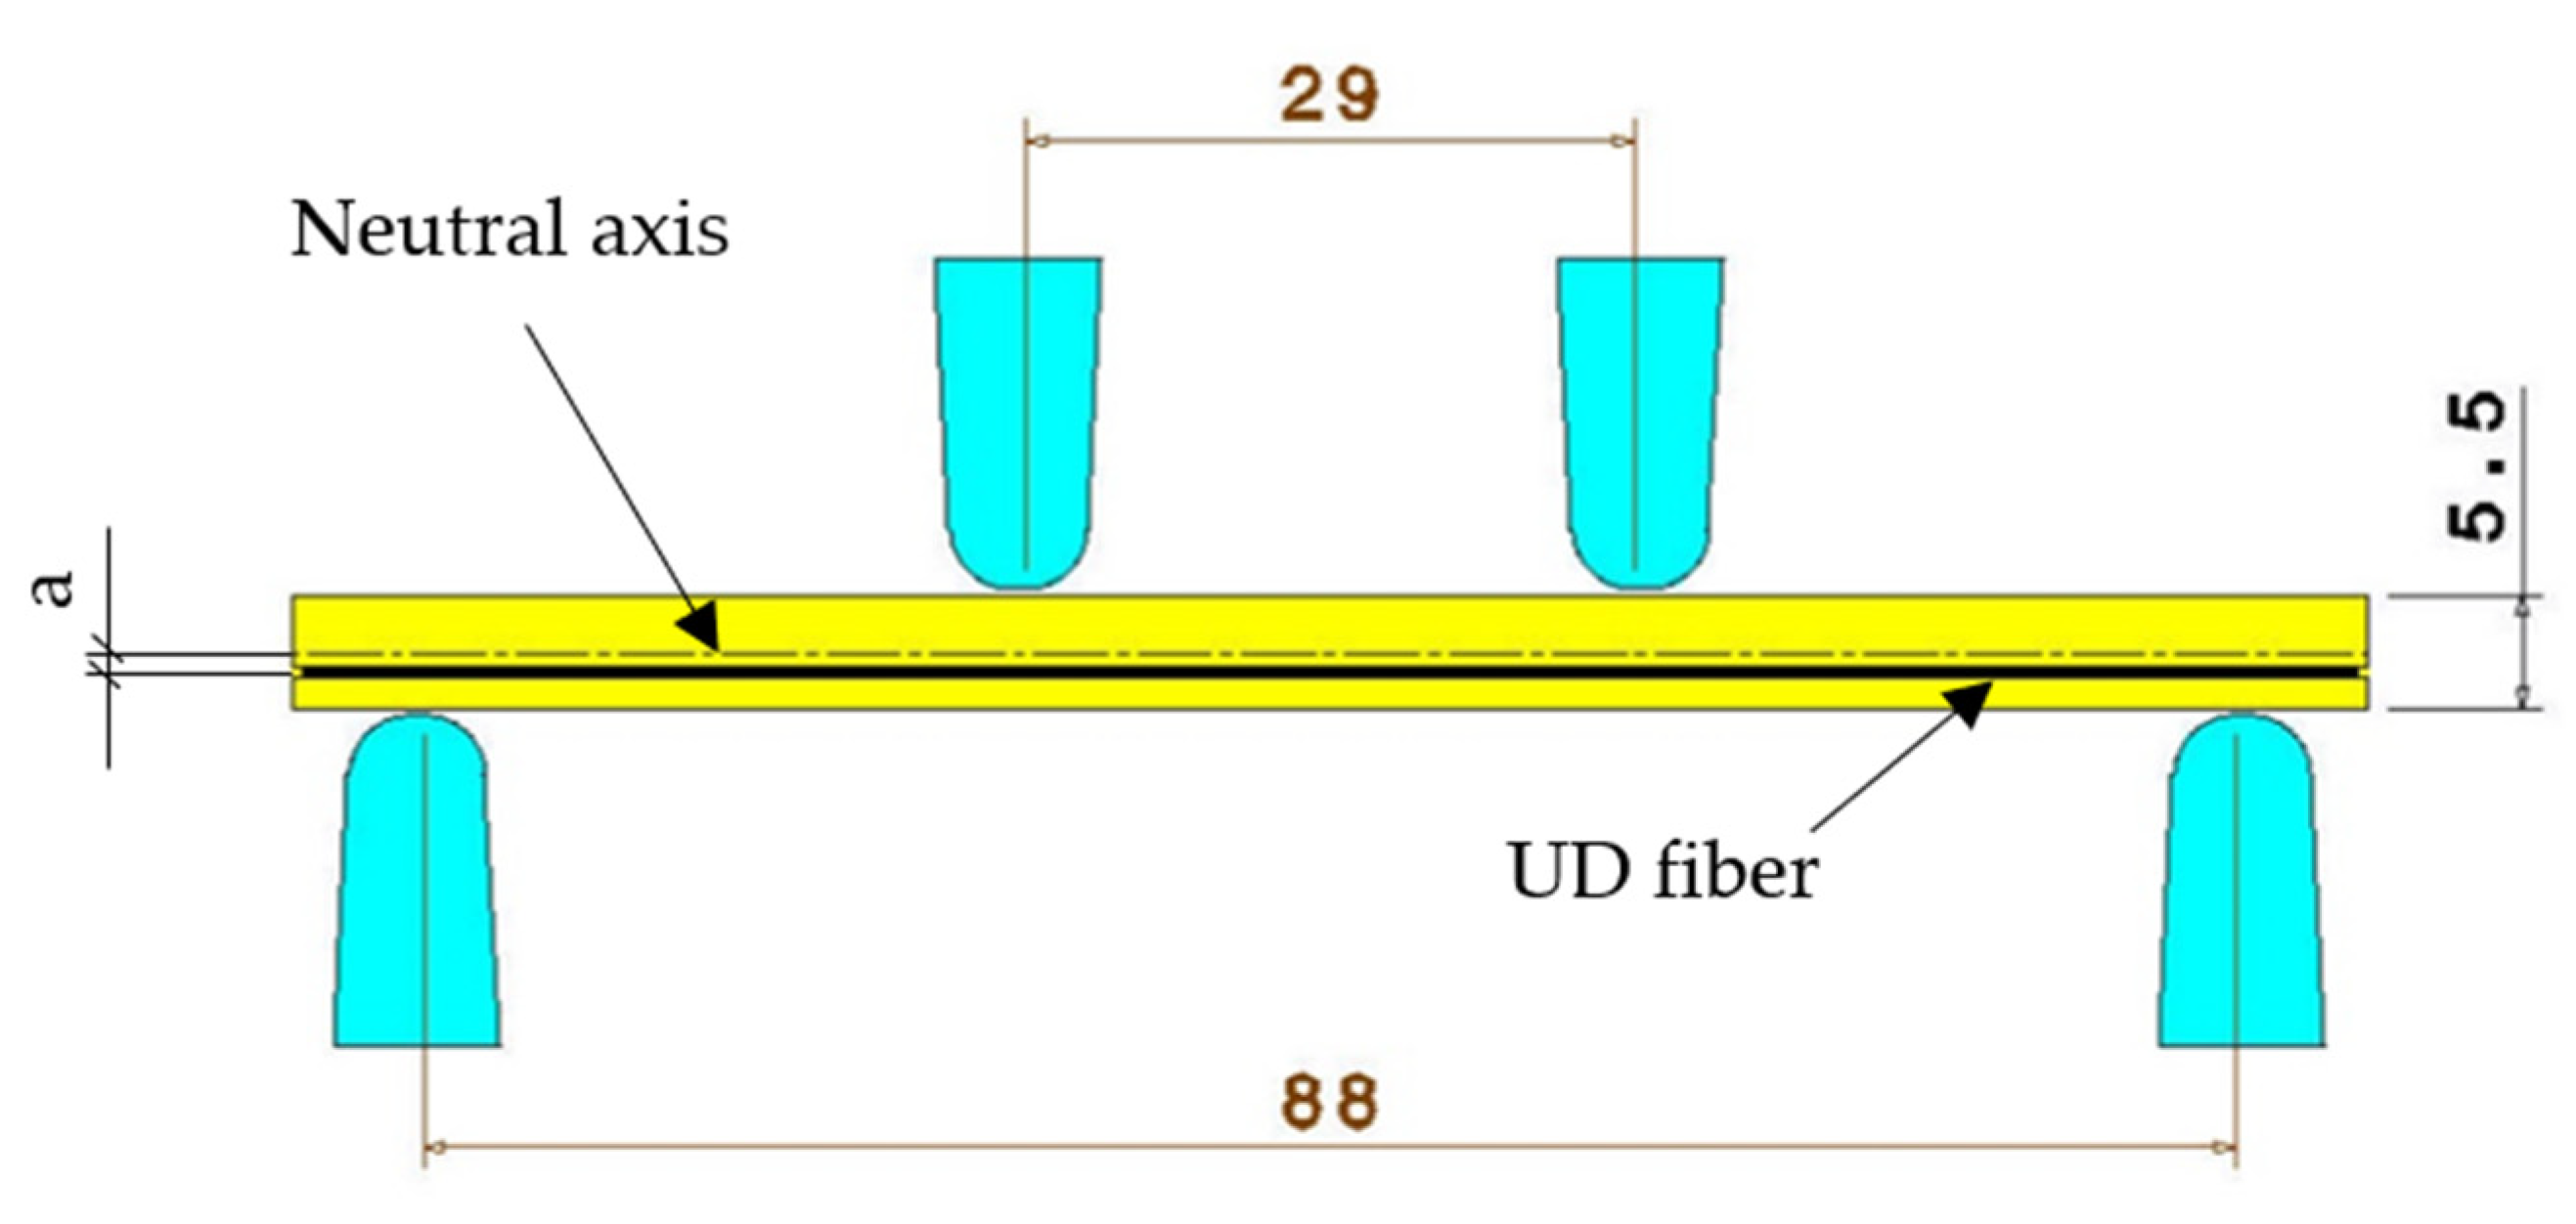
2.4. Characterization

A four-point bending test was performed on a Zwick/Roell Z20 Proline universal test machine to evaluate the flexural properties of composites. The four-point bending method is more suitable for non-homogeneous materials such as composites. Here, the maximum flexural stress was distributed throughout the beam section between the loading points. Stress concentration in a four-point test is relatively low and shared over a larger area, restricting premature failure. In contrast, the maximum bend stress occurs beneath the loading pressure bar in three-point flexural bending tests. The stress concentration in a three-point test is narrow and focused beneath the loading point’s center. Additionally, a three-point test works best when the material is homogeneous, such as plastic.
Test configuration was set up according to ISO 178. The test was carried out with a crosshead rate of 2 mm/min [29]. Due to the fact that the thickness of the specimen was 5.5 mm, the standard length of the specimen was 100 mm, and the span length was 88 mm [30]. Thickness was designed to be higher than that of standard specimens to allow for significant surface strains at relatively small deflections [31]. Under bending, the unidirectional fiber was positioned close to the bottom side with an offset “a” from the neutral axis because of reduced compressive modulus, as shown in Figure 4. When the unidirectional reinforcement is precisely placed on the neutral axis, the maximum compressive strain (top surface) is greater than the maximum tensile strain (bottom surface); as a result, the maximum tensile stress is lower than the maximum compressive stress. Micro buckling and compressive failure may occur due to increased compressive strain, particularly in thick specimens [32].
Impact properties were characterized according to Charpy flatwise ISO 179 using a GOTECH impact tester with a standard rate of 3.46 m/s. Impact strength (kJ/m2) was calculated by dividing impact energy by the width of the specimens. Both tests were carried out at a temperature of 23 °C and relative humidity (RH) of approximately 50%. For each trial, at least five identical specimens were examined, and average values were recorded. The configuration of testing is described in Figure 5.
Fiber volume fraction was determined by burning the composite in a heating furnace at 600 °C. At that temperature, the matrix resin can be removed entirely, and the fibers remain. The test samples obtained from the dumbell specimen were conditioned at 23 °C and RH of 50% for 24 h before performing the burning process. Before burning the matrix, the composite was weighed, and by Formula (2), the density of the composite can be calculated. The matrix resin generally burned out in 90 min, followed by char; as a byproduct of the burning resin, it lost its weight at around 30 min. Finally, only carbon fiber remained [33]. The mass fraction of carbon fiber was calculated by dividing the weight of the remaining carbon fiber and the total weight of the composite. The volume fraction of carbon fiber can be calculated using the known density and the mass fraction of carbon fiber.
Scanning electron microscopy (SEM) was used to observe the fracture surface, fiber waviness, and the interface layer of the specimens. SEM analysis was performed using a JIB-4610F field emission SEM (JEOL Ltd., Tokyo, Japan). It is a simple, out-of-lens scanning electron microscope (SEM) with a Schottky electron gun proficient in significant current processing (maximum ion current 90 nA) mounted in a single chamber. Prior to the measurements, the specimens were sputtered with a gold/palladium layer.

3. Results and Discussion
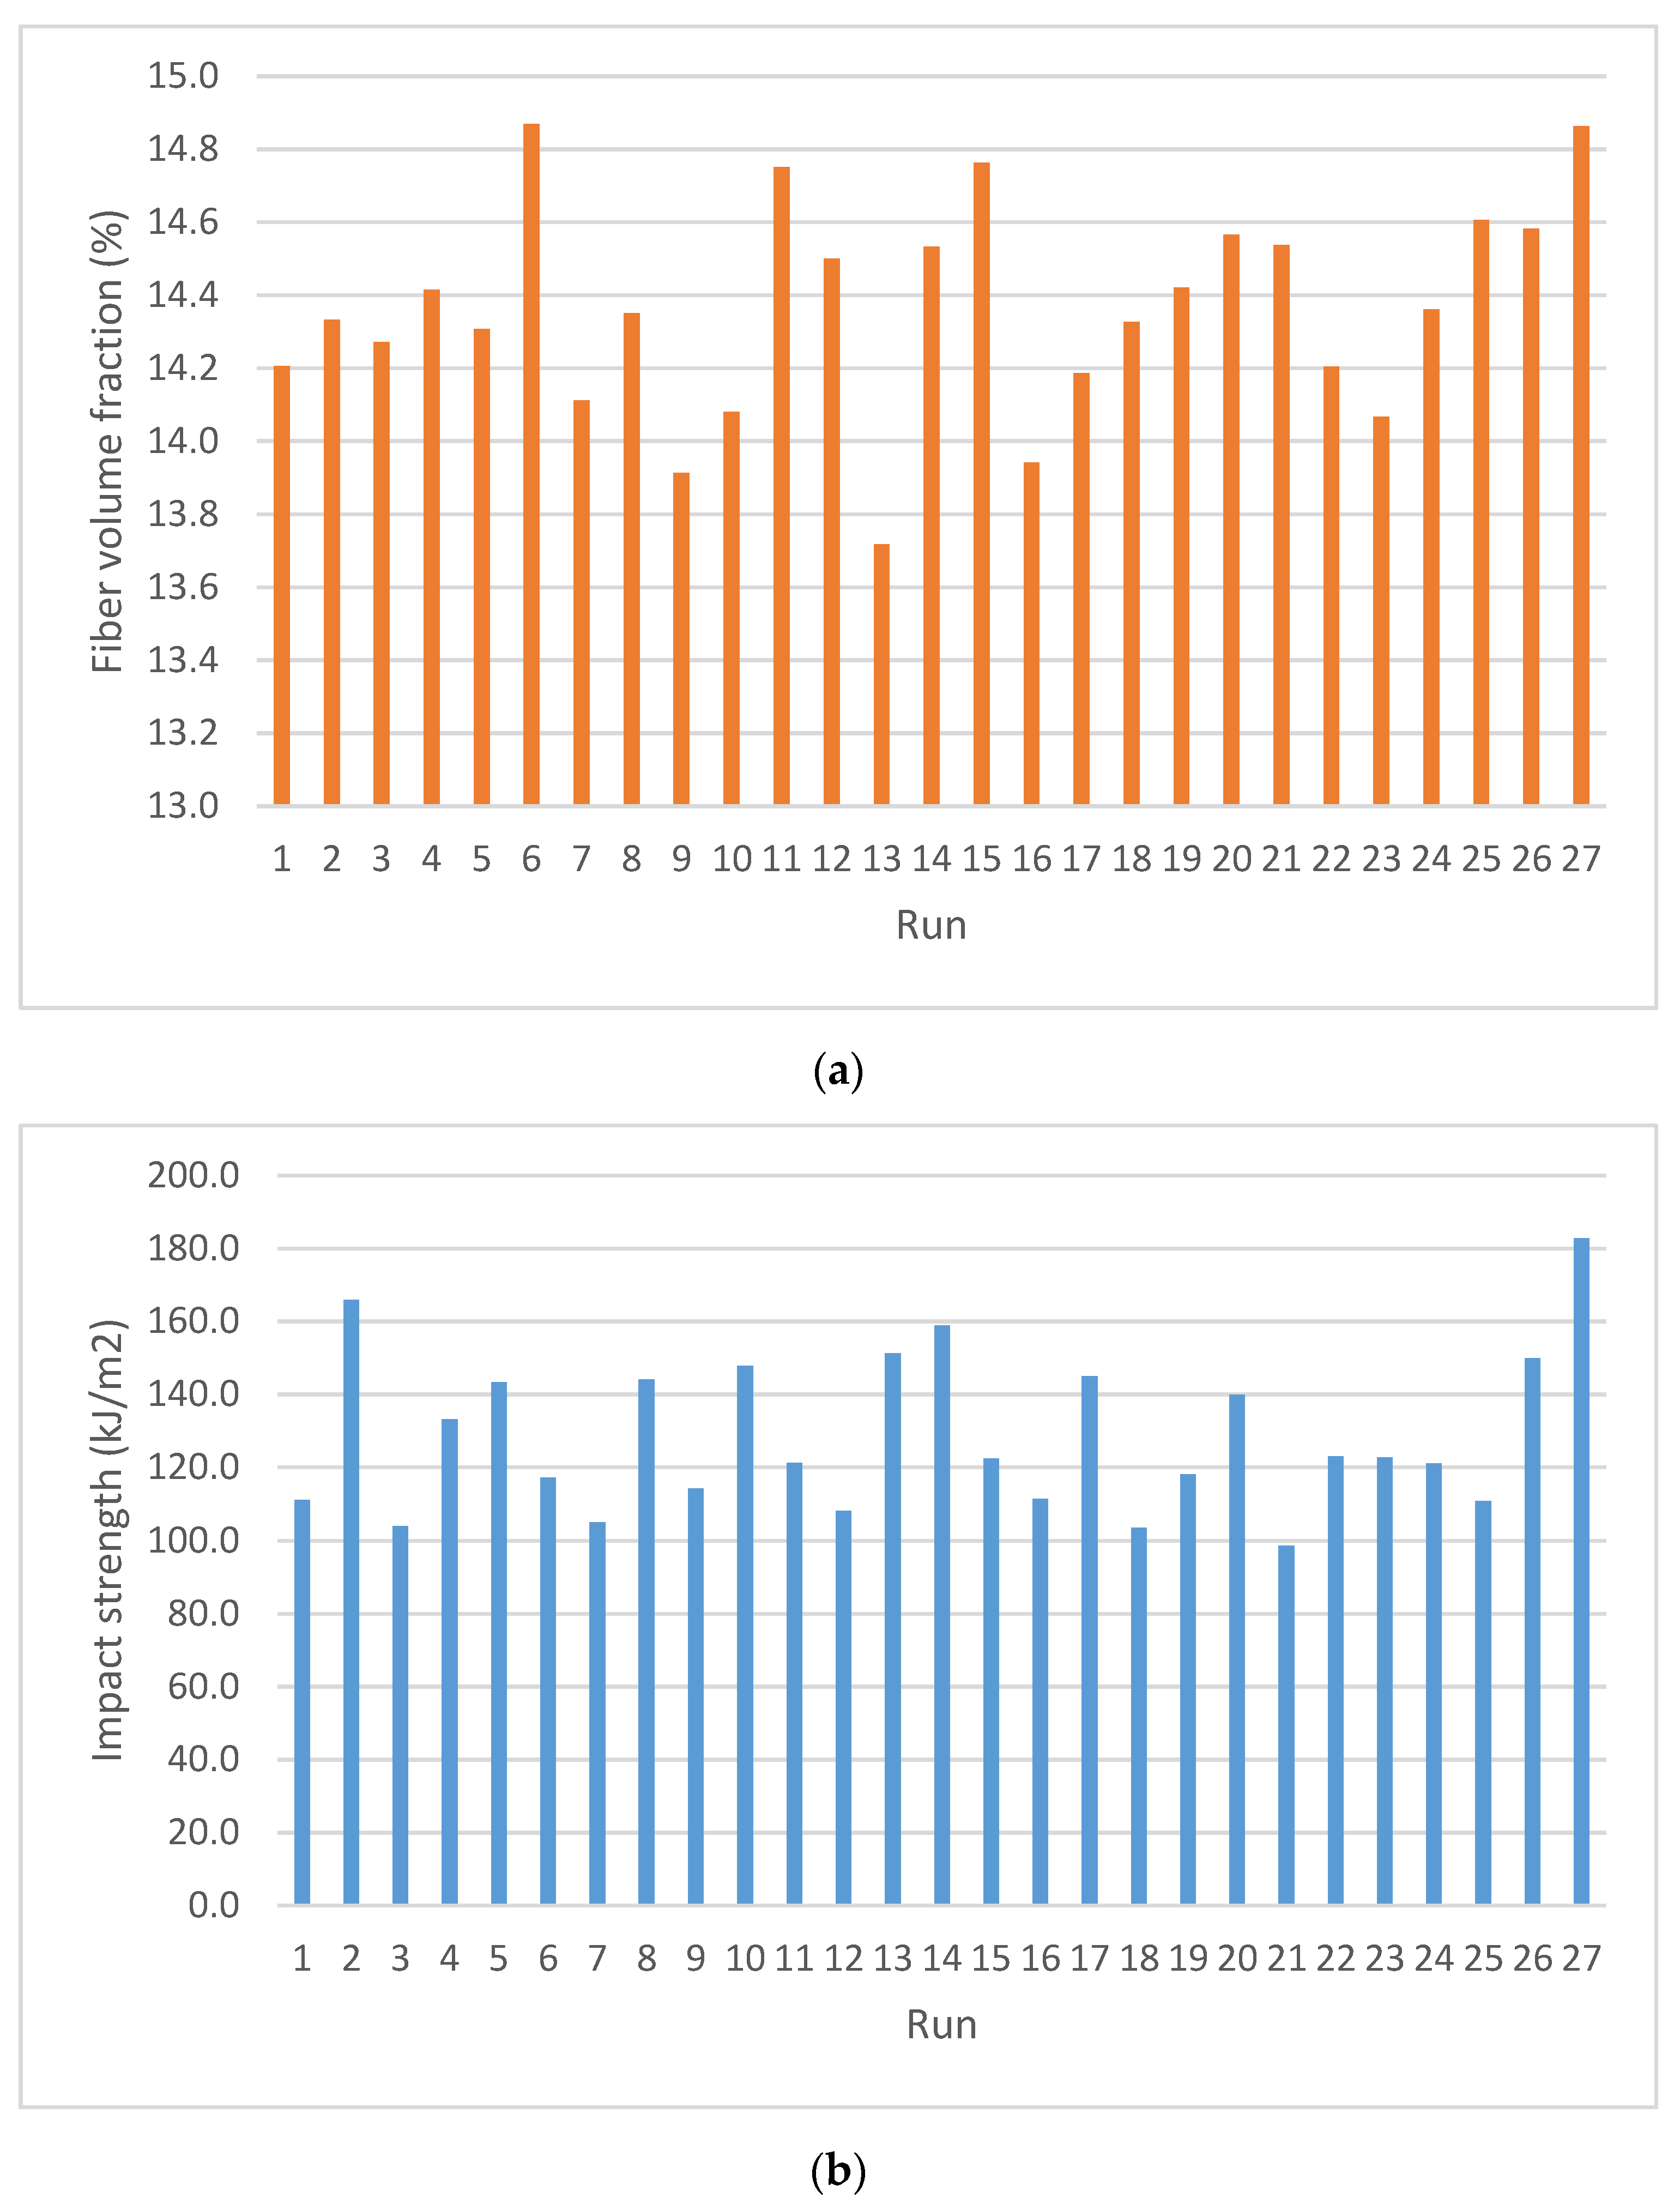
3.1. Responses

The overmolding process of polypropylene pellets containing short carbon fibers against pre-tensioned unidirectional carbon fibers resulted in a multipurpose specimen, as shown in Figure 6.
The runner system, especially the gate design, governs the matrix flow that carries the short carbon fibers into the mold. The flow orientation of the matrix can affect the positional stability of the unidirectional carbon fiber. The position of the UD carbon fiber must be ensured to be in the middle of the specimen’s cross section and not shifted due to matrix pressure during overmolding; for this reason, confirmation of gate design using Moldflow simulation was carried out. Figure 7 shows the tensor orientation of the short fibers directed by the flow matrix. Gate design can direct short fibers so that they are oriented parallel to the unidirectional fibers.
The experimental results in Figure 8 showed that the sixth run with a melting temperature of 210 °C, injection pressure of 120 bar, backpressure of 15 bar, and fiber pretension of 20 N produced the highest volume fraction 14.87%. The highest impact strength of 182.72 kJ/m2 resulted from the 27th run at a combination of melting temperature parameters of 230 °C, injection pressure of 120 bar, backpressure of 10 bar, and fiber pretension of 80 N. The second run with a combination of melt temperature parameters 210 °C, injection pressure 120 bar, backpressure 10 bar, and fiber pretension 50 N can produce the highest flexural strength of 73.32 Mpa after being tested with the four-point bending test. However, further analysis is required to observe the relationship between the four-parameter factors and the three targeted responses. It is essential to obtain factors that significantly affect the response and to obtain the prediction parameters that can produce higher results.

3.2. Analysis of Fiber Volume Fraction

Table 5 demonstrates the analysis of variance for fiber volume fraction. The linear equation model built from the four-parameter factors was not significantly related to the fiber volume fraction. This fact is shown by the Model F-value of 0.60; there is a 66.52% chance that F-value could occur due to noise. Each factor also cannot significantly affect fiber volume fraction, proven by the values of “Prob > F” greater than 0.1000.
Figure 9 shows the effect of all factors on fiber volume fraction. Factors likely to affect the fiber volume fraction were melt temperature, injection pressure, and backpressure. Those three parameters were assumed to ease plastic melt to carry the short fibers into the mold. However, it can be observed that the curve of melting temperature versus fiber volume fraction forms a flat line, while other factors produce a volume fraction difference of only 0.1 to 0.2% from low factor level to high factor level. Thus, it can be stated that these factors do not affect fiber volume fraction. From the results of 27 trials, the average value of the fiber volume fraction is 14.36%, which is decreased by 1.84% compared to the fiber volume fraction of pellet raw material.
Further research is needed to observe the possibility of increasing fiber volume fraction at the same level as pellet raw material. The setting of the matrix melting temperature follows recommendations from the material’s supplier; an increase in temperature can cause matrix degradation. Thus, the opportunity for parameter improvement is related to injection pressure and backpressure.

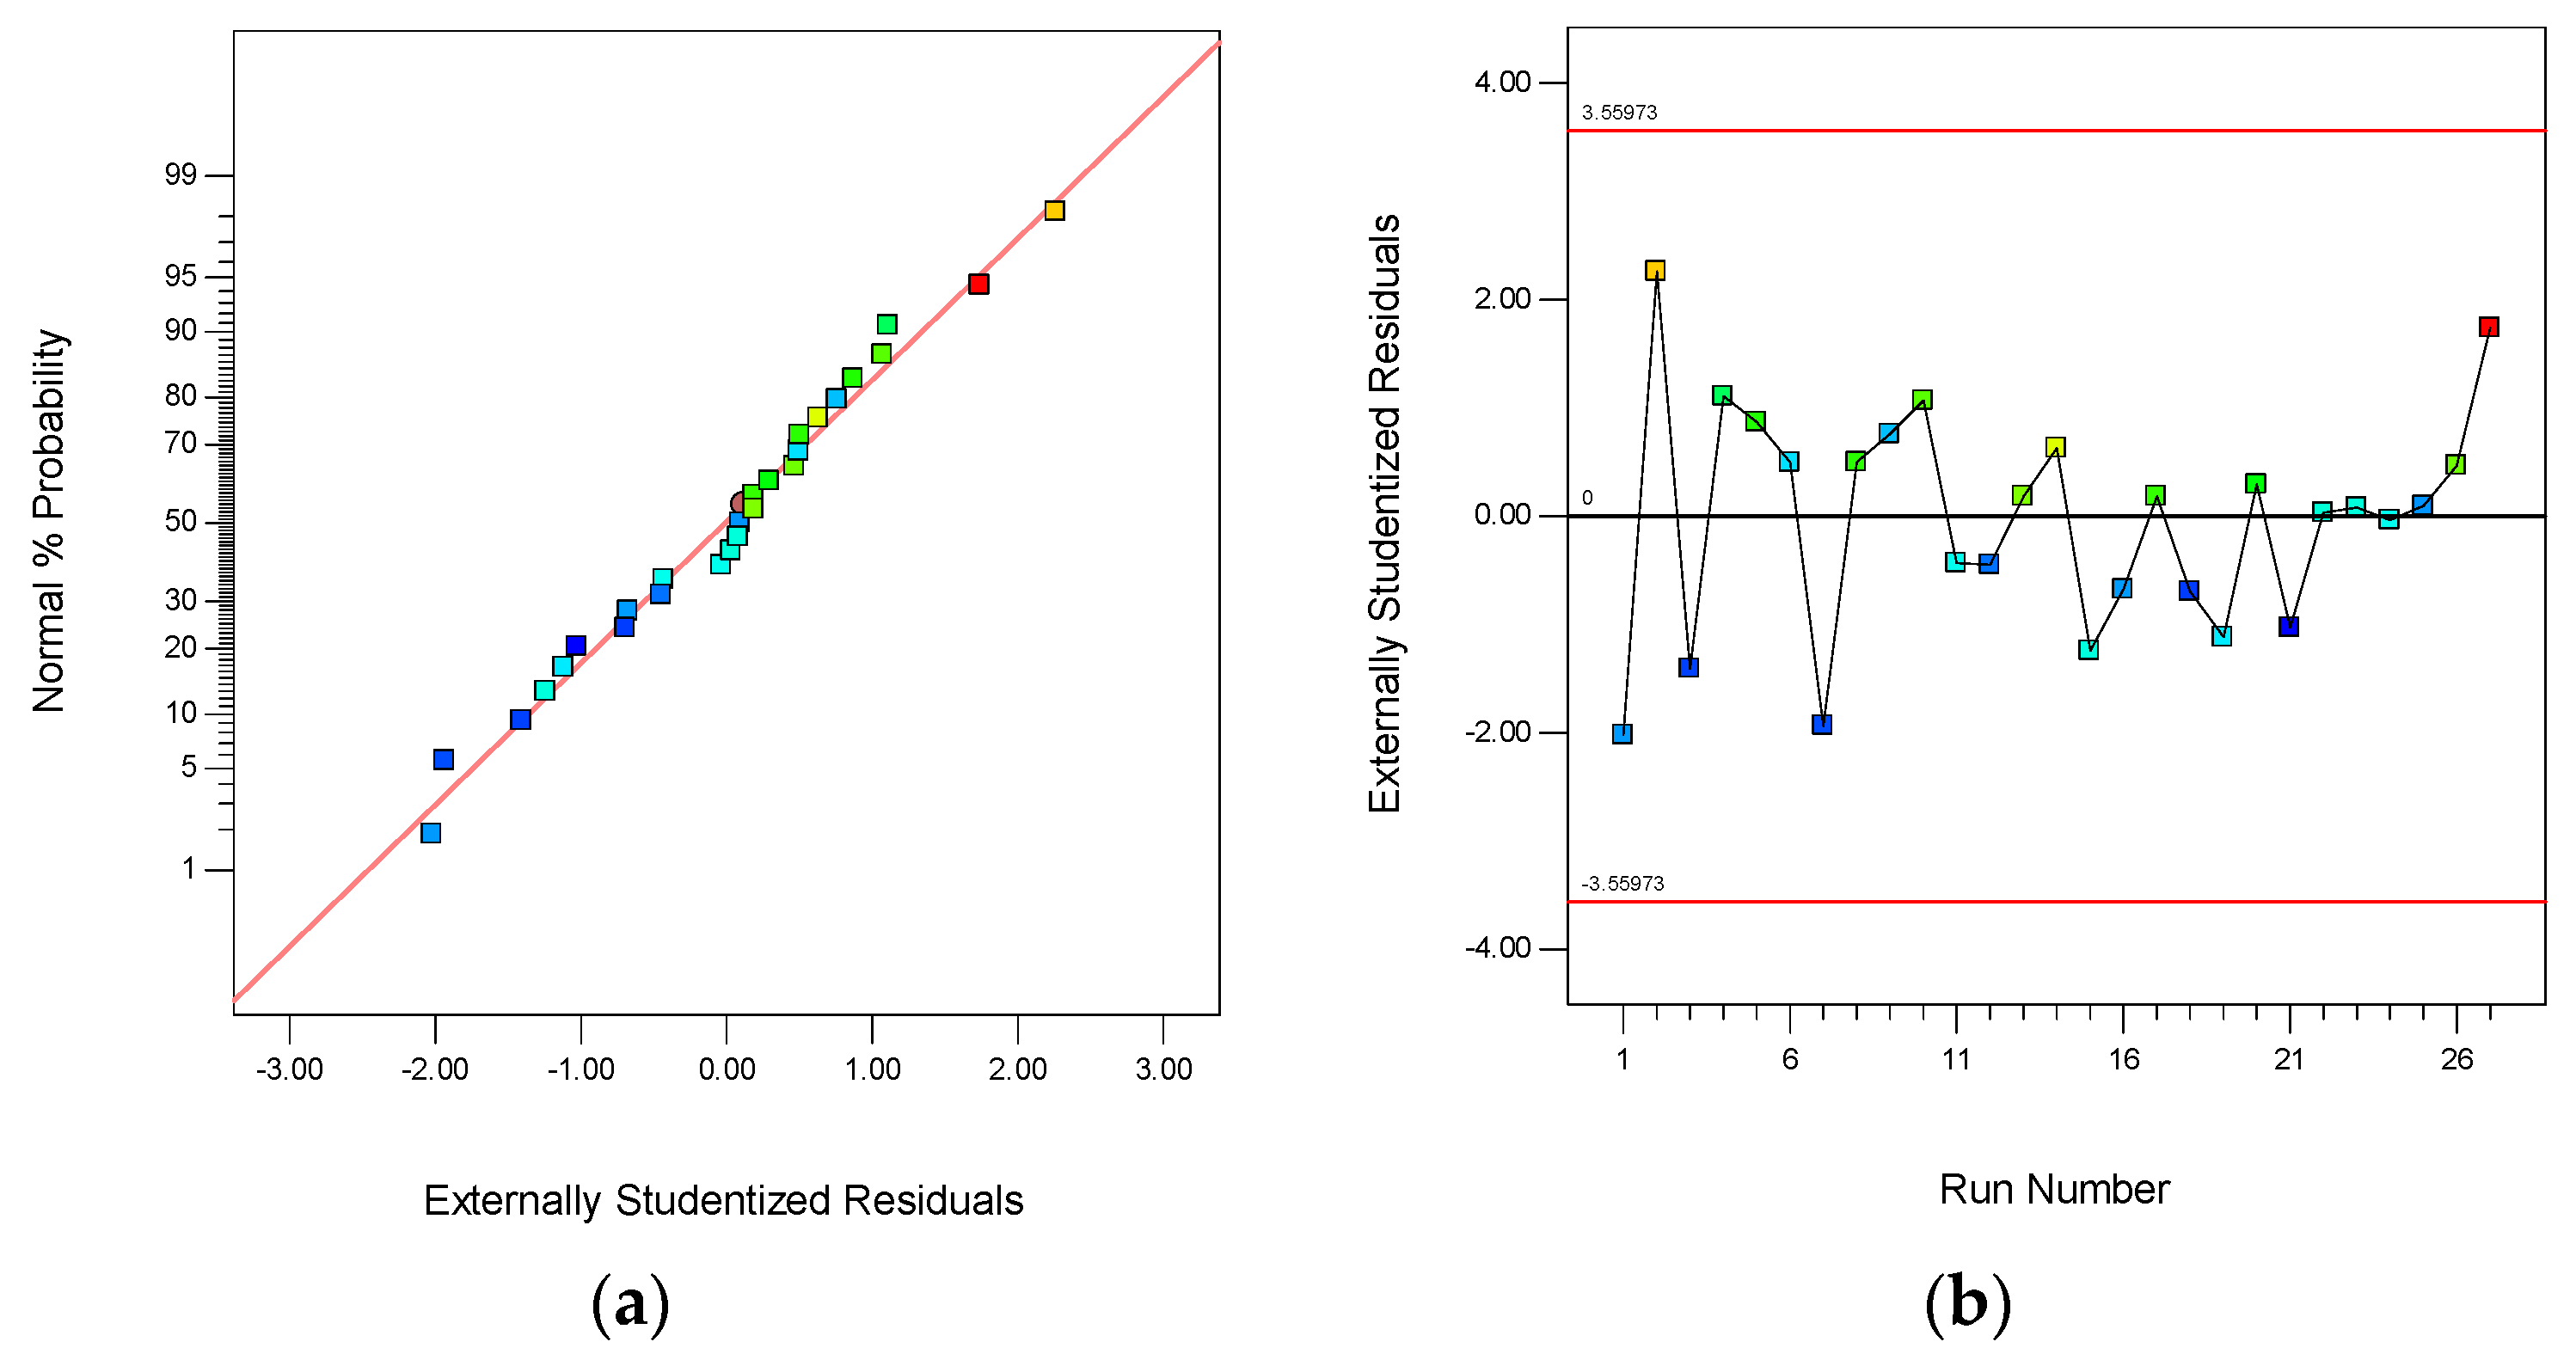
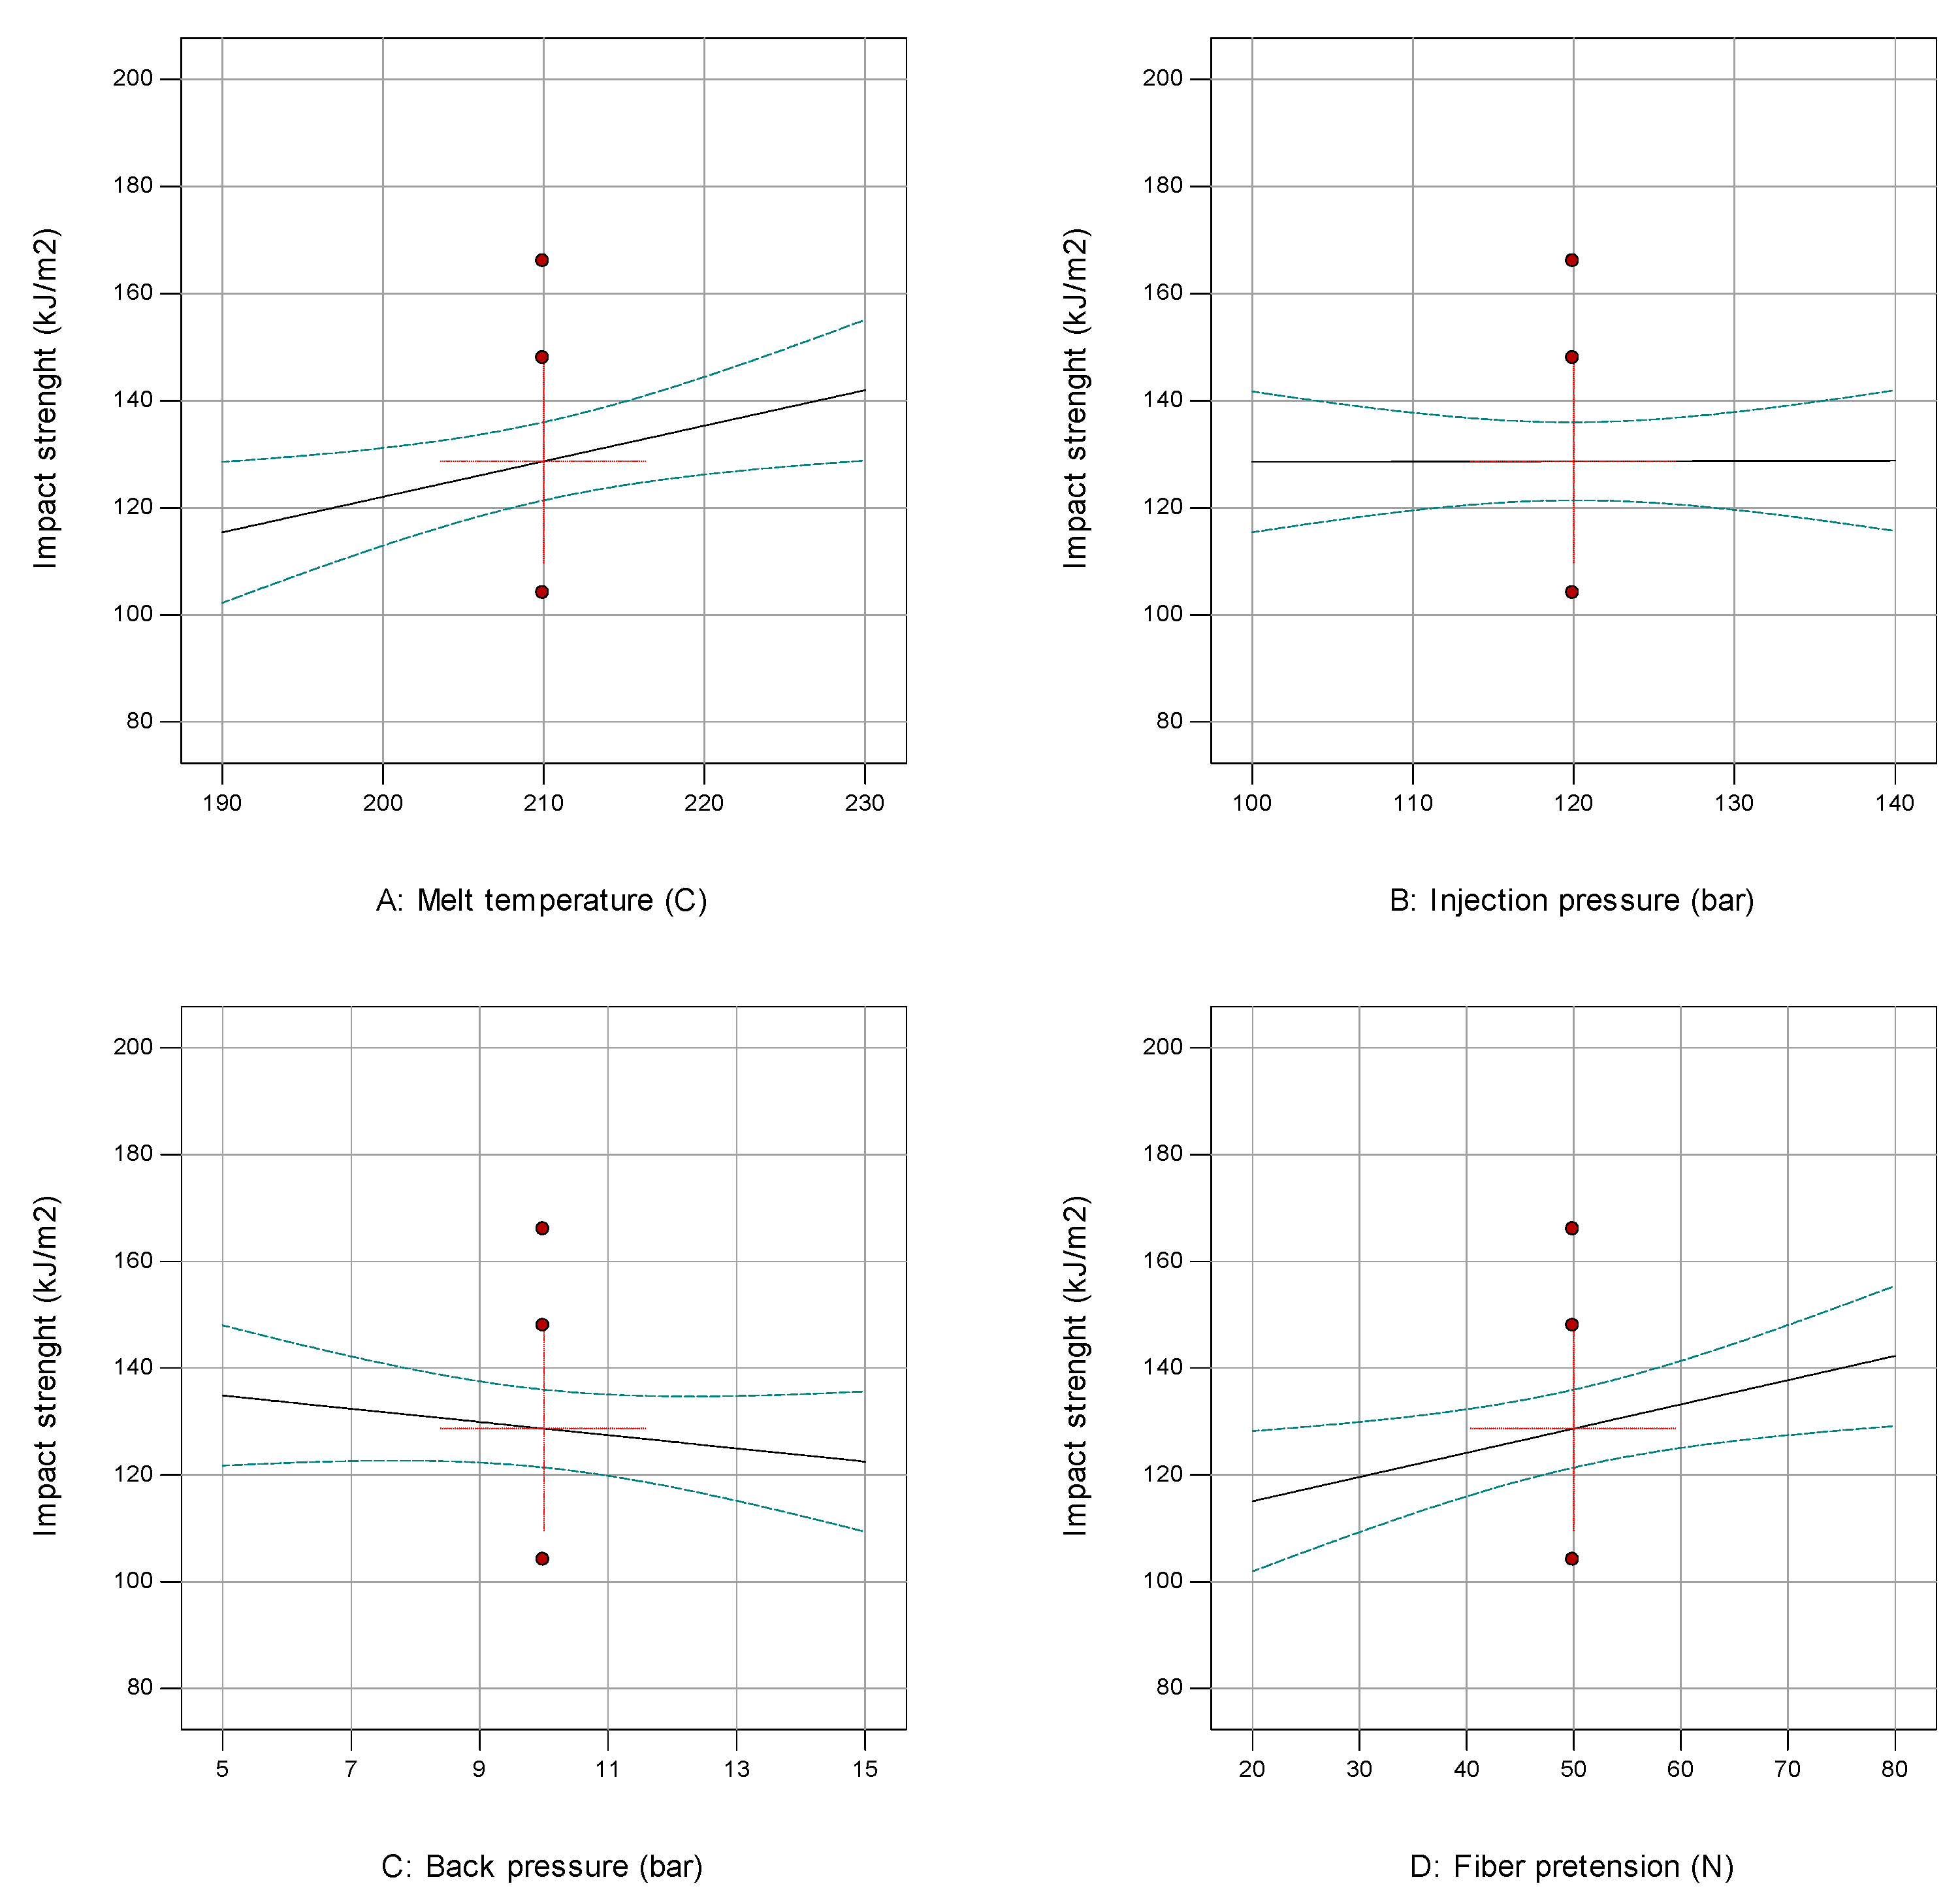
3.3. Analysis of Impact Strength

The model’s F-value of 3.59 indicates that it is significant. An F-value this large could occur due to noise only 2.12%. The model terms are significant, proved by the “Prob > F” values less than 0.0500. Here, the significant model terms are melted temperature and fiber pretension. The “Lack of Fit F-value” of 0.26 reflects that the Lack of Fit is insignificant compared to pure error. A “Lack of Fit F-value” of this magnitude has a 96.04% chance of occurrence due to noise. Non-significant lack of fit is desirable; it proves that the model is fit. Table 6 shows the initial ANOVA for impact strength.
The “Pred R-Squared” of 0.1429 is in close approximation with the “Adj R-Squared” of 0.2851; the difference is less than 0.2. The signal-to-noise ratio is measured by “Adeq Precision.” It is preferable to have a ratio greater than four. The signal is adequate, as indicated by the ratio of 6.838. This model can be used to guide the design space. The relationship between model-forming factors and impact strength response, in terms of actual factors, can be expressed in the following mathematical equation:
Impact strength = −21.707 + 0.66352 A + 6.208 × 10⁻³ B − 1.238 C + 0.454 D
where A is melt temperature, B is injection pressure, C is backpressure, and D is the fiber pretension. This equation can be interpreted as all factors except back pressure having a positive effect on impact strength. Here, melting temperature and fiber pretension have a significant effect on impact strength.
The model’s compatibility with the actual system must be investigated to verify that the model gives an accurate estimate. One of the diagnostic tools that can be used to prove the adequacy of the model is a normal probability plot. Figure 10a displays the normal probability plot of the residuals for the impact strength. As can be seen, the points follow a straight line, so in this case, the residuals follow a normal distribution. The plot of residuals versus the experimental run in Figure 10b shows a random scatter. Residuals in run 1 and run 2 are higher than others but still below the limit, close to the lurking variables that may have influenced the response during the experiment.
The influence of each factor individually on impact strength is shown in Figure 11. The graph shows that the increase in melting temperature and fiber pretension affects increasing impact strength, while changes in injection pressure do not affect impact strength. In impact testing, short fibres orientation play a significant role in resisting collisions. In this study, the given injection pressure range did not give a different effect on the short fibre orientation. The fibre orientation has not yet reached the final stage when the injection pressure is applied. Several studies have found that orientation changes can occur after a cavity has been filled and during the post filling stage of the injection moulding process. In this case, the packing pressure determines the fibre’s final orientation [34,35]. With these facts, modifications were made to the ANOVA by eliminating the injection pressure from the factors that make up the model, as shown in Table 7. With the elimination of injection pressure, the significance of the model becomes better, indicated by the smaller p-value and higher “Adeq Precision” value.
The relationship between impact strength and parameter factors after ANOVA modification is mathematically shown in Equation (5). Backpressure shows a negative effect; increasing backpressure will decrease the impact strength’s value.
Impact strength (modified) = −20.962 + 0.664 A − 1.238 C + 0.453 D
By considering the effect of each factor (as described in Figure 8) and using Equation (5), an optimum impact strength value of 168.03 kJ/m2 was predicted to be obtained from a combination of parameters: melting temperature 230 °C, injection pressure 120 bar, backpressure 10 bar, and fiber pretension 80 N. The value of the predicted result is lower than the highest experimental result, but it is still higher than the others.

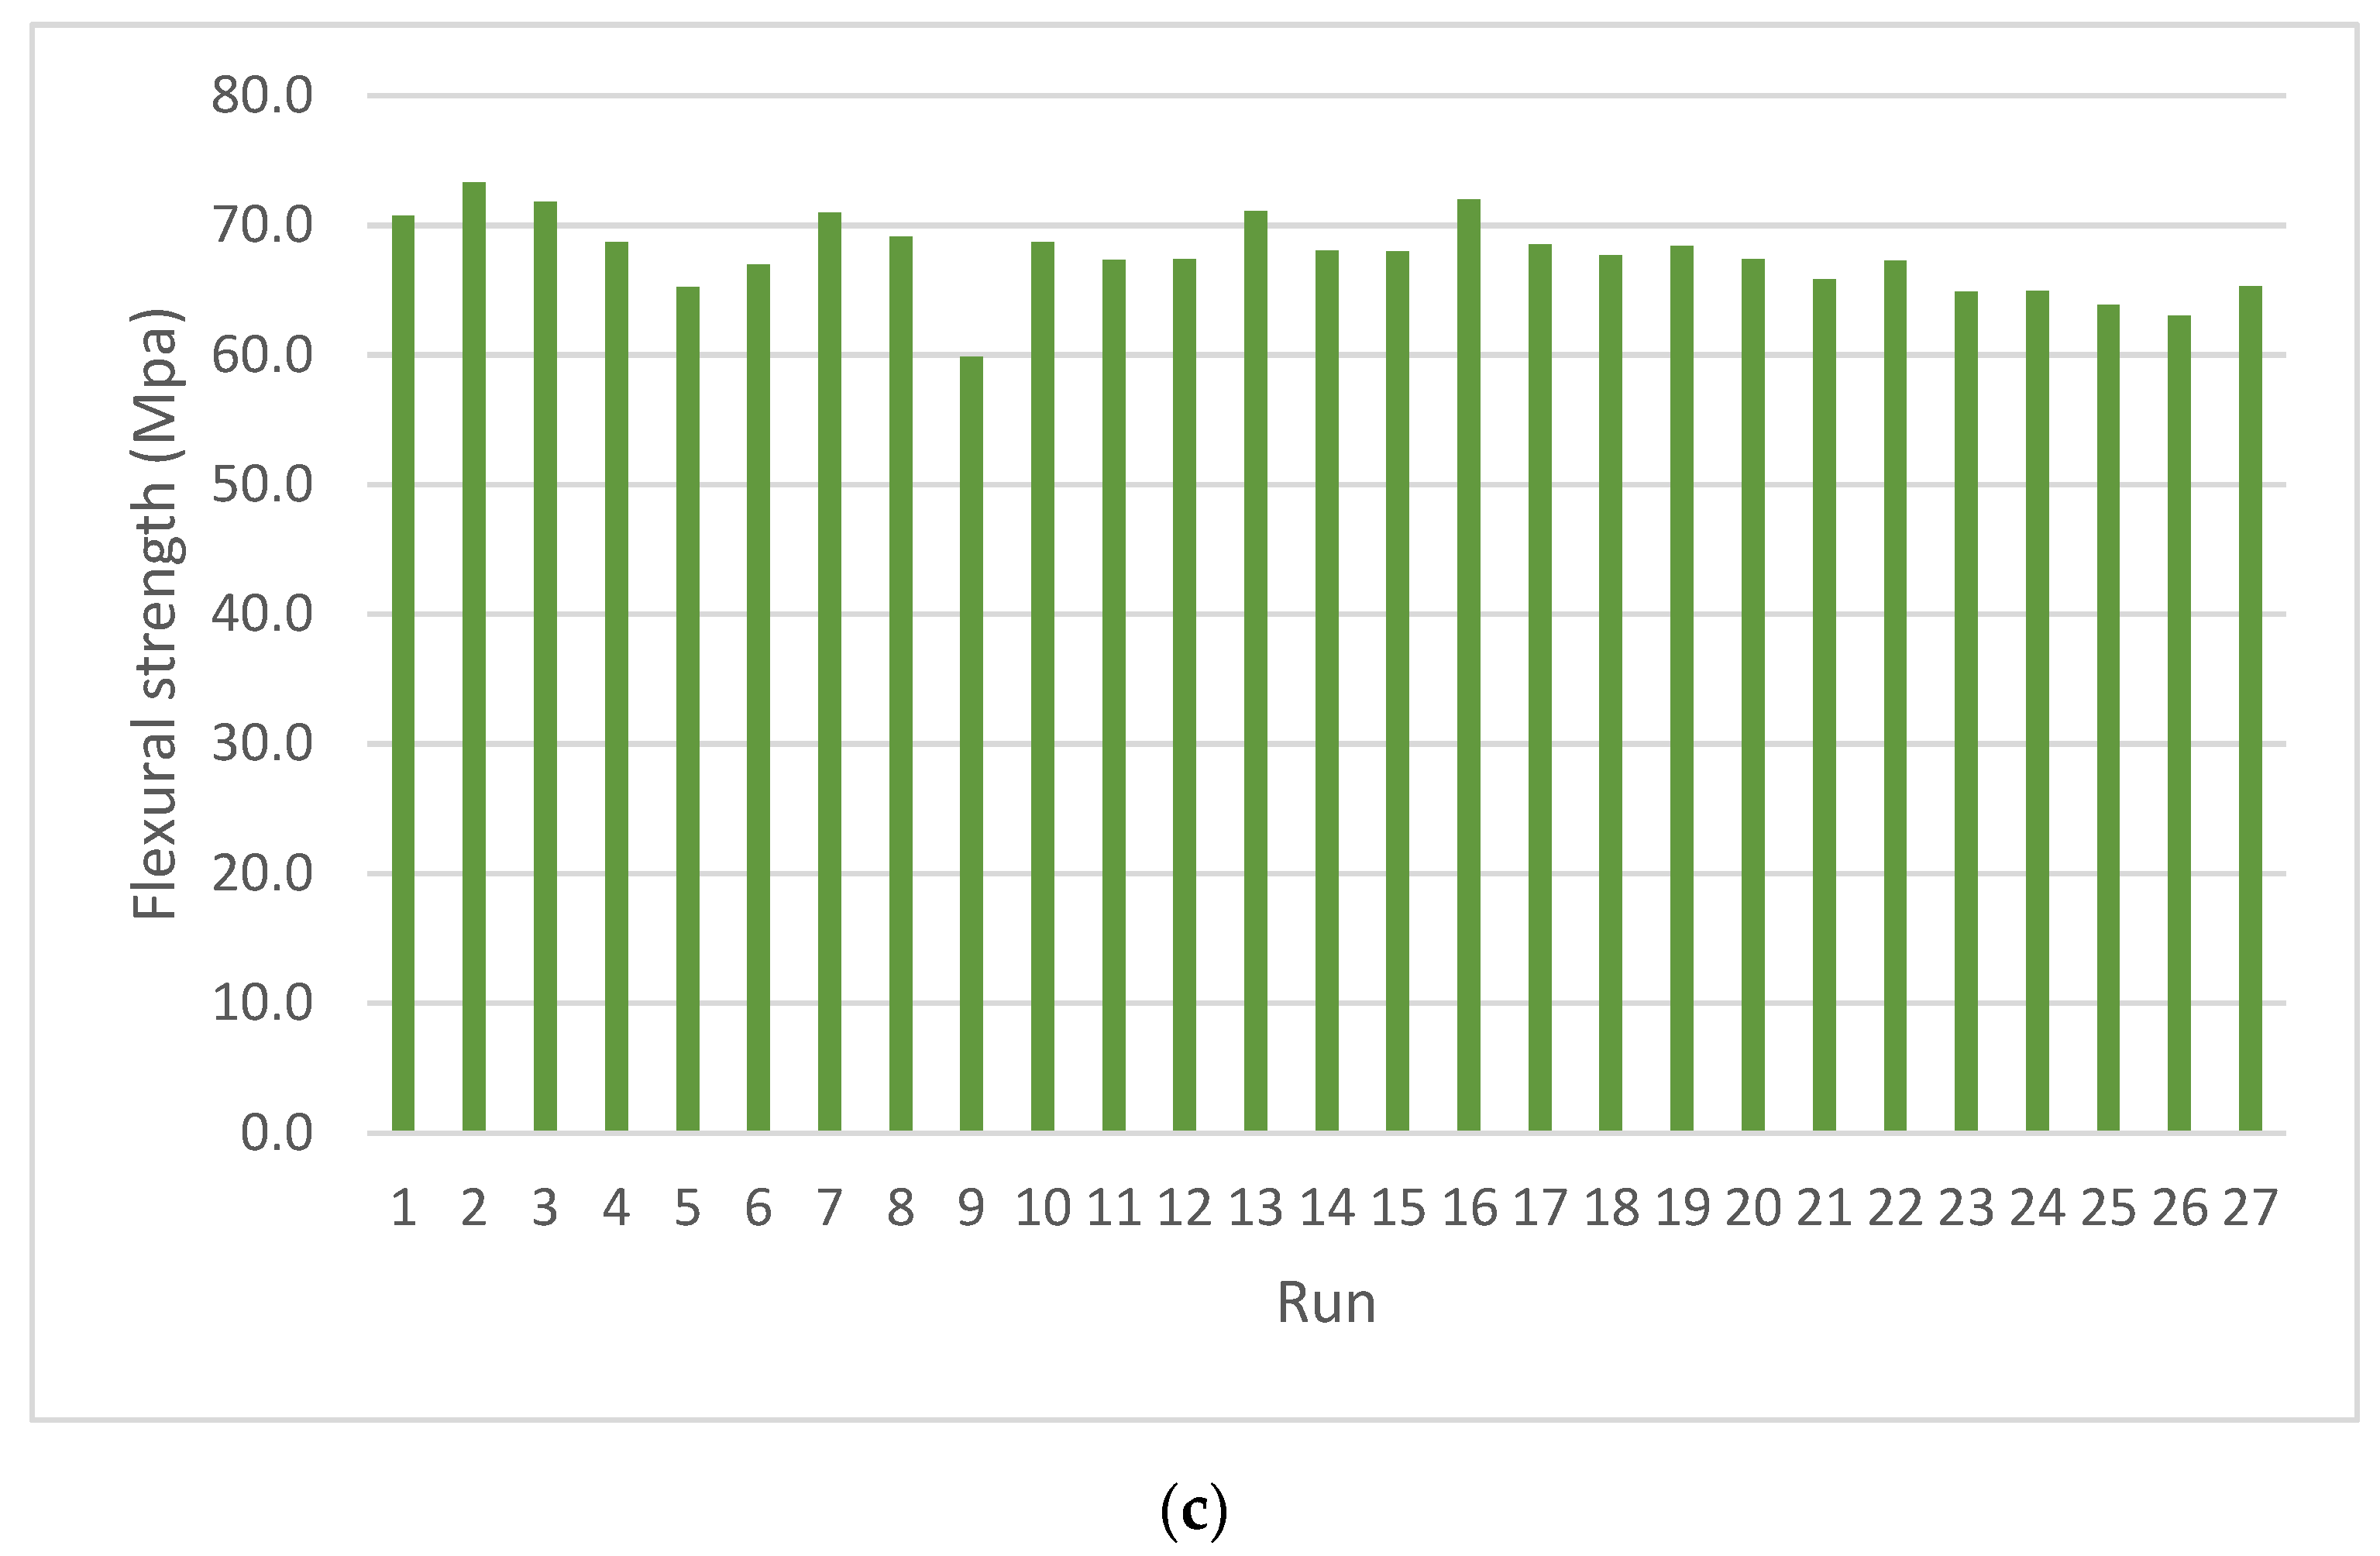
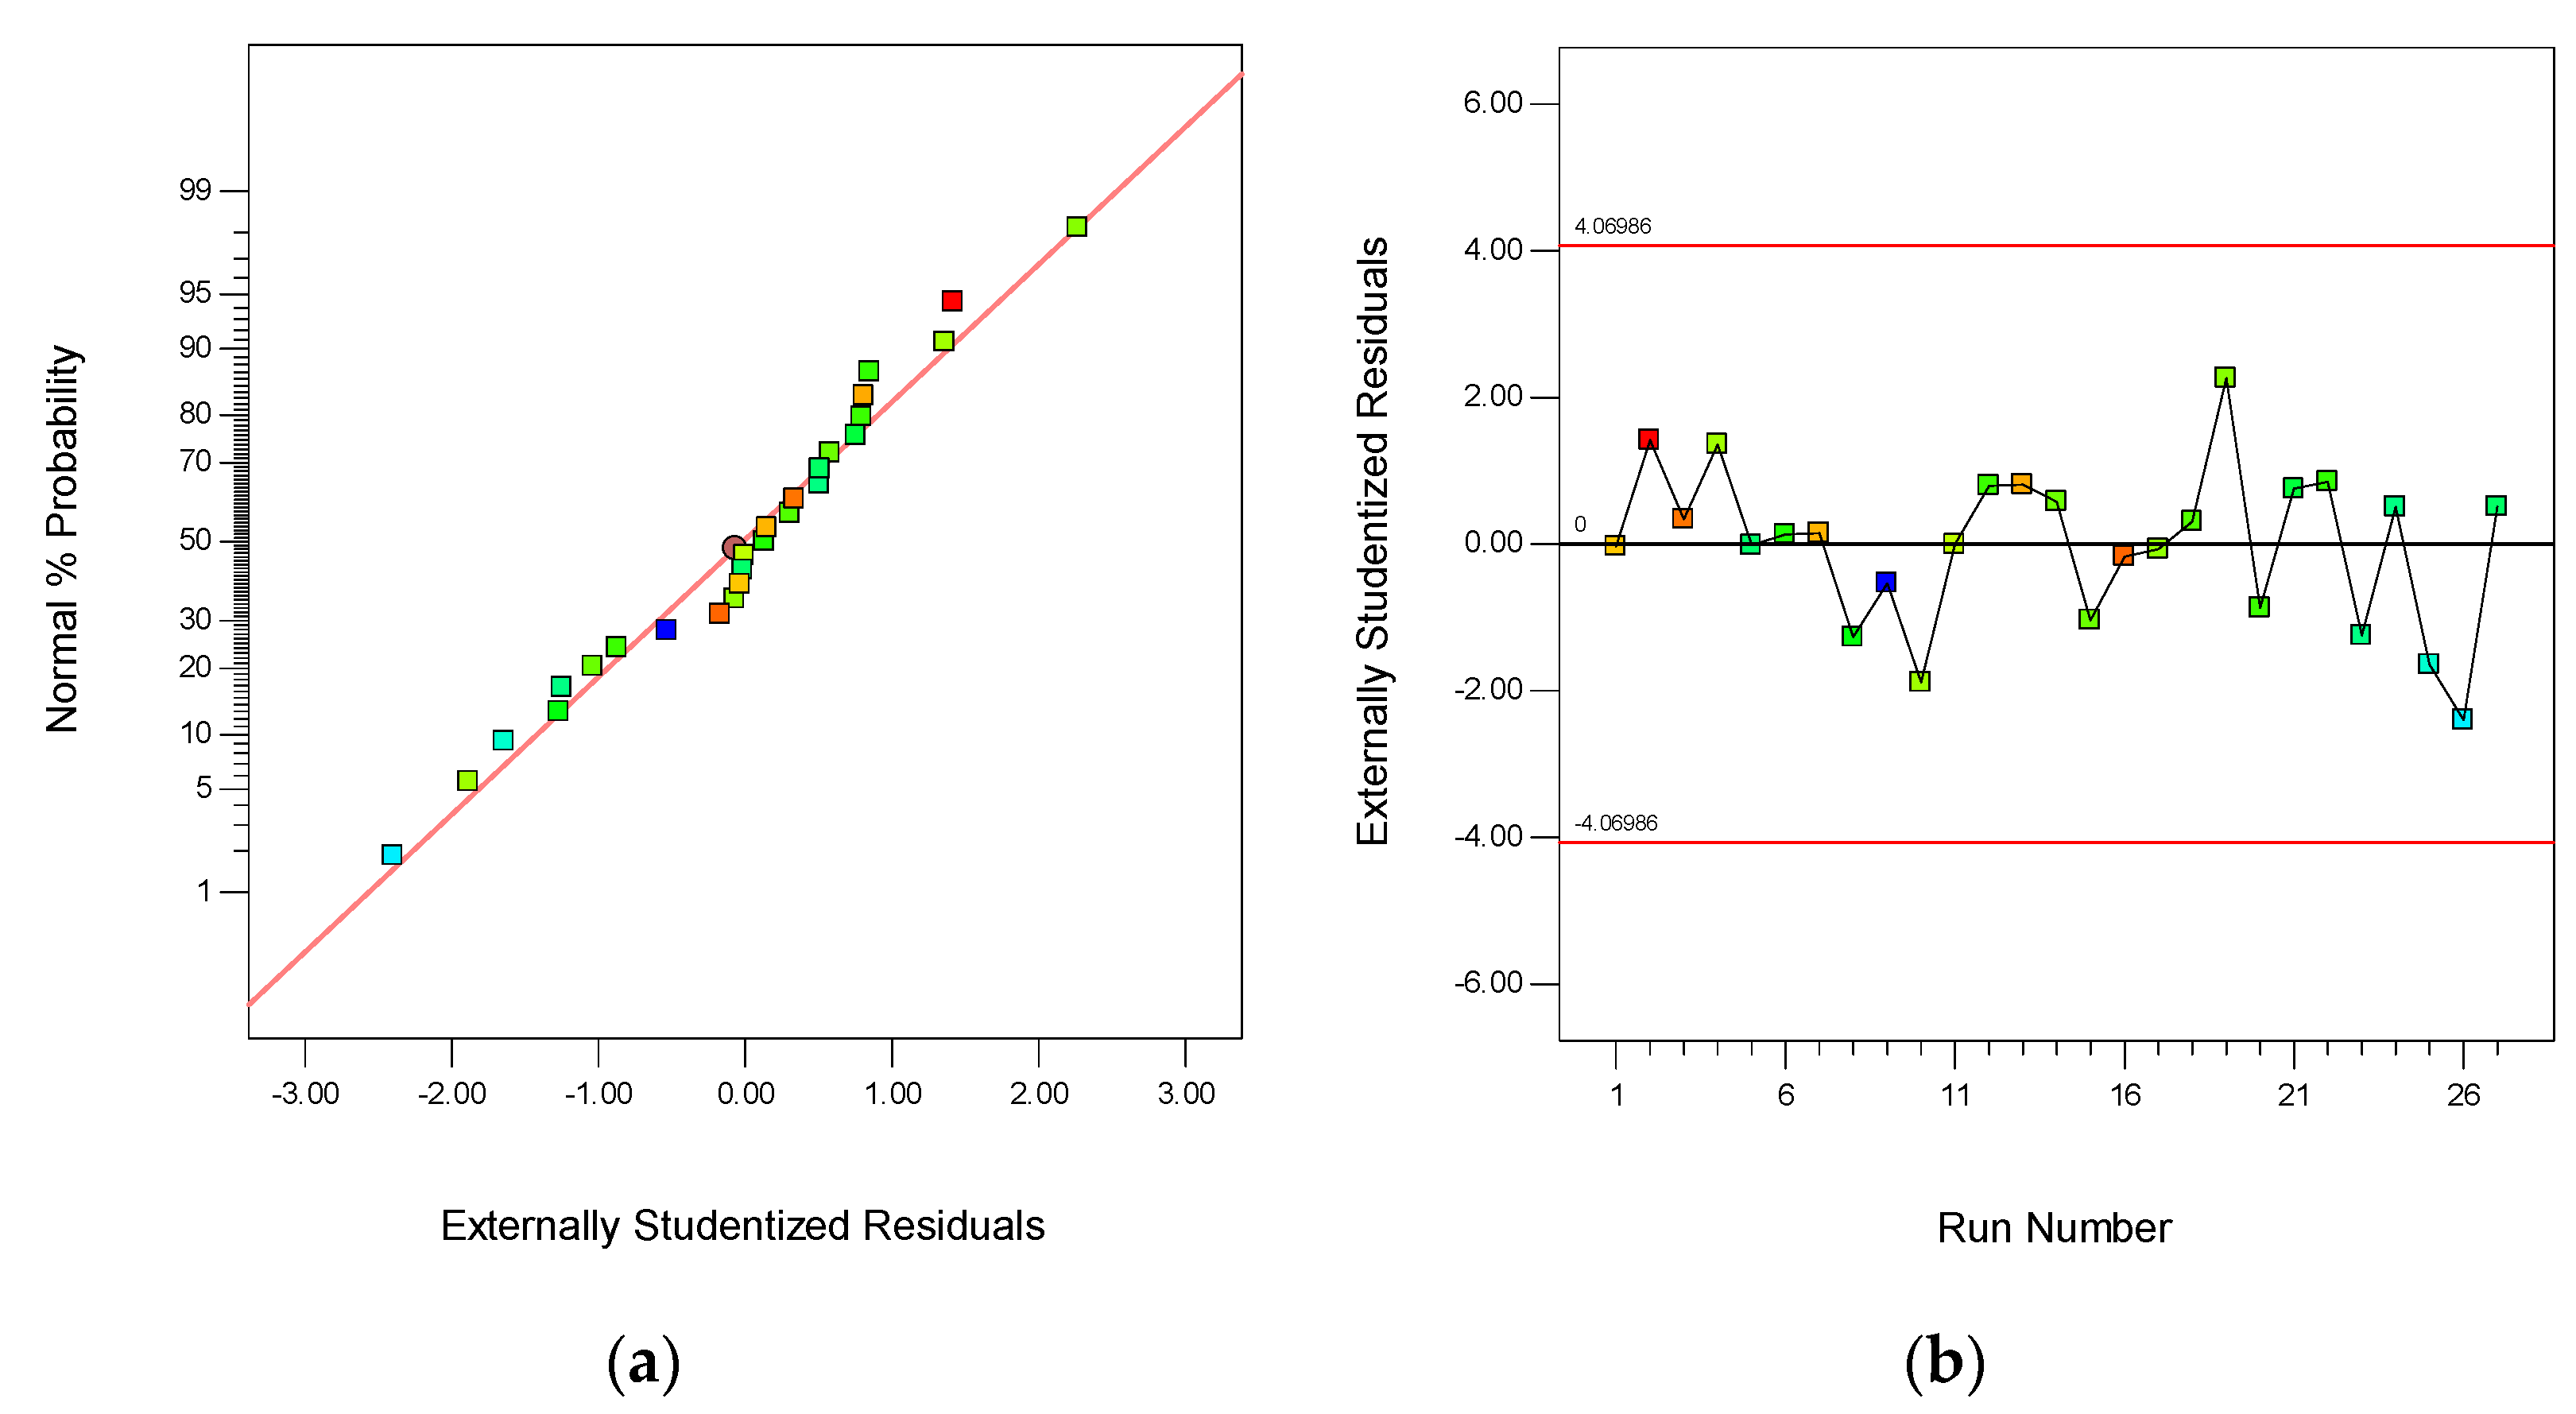
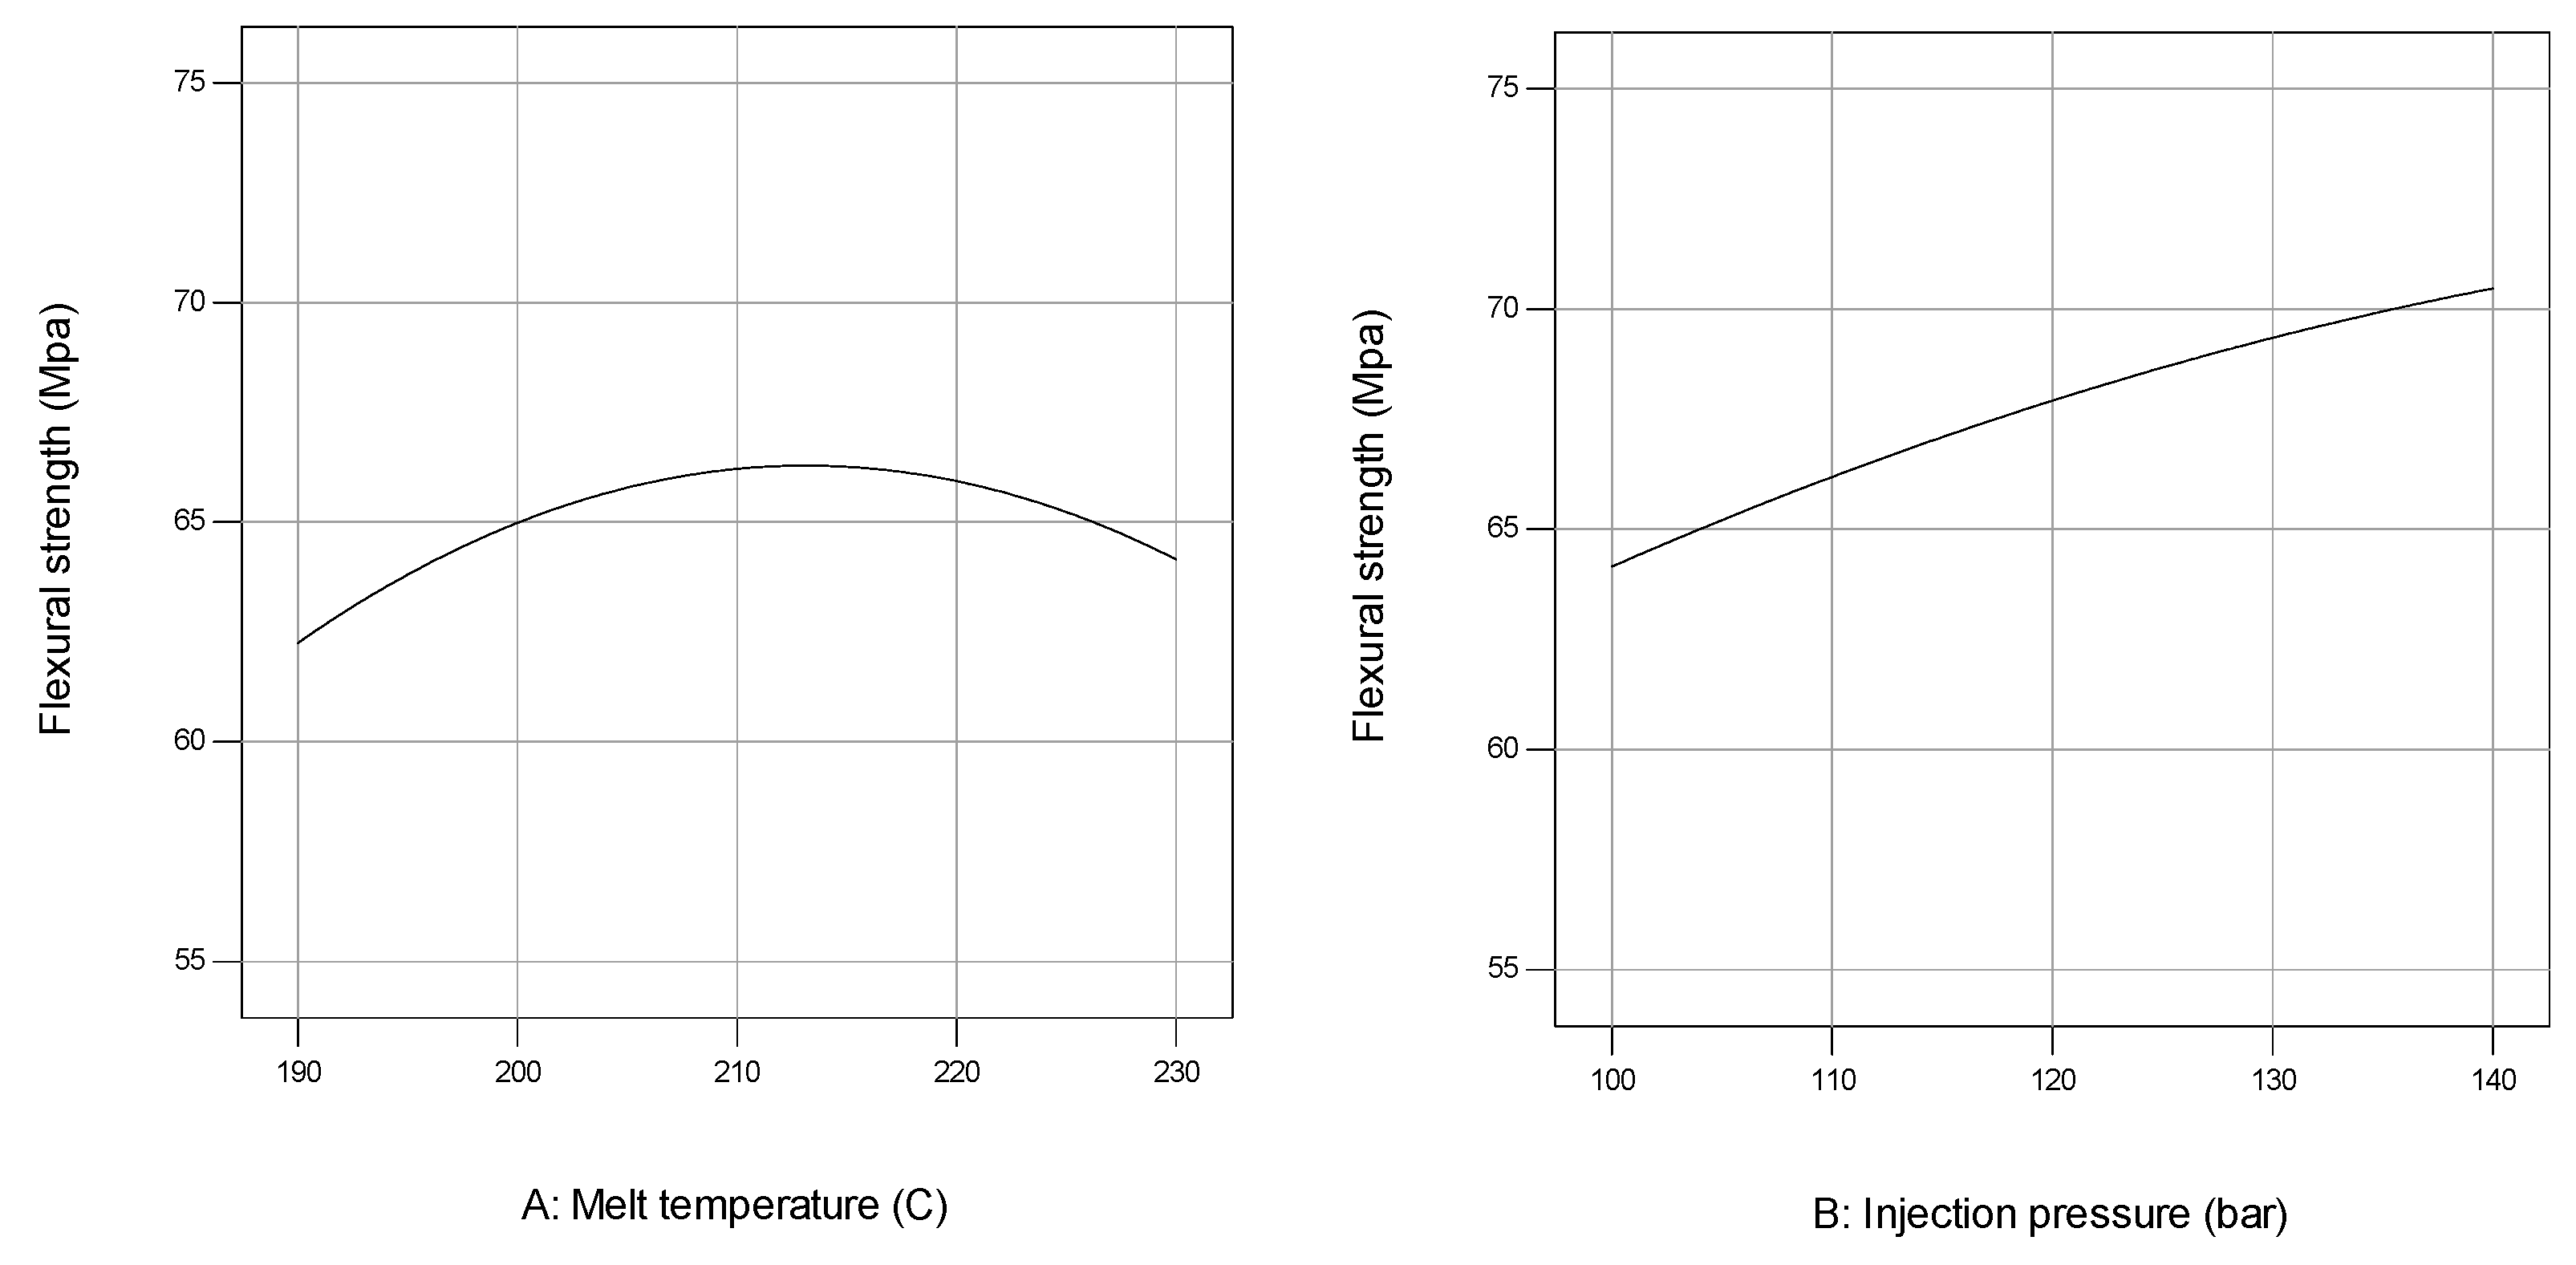
3.4. Analysis of Flexural Strength

The response of the four-point bending test results in the range of 59.86 Mpa to 73.32 Mpa, with a maximum to minimum ratio of 1.225. The relationship between factors and responses can be displayed in a second-order polynomial model. Table 8 is the ANOVA for the flexural strength response in a quadratic model.
A significant p-value (<0.05) is shown in the model terms A, AD, BC, A2, and D2. The scatterplot of the prediction errors is plotted in two ways, as shown in Figure 12. The error in each run lies close to the normal line, indicating that the data are normally distributed, and the errors in the prediction of response are minimal since they are very close to the diagonal line. Furthermore, the plot of the residuals versus the experimental run order shows a random scatter that provides insurance against trends ruining the analysis.
Figure 13 describes the effect of each factor on flexural strength response. It can be observed that the relationship between factors and responses forms a quadratic curve. Considering the influence of each factor individually, the maximum flexural strength value can be achieved at a melt temperature of 215 °C, the injection pressure of 140 bar, backpressure of 5 bar, and fibre pretension of 35 N, respectively. However, if these factors are applied in combination, the model from ANOVA should be used as a reference.
With ANOVA, the relationship between flexural strength and parameter factors can be obtained and expressed mathematically with Equation (6). The equation is in terms of actual factors, and it can be used to make predictions about the flexural strength for given levels of each factor.
Flexural strength = −339.06 + 3.494 A + 0.038 B + 0.513 C + 1.015 D + 4.00 × 10⁻⁴ AB − 9.0125 × 10⁻³ AC − 3.82708 × 10⁻³ AD + 0.0208 BC + 1.63125 × 10⁻³ BD − 2.93056 × 10⁻³ CD − 7.525 × 10⁻³ A2 − 1.52552 × 10⁻³ B2 − 0.050 C2 − 3.76366 × 10⁻³ D2
From the equation above, the predictive optimum flexural strength of 71.3 Mpa can be obtained with a combination of parameters: melting temperature 210 °C, injection pressure 120 bar, backpressure 10 bar, and fiber pretension 50 N. The calculated result had a very relative value with the experimental result at the same factor combination.

3.5. Optimizing All Responses

Each target response has been characterized by RSM analysis by varying four factors and three levels. For optimization reasons, it was essential to gain the hybrid composite’s specific target value simultaneously. The target value was 14.5% fiber volume fraction, 150 kJ/m2 of impact strength, and 73 Mpa of flexural strength. The desirability function is a powerful method for simultaneous optimization of multiple responses; it ranges from 0 (outside the limits) to 1 (optimal performance). Desirability function optimization for all responses is obtained by normalizing each response parameter into an individual desirability function di with equations [36].
d v = [ F i F m i n F m a x F m i n ]
d I = [ I i I m i n I m a x I m i n ]
d F = [ σ F i σ F m i n σ F m a x σ F m i n ]
D F = ( d v w 1 × d I w 2 × d F W 3 ) 1 ( w 1 + w 2 + w 3 )
dv, dI, and dF are the individual desirability function for fiber volume fraction, impact strength, and flexural strength, respectively, and DF is a desirability function optimization for all responses. Imax and σFmax are the maximum values of impact strength and flexural strength, while Imin and σFmin are the minimum values of impact strength and flexural strength, respectively. In addition, w1, w2, and w3 are the weightings of importance for fiber volume fraction, impact strength, and flexural strength, respectively. In this case, the weighting for both responses is equal. Table 9 describes the corresponding values for calculating the desirability function, and Figure 14 displays the desirability chart resulting from the calculation. Both individual and combined desirability functions are found to be close to the optimum condition of one. This fact shows that the hybrid carbon fiber polypropylene composite is well optimized.
Combined desirability to obtain multiple responses is 0.811 with the following factor combination: melt temperature of 223 °C, the injection pressure of 140 bar, the backpressure of 10.7 bar, and fiber pretension of 65.82 N, respectively. As observed in Figure 15, by applying those parameter combinations, the optimum value can be obtained as follows: fiber volume fraction of 14.45%, impact strength of 143.58 kJ/m2, and flexural strength of 70.67 Mpa below the target value. The selection of parameter combinations depends on the response achieved: individual responses or multiple responses.

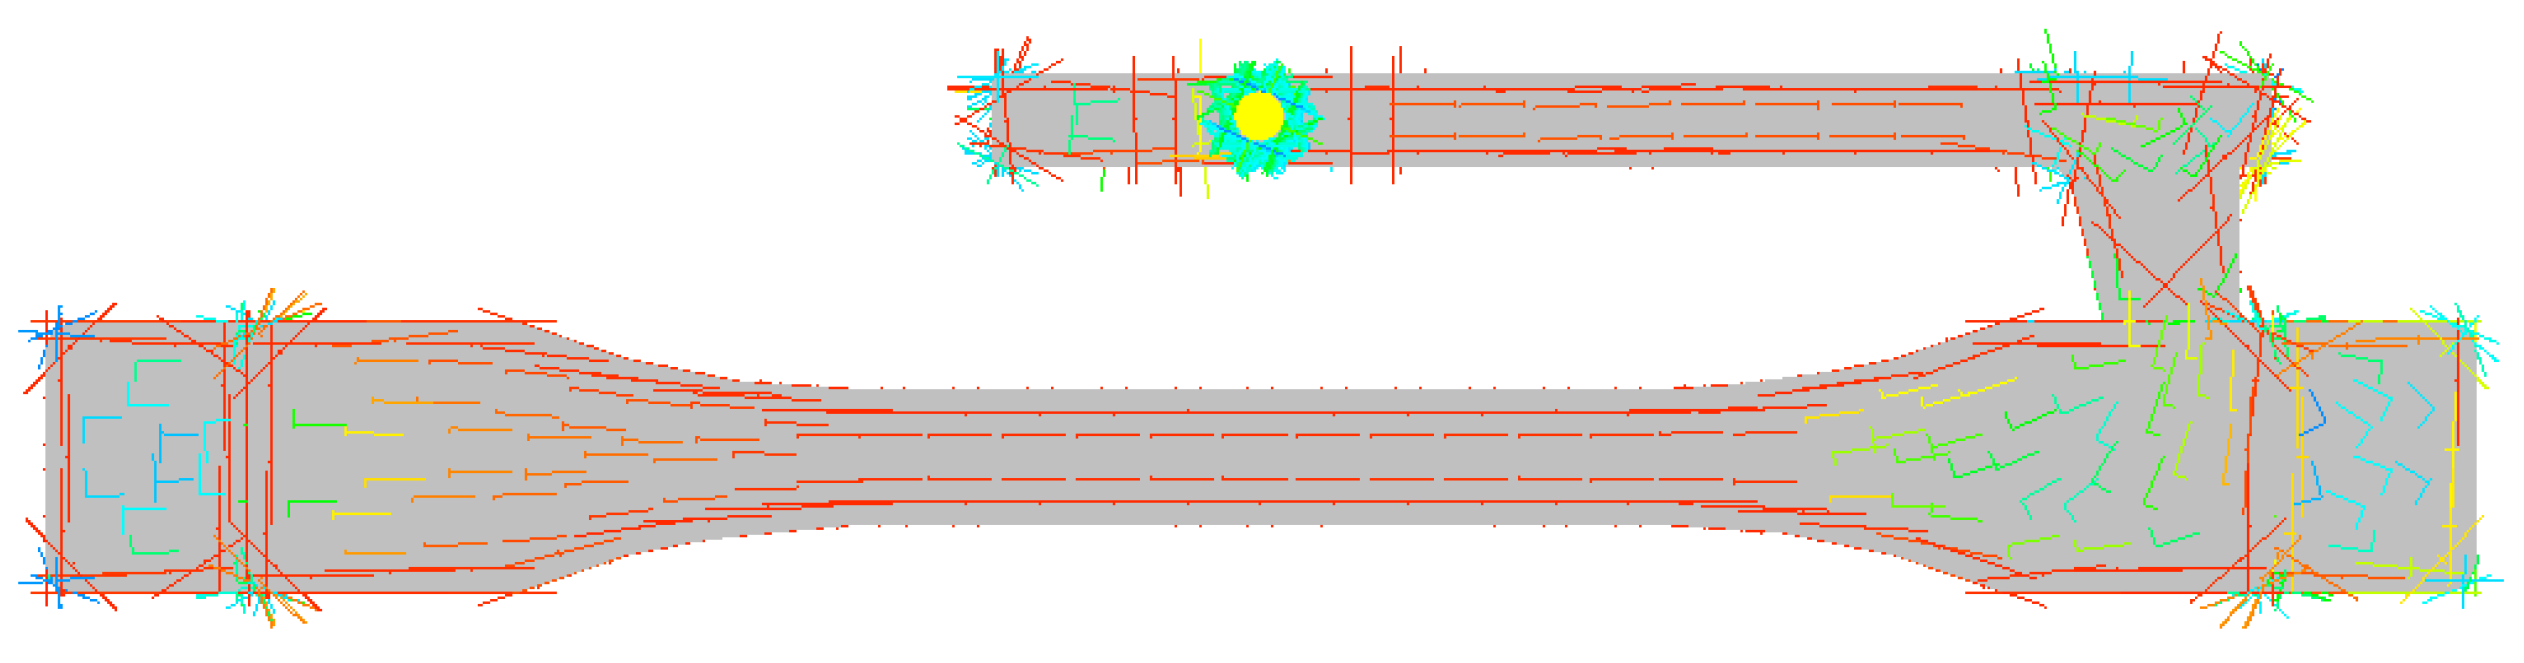
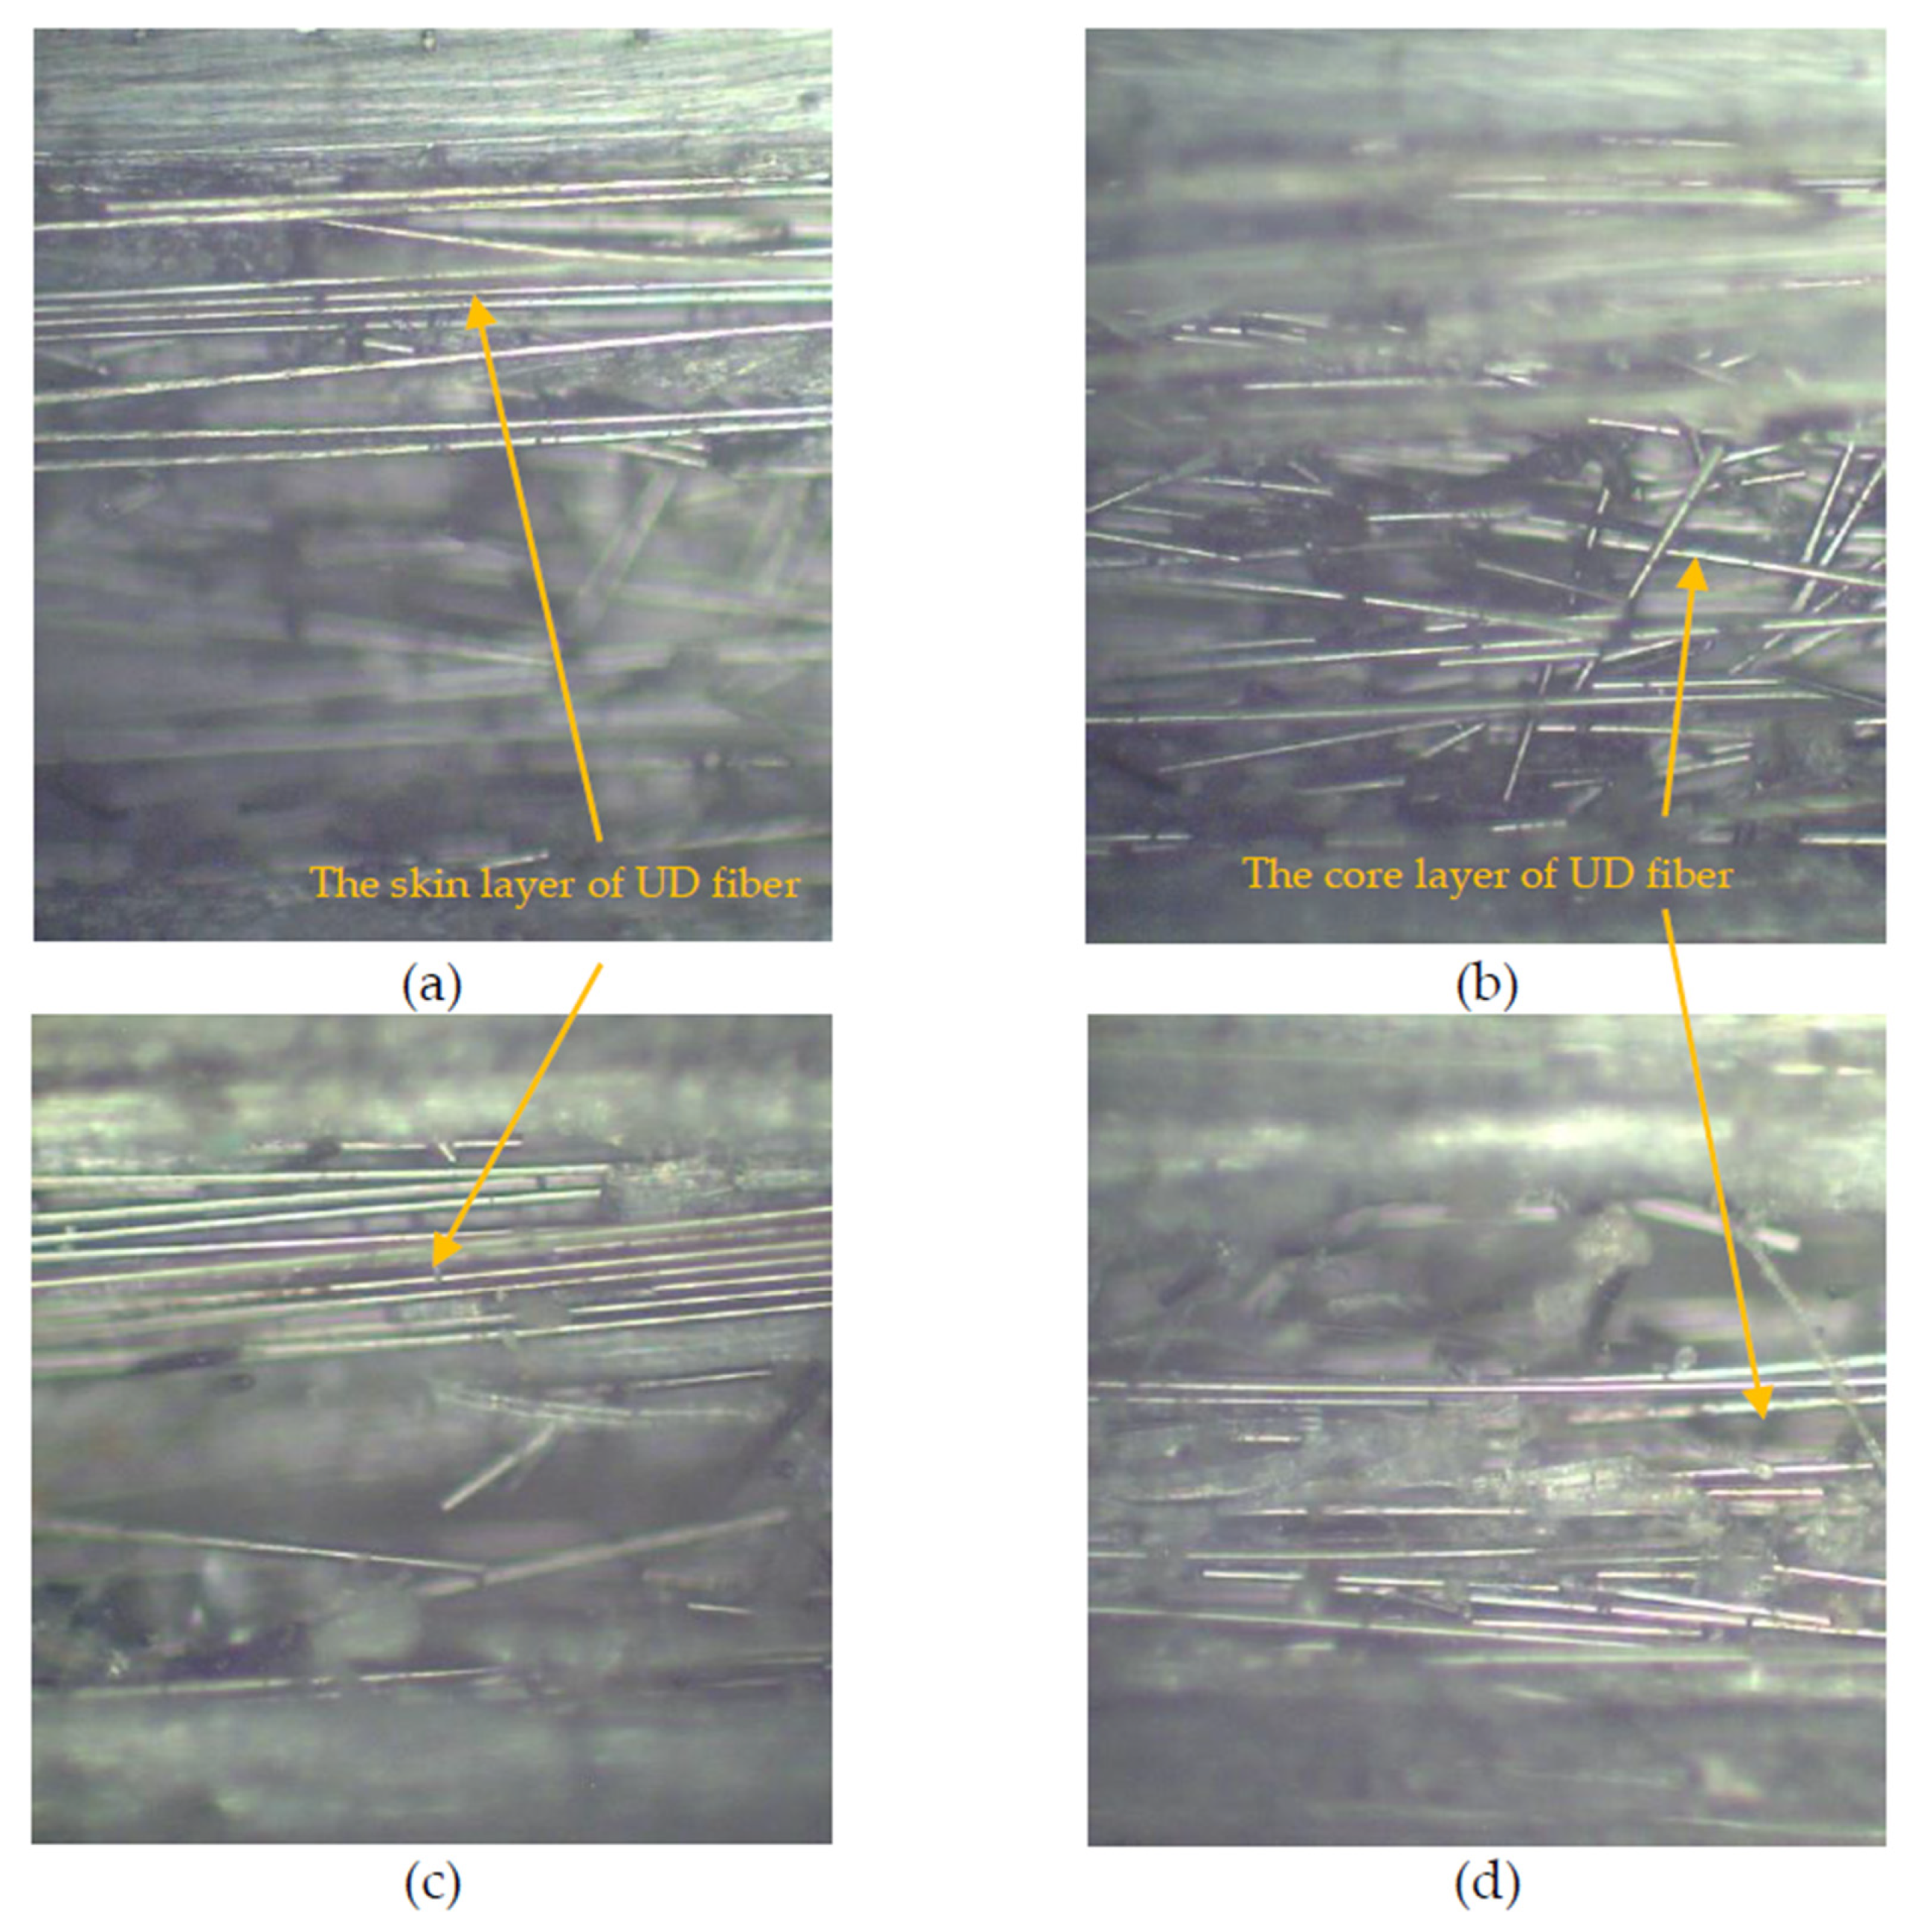
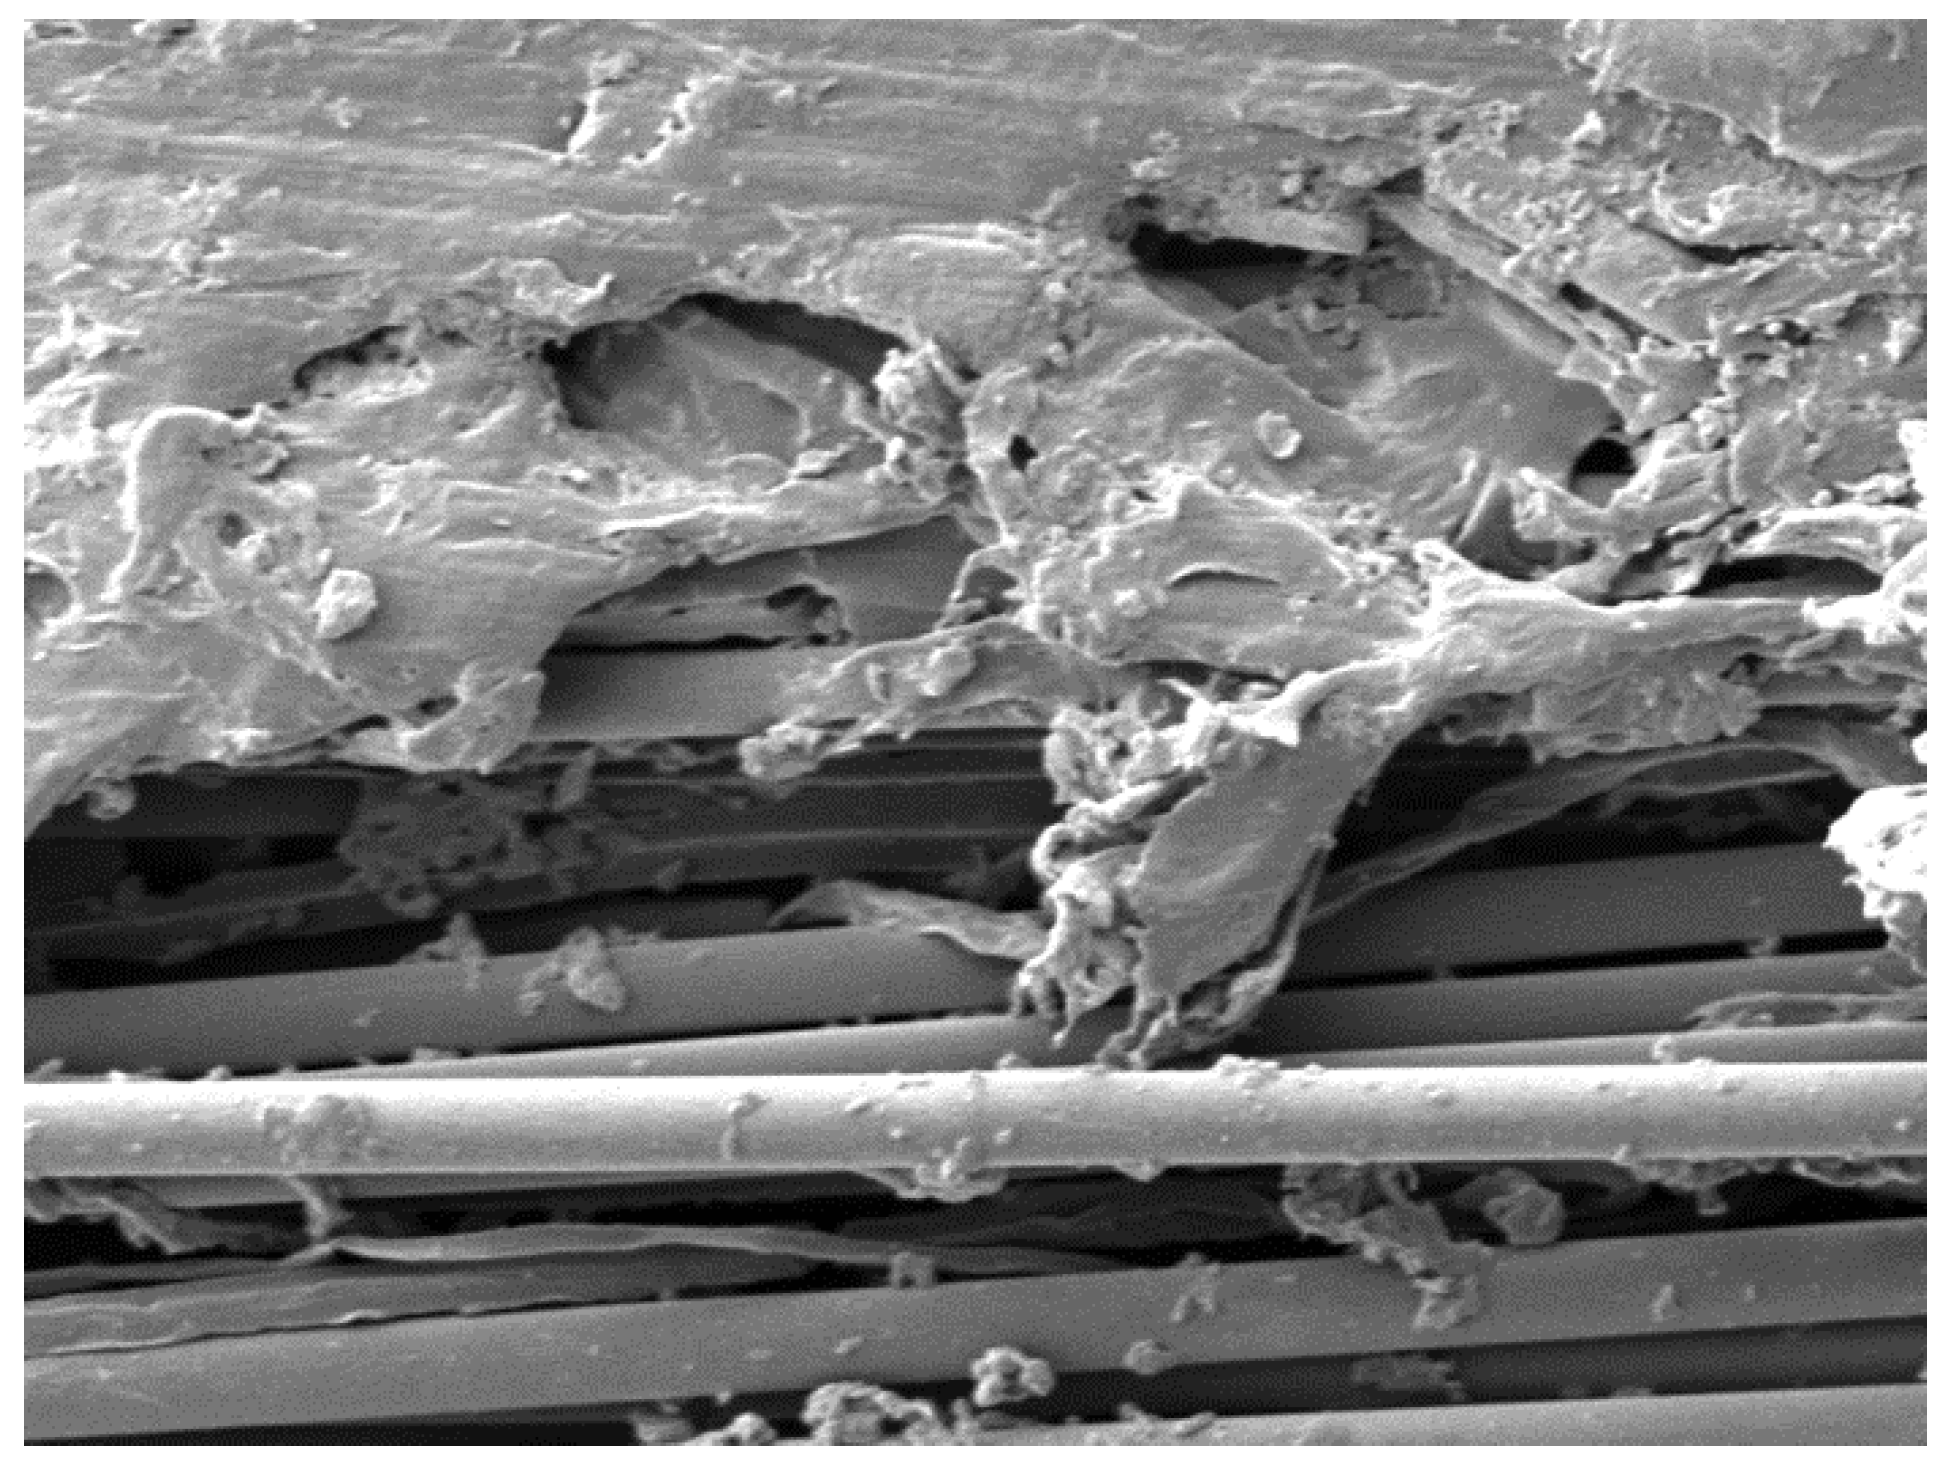
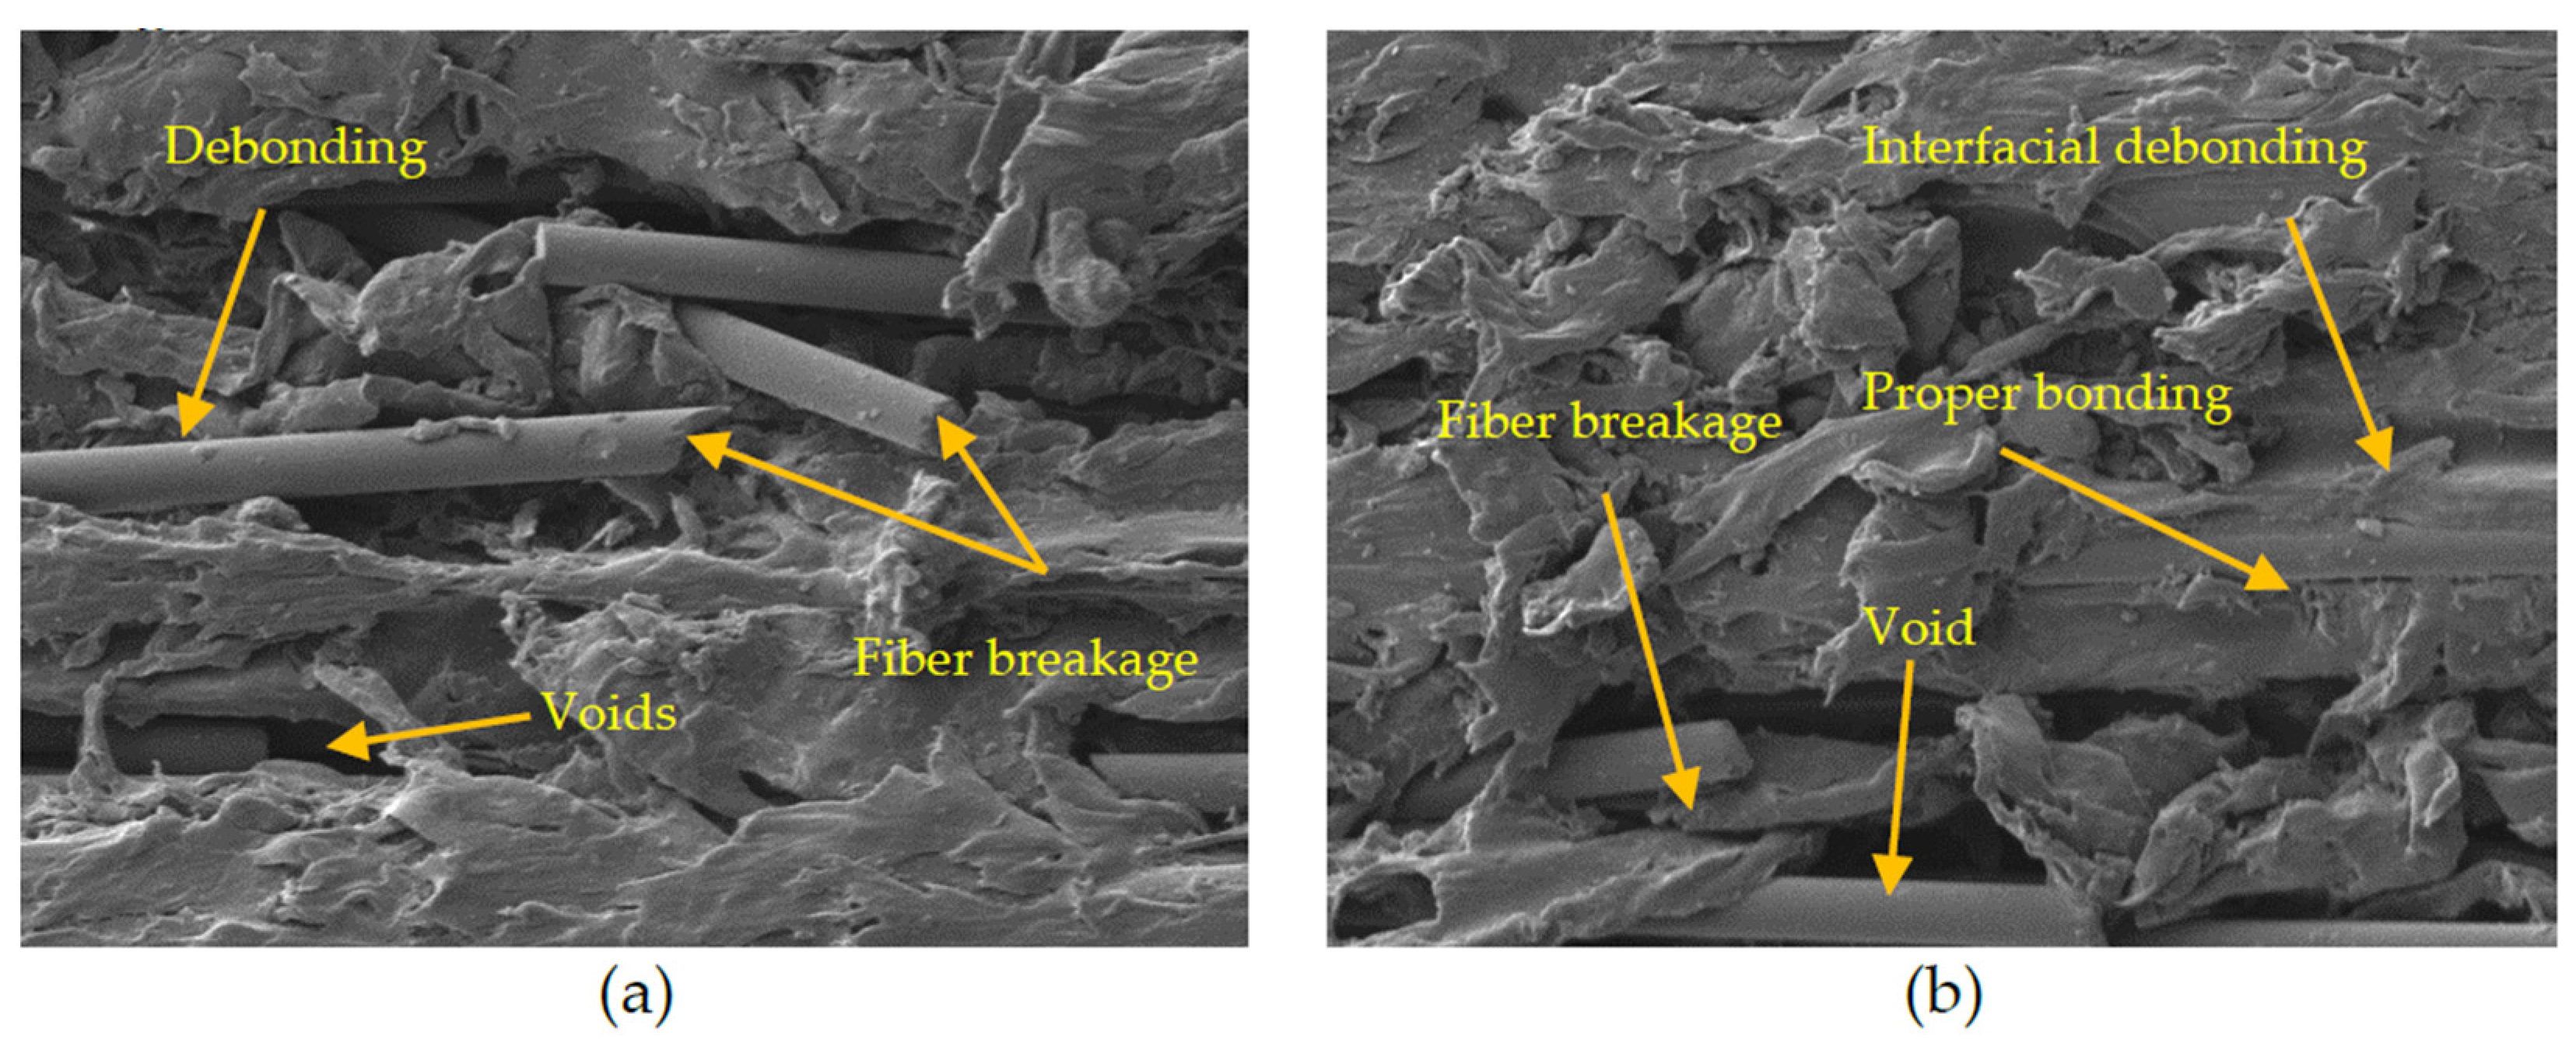
3.6. Morphology of Hybrid Fiber Polypropylene Composite

A micrograph of the composite’s longitudinal cross section is shown to determine the difference in morphological conditions of unidirectional fiber with fiber pretension and without pretension treatment when processed in overmold, as shown in Figure 16. In specimens without pretension, injection pressure does not affect the orientation stability of the UD fibers in the skin layer position. The injection pressure induces the matrix to enter mold experience flow resistance on the sidewalls of the mold and pushes the UD fiber from the fiber core, causing fiber misalignment in the core. In the case of UD fibers that experience pretension, the matrix’s pressure towards the center of the UD fiber can be resisted by the stretched fiber; thus, the orientation of the UD fiber can be maintained both in the skin layer and in the core. The condition of fiber pretension is shown in more detail by SEM in Figure 17. The stretching of the fiber also makes it difficult for the PP matrix to penetrate between fiber gaps; some gaps are not filled with the matrix. The short fiber content in the matrix further complicates this condition. Changes in the orientation of the UD fiber affect its contribution in receiving both impact and flexural loads. The result of flexural and impact testing for specimens without pretension treatment on UD fibers are 56 Mpa for flexural strength and 60.03 kJ/m2 for impact strength.
The condition of the longitudinal section undergoing four-point bending test of the specimen with high and low flexural strength values is shown in Figure 18. The scanning electron microscope depicts several modes of damage such as voids, interfacial debonding, and fiber breakage of the fracture surface of the specimen. All bending specimens experienced permanent deformation but did not fracture due to bending, even though the compression stroke had reached more than 20 mm. Figure 18a provides a view of a specimen with low flexural strength; it can be observed that the damage mechanism is dominated by fiber fracture. The initial crack occurs on the compressive side due to fiber breakage, the matrix fails before the UD carbon fiber, and the crack propagates until it reaches the UD fiber, which tends to approach the tensile side, resulting in interfacial debonding. Some voids also appear in the matrix; low melting temperature in combination with high injection pressure can trigger this condition. Voids can occur during the cooling stage due to (1) the difference in cooling rate between the core and the skin of the specimen; (2) inhibition of matrix consolidation by fibres; and (3) fiber displacement. This condition can be overcome by a high melting temperatures injected at low pressure. With these two factors, the temperature difference of the melt can be minimized, and the melt has a better opportunity to penetrate between the fibres. Temperature is the main factor in the viscosity of a molten matrix. Low temperatures increase the viscosity of the melted matrix, and with high injection pressures, it becomes more difficult to penetrate UD fibres [37]. Defects in the matrix can cause stress concentration and reduce the cross section that should withstand the impact. Composites that contain many voids will be more prone to fracture because the voids become crack propagation paths. This flexural strength condition was obtained from confirmation tests on a combination of melting temperature of 190 °C, the injection pressure of 120 bar, backpressure of 10 bar, and fiber pretension of 20 N. The low melting temperature of plastic and fiber pretension contributed to low flexural strengths of the specimen.
Figure 18b is the morphological condition of the specimen possessing high flexural strength. Matrix damage due to compression occurs on the tensile side. Interfacial debonding is experienced by some UD fibers in the interface area. It shifts the location of the fibers so that they are separated from the matrix. The displacement of the fibers causes the appearance of voids. Even though the UD fiber bond with the matrix was released in the compression area, some UD fibers still maintained a proper bond so that they can resist compression force. This flexural strength was obtained from confirmation tests on a combination of melting temperature of 223 °C, the injection pressure of 140 bar, backpressure of 10.7 bar, and fiber pretension of 65.82 N. The appropriate melting temperature and fiber pretension contributed to high flexural strengths.

4. Conclusions

In this study, the injection overmolding process for producing hybrid fiber polypropylene composite was successfully carried out. From the analysis that has been conducted, several conclusions can be obtained:
  • The injection molding process parameters do not have a significant effect on fiber volume fraction.
  • ANOVA provides a predictive mathematical model that can be used to calculate a response if factor values are determined.
  • Factors that have a significant effect on impact strength are melt temperature and fiber pretension, respectively.
  • The maximum impact strength of 168.03 kJ/m2 can be obtained from a combination of parameters: melt temperature of 230 °C, injection pressure of 100 bar, backpressure of 10 bar, and fiber pretension of 50 N.
  • Sequentially, factors that significantly affect flexural strength are melt temperature, quadratic melt temperature, melt temperature interaction with fiber pretension, and injection pressure interaction with backpressure.
  • The maximum flexural strength value of 71.3 Mpa can be obtained from a combination of parameters: melt temperature of 210 °C, the injection pressure of 120 bar, backpressure of 10 bar, and fiber pretension of 50 N.
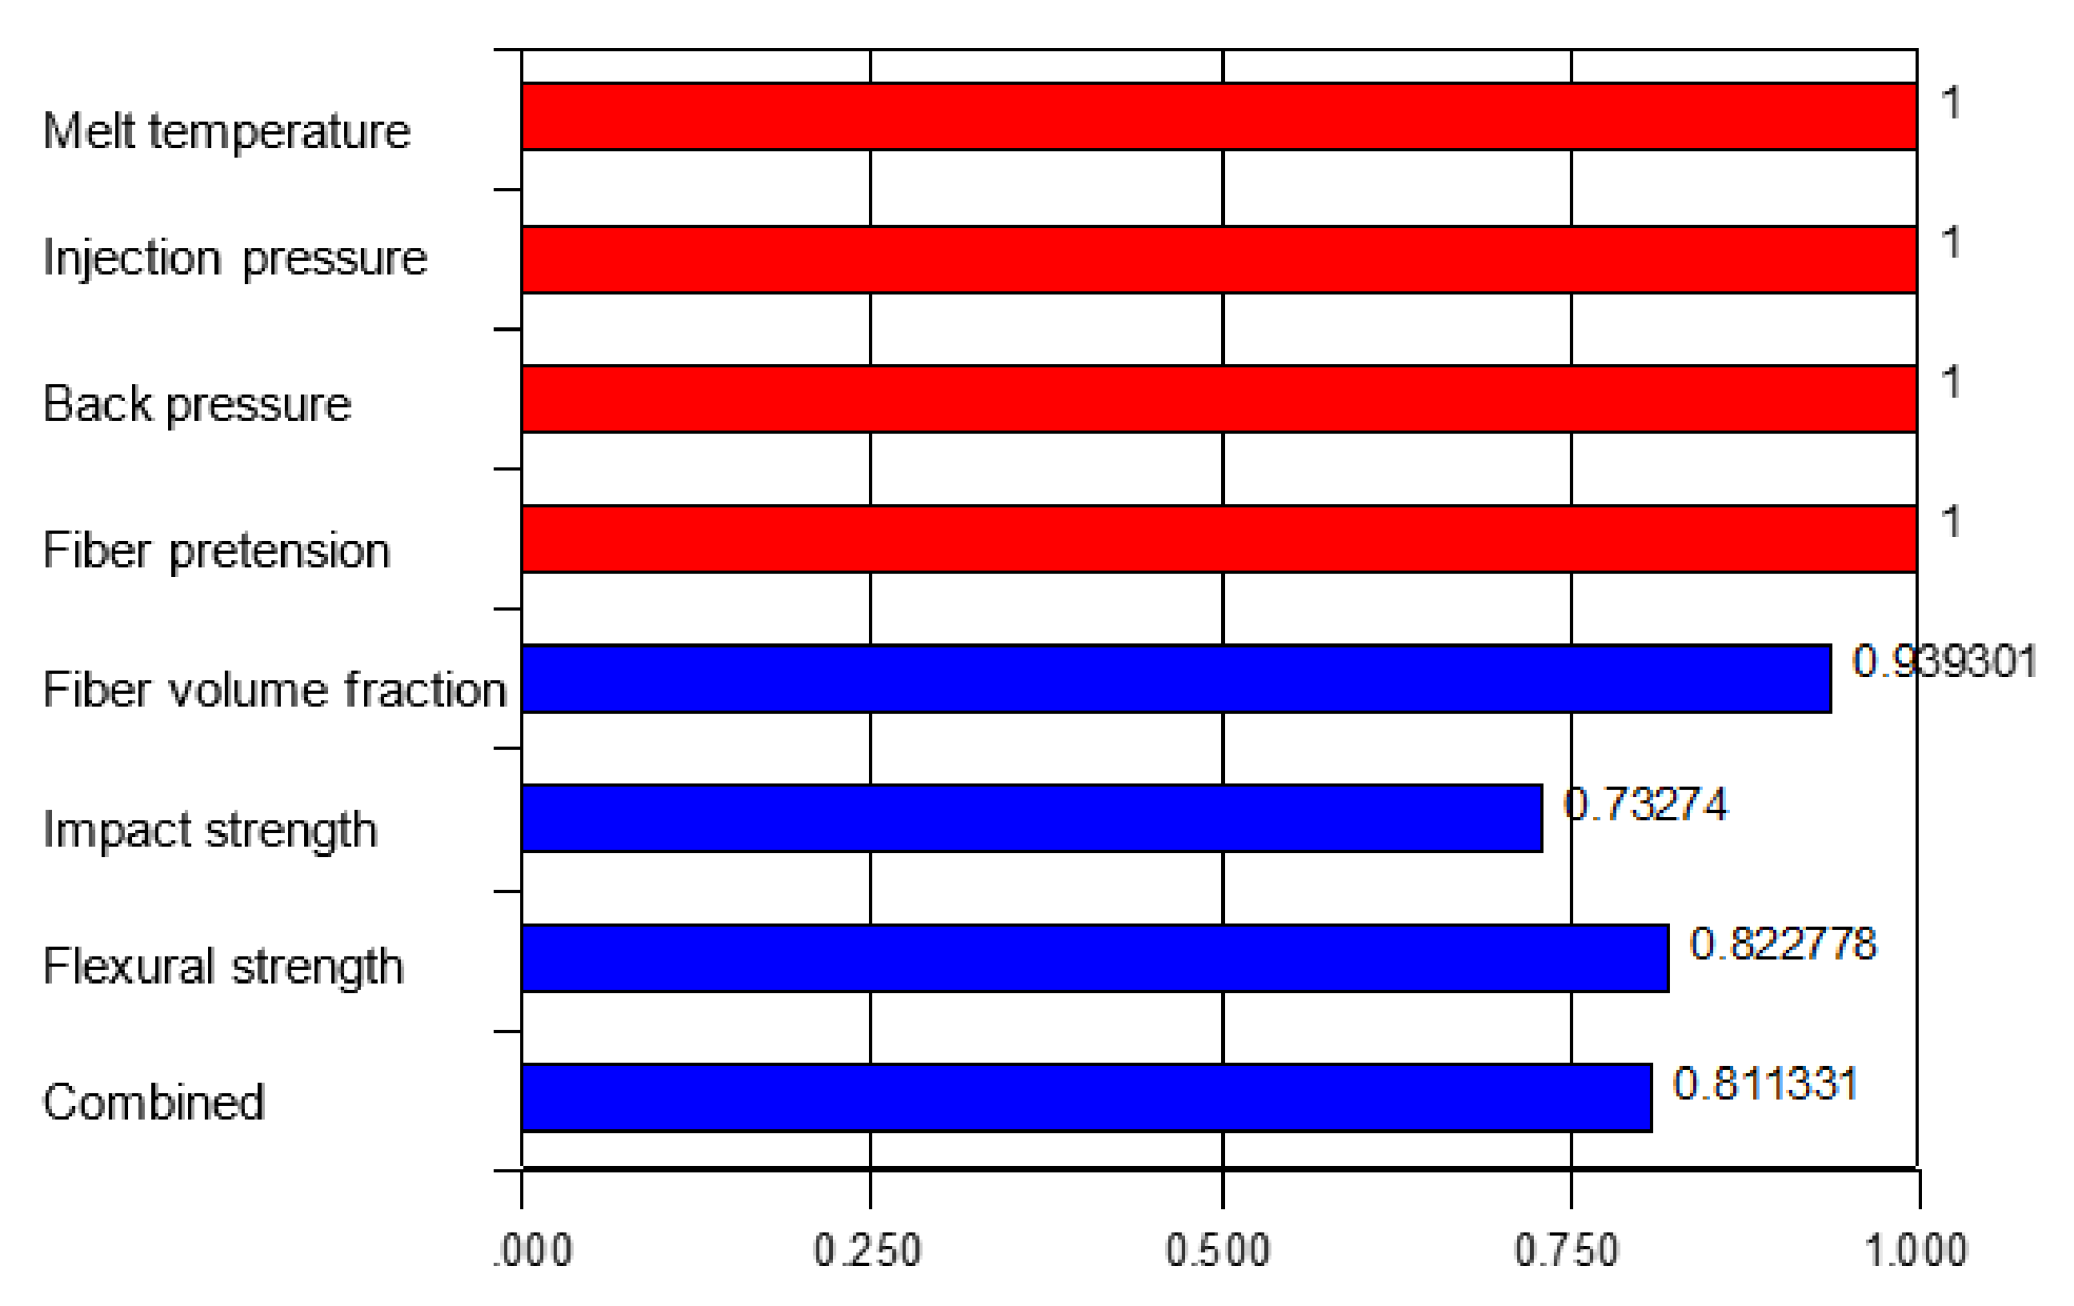
  • In order to optimize the responses simultaneously, individual and combined desirability functions were derived. The overall desirability was 0.81, individual desirability for fiber volume fraction was 0.94, impact strength was 0.73, and flexural strength was 0.82.
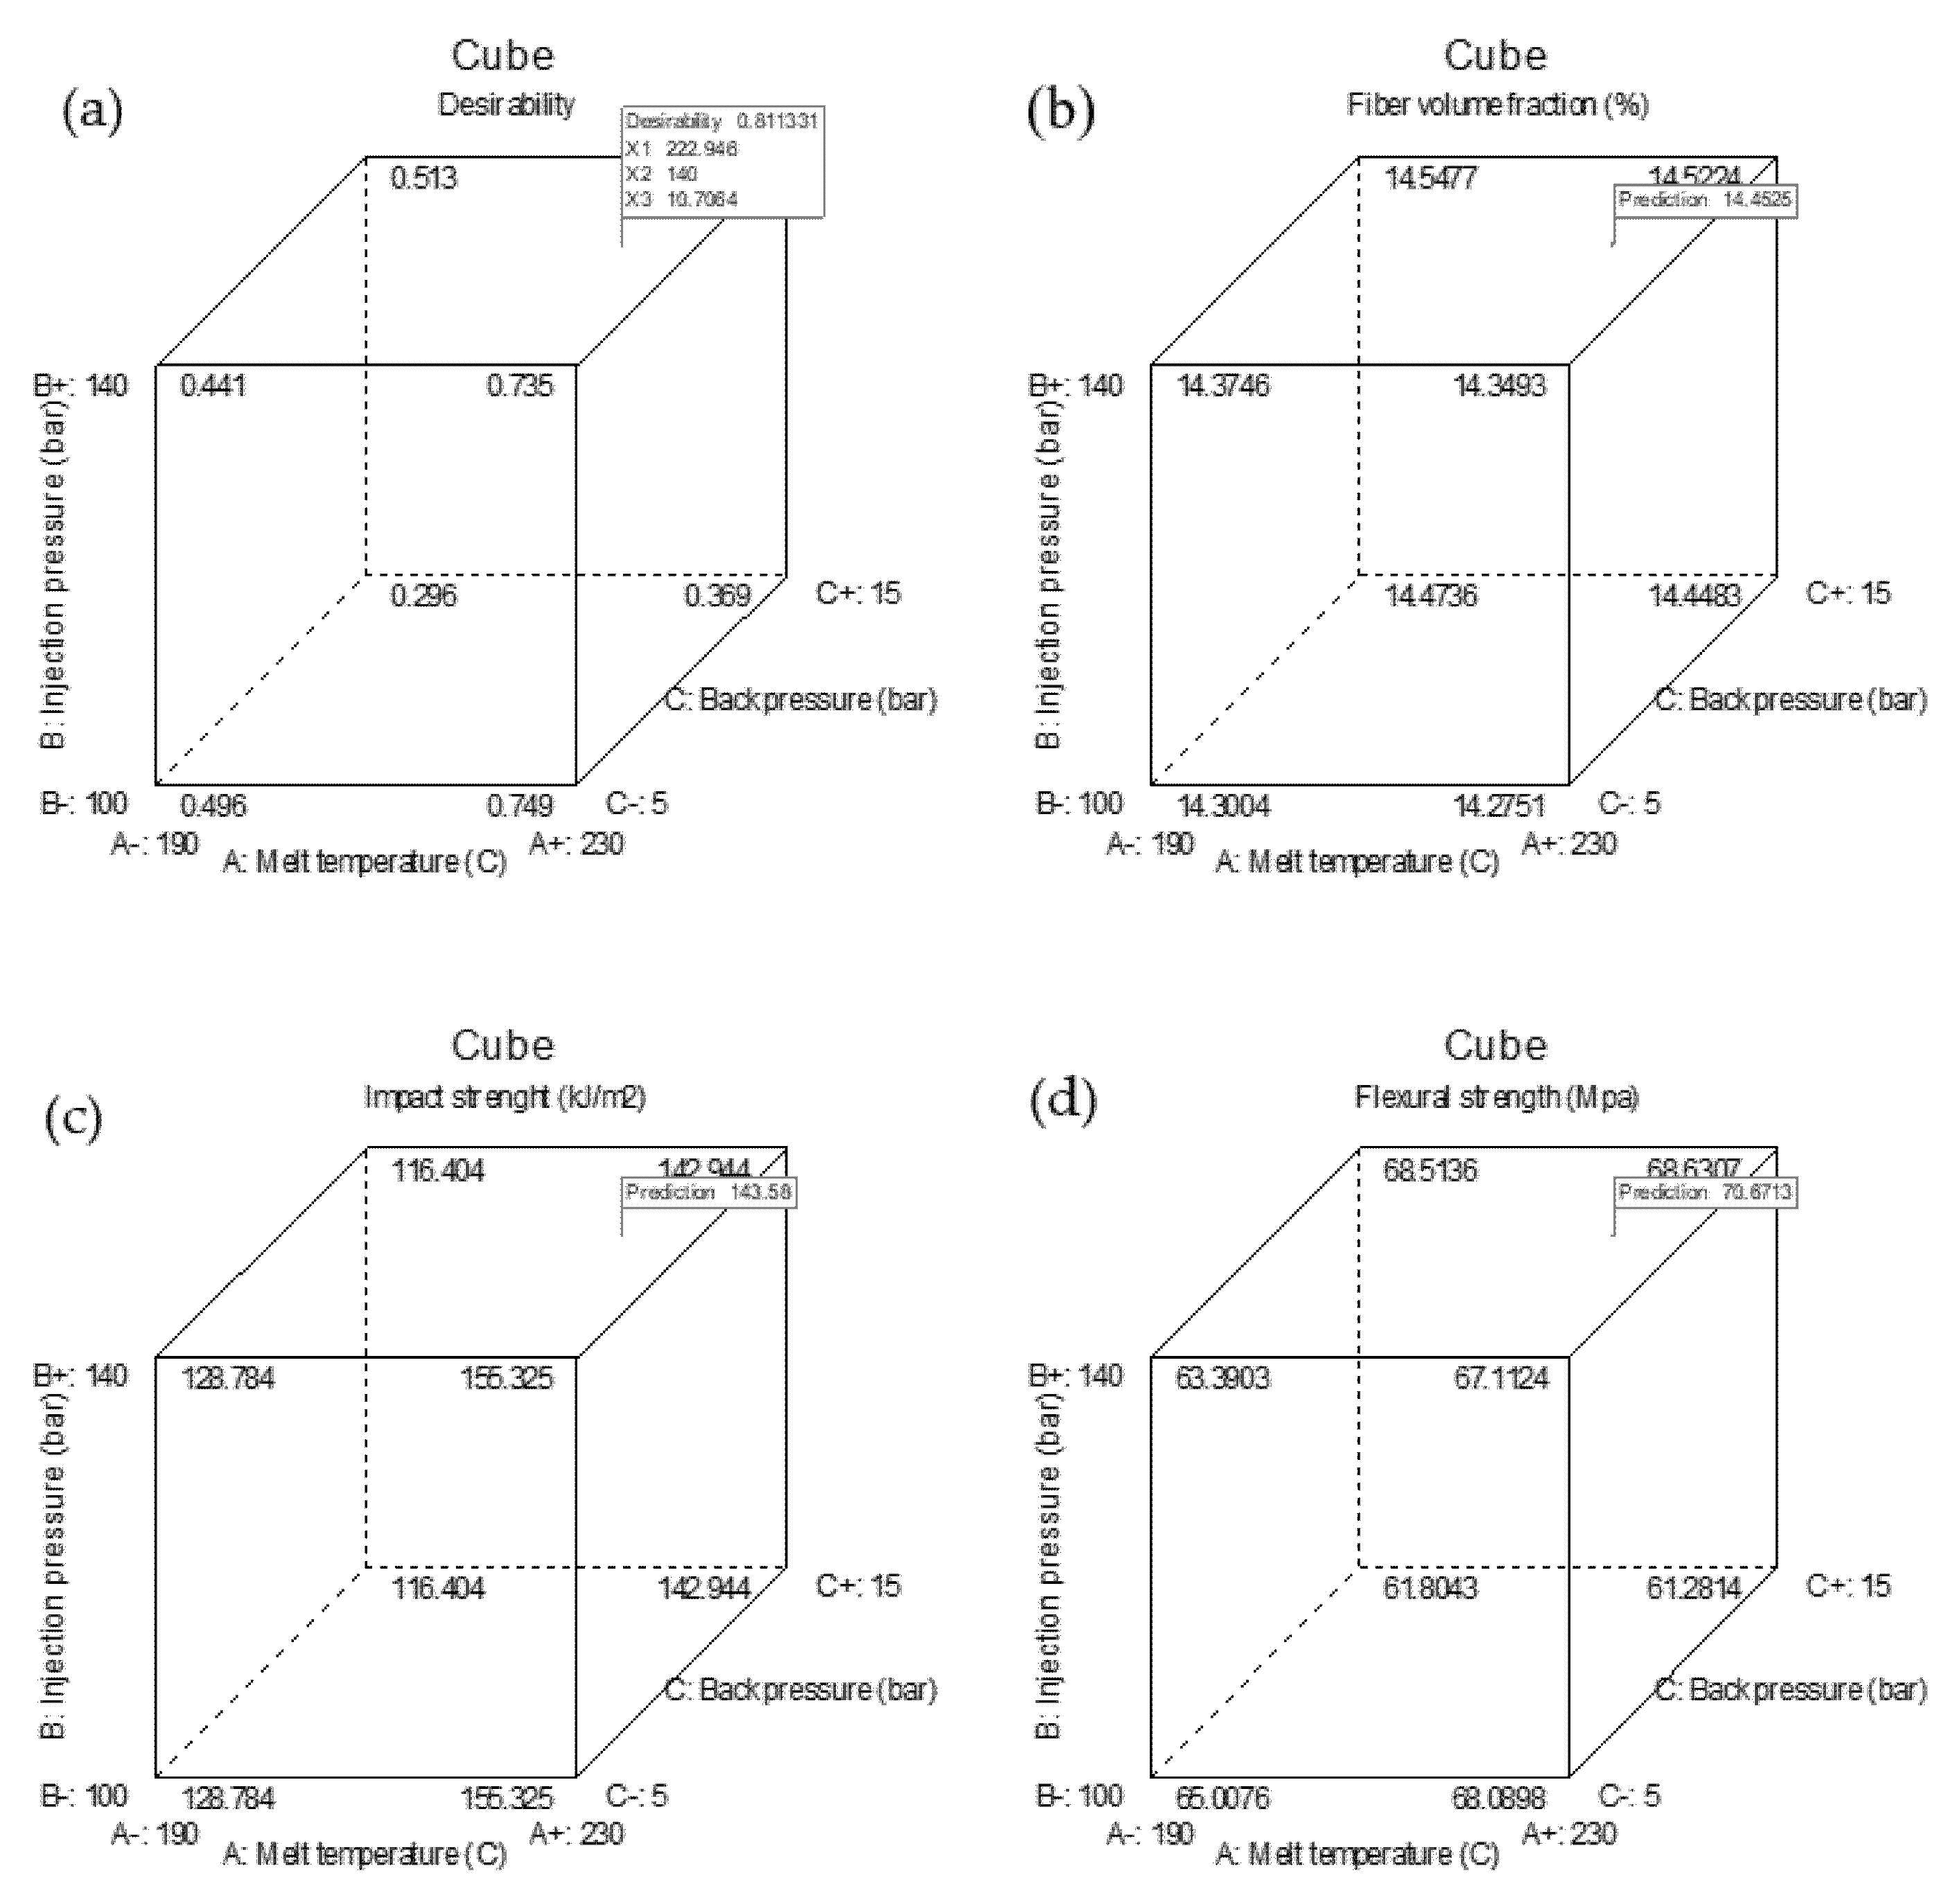
  • Finally, for optimizing multiple responses, the recommended factors are as follows: melt temperature of 223 °C, the injection pressure of 140 bar, backpressure of 10.7 bar, and fibre pretension of 65.82 N. The combination of these factors resulted in an optimum fibre volume fraction of 14.45%, impact strength of 143.58 kJ/m2, and flexural strength of 70.67 Mpa.

Author Contributions

Experimental design, C.B. and H.S.B.R.; methodology, C.B.; performed the experiment, C.B.; validation, H.S.B.R. and G.N.; resources, H.S.B.R. and G.N.; data curation, H.S.B.R.; writing—original draft preparation, C.B.; writing—review and editing, C.B., H.S.B.R. and G.N.; visualization, C.B.; supervision, H.S.B.R. and G.N.; project administration, G.N.; funding acquisition, H.S.B.R. All authors have read and agreed to the published version of the manuscript.

Funding

This research received no external funding.

Institutional Review Board Statement

Not applicable.

Informed Consent Statement

Not applicable.

Acknowledgments

The authors would like to acknowledge the Department Mechanical and Industrial Engineering, Universitas Gadjah Mada Yogyakarta, and Department Mechanical Engineering Universitas Muhammadiyah Yogyakarta for supporting the materials and equipment used in the experiment.

Conflicts of Interest

The authors declare no conflict of interest.

References

  1. Wan, Y.; Takahashi, J. Tensile properties and aspect ratio simulation of transversely isotropic discontinuous carbon fiber reinforced thermoplastics. Compos. Sci. Technol. 2016, 137, 167–176. [Google Scholar] [CrossRef]
  2. Friedrich, K.; Almajid, A.A. Manufacturing Aspects of Advanced Polymer Composites for Automotive Applications. Appl. Compos. Mater. 2013, 20, 107–128. [Google Scholar] [CrossRef]
  3. Jiang, B.; Fu, L.; Zhang, M.; Weng, C. Effect of thermal gradient on interfacial behavior of hybrid fiber reinforced polypropylene composites fabricated by injection overmolding technique. Polym. Compos. 2020, 41, 4064–4073. [Google Scholar] [CrossRef]
  4. Akkerman, R.; Bouwman, M.; Wijskamp, S. Analysis of the thermoplastic composite overmolding process: Interface strength. Front. Mater. 2020, 7, 27. [Google Scholar] [CrossRef]
  5. Andrzejewski, J.; Przyszczypkowski, P.; Szostak, M. Development and characterization of poly (ethylene terephthalate) based injection molded self-reinforced composites. Direct reinforcement by overmolding the composite inserts. Mater. Des. 2018, 153, 273–286. [Google Scholar] [CrossRef]
  6. Gupta, S.K.; Saini, S.K.; Spranklin, B.W. Incorporating Manufacturability Considerations during Design of Injection Molded Multi-Material Objects. Mech. Eng. 2005, 37, 207–231. [Google Scholar]
  7. Huang, P.W.; Peng, H.-S.; Hwang, S.-J.; Huang, C.-T. The Low Breaking Fiber Mechanism and Its Effect on the Behavior of the Melt Flow of Injection Molded Ultra-Long Glass Fiber Reinforced Polypropylene Composites. Polymers 2021, 13, 2492. [Google Scholar] [CrossRef]
  8. Rosato, D.V. Plastics Processing Data Handbook, 2nd ed.; Chapman & Hall: London, UK, 1997. [Google Scholar]
  9. Rohde, M.; Ebel, A. Influence of Processing Parameters on the Fiber Length and Impact Properties of Injection Molded Long Glass Fiber Reinforced Polypropylene. Intern. Polym. Process. 2011, 26, 292–303. [Google Scholar] [CrossRef]
  10. Garnich, M.; Karami, G. Localized Fiber Waviness and Implications for Failure in Unidirectional Composites. J. Compos. Mater. 2005, 39, 1225–1244. [Google Scholar] [CrossRef]
  11. Allison, B.D.; Evans, J.L. Effect of fiber waviness on the bending behavior of S-glass/epoxy composites. Mater. Des. 2012, 36, 316–322. [Google Scholar] [CrossRef]
  12. Mertiny, P.; Ellyin, F. Influence of the filament winding tension on physical and mechanical properties of reinforced composites. Compos. Part A 2002, 33, 1615–1622. [Google Scholar] [CrossRef]
  13. Hörrmann, S.; Adumitroaie, A.; Viechtbauer, C. The effect of fiber waviness on the fatigue life of CFRP materials. Int. J. Fatigue J. 2016, 90, 139–147. [Google Scholar] [CrossRef]
  14. Krishnamurthy, S. Prestressed Advanced Fibre Reinforced Composites: Fabrication and Mechanical Performance. Ph.D. Thesis, Cranfield University, Cranfield, UK, 2006. [Google Scholar]
  15. Moallemzadeh, A.R.; Sabet, S.A.R.; Abedini, H. Preloaded composite panels under high velocity impact. Int. J. Impact Eng. 2018, 114, 153–159. [Google Scholar] [CrossRef]
  16. Pickett, A.K.; Fouinneteau, M.R.C.; Middendorf, P. Test and Modelling of Impact on Pre-Loaded Composite Panels. Appl. Compos. Mater. 2009, 16, 225–244. [Google Scholar] [CrossRef]
  17. Whittingham, B.; Marshall, I.H.; Mitrevski, T.; Jones, R. The response of composite structures with pre-stress subject to low velocity impact damage. Compos. Struct. 2004, 66, 685–698. [Google Scholar] [CrossRef]
  18. Schlichting, L.H.; de Andrada, M.A.C.; Vieira, L.C.C. Composite resin reinforced with pre-tensioned glass fibers. Influence of prestressing on flexural properties. Dent. Mater. 2010, 26, 118–125. [Google Scholar] [CrossRef]
  19. Mostafa, N.H.; Ismarrubie, Z.N.; Sapuan, S.M. Fibre prestressed polymer-matrix composites: A review. J. Compos. Mater. 2017, 51, 39–66. [Google Scholar] [CrossRef]
  20. Schuite, K.; Marissen, R. Influence of artificial pre-stressing during curing of CFRP laminates on interfibre transverse cracking. Compos. Sci. Technol. 1992, 44, 361–367. [Google Scholar] [CrossRef]
  21. Tuttle, M.E.; Koehler, R.; Keren, D. Controlling Thermal Stresses in Composite by Means of Fiber Prestress. J. Compos. Mater. 1995, 30, 486–502. [Google Scholar] [CrossRef]
  22. Motahhari, S.; Cameron, J. Measurement of Micro-Residual Stresses in Fiber-Prestressed Composite. J. Reinf. Plast. Compos. 1997, 16, 1129–1136. [Google Scholar] [CrossRef]
  23. Mostafa, N.H.; Ismarrubie, Z.N.; Sapuan, S.M.; Sultan, M.T.H. Fibre prestressed composites: Theoretical and numerical modelling of unidirectional and plain-weave fibre reinforcement forms. Compos. Struct. 2017, 159, 410–423. [Google Scholar] [CrossRef]
  24. Sumitomo, C. Cosmoplene® AW564 Technical Data Sheet; The Polyolefin Company: Singapore, 2019. [Google Scholar]
  25. Torayca. T700S Data Sheet No. CFA-005; Toray Carbon Fibers: Santa Ana, CA, USA, 2018. [Google Scholar]
  26. Budiyantoro, C.; Rochardjo, H.S.B.; Nugroho, G. Design, Manufacture, and Performance Testing of Extrusion–Pultrusion Machine for Fiber-Reinforced Thermoplastic Pellet Production. Machines 2021, 9, 42. [Google Scholar] [CrossRef]
  27. Budiyantoro, C.; Rochardjo, H.S.B.; Nugroho, G. Effects of Processing Variables of Extrusion—Pultrusion Method on the Impregnation Quality of Thermoplastic Composite Filaments. Polymers 2020, 12, 2833. [Google Scholar] [CrossRef] [PubMed]
  28. Hassan, A.K.F.; Abdullah, O.A. New methodology for prestressing fiber composites. Univers. J. Mech. Eng. 2015, 3, 252–261. [Google Scholar] [CrossRef] [Green Version]
  29. Wong, K.H.; Mohammed, D.S.; Pickering, S.J.; Brooks, R. Effect of coupling agents on reinforcing potential of recycled carbon fibre for polypropylene composite. Compos. Sci. Technol. 2012, 72, 835–844. [Google Scholar] [CrossRef]
  30. Standard, B. ISO 178—Plastic, Determination of Flexural Properties; BSI: London, UK, 2005. [Google Scholar]
  31. Czél, G.; Jalalvand, M.; Wisnom, M.R. Hybrid specimens eliminating stress concentrations in tensile and compressive testing of unidirectional composites. Compos. Part A 2016, 16, 436–447. [Google Scholar] [CrossRef] [Green Version]
  32. Meng, M.; Le, H.; Jahir, R.; Grove, S. The effects of unequal compressive/tensile moduli of composites. Compos. Struct. 2015, 126, 207–215. [Google Scholar] [CrossRef] [Green Version]
  33. ISO. ISO 179—Determination of Charpy Impact Properties; ISO: Brussels, Belgium, 2013. [Google Scholar]
  34. Shokri, P.; Bhatnagar, N. Effect of the Post-Filling Stage on Fiber Orientation at the Mid-Plane in Injection Molding of Reinforced Thermoplastics. Phys. Procedia 2012, 25, 79–85. [Google Scholar] [CrossRef] [Green Version]
  35. Dupuis, A.; Pesce, J.; Ferreira, P.; Gilles, R. Fiber Orientation and Concentration in an Injection-Molded Ethylene-Propylene Copolymer Reinforced by Hemp. Polymers 2020, 12, 2771. [Google Scholar] [CrossRef]
  36. Tzeng, C.; Yang, Y.; Lin, Y. A study of optimization of injection molding process parameters for SGF and PTFE reinforced PC composites using neural network and response surface methodology. Int. J. Adv. Manuf. Technol. 2012, 63, 691–704. [Google Scholar] [CrossRef]
  37. Ginghtong, T.; Nakpathomkun, N.; Pechyen, C. Effect of injection parameters on mechanical and physical properties of super ultra-thin wall propylene packaging by Taguchi method. Results Phys. 2018, 9, 987–995. [Google Scholar] [CrossRef]
Figure 1. Schematic illustration of the fiber pretension condition.
Jmmp 05 00132 g001
Figure 2. Production steps of hybrid fiber overmolded composite.
Jmmp 05 00132 g002
Figure 3. Overmolding device.
Jmmp 05 00132 g003
Figure 4. The four bending test setups with an asymmetric UD fiber position.
Jmmp 05 00132 g004
Figure 5. Impact test configuration.
Jmmp 05 00132 g005
Figure 6. Overmolding product.
Jmmp 05 00132 g006
Figure 7. Fiber orientation tensor.
Jmmp 05 00132 g007
Figure 8. Experimental results: (a) fiber volume fraction; (b) impact strenght; and (c) flexural strength.
Jmmp 05 00132 g008aJmmp 05 00132 g008b
Figure 9. Effect of all factors on fiber volume fraction: (A) melt temperature; (B) injection pressure; (C) backpressure; and (D) fiber pretension.
Jmmp 05 00132 g009
Figure 10. Diagnostic plots for impact strength response: (a) normal probability; (b) residuals vs run.
Jmmp 05 00132 g010
Figure 11. Influence of individual factor on the impact strength: (A) melt temperature; (B) injection pressure; (C) backpressure; and (D) fiber pretension.
Jmmp 05 00132 g011
Figure 12. Diagnostic plots for flexural strength response: (a) normal probability; (b) residuals vs. run.
Jmmp 05 00132 g012
Figure 13. Influence of individual factor on the flexural strength: (A) melt temperature; (B) injection pressure; (C) backpressure; and (D) fiber pretension.
Jmmp 05 00132 g013aJmmp 05 00132 g013b
Figure 14. Desirability function.
Jmmp 05 00132 g014
Figure 15. Optimized responses prediction: (a) desirability; (b) fiber volume fraction; (c) impact strength; and (d) flexural strength.
Jmmp 05 00132 g015
Figure 16. Longitudinal cross section of (a) non-pre tensioned fiber at skin layer; (b) non-pre tensioned fiber at the core; (c) pre-tensioned fiber at skin layer; and (d) pre-tensioned fiber at the core.
Jmmp 05 00132 g016
Figure 17. Micrograph of pretensioned fiber composite.
Jmmp 05 00132 g017
Figure 18. Micrograph of the longitudinal cross-section after bending: (a) low flexural strength; (b) high flexural strength.
Jmmp 05 00132 g018
Table 1. Material properties.
MaterialPropertiesValues
Carbon fiber (T700SC 12K)Filament diameter (µm)7
Density (g/cm3)1.8
Tensile strength (Mpa)4900
Cosmoplene AW564-PPDensity (g/cm3)0.9
Cylinder temperature (°C)190–230
Tensile strength at yield (Mpa)27.5
Tensile strength at break (Mpa)23
Melt Flow Index (g/10 min)10
Liquid nitrogenBoiling point (°C)−196
Density, Liquid @ BP, 1 atm (Kg/m3)808.5
Specific Gravity, Liquid (water = 1) @ 20 °C, 1 atm0.808
Table 2. Non-variable parameter setting.
ParametersValuesUnit
Charging time3.5s
Shot size83mm
Injection speed80mm/s
Filling time0.6s
Velocity Transfer Pressure35mm
Packing pressure70bar
Screw speed40rpm
Packing time5s
Cooling temperature40°C
Cooling time15s
Table 3. Processing factors and levels.
FactorsCodingActual Level
Low (−1)Middle (0)High (+1)
Melting temperature (°C)A190210230
Injection pressure (bar)B100120140
Backpressure (bar)C51015
Fiber Pre-tension (N)D205080
Table 4. Experimental design.
RunCodeActual
ABCDABCD
111002301401050
200002101201050
300002101201050
4010−12101401020
5−10011901201080
6001−12101201520
70−1−10210100550
810102301201550
9−100−11901201020
1000002101201050
11100−12301201020
12−11001901401050
1310−10230120550
1400−11210120580
1501012101401080
1601102101401550
171−1002301001050
180−10−12101001020
1900112101201580
2001−10210140550
21−1−1001901001050
220−1102101001550
2300−1−1210120520
24−10−10190120550
25−10101901201550
260−1012101001080
2710012301201080
Table 5. ANOVA for fiber volume fraction.
SourceSum of SquaresdfMean SquareF-Valuep-Value
Prob > F
Note
Model0.2140.0530.600.6652not significant
A-Melt temperature1.919 × 10−311.919 × 10⁻³ 0.0220.8845
B-Injection pressure0.01710.0170.190.6707
C-Back pressure0.09010.0901.010.3253
D-Fiber pretension0.1110.111.190.2874
Residual1.95220.089
Lack of Fit1.92200.0965.780.1575not significant
Pure Error0.03320.017
Cor Total2.1726
Table 6. Initial ANOVA for impact strength.
SourceSum of SquaresdfMean SquareF-Valuep-Value
Prob > F
Note
Model4796.9041199.233.590.0212significant
A-Melt temperature2113.2512113.256.330.0197significant
B-Injection pressure0.1910.195.541 × 10−40.9814
C-Back pressure459.811459.811.380.2531
D-Fiber pretension2223.6612223.666.660.0171significant
Residual7345.4522333.88
Lack of Fit5318.9220265.950.260.9604not significant
Pure Error2026.5321013.27
Cor Total12,142.3526
Pred R-Squared0.1429
Adj R-Squared0.2851
Adeq Precision6.838
Table 7. ANOVA modified term for impact strength.
SourceSum of SquaresdfMean SquareF-Valuep-Value
Prob > F
Note
Model4796.7231598.915.010.0081significant
A-Melt temperature2113.2512113.256.620.0170significant
C-Back pressure459.811459.811.440.2424
D-Fiber pretension2223.6612223.666.960.0147significant
Residual7345.6323319.38
Lack of Fit5319.1021253.290.250.9663not significant
Pure Error2026.5321013.27
Cor Total12,142.3526
Pred R-Squared0.2190
Adj R-Squared0.3161
Adeq Precision7.816
Table 8. ANOVA for flexural strength.
SourceSum of SquaresdfMean SquareF-Valuep-Value
Prob > F
Note
Model194.271413.884.090.0096significant
A-Melt temperature48.52148.5214.310.0026significant
B-Injection pressure10.09110.092.980.1102
C-Back pressure0.4310.430.130.7277
D-Fiber pretension0.03910.0390.0120.9158
AB0.1010.100.0300.8649
AC3.2513.250.960.3469
AD21.09121.096.220.0282significant
BC17.33117.335.110.0431significant
BD3.8313.831.130.3086
CD0.7710.770.230.6416
A248.32148.3214.250.0026significant
B21.9911.990.590.4588
C28.5018.502.510.1393
D261.19161.1918.050.0011significant
Residual40.68123.39
Lack of Fit29.59102.960.530.7963not significant
Pure Error11.0925.54
Cor Total234.9526
Table 9. Determination of desirability functions.
Factors or ResponsesGoalLower LimitUpper LimitLower WeightUpper WeightImportanceTarget
Melt temperatureIn range190230113
Injection pressureIn range100140113
BackpressureIn range515113
Fiber pretensionIn range2080113
Fiber volume fractionMaximize13.7214.8711314.5
Impact strengthMaximize98.56182.717113150
Flexural strengthMaximize59.8673.3211373
Publisher’s Note: MDPI stays neutral with regard to jurisdictional claims in published maps and institutional affiliations.

