1. Introduction
The ease of replication capabilities makes micro-injection molding process the most preferred manufacturing technology in medical, surgical, automotive, electronics, and aerospace industries [
1]. The development of new miniature products is highly dependent on manufacturing systems that can produce micro-components reliably and economically in large quantities with the desired precision. The precision and quality of micro-molded parts are mainly subjected to their geometrical and functional requirements. Different applications aim for different quality criteria of micro-molded parts and these criteria usually correspond to the ability to completely fill the micro-size cavities, which is controlled by processing conditions.
There have been several studies about application-based optimization of micro-injection molding parameters with respect to different quality criteria, as summarized in [
2]. In particular, micro-fluidics are the most researched application with different desirable quality aspects: filling quality (part mass) and process variability (standard deviation) [
2], filled volume fraction of microfilters [
3], filling quality of micro-featured channels [
4], width and depth of micro-channel [
5] and height of micro-channels [
6]. The effect of processing conditions on the quality of micro gears was studied with gear-outside-diameter and tooth-thickness as the quality parameters [
7]. Shrinkage is also one of the most important quality aspects for micro-injection molded components and, therefore, it has been studied by various researchers. Annicchiarico et al. [
8,
9] implemented a statistical methodology to attempt optimization for both shrinkage and part mass in micro-injection molding. Shrinkage in fiber-reinforced thin-walled molded parts was examined in [
10]. Reportedly, there is a lack of studies or information in the literature related to the effect of processing conditions on the presence of voids or pores in micro-injection molded components.
Nevertheless, all the quality parameters are required to be precisely measured and analyzed by using sophisticated characterization instruments to perform accurate correlation with the process settings. Traditionally, destructive methods are used to measure the quality parameters of micro-injection molded parts, which is because the parts are usually of large sizes compared to their micro-features. Hence, a subsampling of the molded parts is often required in order to characterize their micro-features. For example, in case of microfluidics, parts are cut to achieve high resolution to measure the channels. Over the years, X-ray computed tomography (CT) [
11] has become an established technique for non-destructive quality control in industrial environments [
12]. Thanks to the recent developments [
13], it is also becoming very popular for dimensional metrology applications due to its strategic advantages such as the capability of performing measurements on a component’s surface as well as on volume, thus enabling inspection of otherwise non-accessible internal features. Reportedly, X-ray CT is being used for different quality aspects of micro-injection molded parts in various studies [
14]. It was used for dimensional verification of industrial micro-injection molded components as reported in [
15]. Furthermore, X-ray CT can also be used in combination with data from other sensors/techniques for micro-molded parts where both micro- and macro-measurements are required [
16]. With regard to molded fiber composite parts, CT provides the fiber characteristics such as fiber distribution and their orientation in flow and transverse directions [
10,
17].
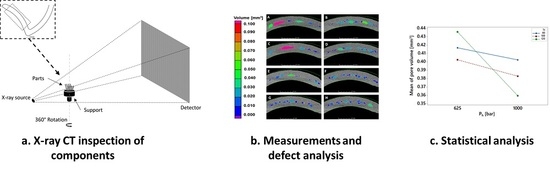
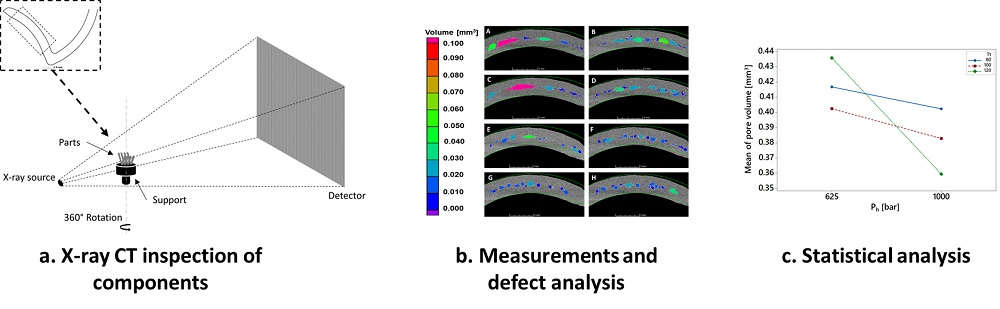
It is evident now that the various studies correspond to specific geometrical features and shapes. With ever-increasing demands of miniaturization, complex geometrical features are being introduced in micro-parts and, hence, there is a requirement to develop strong knowledge about the specific quality criteria corresponding to the specific molding geometries. In addition, accurate measurements of quality parameters are also very critical. Therefore, the current work aims to optimize the micro-injection molding of a component with a new V-shaped geometry by measuring the parts with the use of X-ray CT. A full-factorial design of the experiment plan is used to study the effect of processing parameters on external and internal quality of the part as represented by volumetric shrinkage of the manufactured part and the internal pores, respectively. A statistical approach is employed to identify the significant factors.
2. Materials and Methods
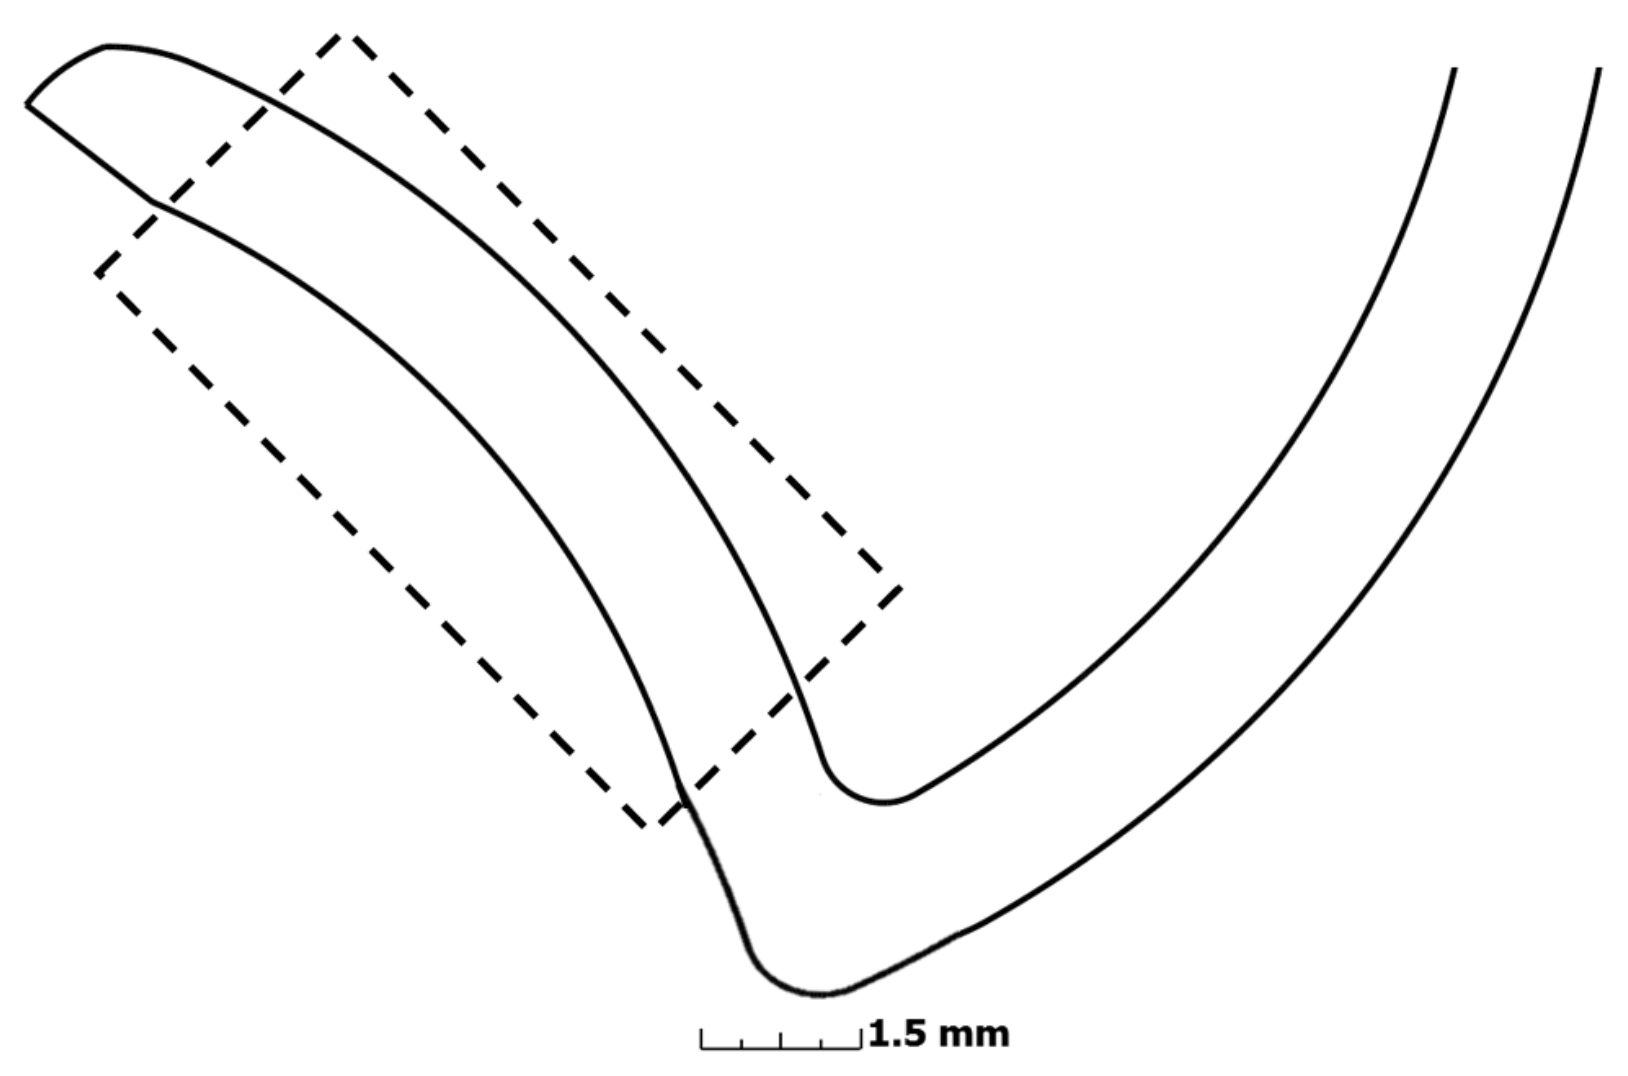
A micro-component with a V-shaped geometry is considered for this study since this type of geometrical feature is present in several medical applications, especially where hinging function is required. Presence of internal voids and pores is reported in many products with this type of geometry, which is the motivation behind this study. As shown in
Figure 1 the part consists of two moving leg-like features joined at the cornerd to allow flexible movement of the legs. The component also includes several micro-scale features; however, the exact geometrical details and dimensions are omitted for confidentiality reasons. The aspect ratio in the perpendicular direction to cross section plane (shown in
Figure 1) is of the 1/10th order of magnitude as compared to the lateral dimension.
The material used for manufacturing is polyoxymethylene (POM). POM possesses balanced combinations of the properties required for engineering plastics, in addition to ease of molding throughout the range of conditions generally employed for polyacetal resins. Furthermore, they combine low friction and high wear resistance with high stiffness and mechanical strength over a broad temperature range; the main physical properties of the material are listed in
Table 1.
2.1. Design of Experiments
Design of experiments (DOE) is a systematic method to determine the relationship between factors affecting a process and the output of that process. In other words, it helps in identifying the critical factors affecting the desired output, thus enables optimization of the entire process. Based on the material recommendations and simulations, the parameters selected for the investigation are: melt temperature (
), mold/tool temperature (
), injection speed (
), and packing pressure (
). Two levels of melt temperature, injection speed, and packing pressure each, and three levels of mold temperature have been chosen. The values of the DOE parameters were chosen so that they cover a wide range of variation for each one of the selected process parameters (see
Table 2). The velocity/pressure switch-over point was set at 90% of the maximum injection pressure. Constant process parameters were back pressure, cooling time, and metering speed. The experiments were performed on a Wittmann Battenfeld, MicroPower 15 micro-injection molding machine.
A four-factor full-factorial design consisting of total 24 molding experiments was created. Ten test specimens were molded for every set of process conditions. The first five test specimens were discarded to allow the process to reach a steady state when changing from one experiment to another. For identification, group IDs were assigned with respect to melt temperature, injection speed, and packing pressure, and the mold temperature is specified separately along with the group ID as specified in
Table 3. X-ray CT was used for part measurements and analysis, which is explained in the next section.
2.2. Characterization with X-ray CT
A metrological micro CT system (Nikon Metrology, MCT 225) was used for acquiring CT data for the molded parts. The metrological performances of the CT system were evaluated using specific procedures and a fiber-based calibrated object [
18,
19]. As shown in
Figure 2, four parts are placed on a support to scan them at one time; the X-ray projections were acquired for a complete rotation cycle and subsequently reconstructed into a 3D volumetric dataset. Physical markings are used for identification as all parts look identical in appearance. The employed scanning parameters are provided in
Table 4. For each process settings, two repetitions were performed.
The acquired CT projections are reconstructed into a 3D volumetric dataset using standard algorithms followed by a precise surface determination (ISO—50%) in CT analysis software VGStudio MAX 3.0 (Volume Graphics GmbH, Germany). The resolution of the CT data is defined by an isotropic voxel size, which is 10.47 m in this case. The CAD model of the component is used for registration. Various analyses and evaluations are performed on the reconstructed CT volume.
3. Results and Discussion
The obtained CT measurement results for the design of experiment plan are presented and discussed in this section. The second part includes the statistical observations based on the DOE.
3.1. Measurements
As mentioned earlier, this type of geometrical component suffers from bad internal quality, thus pore volume (measure of the total volume of internal voids) is included as a quality criterion. In addition, the volumetric shrinkage (measure of the total part volume) is also studied in consideration of the overall quality of the part. The measurements of pore volume and volumetric shrinkage are obtained from the CT for the entire DOE plan. Two parts were measured for each set of process conditions and the standard deviations are also reported. Incomplete moldings resulted from settings , and ; therefore, these are excluded from the discussion.
3.1.1. Pore Volume and Morphology
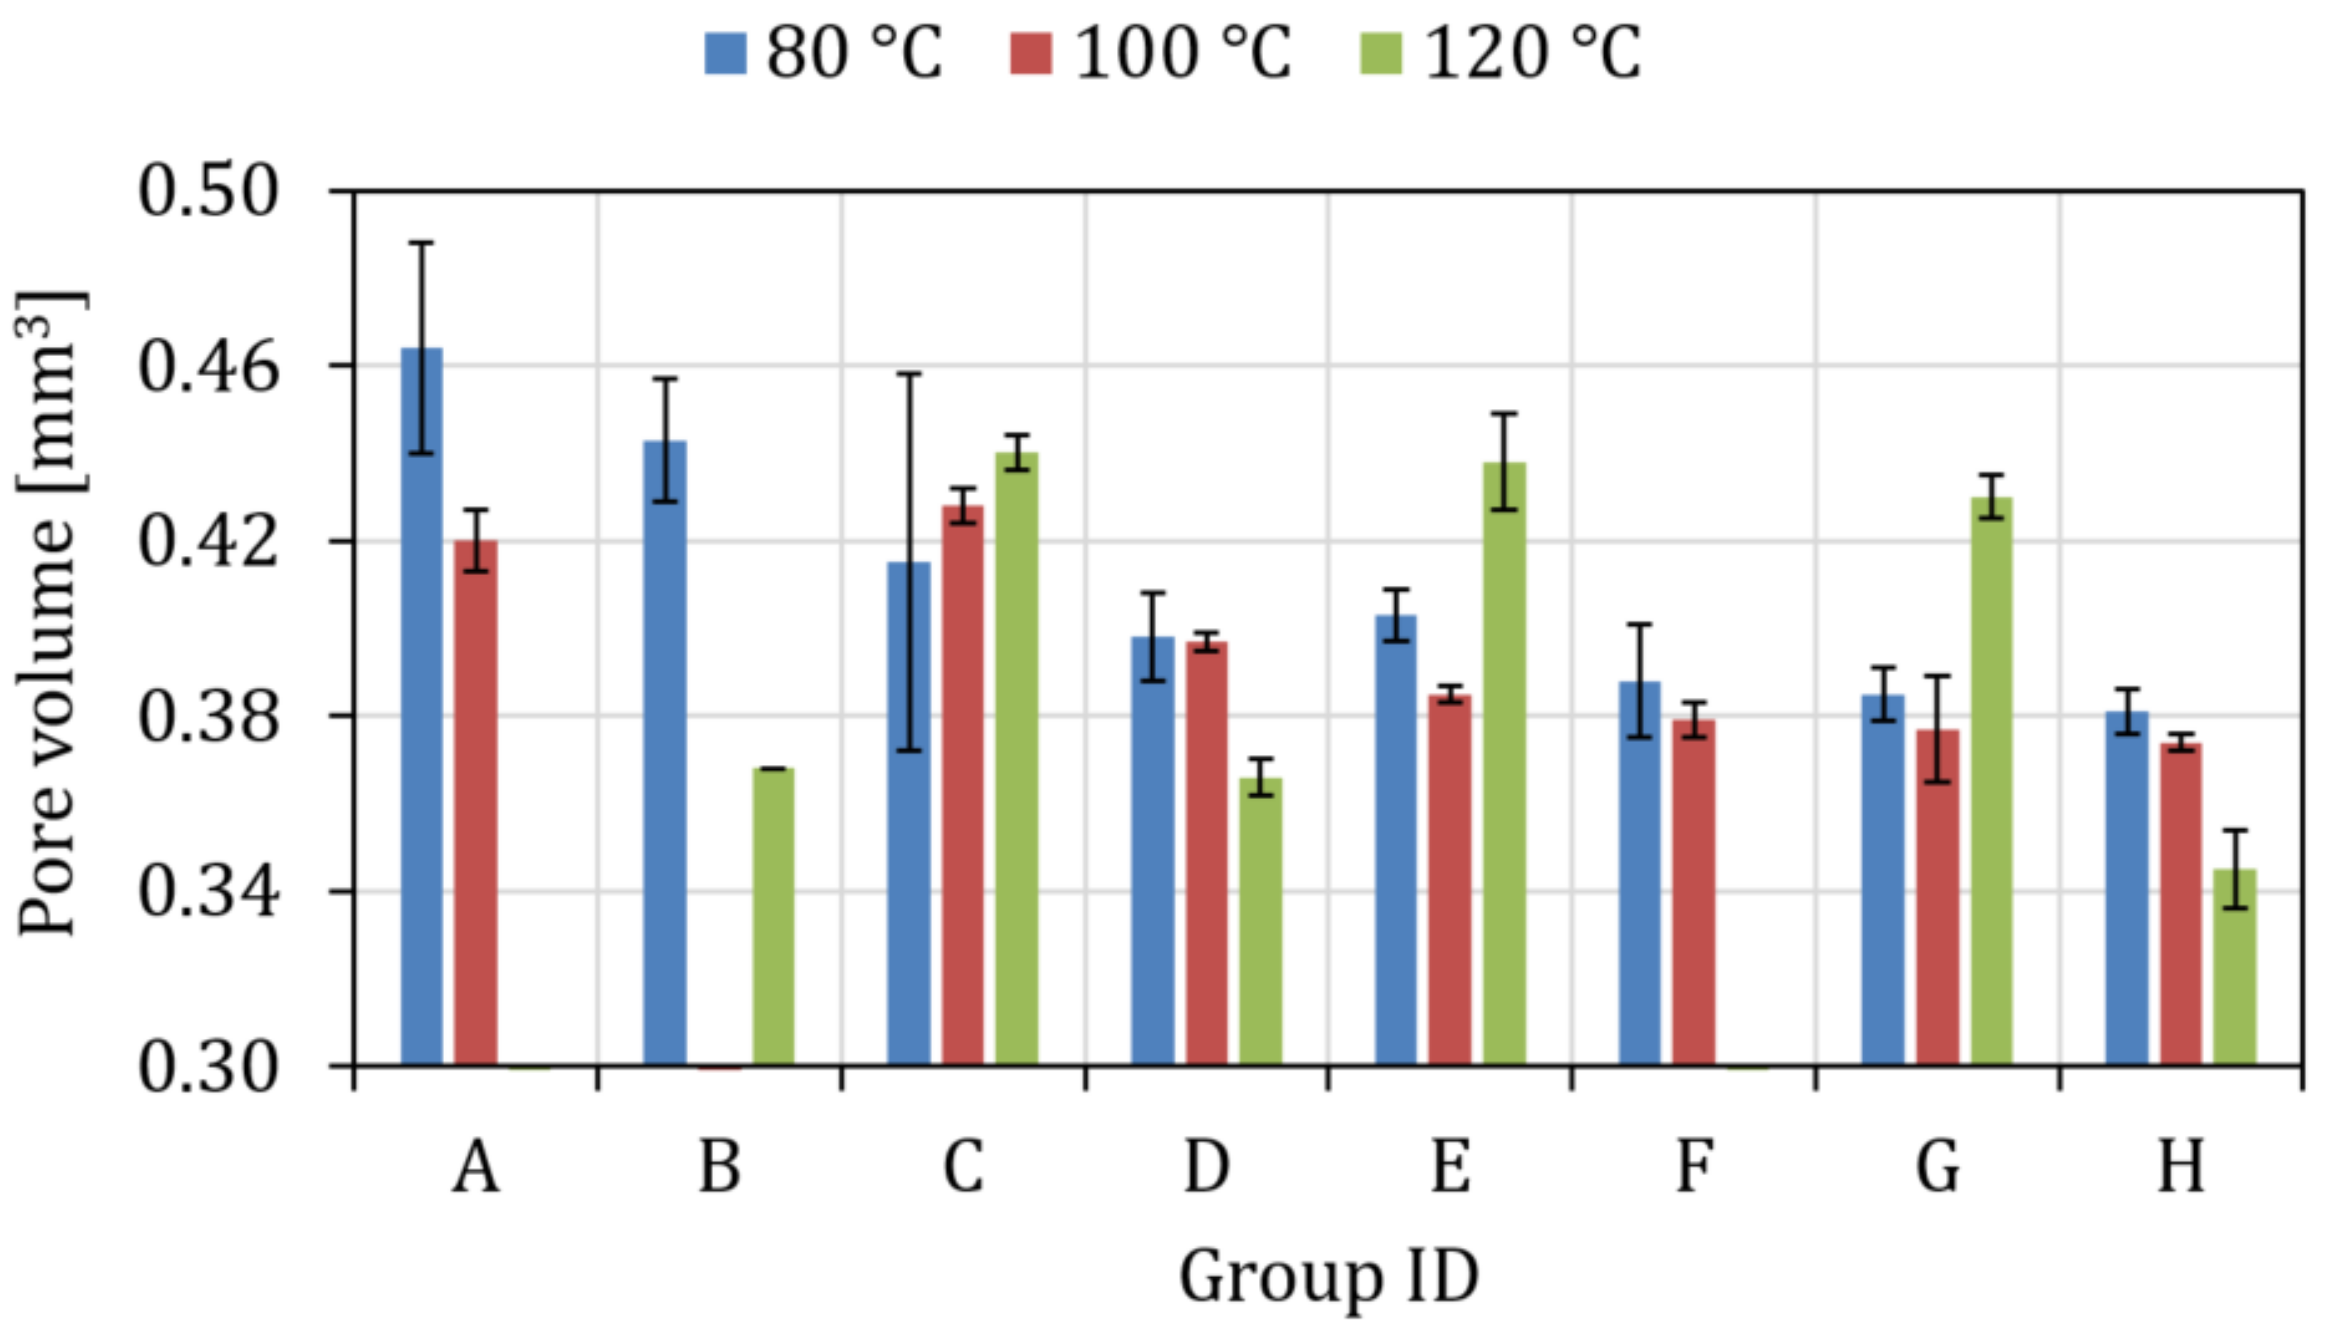
The surface determination-based porosity module was used for the void volume analysis in the VGStudioMax 3.0. The quantitative results of the void volume are presented in
Figure 3; the plot shows the mean values of the total pore volume and the standard deviations.
The lower pore volume corresponds to better internal quality of the component. As can been seen in
Figure 3, the process settings
yield the maximum void volume and the process settings
yield the minimum void volume; eventually, that corresponds to all four factors at their lowest level and highest level, respectively. At 80 °C and 100 °C mold temperature, a decreasing trend in the pore volume is observed when going from setting
A to
H. However, this decreasing trend becomes irregular at 120 °C mold temperature, which shows the effect of packing pressure; the lower packing pressure of 625 bar results in considerably higher pore volume than that of 1000 bar. Moreover, the pores are distributed mainly along the central symmetrical plane (parting plane) of the part and individual pore volume ranges from 0.010 mm
to 0.10 mm
. This pattern of pore distribution can be attributed to the fact that the material around the central plane is the last to solidify and, therefore, it is more prone to air/gas entrapment and/or differential shrinkage.
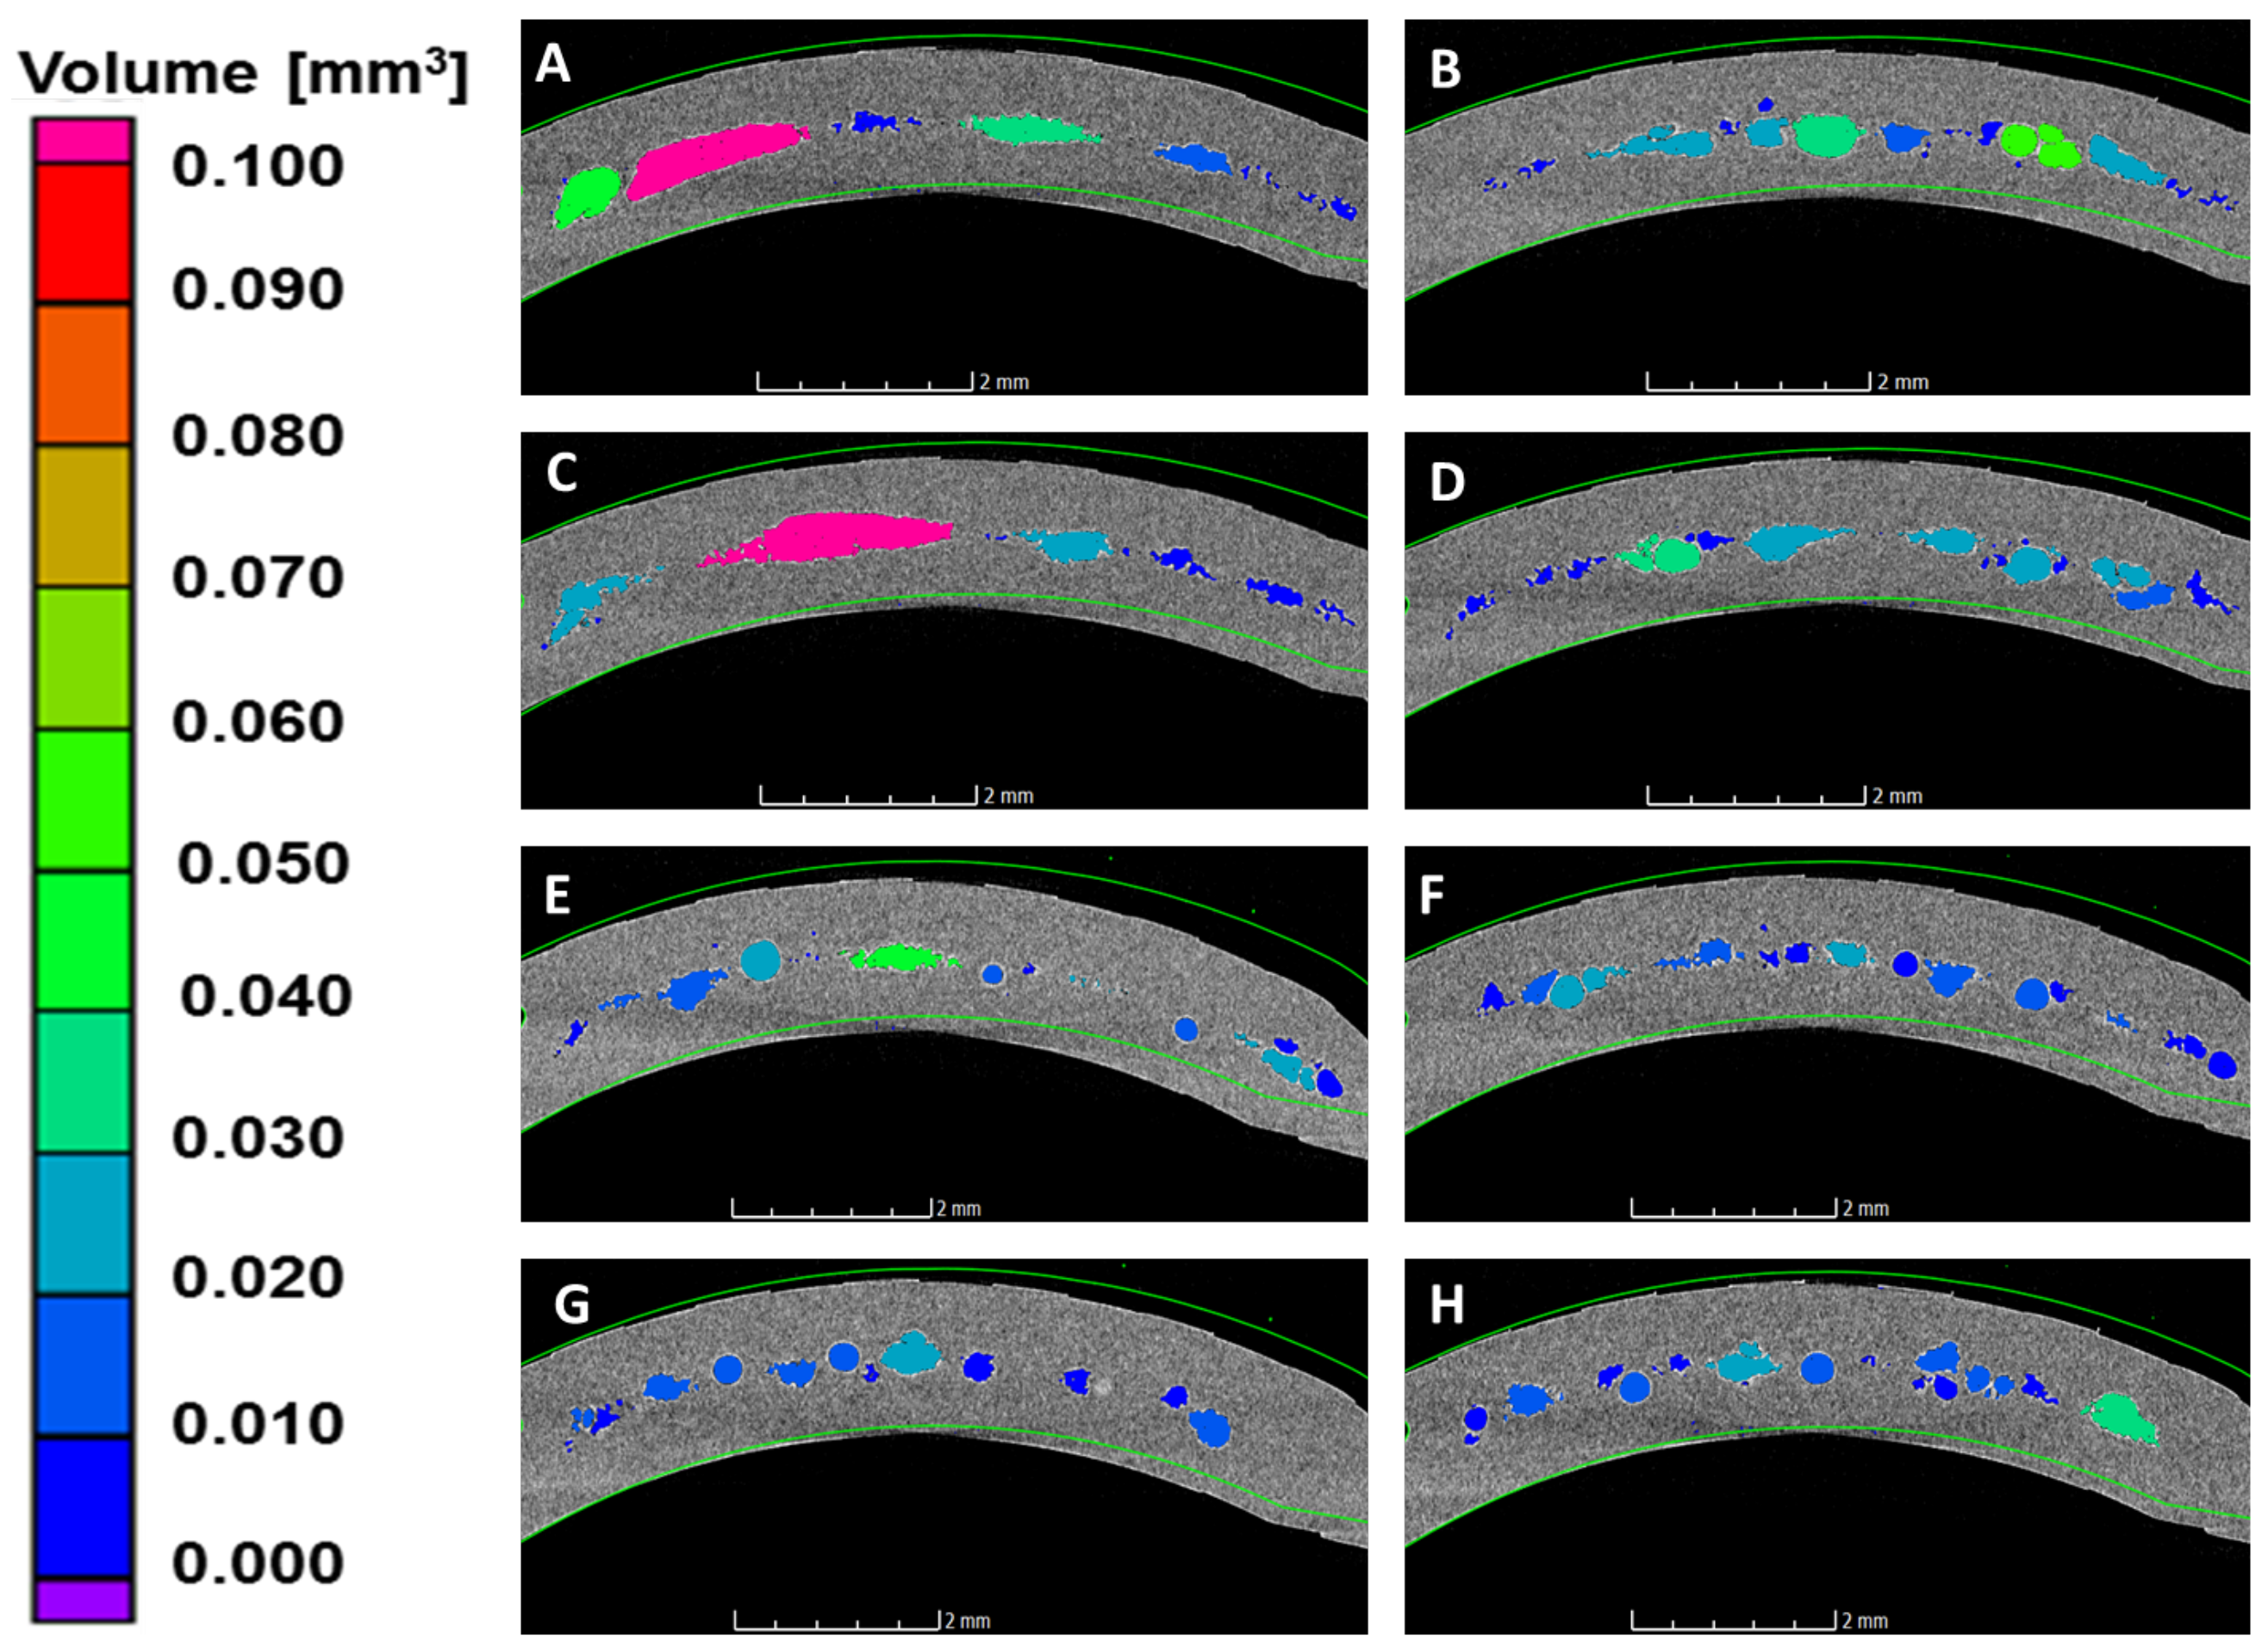
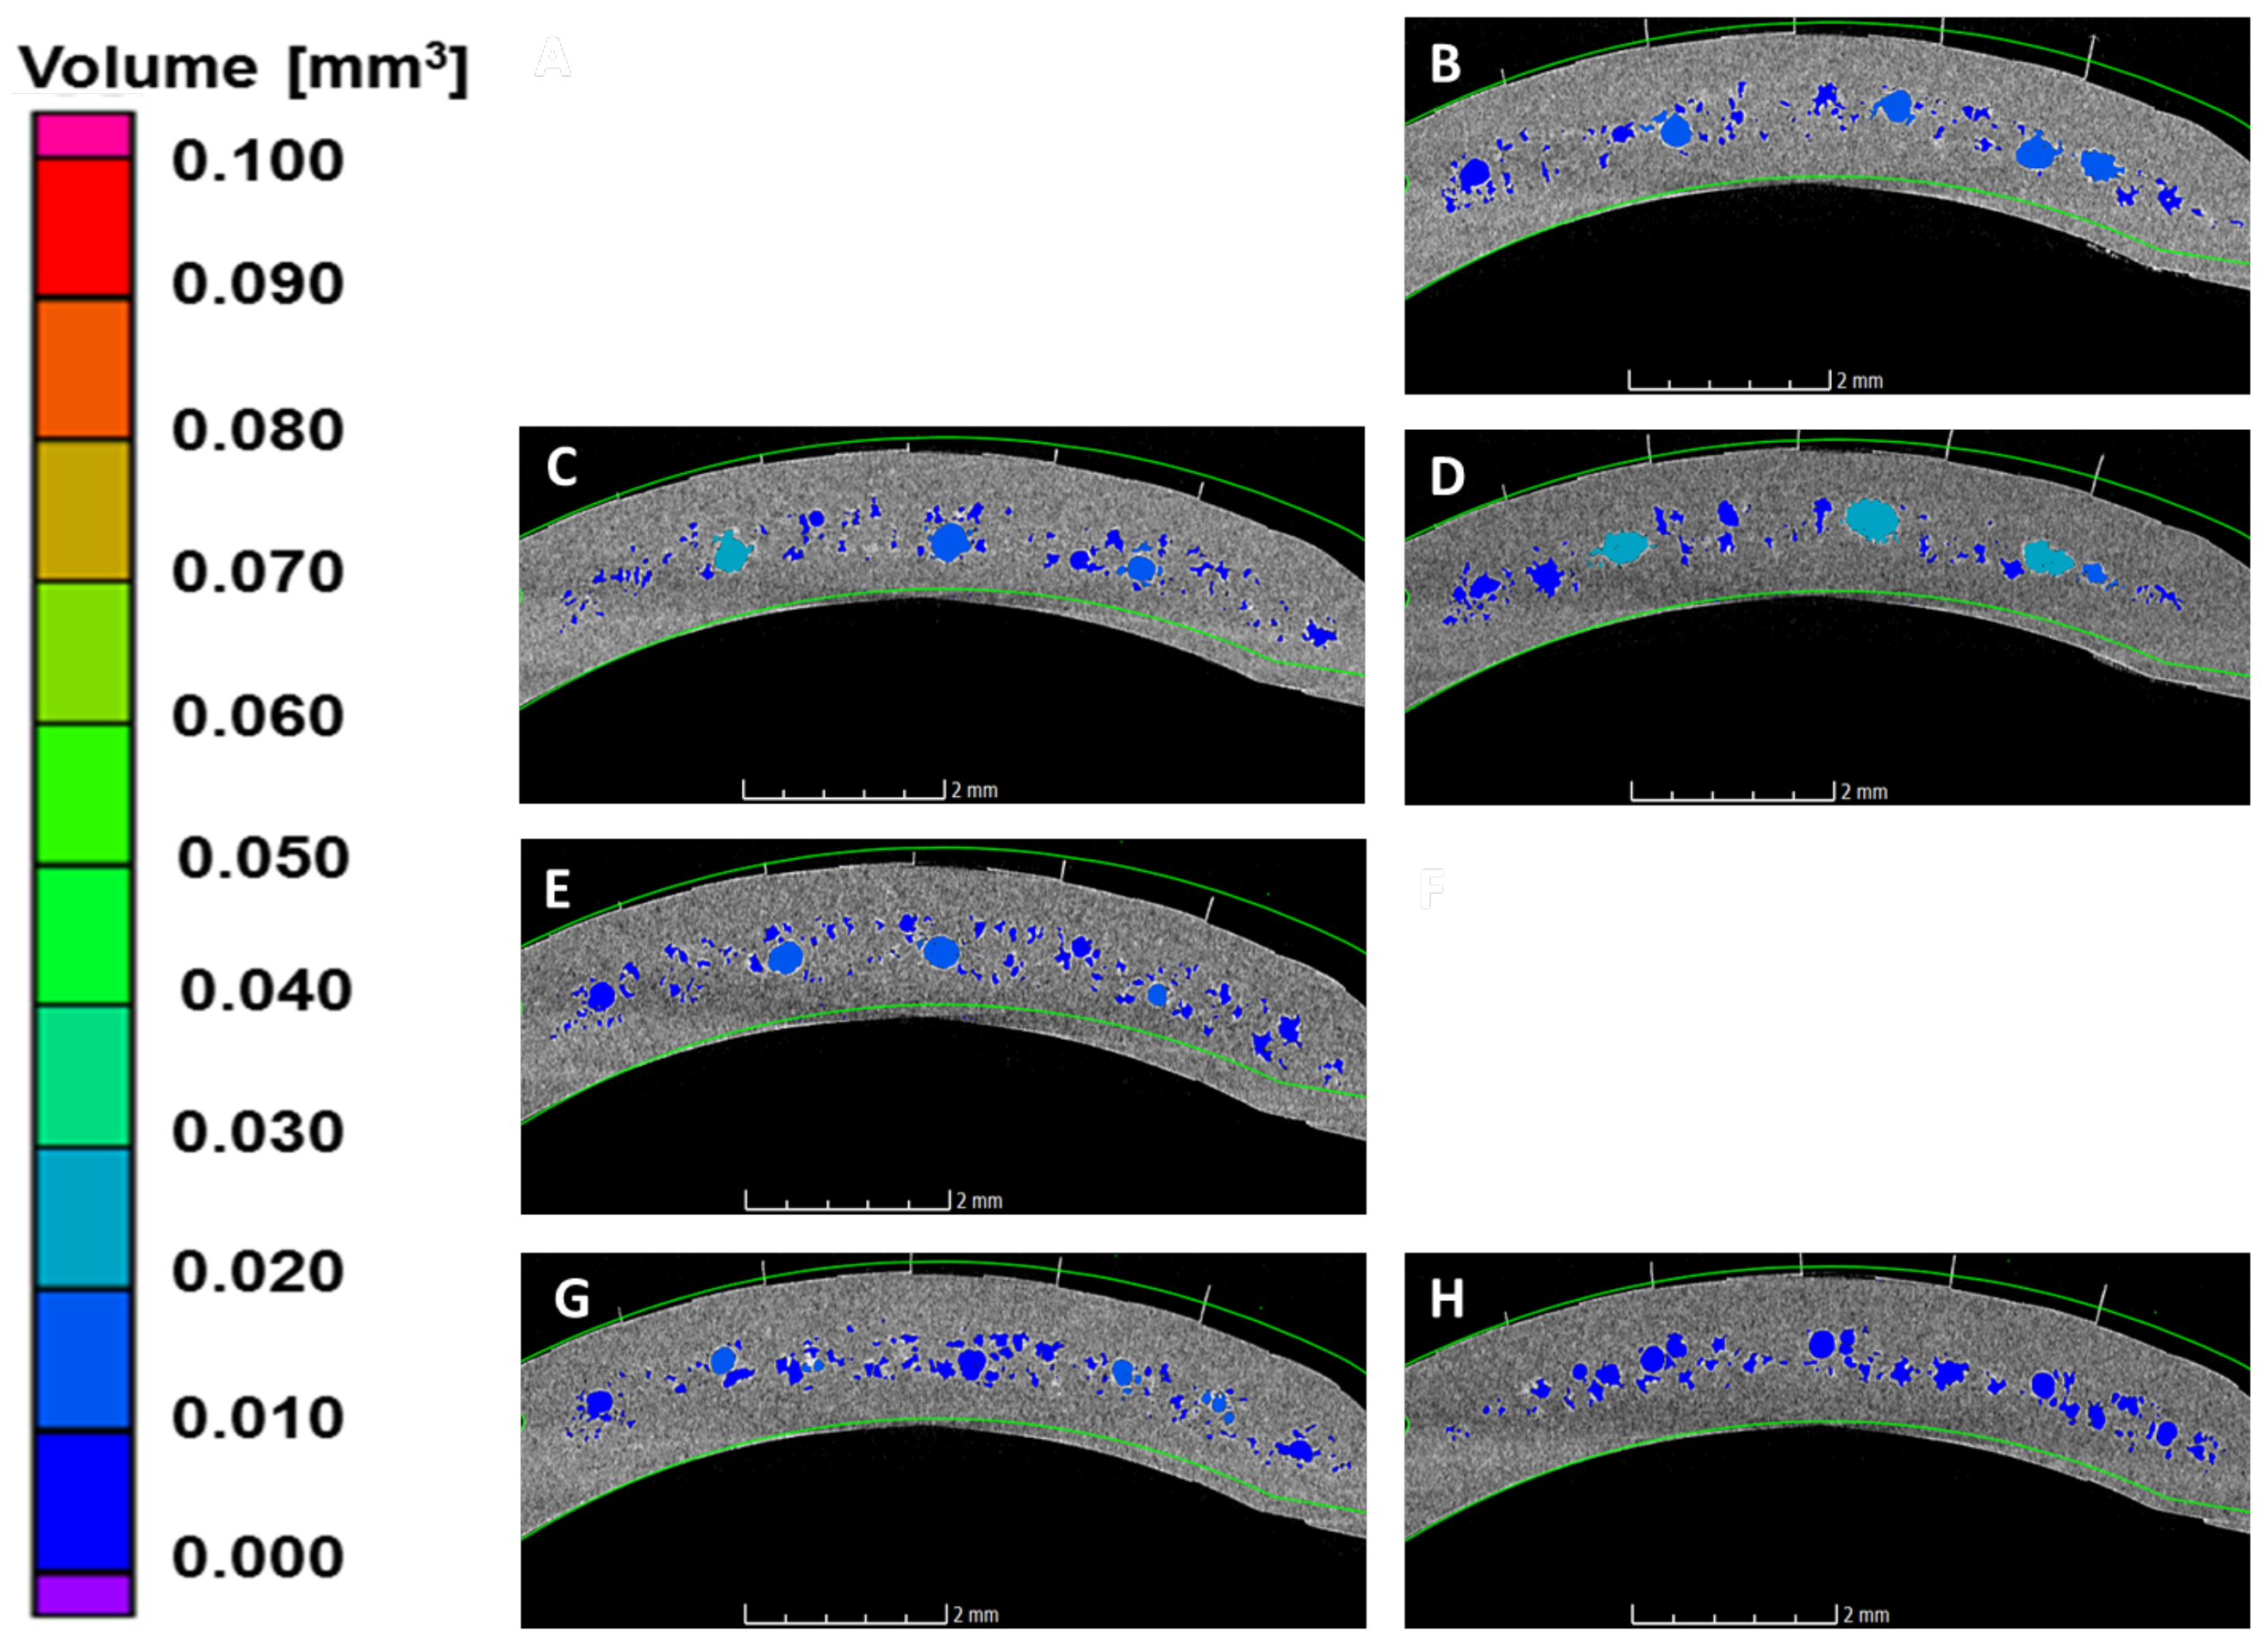
To understand the morphology of the pores, the cross sections along the parting plane have been examined.
Figure 4 and
Figure 5 include the cross sections (the portion in the dashed region in
Figure 1) of all the parts manufactured at mold temperature 80 and 120 °C, respectively. At mold temperature 80 °C, the presence of large voids of volume of 0.07 mm
and above is very evident especially with combination of lower melt temperature and lower packing pressure (
A and
C), which could be attributed to material insufficiency. At mold temperature 120 °C, the voids are comparatively smaller and remains lower than 0.03 mm
; however, the number of bigger voids is reduced with the increment of mold temperature. Furthermore, the pores are of irregular shapes, especially the bigger pores, which show elongated shapes due to the merging of small neighboring pores. The mold temperature 100 °C exhibits an intermediate effect.
3.1.2. Volumetric Shrinkage
The determined surface helps in measuring the part volume and geometrical deviation in the part geometry as compared to nominal geometry (CAD). The part volume is aligned against the CAD using the best-fit alignment approach. The part exhibits larger deviation at both the ends and the central portion shows minimum deviations. This could be due to the flexibility at the open ends. However, the deviations are not very crucial from the quality point of view; the important aspect is the overall volumetric shrinkage of the part. The volumetric shrinkage of the component is the estimation of the overall shrinkage in the material volume with respect to the nominal cavity volume, which is calculated using the below equation:
where,
,
and
are the calculated volumetric shrinkage, measured part volume, and the nominal cavity volume, respectively.
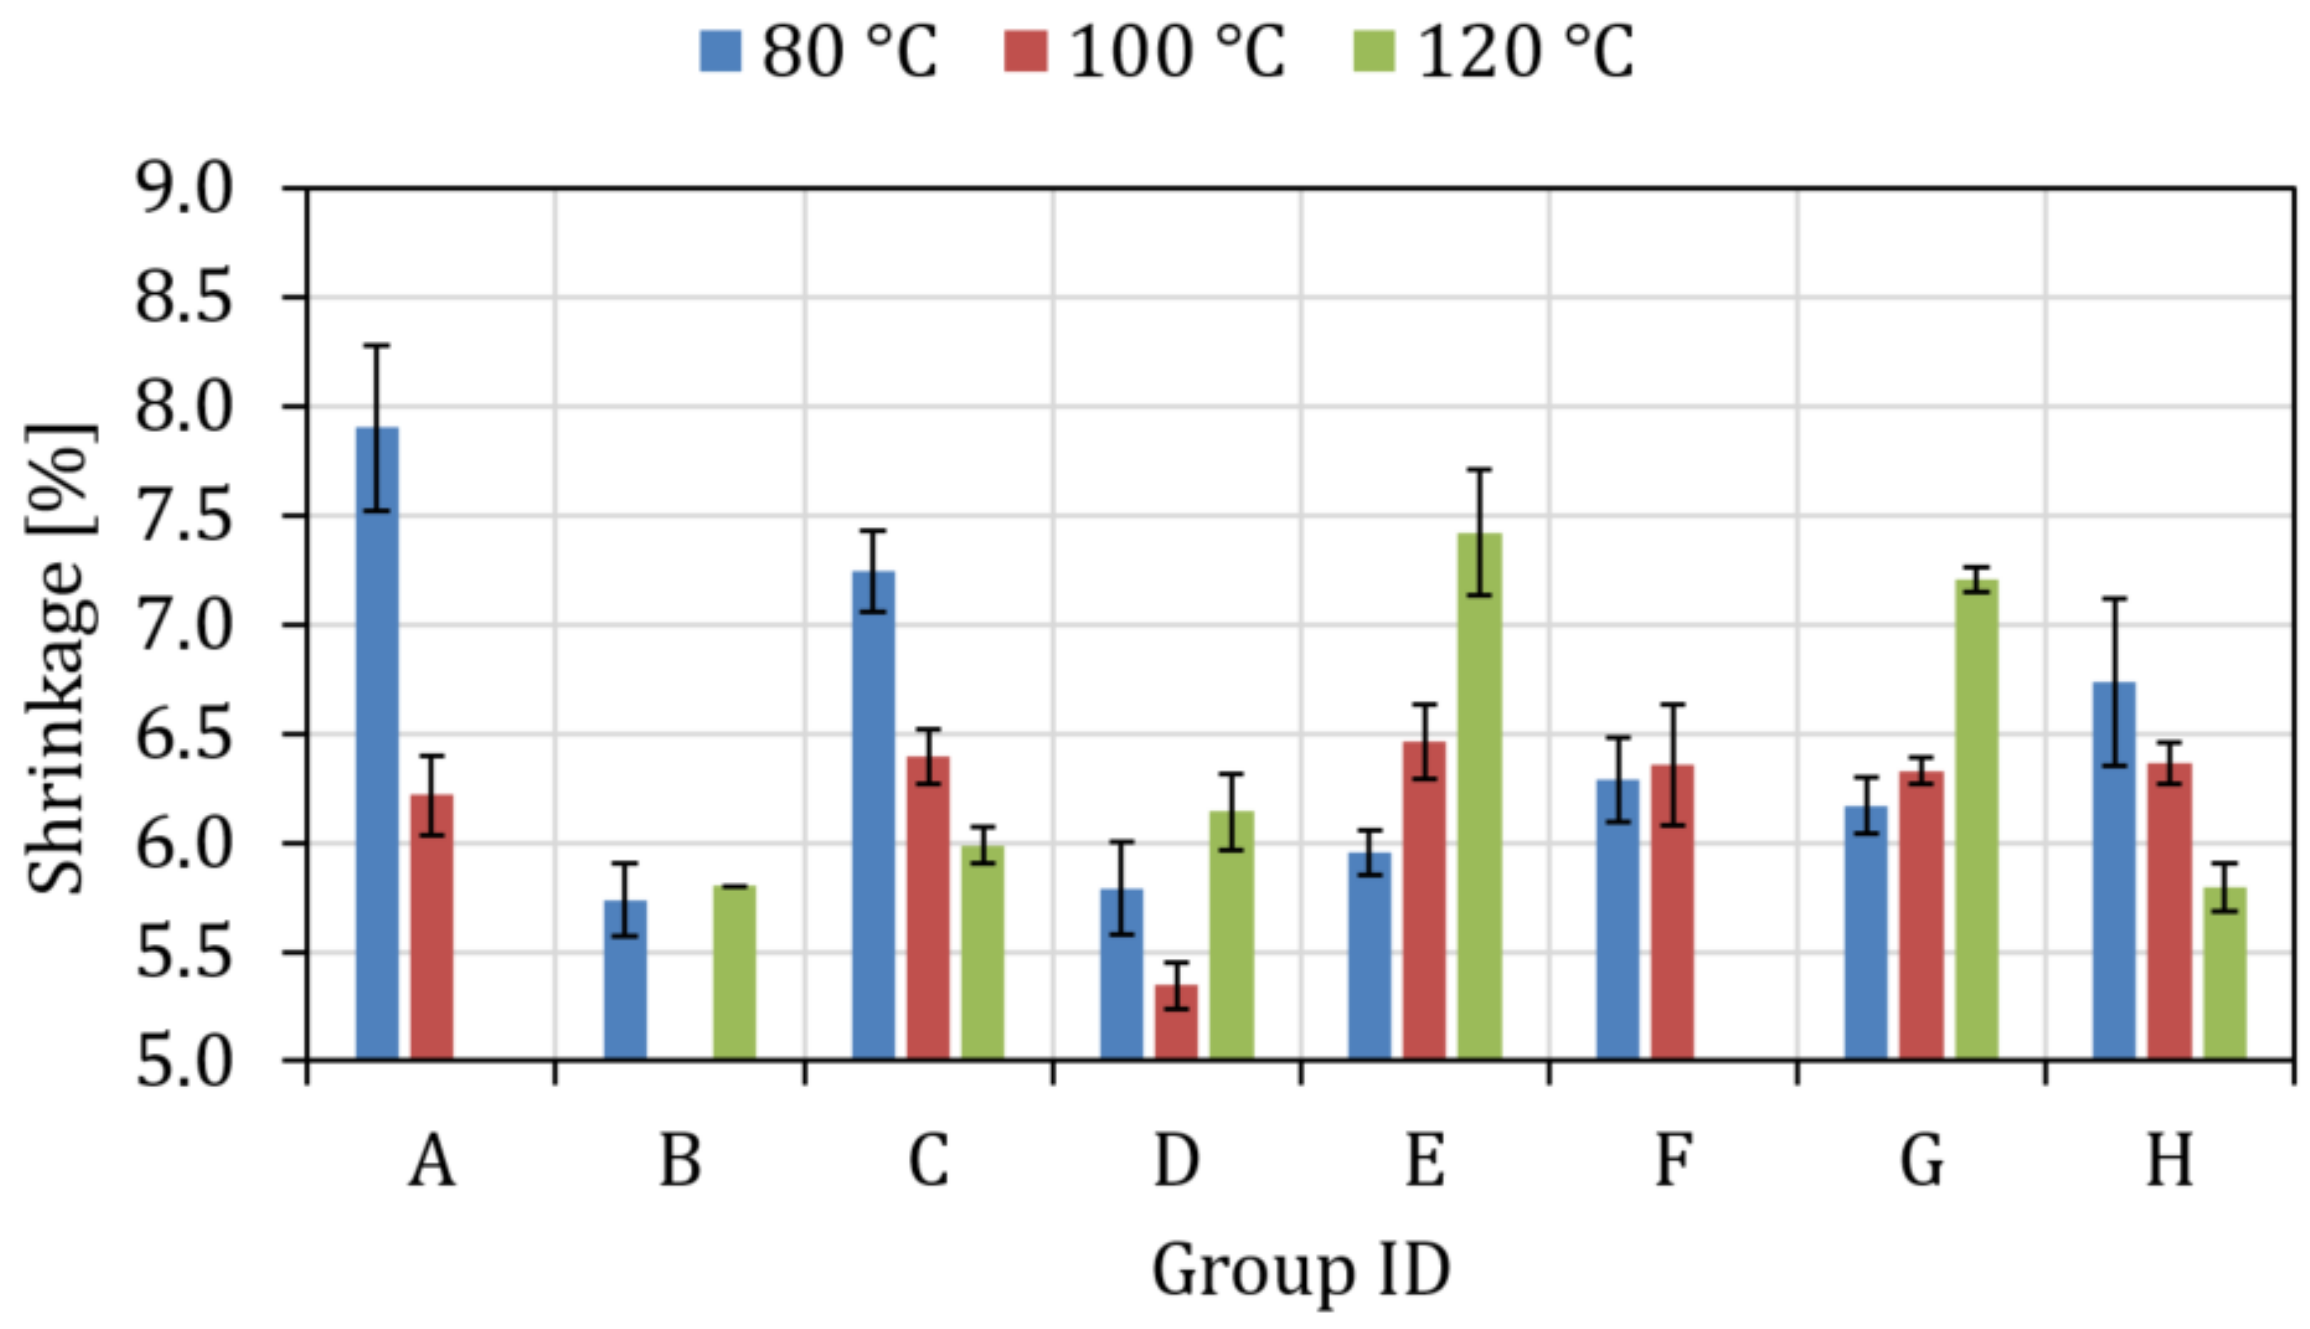
The measured mean values of
and the standard deviations for the DOE plan are shown in
Figure 6. For all the experiments, the shrinkage ranges between 5.5 and 8%. As the initial observation, the settings
,
,
and
resulted in higher volumetric shrinkage (>7%); interestingly all of them correspond to lower packing pressure of 625 bar. However, at settings
and
the effect of high packing pressure is countered by higher mold temperature, while at settings
and
, lower mold temperature results in lower shrinkage. This trend suggests that both low melt-mold temperature and high melt-mold temperature are not favorable from the shrinkage point of view. Thus, a balance of the temperature parameters (melt and mold temperature) is required for minimizing shrinkage. The minimum shrinkage of the component was came at
.
3.2. Statistical Analysis
As reported, the results from the experimental campaign were analyzed considering the two response variables (pore volume and volumetric shrinkage). A General Linear Model was used in order to use a univariate analysis of variance (ANOVA) for identifying the factors and their first-order interactions that significantly affect each response. The statistical analyses were carried out using the statistical software Minitab 17. The significance of the factors and their interactions corresponds to obtained
p-values, for which the threshold value was fixed at 0.05 (
Table 5). The factors with a
p-value inferior to 0.05 are statistically significant to the selected response.
Table 5 presents the results of the statistical analyses of the DOE plan.
The results depict that packing pressure and melt temperature affects the pore volume significantly. No significant interactions are observed for pore volume except slightly significant interaction of mold temperature and packing pressure. On the other hand, mold temperature, melt temperature, and packing pressure seem to be affecting the shrinkage significantly; however, the degree of significance varies (corresponding to p-value). The interactions of melt temperature with mold temperature and packing pressure are also significant for shrinkage results. The main effects of parameters and their interactions are discussed in detail in the following section.
3.2.1. Main Effects Plots
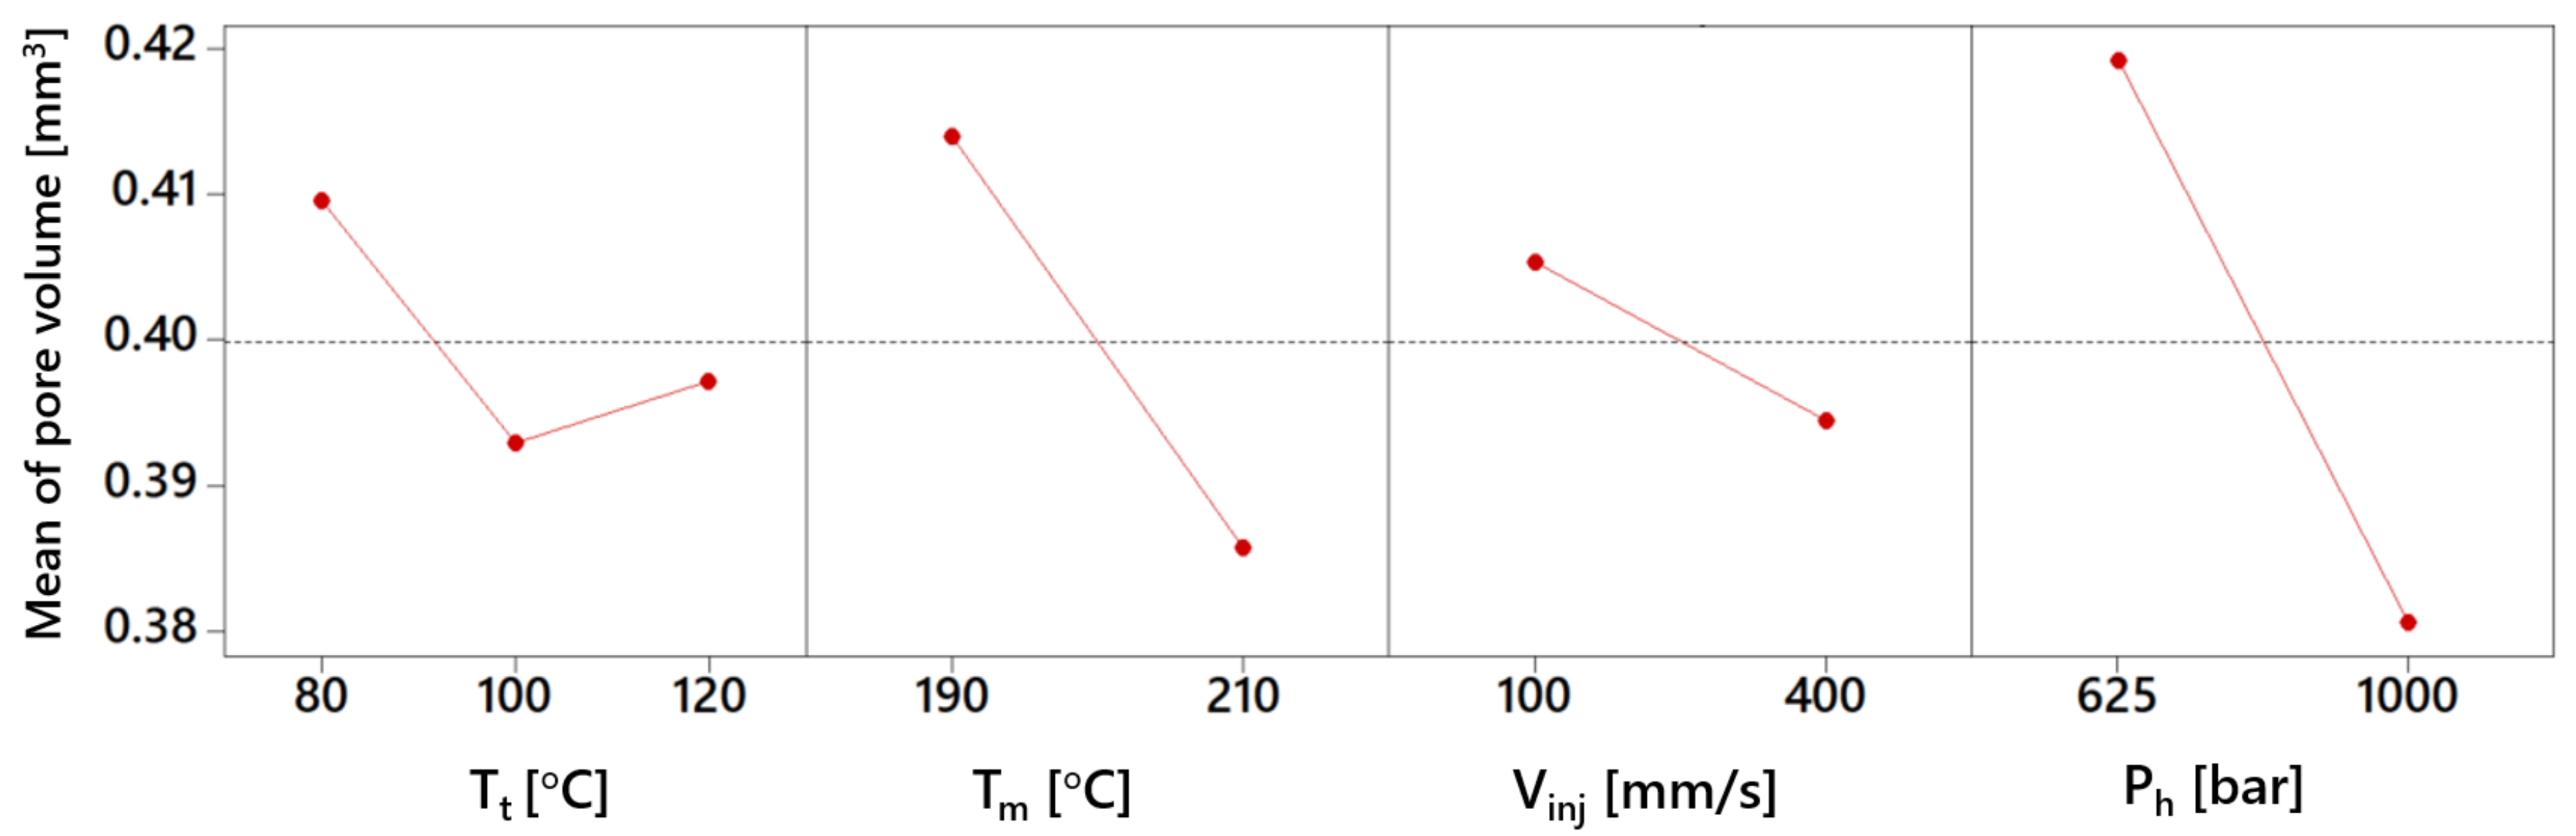
The main effect plots for pore volume are shown in
Figure 7. It can be seen that the greatest effect on the pore volume is of packing pressure followed by effect of melt temperature. Increasing packing pressure from 625 to 1000 bar reduced the void content by around 10%. Indeed, higher pressure helps in removing the trapped air inside and densifies the melt. A reduction (−4.8%) in the pore volume is also observed when increasing the melt temperature from 190 to 210 °C. The effect, with respect to injection speed and mold temperature, is around 2% each, which is negligible as compared to other effects.
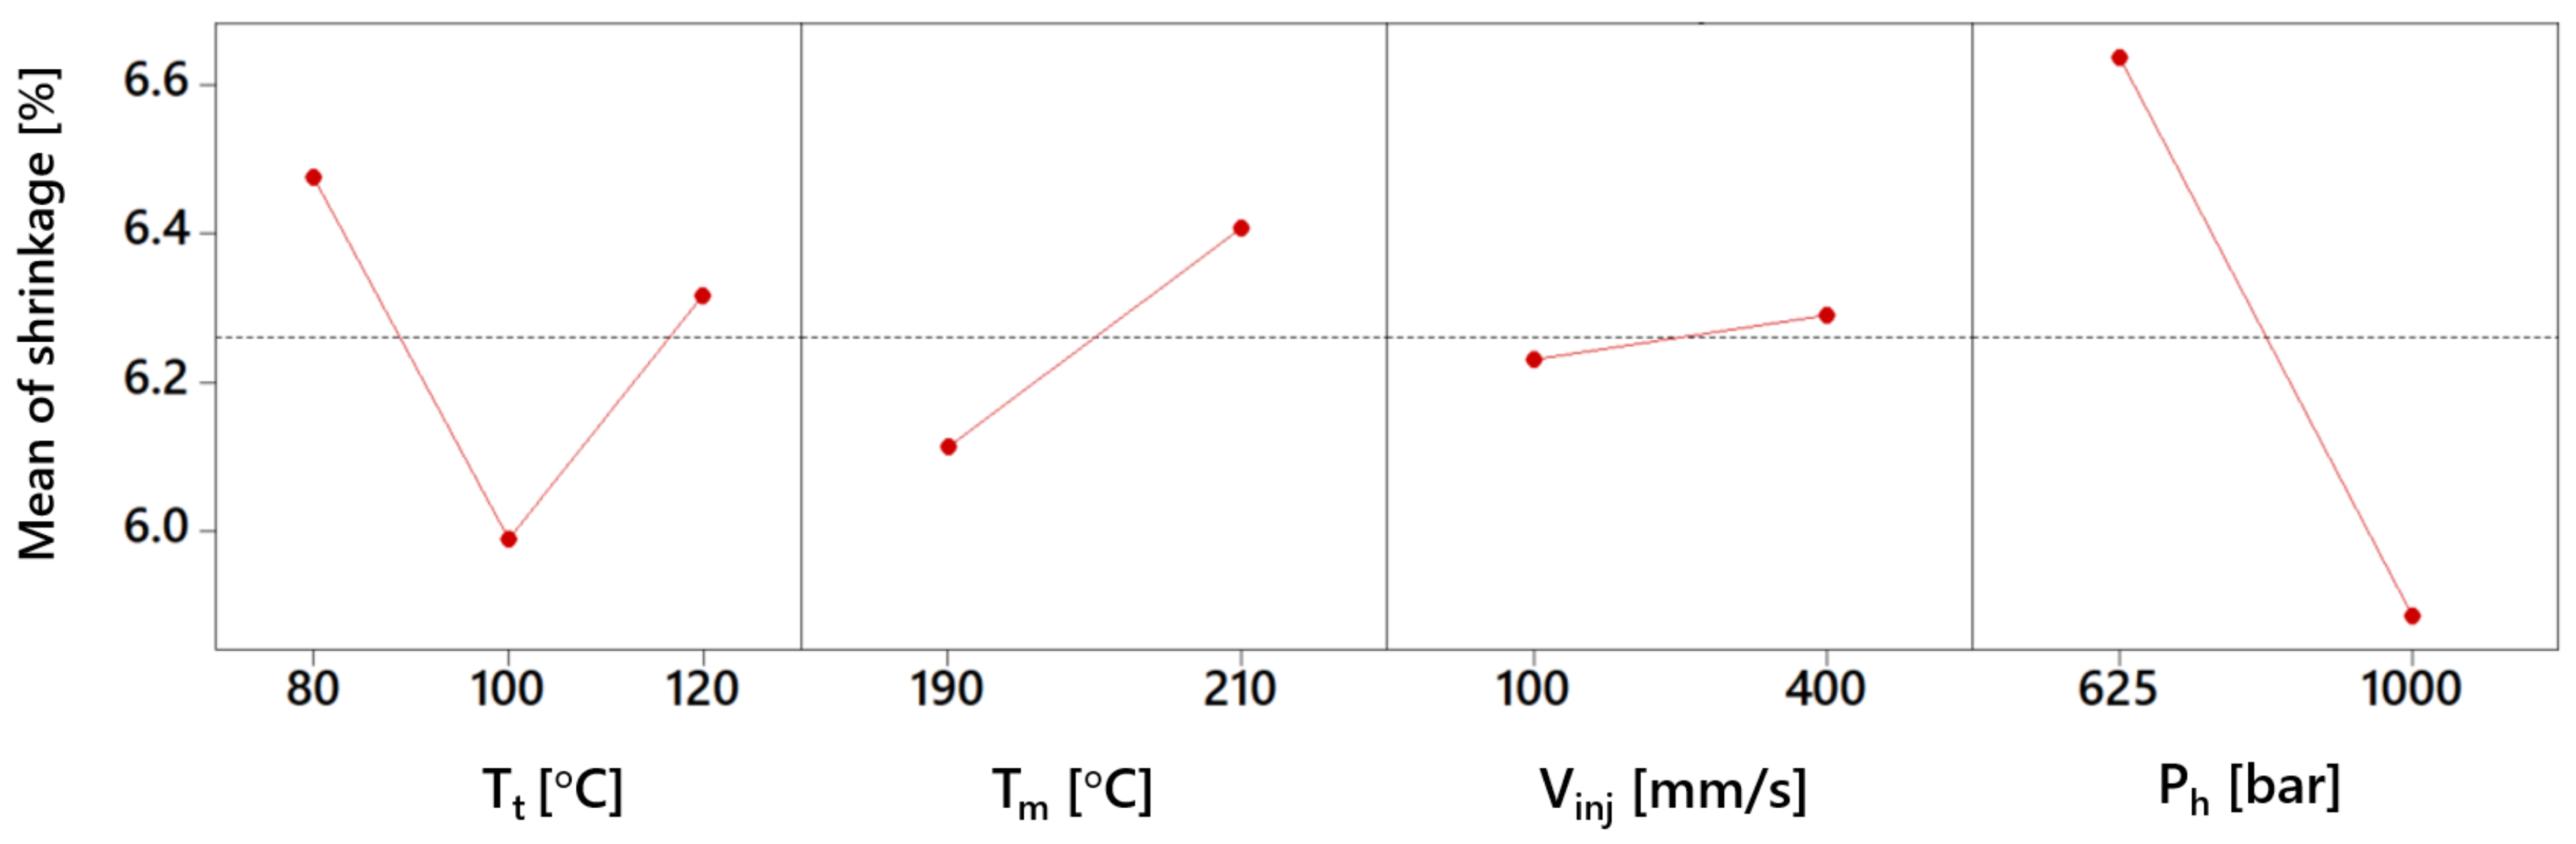
Figure 8 contains the main plots for shrinkage. The shrinkage is significantly affected by the packing pressure; increasing packing pressure from 625 to 1000 bar reduces the shrinkage considerably (ca. 10%). This reduction can be due to the fact that increasing packing pressure increases the amount of material entering the cavity; as a result, shrinkage decreases. Increasing mold temperature from 80 to 100 °C is resulted in a reduction of shrinkage; but increasing mold temperature to 120 °C shows an increment. This complex effect could be related to the crystallinity of the POM polymer as temperature (both mold and melt temperature) are known to drive the rate of crystallization by controlling the transition from melt to solid state [
9,
20]. The effect of melt temperature is around 2.5% and even smaller for injection speed, thus the effects are not significant.
3.2.2. Interaction Effect Plots
Interaction plots are used to visualize interactions among the factors; parallel lines in an interaction plot indicate no interaction, and the greater the difference in slope between the lines, the higher the degree of interaction. The significant interactions of the parameters can be identified from the
p-values (<0.05) reported in
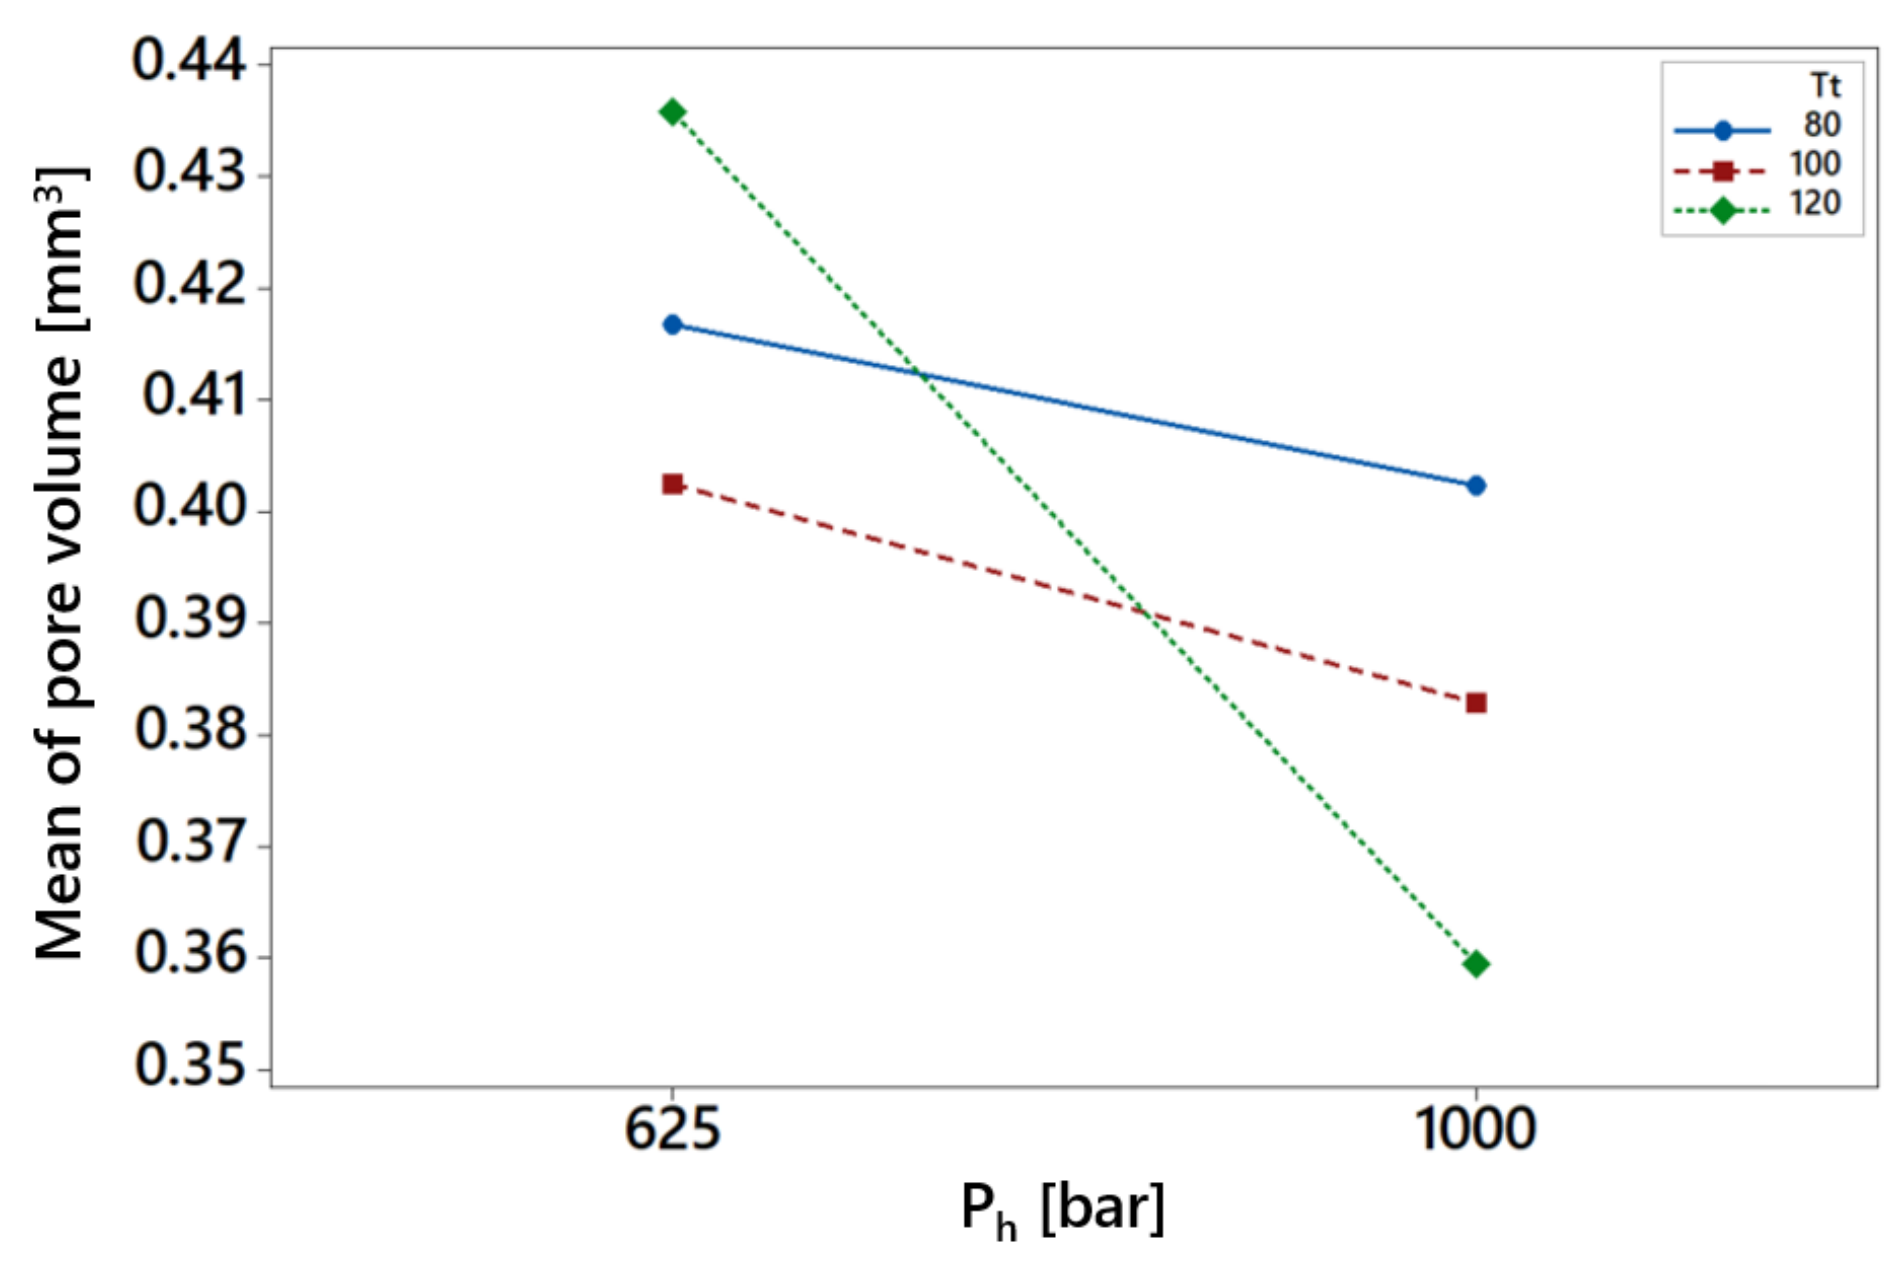
Table 5, which are also discussed here in detail. Although no significant interactions are identified for pore volume, the interaction between mold temperature and packing pressure (with
p-value = 0.053) seems to be slightly significant as visible in
Figure 9. There seems to be no interaction up to mold temperature 100 °C; but increasing the mold temperature to 120 °C with combination of higher packing pressure lowers the pore volume considerably.
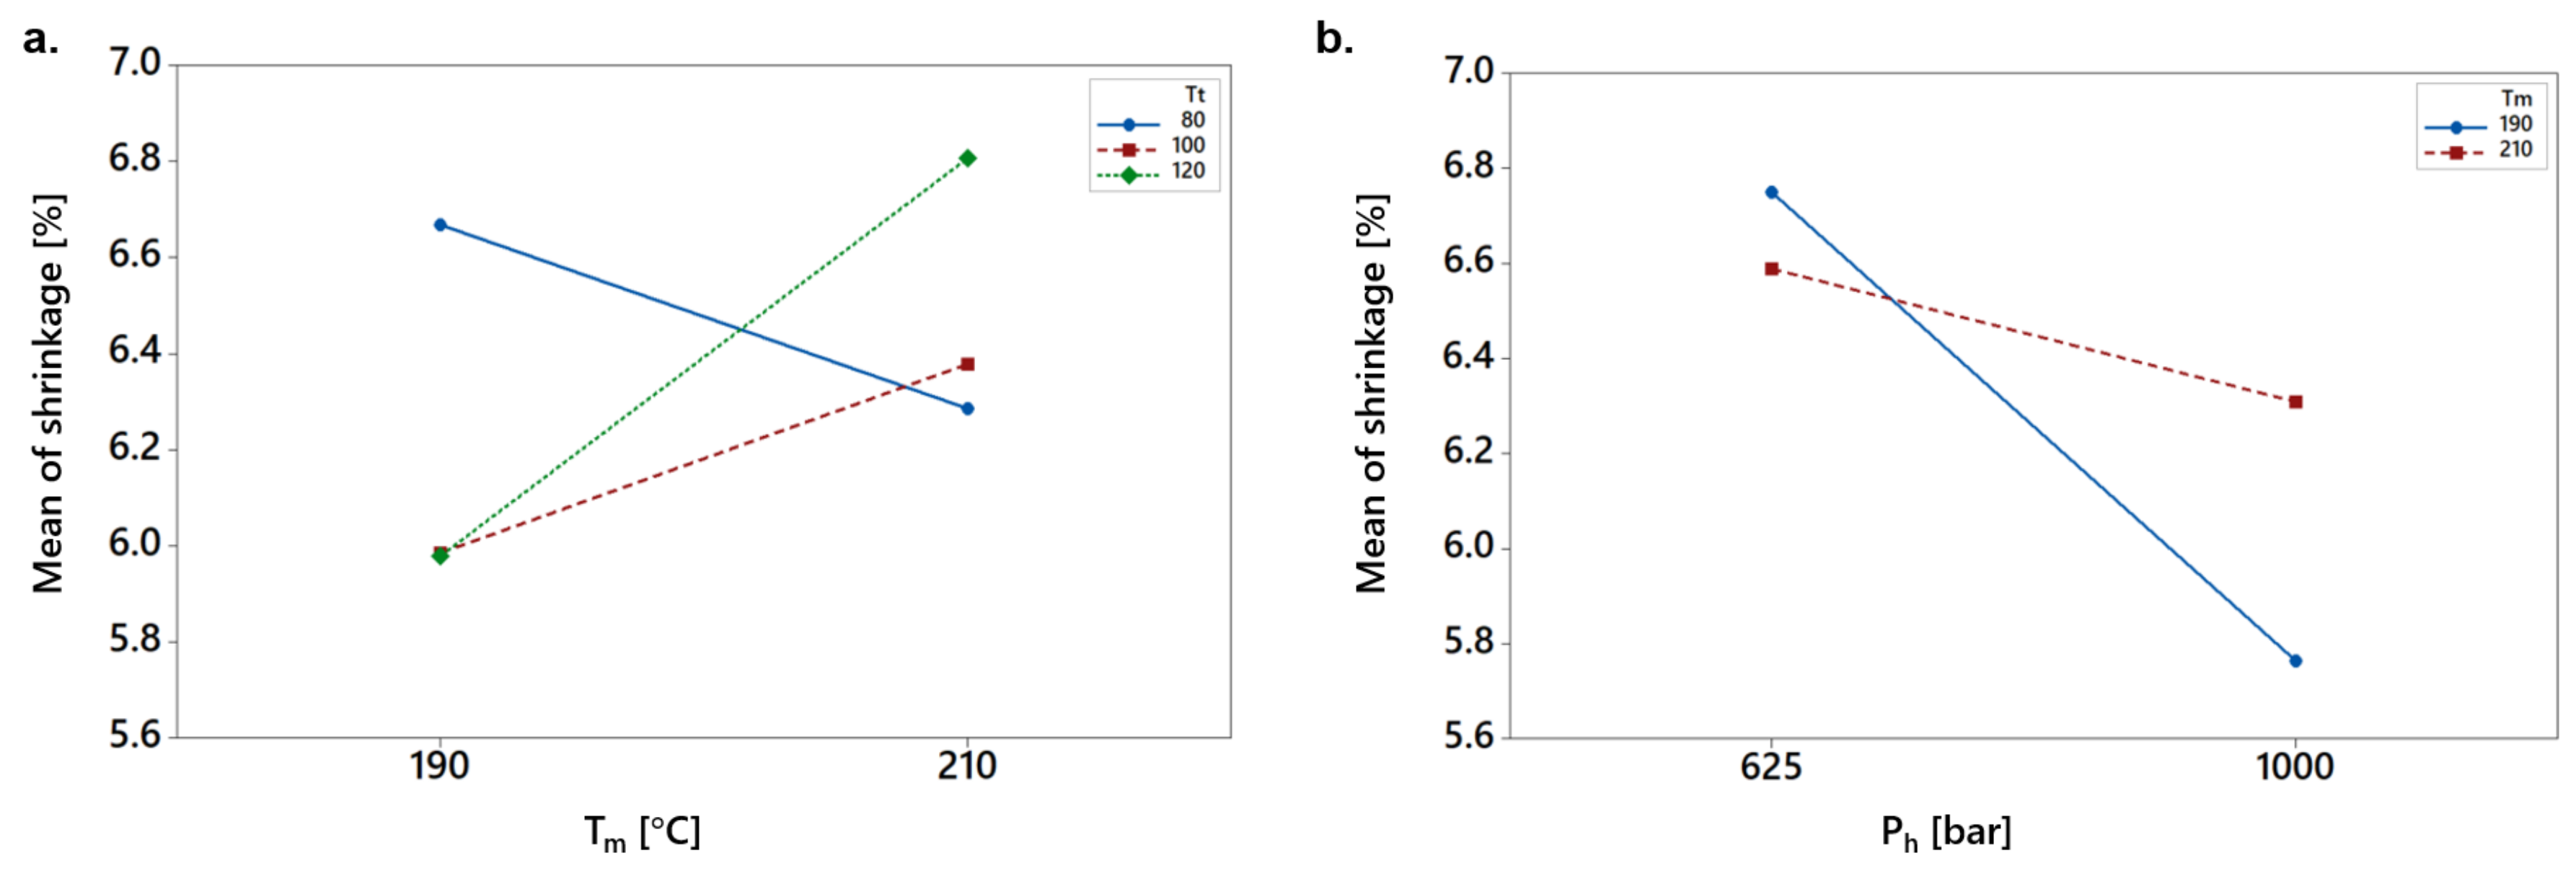
Regarding the shrinkage, the first-order interactions between melt temperature and mold temperature (
) and packing pressure and melt temperature (
) were significant as presented in
Figure 10a,b, respectively. In particular, the combination of higher mold temperatures (100 and 120 °C) with lower melt temperature resulted in the lowest shrinkage of molded parts. Increasing the melt temperature to 210 °C increases the shrinkage (13%) considerably at 120 °C mold temperature. Moreover, the low melt temperature and high packing pressure exhibits a reduction of around 15% in the volumetric shrinkage of the part.
4. Conclusions
The paper presented a study towards optimization of micro-injection molding process parameters for manufacturing a component with a new V-shaped geometry, since this type of geometrical feature is found in various medical components. The aim was to minimize volumetric shrinkage and the number of internal pores with design constraints in the mold geometry. Four important processing parameters were investigated with the help of design of experiment approach and the manufacturing parts were measured and analyzed with microfocus X-ray computed tomography.
The statistical analyses demonstrated that the greatest effect on the pore volume is of packing pressure followed by the effect of melt temperature. Increasing packing pressure from 625 to 1000 bar reduced the number of pores by around 10%. A reduction (−4.8%) in the pore volume is also observed when increasing the melt temperature from 190 to 210 °C. The shrinkage is significantly affected by the packing pressure as increasing packing pressure from 625 to 1000 bar reduces the shrinkage considerably (ca. 10%). A reduction in shrinkage is also exhibited with increasing mold temperature. The first-order interactions between melt temperature and mold temperature () and packing pressure and melt temperature () was significant for shrinkage, while no significant interactions are identified for pore volume.
The results showed that the presence of pores is inevitable within the selected process window. However, this study helps to understand the correlation of the process parameters with the number of pores and shrinkage; hence, optimization of the process settings can be achieved. The knowledge obtained from this study will be used for further research on the industrial products with V-shaped geometrical features.


