


Predicting the Tumour Response to Radiation by Modelling the Five Rs of Radiotherapy Using PET Images
 ,
,  ,
,
Abstract
:1. Introduction
2. Materials and Methods
2.1. Model of Tumour Response to Radiotherapy
- G0 phase, also called quiescence phase where the cell has left the active cycle and has stopped dividing.
- G1 phase, where the cell increases in size.
- S phase, or synthesis phase, where DNA is duplicated.
- G2 phase, preparing mitosis (synthesis of enzymes, etc.).
- M phase or mitosis, which is the last phase of the cell cycle, when division occurs.

| Parameter | Symbol | Value |
|---|---|---|
| Cell density | µ | 106/mm3 [40] |
| Cell cycle time | Tc | 24 h |
| Upper asymptote | C | 1 [41] |
| Cell growth rate | B | 0.075 [41] |
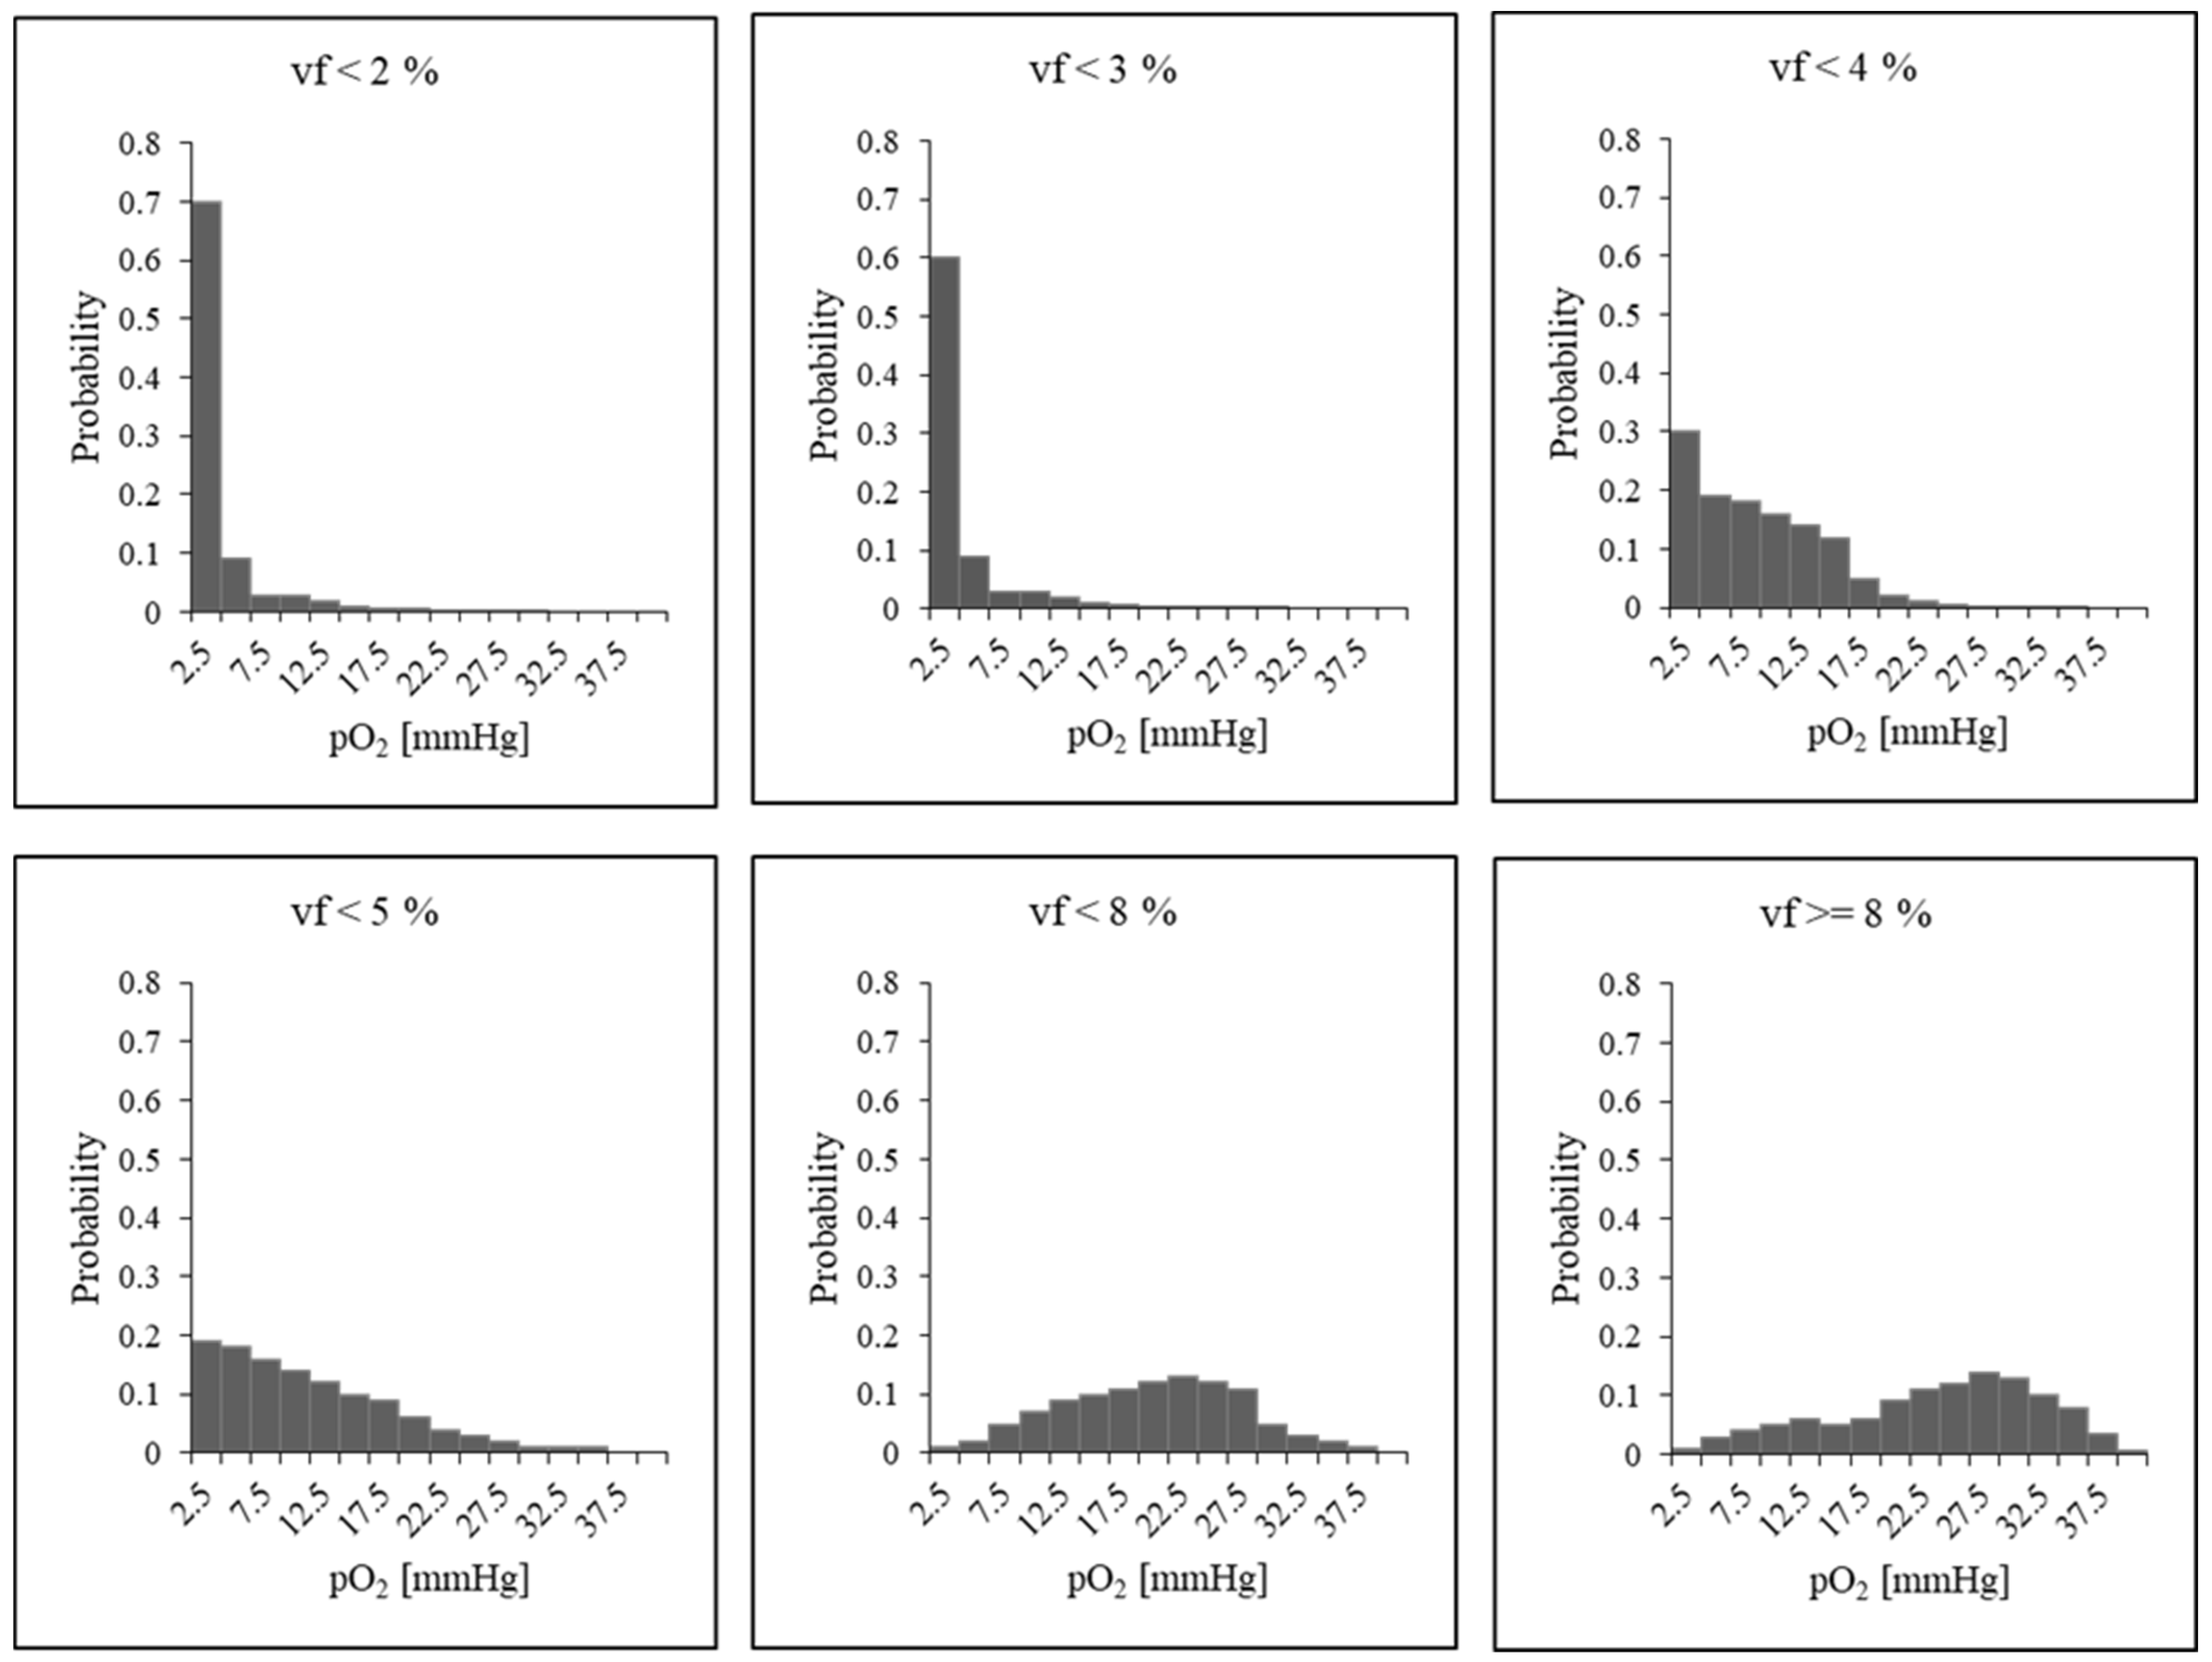
| Oxygen partial pressure | Calculated from histograms | |
| Inflection point (the pO2 value at the point of maximum incline) | 26.3 [41] | |
| Capillary cell proliferation (doubling time) | 612 h [42] | |
| Radiosensitivity coefficient | 0.273 Gy−1 [43] | |
| Radiosensitivity coefficient | 0.045 Gy−2 [43] | |
| Dose | 2 Gy | |
| Maximumvalue | 3 [44] | |
| Oxygen partial tension at | 3 mmHg [45] | |
| Half-life of dead cell resorption | 168 h [22] |
2.2. Model Components
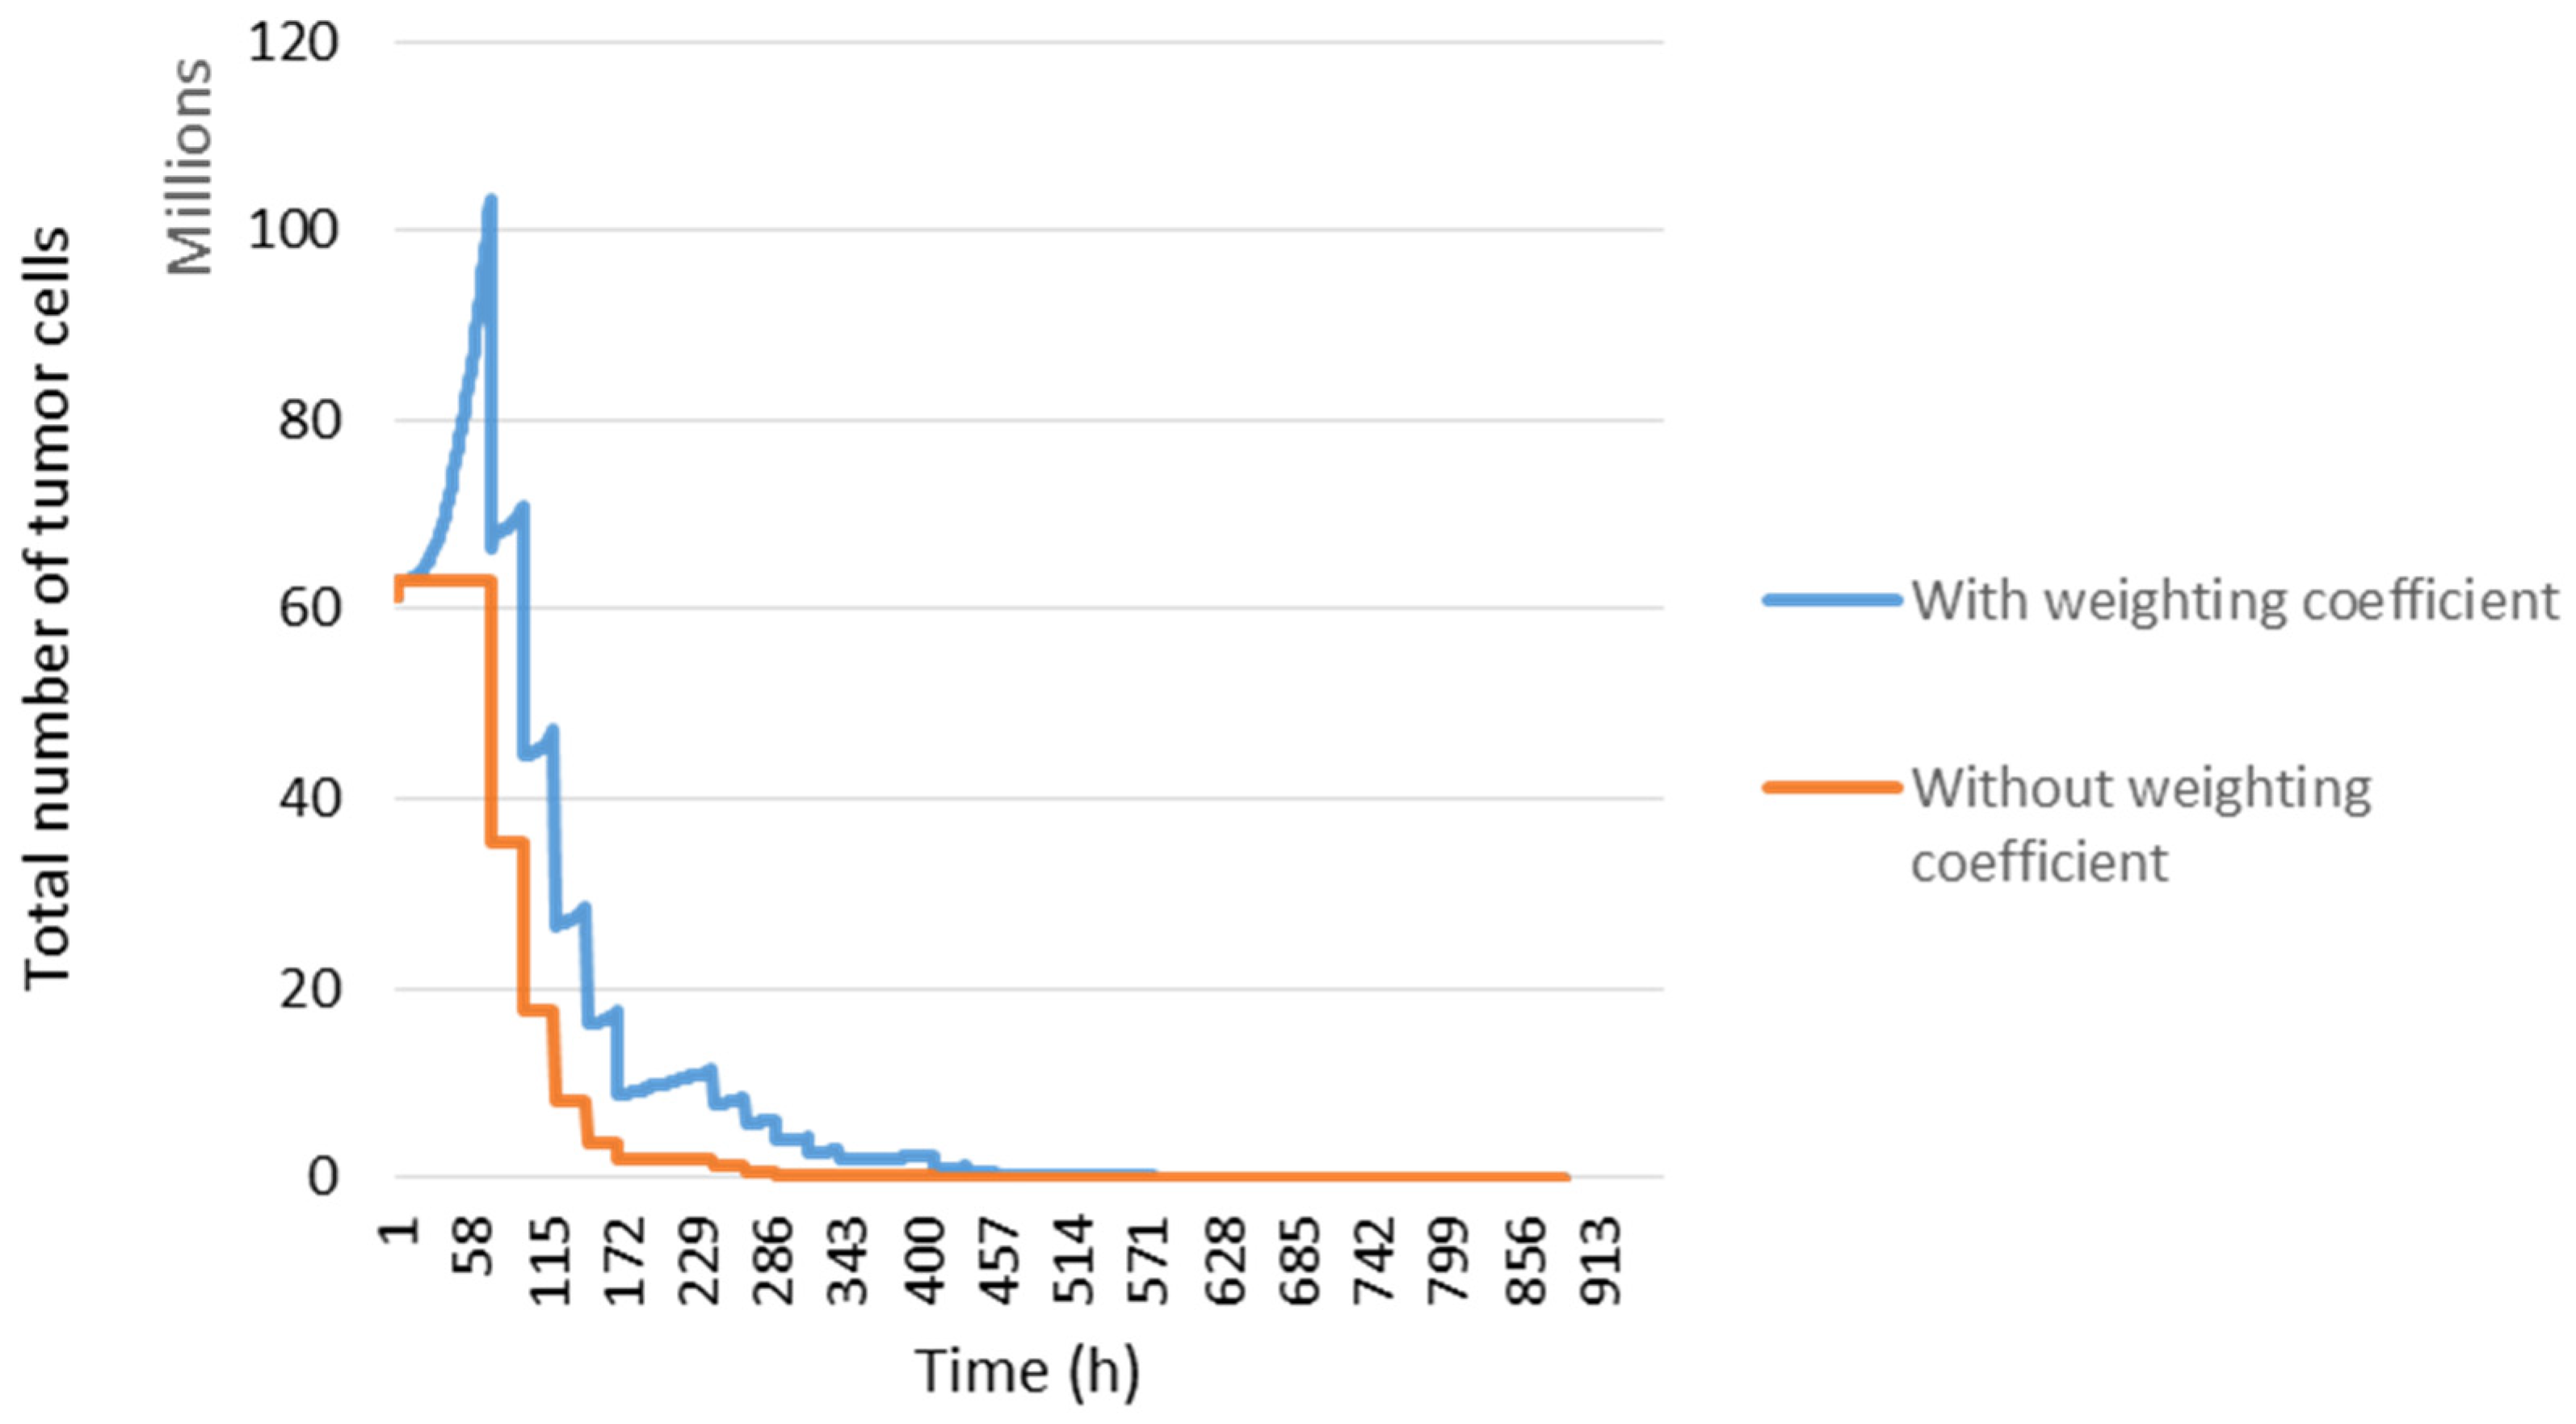
- Proliferation of tumour cells: the probability of cell division depends on the current oxygenation status of the cell. Cell proliferation factor PF was calculated as follows:where C is the superior asymptote, B the growth rate and M represents the pO2 value at the curve inflexion point.
- Angiogenesis: the presence of hypoxia may induce angiogenesis [46]. In this case the fraction of the capillary cells was multiplied by the factor :where ta is the doubling time for capillary cells and is the simulation time step (1 h).
- Cell survival after irradiation SF:Here, α and β are the radio-sensitivity coefficients, m is the maximum ratio, d is the dose and the is given by the following:where k is the pO2 at half of the increase from 1 to m.
- Resorption of dead tumour cells: tumour cells that have died after irradiation will be resorbed after a few days. This was reflected by the fraction of resorption:Here, tr represents the half-life of dead cell resorption.
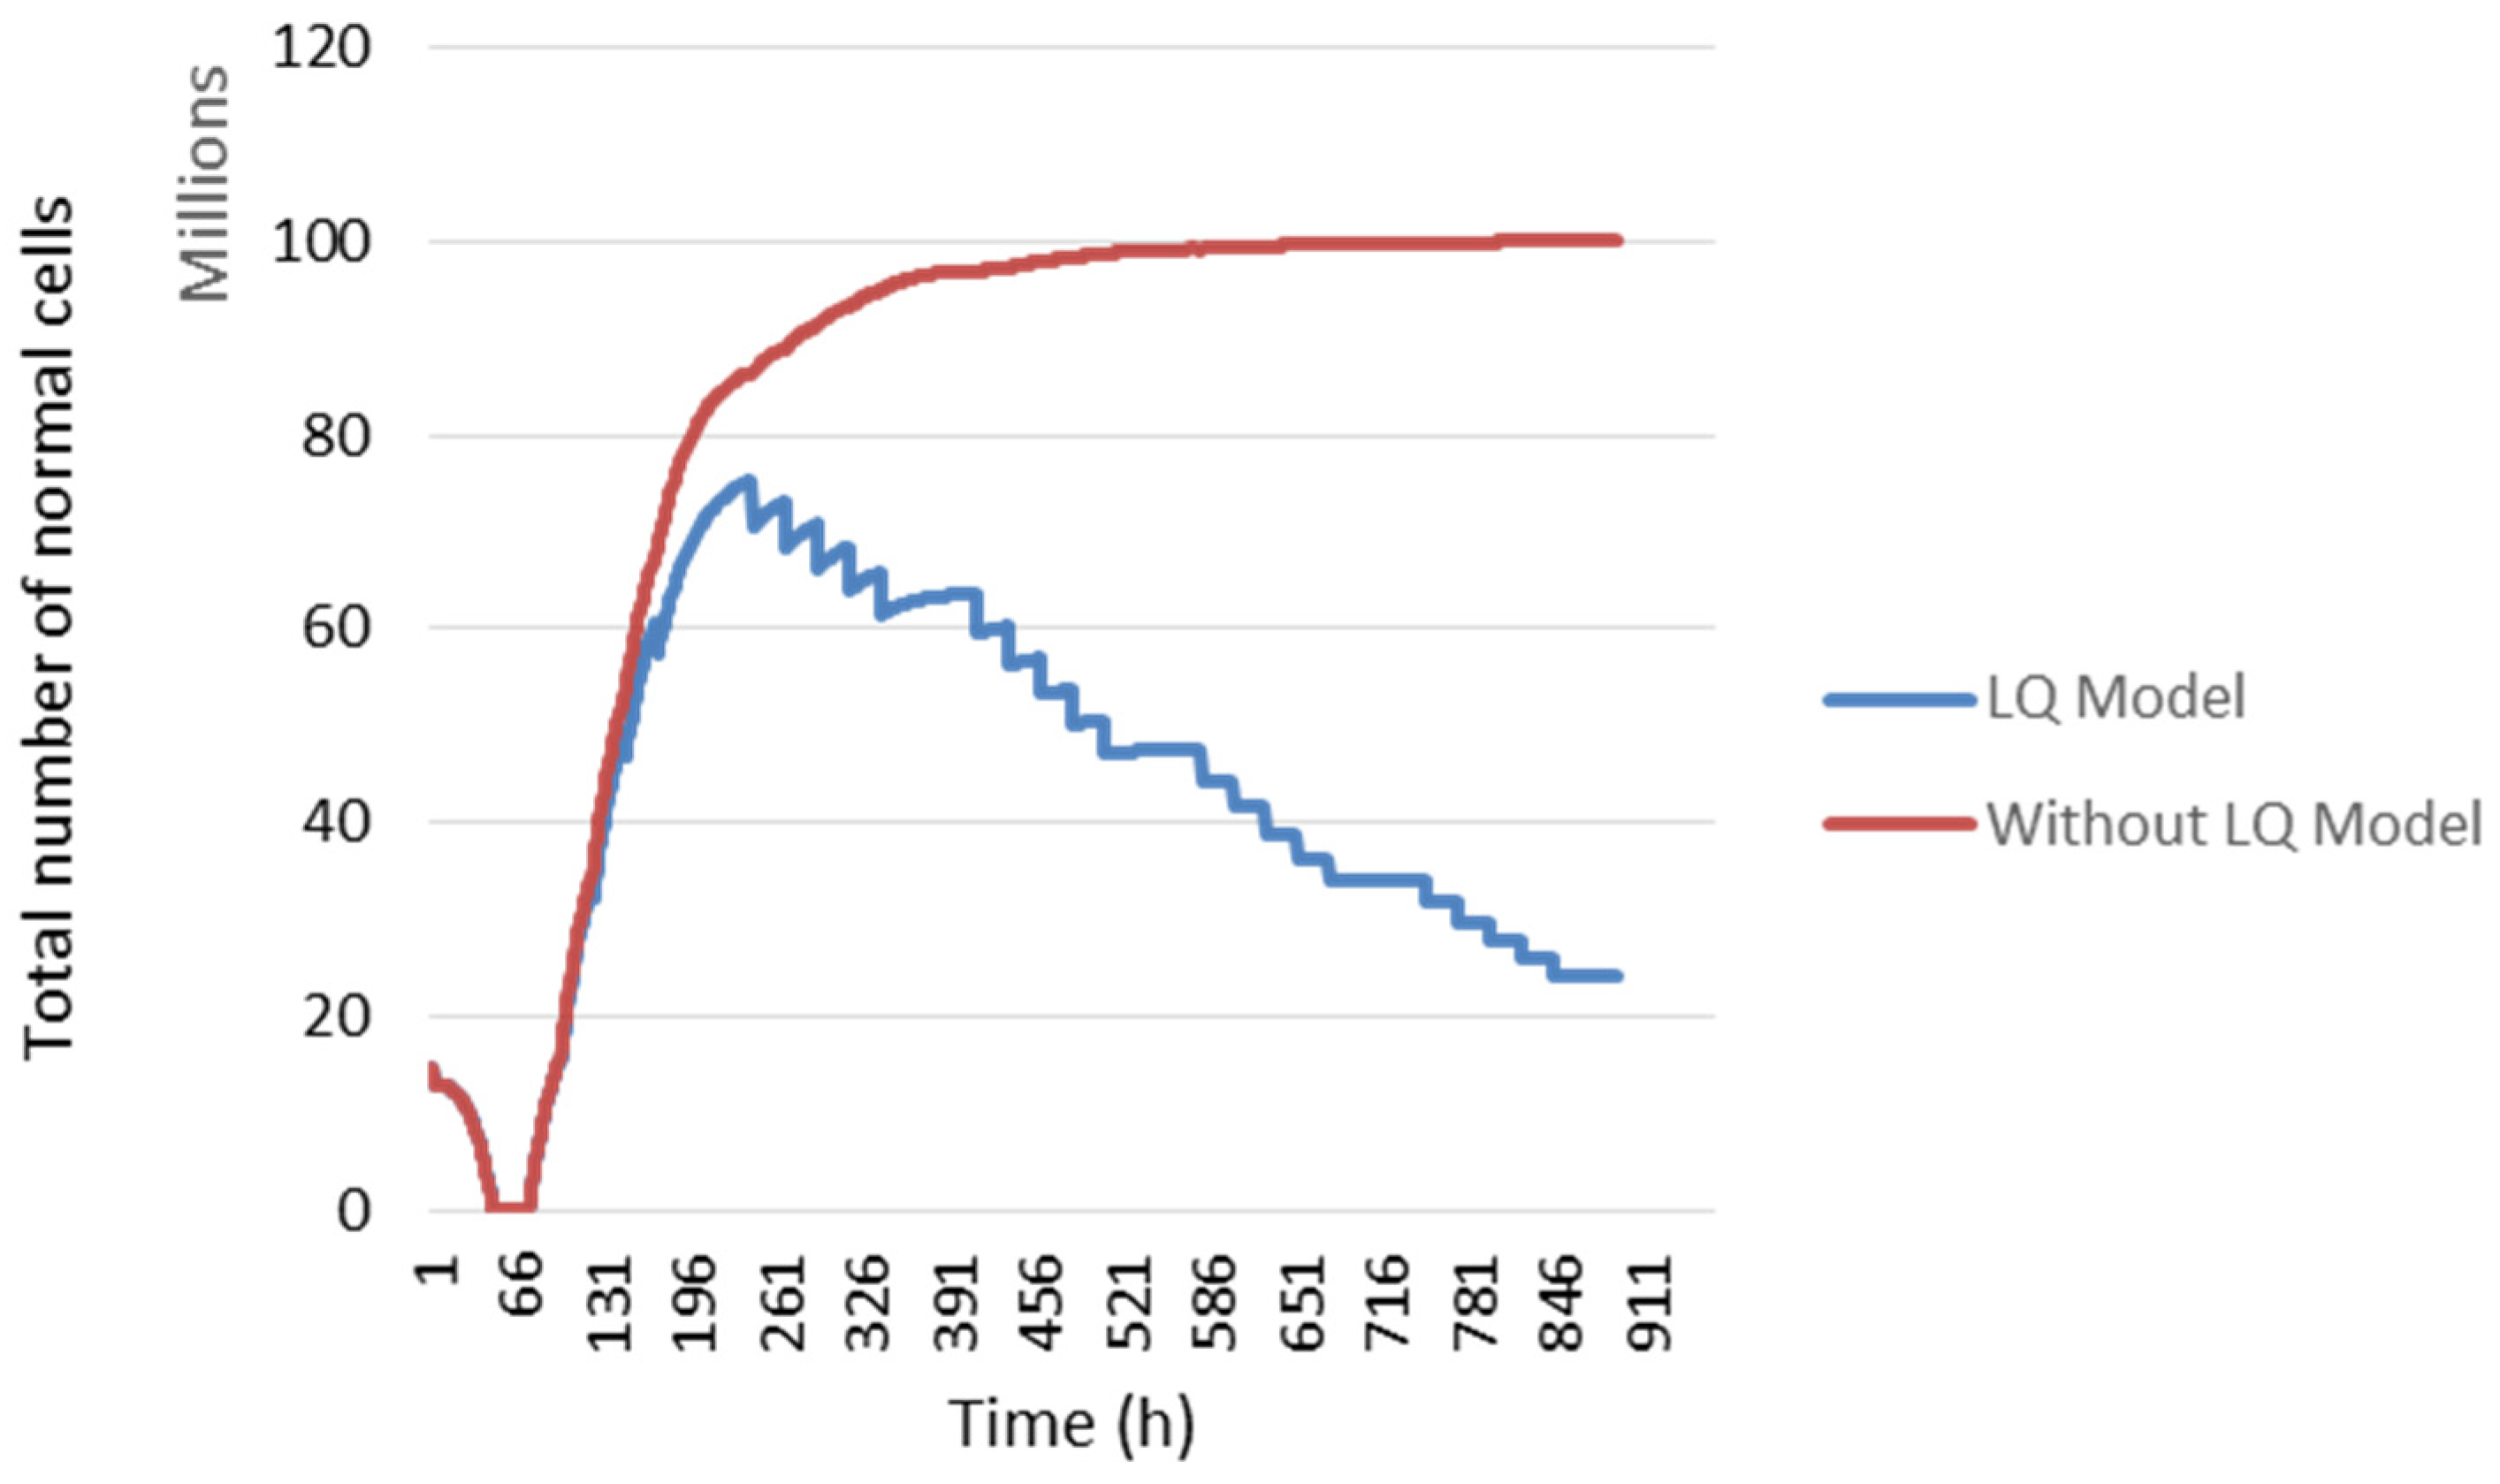
- Cell replacement: if the number of cells per voxel decreased after the resorption of dead cells, it was necessary to redistribute some new cells in the voxel to maintain cell density. For the sake of simplicity, resorbed cells were arbitrarily replaced by normal cells or capillary ones, depending on the oxygenation model.
2.3. Factors Influencing Tumour Response According to the 5 Rs
2.3.1. Repair
2.3.2. Redistribution in the Cell Cycle
2.3.3. Repopulation
2.3.4. Reoxygenation
2.3.5. Radiosensitivity
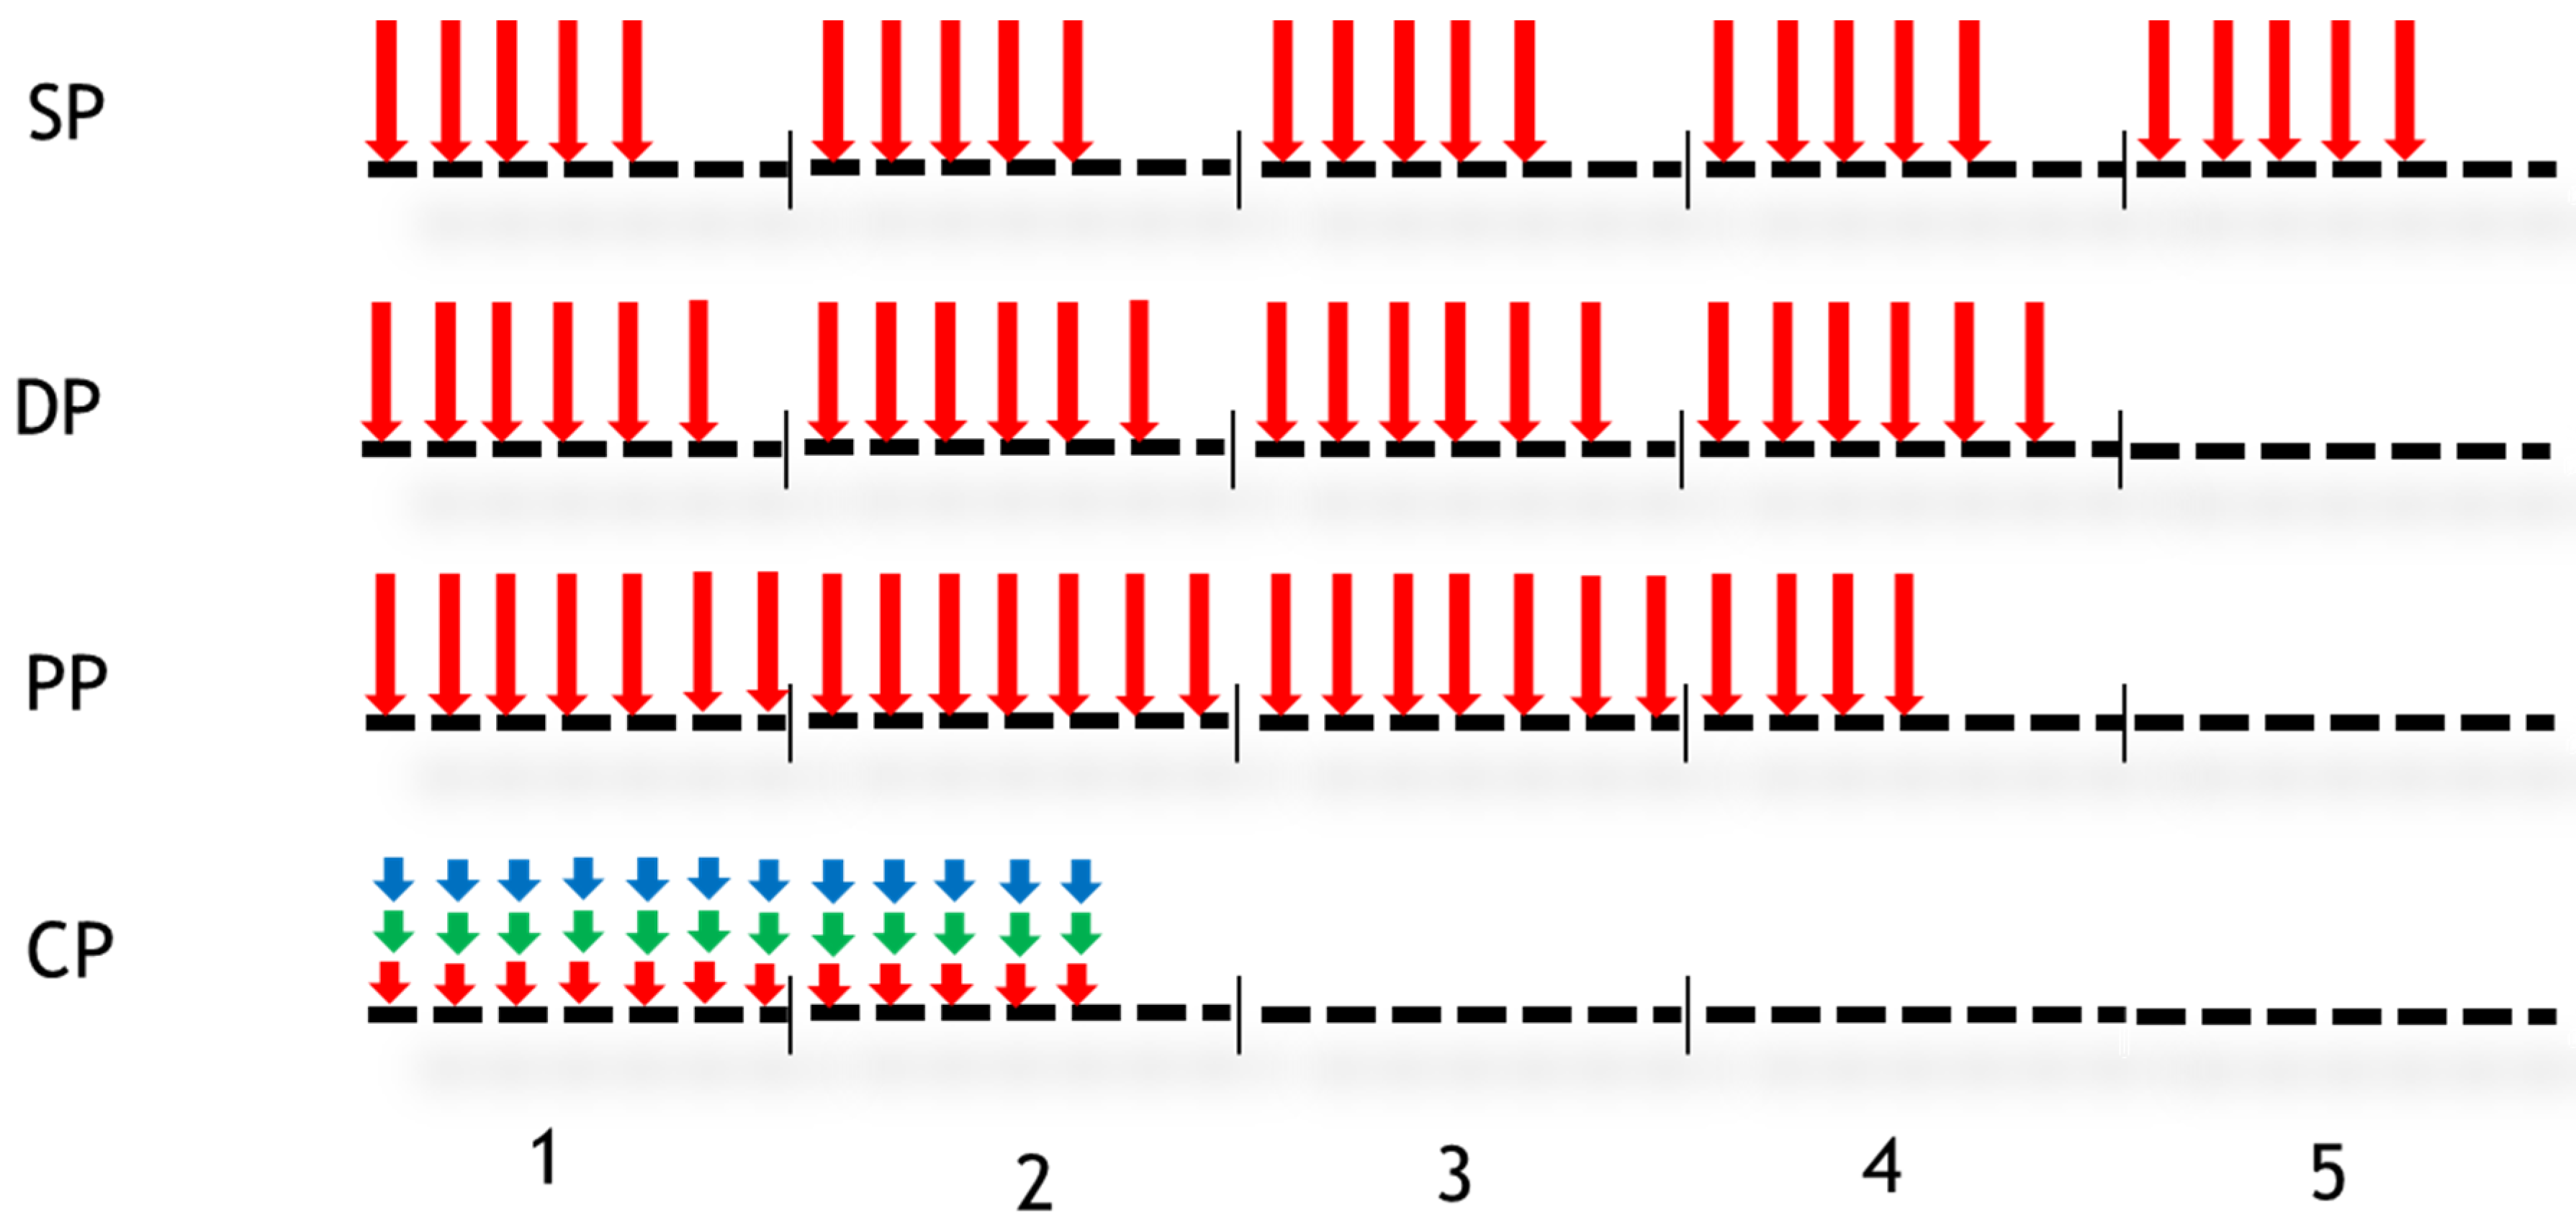
2.4. Simulations
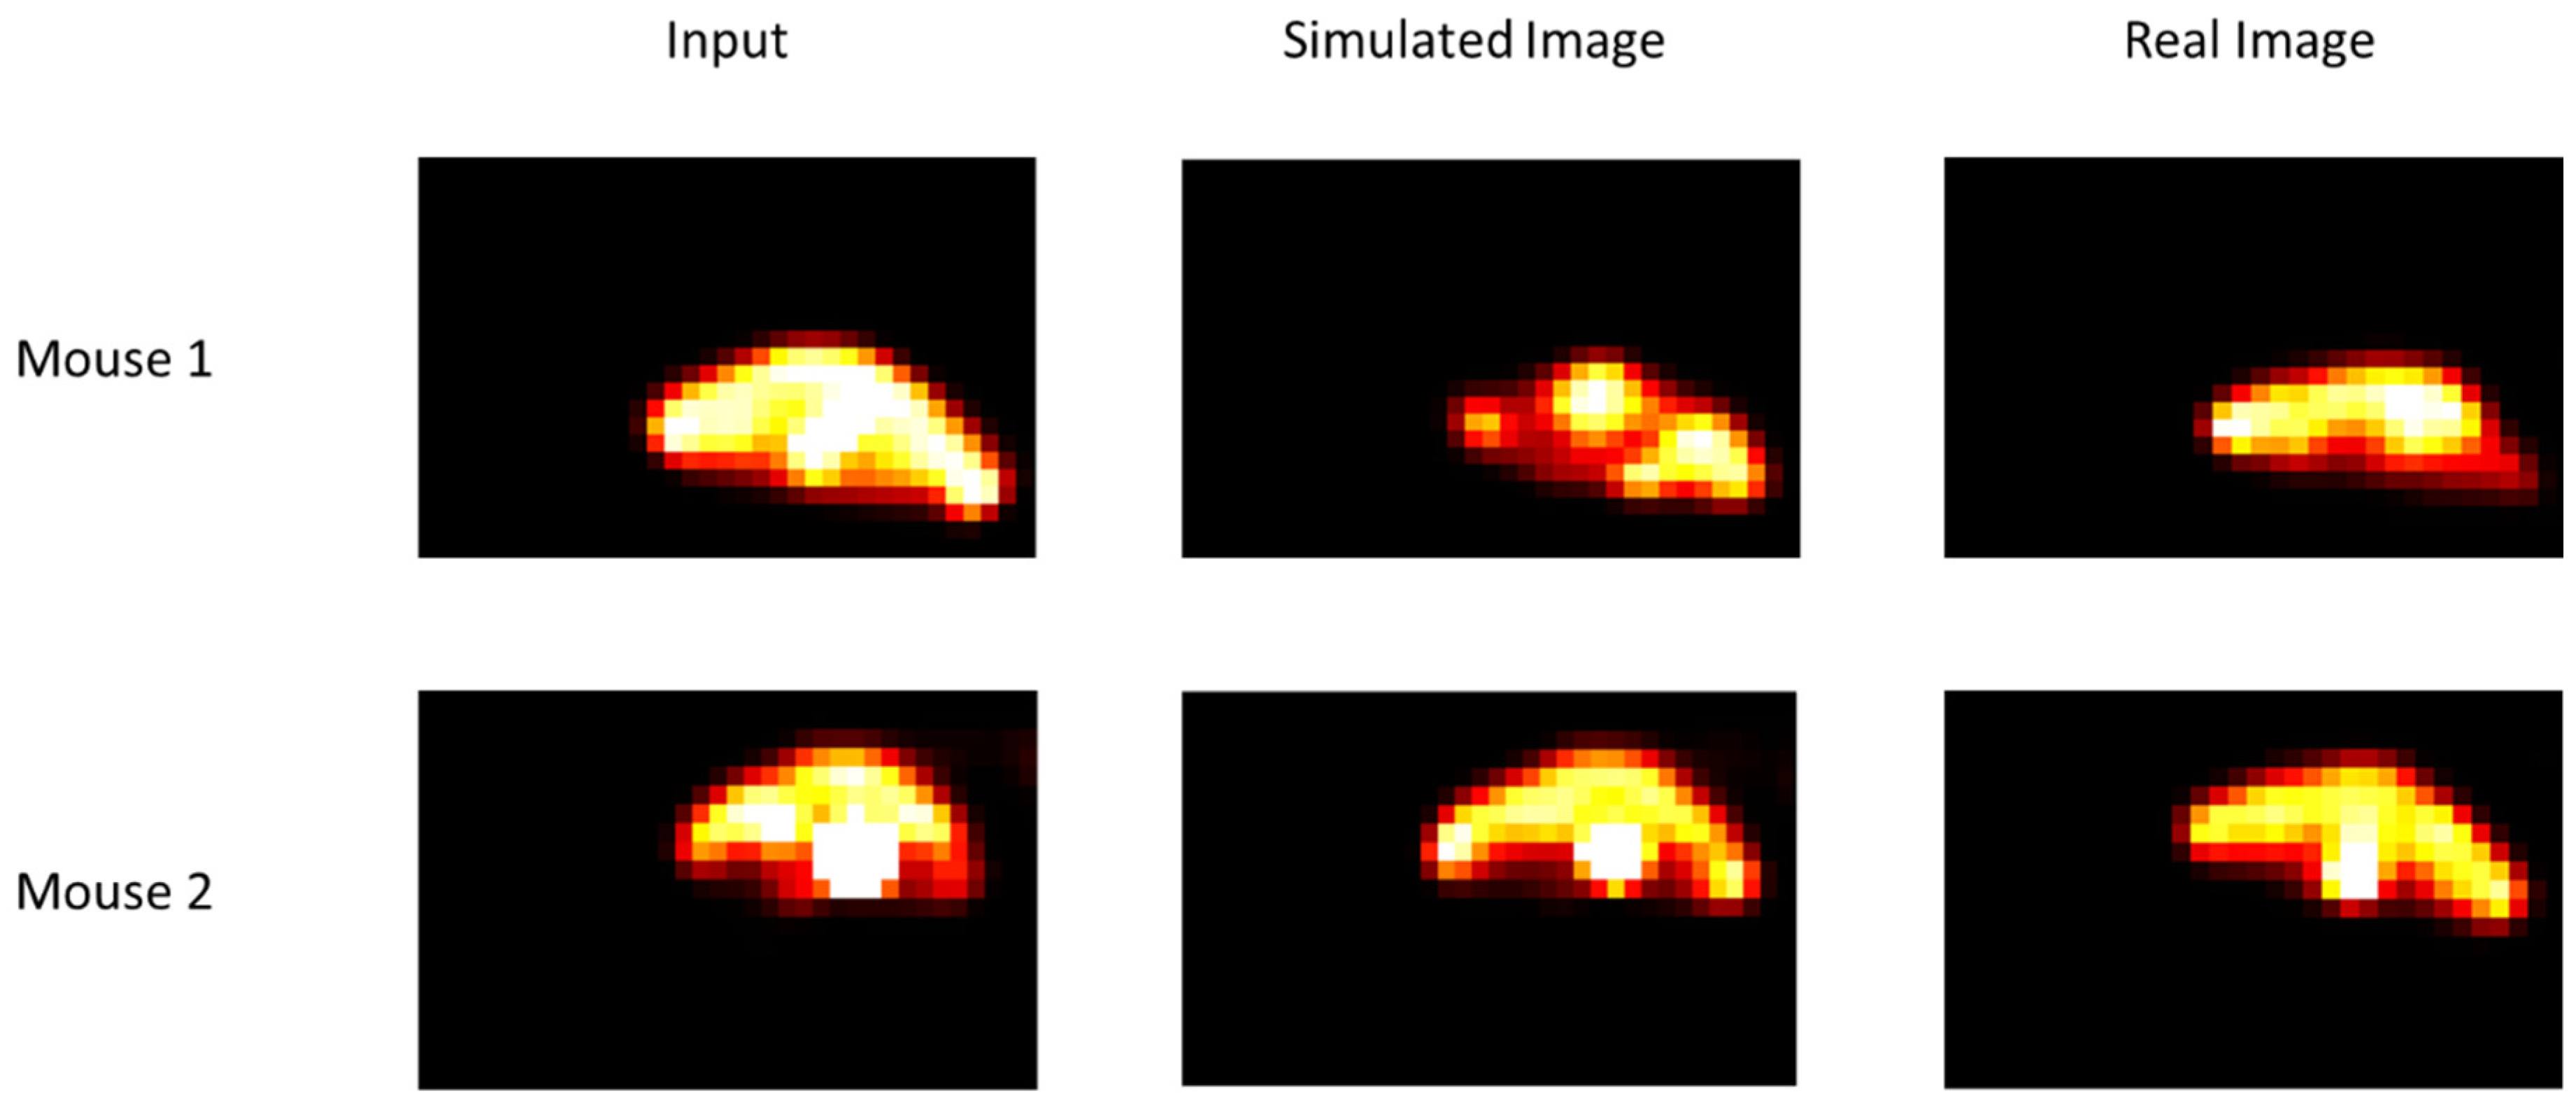
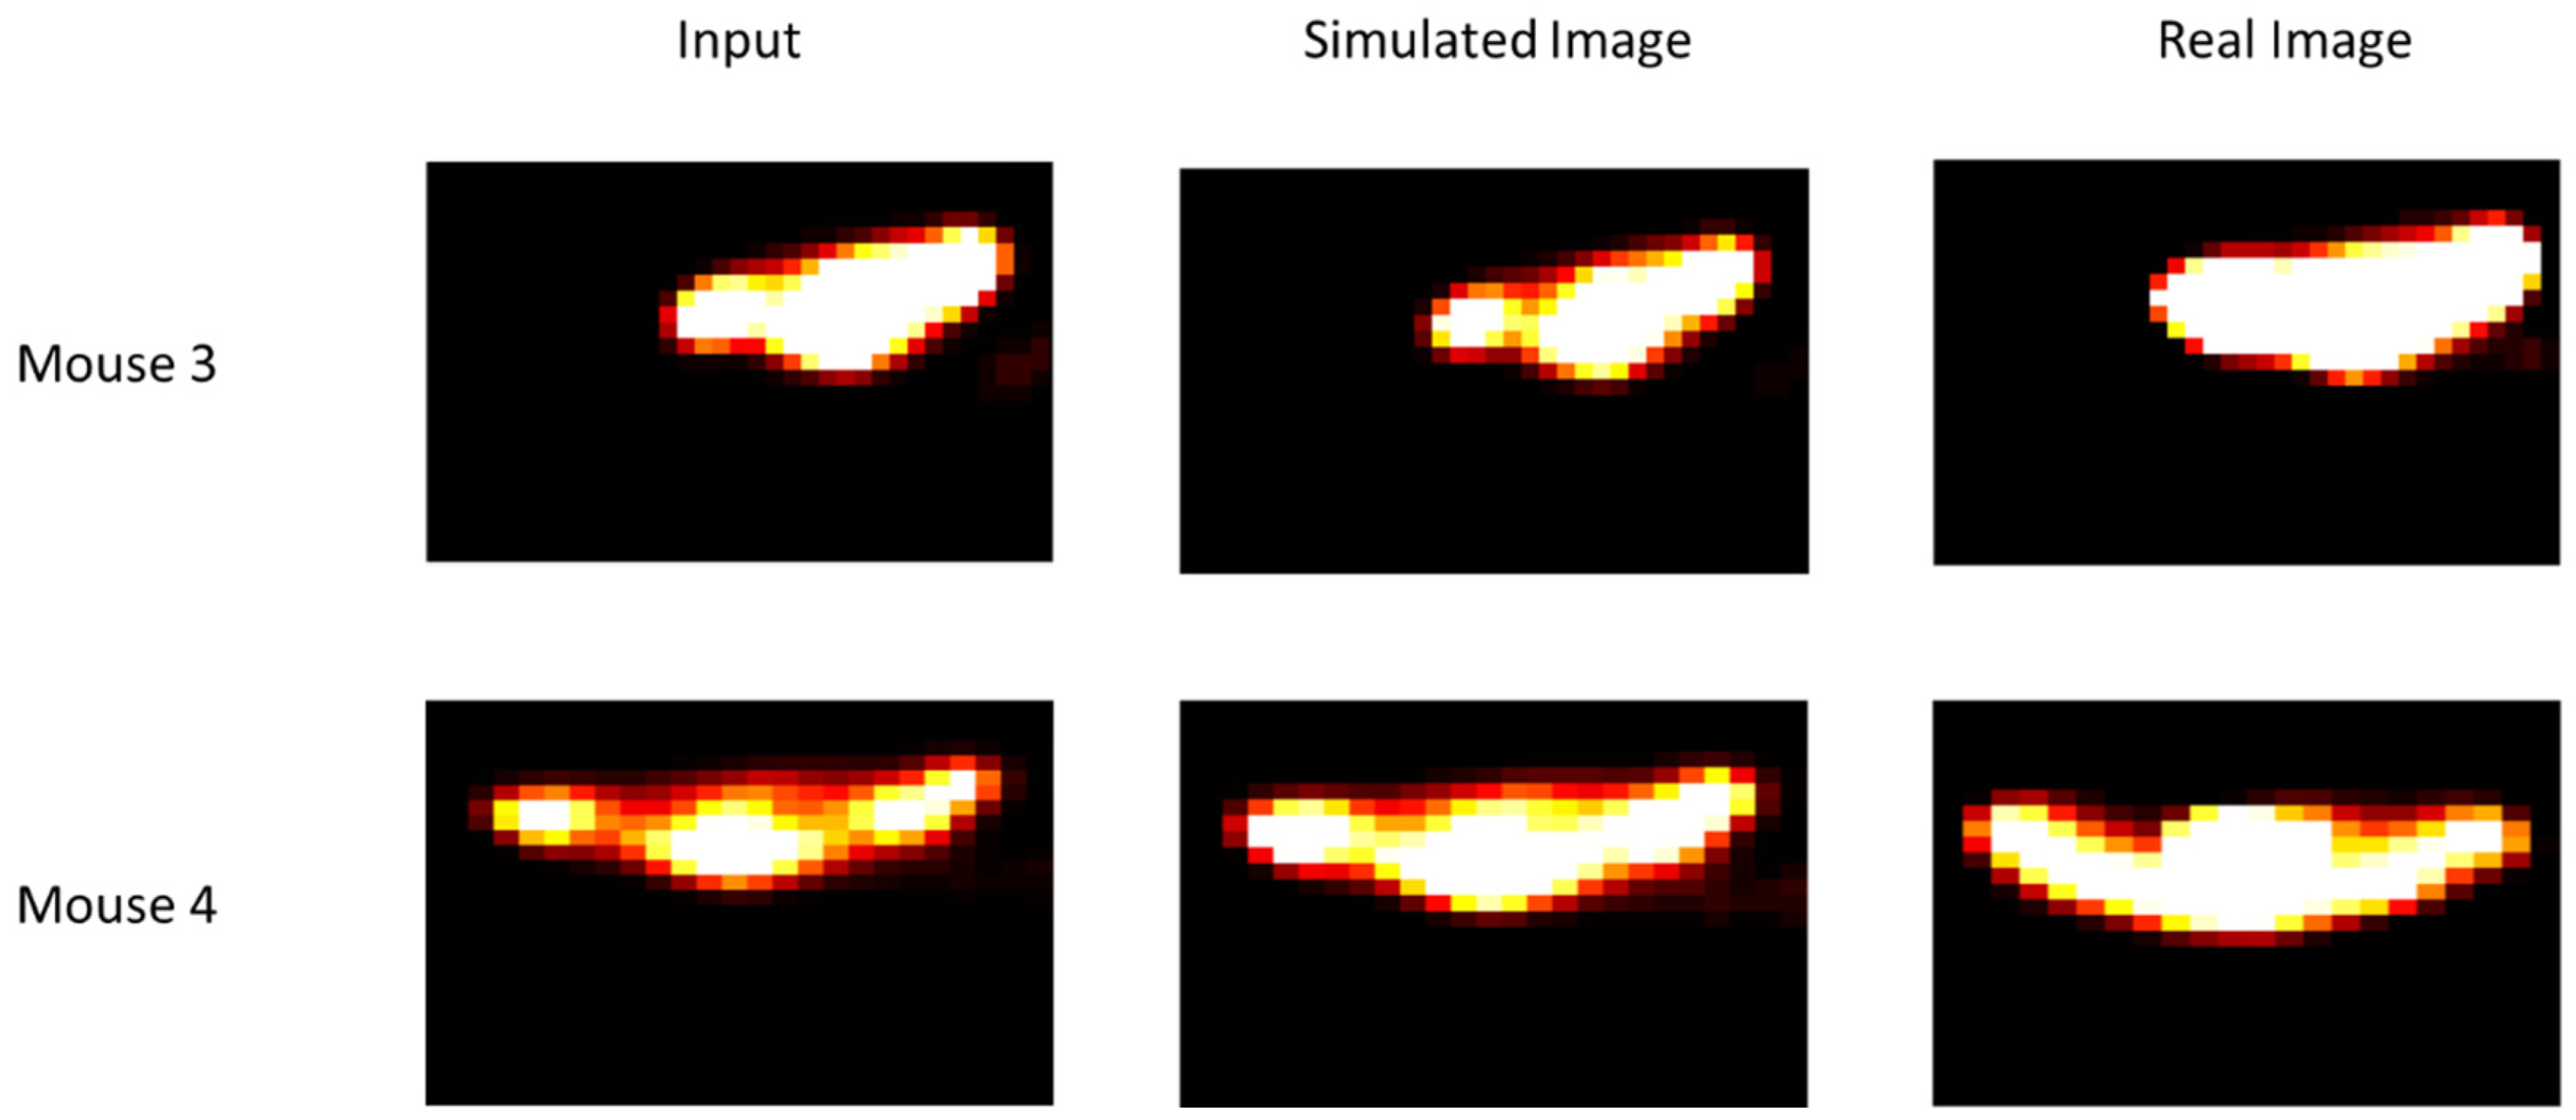
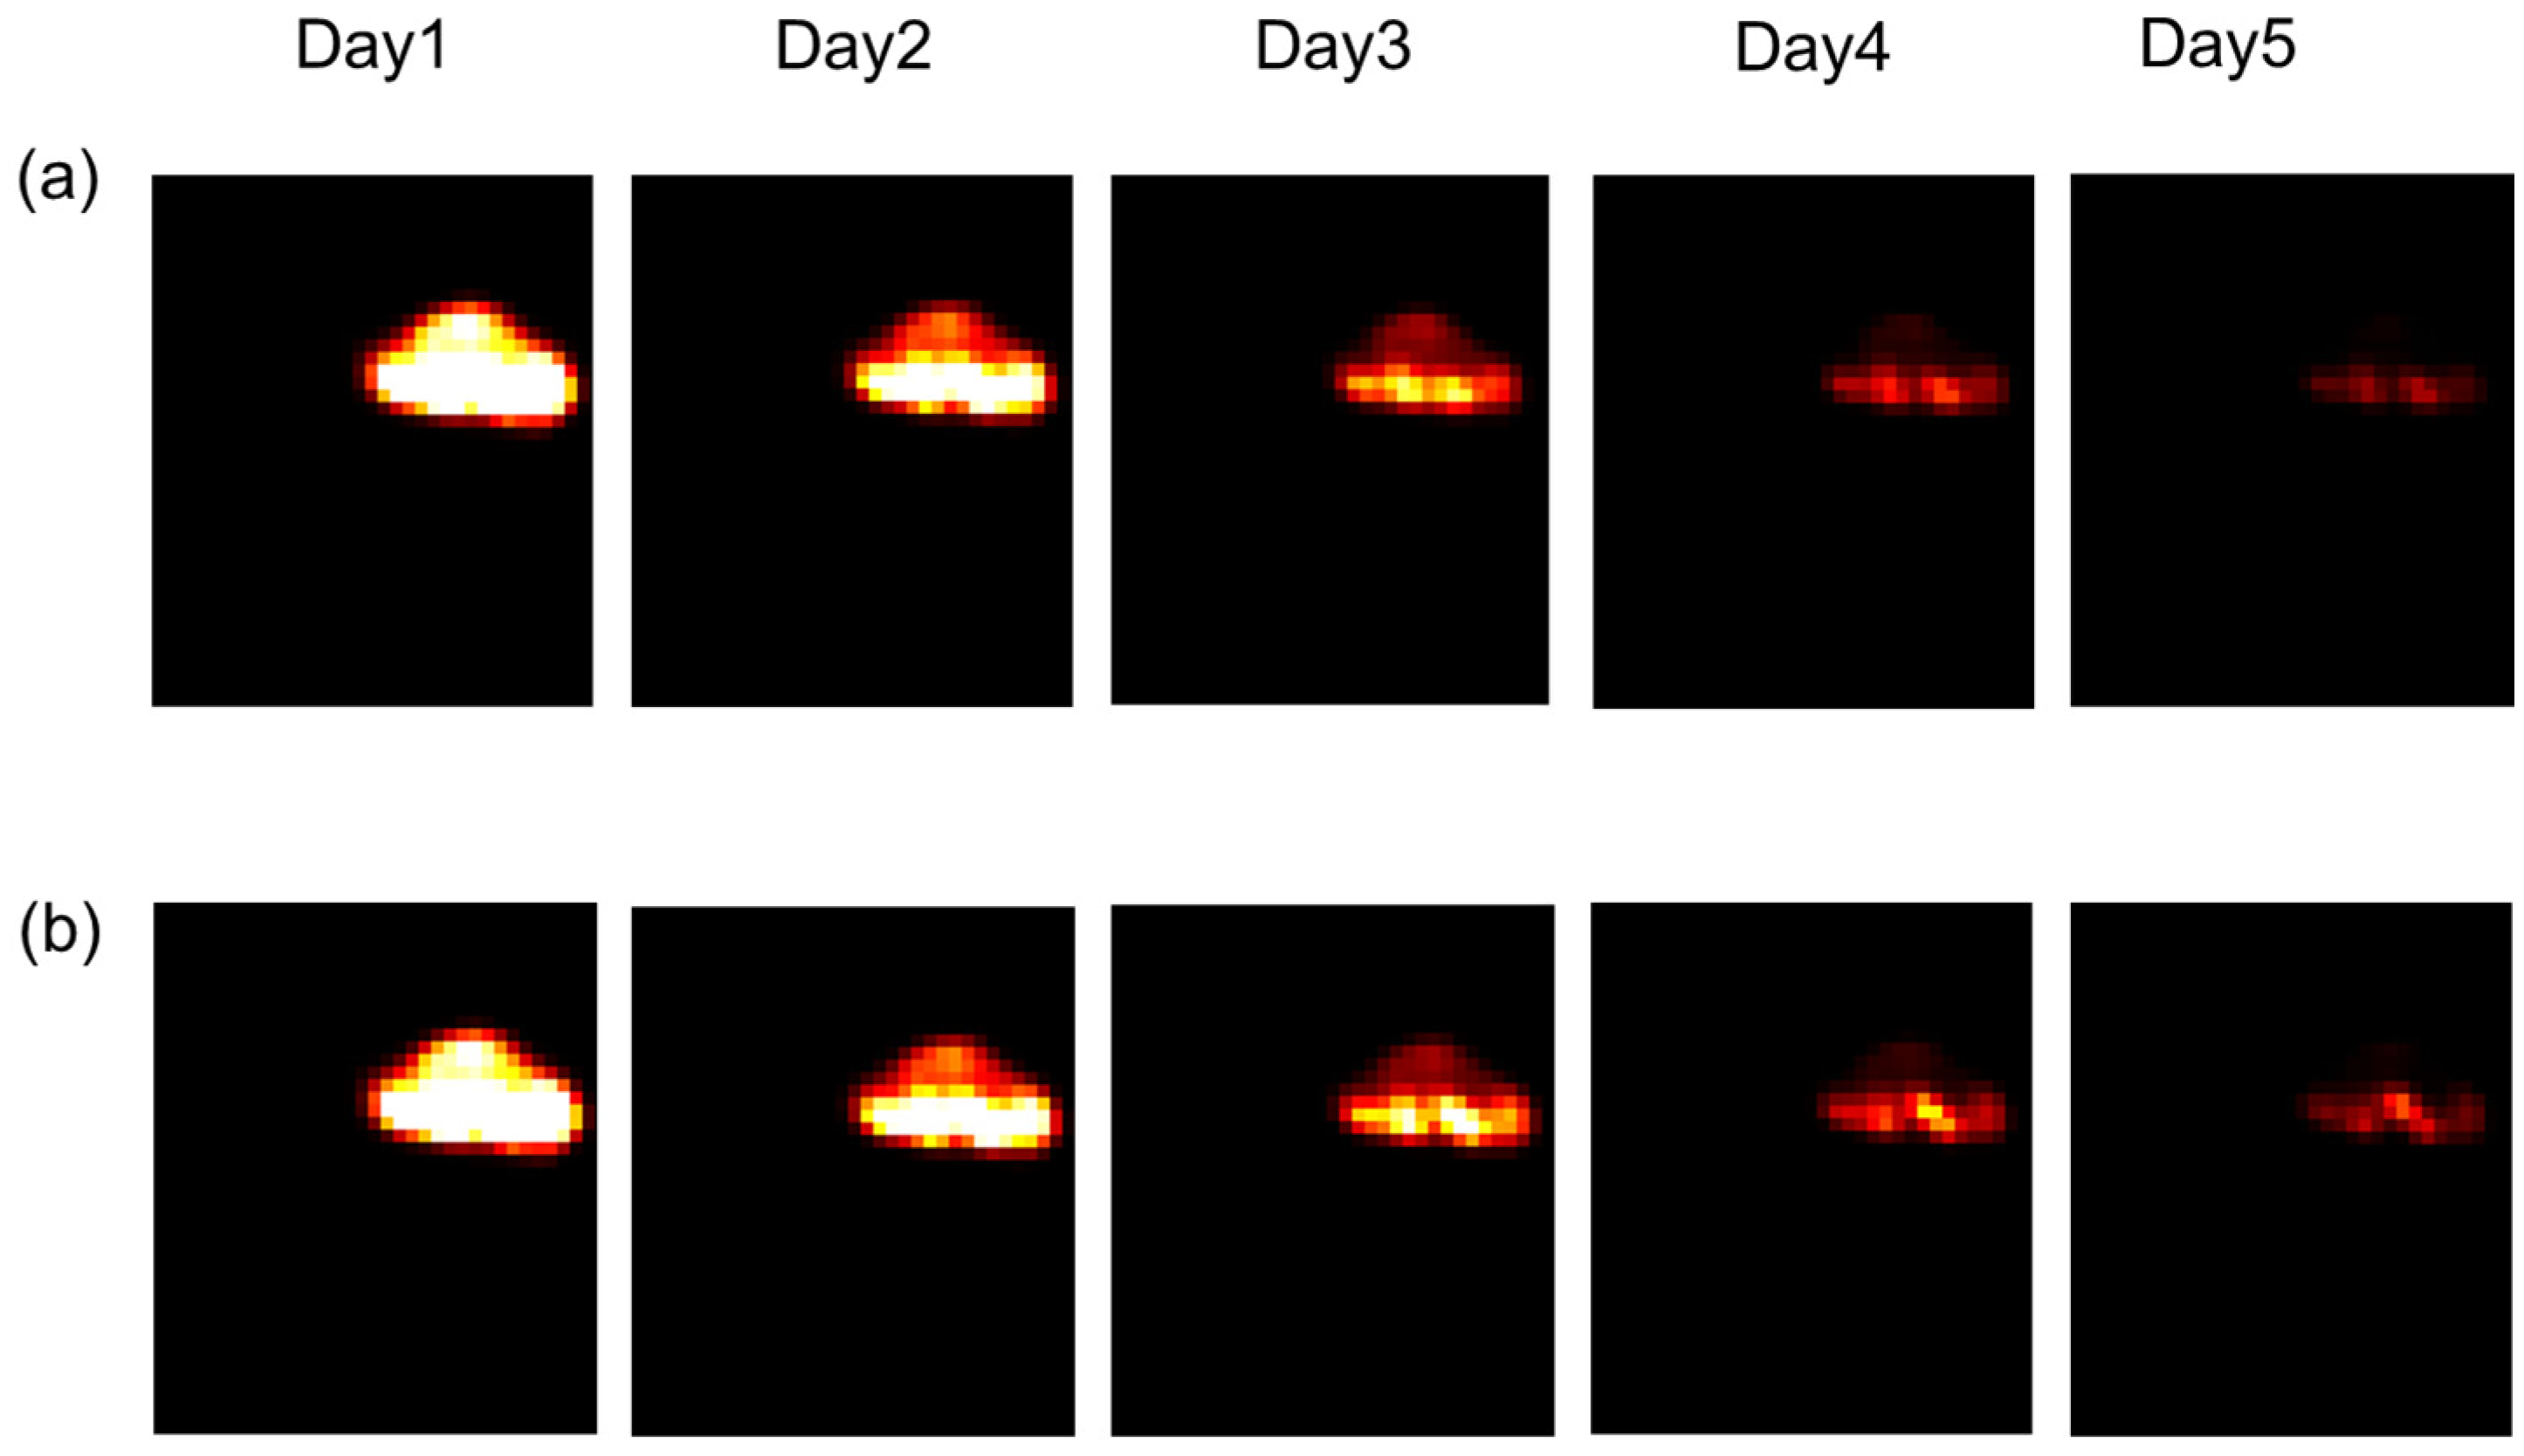
2.5. Data
- Mouse 1: NaCl + 95% oxygen;
- Mouse 2: TH-302 + 95% oxygen;
- Mouse 3: NaCl + 7% oxygen;
- Mouse 4: TH-302 + 7% oxygen.
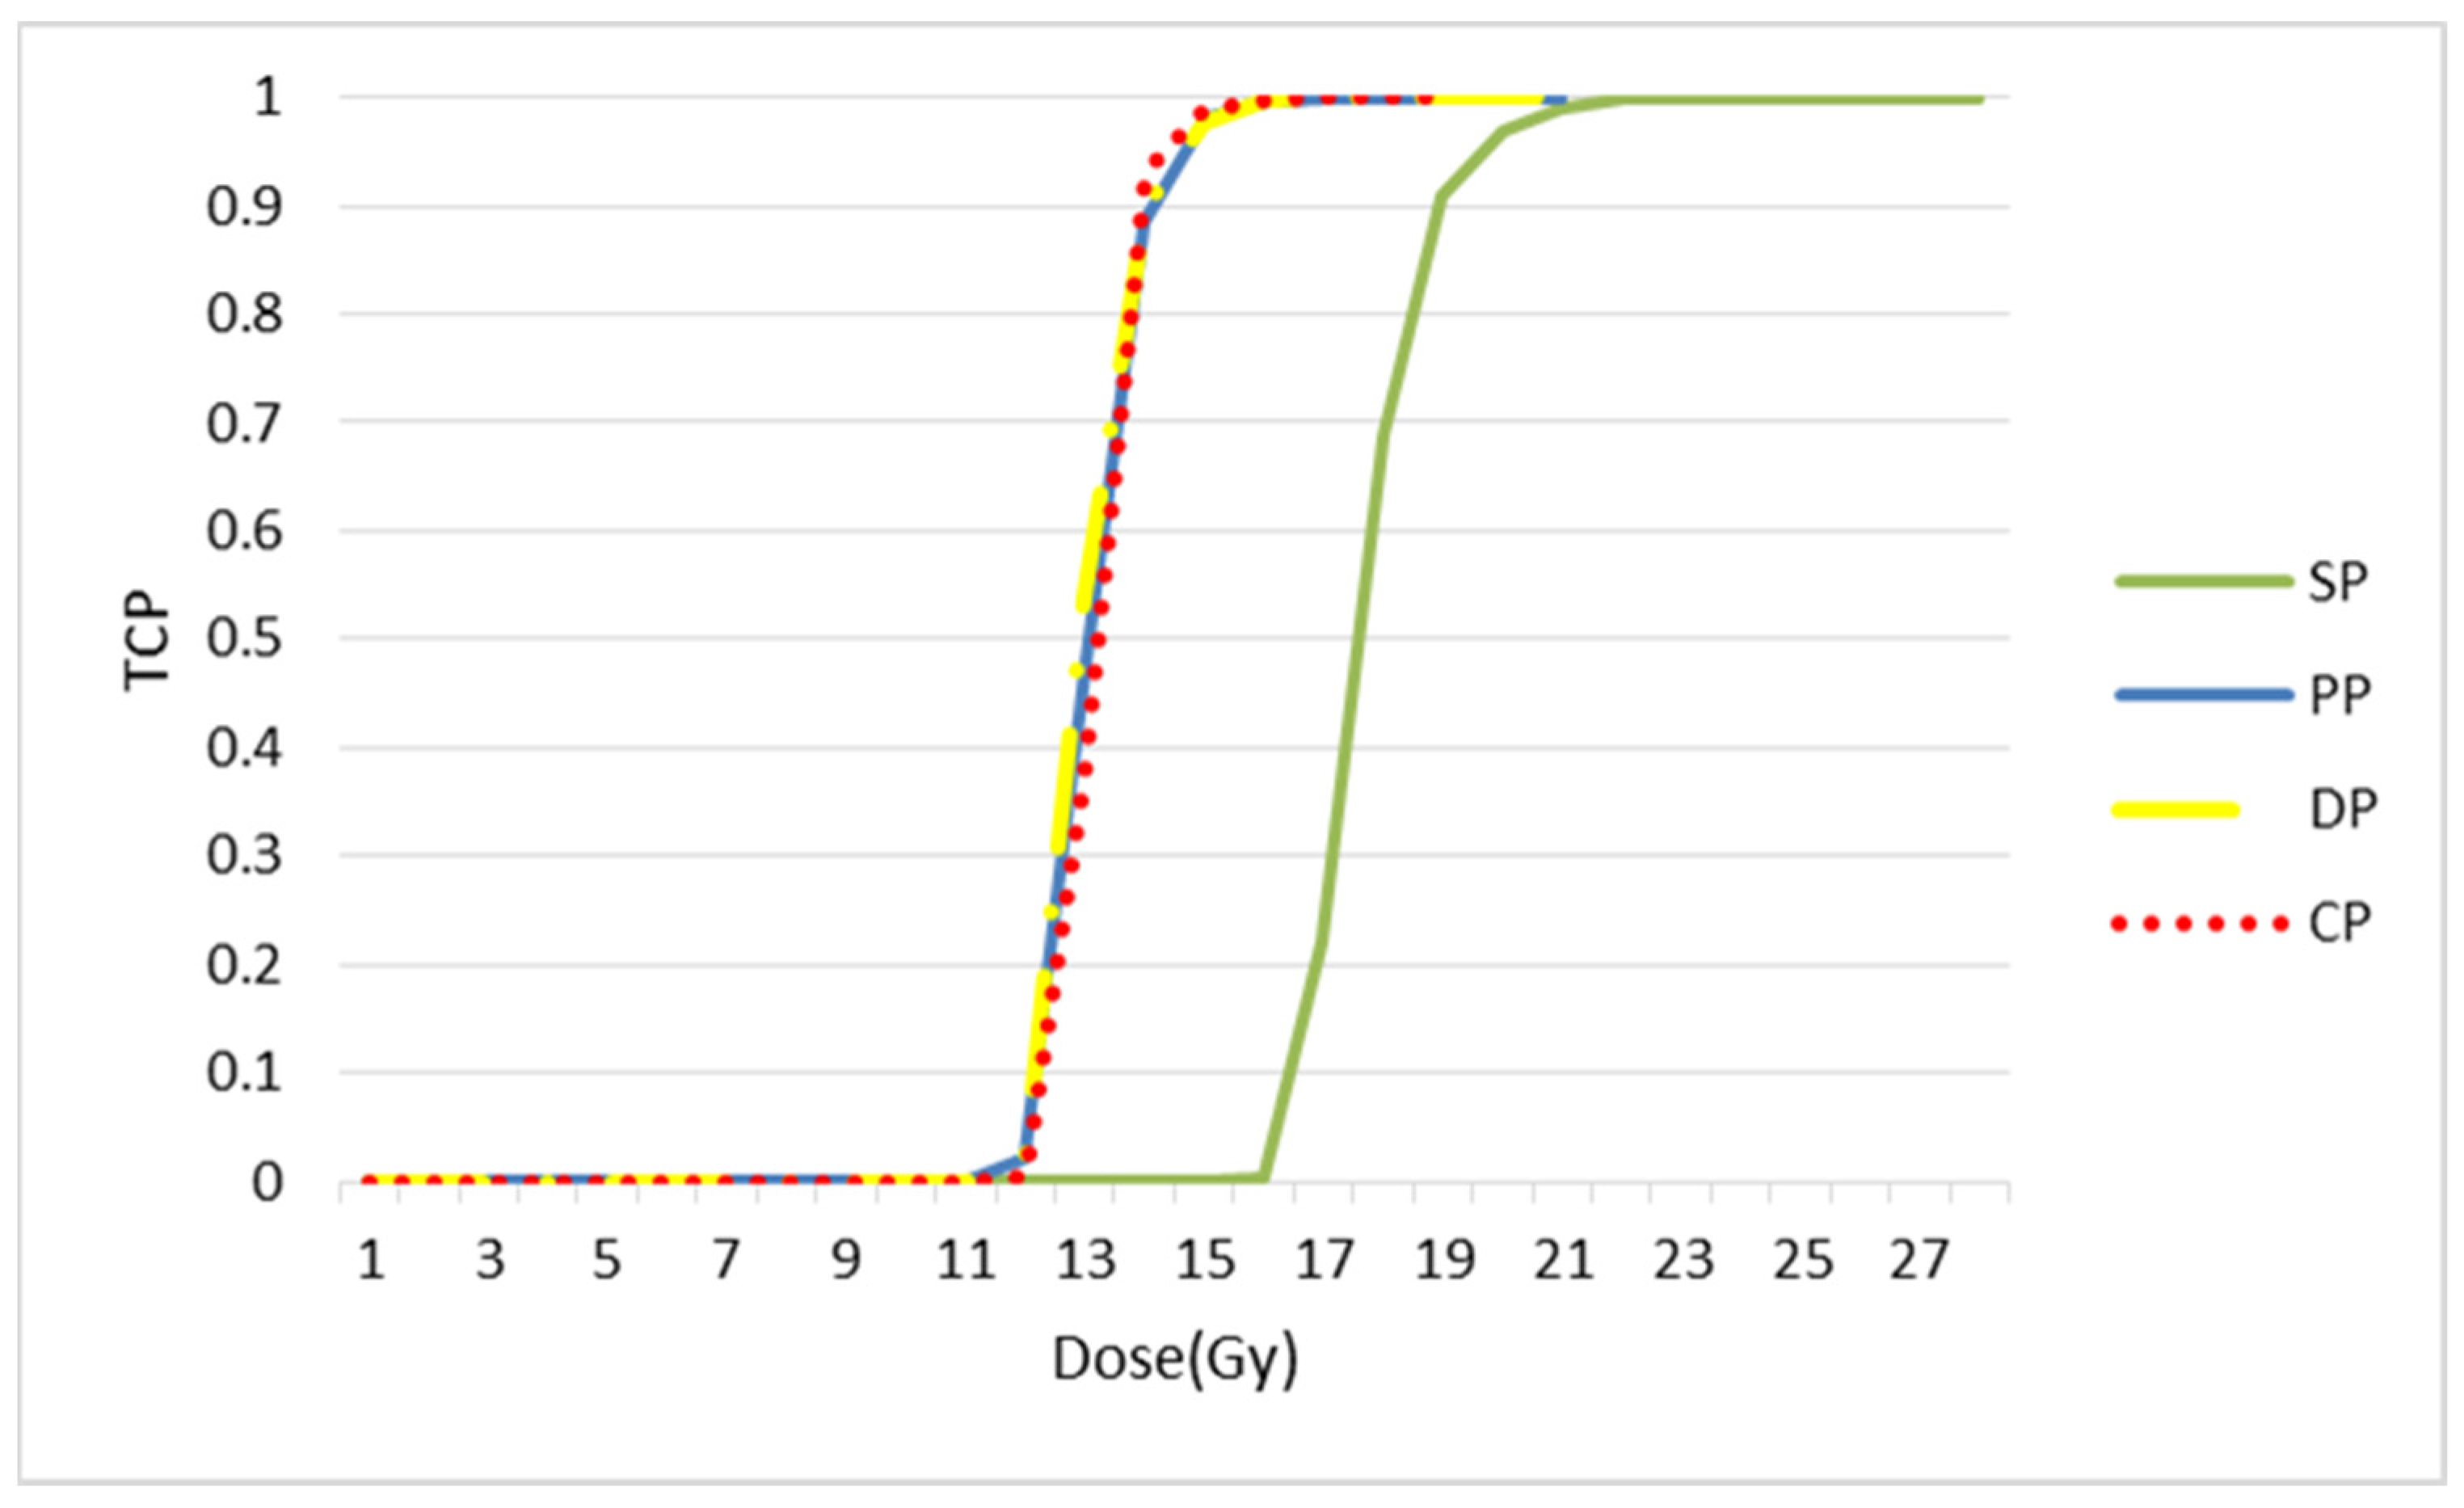
2.6. Tumour Control Probability (TCP)
3. Results
3.1. Repair
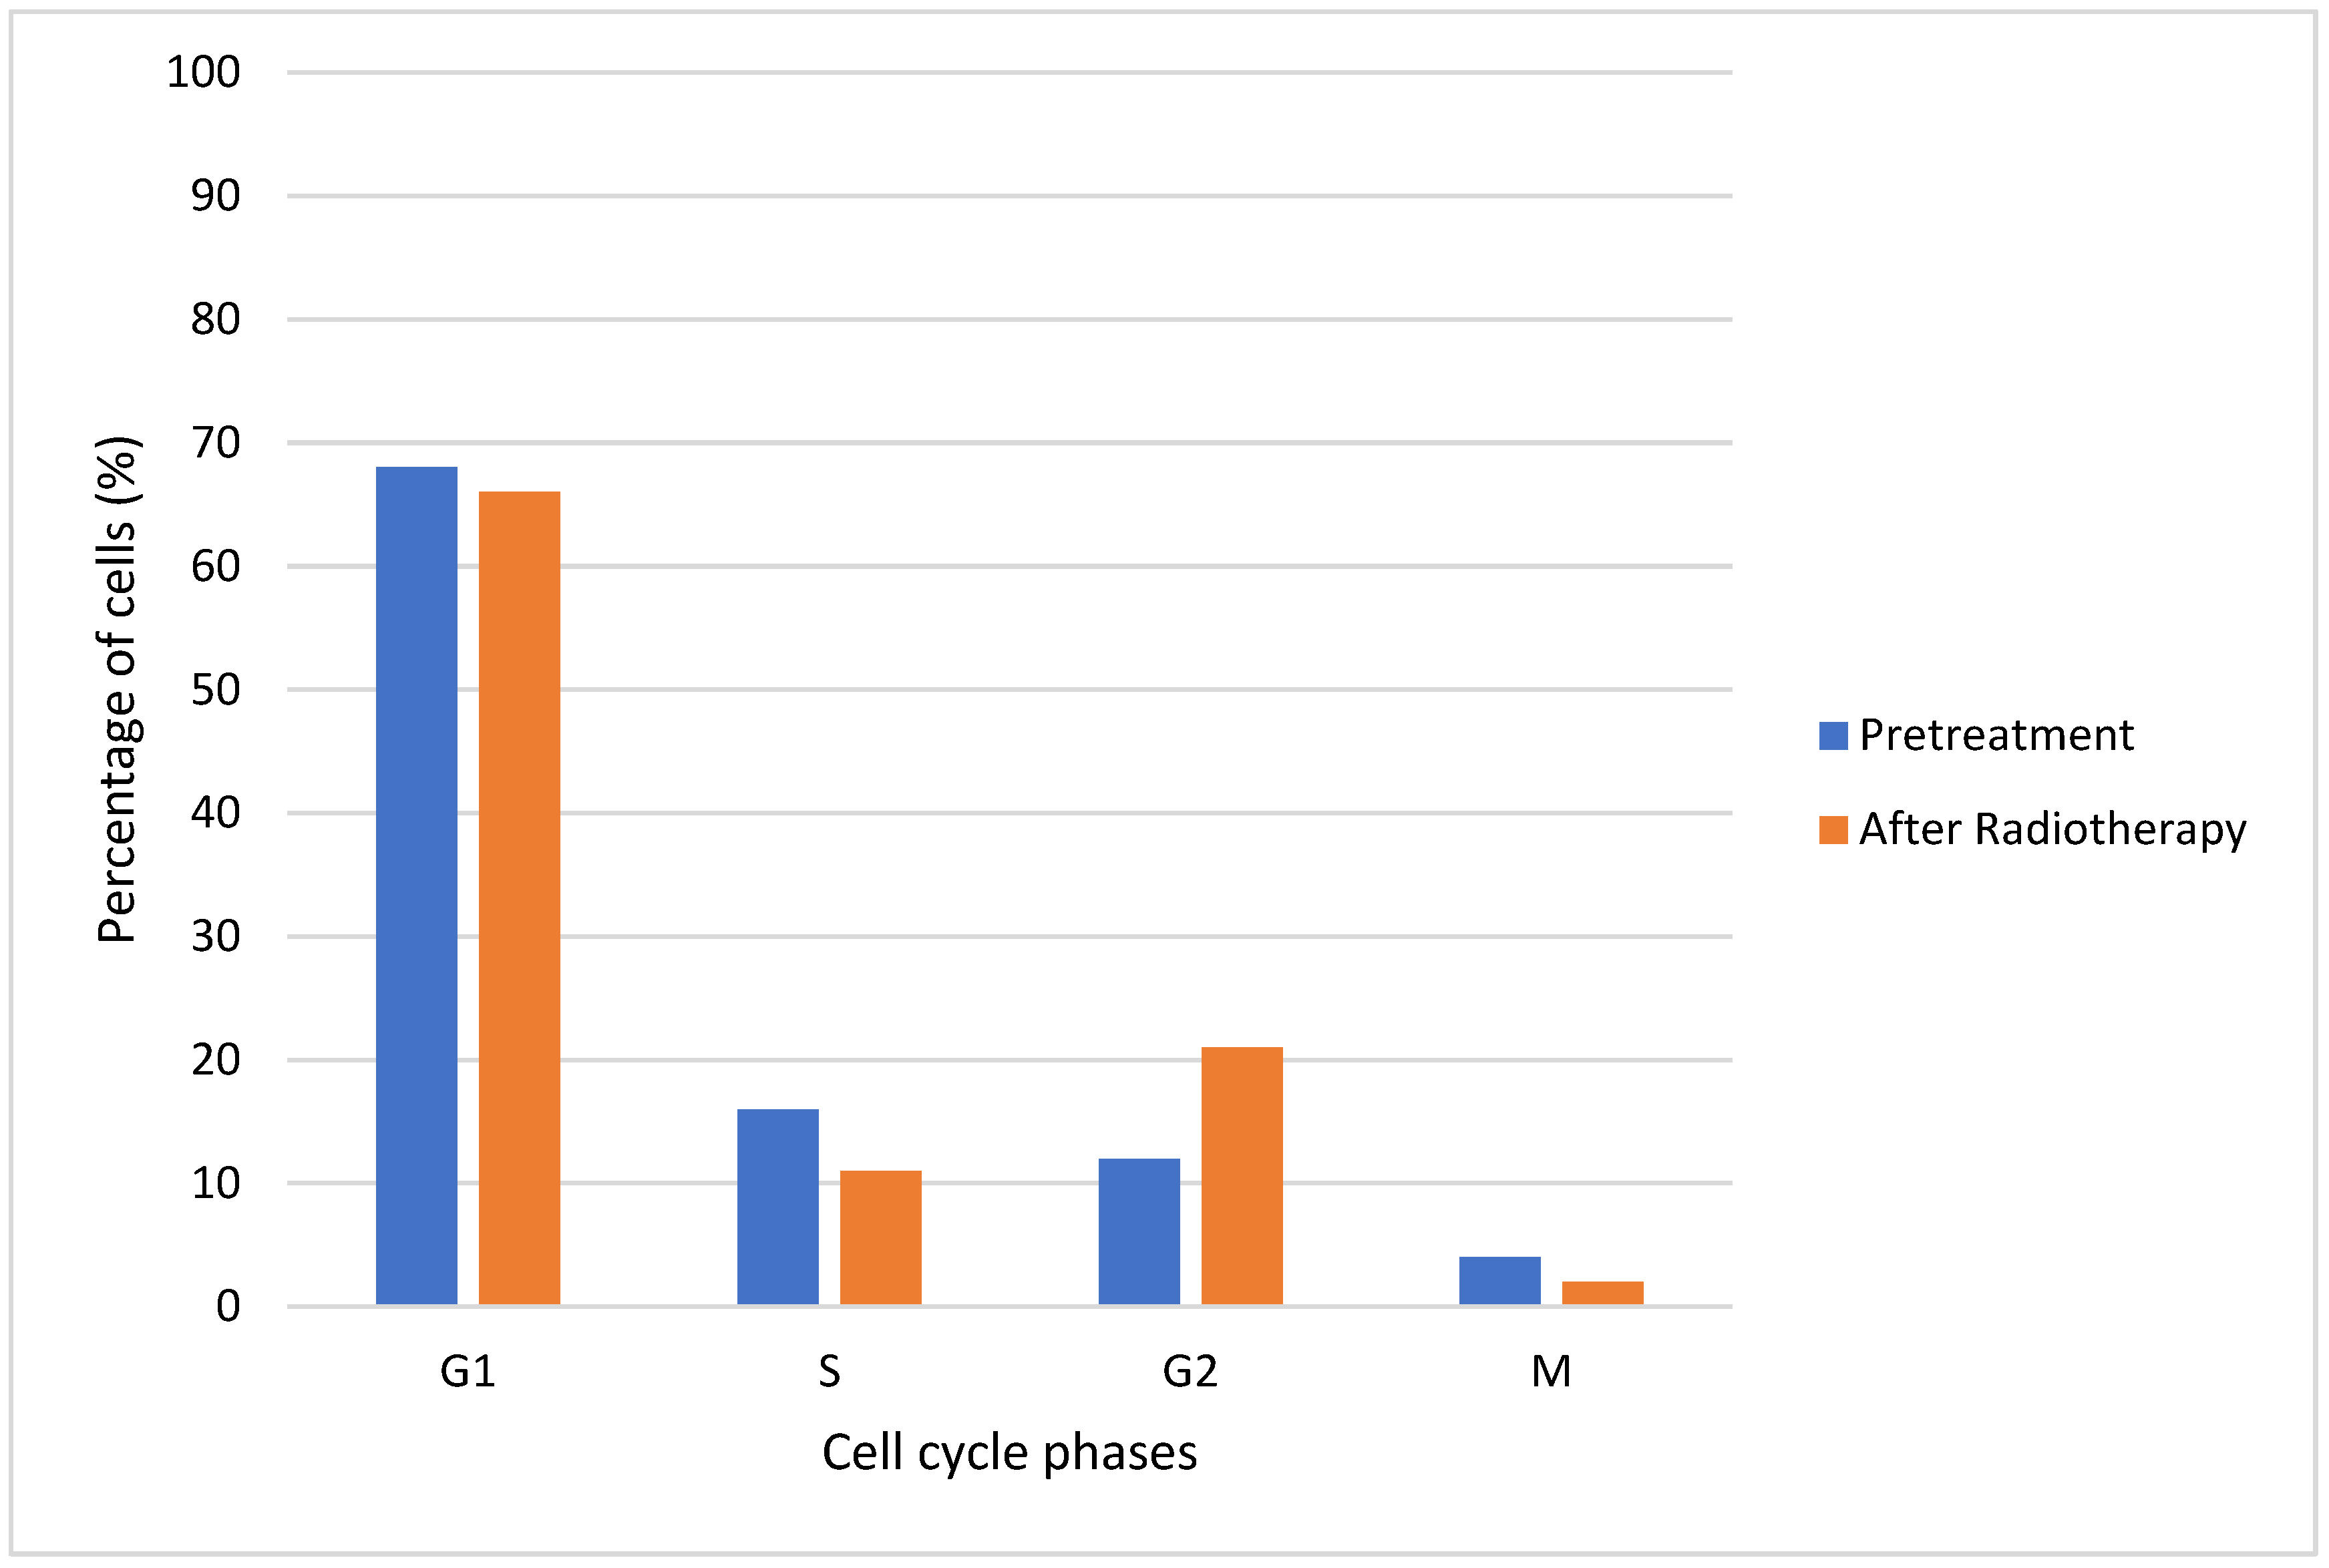
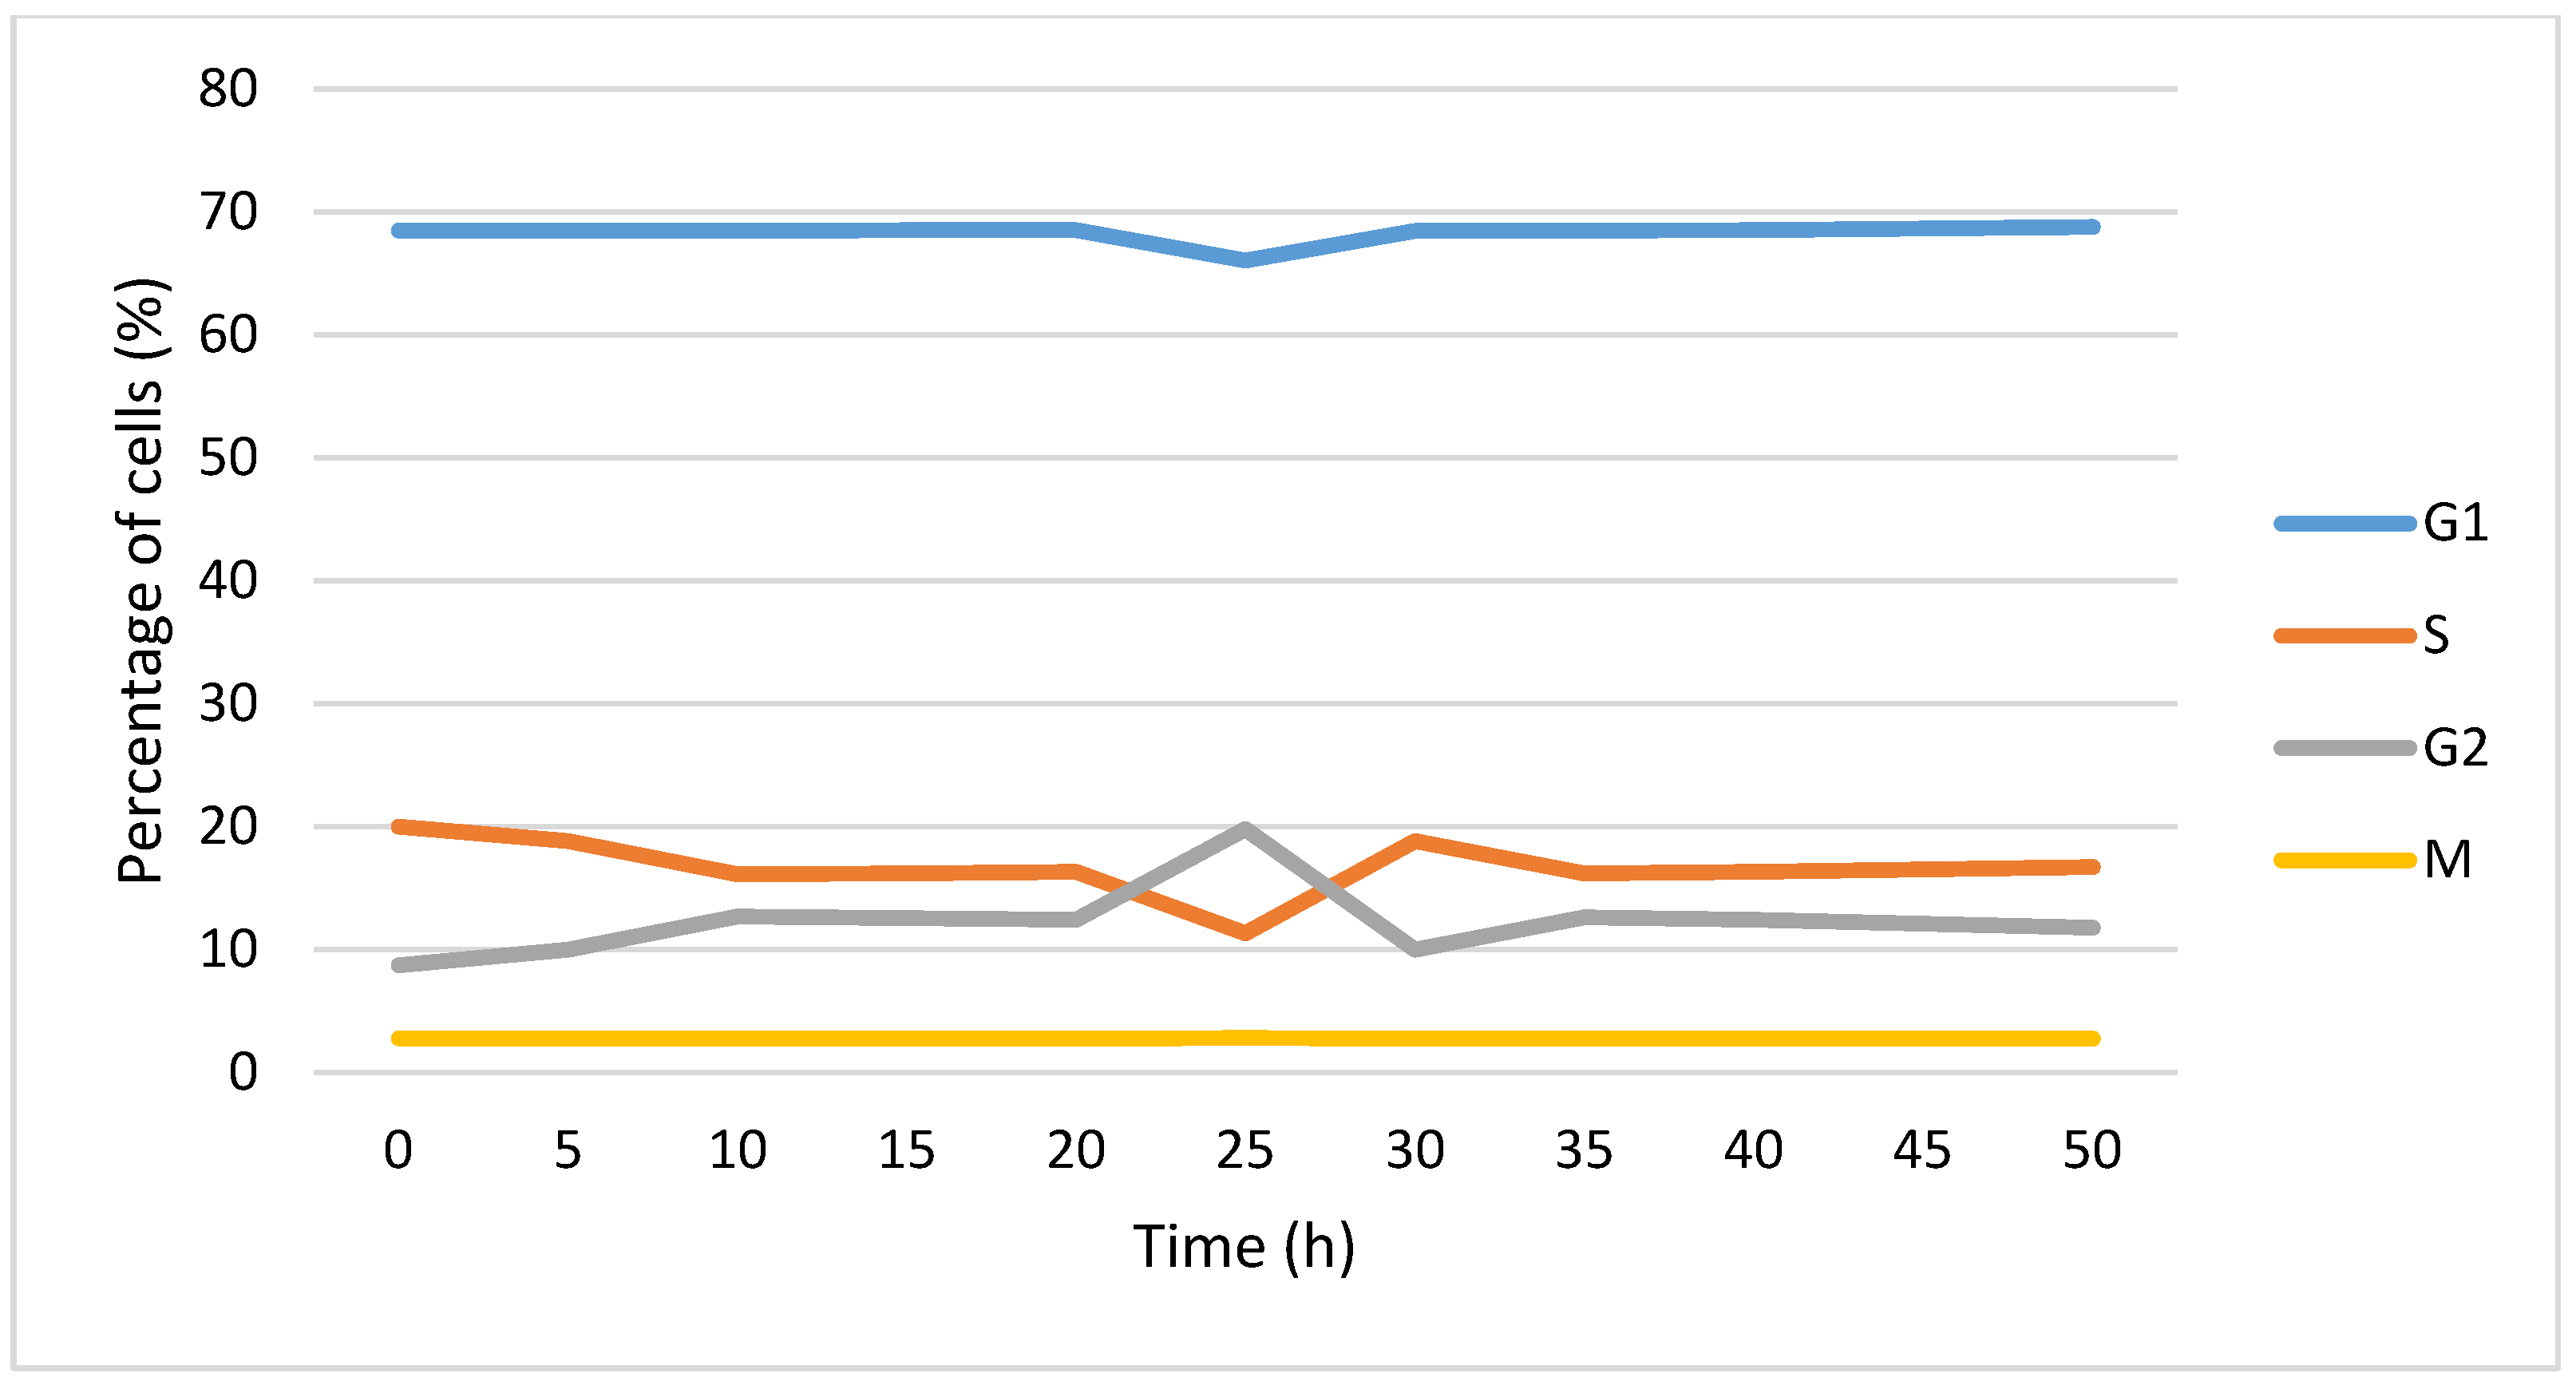
3.2. Redistribution in the Cell Cycle
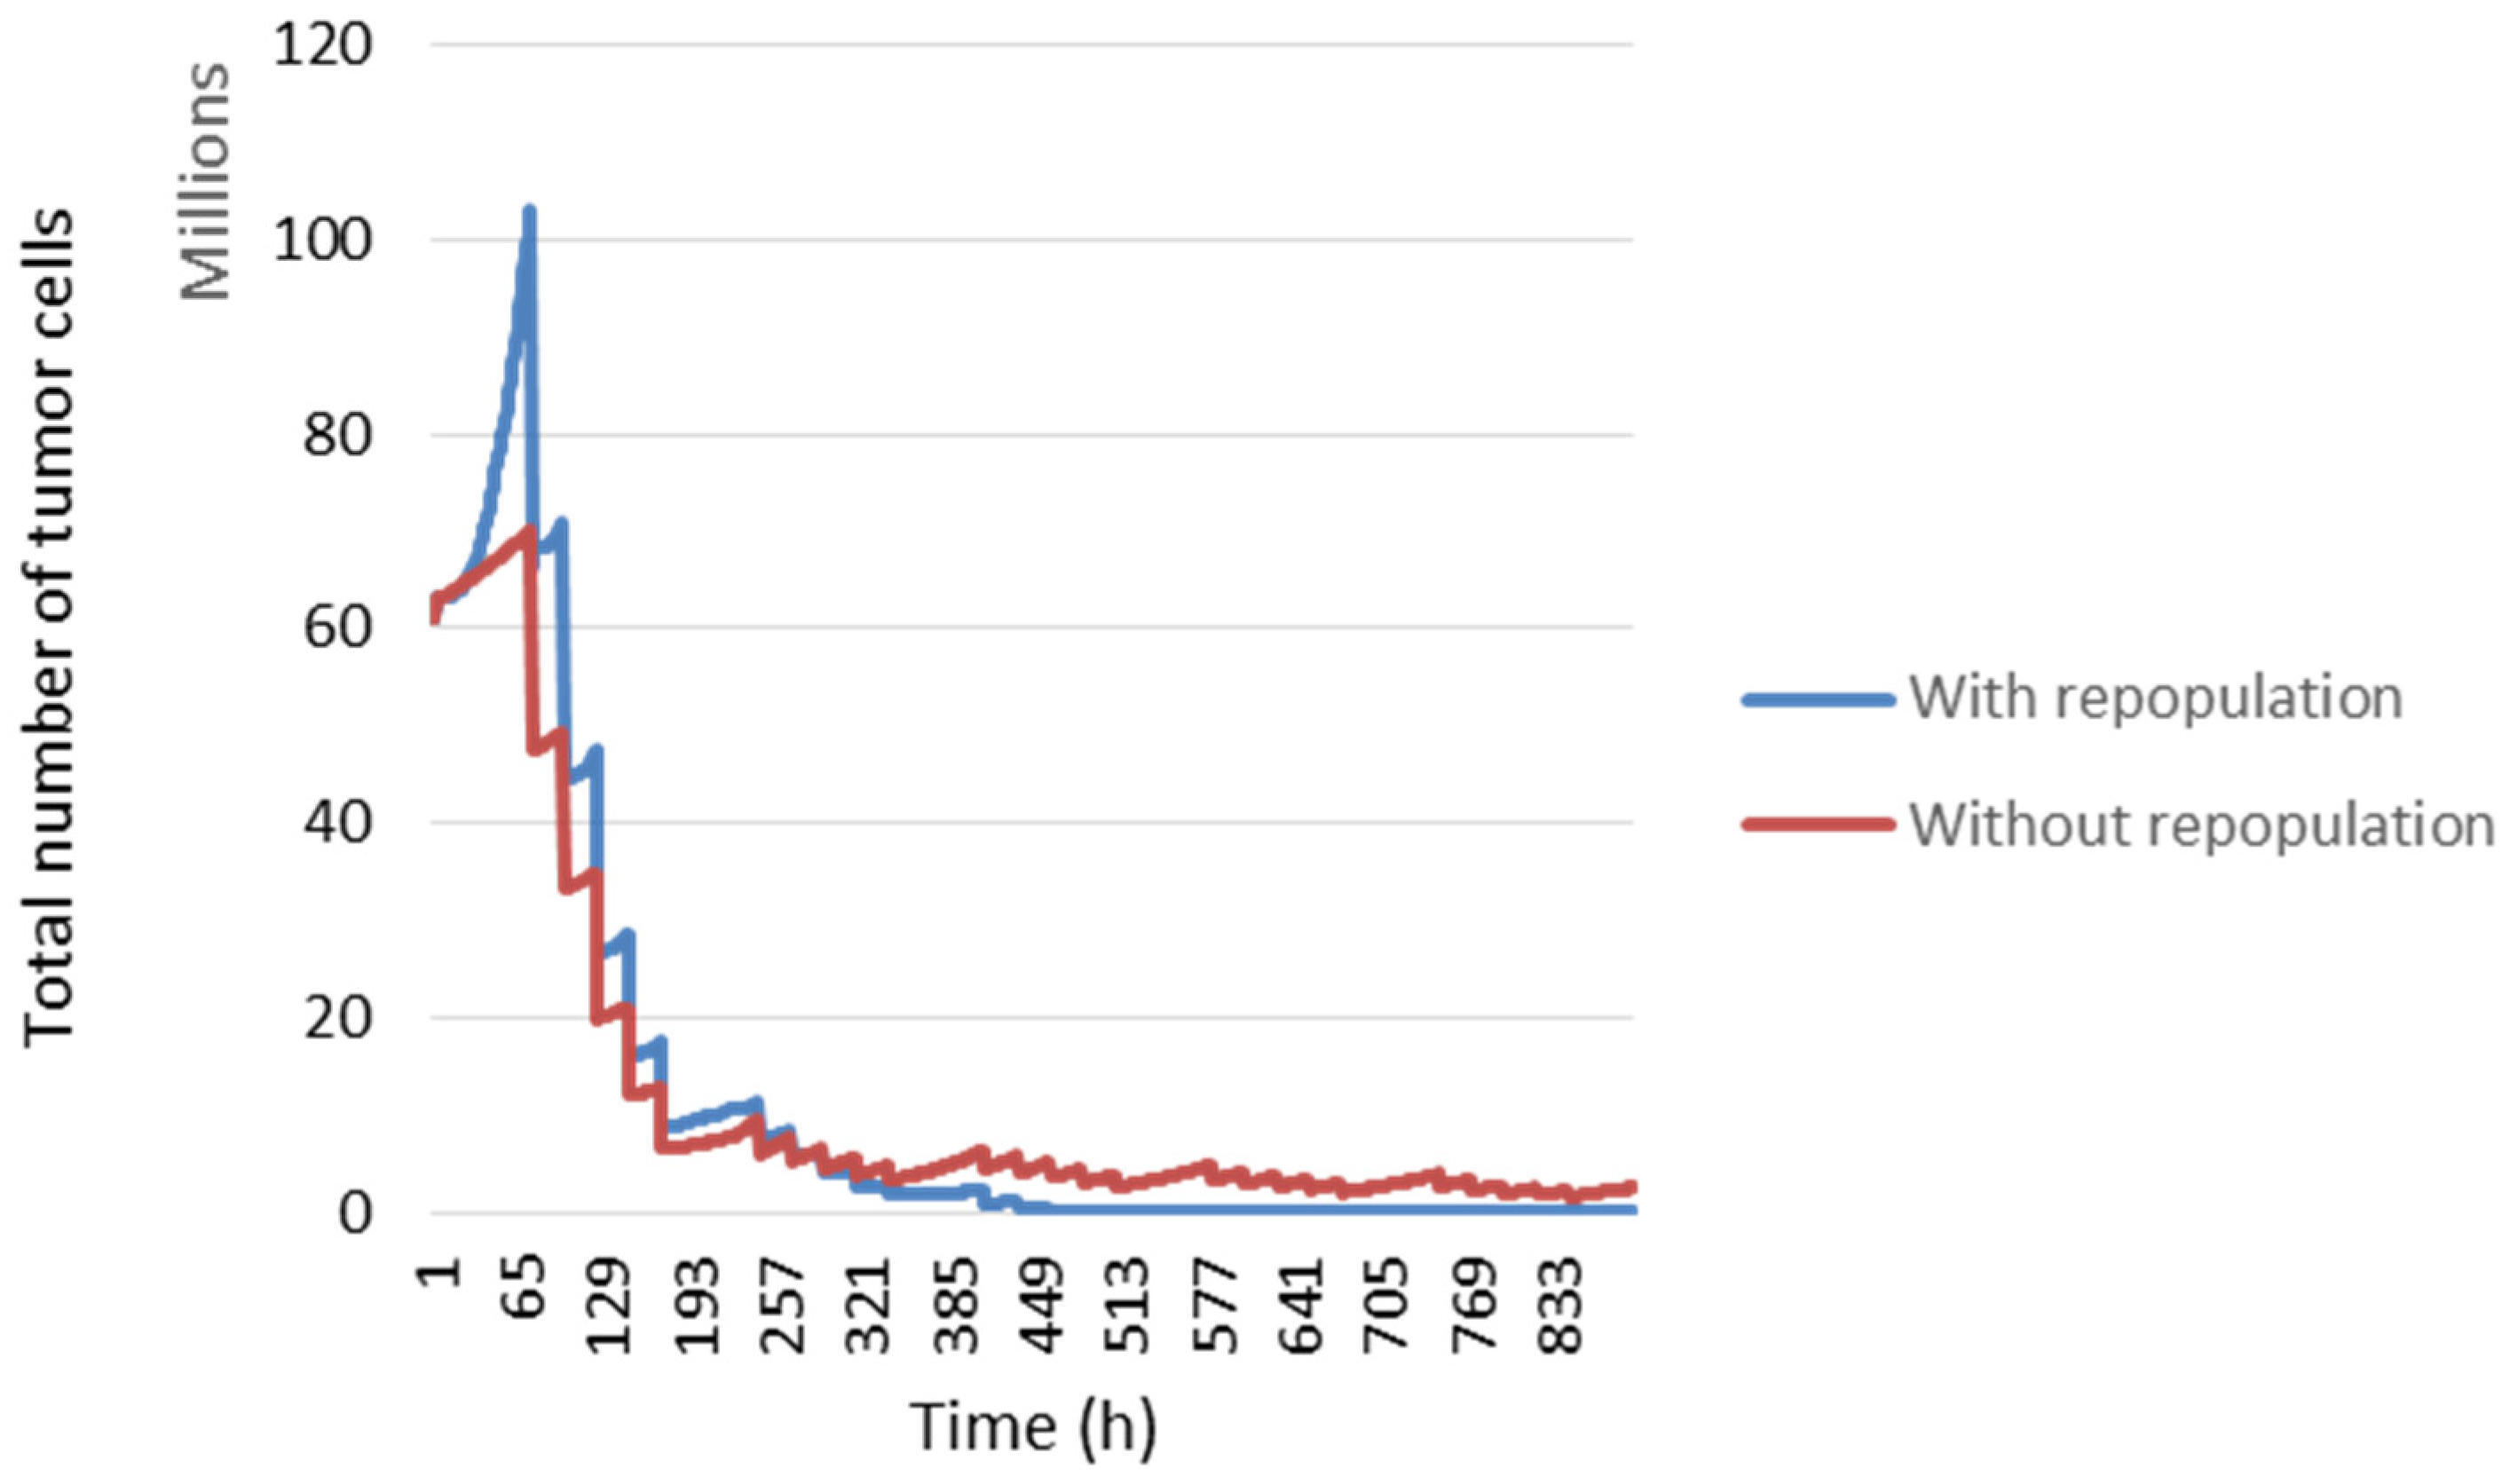
3.3. Repopulation
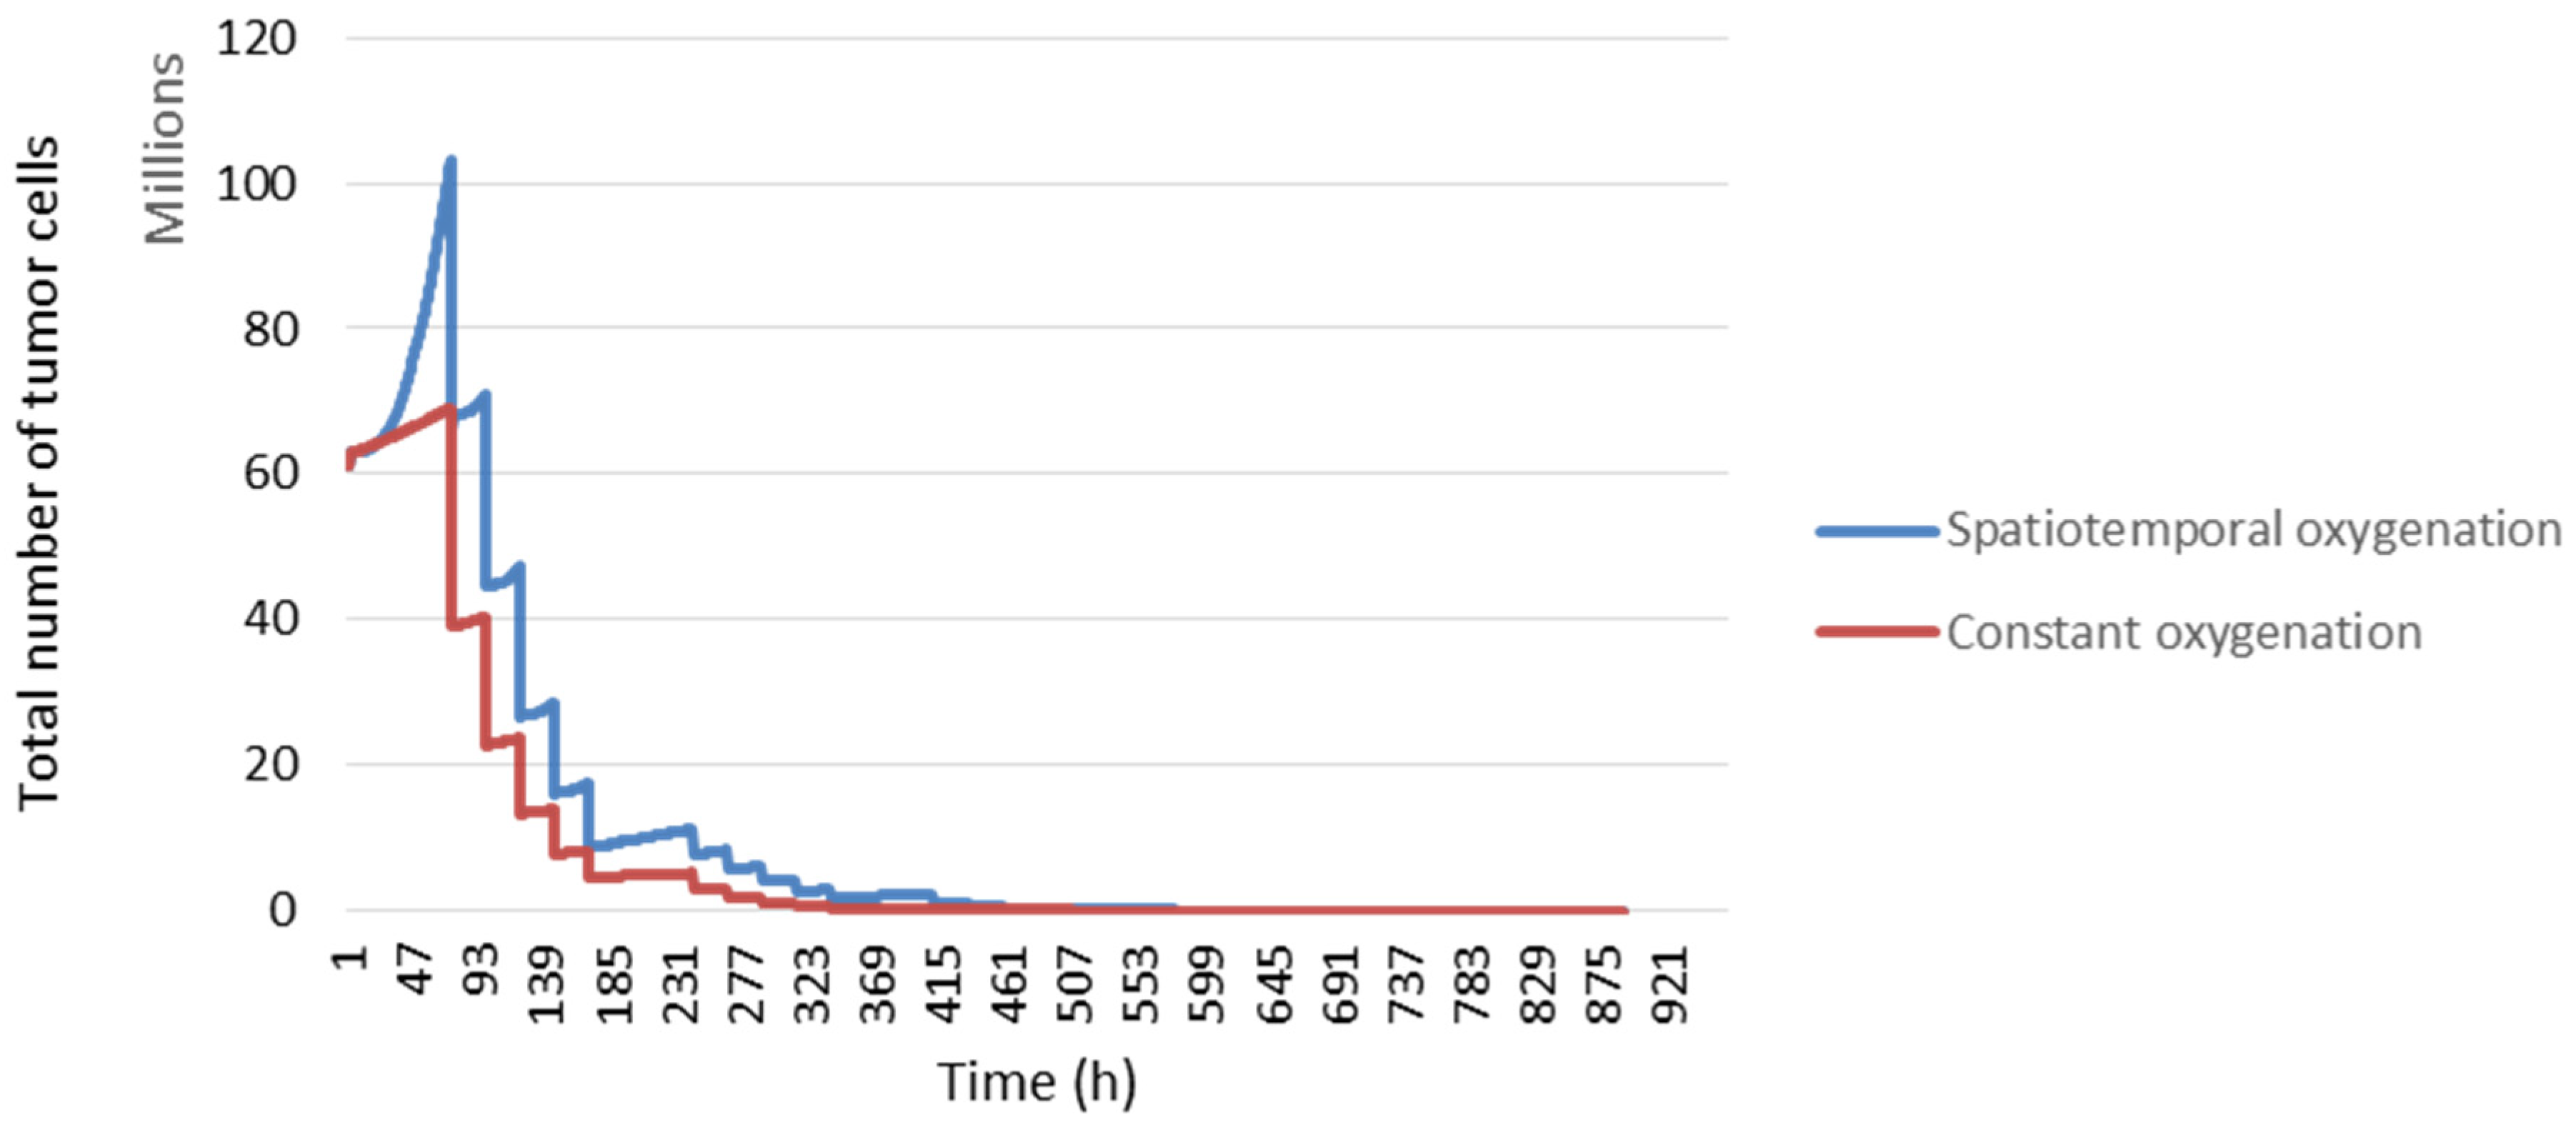
3.4. Reoxygenation
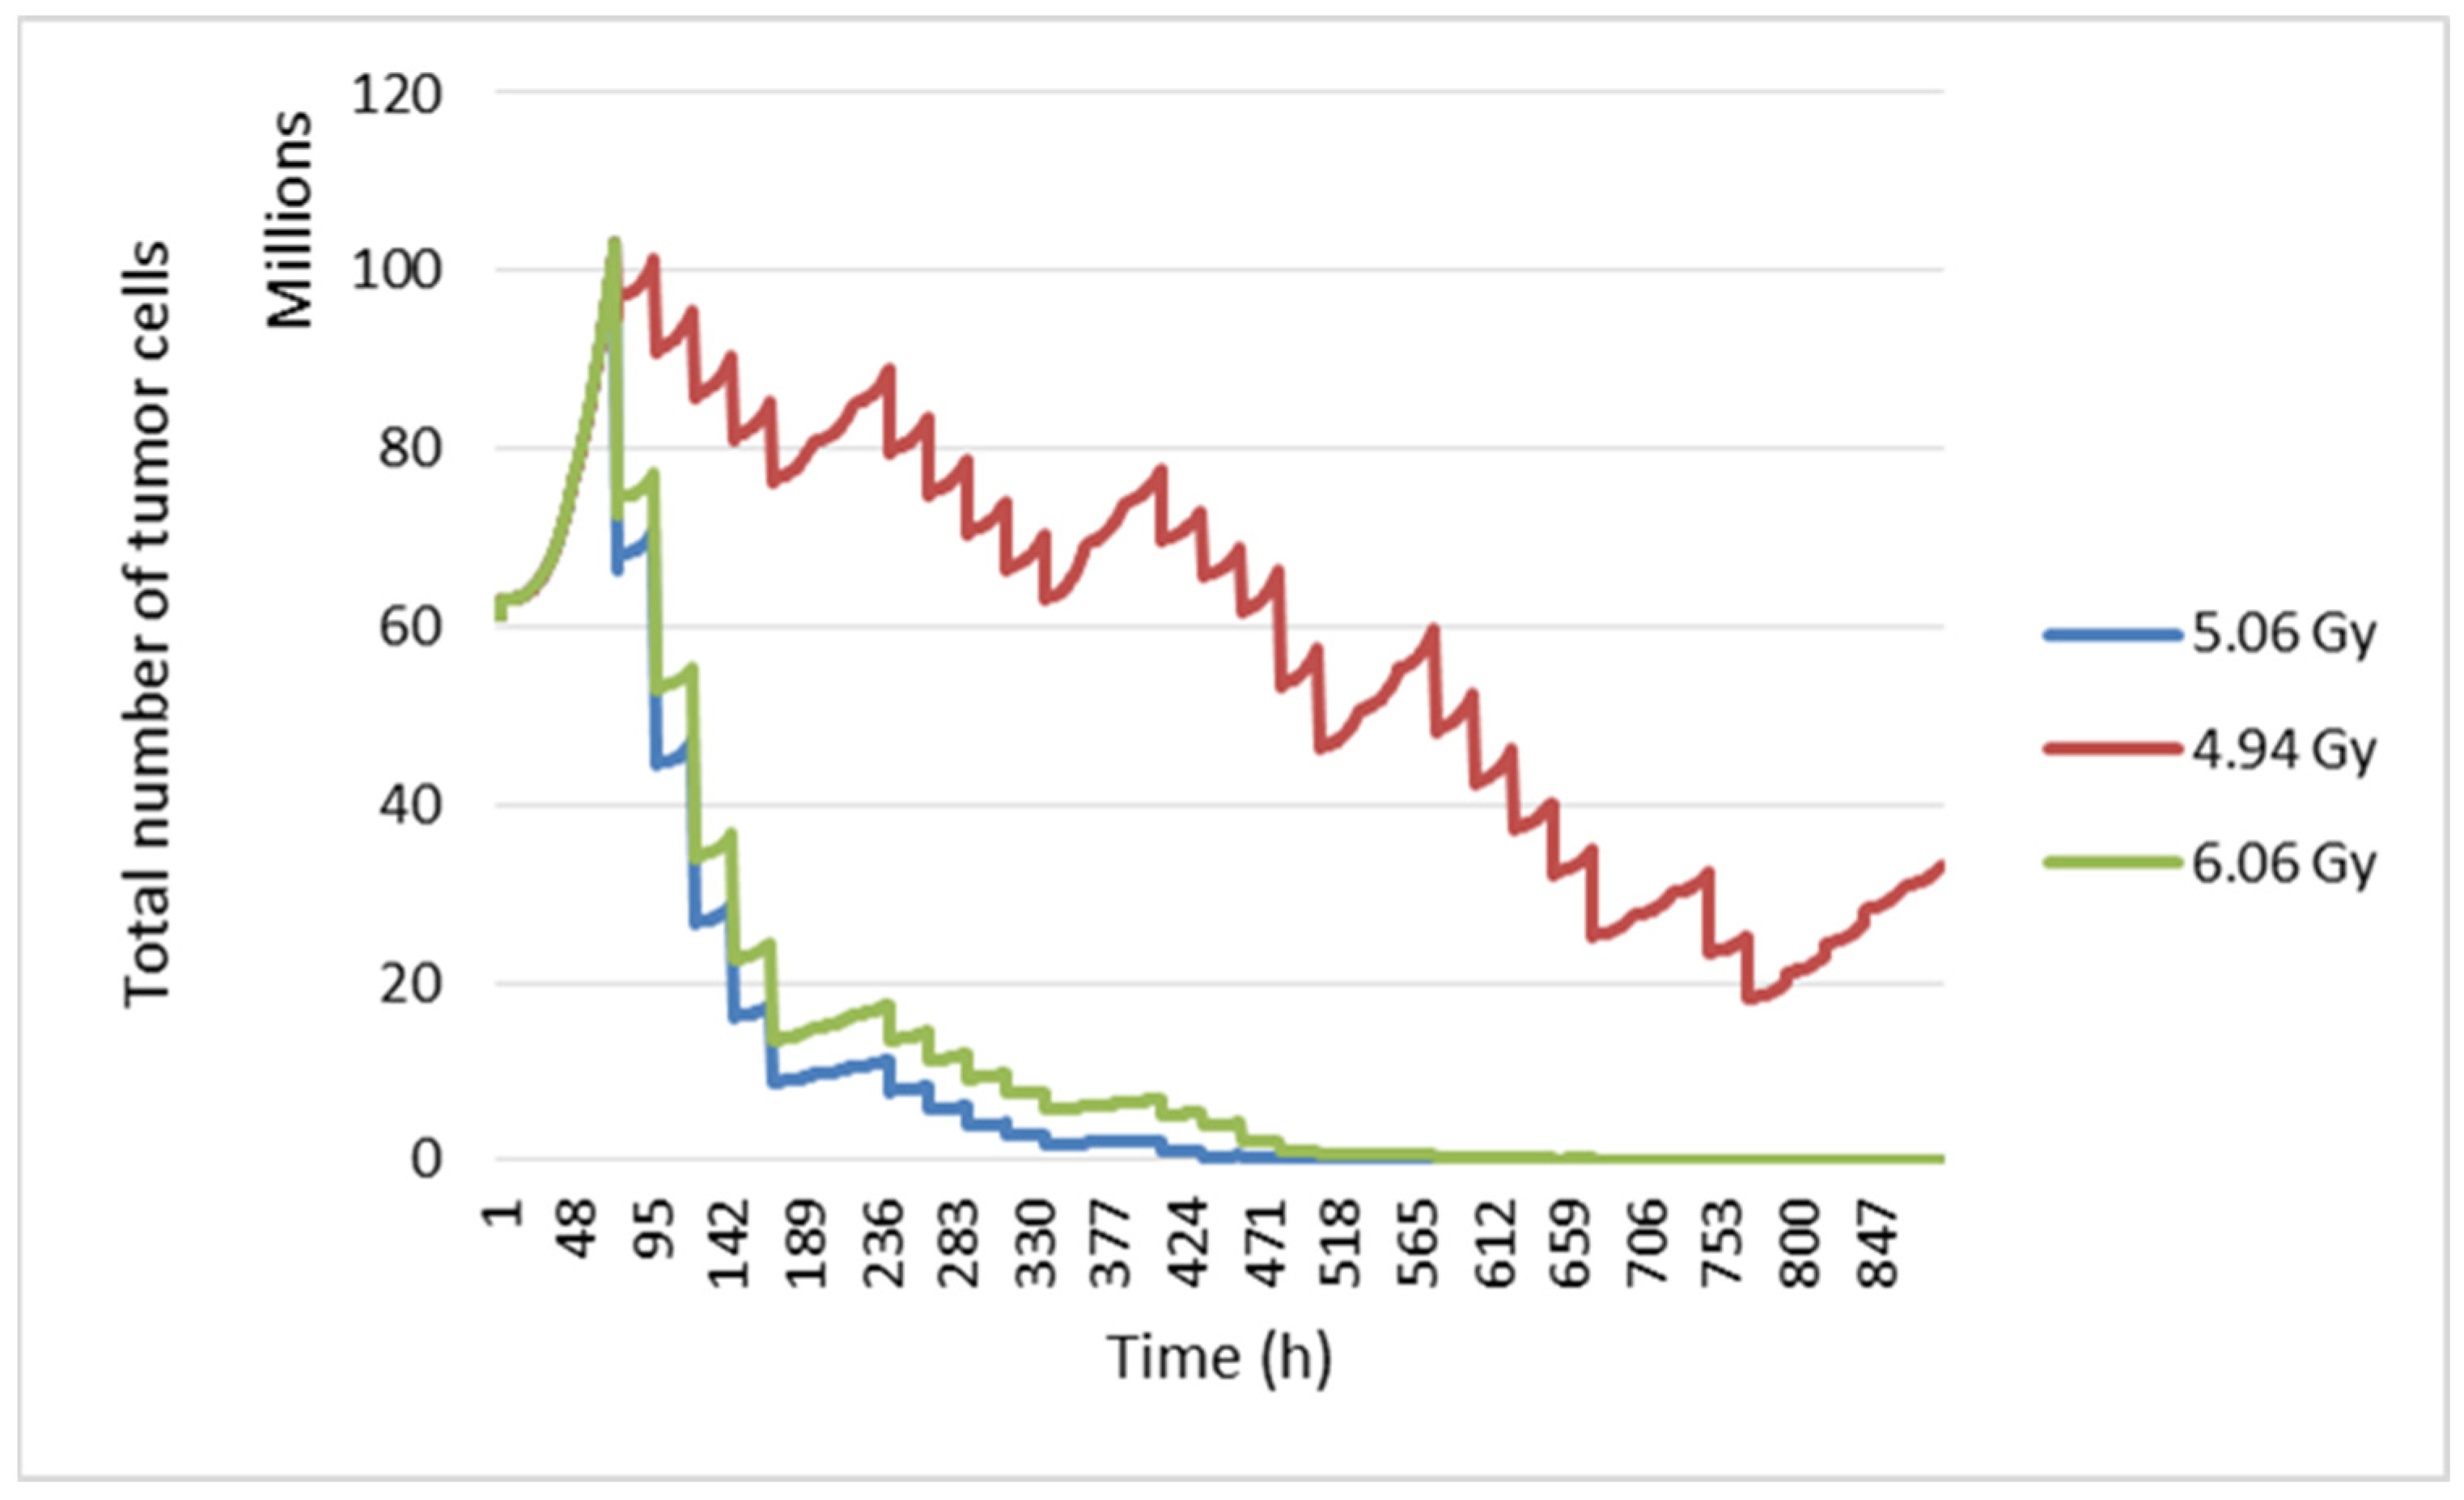
3.5. Radiosensitivity
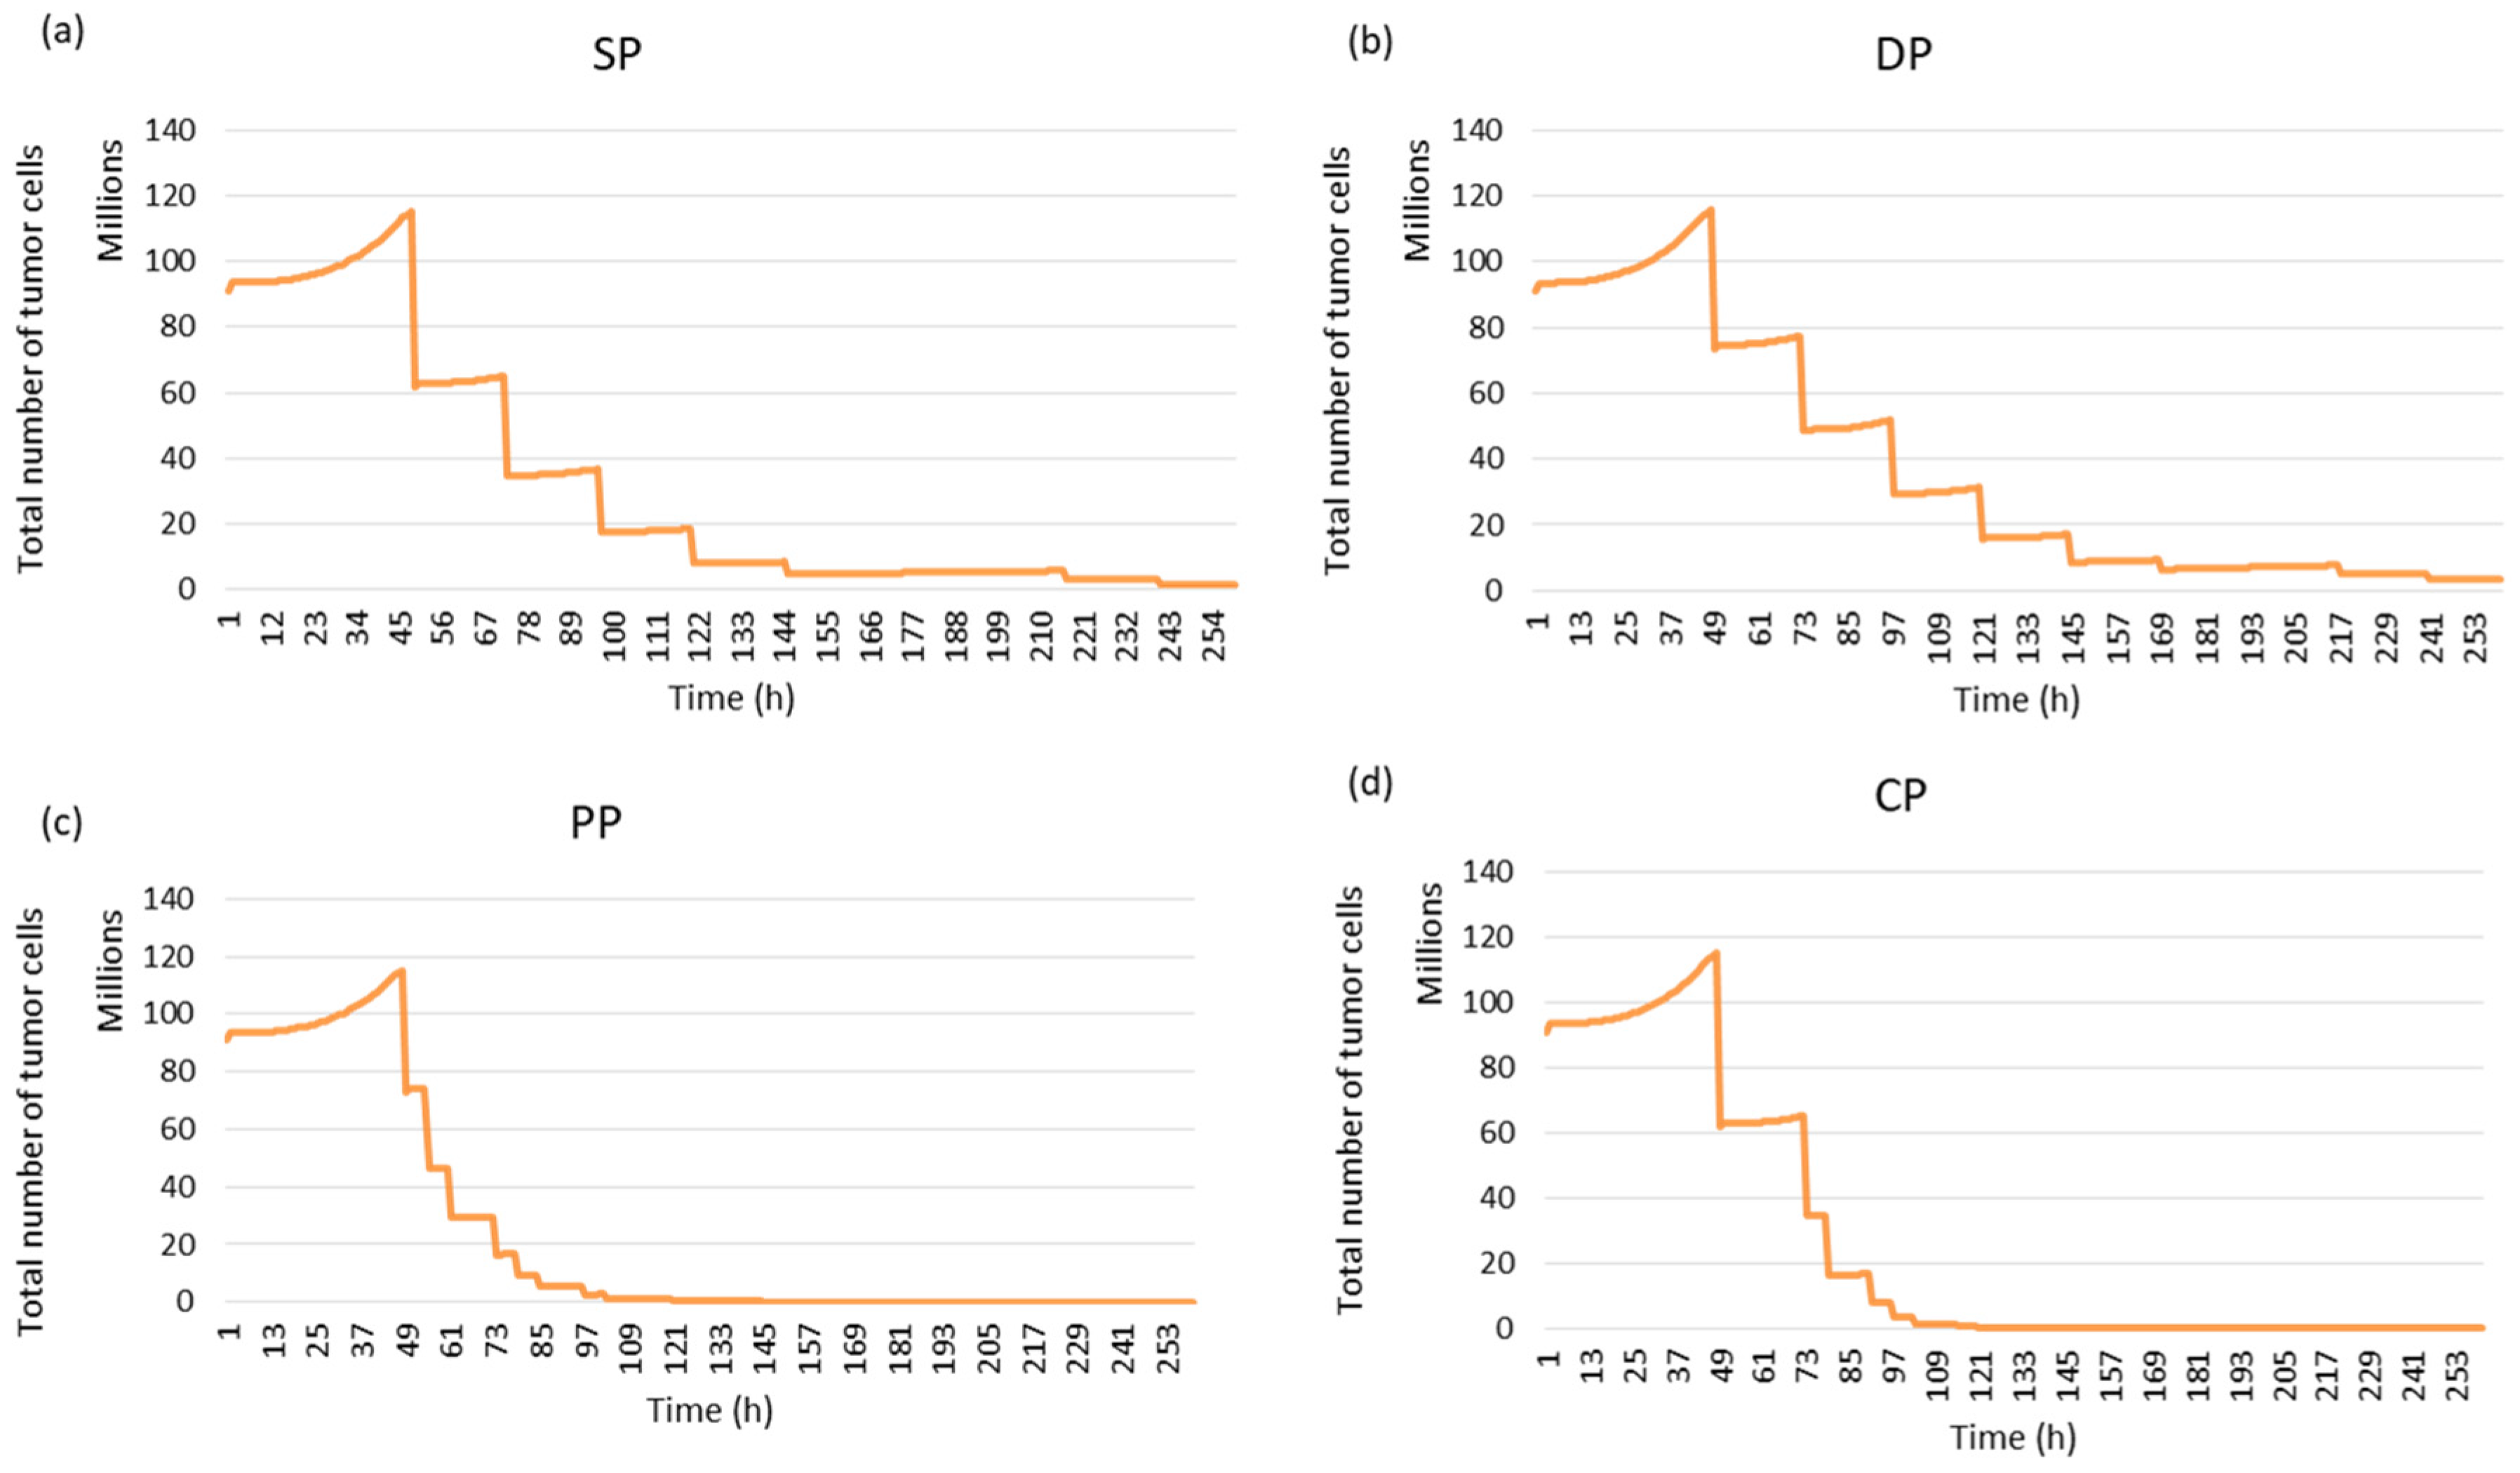
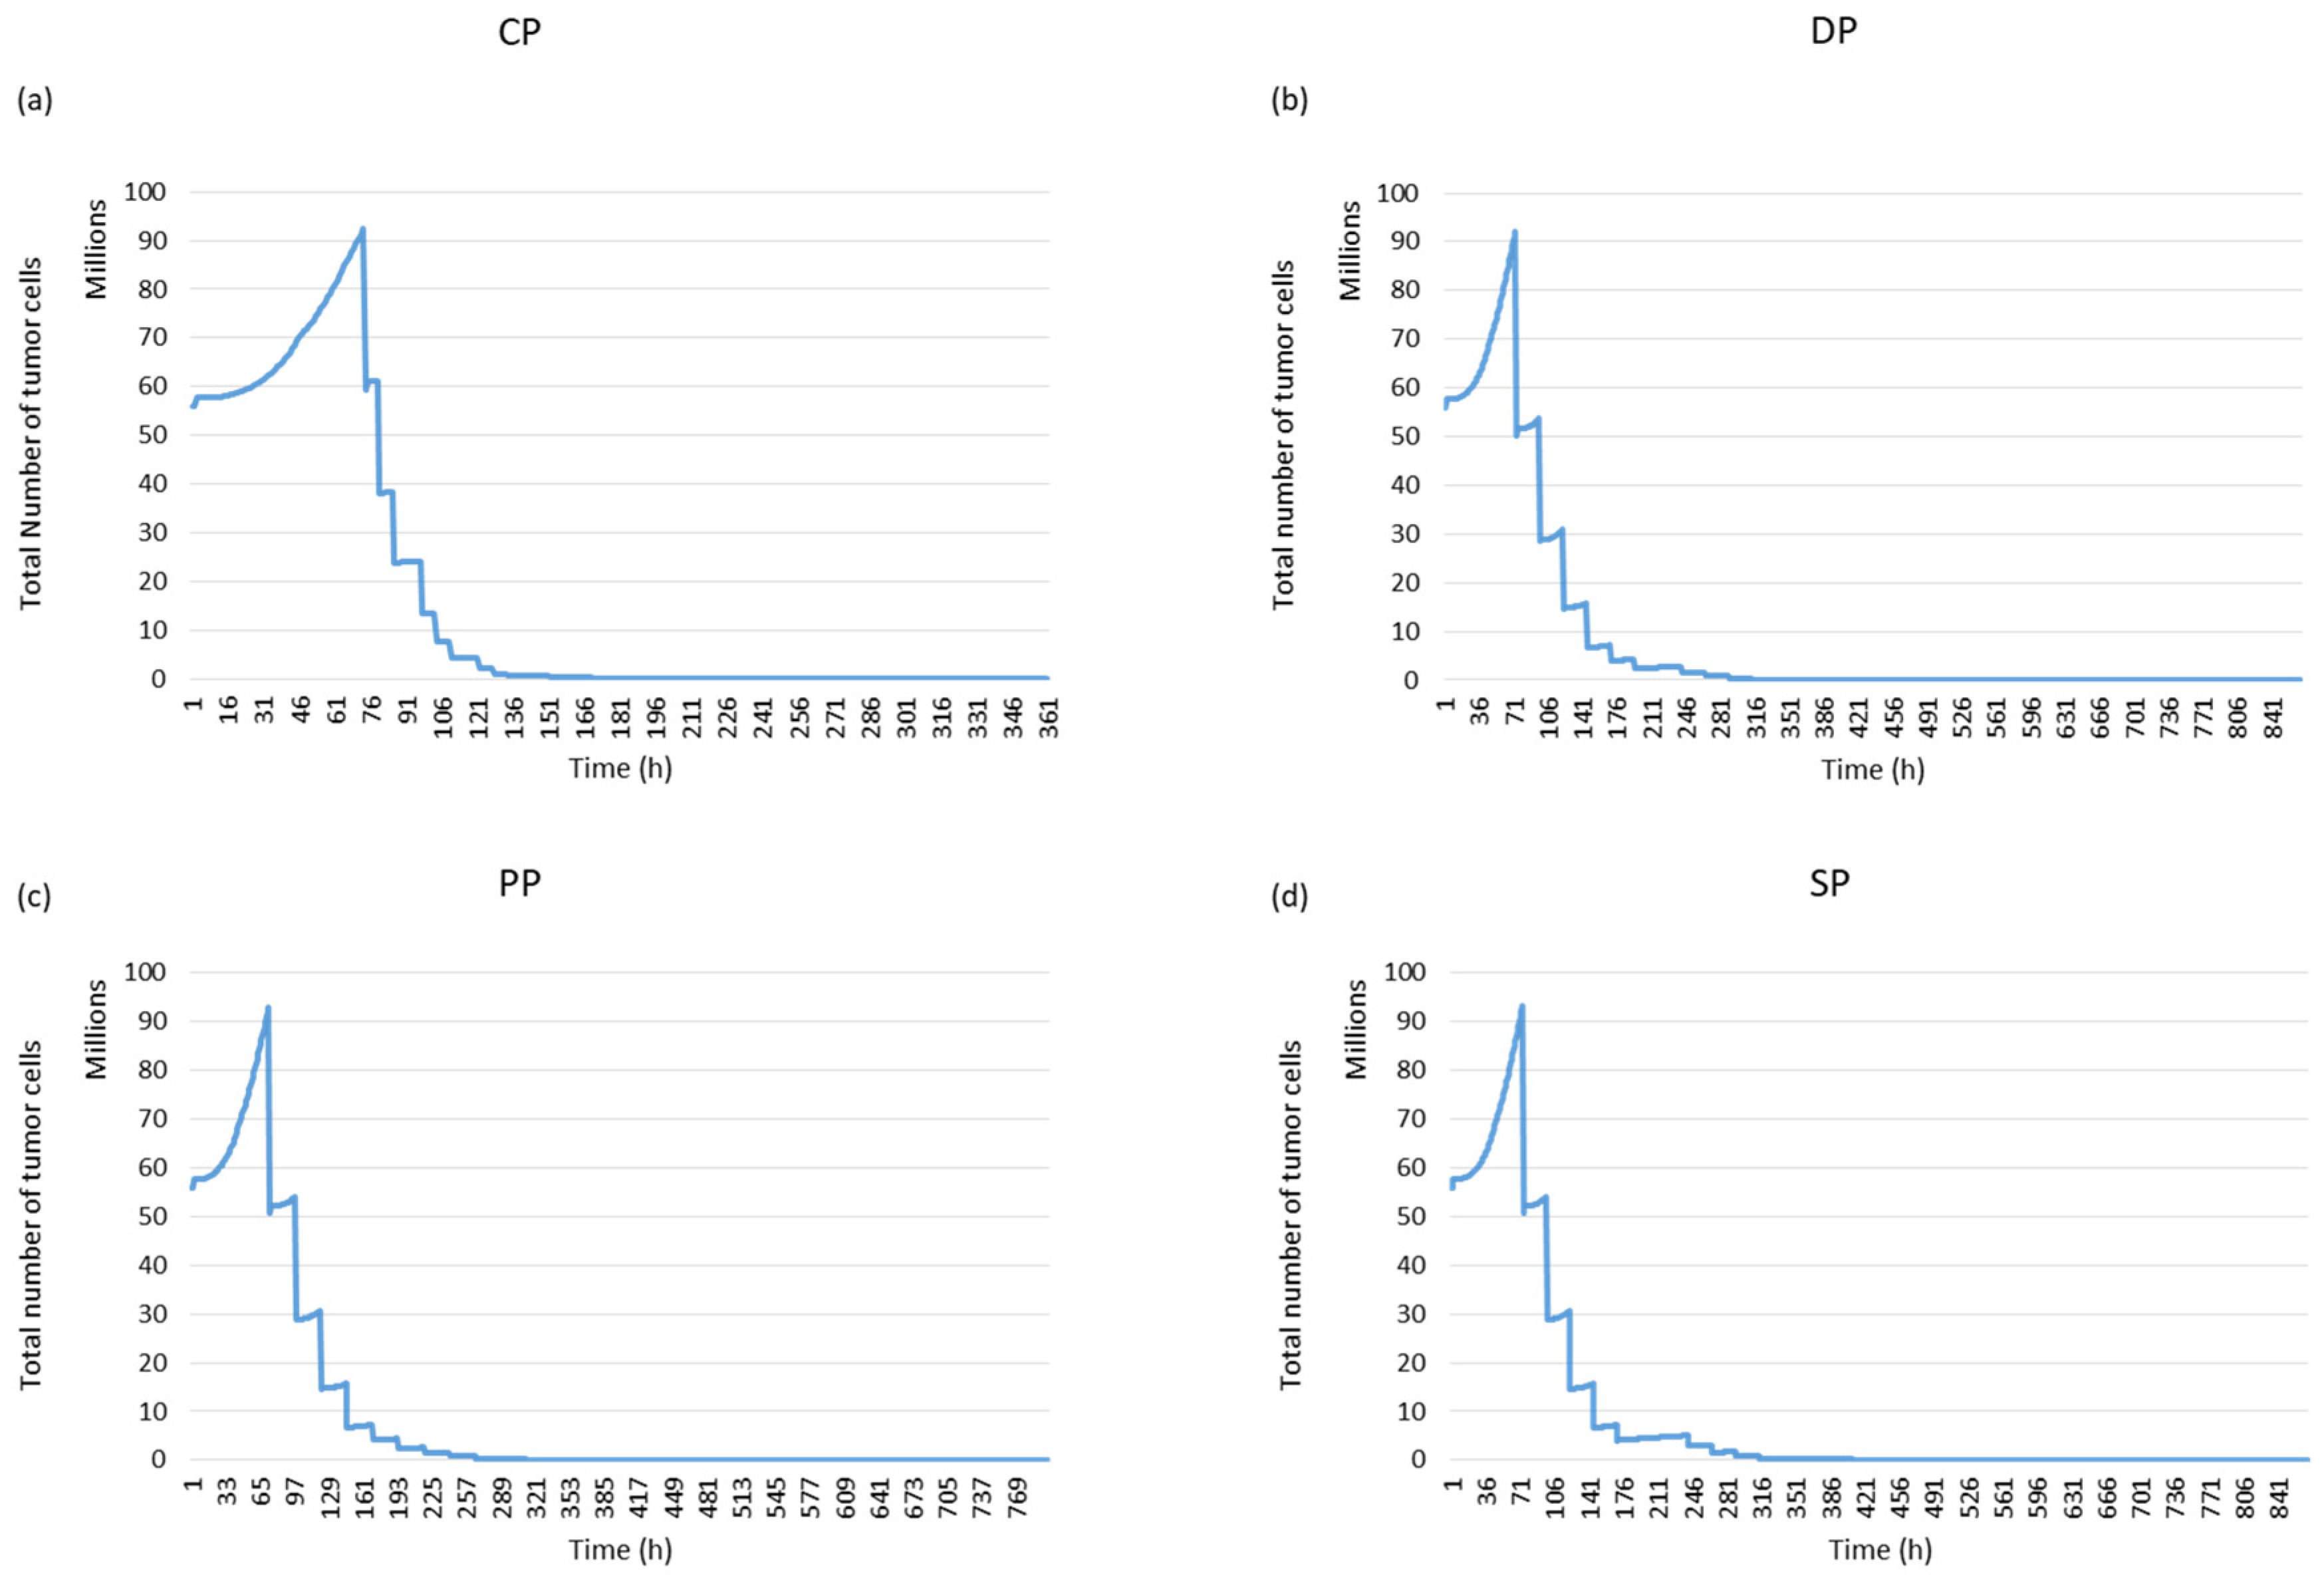
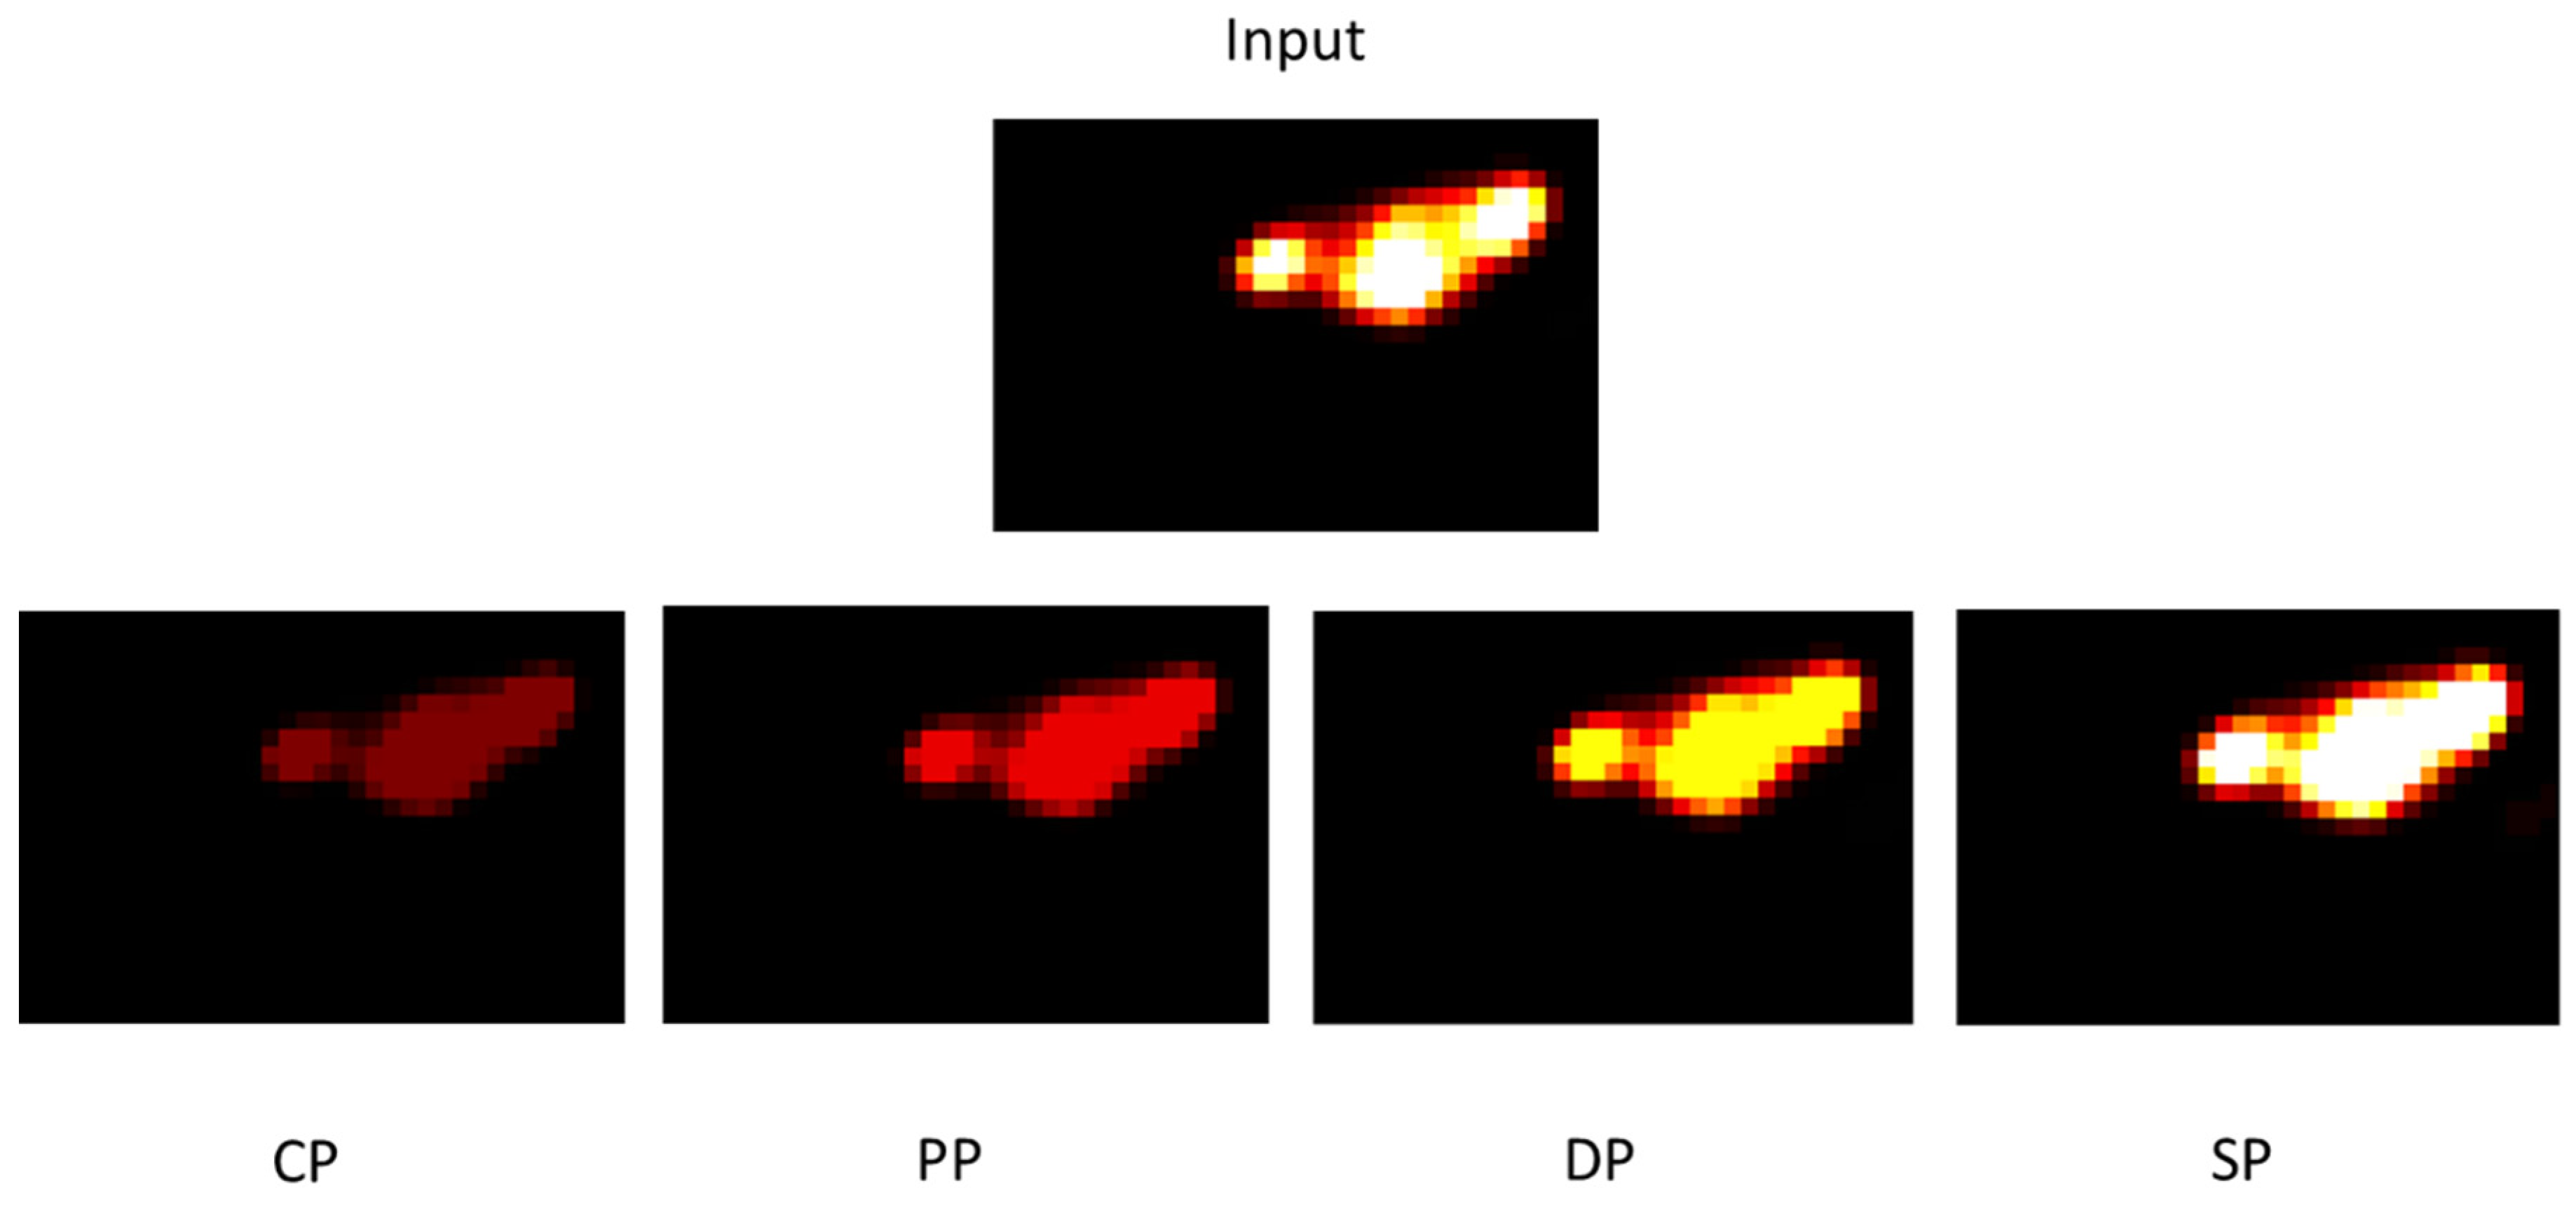
3.6. Tumour Response to Different Fractionation Schemes
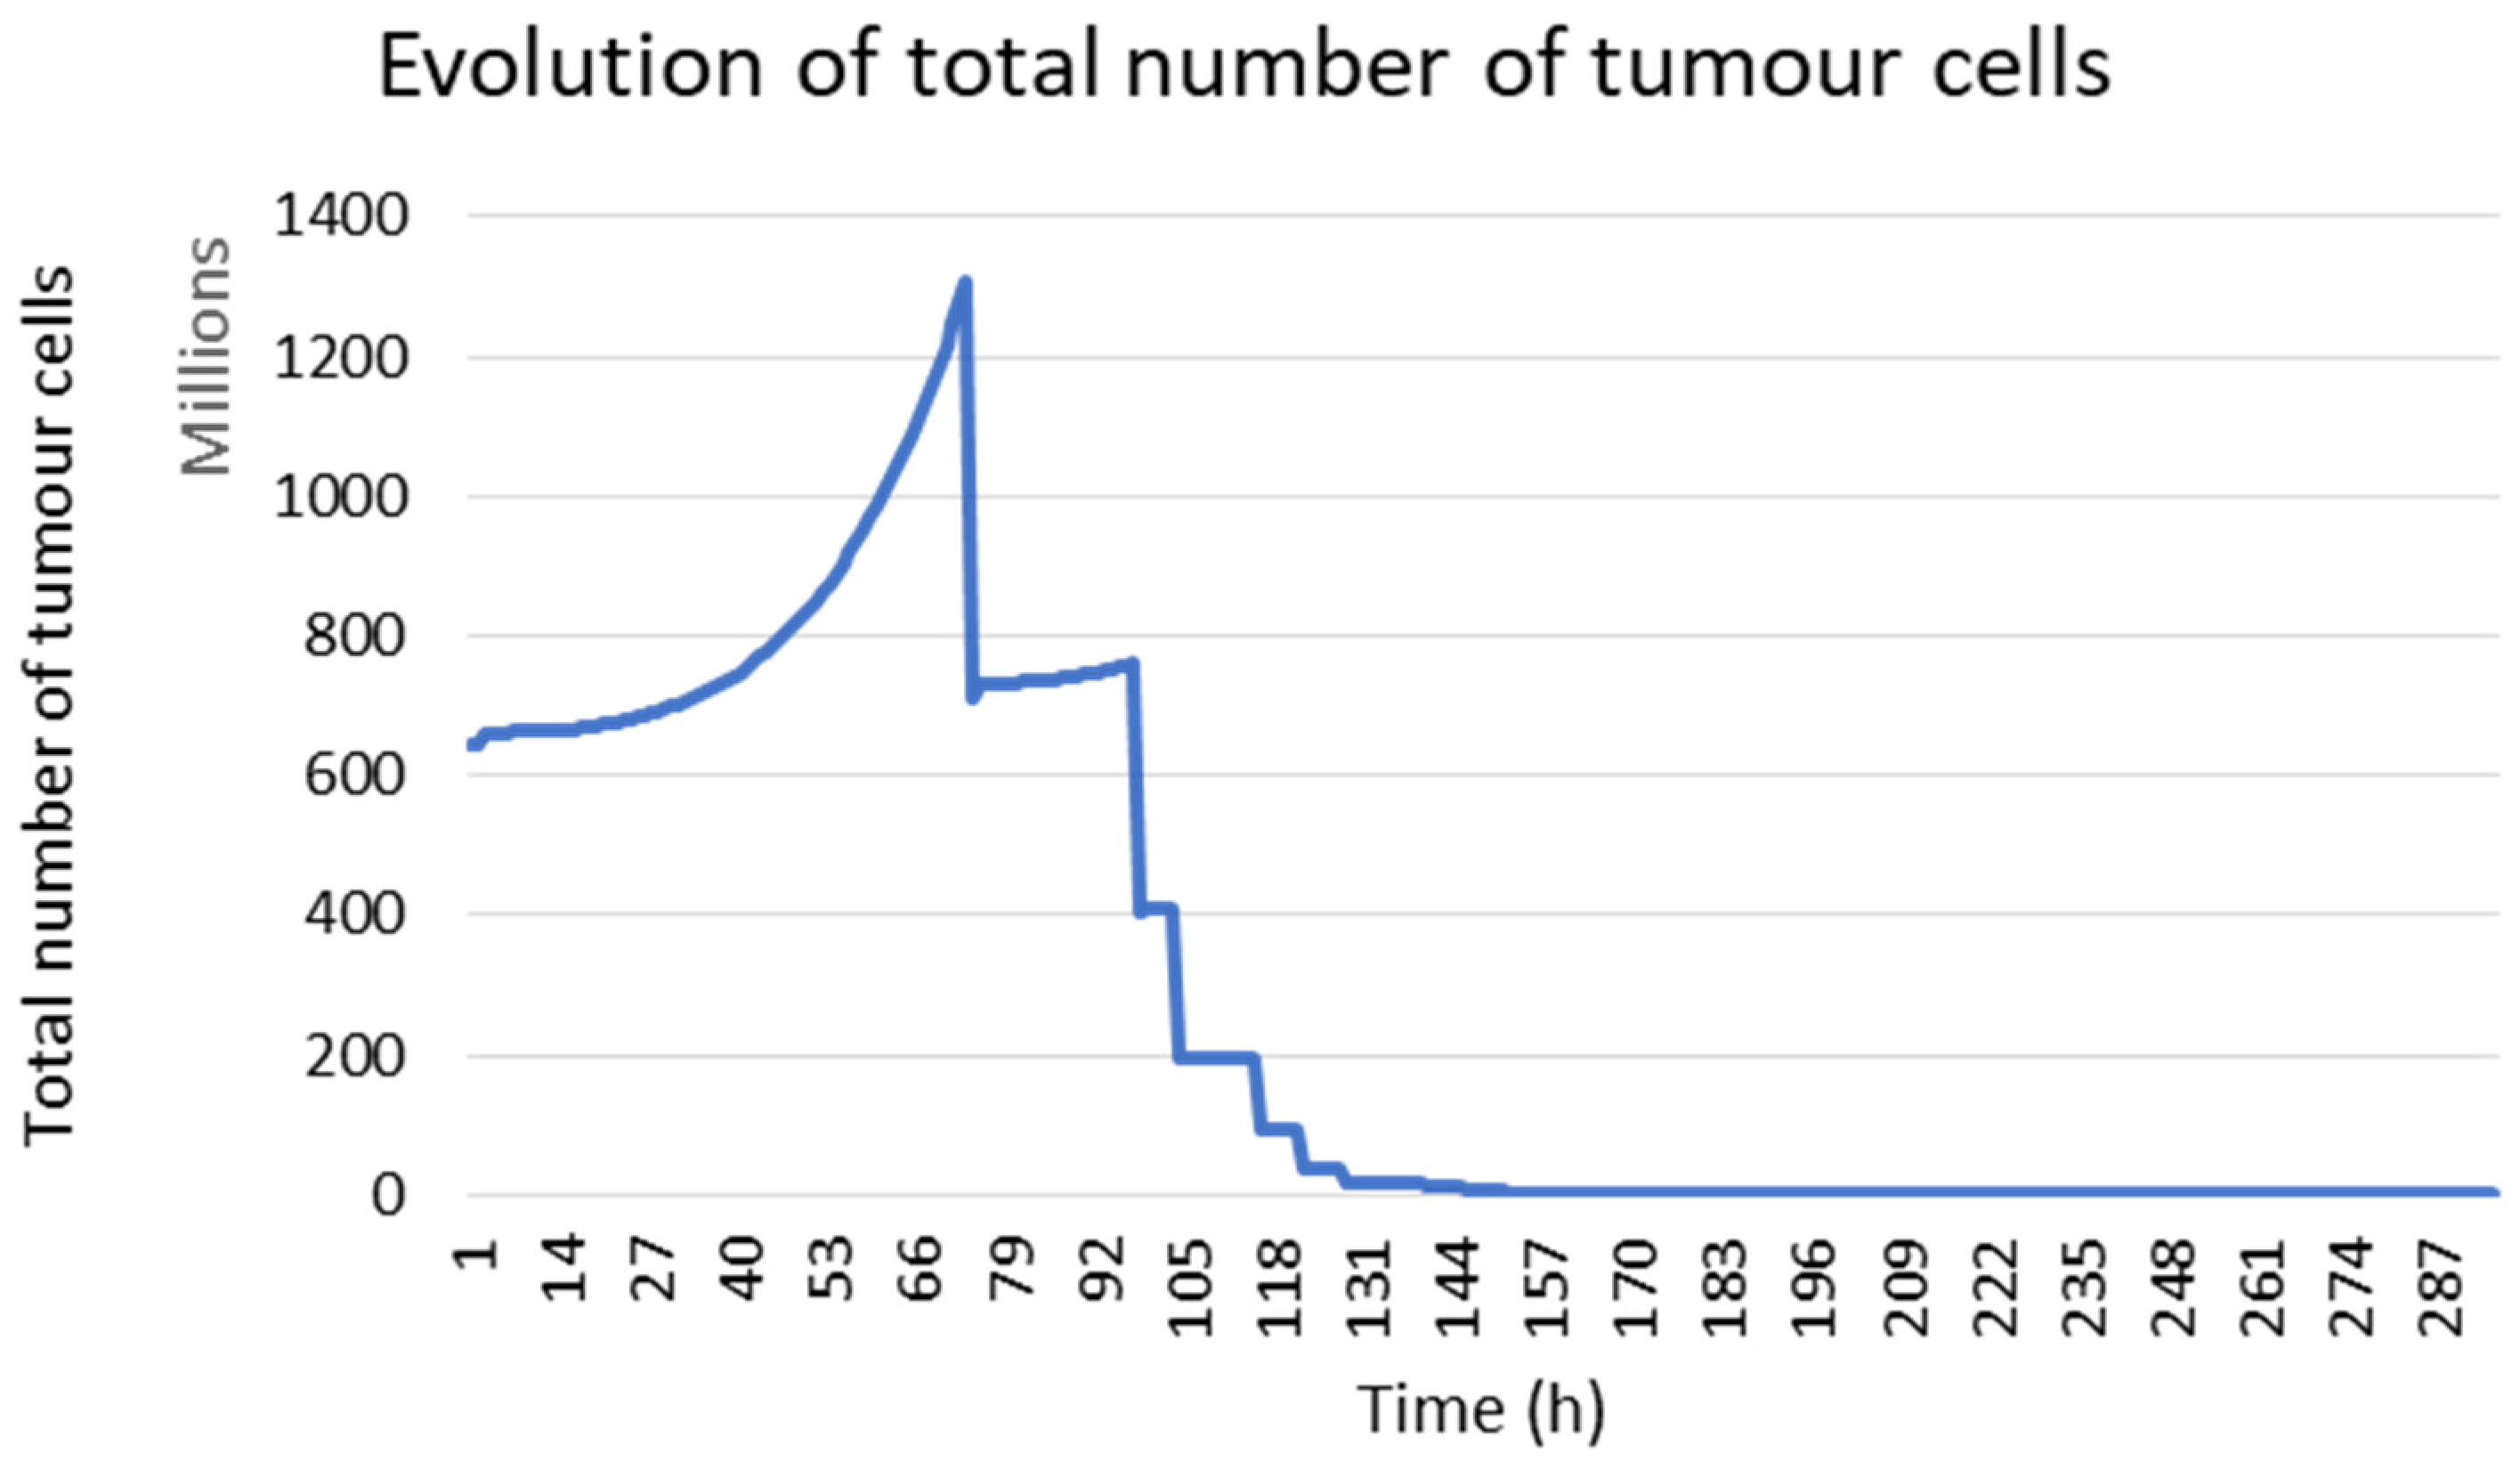
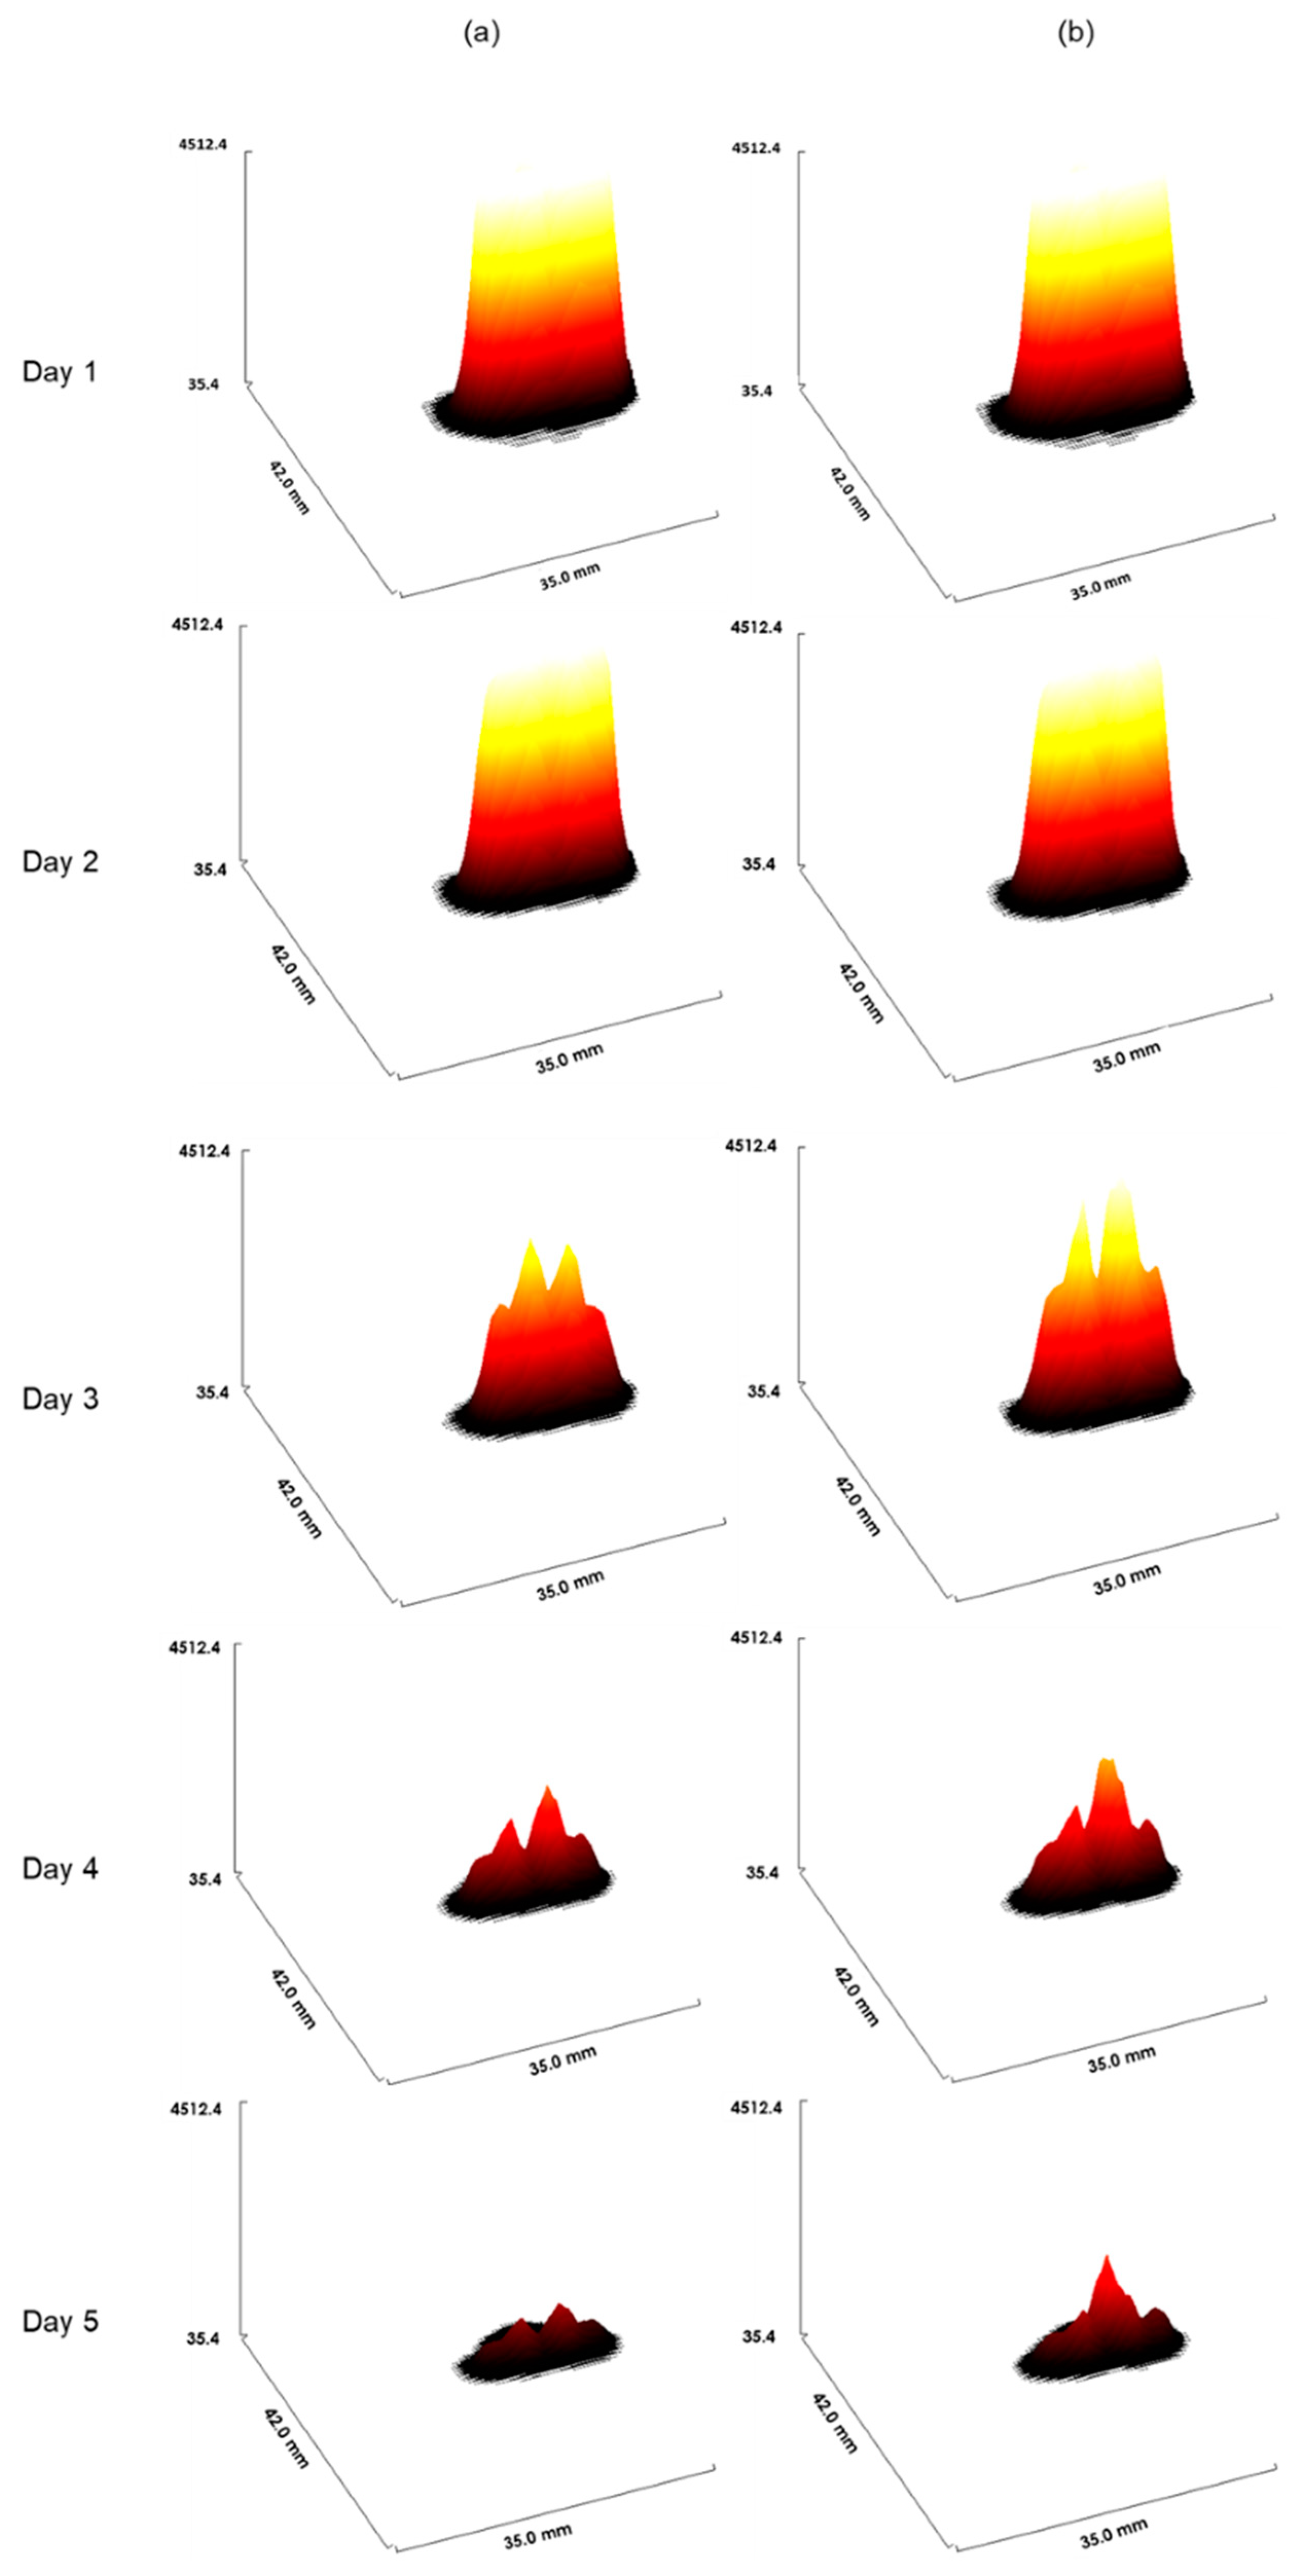
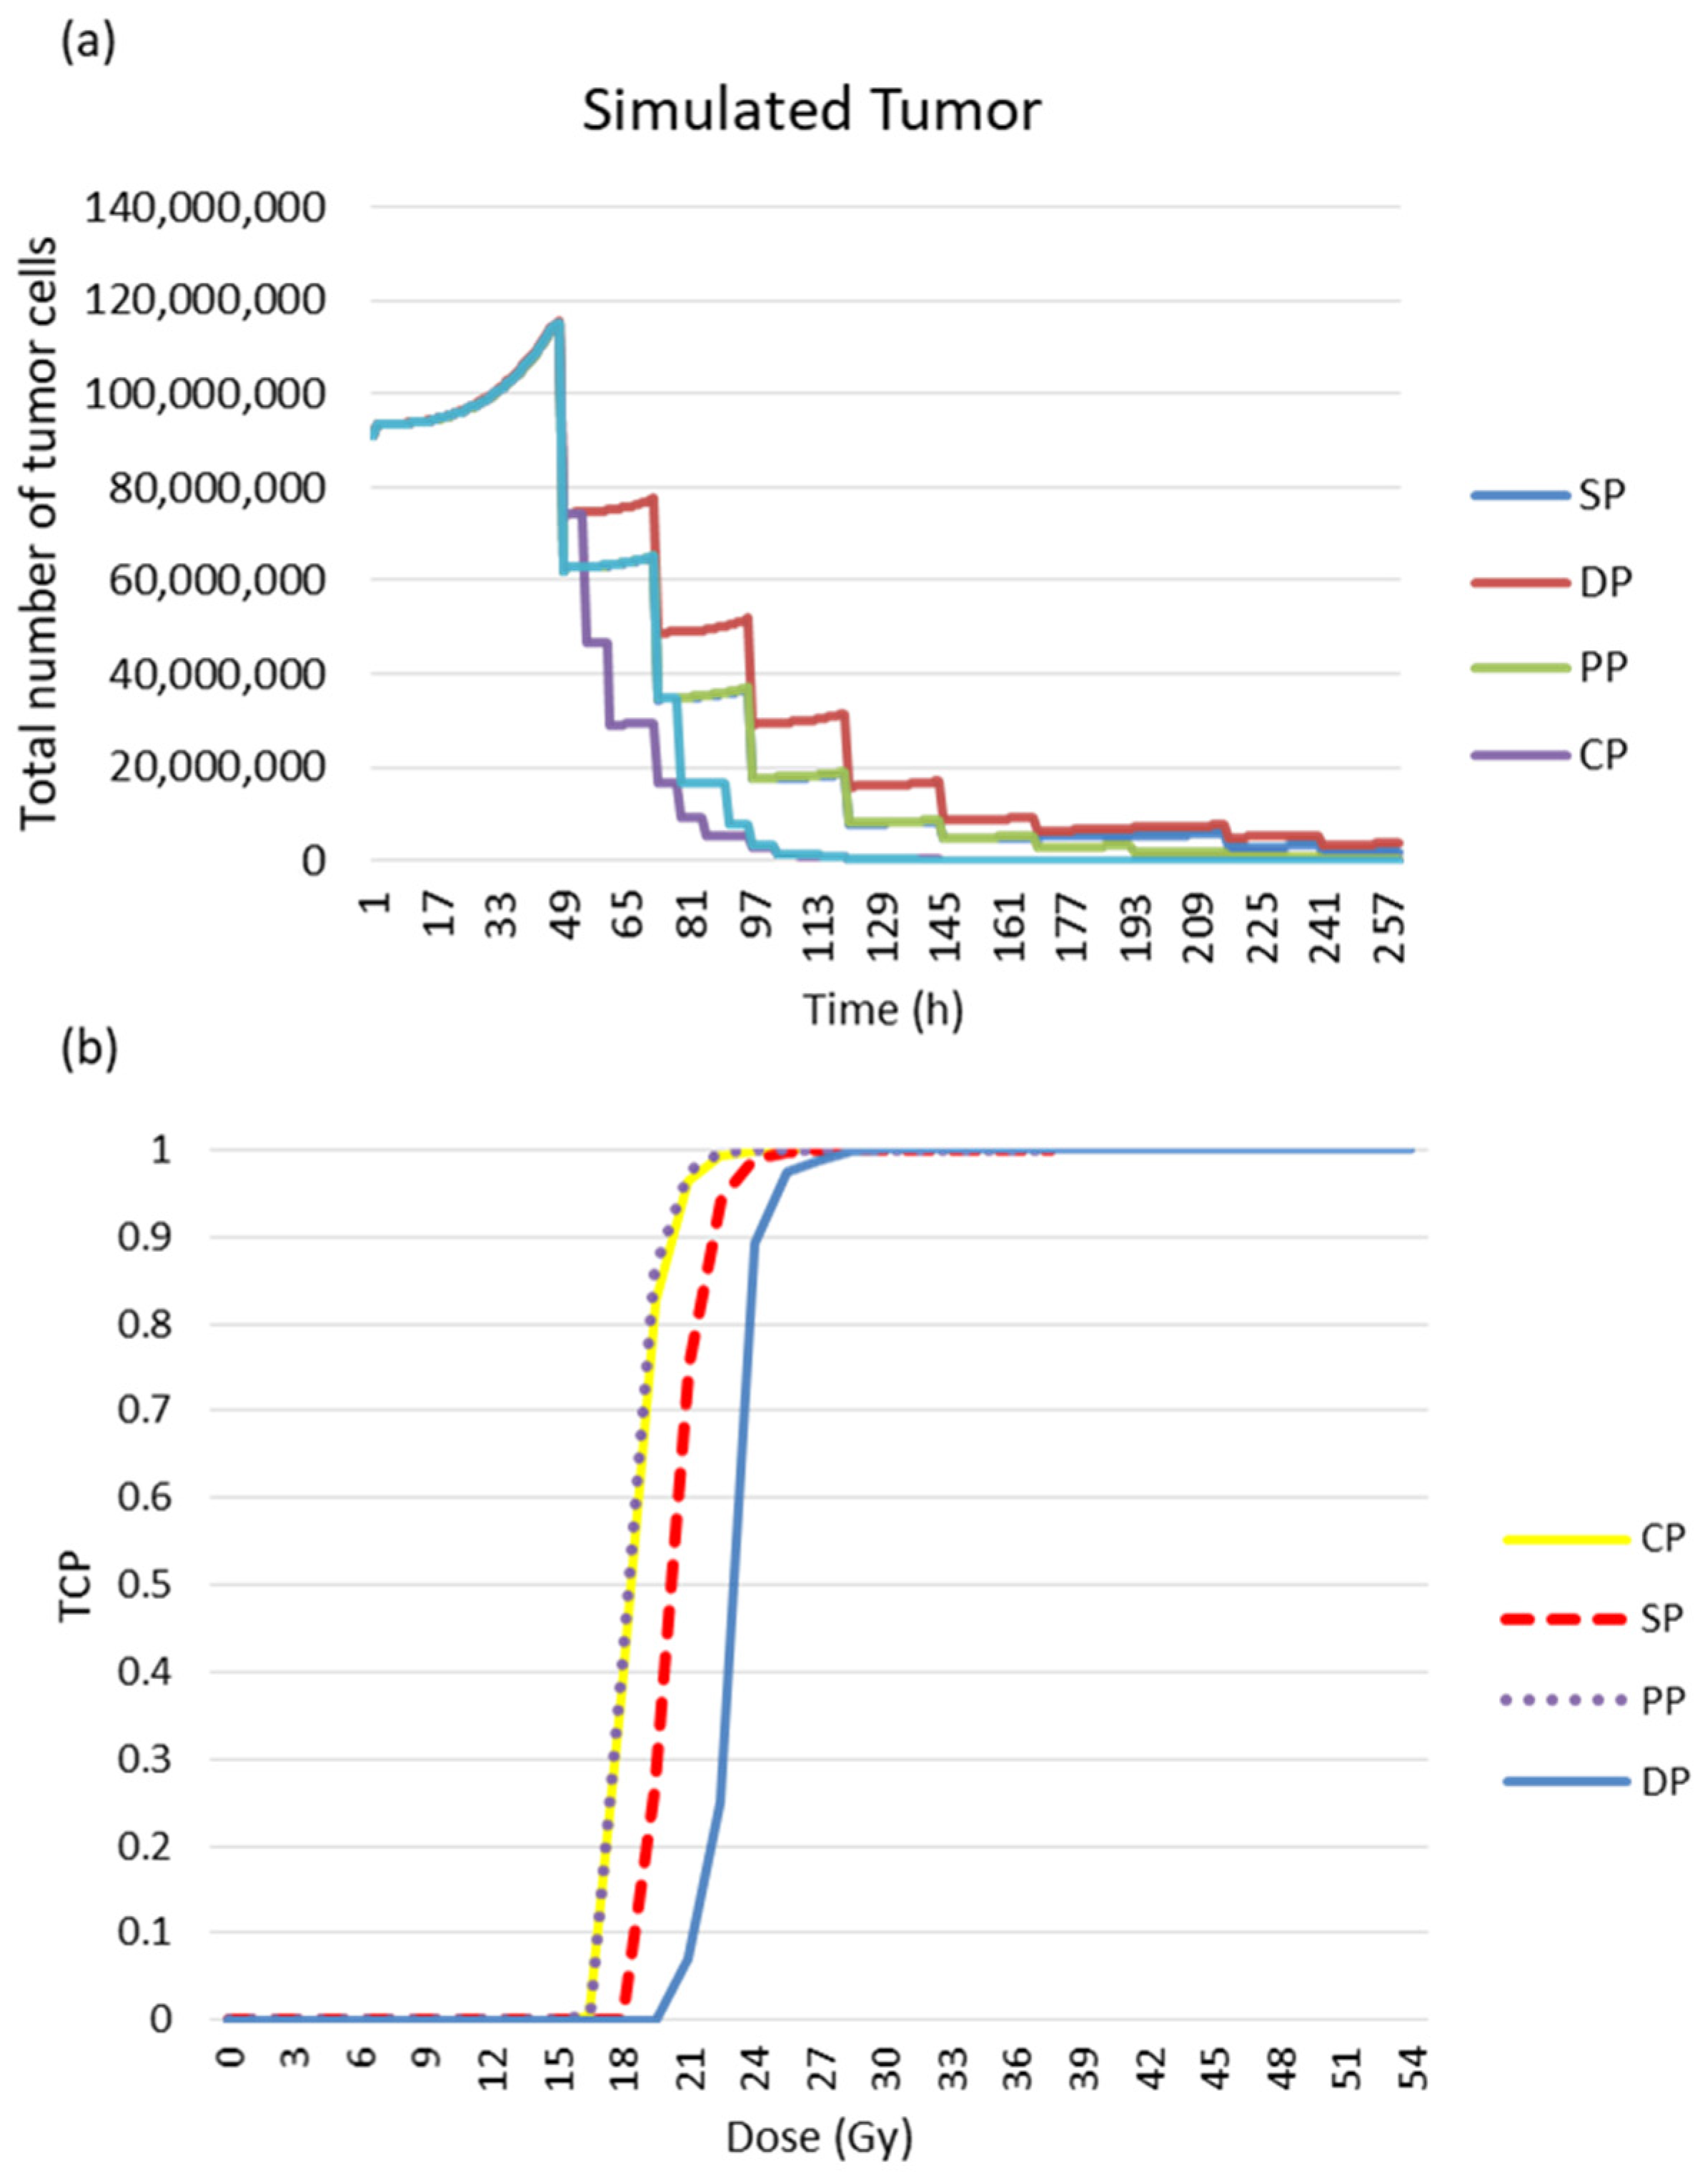
3.6.1. Simulated Tumour Response
3.6.2. Tumour Response to Radiotherapy
4. Discussion
5. Conclusions
Author Contributions
Funding
Institutional Review Board Statement
Informed Consent Statement
Data Availability Statement
Conflicts of Interest
References
- Joiner, M.; Van der Kogel, A. Basic Clinical Radiobiology, 4th ed.; Hodder Arnold: London, UK, 2009; ISBN 978 0 340 929 667. [Google Scholar]
- Siegel, R.L.; Miller, K.D.; Jemal, A. Cancer Statistics, 2018. CA Cancer J. Clin. 2018, 68, 7–30. [Google Scholar] [CrossRef] [PubMed]
- Bray, F.; Jemal, A.; Grey, N.; Ferlay, J.; Forman, D. Global Cancer Transitions According to the Human Development Index (2008–2030): A Population-Based Study. Lancet Oncol. 2012, 13, 790–801. [Google Scholar] [CrossRef] [PubMed]
- Baskar, R.; Lee, K.A.; Yeo, R.; Yeoh, K.W. Cancer and Radiation Therapy: Current Advances and Future Directions. Int. J. Med. Sci. 2012, 9, 193–199. [Google Scholar] [CrossRef] [Green Version]
- Deloch, L.; Derer, A.; Hartmann, J.; Frey, B.; Fietkau, R.; Gaipl, U.S. Modern Radiotherapy Concepts and the Impact of Radiation on Immune Activation. Front. Oncol. 2016, 6, 141. [Google Scholar] [CrossRef] [Green Version]
- Nahum, A.E. The Radiobiology of Hypofractionation. Clin. Oncol. 2015, 27, 260–269. [Google Scholar] [CrossRef]
- Klement, R.J. The Influence of Ketogenic Therapy on the 5 R’s of Radiobiology. Int. J. Radiat. Biol. 2017, 95, 394–407. [Google Scholar] [CrossRef]
- Peitzsch, C.; Kurth, I.; Ebert, N.; Dubrovska, A.; Baumann, M. Cancer Stem Cells in Radiation Response: Current Views and Future Perspectives in Radiation Oncology. Int. J. Radiat. Biol. 2019, 95, 900–911. [Google Scholar] [CrossRef] [PubMed]
- Lambin, P.; Van Stiphout, R.G.P.M.; Starmans, M.H.W.; Rios-Velazquez, E.; Nalbantov, G.; Aerts, H.J.W.L.; Roelofs, E.; Van Elmpt, W.; Boutros, P.C.; Granone, P.; et al. Predicting Outcomes in Radiation Oncology-Multifactorial Decision Support Systems. Nat. Rev. Clin. Oncol. 2012, 10, 27–40. [Google Scholar] [CrossRef] [Green Version]
- Mali, S.B. Adaptive Radiotherapy for Head Neck Cancer. J. Maxillofac. Oral Surg. 2016, 15, 549–554. [Google Scholar] [CrossRef] [Green Version]
- Hunt, A.; Hansen, V.N.; Oelfke, U.; Nill, S.; Hafeez, S. Adaptive Radiotherapy Enabled by MRI Guidance. Clin. Oncol. 2018, 30, 711–719. [Google Scholar] [CrossRef] [Green Version]
- Belshaw, L.; Agnew, C.E.; Irvine, D.M.; Rooney, K.P.; McGarry, C.K. Adaptive Radiotherapy for Head and Neck Cancer Reduces the Requirement for Rescans during Treatment Due to Spinal Cord Dose. Radiat. Oncol. 2019, 14, 189. [Google Scholar] [CrossRef]
- Belfatto, A.; White, D.A.; Zhang, Z.; Zhang, Z.; Cerveri, P.; Baroni, G.; Mason, R.P. Mathematical Modeling of Tumor Response to Radiation: Radio-Sensitivity Correlation with BOLD, TOLD, Δr1 and Δr2∗ Investigated in Large Dunning R3327-AT1 Rat Prostate Tumors. In Proceedings of the Annual International Conference of the IEEE Engineering in Medicine and Biology Society, EMBS, Milan, Italy, 25–29 August 2015; Volume 2015, pp. 3266–3269. [Google Scholar]
- Lind, B.K.; Persson, L.M.; Edgren, M.R.; Hedlöf, I.; Brahme, A. Repairable–Conditionally Repairable Damage Model Based on Dual Poisson Processes. Radiat. Res. 2003, 160, 366–375. [Google Scholar] [CrossRef] [PubMed]
- Farayola, M.F.; Shafie, S.; Siam, F.M.; Khan, I. Mathematical Modeling of Radiotherapy Cancer Treatment Using Caputo Fractional Derivative. Comput. Methods Programs Biomed. 2020, 188, 105306. [Google Scholar] [CrossRef] [PubMed]
- Zaider, M.; Wuu, C.S.; Minerbo, G.N. The Combined Effects of Sublethal Damage Repair, Cellular Repopulation and Redistribution in the Mitotic Cycle. I. Survival Probabilities after Exposure to Radiation. Radiat. Res. 1996, 145, 457. [Google Scholar] [CrossRef]
- Fakir, H.; Hlatky, L.; Li, H.; Sachs, R. Repopulation of Interacting Tumor Cells during Fractionated Radiotherapy: Stochastic Modeling of the Tumor Control Probability. Med. Phys. 2013, 40, 121716. [Google Scholar] [CrossRef] [PubMed]
- Yang, J.; Yue, J.B.; Liu, J.; Yu, J.M. Repopulation of Tumor Cells during Fractionated Radiotherapy and Detection Methods (Review). Oncol. Lett. 2014, 7, 1755–1760. [Google Scholar] [CrossRef] [Green Version]
- Badri, H.; Watanabe, Y.; Leder, K. Optimal Radiotherapy Dose Schedules under Parametric Uncertainty. Phys. Med. Biol. 2016, 61, 338–364. [Google Scholar] [CrossRef]
- Saberian, F.; Ghate, A.; Kim, M. Optimal Fractionation in Radiotherapy with Multiple Normal Tissues. Math. Med. Biol. 2015, 33, 211–252. [Google Scholar] [CrossRef] [PubMed] [Green Version]
- Grogan, J.A.; Markelc, B.; Connor, A.J.; Muschel, R.J.; Pitt-Francis, J.M.; Maini, P.K.; Byrne, H.M. Predicting the Influence of Microvascular Structure on Tumor Response to Radiotherapy. IEEE Trans. Biomed. Eng. 2017, 64, 504–511. [Google Scholar] [CrossRef]
- Harting, C.; Peschke, P.; Borkenstein, K.; Karger, C.P. Single-Cell-Based Computer Simulation of the Oxygen-Dependent Tumour Response to Irradiation. Phys. Med. Biol. 2007, 52, 4775–4789. [Google Scholar] [CrossRef]
- Kempf, H.; Bleicher, M.; Meyer-Hermann, M.; Rocha, S. Spatio-Temporal Dynamics of Hypoxia during Radiotherapy. PLoS ONE 2015, 10, e0133357. [Google Scholar] [CrossRef]
- Jeho, J.; Jung, H.O.; Jan-Jakob, S.; Jose, B.; Jeffrey, D.B.; Andrew, N.F.; Shyam, S.R.; Joseph, O.D. Modeling the Cellular Response of Lung Cancer to Radiation Therapy for a Broad Range of Fractionation Schedules. Clin. Cancer Res. 2018, 176, 139–148. [Google Scholar] [CrossRef]
- Petersson, K.; Adrian, G.; Butterworth, K.; McMahon, S.J. A Quantitative Analysis of the Role of Oxygen Tension in FLASH Radiation Therapy. Int. J. Radiat. Oncol. Biol. Phys. 2020, 107, 539–547. [Google Scholar] [CrossRef] [PubMed]
- Gago-Arias, A.; Aguiar, P.; Espinoza, I.; Sánchez-Nieto, B.; Pardo-Montero, J. Modelling Radiation-Induced Cell Death and Tumour Re-Oxygenation: Local versus Global and Instant versus Delayed Cell Death. Phys. Med. Biol. 2016, 61, 1204–1216. [Google Scholar] [CrossRef]
- Chen, Y.; Cairns, R.; Papandreou, I.; Koong, A.; Denko, N.C. Oxygen Consumption Can Regulate the Growth of Tumors, a New Perspective on the Warburg Effect. PLoS ONE 2009, 4, e7033. [Google Scholar] [CrossRef] [PubMed] [Green Version]
- Mi, H.; Petitjean, C.; Dubray, B.; Vera, P.; Ruan, S. Prediction of Lung Tumor Evolution during Radiotherapy in Individual Patients with Pet. IEEE Trans. Med. Imaging 2014, 33, 995–1003. [Google Scholar] [CrossRef] [PubMed]
- Grimes, D.R.D.; Kannan, P.; Warren, D.R.; Markelc, B.; Bates, R.; Muschel, R.; Partridge, M.; Gray, L.; Conger, A.; Ebert, M.; et al. Estimating Oxygen Distribution from Vasculature in Three-Dimensional Tumour Tissue. J. R. Soc. Interface 2016, 13, 20160070. [Google Scholar] [CrossRef] [PubMed] [Green Version]
- Powathil, G.G.; Gordon, K.E.; Hill, L.A.; Chaplain, M.A.J. Modelling the Effects of Cell-Cycle Heterogeneity on the Response of a Solid Tumour to Chemotherapy: Biological Insights from a Hybrid Multiscale Cellular Automaton Model. J. Theor. Biol. 2012, 308, 1–19. [Google Scholar] [CrossRef]
- Dawson, A.; Hillen, T. Derivation of the Tumour Control Probability (TCP) from a Cell Cycle Model. Comput. Math. Methods Med. 2006, 7, 121–141. [Google Scholar] [CrossRef] [Green Version]
- Apeke, S.; Gaubert, L.; Boussion, N.; Lambin, P.; Visvikis, D.; Rodin, V.; Redou, P. Multi-Scale Modelling and Oxygen Impact on Tumor Temporal Evolution: Application on Rectal Cancer during Radiotherapy. IEEE Trans. Med. Imaging 2018, 37, 871. [Google Scholar] [CrossRef]
- Alfonso, J.C.L.; Berk, L. Modeling the Effect of Intratumoral Heterogeneity of Radiosensitivity on Tumor Response over the Course of Fractionated Radiation Therapy. Radiat. Oncol. 2019, 14, 88. [Google Scholar] [CrossRef] [Green Version]
- Hedman, M.; Bjrk-Eriksson, T.; Mercke, C.; West, C.; Hesselius, P.; Brodin, O. Comparison of Predicted and Clinical Response to Radiotherapy: A Radiobiology Modelling Study. Acta Oncol. 2009, 48, 584–590. [Google Scholar] [CrossRef]
- Hedman, M.; Björk-Eriksson, T.; Brodin, O.; Toma-Dasu, I. Predictive Value of Modelled Tumour Control Probability Based on Individual Measurements of in Vitro Radiosensitivity and Potential Doubling Time. Br. J. Radiol. 2013, 86, 20130015. [Google Scholar] [CrossRef] [Green Version]
- Betts, H.M.; O’Connor, R.A.; Christian, J.A.; Vinayakamoorthy, V.; Foweraker, K.; Pascoe, A.C.; Perkins, A.C. Hypoxia Imaging with [18 F]HX4 PET in Squamous Cell Head and Neck Cancers: A Pilot Study for Integration into Treatment Planning. Nucl. Med. Commun. 2019, 40, 73–78. [Google Scholar] [CrossRef] [PubMed]
- Dubois, L.J.; Lieuwes, N.G.; Janssen, M.H.M.; Peeters, W.J.M.; Windhorst, A.D.; Walsh, J.C.; Kolb, H.C.; Öllers, M.C.; Bussink, J.; Van Dungeon, G.A.M.S.; et al. Preclinical Evaluation and Validation of [ 18F]HX4,a Promising Hypoxia Marker for Imaging. Proc. Natl. Acad. Sci. USA 2011, 108, 14620–14625. [Google Scholar] [CrossRef] [PubMed] [Green Version]
- Espinoza, I.; Peschke, P.; Karger, C.P. A Model to Simulate the Oxygen Distribution in Hypoxic Tumors for Different Vascular Architectures. Med. Phys. 2013, 40, 081703. [Google Scholar] [CrossRef] [PubMed]
- Wille, J.; Pittelkow, M.; Shipley, G.; Scott, R. Integrated Control of Growth and Differentiation of Normal Human Prokeratinocytes Cultured in Serum-Free Medium: Clonal Analyses, Growth Kinetics, and Cell Cycle Studies. J. Cell. Physiol. 1984, 121, 31–44. [Google Scholar] [CrossRef] [PubMed]
- Steel, G.G. Basic Clinical Radiobiology, 3rd ed.; George, G., Ed.; Hodder Arnold: London, UK, 2002; ISBN 9780340807835. [Google Scholar]
- Titz, B.; Jeraj, R. An Imaging-Based Tumour Growth and Treatment Response Model: Investigating the Effect of Tumour Oxygenation on Radiation Therapy Response. Phys. Med. Biol. 2008, 53, 4471. [Google Scholar] [CrossRef] [Green Version]
- Denekamp, J.; Hobson, B. Endothelial-Cell Proliferation in Experimental Tumours. Br. J. Cancer 1982, 46, 711–720. [Google Scholar] [CrossRef] [Green Version]
- Malaise, E.P.; Fertil, B.; Chavaudra, N.; Guichard, M. Distribution of Radiation Sensitivities for Human Tumor Cells of Specific Histological Types: Comparison of In Vivo to In Vitro Data. J. Radrorron Oncol. Biol. Phys 1986, 12, 617–624. [Google Scholar] [CrossRef]
- Nash, J.C.; Dalrymple, G.V.; Moss, A.J.; Baker, M.L. Initial Studies with a Line of Radioresistant Rat Tumor Cells. Radiat. Res. 1974, 60, 280–291. [Google Scholar] [CrossRef]
- Hall, E.J.; Giaccia, A.J. Radiobiology for the Radiologist, 6th Edition. Int. J. Radiat. Oncol. 2006, 66, 627. [Google Scholar] [CrossRef]
- Krock, B.L.; Skuli, N.; Simon, M.C. Hypoxia-Induced Angiogenesis: Good and Evil. Genes Cancer 2011, 2, 1117–1133. [Google Scholar] [CrossRef] [Green Version]
- Schulz, A.; Meyer, F.; Dubrovska, A.; Borgmann, K. Cancer Stem Cells and Radioresistance: DNA Repair and Beyond. Cancers 2019, 11, 862. [Google Scholar] [CrossRef] [PubMed] [Green Version]
- Brown, J.M.; Carlson, D.J.; Brenner, D.J. The Tumor Radiobiology of SRS and SBRT: Are More than the 5 Rs Involved? Int. J. Radiat. Oncol. Biol. Phys. 2014, 88, 254–262. [Google Scholar] [CrossRef] [Green Version]
- Branzei, D.; Foiani, M. Regulation of DNA Repair throughout the Cell Cycle. Nat. Rev. Mol. Cell Biol. 2008, 9, 297–308. [Google Scholar] [CrossRef] [PubMed]
- Liu, Y.; Chen, X.; Hu, Q.; Huang, J.; Ling, C. Resistance to Radiotherapy in Lung Cancer. Int. J. Clin. Exp. Med. 2018, 11, 7628–7642. [Google Scholar]
- Withers, H.R. The Four R’s of Radiotherapy; Academic Press, Inc.: Cambridge, MA, USA, 1975; Volume 5. [Google Scholar]
- Han, W.; Yu, K.N. Response of Cells to Ionizing Radiation. Adv. Biomed. Sci. Eng. 2009, 59, 204–262. [Google Scholar] [CrossRef] [Green Version]
- Naderi, S.; Hunton, I.C.; Wang, J.Y.J. Radiation Dose-Dependent Maintenance of G(2) Arrest Requires Retinoblastoma Protein. Cell Cycle 2002, 1, 192–199. [Google Scholar] [CrossRef] [Green Version]
- Brown, J.M. The Hypoxic Cell: A Target for Selective Cancer Therapy—Eighteenth Bruce F. Cain Memorial Award Lecture. Cancer Res. 1999, 59, 5863–5870. [Google Scholar]
- Nakamura, T.; Matsumine, A.; Matsubara, T.; Asanuma, K.; Uchida, A.; Sudo, A. Clinical Impact of the Tumor Volume Doubling Time on Sarcoma Patients with Lung Metastases. Clin. Exp. Metastasis 2011, 28, 819–825. [Google Scholar] [CrossRef]
- Nordsmark, M.; Bentzen, S.M.; Rudat, V.; Brizel, D.; Lartigau, E.; Stadler, P.; Becker, A.; Adam, M.; Molls, M.; Dunst, J.; et al. Prognostic Value of Tumor Oxygenation in 397 Head and Neck Tumors after Primary Radiation Therapy. An International Multi-Center Study. Radiother. Oncol. 2005, 77, 18–24. [Google Scholar] [CrossRef]
- Lewin, T.D.; Maini, P.K.; Moros, E.G.; Enderling, H.; Byrne, H.M. The Evolution of Tumour Composition During Fractionated Radiotherapy: Implications for Outcome. Bull. Math. Biol. 2018, 80, 1207–1235. [Google Scholar] [CrossRef] [Green Version]
- Thomlinson, R.H.; Gray, L.H. The Histological Structure of Some Human Lung Cancers and the Possible Implications for Radiotherapy. Br. J. Cancer 1955, 9, 539–549. [Google Scholar] [CrossRef] [Green Version]
- Crokart, N.; Jordan, B.F.; Baudelet, C.; Ansiaux, R.; Sonveaux, P.; Grégoire, V.; Beghein, N.; DeWever, J.; Bouzin, C.; Feron, O.; et al. Early Reoxygenation in Tumors after Irradiation: Determining Factors and Consequences for Radiotherapy Regimens Using Daily Multiple Fractions. Int. J. Radiat. Oncol. Biol. Phys. 2005, 63, 901–910. [Google Scholar] [CrossRef]
- Espinoza, I.; Peschke, P.; Karger, C.P. A Voxel-Based Multiscale Model to Simulate the Radiation Response of Hypoxic Tumors. Med. Phys. 2015, 42, 90–102. [Google Scholar] [CrossRef]
- Steel, G.G.; Mcmillan, T.J.; Peacock, J.H. The 5rs of Radiobiology. Int. J. Radiat. Biol. 1989, 56, 1045–1048. [Google Scholar] [CrossRef] [Green Version]
- Peeters, S.G.J.A.; Zegers, C.M.L.; Biemans, R.; Lieuwes, N.G.; Van Stiphout, R.G.P.M.; Yaromina, A.; Sun, J.D.; Hart, C.P.; Windhorst, A.D.; Van Elmpt, W.; et al. TH-302 in Combination with Radiotherapy Enhances the Therapeutic Outcome and Is Associated with Pretreatment [18F]HX4 Hypoxia PET Imaging. Clin. Cancer Res. 2015, 21, 2984–2992. [Google Scholar] [CrossRef] [PubMed] [Green Version]
- Sanduleanu, S.; van der Wiel, A.M.A.; Lieverse, R.I.Y.; Marcus, D.; Ibrahim, A.; Primakov, S.; Wu, G.; Theys, J.; Yaromina, A.; Dubois, L.J.; et al. Hypoxia PET Imaging with [18F]-HX4—A Promising Next-Generation Tracer. Cancers 2020, 12, 1322. [Google Scholar] [CrossRef] [PubMed]
- De Bruycker, S.; Vangestel, C.; Van Den Wyngaert, T.; Pauwels, P.; Wyffels, L.; Staelens, S.; Stroobants, S. 18F-Flortanidazole Hypoxia PET Holds Promise as a Prognostic and Predictive Imaging Biomarker in a Lung Cancer Xenograft Model Treated with Metformin and Radiotherapy. J. Nucl. Med. 2019, 60, 34–40. [Google Scholar] [CrossRef] [PubMed] [Green Version]
- Lonati, L.; Barbieri, S.; Guardamagna, I.; Ottolenghi, A.; Baiocco, G. Radiation-Induced Cell Cycle Perturbations: A Computational Tool Validated with Flow-Cytometry Data. Sci. Rep. 2021, 11, 925. [Google Scholar] [CrossRef]
- Suwinski, R.; Wzietek, I.; Tarnawski, R.; Namysl-Kaletka, A.; Kryj, M.; Chmielarz, A.; Wydmanski, J. Moderately Low Alpha/Beta Ratio for Rectal Cancer May Best Explain the Outcome of Three Fractionation Schedules of Preoperative Radiotherapy. Int. J. Radiat. Oncol. Biol. Phys. 2007, 69, 793–799. [Google Scholar] [CrossRef] [PubMed]
- Dirscherl, T.; Rickhey, M.; Bogner, L. Feasibility of TCP-Based Dose Painting by Numbers Applied to a Prostate Case with 18F-Choline PET Imaging. Z. Med. Phys. 2012, 22, 48–57. [Google Scholar] [CrossRef] [PubMed]
- Brooks, S.; Glynne-Jones, R.; Novell, R.; Harrison, M.; Brown, K.; Makris, A. Short Course Continuous, Hyperfractionated, Accelerated Radiation Therapy (CHART) as Preoperative Treatment for Rectal Cancer. Acta Oncol. 2006, 45, 1079–1085. [Google Scholar] [CrossRef] [PubMed]
- Boustani, J.; Grapin, M.; Laurent, P.A.; Apetoh, L.; Mirjolet, C. The 6th R of Radiobiology: Reactivation of Anti-Tumor Immune Response. Cancers 2019, 11, 860. [Google Scholar] [CrossRef] [PubMed] [Green Version]


| Time (h) | Percentage of Cells in: | |||
|---|---|---|---|---|
| G1 | S | G2 | M | |
| 0 | 68.44 | 20.04 | 8.77 | 2.75 |
| 24 | 68.58 | 16.44 | 12.22 | 2.75 |
Disclaimer/Publisher’s Note: The statements, opinions and data contained in all publications are solely those of the individual author(s) and contributor(s) and not of MDPI and/or the editor(s). MDPI and/or the editor(s) disclaim responsibility for any injury to people or property resulting from any ideas, methods, instructions or products referred to in the content. |
© 2023 by the authors. Licensee MDPI, Basel, Switzerland. This article is an open access article distributed under the terms and conditions of the Creative Commons Attribution (CC BY) license (https://creativecommons.org/licenses/by/4.0/).
Share and Cite
Hami, R.; Apeke, S.; Redou, P.; Gaubert, L.; Dubois, L.J.; Lambin, P.; Visvikis, D.; Boussion, N. Predicting the Tumour Response to Radiation by Modelling the Five Rs of Radiotherapy Using PET Images. J. Imaging 2023, 9, 124. https://doi.org/10.3390/jimaging9060124
Hami R, Apeke S, Redou P, Gaubert L, Dubois LJ, Lambin P, Visvikis D, Boussion N. Predicting the Tumour Response to Radiation by Modelling the Five Rs of Radiotherapy Using PET Images. Journal of Imaging. 2023; 9(6):124. https://doi.org/10.3390/jimaging9060124
Chicago/Turabian StyleHami, Rihab, Sena Apeke, Pascal Redou, Laurent Gaubert, Ludwig J. Dubois, Philippe Lambin, Dimitris Visvikis, and Nicolas Boussion. 2023. "Predicting the Tumour Response to Radiation by Modelling the Five Rs of Radiotherapy Using PET Images" Journal of Imaging 9, no. 6: 124. https://doi.org/10.3390/jimaging9060124