Article

Exploration of Optical, Redox, and Catalytic Properties of Vanadia-Mayenite Nanocomposites

by
Ekaterina I. Shuvarakova
,
Ekaterina V. Ilyina
,
Vladimir O. Stoyanovskii
,
Grigory B. Veselov
,
Alexander F. Bedilo
and
Aleksey A. Vedyagin
*
Boreskov Institute of Catalysis SB RAS, pr. Ac. Lavtentieva 5, 630090 Novosibirsk, Russia
*
Author to whom correspondence should be addressed.
J. Compos. Sci. 2022, 6(10), 308; https://doi.org/10.3390/jcs6100308
Submission received: 15 September 2022 / Revised: 2 October 2022 / Accepted: 9 October 2022 / Published: 12 October 2022
(This article belongs to the Section Nanocomposites)

Abstract

:
The present paper continues the exploration of the physicochemical and catalytic properties of vanadia-mayenite composites. The samples were prepared by an impregnation of calcium aluminate Ca12Al14O33 (mayenite, C12A7) with a solution of vanadium precursor. Pure mayenite and V/C12A7 nanocomposites were characterized by Raman and diffuse reflectance UV–Vis spectroscopies. The reducibility of the samples was examined in temperature-programmed reduction experiments performed in a hydrogen atmosphere. The catalytic performance of vanadium-containing systems was studied in the non-oxidative dehydrogenation of ethane. As found, the low-loaded sample (5%V/C12A7 sample) contains vanadium predominantly in the form of Ca3(VO4)2, while for the 10%V/C12A7 sample, two types of calcium vanadates (Ca2V2O7 and Ca3(VO4)2) are registered. The presence of these phases defines the spectroscopic characteristics and the redox properties of nanocomposites. Both the samples, 5%V/C12A7 and 10%V/C12A7, exhibit comparable catalytic activity, which is mainly connected with the amount of the Ca3(VO4)2 phase. The uniqueness of the studied catalysts is their excellent tolerance toward coke formation under the reaction conditions.

1. Introduction

Calcium aluminates of the mayenite structure belong to a new class of materials, which are intensively studied in various fields of science and technology, and the area of their application widens every day [1]. The stoichiometric chemical formula for the unit cell of mayenite can be represented as [Ca24Al28O64]4+(O2−)2, where O2− ions are located in cages formed by the mayenite’s framework. The uniqueness of this material comes from the fact that O2− ions can be substituted with other anions such as O2, O, O2−, F, H, OH, NO2, or even electrons [2,3]. Upon preparation, mayenite can already contain a number of oxygen anion species without the need of any special treatment [4]. In many cases, the properties of mayenite can be changed greatly depending on the type of anions in its framework.
Optical properties of the mayenite-based materials have been of great interest recently. In particular, Eu3+ can substitute Ca2+ in the mayenite lattice, which results in enhanced luminescent characteristics [5,6]. The mayenite-based high-temperature stable ceramic pigments prepared from Eu- and Nd-doped layered double hydroxide precursors allows the obtaining of multi-wavelength luminescent materials, which emit in a wide spectral region. Such materials can be employed in broadband amplifiers or as barcodes [7]. The emission spectra of Bi3+-doped mayenites can be tuned by changing the type of anion in the nanocages (O2−, F, and Cl) [8].
The mayenite-based materials have been investigated to be used as supports for various catalytic processes. For example, Ru-loaded C12A7:e electrides have been shown to be promising catalysts for ammonia synthesis [9] and decomposition [10]. Such an improvement in catalytic activity is attributed to the enhanced dissociation of N2 molecules (which is a limiting step in ammonia synthesis) by a donation of electrons from mayenite. Higher electron densities result in a higher catalytic activity with lower activation energy [11]. The main drawback of the process, poisoning of Ru by hydrogen, is also suppressed by a reversible storage of H in mayenite cages.
One of the possible applications of mayenite is its use as a catalyst for the oxidation reactions. Due to the presence of various active oxygen species (O2−, O, O2−, O22−, and OH) stored in the mayenite nanocages, it possesses catalytic activity without the addition of any metal or metal oxide as active components. However, these oxygen species are mainly located in the bulk of mayenite, which complicates their accessibility for the reactants. For instance, the hydrogen consumption in the temperature-programmed reduction of mayenite prepared by a conventional ceramic route was just 10 μmol/g [2]. Such a low value can be explained by the reduction of surface species only. On the other hand, Intiso et al. reported that the hydrogen uptake can be varied in a range from 0.45 to 1.19 mmol/g, depending on the preparation method [12]. The doping of mayenite with 1.5–2 wt% of Fe was shown to facilitate the reduction of oxygen species in mayenite and improve the catalytic performance as well [13]. For instance, the high activity of mayenite in trichloroethylene (TCE) oxidation was observed by Cucciniello et al. [14]. Mayenite of relatively low surface area (4.5 m2/g) was capable of total oxidation of TCE without coke formation, thus demonstrating high recyclability. It was revealed by Raman spectroscopy that O2 ions are retained in Fe-doped mayenite even after testing under reaction conditions, which is not typical for pure mayenite. The high-surface-area mayenite exhibits higher activity in soot oxidation and shifts the process temperatures toward the lower values [15].
The mayenite-based materials are also promising catalysts for steam reforming of methane and tar [16,17,18,19,20]. Ni/mayenite compositions are typically employed for this purpose. As known, the most important problems in steam reforming are the coke formation and the poisoning with sulfur, causing the deactivation of the catalyst [21]. Highly reactive oxygen species of mayenite are capable of oxidizing carbon deposits and removing sulfur from the metal surface. Sorption-enhanced steam reforming with Ni-CaO/mayenite used as a catalyst is an especially promising approach [16,19]. An in situ adsorption of CO2 shifts the reaction equilibrium to the product side and allows the production of hydrogen of higher purity.
Although all the traditional processes of non-oxidative dehydrogenation of light olefins employ either platinum- or chromium-oxide-based catalysts, supported vanadium-oxide-based catalysts used mostly in the oxidative dehydrogenation processes are of growing interest as well [22,23,24]. In a comparative work by Sokolov et al. [23], VOx/MCM-41 catalysts demonstrated a higher stability in four dehydrogenation cycles than Pt/MCM-41 and CrOx/MCM-41. As reported by various authors, isolated VOx tetrahedra provide improved activity and stability if compared with polymerized VOx species [25]. Gu et al. showed that the addition of phosphine promotes the formation of isolated VOx species [26]. Vanadium oxide supported on ZrO2 appeared to be more active than vanadium oxide supported on Al2O3 because of its better reducibility and the facilitated formation of low-coordinated VOx species [27]. This, in turn, enhanced the C-H activation significantly. Another example is the combined use of V-Mg-O and Ni-Mg-O, which allows the increase in the yield of ethylene in a temperature range of 600–650 °C [28].
Such features of mayenite-based composites as a high resistance toward coking along with the presence of highly reactive oxygen species allow the anticipation of their excellent catalytic performance in the dehydrogenation processes. As known from the literature, Raman spectroscopy allows the detection of O22− and O2 ions in mayenite [29], which, as mentioned previously, defines its unique catalytic activity. The 2D and 3D Raman imaging technique can be informative as well [30]. As we have reported recently [31], vanadia-mayenite nanocomposites can be successfully prepared by an impregnation of the dispersed mayenite particles with an ammonia vanadate solution. These nanocomposites were characterized by the low-temperature nitrogen adsorption/desorption technique, X-ray diffraction analysis, high-resolution transmission electron microscopy, and electron paramagnetic resonance (a spin probe technique). In the present work, an additional insight into the physicochemical properties of these nanocomposites by means of diffuse reflectance UV–Vis and Raman spectroscopies is provided. The reproducibility of the redox properties of vanadia-mayenite nanocomposites was assessed by means of temperature-programmed reduction of hydrogen (TPR-H2). Finally, the catalytic activity of the prepared samples in the ethane dehydrogenation reaction was studied in comparison with the V-Mg-O reference catalyst. The long-term stability of the nanocomposites was examined in durability tests at 700 °C.

2. Materials and Methods

2.1. Preparation of the Samples

The high-dispersity samples of pure mayenite were prepared in an aqueous medium using high-dispersity aluminum and calcium hydroxides [32]. In order to obtain Ca(OH)2, calcium carbonate (LLC Reakhim, Moscow, Russia) was calcined in a muffle furnace with the formation of CaO. The latter was dissolved in a suspension of pseudoboehmite (Sasol, Sandton, South Africa) in distilled water. The chemicals were taken in amounts providing the required Ca/Al ratio of 12/14. The mixture was stirred for 10 h, resulting in the formation of a joint hydroxide of aluminum and calcium. The filtered sediment was dried at 110 °C and calcined in air at 600 °C.
To prepare the vanadia-mayenite composites (V/C12A7), pure mayenite (5 g) was impregnated with 57.5 mL or 115 mL of the ammonium vanadate NH4VO3 (LLC Plant of Rare Metals, Koltsovo, Russia) aqueous solution heated to 70 °C. The mixture was stirred for 3 h at the same temperature, dried, and calcined in air at 90 °C for 24 h and at 600 °C for 6 h, respectively. Thus, the composite samples 5%V/C12A7 and 10%V/C12A7 containing 5% or 10% of vanadium (with respect to V2O5) were obtained, respectively.
The V-Mg-O oxide system was used as a reference material for catalytic tests. The sample was synthesized as described elsewhere [28]. Magnesium tape (2.4 g, Sigma-Aldrich, St. Louis, MO, USA) was dissolved in methanol (90 mL, Avantor Performance Materials, Gliwice, Poland). The mixture was stirred with heating for 1 h, and then toluene (100 mL, Component-Reaktiv, Moscow, Russia) was added. In order to provide slow hydrolysis of magnesium methoxide, distilled water (3.6 mL) was added dropwise with continuous stirring. When the gel of magnesium hydroxide was formed, a solution of vanadium precursor (1.04 g of vanadyl acetylacetonate (Alfa Aesar, Ward Hill, MA, USA) in a mixture of 20 mL of methanol, 10 mL of toluene, and 1.8 mL of H2O) was loaded into the vessel. The mixture was kept there for 24 h. Then, the resulting joint gel was placed in an autoclave and heated with a ramping rate of 1.3 °C/min for the solvent removal under supercritical conditions. The final pressure and temperature in the autoclave were 80 atm and 265 °C, correspondingly. The obtained vanadium-magnesium aerogel was placed in a muffle furnace, heated at a ramping rate of 1 °C/min up to 500 °C, and maintained at this temperature for 1 h.

2.2. Characterization of Pure Mayenite and Vanadia-Mayenite Composites

Diffuse reflectance UV–Vis spectra were recorded between 190 and 800 nm using a UV–Vis spectrometer Varian Cary 300 UV/VIS Bio (Agilent, Santa Clara, CA, USA) with a DRA-CA-3300 integrating sphere (Labsphere, North Sutton, NH, USA) with the Spectralon standard as a reference. The UV–Vis spectra were transformed into the Kubelka–Munk function F(R) = α/s [33], where α is the absorption and s is the scattering. The energy-gap width (Eg) was estimated from the UV–Vis spectra using an expression proposed by Tauc, Davis, and Mott:
[F(R)·]n = A·(Eg)
where h is the Planck’s constant, ν is the frequency of vibration, represents the energy per photon, function F(R) ~ α is the absorption coefficient, Eg is the band gap, and A is the proportional constant. The value of n = 1/2 means an indirect allowed transition, while n = 2 represents a direct allowed transition [34].
Raman spectra of the samples were collected on a Horiba Jobin Yvon LabRAM HR UV-VIS-NIR Evolution Raman spectrometer (Horiba France SAS, Longjumeau, France) equipped with an Olympus BX41 microscope (Olympus Corp., Tokyo, Japan) and the 514.5 nm line of an Ar ion laser. The power of light focused in a spot with a diameter of ∼2 μm was less than 0.8 mW to avoid the thermal decomposition of the sample. The samples were examined in a naturally hydrated state under the atmospheric conditions.
Temperature-programmed reduction of hydrogen (TPR-H2) was performed to study the reduction behavior of the samples. A specimen (200 mg) was loaded into a quartz reactor. Then, the reactor was fed with a mixture of 10% H2 and 90% N2. The gas flow rate was 57.8 mL/min. The temperature of the reactor was increased from room temperature to 700 °C with a ramping rate of 10 °C/min. The hydrogen concentration at the reactor outlet was measured using a GAMMA-100 gas (H2) analyzer (Analitpribor, Smolensk, Russia). Finally, the reactor was cooled down to room temperature in a nitrogen flow. In order to study the reproducibility of the reduction behavior, the samples were re-oxidized in an air flow at 500 °C. Each sample was examined in five redox cycles.

2.3. Testing the Catalytic Activity of Vanadia-Mayenite Composites

The catalytic activity of the vanadia-mayenite composites was studied in a model reaction of ethane dehydrogenation. In each experiment, a specimen (200 mg) was loaded in a quartz reactor. Next, the reactor was heated up to 450 °C in a helium flow (50 mL/min). Then, a mixture of 5% ethane in helium was fed into the reactor with a flow rate of 100 mL/min. The temperature was varied in a range of 450–700 °C with a step of 25 °C. The composition of the gas mixture at the reactor outlet was analyzed by gas chromatography (GC) using a Crystal-2000M gas chromatograph (Chromatec Instruments, Yoshkar-Ola, Russia) equipped with a flame ionization detector. At each temperature point, the analysis of the reaction mixture was performed for five times.
In order to study the stability of the samples under reaction conditions, the durability tests were carried out. During these tests, the catalytic activity was monitored at 700 °C for 9 h. The reaction mixture at the reactor outlet was analyzed by GC every six minutes.

3. Results and Discussion

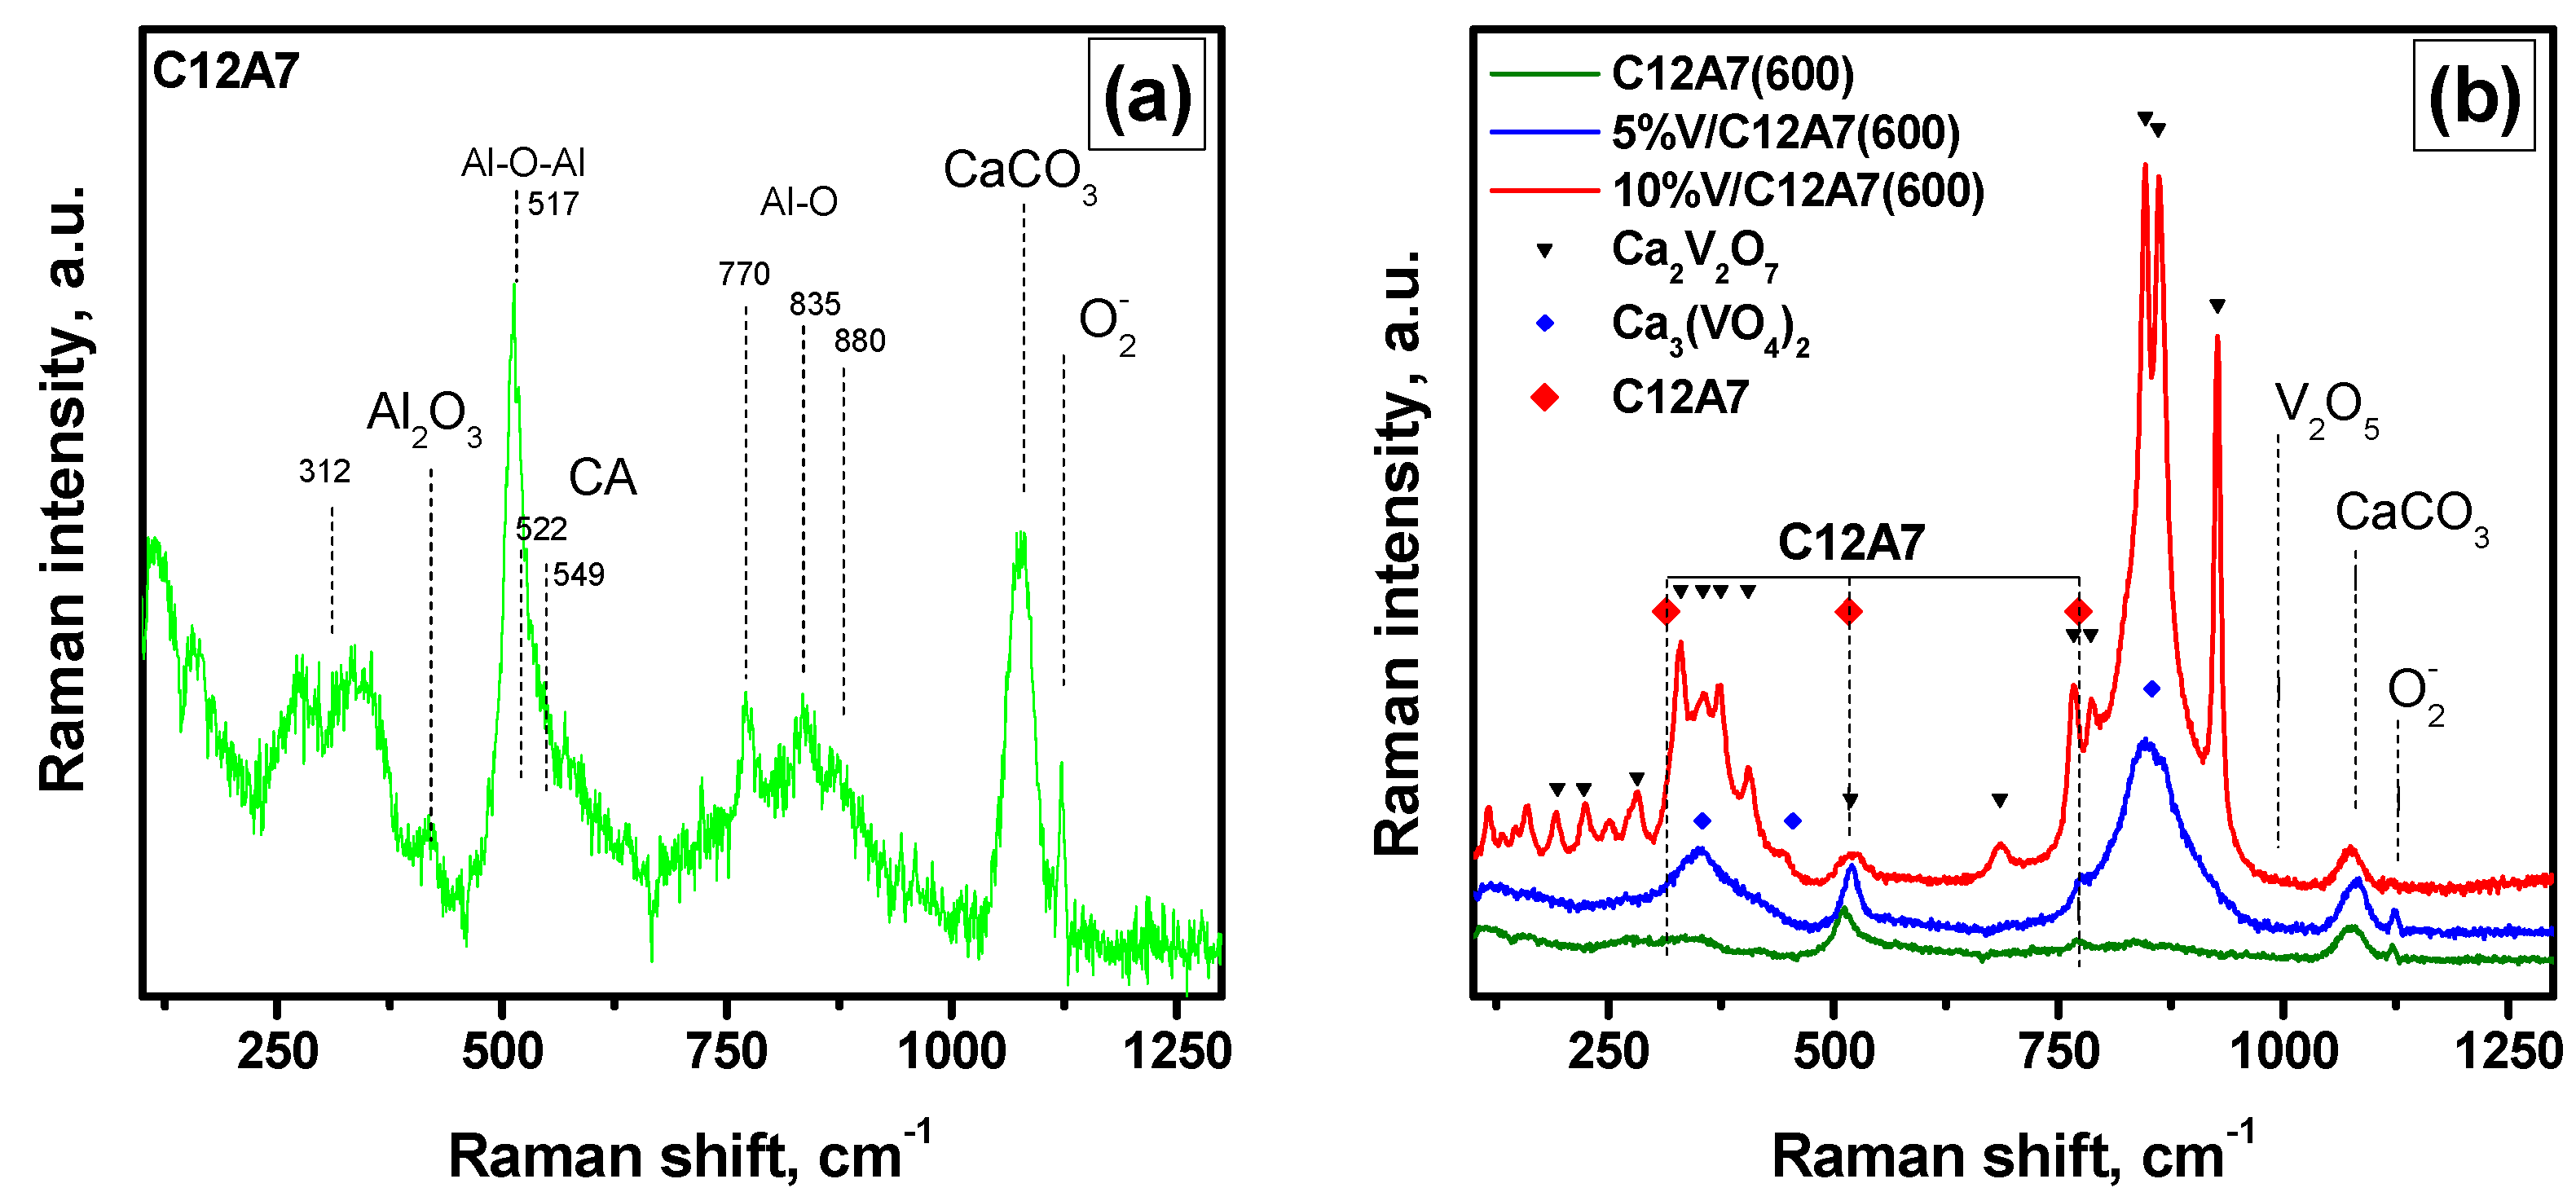
3.1. Raman Spectroscopy Study of Pure Mayenite and Vanadia-Mayenite Composites

Raman spectroscopy is an informative method for characterization of mayenite-based materials. Figure 1 shows Raman spectra of pure mayenite and vanadia-mayenite composites calcined at 600 °C. As follows from the detailed spectrum of pure mayenite (Figure 1a), the most intensive band at 517 cm−1 is the most resolved one. This band is attributed to symmetric Al-O-Al vibrations of the bridge oxygen between AlO4 tetrahedrons [35]. The Al-O stretching vibrations within these tetrahedrons give a group of middle-intensive bands at 770, 880, and 910 cm−1. The group of weaker bands at ~300 cm−1, which are not resolved practically, relates to doubly and triply degenerated framework oxygen [35,36]. The asymmetric profile of the band at 517 cm−1 allows surmising the presence of monocalcium aluminate (CaAl2O4) traces. The Raman spectrum of CaAl2O4 consists of a strong band at 520 cm−1 with a shoulder at 545 cm−1 [37]. Another band at 1128 cm−1 is assigned to the stretching vibration of O2 [38]. Taking into account the XRD data for this sample [31] and the noticeable amount of CaO and Al2O3, the bands at ~1080 and ~420 cm−1 can be attributed to CaCO3 [39] and Al2O3 [40], correspondingly.
Raman spectra of the vanadia-mayenite composites also include the vanadium-related bands (Figure 1b). However, it should be noted that the band at ~995 cm−1 corresponding to crystalline surface forms of V2O5 is absent in spectra of both the V/C12A7 samples. The low-intensive Raman band at ~910 cm−1 of interface vibration mode V-O-Al and two types of V=O stretching band at 1013–1035 cm−1 assigned to monovanadate and polyvanadate species typical for the samples hydrated in air are also not evidently seen [41,42]. Supposedly, these bands are overlapped by more intensive bands of calcium vanadates Ca2V2O7 and Ca3(VO4)2. Thus, in the case of the 5%V/C12A7 sample, the broadened intensive bands at 854 and 354 cm−1 are characteristic for Ca3(VO4)2 in the whitlockite structure (R3c space group). Such a structure with a shift in calcium and oxygen atoms from appropriate locations and with a random distribution of vacancies leads to the overlapping of a number of vibration modes [43].
The Raman spectrum of the 10%V/C12A7 sample (Figure 1b) shows typical narrow Raman modes in three regions. The first region of 800–950 cm−1 corresponds to the symmetric vibrations of terminal VO3 groups. The second region of 400–800 cm−1 is attributed to the stretching vibrations of bridging V-O-V band bending vibrations. The third region contains a band below 400 cm−1 that allows their assignment to Ca2V2O7 [44]. Therefore, if, in the case of the 5%V/C12A7 sample, vanadium is present predominantly in the form of Ca3(VO4)2, then, for the 10%V/C12A7 sample, two types of calcium vanadates (Ca2V2O7 and Ca3(VO4)2) are observed. The molecular structures of these vanadates are shown in Figure 2. These results correlate well with the XRD data reported recently [31].

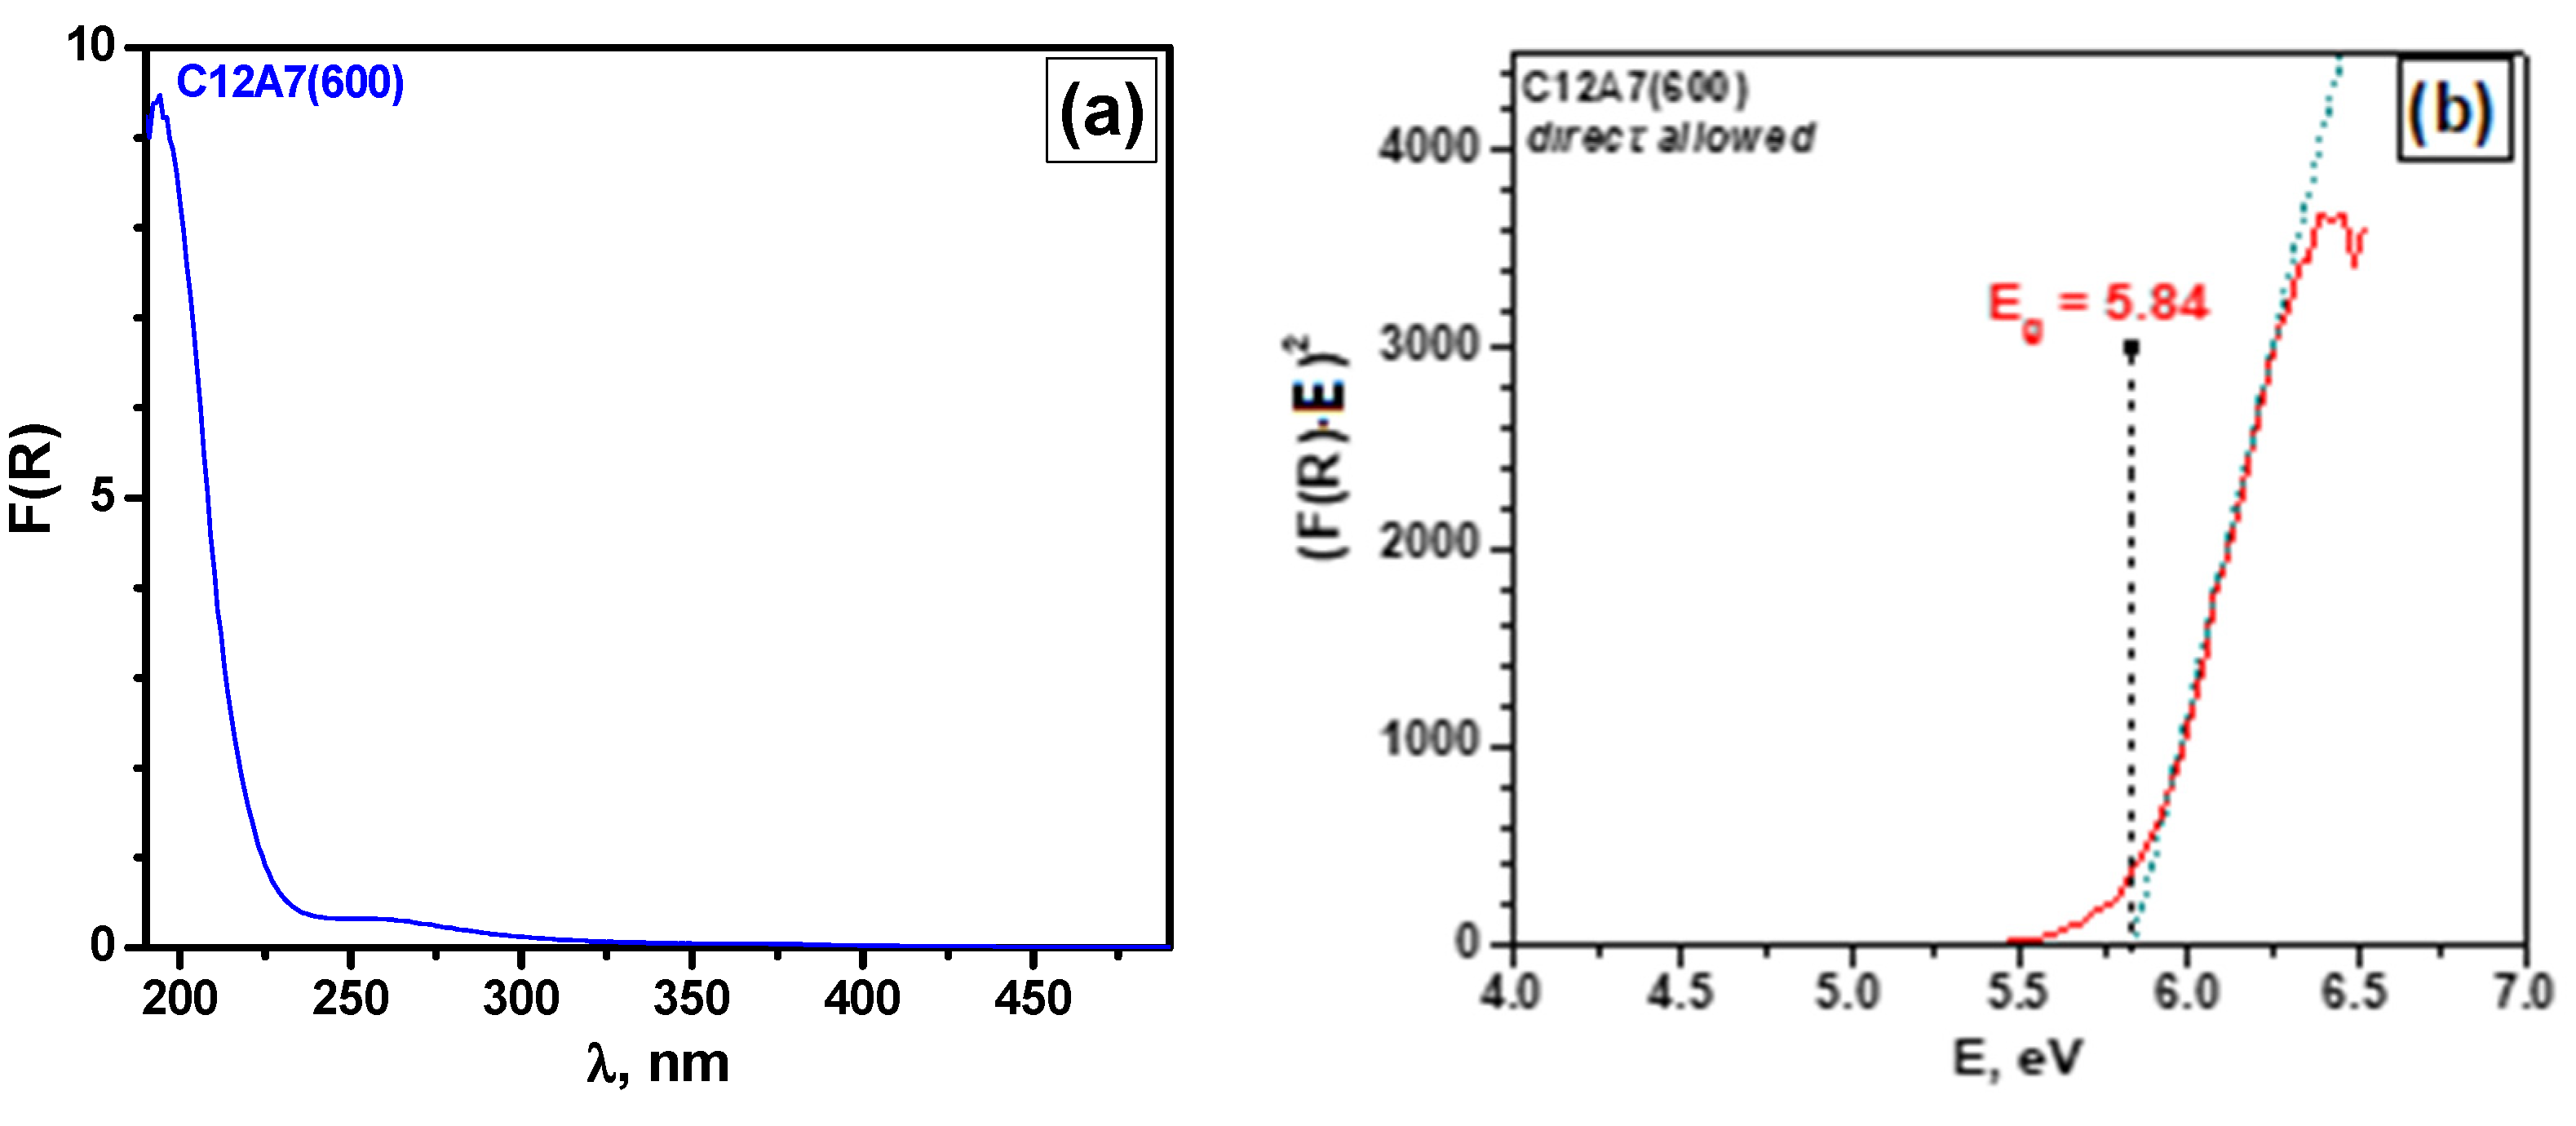
3.2. Diffuse Reflectance UV–Vis Spectroscopy Study of Pure Mayenite

As mentioned above, the stoichiometric cubic unit cell of mayenite is represented by the following formula [Ca24Al28O64]4+(O2−)2, where the first part is a framework built of 12 cages, and O2− ions are extraframework species occupying 2 of 12 framework cages. Mayenite synthesized in an oxidative atmosphere can contain not only O2− ions but OH, O, and O2 anions as well. These extraframework anions form an absorption edge or absorption bands below the fundamental edge assigned to the transition from the top of the valence band to the lower part of the framework’s conduction band (VB FCB, Eg ~ 6.8 eV). The incorporation of anions shifts the absorption edge toward the lower energy values in the following order: OH > O2− > oxygen radicals. The absorption edge of C12A7 is defined by the chemical identity and the relative concentrations of extraframework species, and can be varied from 4 to ~6 eV. The extraframework OH ions seem to be the most stable substituting anions, as they rapidly substitute the extraframework O2− ions during treatment at moderate temperatures in a wet atmosphere [38]. The complete dehydration process of the extraframework OH ions in the cages takes place in a temperature range of 500–1350 °C [45].
Figure 3 demonstrates the diffuse reflectance UV–Vis spectrum of pure mayenite calcined at 600 °C and the dependence of (F(RE)2 on the photon energy E characterizing the energy gap width Eg for the direct allowed transitions, which were determined in accordance with the Tauc method. The observed value of Eg ~ 5.84 eV corresponds to mayenite with a practically complete substitution of extraframework O2− ions with OH anions [34]. Calcination of mayenite in air at 800 and 1000 °C results in decreased Eg values of ~5.58 and ~5.44 eV, which is connected with an enlargement of the mayenite particles. These values are significantly lower than the band gap of γ-Al2O3 (7.6 eV) [46] and the indirect gap of CaO (~6.4 eV) [47], despite the noticeable content of these oxides in the sample. Nevertheless, the absorption in a region typical for the extraframework ions O2− and oxygen radicals in the wavelength region shorter than 300 nm (E > 4 eV) is mainly defined by the impurity ions (Cr3+, Fe3+, etc.).
The emission luminescence spectra of mayenite in a visible region are defined by the impurity ions Cr3+ and Fe3+ coordinated in octahedral and tetrahedral positions, accordingly. The luminescence band of the impurity Fe3+ ions in tetrahedra surrounded with a maximum near 770 nm (Figure 4a) along with the excitation band with a charge transfer at 320 nm is characteristic for γ-Al2O3, where Fe3+ ions can substitute Al3+ in tetrahedra surrounded with Al-O (1.7759 Å) [48,49,50]. The luminescence band at 694 nm corresponds to the Cr3+ impurity ions in γ-Al2O3. However, the positions of the d-d transition bands 4T1g and 4T2g  4A2g at 452 and 551 nm, respectively, do not coincide with that for pure γ-Al2O3 (425 and 564 nm, accordingly). With calcination of the mayenite sample, a rapid increase in luminescence intensity (by ~24 times at 1000 °C) accompanied by an insignificant further rearrangement of the positions of the 4T1g, 4T2g  4A2g bands is observed (Figure 4b). Therefore, the observable luminescence of Cr3+ is supposedly connected with the presence of γ-Al2O3 traces of a disordered (roentgen-amorphous) structure.
There are two tetrahedral positions of Al3+ within the mayenite structure with the Al-O distances of 1.7439–1.7753 Å and 1.7402 Å [51,52], which can be isomorphically substituted with Fe3+ ions. Such a substitution should be accompanied by changes in the lattice constant [53]. Therefore, as the intensity of the Fe3+ luminescence decreases with calcining more slowly than in the case of Cr3+ ions (~2.8 times at 1000 °C), this indicates the possible formation of the luminescence sites of iron within the mayenite structure. No experimental confirmation of the formation of such sites is reported in the literature. The main attention is usually paid for the high-loaded mayenite-based materials. For instance, Ebbinghaus et al. [52] worked with single crystals of C12A7 substituted with 1 mol% of iron. At the same time, the concentration quenching of luminescence for Fe3+ in Al2O3 takes place already at concentrations above 100 ppm [48].

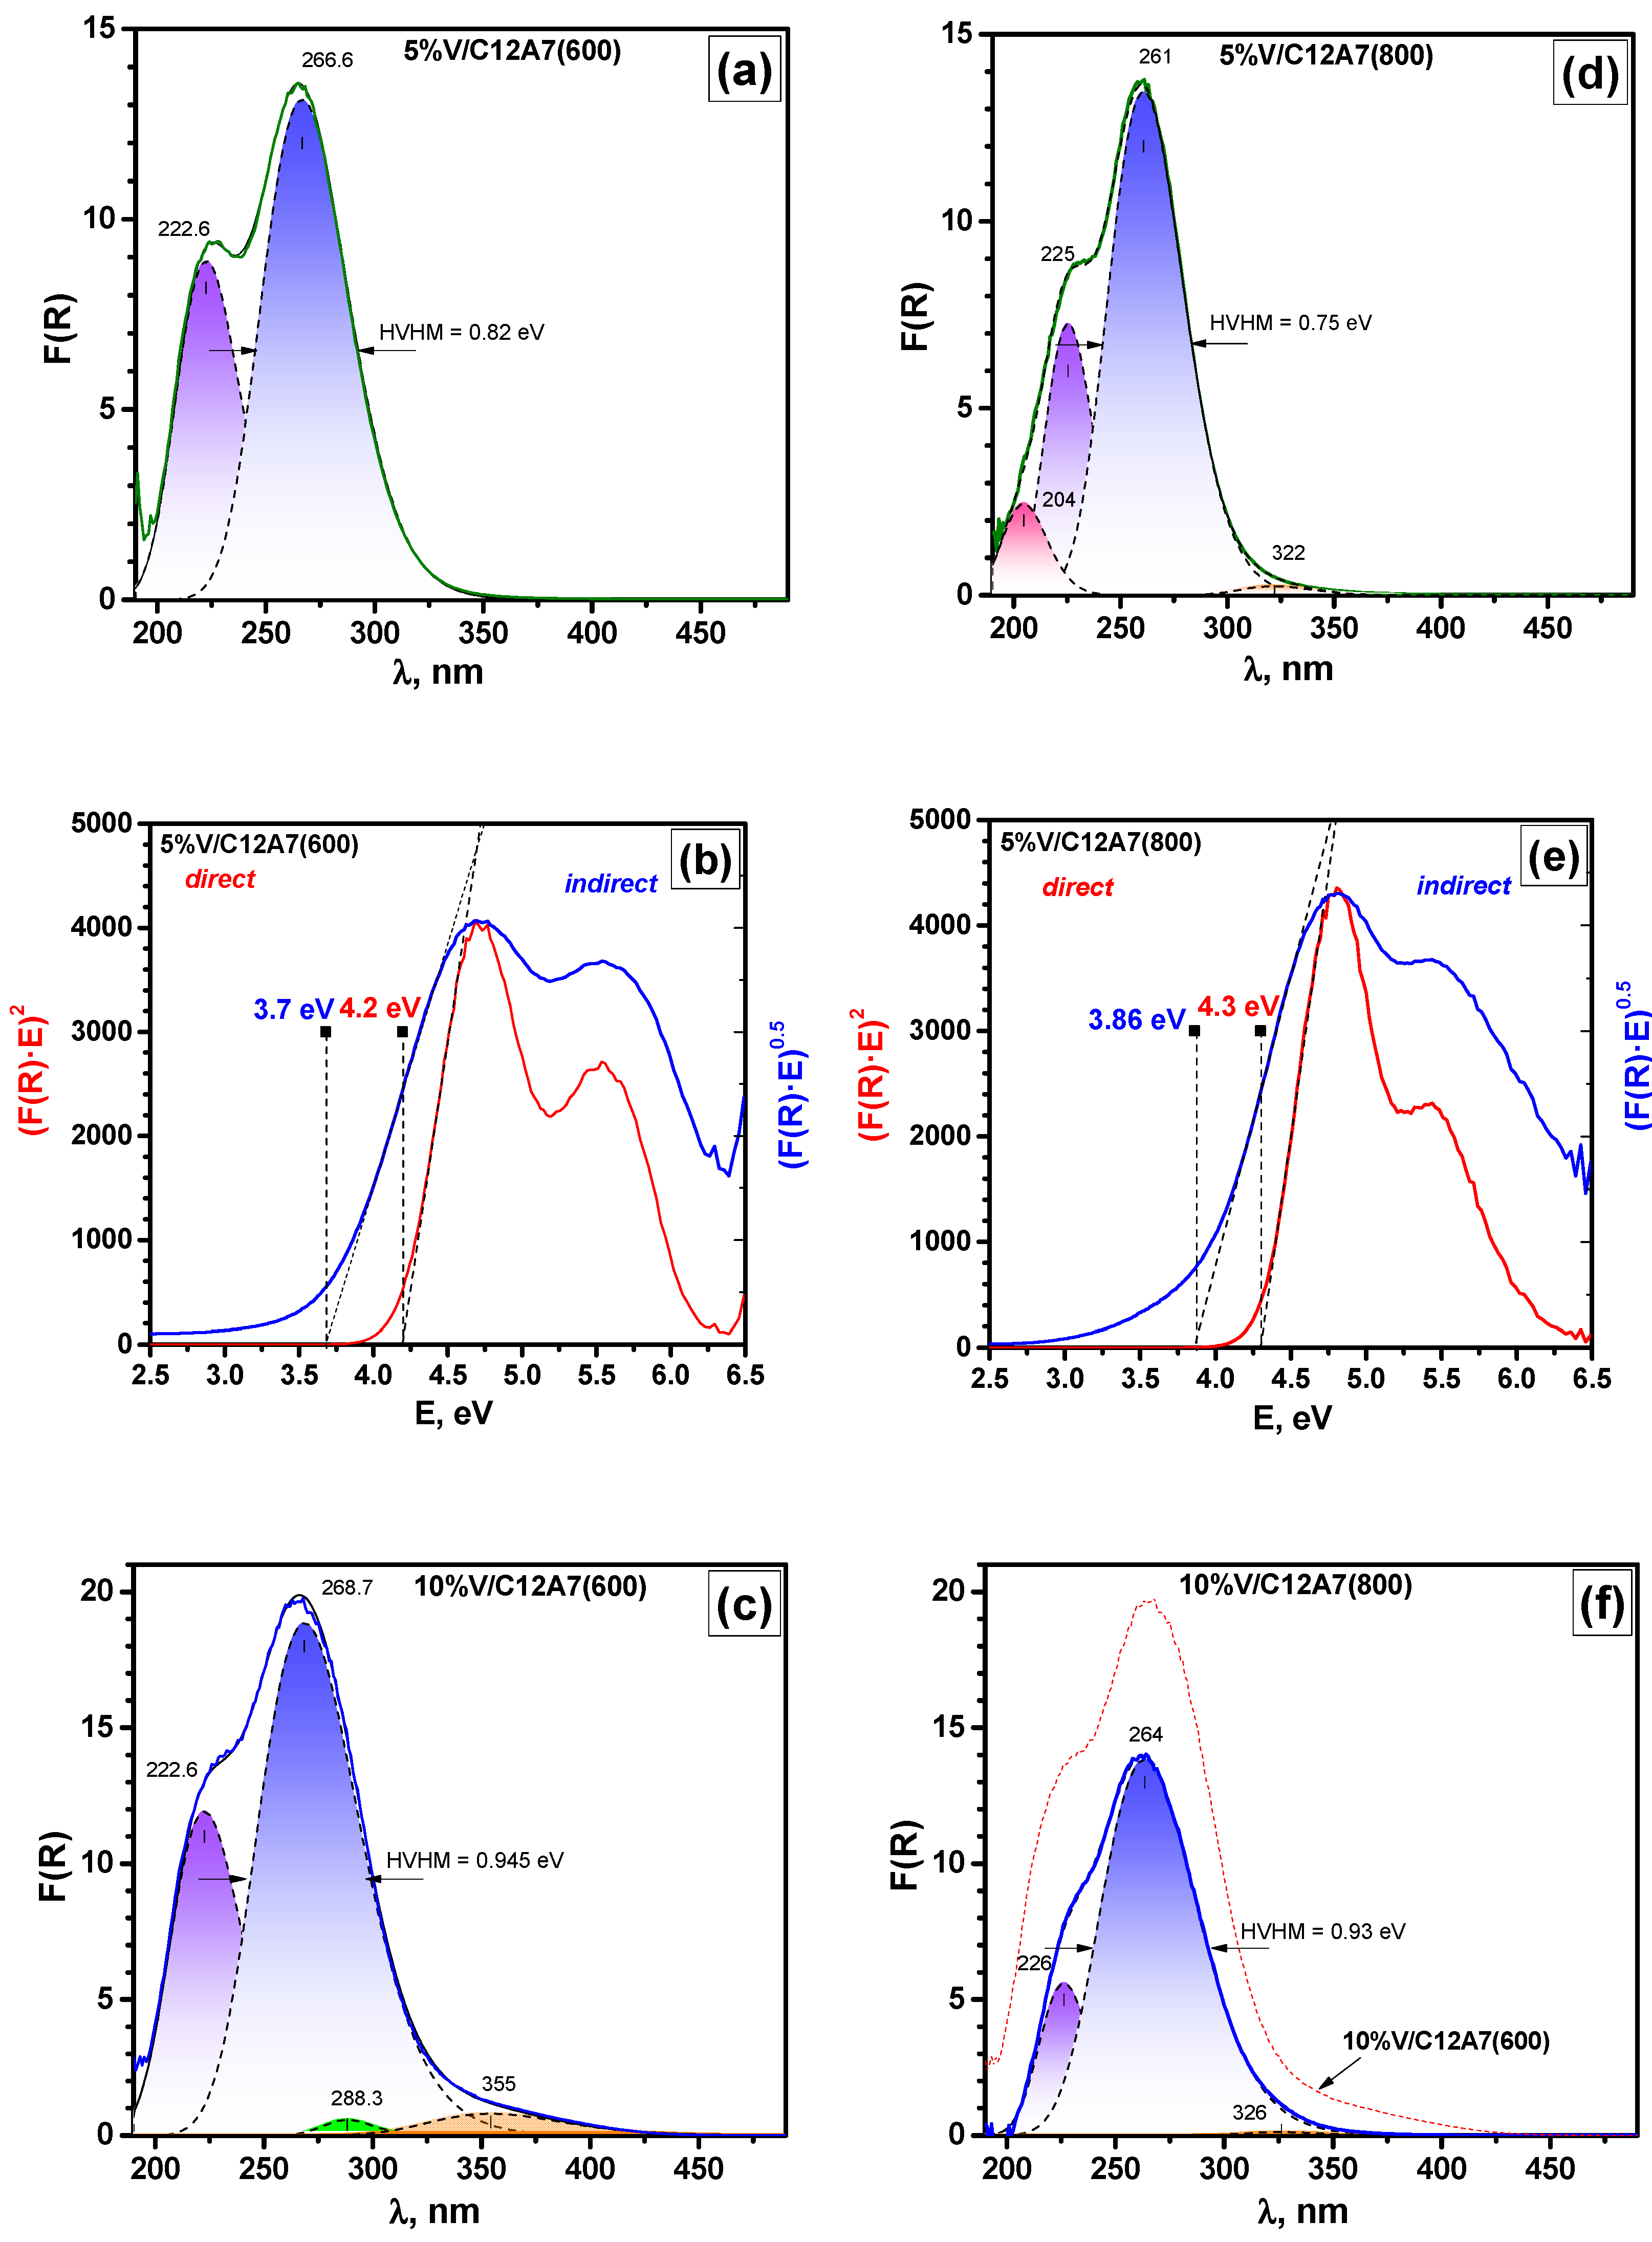
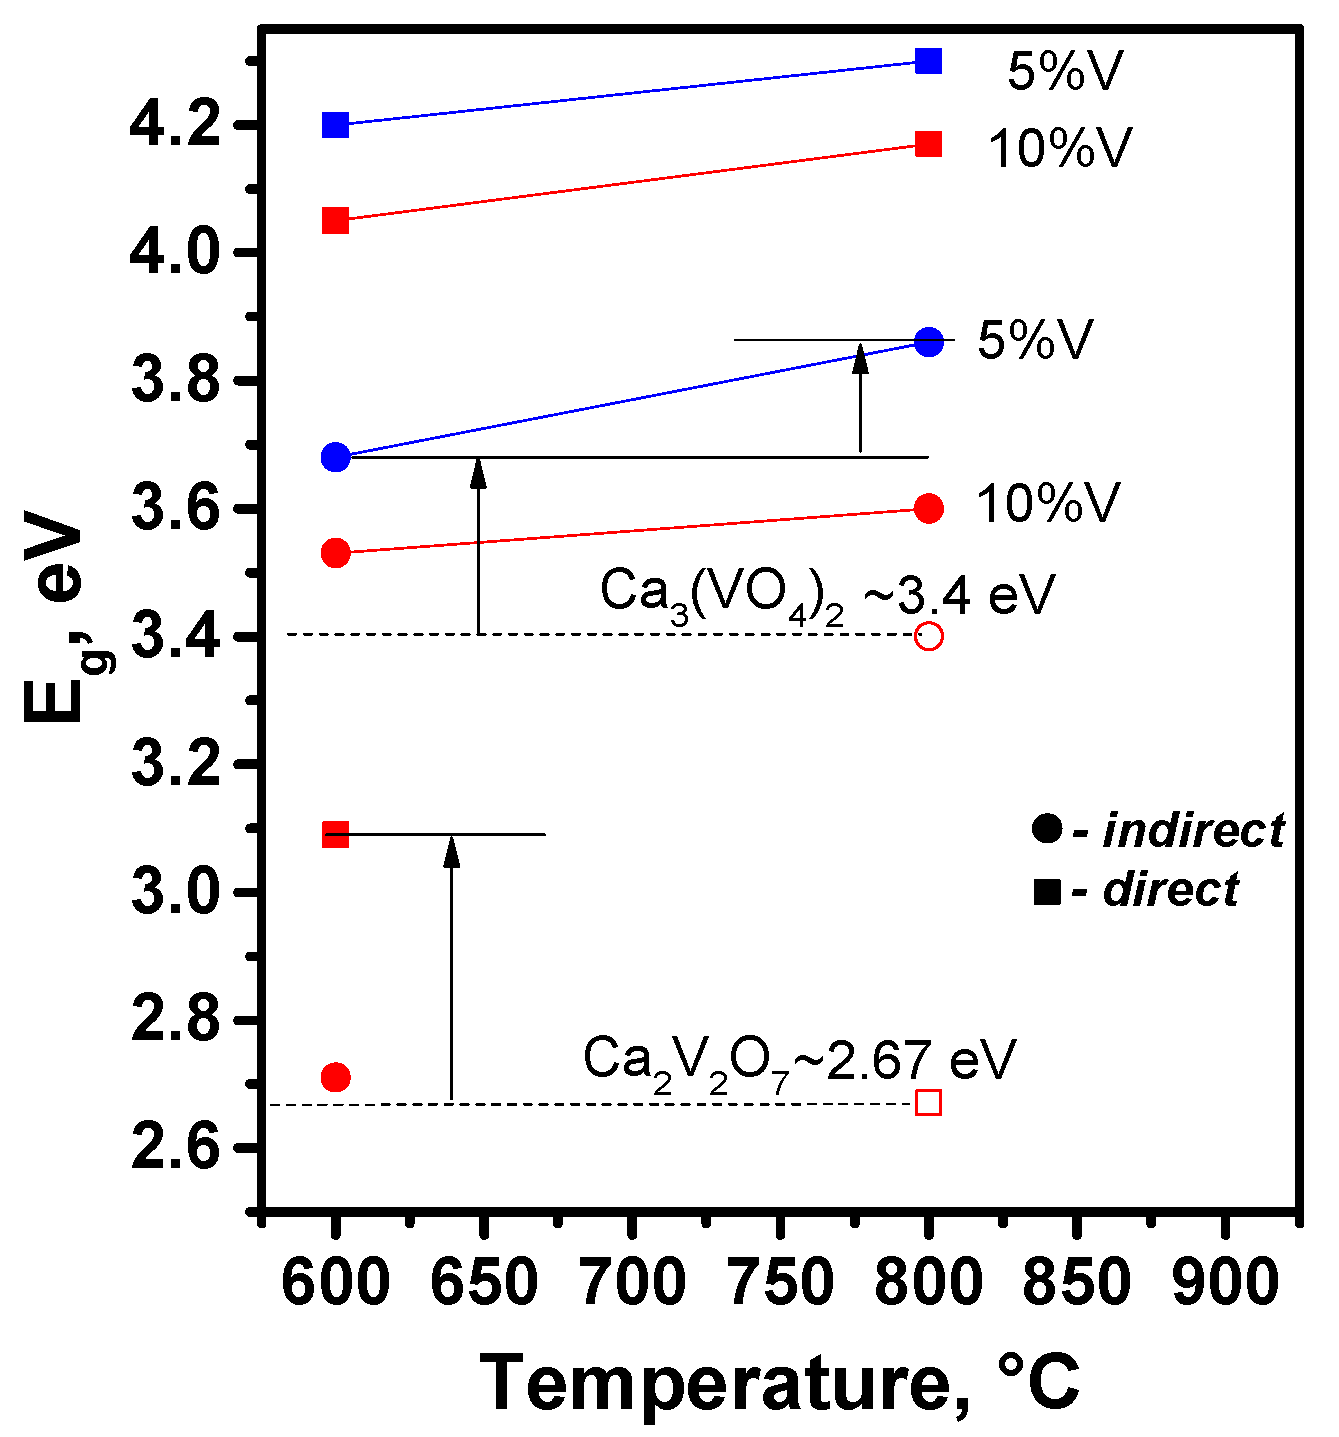
3.3. Diffuse Reflectance UV–Vis Spectroscopy Study of Vanadia-Mayenite Composites

Molecular structures of the supported vanadium oxides in a solid state were summarized by Weckhuysen et al. [54]. Diffuse reflectance spectroscopy allows the study of the charge transfer transitions for V5+ (d0). These species can be in a tetrahedral (VO4), pentahedral (VO5), and octahedral (VO6) coordination environment. Therefore, the following types of vanadium oxide species on the surface can be expected [42,55,56,57,58,59]: (1) isolated vanadium ions; (2) dimeric or polymeric species; (3) chains of vanadium ions building up a two-dimensional over-layer of supported vanadium oxides; (4) three-dimensional vanadium oxides (e.g., V2O5), which can be crystalline or not; (5) mixed metal oxide phases with the support (e.g., AlVO4, Ca3(VO4)2, and Ca2V2O7), or their combination.
The Eg values for the direct allowed transition of sodium orthovanadate Na3VO4 (Eg ~ 3.82 eV), metavanadate NaVO3 (Eg ~ 3.15 eV), and V2O5 (Eg ~ 2.26 eV) can be used as standard values of compounds containing only isolated monomeric tetrahedral units, the linearly polymerized tetrahedrally coordinated oligomeric units, and polymerized octahedrally coordinated units, correspondingly. In our case, among the group of mixed metal oxide phases (5), Ca3(VO4)2 is the most stable compound at high temperature (melting point of 1400 °C), which has a polar whitlockite-type crystal structure containing fourfold-coordinated V (indirect gap, Eg ∼ 3.34–3.4 eV) [60]. For Ca2V2O7 (melting point of ~1010 °C) and AlVO4 (melting point of ~745 °C), the values of the energy gap width (direct gap) Eg are ~2.67 and ~3.4–3.6 eV, respectively [44,61,62]. Therefore, both the direct and indirect allowed transitions were considered while estimating the Eg values (Figure 5, Table 1).
In order to reveal the possible vanadium species from groups (1–4), an additional reference sample 5%V/Al2O3 was prepared via the same procedures as described for C12A7. The results of the UV–Vis spectroscopic characterization for this sample are shown in Figure 6. The Eg value (direct allowed transition) of ~3.44 eV for 5%V/Al2O3 corresponds mainly to the isolated VO4 species along with the ultimate absence of V2O5 particles [63]. By comparing the spectra in Figure 5a and Figure 6a, it can be concluded that in the case of 5%V/C12A7, vanadium is present as Ca3(VO4)2. Note that the Eg values exceed the experimental data known for Ca3(VO4)2 (Table 1, Figure 7). However, taking into account the small sizes of the particles, the results reported here can be considered as consistent with the published ones.
For the sample of 10%V/C12A7 (Figure 5c), considering the results of XRD and Raman spectroscopy regarding the presence of two phases, Ca2V2O7 and Ca3(VO4)2, the Eg values were defined for two bands—the absorption edges for Ca3(VO4)2 (4.615 eV, 268.7 nm) and for Ca2V2O7 (3.49 eV, 355.3 nm).
As seen from Figure 5c,f, calcination of 10%V/C12A7 at 800 °C leads to the predominant rearrangement of the spectrum accompanied with a decrease in intensity of the charge transfer band and disappearance of the bands related to Ca2V2O7. For 5%V/C12A7, the changes with regard to the initial sample are represented by an insignificant increase in the Eg values for both the transition types and by a decrease in the characteristic half-width of the charge transfer bands from ~0.82 eV to ~0.75 eV (Figure 5a,d). The observable effect can be explained by the disappearance of other disordered impurity phases of group (5), which are not connected with Ca3(VO4)2.

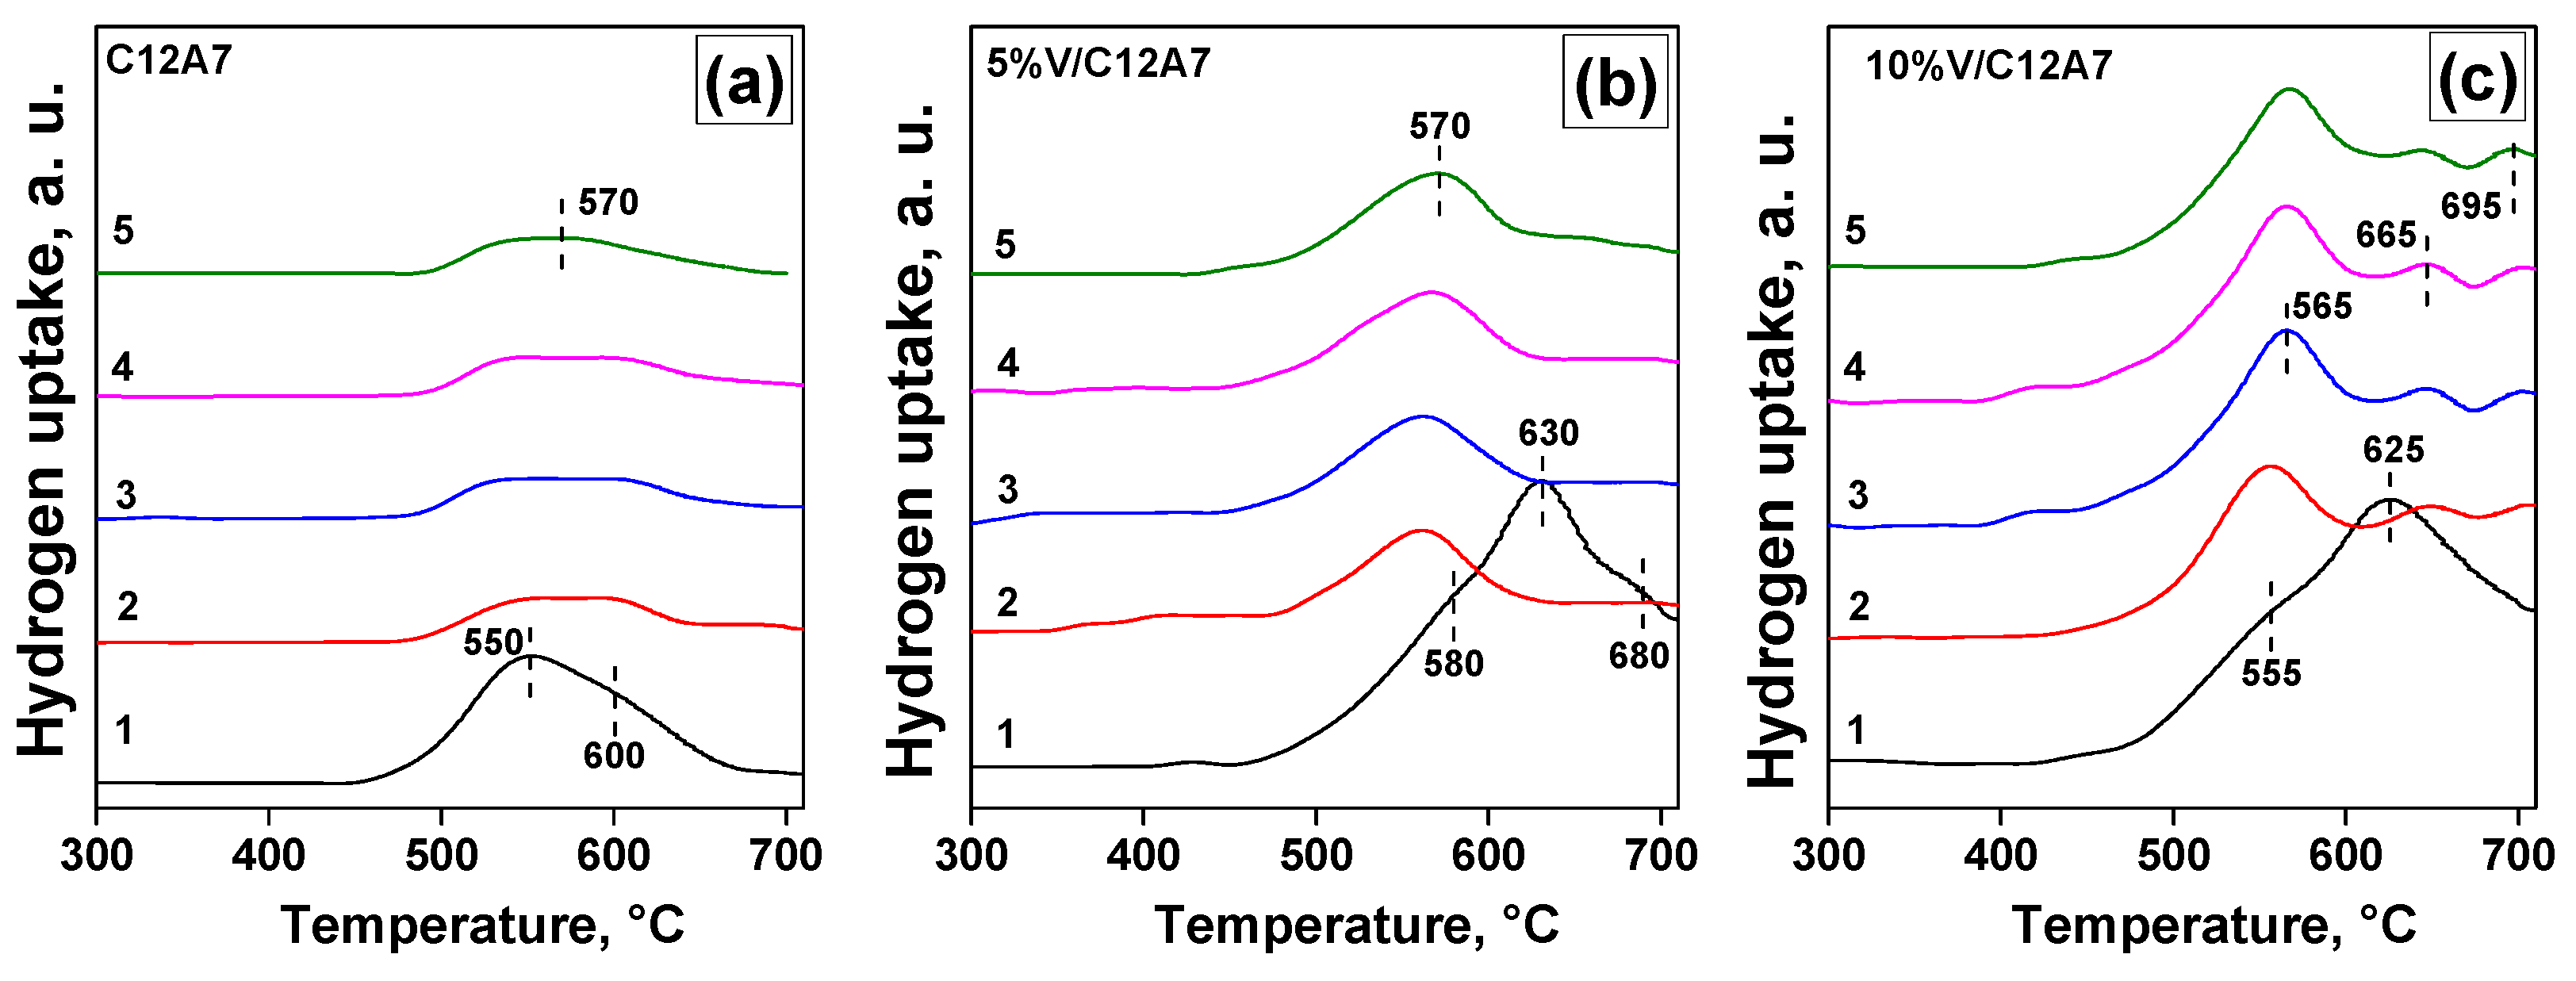
3.4. Temperature-Programmed Reduction of Pure Mayenite and Vanadia-Mayenite Composites

Temperature-programmed reduction of the studied samples was performed in a hydrogen medium. This technique is commonly used to characterize bulk materials and supported catalysts, as it provides important information on their reducibility. In order to study the reproducibility of the reduction behavior, the samples were re-oxidized in air after each reduction step. The obtained TPR-H2 profiles are presented in Figure 8. In the case of pure mayenite (Figure 8a), the TPR-H2 profile initially contains one hydrogen uptake peak at ~550 °C with a shoulder at ~600 °C. The total hydrogen uptake value was calculated to be 0.288 mmol/g (Table 2). Such a value presumably corresponds to the reduction of various reducible oxygen-containing species in mayenite with the possible incorporation of hydride ions into the mayenite structure. As reported by Ruszak et al. [2], the TPR-H2 technique allows reduction of the surface species only. This corresponds to an uptake of ~10 μmol/g. At the same time, the complete reduction requires about 1 mmol/g of hydrogen. Intiso et al. [12] used various preparation methods to obtain mayenite and found that the hydrogen uptake values can reach 1.19 mmol/g. The shape of the TPR-H2 profiles observed by other researchers is similar to the profile (1) in Figure 8a. Therefore, it can be concluded that the C12A7 sample prepared in the present work possesses high dispersity. In subsequent redox cycles, the sample demonstrates reproducible reduction behavior. One broad peak appears in a temperature range of 500–630 °C. The lower hydrogen consumption values (Table 2) indicate that the conditions used for the re-oxidation of partly reduced mayenite do not provide the formation of oxygen species, which are present in the initial (as-prepared) state.
The addition of vanadium to mayenite changes the situation significantly. Thus, for the as-prepared 5%V/C12A7 sample, the TPR-H2 profile is represented by one large peak at ~630 °C with two shoulders at ~580 and ~680 °C (Figure 8b). Assuming that all vanadium in the sample is in the V5+ state, the reduction process V5+  V3+ requires 0.943 mmol/g of hydrogen. At the same time, the calculated value of hydrogen uptake of 1.018 mmol/g (Table 2) is slightly higher than the theoretical value. This indicates that the oxygen species of mayenite also participate in the reduction process. Starting from the second redox cycle, just one peak appears at ~570 °C. According to the literature, such a behavior corresponds to the reduction of well-dispersed VO43− species [64]. The shift in the hydrogen uptake peak along with the decrease in the H2 consumption values in the 2nd–5th cycles (Table 2) indicate the strengthened interaction of vanadium species with the mayenite framework and the formation of the Ca3(VO4)2 phase discussed above.
Figure 8c shows the TPR-H2 profiles for 10%V/C12A7. In the first cycle, this sample behaves similarly to 5%V/C12A7. However, in this case, the calculated value of hydrogen uptake is lower than the theoretical value of 1.818 mmol/g (Table 2). This means that about 40% of vanadium is represented by hardly reducible species. It was previously reported that an increase in the vanadium content results in a shift in the hydrogen uptake area toward higher temperatures [65,66]. In our case, according to the XRD data [31], two types of calcium vanadate phases (Ca3(VO4)2 and Ca2V2O7) are present in the 10%V/C12A7 sample with an estimated weight ratio of 1:2. As known from the literature, the orthovanadate phase Ca3(VO4)2 reduces easier if compared with the pyrovanadate phase Ca2V2O7 [67]. Considering this, the large peak at ~625 °C can be assigned to the reduction of Ca3(VO4)2 and the shoulder at ~555 °C seems to be the overlapped peak of the mayenite reduction. The reduction of the Ca2V2O7 phase is expected at temperatures near 700 °C. Its presence is evidently seen in subsequent redox cycles at ~665 °C. Dasireddy et al. [65] reported that vanadium oxide V2O5 is less reducible if compared with the pyrovanadate phase. Therefore, two other peaks appearing at ~565 and ~695 °C can be attributed to the Ca3(VO4)2 and V2O5 phases, accordingly. It is important to note that the profiles of the 2nd–5th redox cycles are reproducible in shape, and the hydrogen consumption values are stabilized at a level of ~730 mmol/g.

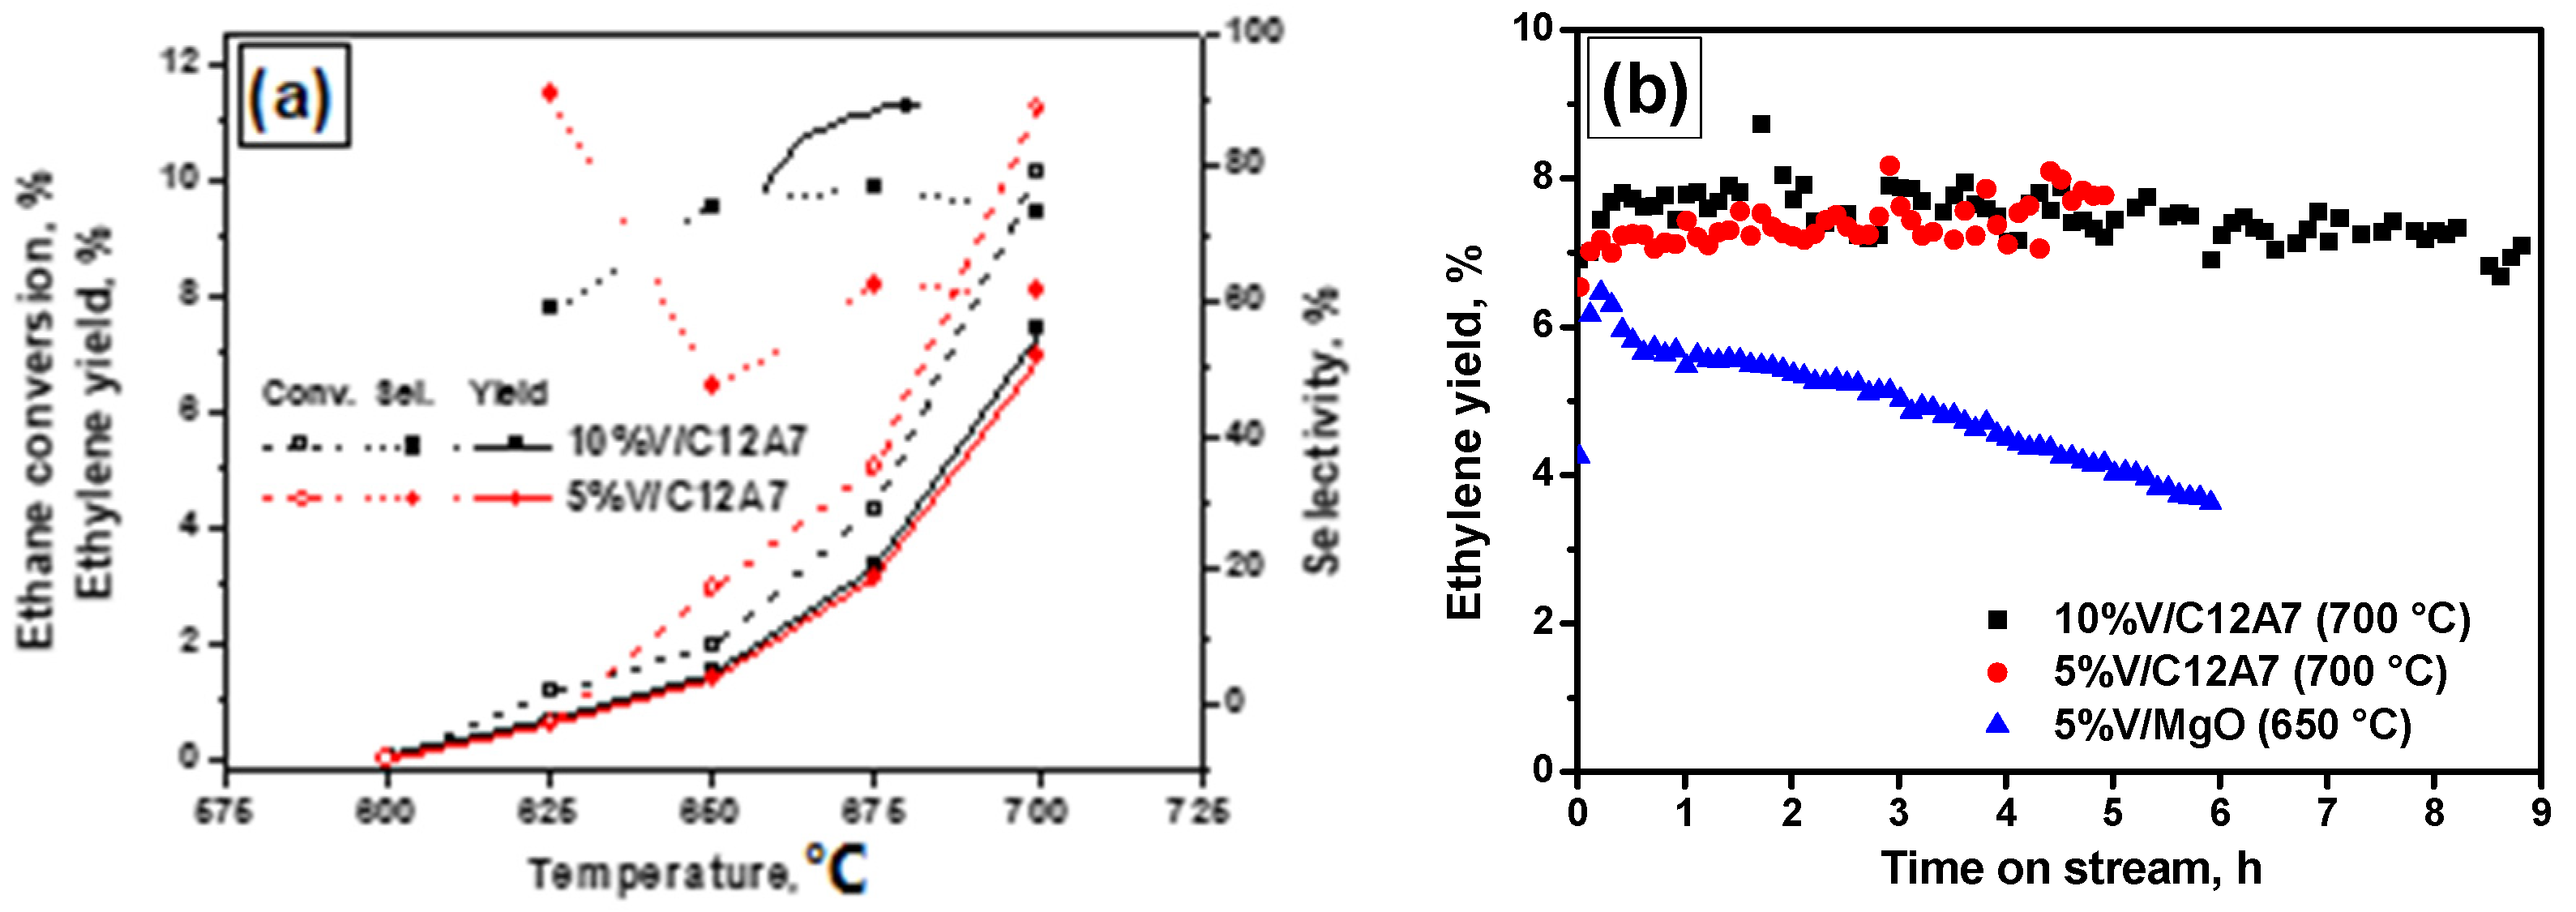
3.5. Catalytic Activity of Vanadia-Mayenite Composites in Ethane Dehydrogenation

Vanadium-containing oxide systems are traditionally attractive as catalysts for the dehydrogenation processes. In the present work, the vanadia-mayenite composites were examined in non-oxidative ethane dehydrogenation. Due to endothermicity of this reaction, remarkable values of the ethane conversion can be observed at 600 °C and above. The temperature dependences of the ethane conversion, ethylene selectivity, and yield for the 5%V/C12A7 and 10%V/C12A7 samples are compared in Figure 9a. As seen, the yield curves are practically coincident. It can be supposed that both samples, despite the double difference in vanadium loading, contain nearly the same amount of active species. Recently, Zhang et al. [25] reported that the catalysts containing isolated VOx tetrahedra showed improved activity and stability in comparison with the catalysts with the polymerized VOx species. On the other hand, it is known that an increase in vanadium loading can lead to the formation of such polymerized vanadium oxide or vanadate species. In our case, Raman spectroscopy demonstrated that the 5%/C12A7 sample contains the Ca3(VO4)2 phase only. At the same time, according to the results of XRD and Raman spectroscopy, both the Ca3(VO4)2 and Ca2V2O7 phases are detected for the 10%V/C12A7 nanocomposite. In addition, the intensity of the Raman band at 1128 cm−1, which is attributed to the stretching vibration of O2, is lower for 10%/C12A7 if compared with 5%V/C12A7. The lower amount of the active O2 species can supposedly be responsible for the lower specific activity of the high-loaded sample.
The results of the durability tests carried out at 700 °C are presented in Figure 9b. As seen, both the V/C12A7 exhibit comparable and stable catalytic performance. Additionally, the same data for a recently reported 5%V/MgO system [28] are plotted in the graph. Note that the reference sample was studied at a lower temperature (650 °C). A rapid deactivation within first six hours is observed for this sample, which is assumedly caused by the coke formation. Therefore, the V/C12A7 composites look very promising in terms of their activity and stability in dehydrogenation processes.
Figure 10 compares the photographs (appearance) of the fresh (as-prepared), reduced (after TPR-H2), and spent (after catalytic tests) 5%V/C12A7 samples and the spent reference 5%V/MgO sample. As follows from Figure 10a, the as-prepared 5%V/C12A7 sample is colored from white to yellowish. Being subjected to the reduction in TPR-H2 cycles, the sample changes its color to dark grey (Figure 10b). Another specimen of the fresh sample tested in the ethane dehydrogenation reaction for 6 h has a light grey color (Figure 10c). This indicates the lower reducibility degree of the sample under the reaction conditions if compared with that under the TPR-H2 conditions. Contrary to 5%V/C12A7, the spent reference 5%V/MgO sample is colored in black (Figure 10d). Such a color is caused by the carbon deposits and confirms the supposition about the reasons for the catalyst deactivation observable in Figure 9b. An increase in the reaction temperature is known to facilitate coke formation. Therefore, the light grey color of the spent 5%V/C12A7 catalyst is an evident illustration of its tolerance toward the deactivation caused by coking. This uniqueness of the vanadia-mayenite composite can be considered key to the development of a new class of dehydrogenation catalysts based on mayenite.

4. Conclusions

The spectroscopic characteristics of pure mayenite and vanadia-mayenite nanocomposites were obtained using Raman and diffuse reflectance UV–Vis spectroscopies. Both the techniques confirmed the presence of calcium vanadates Ca2V2O7 and Ca3(VO4)2 in the high-loaded sample 10%V/C12A7. The low-loaded sample 5%V/C12A7 contained predominantly the orthovanadate phase. These data correlate well the XRD results reported recently. The reducibility of the samples in consecutive redox cycles was studied by the TPR-H2 method. The stable reduction behavior was observable starting from the third cycle. The multi-peak shape of the TPR-H2 profiles was connected with the incomplete reduction of mayenite and the reduction of the mentioned vanadium species. Testing the V-containing samples in catalytic ethane dehydrogenation revealed that the vanadium loading in the catalyst did not affect the ethylene yield. Both the samples exhibited very similar catalytic performance, which can be explained by the comparable amount of Ca3(VO4)2 species present in the samples. Moreover, both the samples demonstrated excellent stability during the durability tests, showing no deactivation caused by coke formation. Such a feature of the vanadia-mayenite nanocomposites can be useful to create a new class of dehydrogenation catalysts.

Author Contributions

Conceptualization, A.F.B. and A.A.V.; methodology, A.F.B., V.O.S. and G.B.V.; validation, E.I.S., E.V.I. and A.F.B.; formal analysis, A.A.V.; investigation, E.I.S., E.V.I., V.O.S. and G.B.V.; resources, A.F.B. and A.A.V.; data curation, E.V.I.; writing—original draft preparation, V.O.S. and G.B.V.; writing—review and editing, A.A.V.; visualization, V.O.S., G.B.V. and A.A.V.; supervision, A.A.V. All authors have read and agreed to the published version of the manuscript.

Funding

This research was funded by the Ministry of Science and Higher Education of the Rus-sian Federation within the governmental order for Boreskov Institute of Catalysis (project No. AAAA-A21-121011390054-1).

Institutional Review Board Statement

Not applicable.

Informed Consent Statement

Not applicable.

Data Availability Statement

Data are contained within the article.

Acknowledgments

Characterization of the samples was performed using the equipment of the Center of Collective Use “National Center of Catalysts Research”.

Conflicts of Interest

The authors declare no conflict of interest.

References

  1. Intiso, A.; Rossi, F.; Proto, A.; Cucciniello, R. The fascinating world of mayenite (Ca12Al14O33) and its derivatives. Rend. Lincei Sci. Fis. Nat. 2021, 32, 699–708. [Google Scholar] [CrossRef]
  2. Ruszak, M.; Witkowski, S.; Sojka, Z. EPR and Raman investigations into anionic redox chemistry of nanoporous 12CaO·7Al2O3 interacting with O2, H2 and N2O. Res. Chem. Intermed. 2007, 33, 689–703. [Google Scholar] [CrossRef]
  3. Schmidt, A.; Boysen, H.; Senyshyn, A.; Lerch, M. New findings on N-mayenite and a new kind of anion substituted mayenite: Ca12Al14O32(NO2)2. Z. Krist.-Cryst. Mater. 2014, 229, 427–434. [Google Scholar] [CrossRef]
  4. Boysen, H.; Lerch, M.; Stys, A.; Senyshyn, A. Structure and oxygen mobility in mayenite (Ca12Al14O33): A high-temperature neutron powder diffraction study. Acta Crystallogr. B 2007, 63, 675–682. [Google Scholar] [CrossRef]
  5. Kumaresh, T.; Awin, E.W.; Bhaskar, L.K.; Djordjevic, M.P.; Matović, B.; Kumar, R. Combustion synthesis of luminescent Eu-doped single phase Mayenite. J. Solid State Chem. 2021, 302, 122420. [Google Scholar] [CrossRef]
  6. Yang, H.; Wang, R.; Wang, Y.; Jiang, J.; Guo, X. Synthesis and characterization of macroporous europium-doped Ca12Al14O33 (C12A7:Eu3+) and its application in metal ion detection. New J. Chem. 2019, 43, 8315–8324. [Google Scholar] [CrossRef]
  7. Domínguez, M.; Pérez-Bernal, M.E.; Ruano-Casero, R.J.; Barriga, C.; Rives, V.; Ferreira, R.A.S.; Carlos, L.D.; Rocha, J. Multiwavelength luminescence in lanthanide-doped hydrocalumite and mayenite. Chem. Mater. 2011, 23, 1993–2004. [Google Scholar] [CrossRef]
  8. Xue, X.; Li, H.; Liu, S.; Lu, L.; Liu, Q.; Mi, X.; Bai, Z.; Zhang, X.; Liu, X. Effect of the anion on the luminescence properties of Bi3+-doped X-mayenite (X = O, F, Cl) phosphors. Mater. Res. Bull. 2021, 139, 111283. [Google Scholar] [CrossRef]
  9. Kitano, M.; Inoue, Y.; Yamazaki, Y.; Hayashi, F.; Kanbara, S.; Matsuishi, S.; Yokoyama, T.; Kim, S.-W.; Hara, M.; Hosono, H. Ammonia synthesis using a stable electride as an electron donor and reversible hydrogen store. Nat. Chem. 2012, 4, 934–940. [Google Scholar] [CrossRef]
  10. Hayashi, F.; Toda, Y.; Kanie, Y.; Kitano, M.; Inoue, Y.; Yokoyama, T.; Hara, M.; Hosono, H. Ammonia decomposition by ruthenium nanoparticles loaded on inorganic electride C12A7:e. Chem. Sci. 2013, 4, 3124–3130. [Google Scholar] [CrossRef]
  11. Khan, K.; Tareen, A.K.; Aslam, M.; Thebo, K.H.; Khan, U.; Wang, R.; Shams, S.S.; Han, Z.; Ouyang, Z. A comprehensive review on synthesis of pristine and doped inorganic room temperature stable mayenite electride, [Ca24Al28O64]4+(e)4 and its applications as a catalyst. Prog. Solid State Chem. 2019, 54, 1–19. [Google Scholar] [CrossRef]
  12. Intiso, A.; Martinez-Triguero, J.; Cucciniello, R.; Rossi, F.; Palomares, A.E. Influence of the synthesis method on the catalytic activity of mayenite for the oxidation of gas-phase trichloroethylene. Sci. Rep. 2019, 9, 425. [Google Scholar] [CrossRef] [Green Version]
  13. Cucciniello, R.; Intiso, A.; Siciliano, T.; Palomares, A.E.; Martínez-Triguero, J.; Cerrillo, J.L.; Proto, A.; Rossi, F. Oxidative degradation of trichloroethylene over Fe2O3-doped mayenite: Chlorine poisoning mitigation and improved catalytic performance. Catalysts 2019, 9, 747. [Google Scholar] [CrossRef] [Green Version]
  14. Cucciniello, R.; Intiso, A.; Castiglione, S.; Genga, A.; Proto, A.; Rossi, F. Total oxidation of trichloroethylene over mayenite (Ca12Al14O33) catalyst. Appl. Catal. B Environ. 2017, 204, 167–172. [Google Scholar] [CrossRef]
  15. Meza-Trujillo, I.; Devred, F.; Gaigneaux, E.M. Production of high surface area mayenite (C12A7) via an assisted solution combustion synthesis (SCS) toward catalytic soot oxidation. Mater. Res. Bull. 2019, 119, 110542. [Google Scholar] [CrossRef]
  16. Di Giuliano, A.; Giancaterino, F.; Courson, C.; Foscolo, P.U.; Gallucci, K. Development of a Ni-CaO-mayenite combined sorbent-catalyst material for multicycle sorption enhanced steam methane reforming. Fuel 2018, 234, 687–699. [Google Scholar] [CrossRef]
  17. Savuto, E.; Di Carlo, A.; Gallucci, K.; Natali, S.; Bocci, E. Characterization and performance analysis of an innovative Ni/Mayenite catalyst for the steam reforming of raw syngas. Fuel 2017, 194, 348–356. [Google Scholar] [CrossRef]
  18. Di Carlo, A.; Borello, D.; Sisinni, M.; Savuto, E.; Venturini, P.; Bocci, E.; Kuramoto, K. Reforming of tar contained in a raw fuel gas from biomass gasification using nickel-mayenite catalyst. Int. J. Hydrogen Energy 2015, 40, 9088–9095. [Google Scholar] [CrossRef]
  19. Di Giuliano, A.; Gallucci, K.; Foscolo, P.U.; Courson, C. Effect of Ni precursor salts on Ni-mayenite catalysts for steam methane reforming and on Ni-CaO-mayenite materials for sorption enhanced steam methane reforming. Int. J. Hydrogen Energy 2019, 44, 6461–6480. [Google Scholar] [CrossRef]
  20. Savuto, E.; Navarro, R.M.; Mota, N.; Di Carlo, A.; Bocci, E.; Carlini, M.; Fierro, J.L.G. Steam reforming of tar model compounds over Ni/Mayenite catalysts: Effect of Ce addition. Fuel 2018, 224, 676–686. [Google Scholar] [CrossRef]
  21. Li, C.; Hirabayashi, D.; Suzuki, K. A crucial role of O2 and O22− on mayenite structure for biomass tar steam reforming over Ni/Ca12Al14O33. Appl. Catal. B Environ. 2009, 88, 351–360. [Google Scholar] [CrossRef]
  22. Chen, S.; Chang, X.; Sun, G.; Zhang, T.; Xu, Y.; Wang, Y.; Pei, C.; Gong, J. Propane dehydrogenation: Catalyst development, new chemistry, and emerging technologies. Chem. Soc. Rev. 2021, 50, 3315–3354. [Google Scholar] [CrossRef]
  23. Sokolov, S.; Stoyanova, M.; Rodemerck, U.; Linke, D.; Kondratenko, E.V. Comparative study of propane dehydrogenation over V-, Cr-, and Pt-based catalysts: Time on-stream behavior and origins of deactivation. J. Catal. 2012, 293, 67–75. [Google Scholar] [CrossRef]
  24. Vedyagin, A.A.; Mishakov, I.V.; Ilyina, E.V. A step forward in the preparation of V–Mg–O catalysts for oxidative dehydrogenation of propane. J. Sol-Gel Sci. Technol. 2021, 97, 117–125. [Google Scholar] [CrossRef]
  25. Zhang, T.; Guo, X.; Song, C.; Liu, Y.; Zhao, Z. Fabrication of isolated VOx sites on alumina for highly active and stable non-oxidative dehydrogenation. J. Phys. Chem. C 2021, 125, 19229–19237. [Google Scholar] [CrossRef]
  26. Gu, Y.; Liu, H.; Yang, M.; Ma, Z.; Zhao, L.; Xing, W.; Wu, P.; Liu, X.; Mintova, S.; Bai, P.; et al. Highly stable phosphine modified VOx/Al2O3 catalyst in propane dehydrogenation. Appl. Catal. B Environ. 2020, 274, 119089. [Google Scholar] [CrossRef]
  27. Xie, Y.; Luo, R.; Sun, G.; Chen, S.; Zhao, Z.-J.; Mu, R.; Gong, J. Facilitating the reduction of V–O bonds on VOx/ZrO2 catalysts for non-oxidative propane dehydrogenation. Chem. Sci. 2020, 11, 3845–3851. [Google Scholar] [CrossRef] [Green Version]
  28. Veselov, G.B.; Ilyina, E.V.; Trenikhin, M.V.; Vedyagin, A.A. Two-component Ni–Mg–O/V–Mg–O catalytic system. I. Synthesis and physicochemical and catalytic properties in oxidative dehydrogenation of ethane. Kinet. Catal. 2022, 63, 523–531. [Google Scholar] [CrossRef]
  29. Yang, S.; Kondo, J.N.; Hayashi, K.; Hirano, M.; Domen, K.; Hosono, H. Formation and desorption of oxygen species in nanoporous crystal 12CaO·7Al2O3. Chem. Mater. 2003, 16, 104–110. [Google Scholar] [CrossRef]
  30. Środek, D.; Dulski, M.; Galuskina, I. Raman imaging as a new approach to identification of the mayenite group minerals. Sci. Rep. 2018, 8, 13593. [Google Scholar] [CrossRef]
  31. Shuvarakova, E.I.; Ilyina, E.V.; Cherepanova, S.V.; Gerasimov, E.Y.; Bedilo, A.F.; Vedyagin, A.A. Synthesis of vanadia-mayenite nanocomposites and characterization of their structure, morphology and surface sites. J. Compos. Sci. 2022, 6, 254. [Google Scholar] [CrossRef]
  32. Kapishnikov, A.V.; Kenzhin, R.M.; Koskin, A.P.; Volodin, A.M.; Geydt, P.V. Mayenite synthesis from hydroxide precursors: Structure formation and active sites on its surface. Materials 2022, 15, 778. [Google Scholar] [CrossRef]
  33. Boehm, H.-P.; Knözinger, H. Nature and estimation of functional groups on solid surfaces. In Catalysis: Science and Technology; Anderson, J.R., Boudart, M., Eds.; Springer: Berlin/Heidelberg, Germany, 1983; pp. 39–207. [Google Scholar] [CrossRef]
  34. Tauc, J. Optical properties of amorphous semiconductors. In Amorphous and Liquid Semiconductors; Springer: Boston, MA, USA, 1974; pp. 159–220. [Google Scholar] [CrossRef]
  35. McMillan, P.; Piriou, B. Raman spectroscopy of calcium aluminate glasses and crystals. J. Non-Cryst. Solids 1983, 55, 221–242. [Google Scholar] [CrossRef]
  36. Kajihara, K.; Matsuishi, S.; Hayashi, K.; Hirano, M.; Hosono, H. Vibrational dynamics and oxygen diffusion in a nanoporous oxide ion conductor 12CaO·7Al2O3 studied by 18O labeling and micro-Raman spectroscopy. J. Phys. Chem. C 2007, 111, 14855–14861. [Google Scholar] [CrossRef]
  37. Gyakwaa, F.; Aula, M.; Alatarvas, T.; Vuolio, T.; Huttula, M.; Fabritius, T. Applicability of time-gated Raman spectroscopy in the characterisation of calcium-aluminate inclusions. ISIJ Int. 2019, 59, 1846–1852. [Google Scholar] [CrossRef] [Green Version]
  38. Hayashi, K.; Sushko, P.V.; Ramo, D.M.; Shluger, A.L.; Watauchi, S.; Tanaka, I.; Matsuishi, S.; Hirano, M.; Hosono, H. Nanoporous crystal 12CaO·7Al2O3: A playground for studies of ultraviolet optical absorption of negative ions. J. Phys. Chem. B 2007, 111, 1946–1956. [Google Scholar] [CrossRef]
  39. Schmid, T.; Dariz, P. Shedding light onto the spectra of lime: Raman and luminescence bands of CaO, Ca(OH)2 and CaCO3. J. Raman Spectr. 2015, 46, 141–146. [Google Scholar] [CrossRef]
  40. Gyakwaa, F.; Aula, M.; Alatarvas, T.; Vuolio, T.; Shu, Q.; Huttula, M.; Fabritius, T. Application of Raman spectroscopy for characterizing synthetic non-metallic inclusions consisting of calcium sulphide and oxides. Appl. Sci. 2020, 10, 2113. [Google Scholar] [CrossRef]
  41. Wu, Z.; Stair, P.C.; Rugmini, S.; Jackson, S.D. Raman spectroscopic study of V/θ-Al2O3 catalysts:  Quantification of surface vanadia species and their structure reduced by hydrogen. J. Phys. Chem. C 2007, 111, 16460–16469. [Google Scholar] [CrossRef]
  42. Wu, Z.; Kim, H.-S.; Stair, P.C.; Rugmini, S.; Jackson, S.D. On the structure of vanadium oxide supported on aluminas:  UV and visible Raman spectroscopy, UV−visible diffuse reflectance spectroscopy and temperature-programmed reduction studies. J. Phys. Chem. B 2005, 109, 2793–2800. [Google Scholar] [CrossRef]
  43. Grzechnik, A. High-temperature transformations in calcium orthovanadate studied with Raman scattering. Chem. Mater. 1998, 10, 1034–1040. [Google Scholar] [CrossRef]
  44. Sharma, A.; Varshney, M.; Chae, K.-H.; Won, S.O. Electronic structure and luminescence assets in white-light emitting Ca2V2O7, Sr2V2O7 and Ba2V2O7 pyro-vanadates: X-ray absorption spectroscopy investigations. RSC Adv. 2018, 8, 26423–26431. [Google Scholar] [CrossRef] [PubMed] [Green Version]
  45. Hayashi, K.; Hirano, M.; Hosono, H. Thermodynamics and kinetics of hydroxide ion formation in 12CaO·7Al2O3. J. Phys. Chem. B 2005, 109, 11900–11906. [Google Scholar] [CrossRef] [PubMed]
  46. Filatova, E.O.; Konashuk, A.S. Interpretation of the changing the band gap of Al2O3 depending on its crystalline form: Connection with different local symmetries. J. Phys. Chem. C 2015, 119, 20755–20761. [Google Scholar] [CrossRef]
  47. Lushchik, C.; Feldbach, E.; Frorip, A.; Kirm, M.; Lushchik, A.; Maaroos, A.; Martinson, I. Multiplication of electronic excitations in CaO and YAlO3 crystals with free and self-trapped excitons. J. Phys. Condens. Matter 1994, 6, 11177–11187. [Google Scholar] [CrossRef]
  48. Pott, G.T.; McNicol, B.D. The phosphorescence of Fe3+ ions in γ-alumina. Chem. Phys. Lett. 1970, 6, 623–625. [Google Scholar] [CrossRef]
  49. Pott, G.T.; McNicol, B.D. Zero-phonon transition and fine structure in the phosphorescence of Fe3+ ions in ordered and disordered LiAl5O8. J. Chem. Phys. 1972, 56, 5246–5254. [Google Scholar] [CrossRef]
  50. Gutiérrez, G.; Taga, A.; Johansson, B. Theoretical structure determination of γ-Al2O3. Phys. Rev. B 2001, 65, 012101. [Google Scholar] [CrossRef]
  51. Matsuishi, S.; Nomura, T.; Hirano, M.; Kodama, K.; Shamoto, S.-I.; Hosono, H. Direct synthesis of powdery inorganic electride [Ca24Al28O64]4+(e)4 and determination of oxygen stoichiometry. Chem. Mater. 2009, 21, 2589–2591. [Google Scholar] [CrossRef]
  52. Ebbinghaus, S.G.; Krause, H.; Lee, D.-K.; Janek, J. Single Crystals of C12A7 (Ca12Al14O33) Substituted with 1 mol % Iron. Cryst. Growth Des. 2014, 14, 2240–2245. [Google Scholar] [CrossRef]
  53. Huang, J.; Valenzano, L.; Sant, G. Framework and channel modifications in mayenite (12CaO·7Al2O3) nanocages by cationic doping. Chem. Mater. 2015, 27, 4731–4741. [Google Scholar] [CrossRef]
  54. Weckhuysen, B.M.; Keller, D.E. Chemistry, spectroscopy and the role of supported vanadium oxides in heterogeneous catalysis. Catal. Today 2003, 78, 25–46. [Google Scholar] [CrossRef] [Green Version]
  55. Bulánek, R.; Čapek, L.; Setnička, M.; Čičmanec, P. DR UV–vis study of the supported vanadium oxide catalysts. J. Phys. Chem. C 2011, 115, 12430–12438. [Google Scholar] [CrossRef]
  56. Bulánek, R.; Čičmanec, P.; Setnička, M. Possibility of VOx/SiO2 complexes speciation: Comparative multi-wavelength raman and DR UV-vis study. Phys. Proc. 2013, 44, 195–205. [Google Scholar] [CrossRef] [Green Version]
  57. Tian, H.; Ross, E.I.; Wachs, I.E. Quantitative determination of the speciation of surface vanadium oxides and their catalytic activity. J. Phys. Chem. B 2006, 110, 9593–9600. [Google Scholar] [CrossRef] [PubMed]
  58. Gao, X.; Wachs, I.E. Investigation of surface structures of supported vanadium oxide catalysts by UV−vis−NIR diffuse reflectance spectroscopy. J. Phys. Chem. B 2000, 104, 1261–1268. [Google Scholar] [CrossRef]
  59. Gao, X.; Bañares, M.A.; Wachs, I.E. Ethane and n-butane oxidation over supported vanadium oxide catalysts: An in situ UV–visible diffuse reflectance spectroscopic investigation. J. Catal. 1999, 188, 325–331. [Google Scholar] [CrossRef] [Green Version]
  60. Li, L.; Pan, Y.; Wang, W.; Zhang, W.; Wen, Z.; Leng, X.; Wang, Q.; Zhou, L.; Xu, H.; Xia, Q.; et al. O2−-V5+ charge transfer band, chemical bond parameters and R/O of Eu3+ doped Ca(VO3)2 and Ca3(VO4)2: A comparable study. J. Alloys Compd. 2017, 726, 121–131. [Google Scholar] [CrossRef]
  61. Dąbrowska, G.; Tabero, P.; Kurzawa, M. Phase relations in the Al2O3-V2O5-MoO3 system in the solid state. The crystal structure of AlVO4. J. Phase Equilibria Diffus. 2009, 30, 220–229. [Google Scholar] [CrossRef]
  62. Atal, M.K.; Saini, A.; Gopal, R.; Nagar, M.; Dhayal, V. Synthesis and characterization of a new class of single-phase AlVO4 precursors. Mater. Res. Innov. 2017, 21, 172–176. [Google Scholar] [CrossRef]
  63. Kondratenko, E.V.; Baerns, M. Catalytic oxidative dehydrogenation of propane in the presence of O2 and N2O—The role of vanadia distribution and oxidant activation. Appl. Catal. A Gen. 2001, 222, 133–143. [Google Scholar] [CrossRef]
  64. Deng, J.; Zhang, L.; Liu, C.; Xia, Y.; Dai, H. Single-crystalline mesoporous CaO supported Cr–V binary oxides: Highly active catalysts for the oxidative dehydrogenation of isobutane. Catal. Today 2011, 164, 347–352. [Google Scholar] [CrossRef]
  65. Dasireddy, V.D.B.C.; Singh, S.; Friedrich, H.B. Activation of n-octane using vanadium oxide supported on alkaline earth hydroxyapatites. Appl. Catal. A Gen. 2013, 456, 105–117. [Google Scholar] [CrossRef]
  66. Lee, E.-K.; Jung, K.-D.; Joo, O.-S.; Shul, Y.-G. Catalytic wet oxidation of H2S to sulfur on V/MgO catalyst. Catal. Lett. 2004, 98, 259–263. [Google Scholar] [CrossRef]
  67. Jin, M.; Cheng, Z.-M. Oxidative dehydrogenation of cyclohexane to cyclohexene over Mg-V-O catalysts. Catal. Lett. 2009, 131, 266–278. [Google Scholar] [CrossRef]
Figure 1. Raman spectra of pure mayenite and V/C12A7 samples calcined at 600 °C: (a) detailed spectrum of pure mayenite; (b) comparison of all the spectra.
Jcs 06 00308 g001
Figure 2. Molecular structure model diagrams of the calcium vanadates: (a) Ca2V2O7; (b) Ca3(VO4)2. The following color designation was used: calcium–blue; oxygen–red; vanadium–orange.
Jcs 06 00308 g002
Figure 3. Diffuse reflectance UV–Vis spectrum of pure mayenite calcined at 600 °C (a). Dependence of (F(R)·E)2 on the photon energy E characterizing the energy gap width Eg for the direct allowed transitions (b).
Jcs 06 00308 g003
Figure 4. Emission and excitation luminescence spectra of the impurity ions Cr3+ex = 470 nm) and Fe3+ex = 320 nm) in pure mayenite (a). Dependence of luminescence intensity of the impurity ions Cr3+ and Fe3+ on the calcination temperature (b).
Jcs 06 00308 g004
Figure 5. Diffuse reflectance UV–Vis spectra of 5%V/C12A7 sample calcined at 600 °C (a) and 800 °C (d). Dependences of (F(RE)2 and (F(RE)0.5 on E characterizing the energy gap width Eg (direct and indirect) for 5%V/C12A7 sample calcined at 600 °C (b) and 800 °C (e). Diffuse reflectance UV–Vis spectra of 10%V/C12A7 sample calcined at 600 °C (c) and 800 °C (f).
Jcs 06 00308 g005
Figure 6. Diffuse reflectance UV–Vis spectrum of 5%V/Al2O3 reference sample calcined at 600 °C with the bands after deconvolution in accordance with [63] (a). Dependence of (F(RE)2 on E characterizing the energy gap width (direct allowed transition) Eg (b).
Jcs 06 00308 g006
Figure 7. The energy gap width Eg values (direct and indirect allowed transitions) for 5%V/C12A7 (blue) and 10%V/C12A7 (red) in comparison with the experimental data for Ca3(VO4)2 () [60] and Ca2V2O7 () [44].
Jcs 06 00308 g007
Figure 8. TPR-H2 profiles for the studied samples: (a) C12A7; (b) 5%V/C12A7; (c) 10%V/C12A7. The number of redox cycles is written above each curve.
Jcs 06 00308 g008
Figure 9. (a) Catalytic performance (ethane conversion, ethylene selectivity, and yield) of 5%V/C12A7 and 10%V/C12A7 in a model reaction of ethylene dehydrogenation. (b) Dependence of ethylene yield on time on stream for the V5%/C12A7 and V10%/C12A7 samples in comparison with a reference sample 5%V/MgO [28].
Jcs 06 00308 g009
Figure 10. Photographs of the 5%V/C12A7 sample ((a) as-prepared; (b) after TPR-H2; (c) after catalytic tests in ethane dehydrogenation) and a reference sample 5%V/MgO after catalytic tests in ethane dehydrogenation (d).
Jcs 06 00308 g010
Table 1. The estimated values of Eg for the 5%V/C12A7 and 10%V/C12A7 samples.
SampleT = 600 °CT = 800 °CAssignment
IndirectDirectIndirectDirect
5%V/C12A73.684.23.864.3Ca3(VO4)2
10%V/C12A73.534.053.64.17Ca3(VO4)2
10%V/C12A7 *2.713.09--Ca2V2O7
* the calculation was performed using the band edge (Figure 5c) for the 10%V/C12A7 sample (3.49 eV, 355 nm).
Table 2. Hydrogen uptake in TPR-H2 experiments for pure mayenite and vanadia-mayenite composites.
Number of Redox CyclesHydrogen Uptake, mmol/g
C12A75%V/C12A710%V/C12A7
10.2881.0181.097
20.1290.5170.815
30.1280.3820.726
40.1140.4160.740
50.0810.3460.721
Publisher’s Note: MDPI stays neutral with regard to jurisdictional claims in published maps and institutional affiliations.

