
Bio-Based Epoxies: Mechanical Characterization and Their Applicability in the Development of Eco-Friendly Composites


Abstract
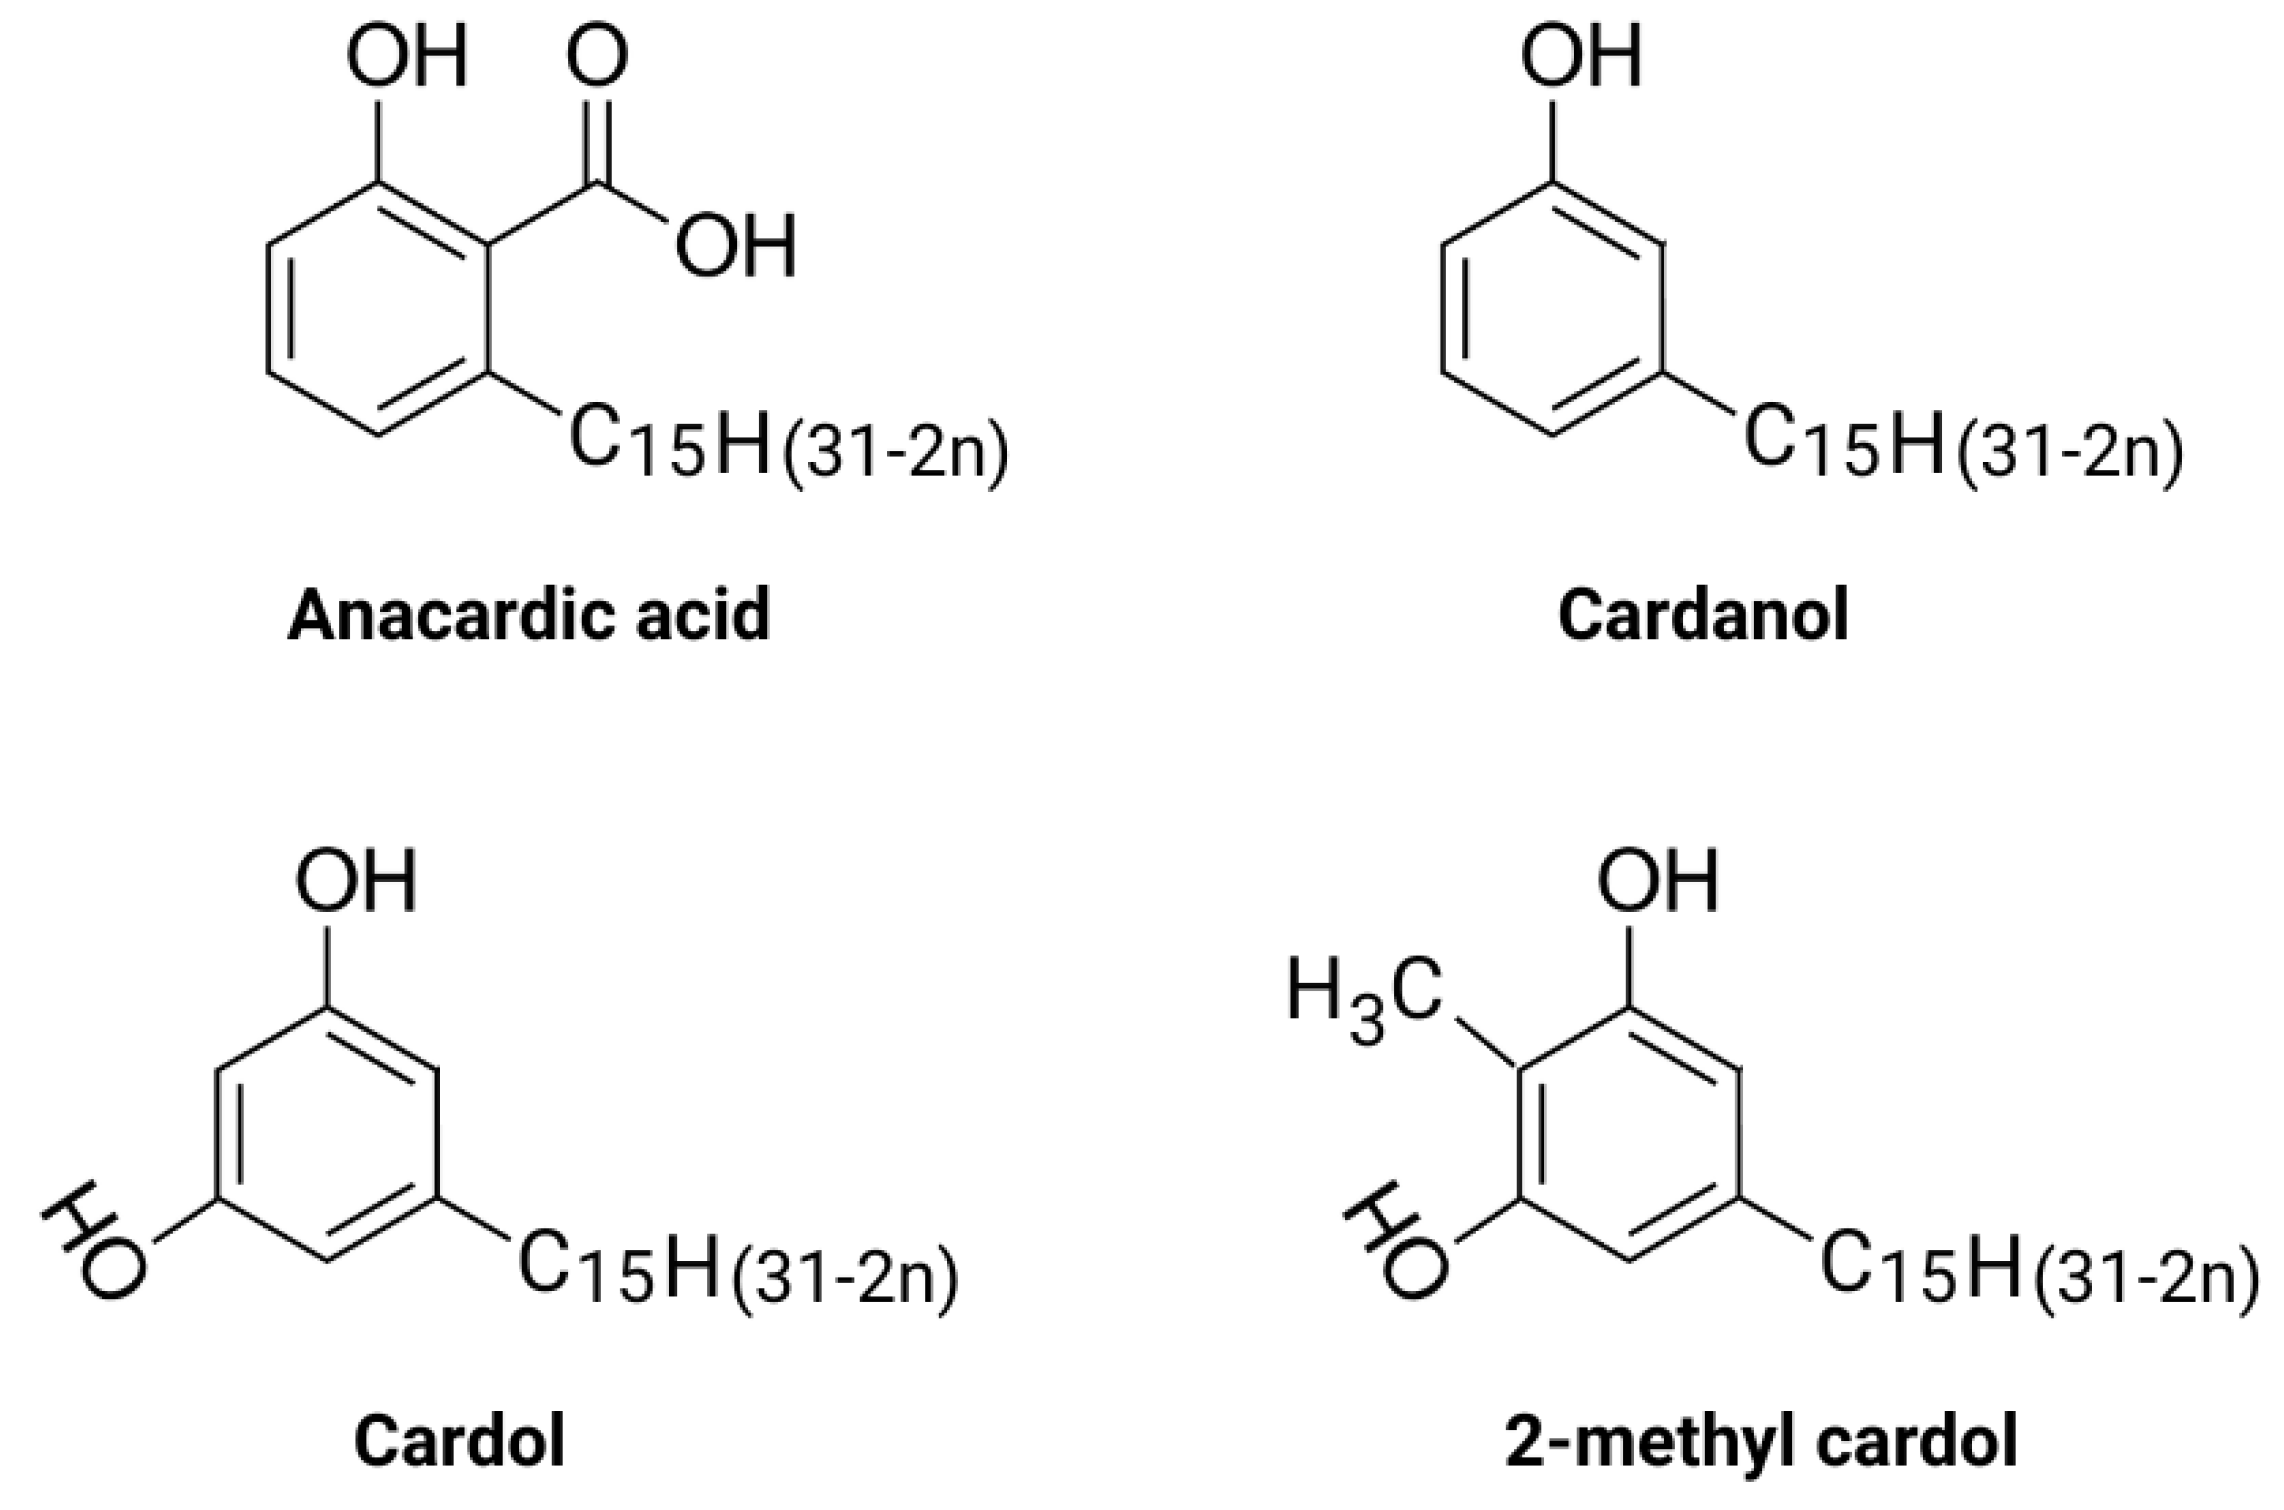
:1. Introduction
2. Materials and Methods
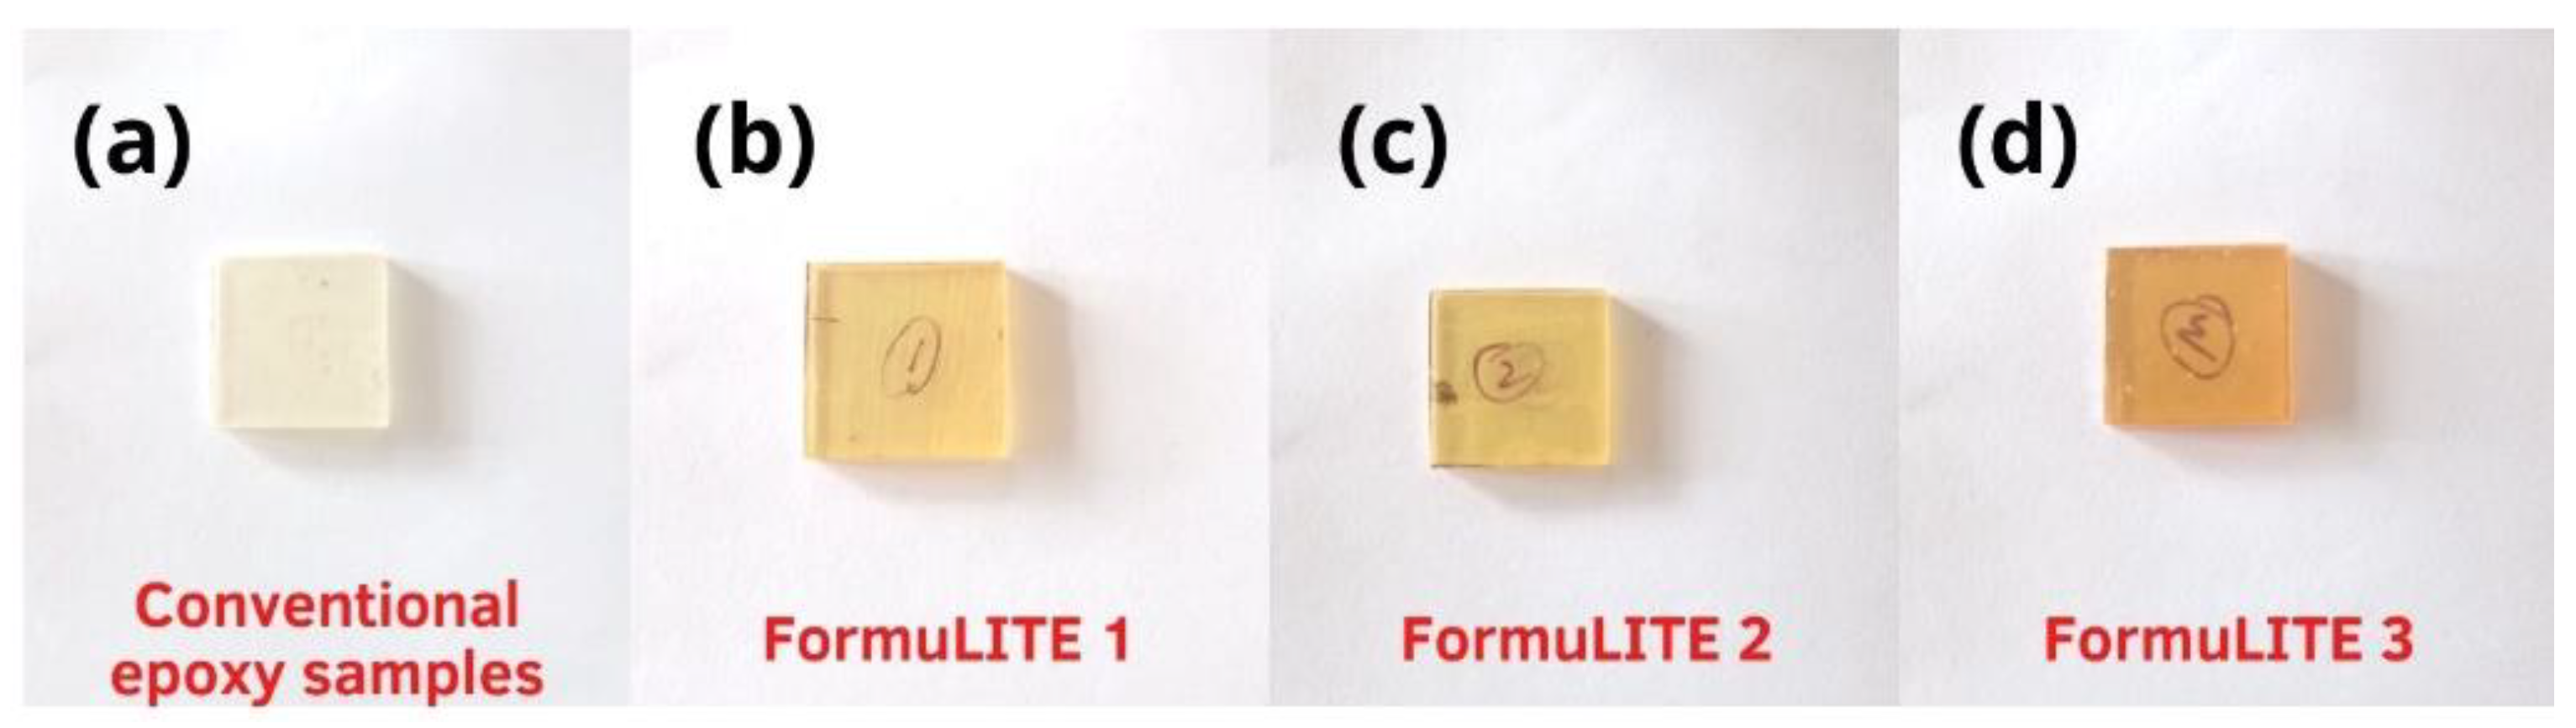
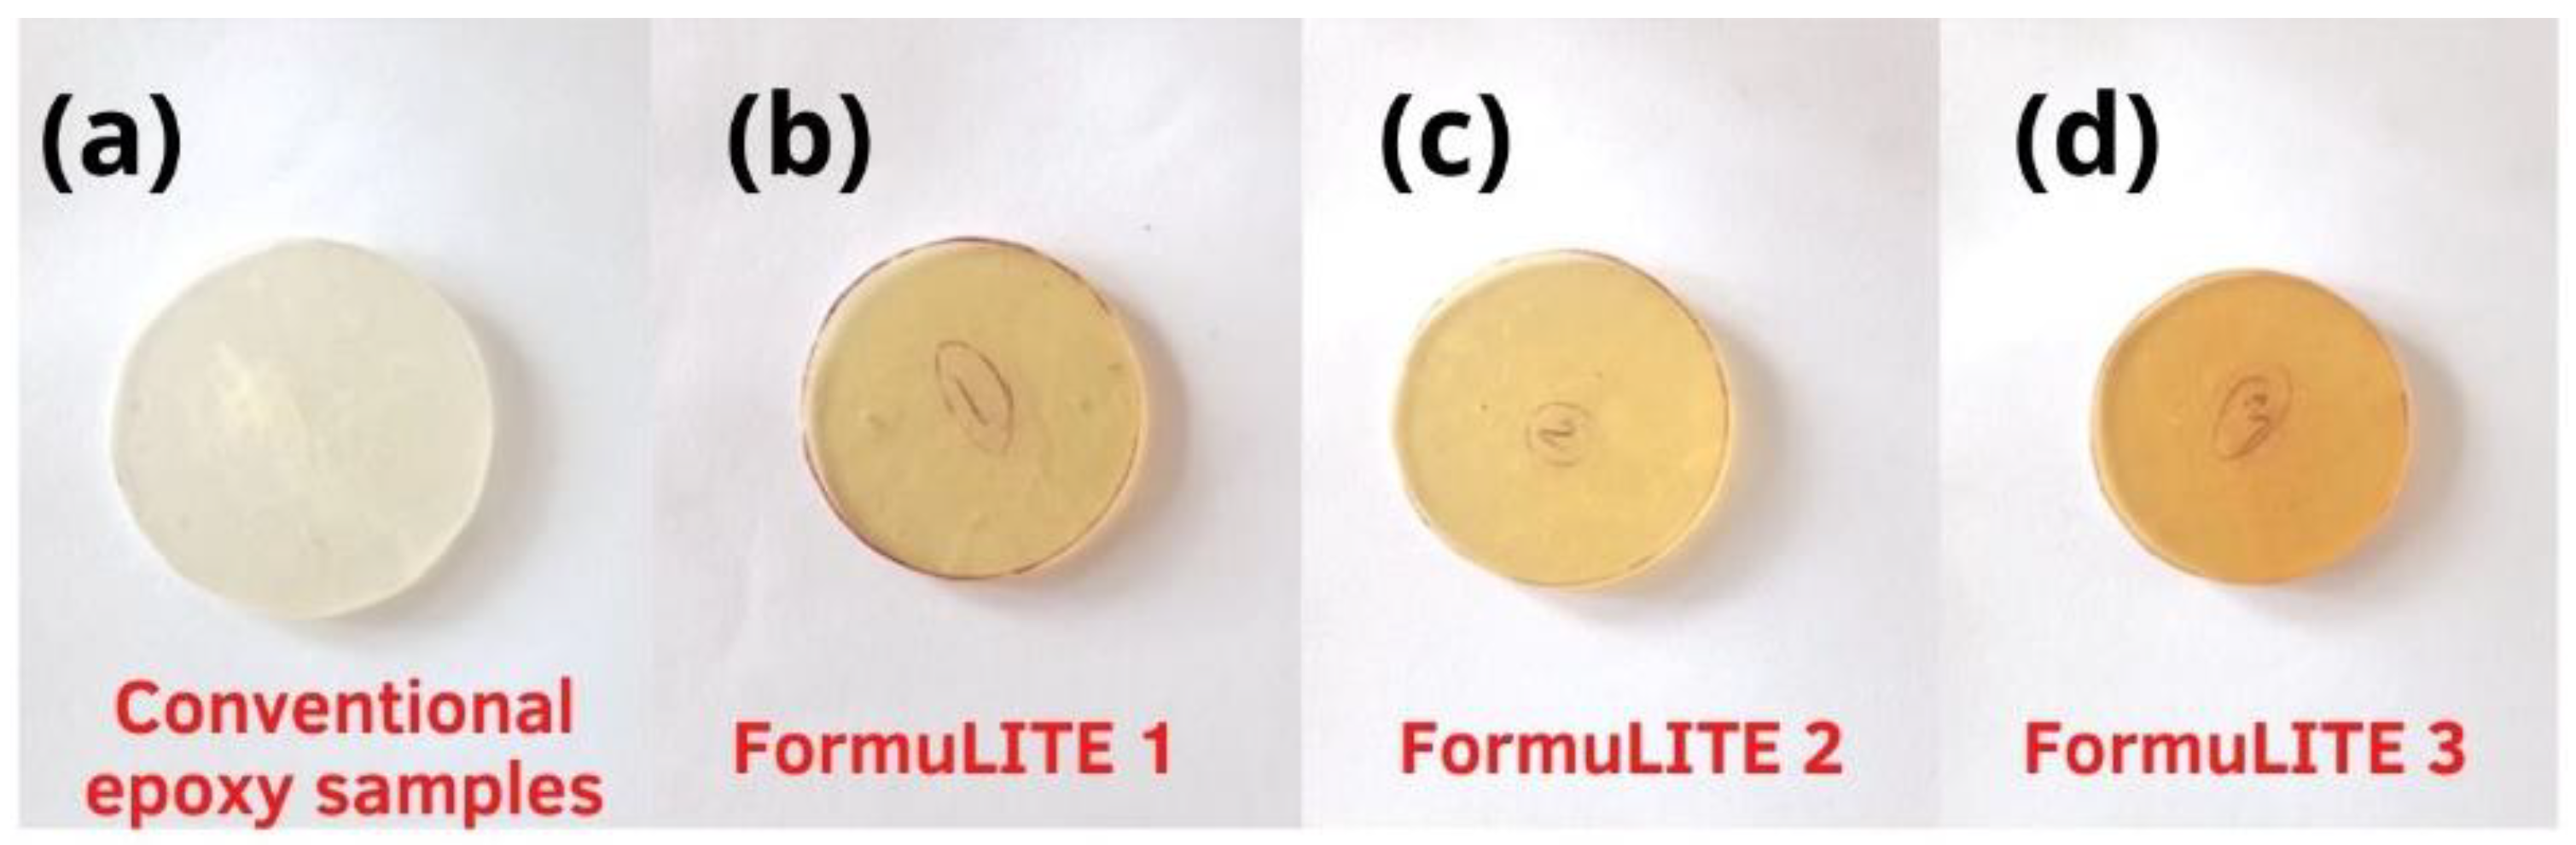
2.1. Material Fabrication
2.2. Experiment and Equipment Details
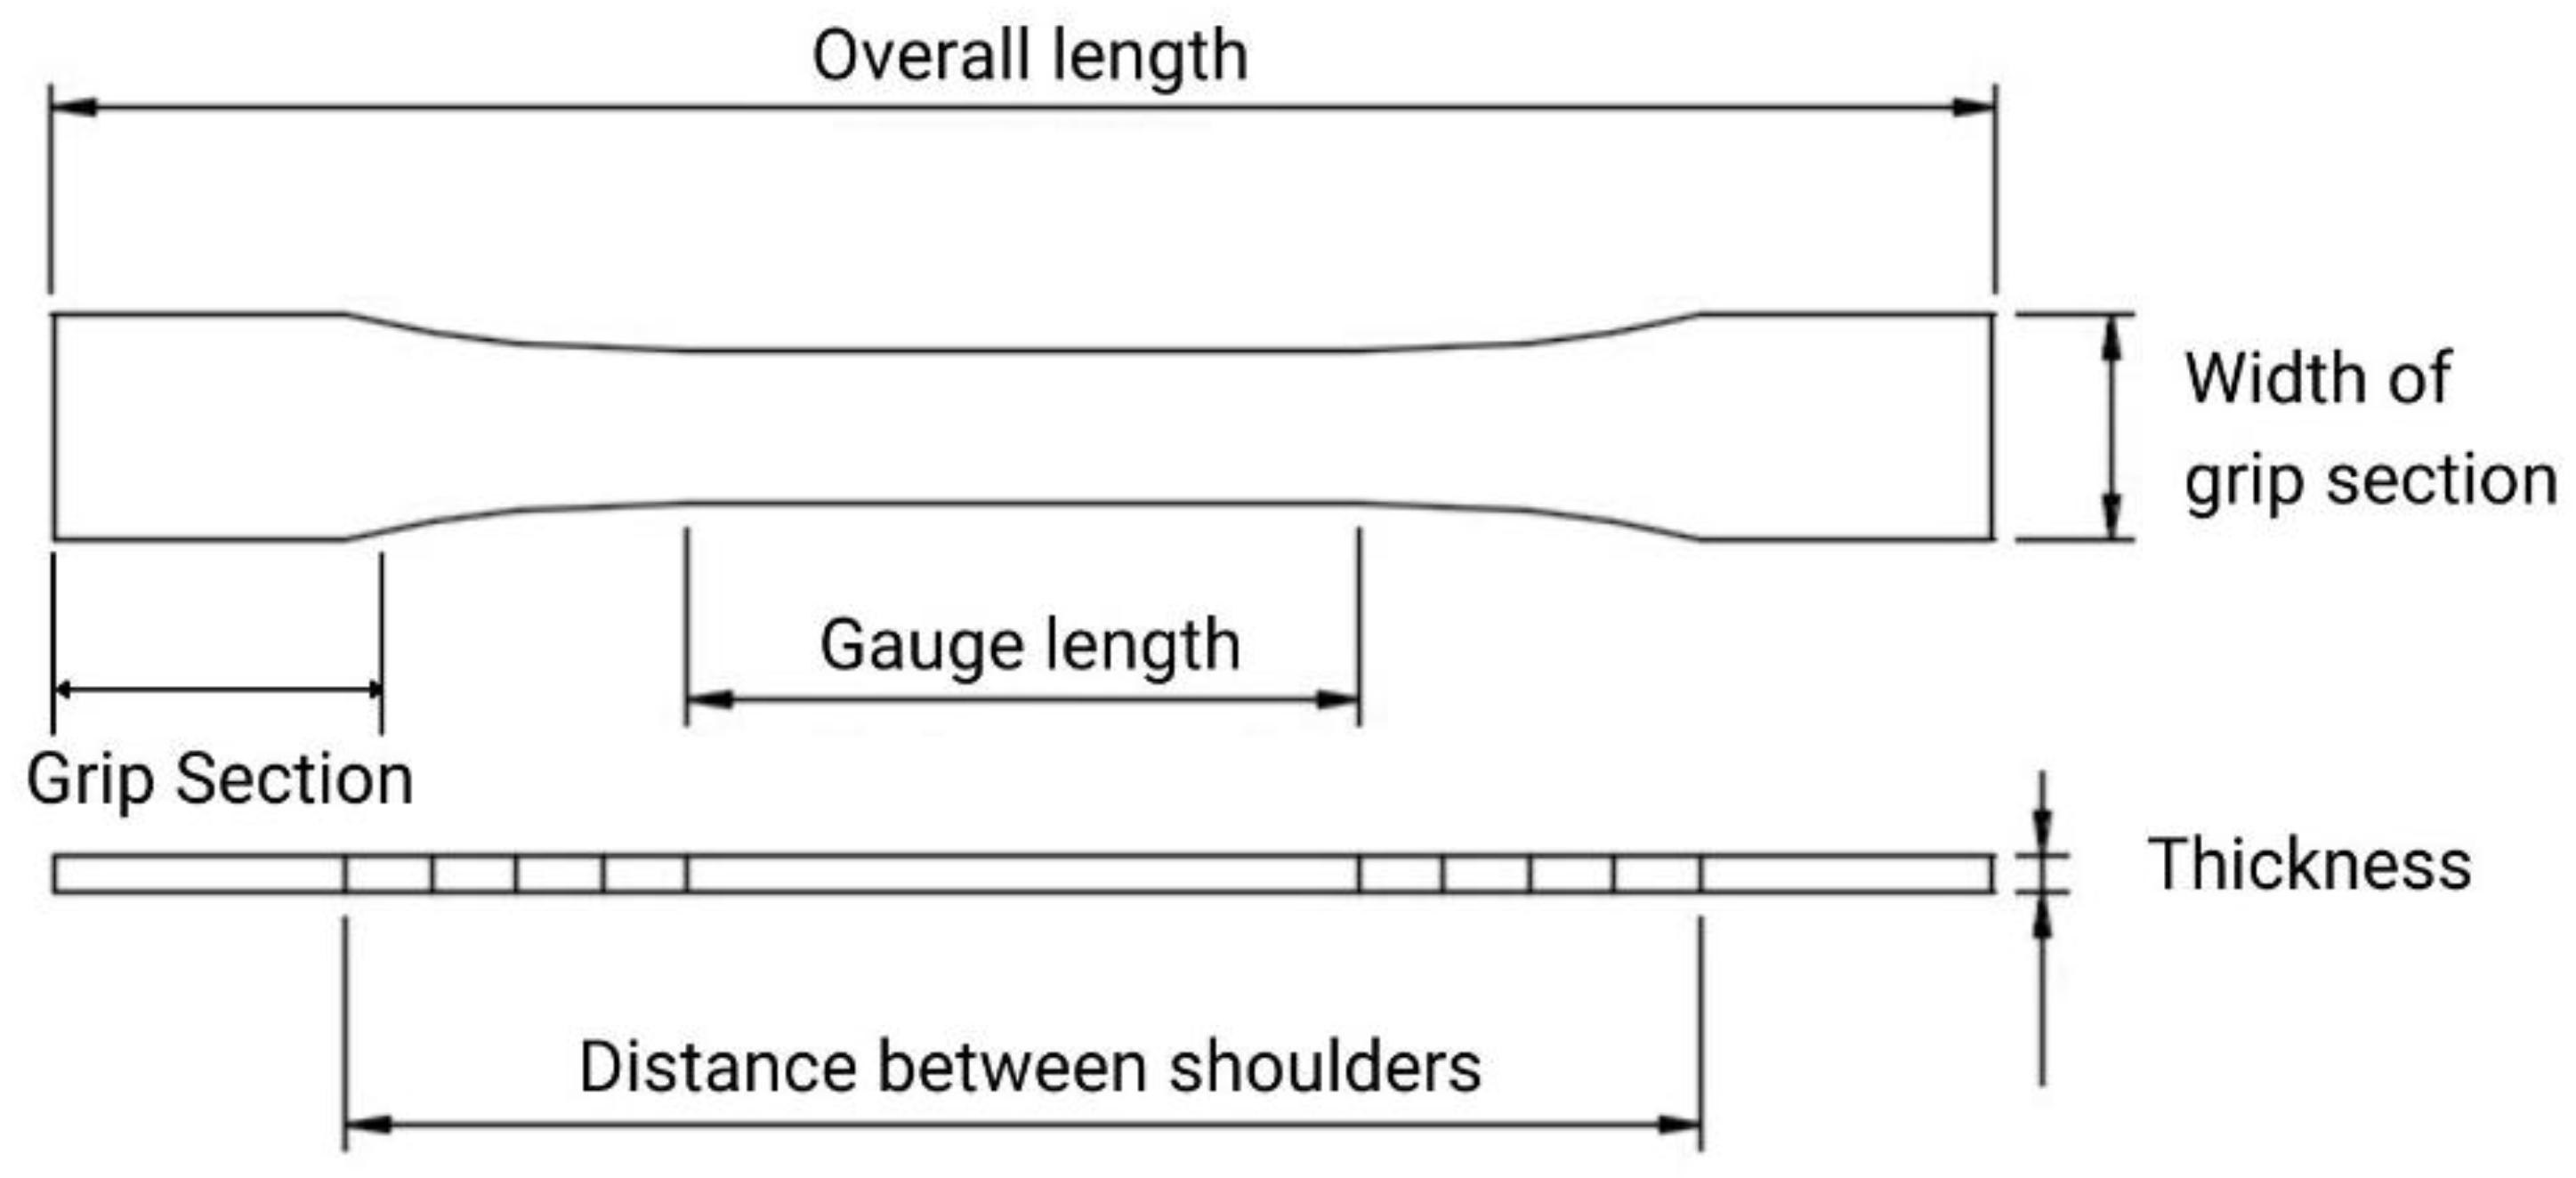
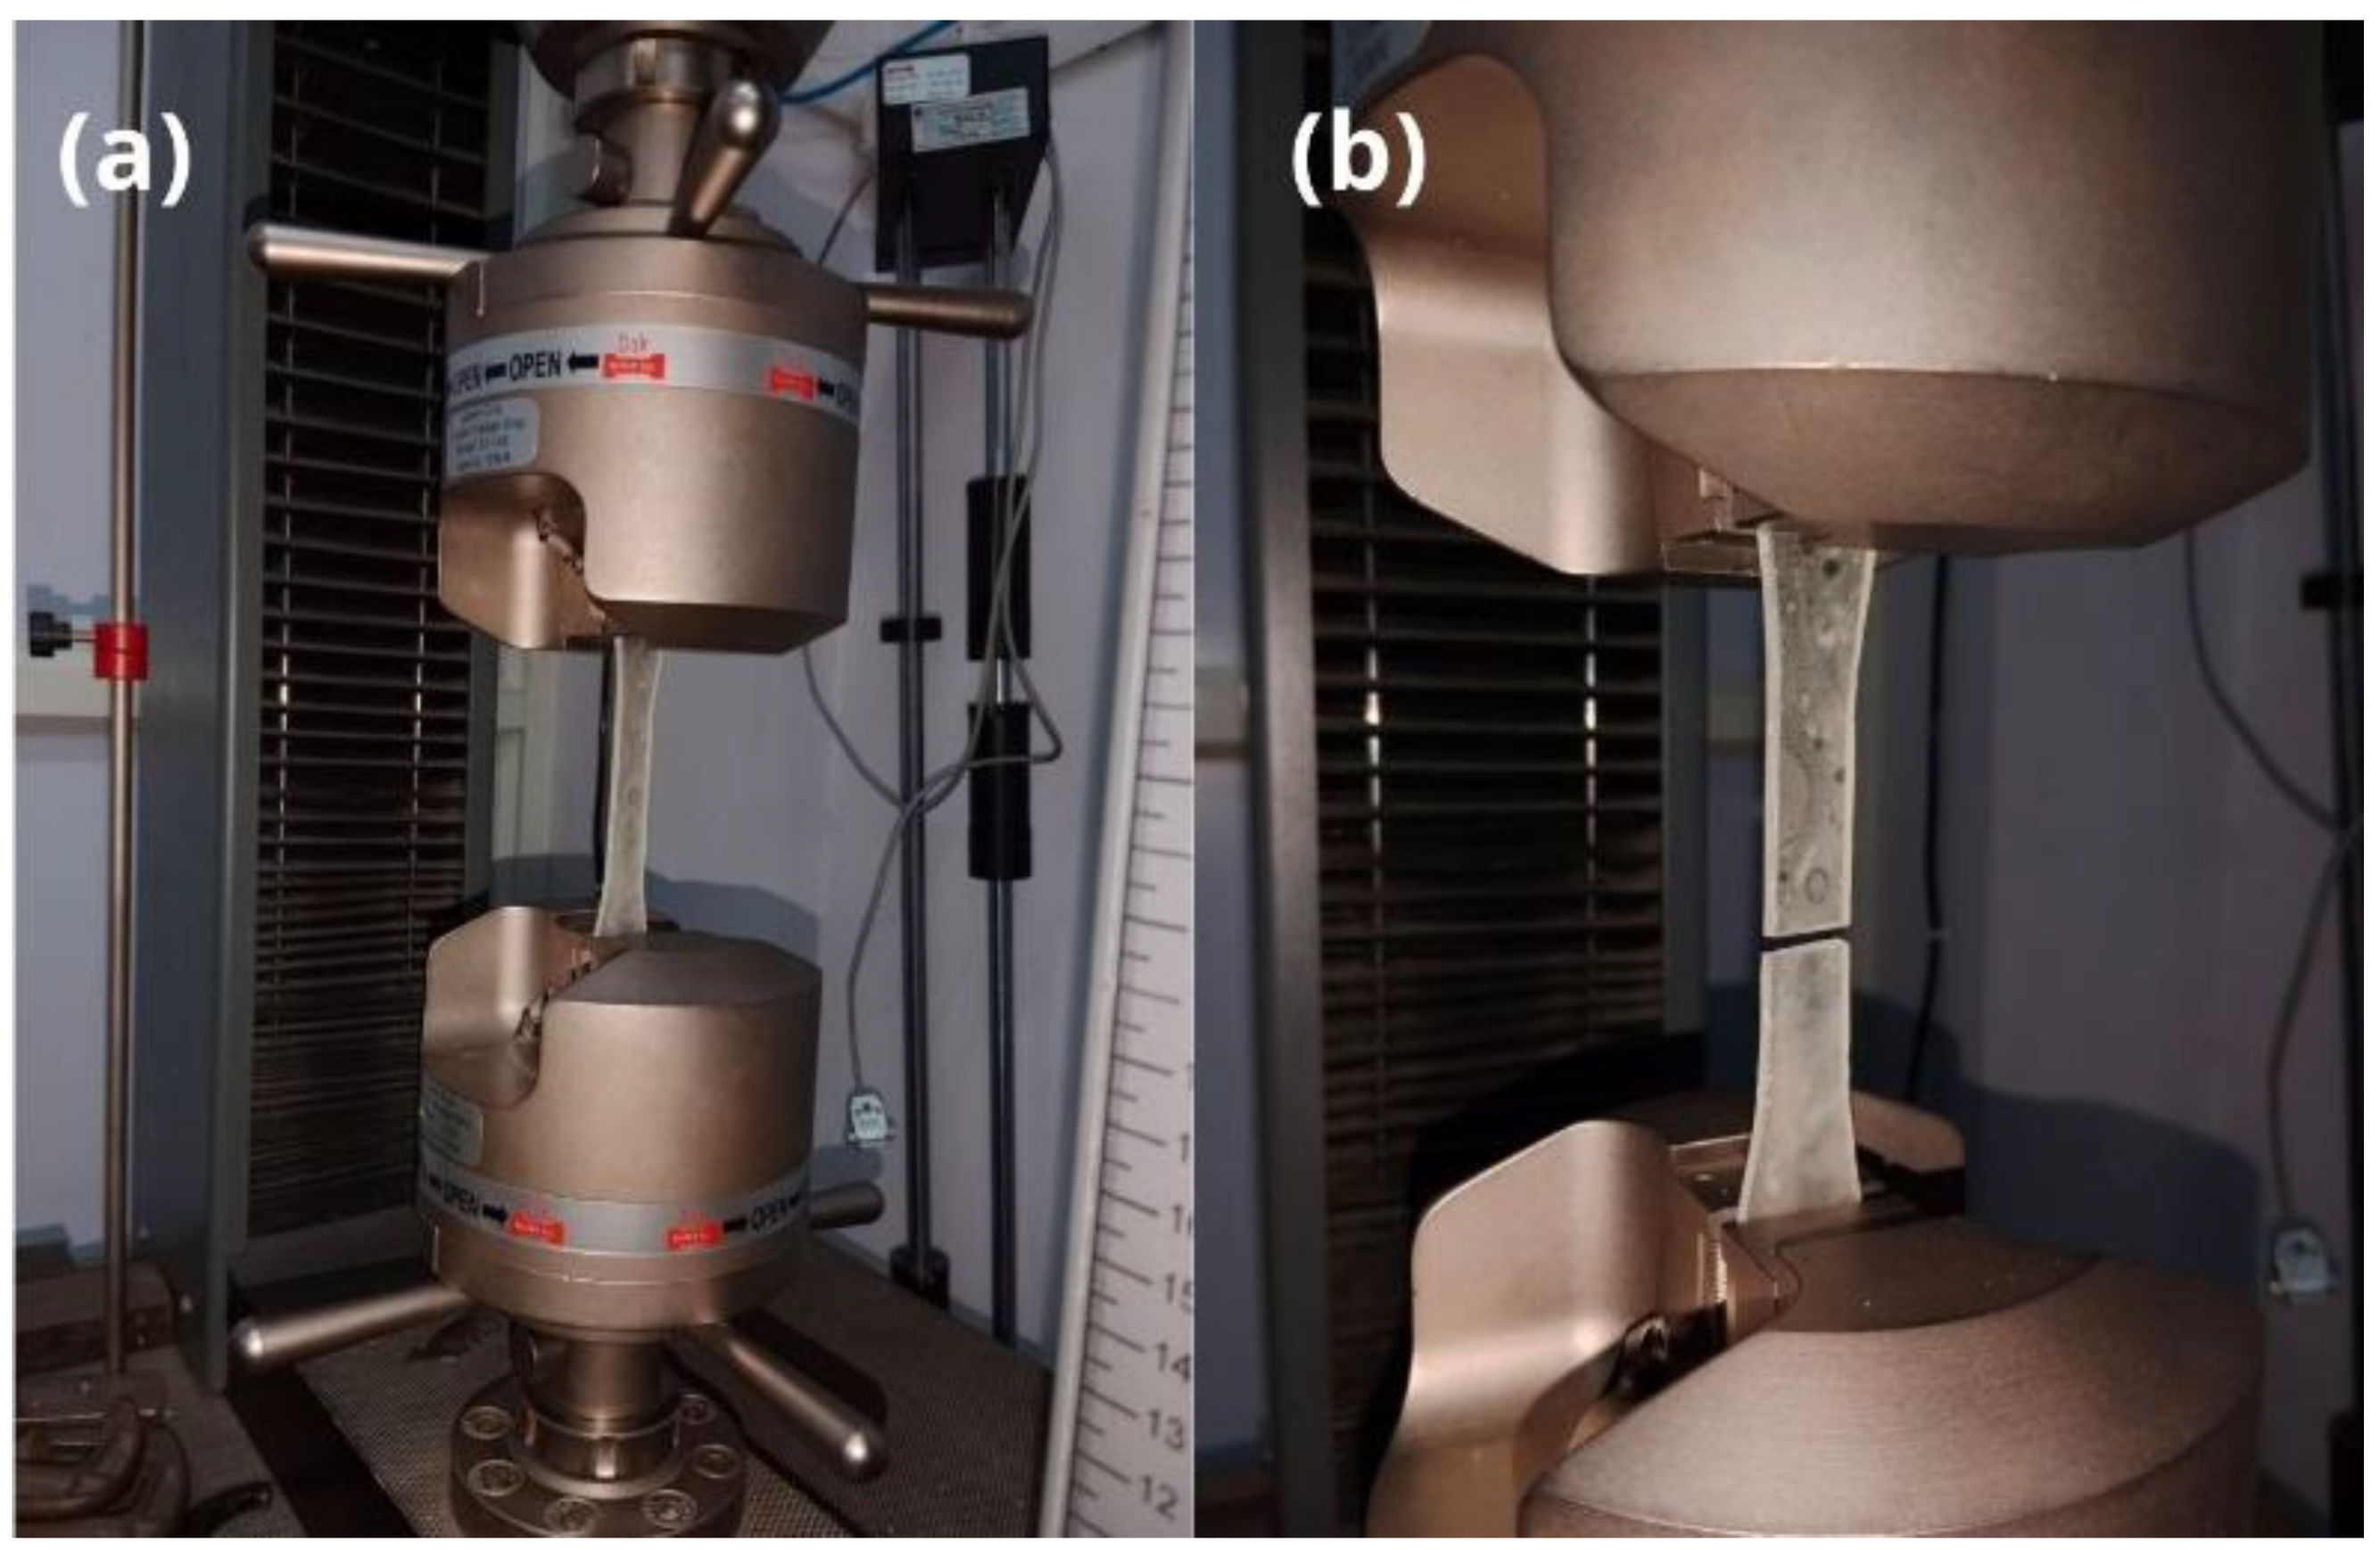
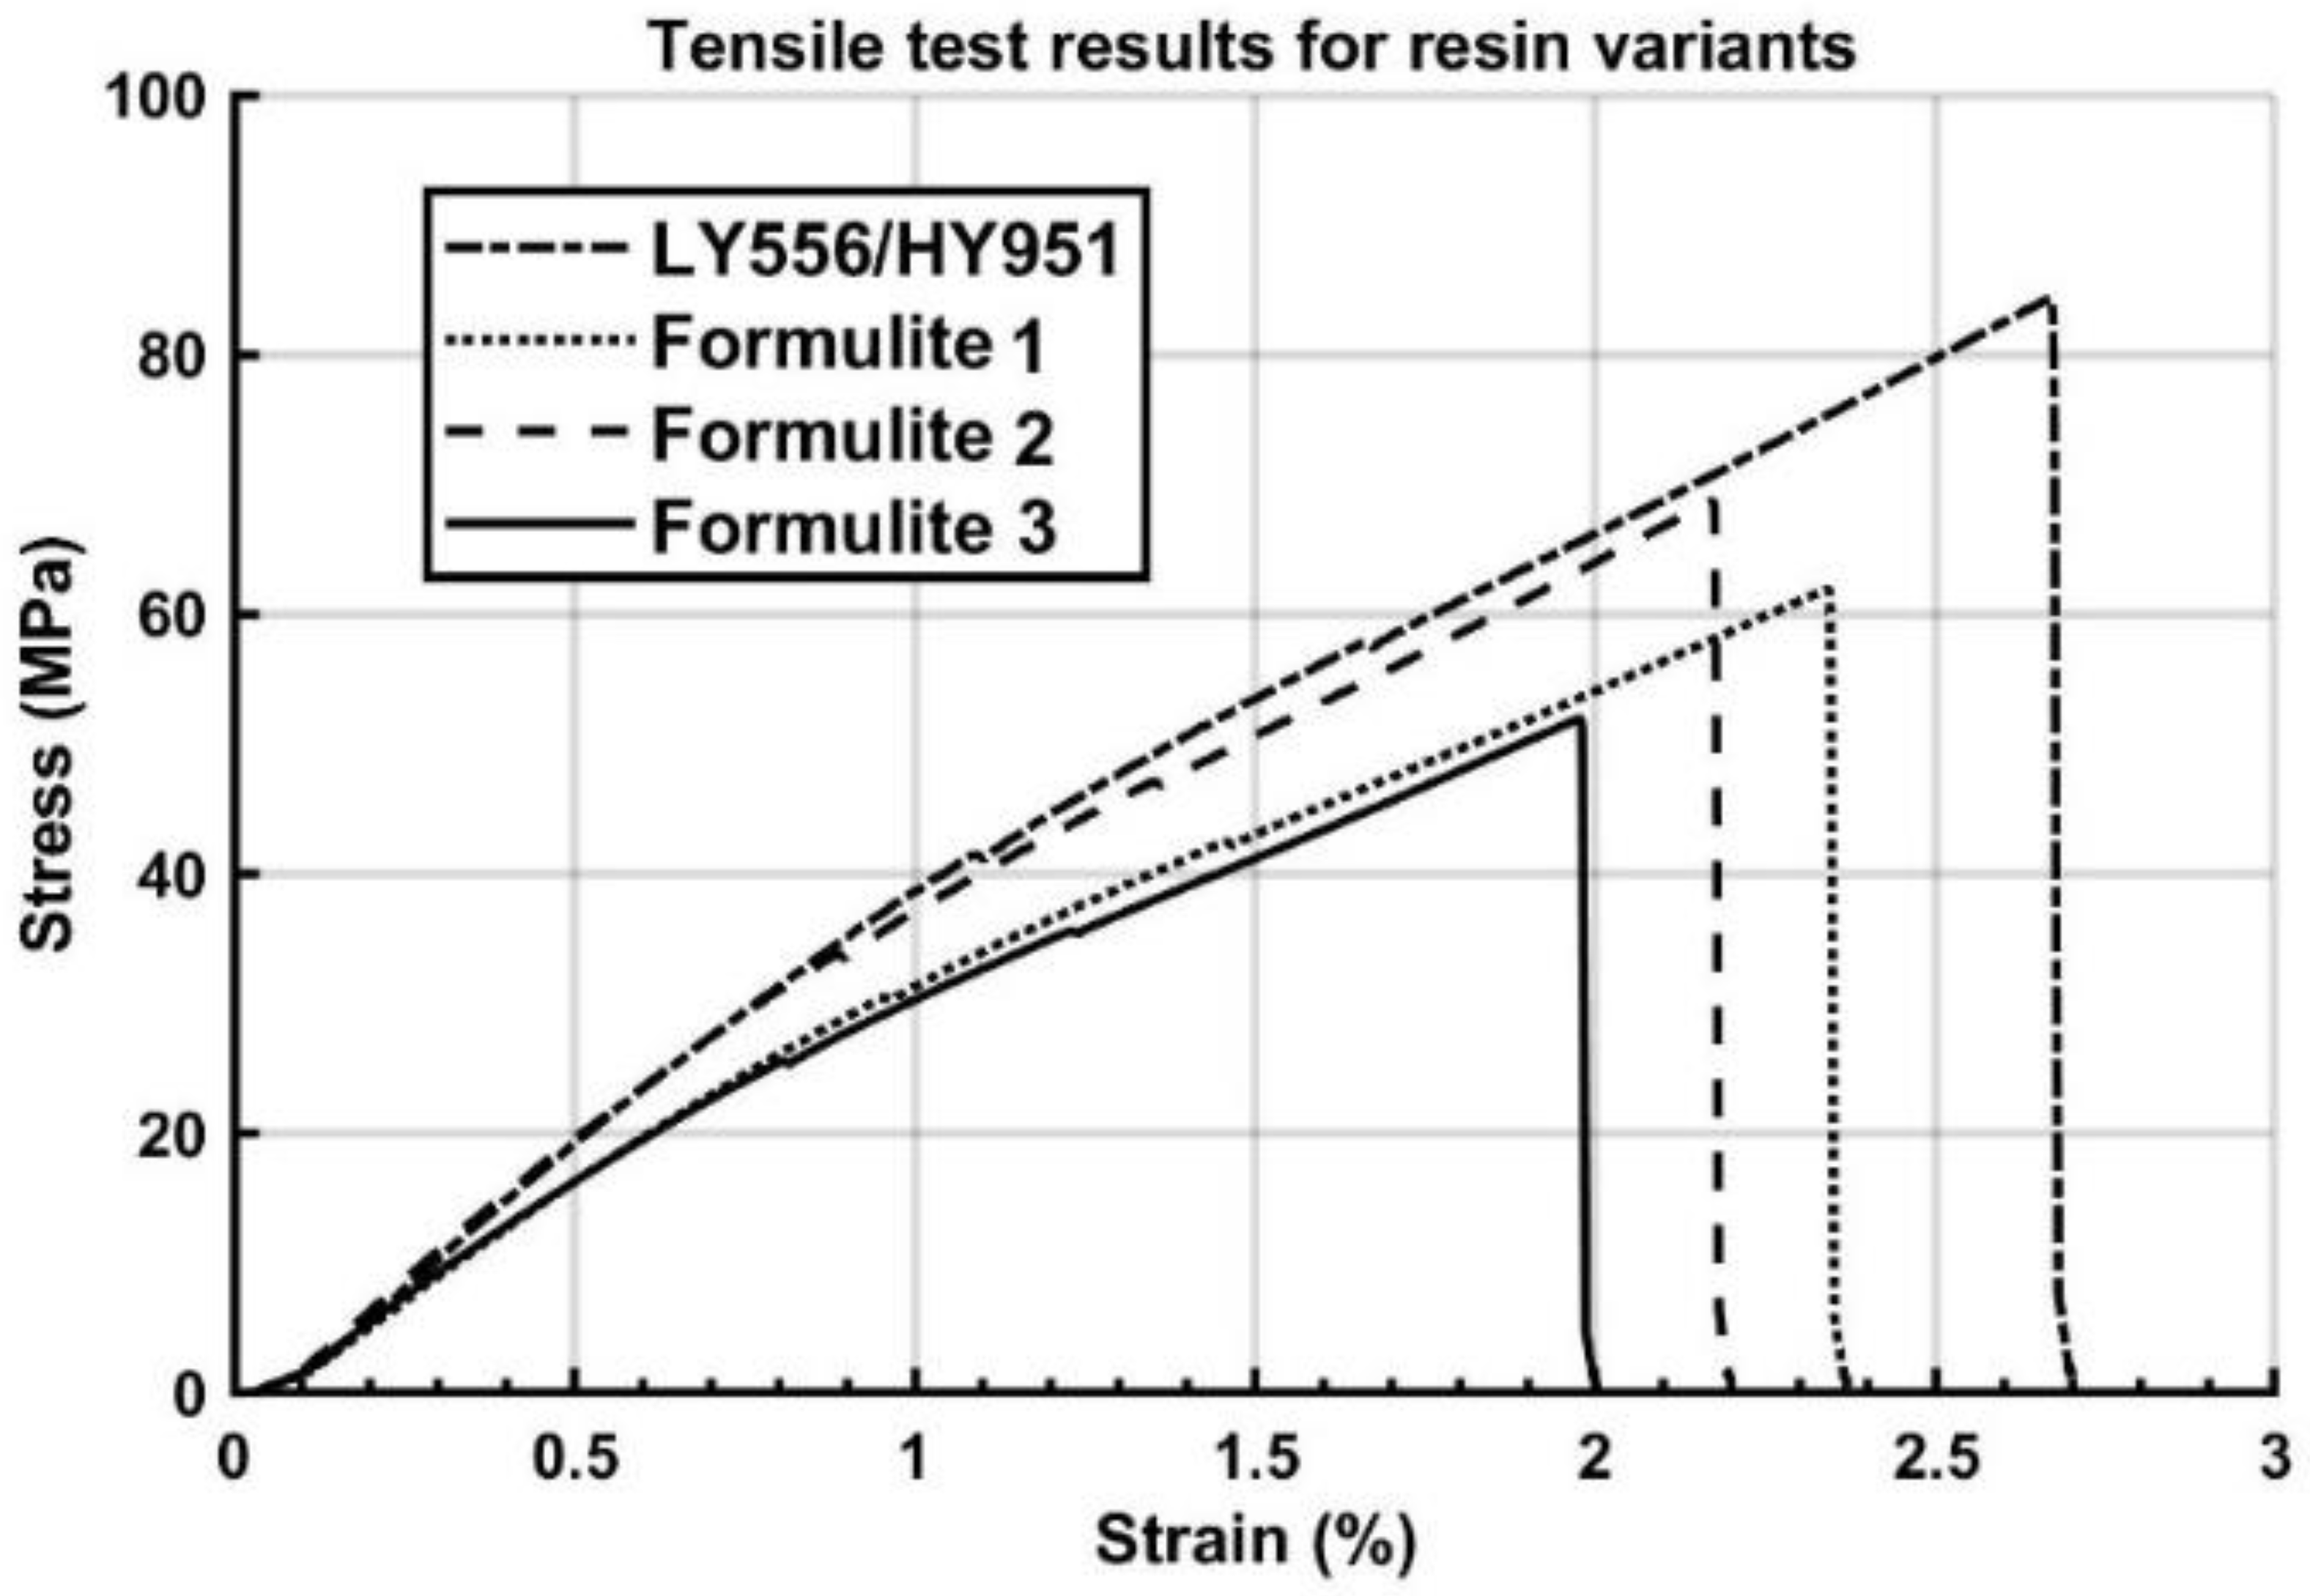
2.2.1. Experimental Setup for Tensile Testing
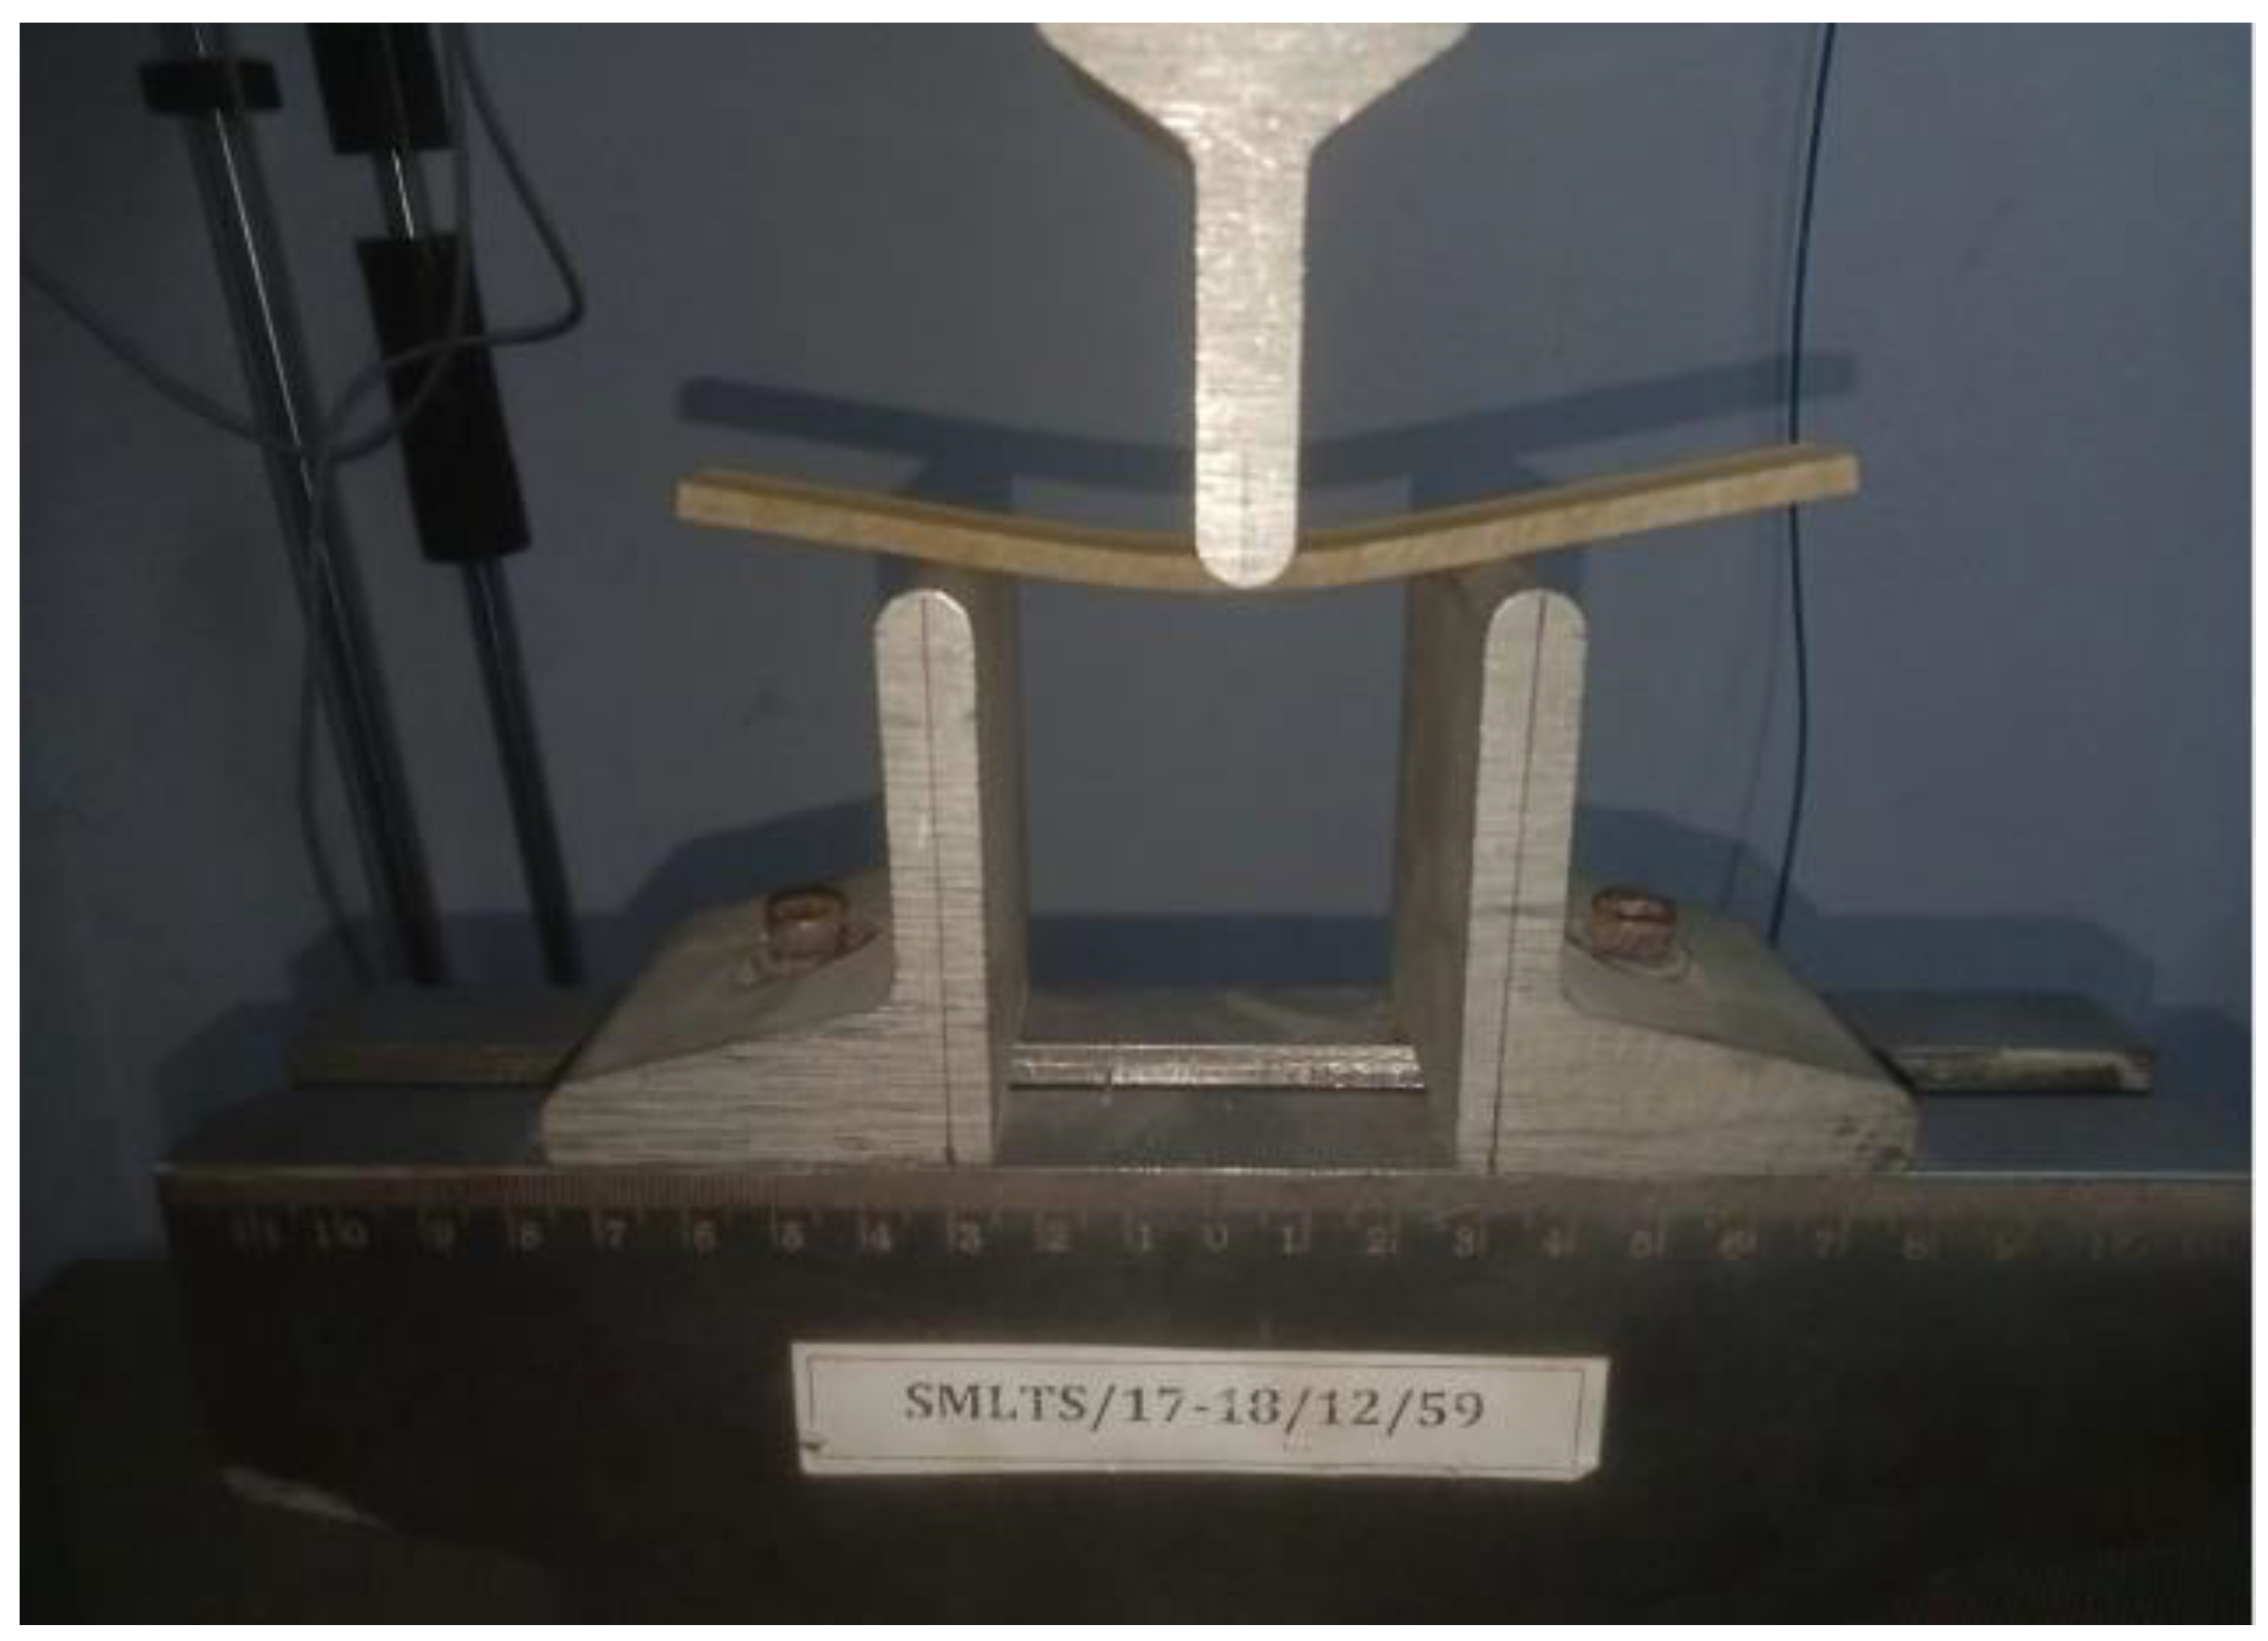
2.2.2. Experimental Setup for Flexural Testing
2.2.3. Experimental Setup for Hardness Testing
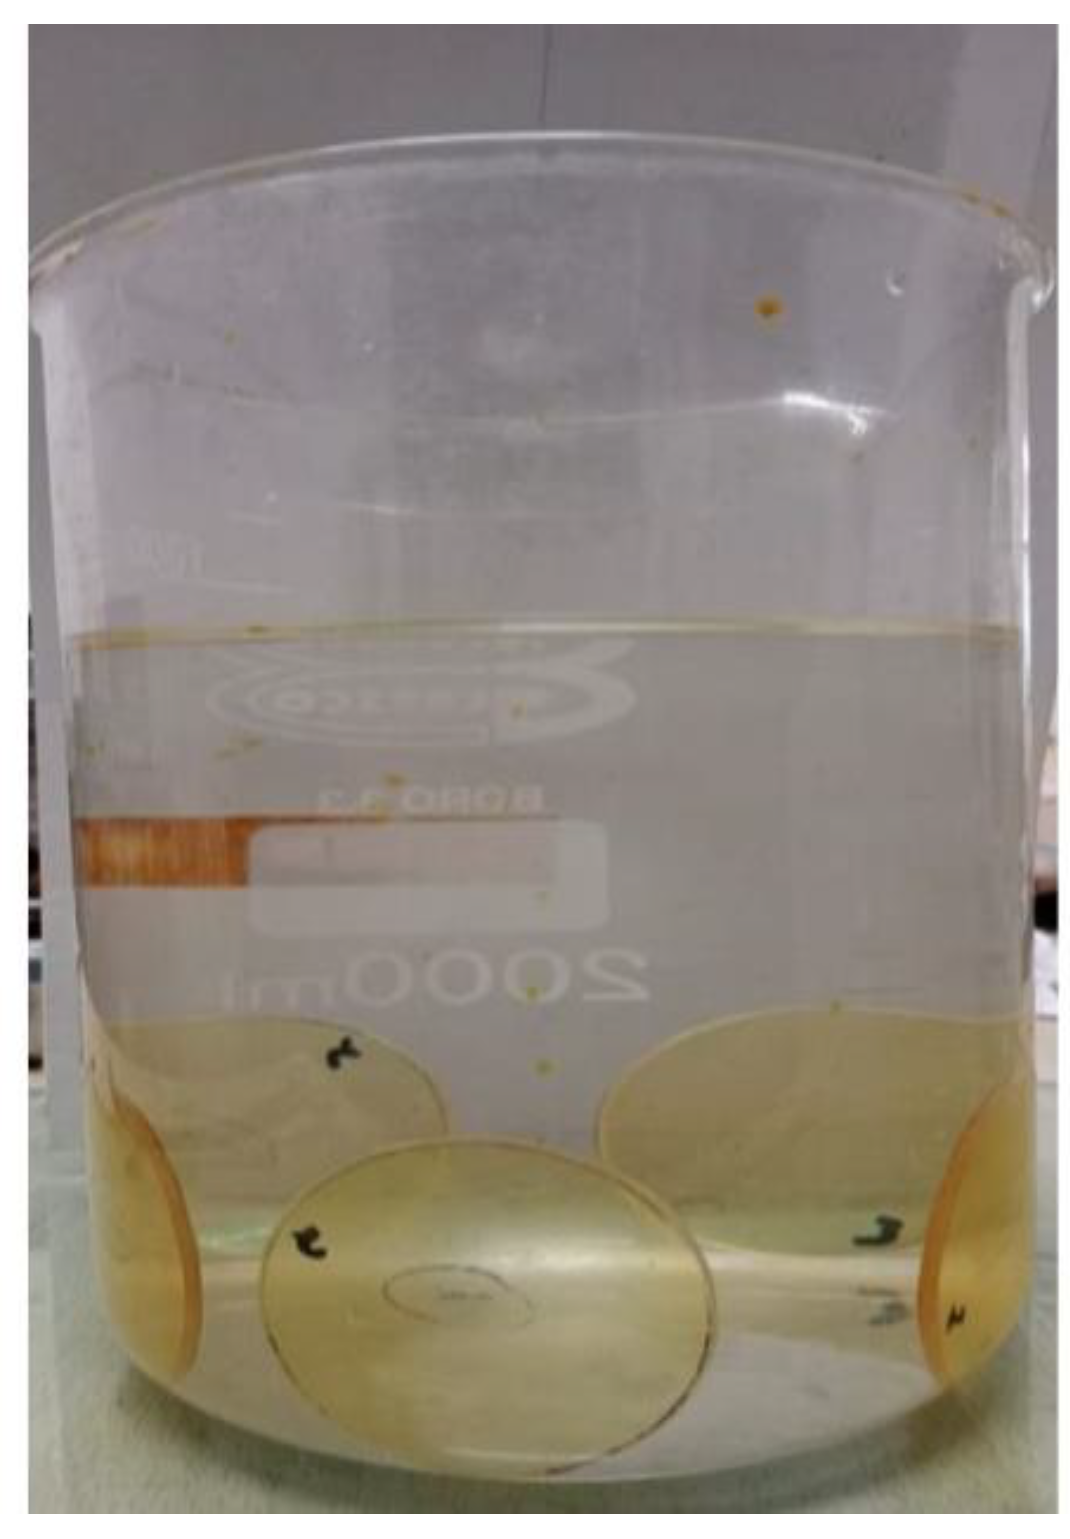
2.2.4. Experimental Setup for Water Absorption Test
2.2.5. Statistical Methods Used
3. Results
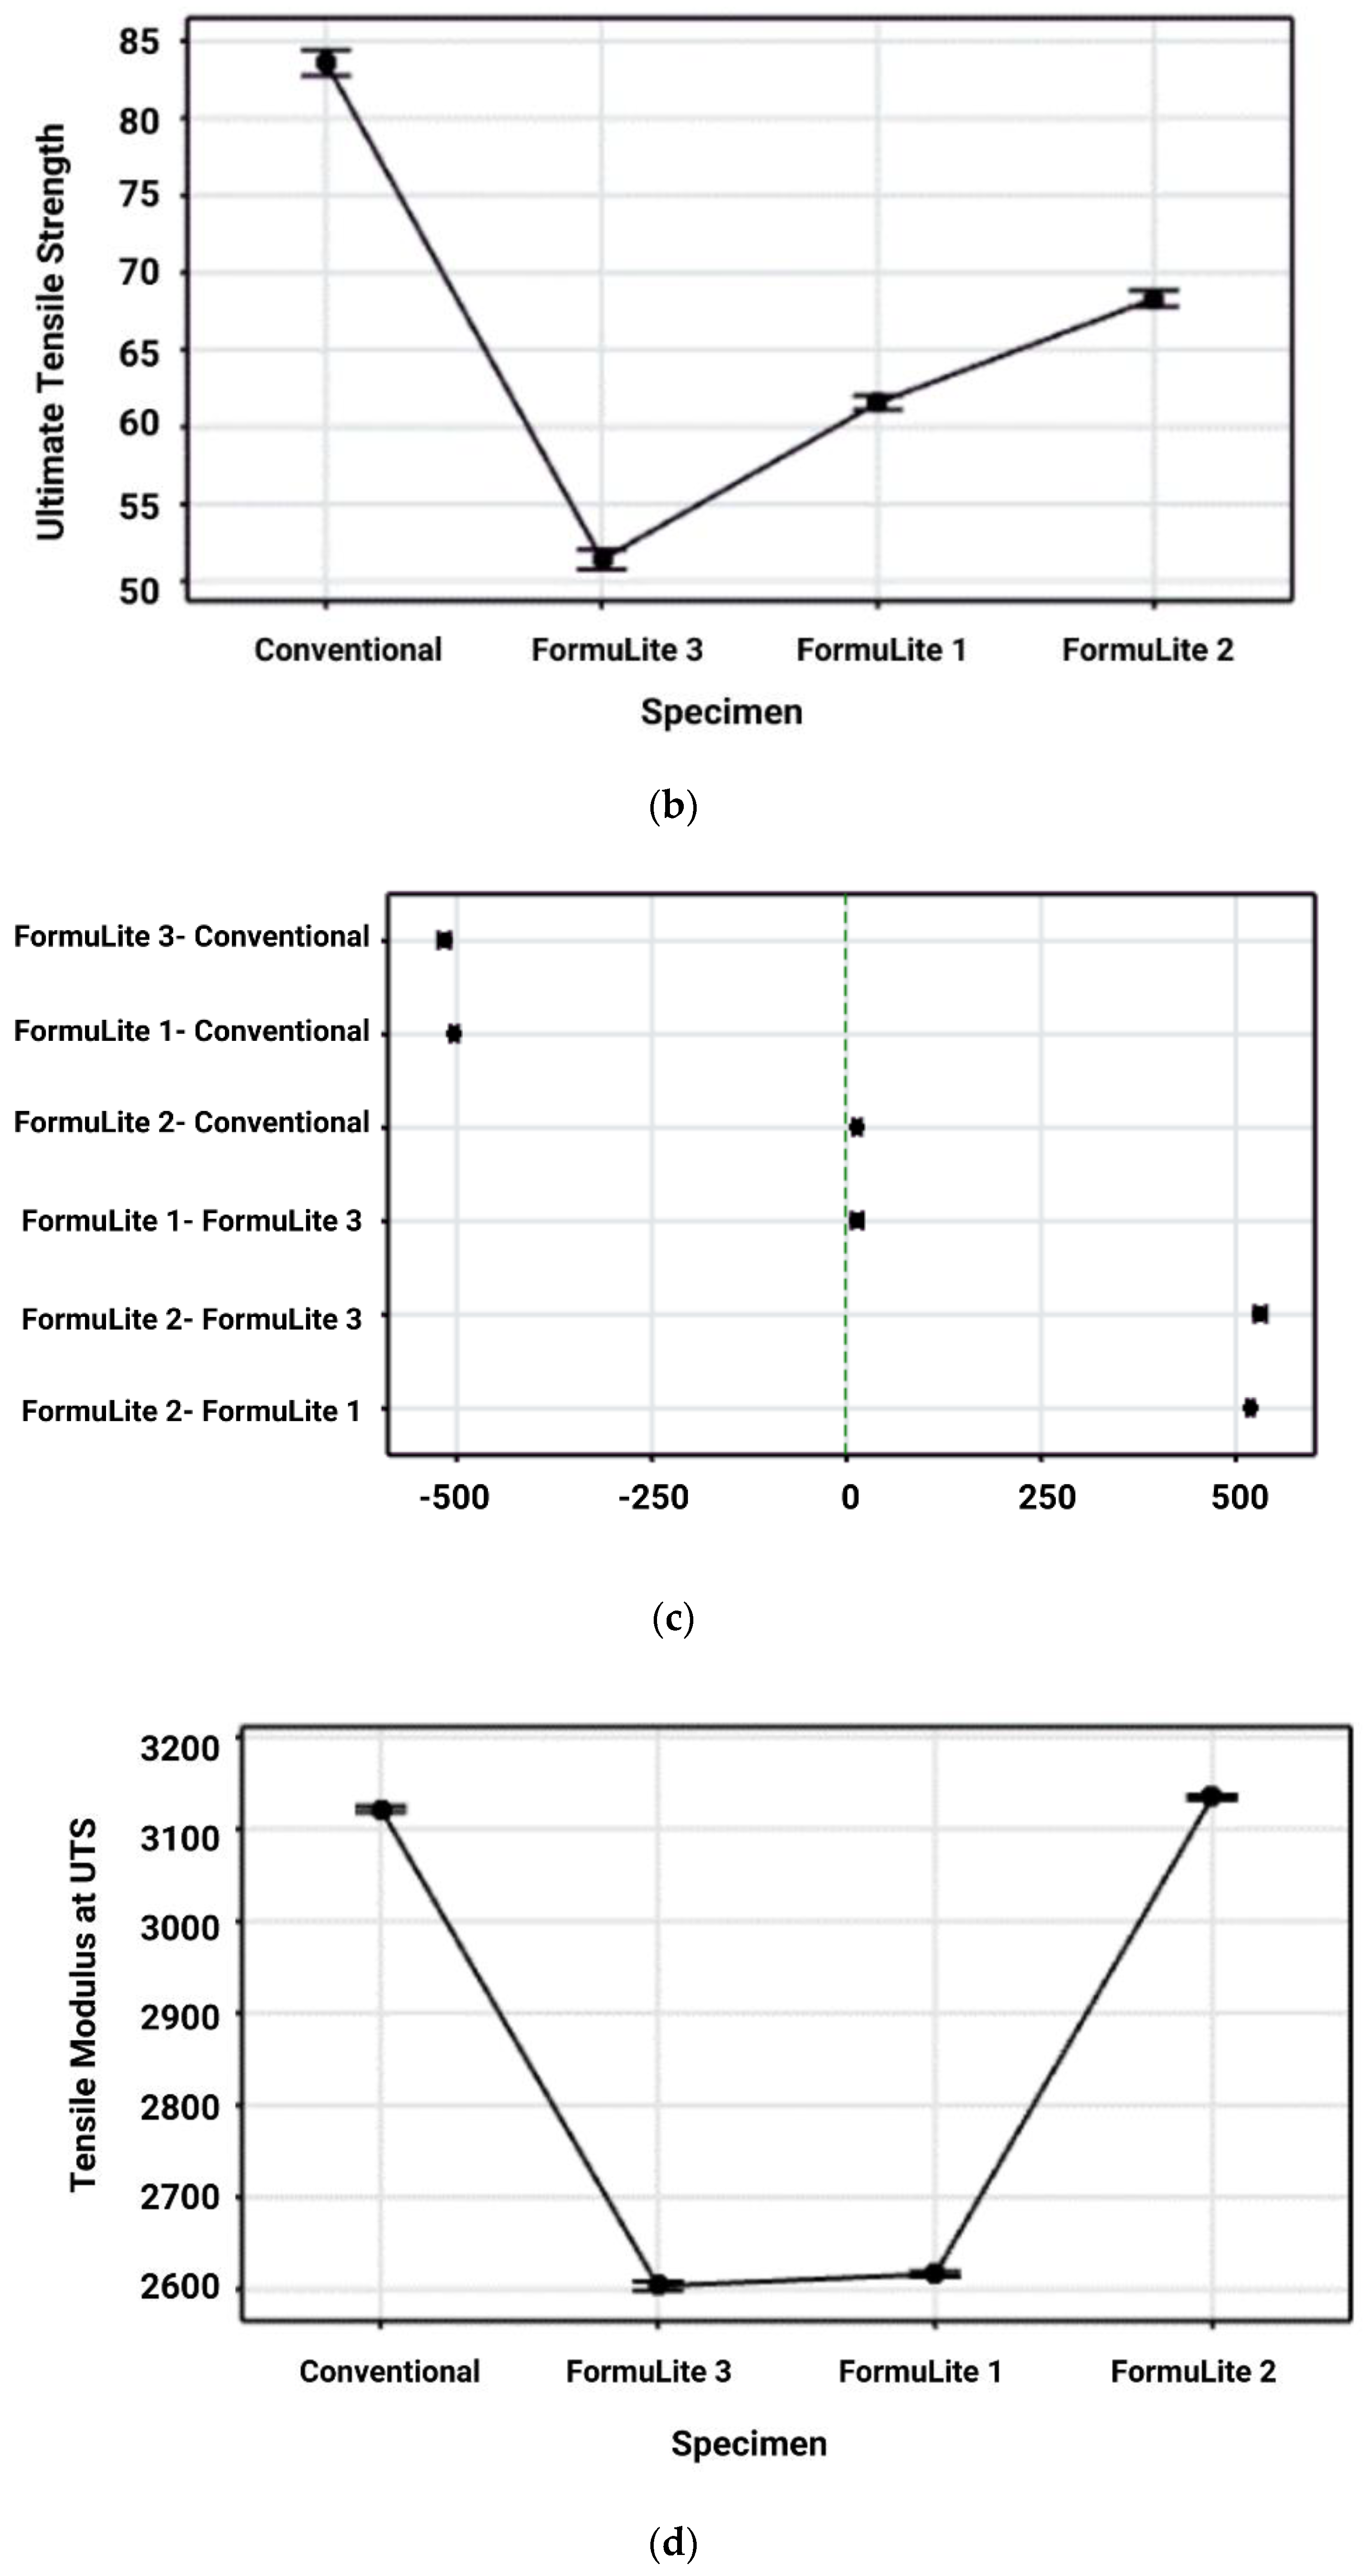
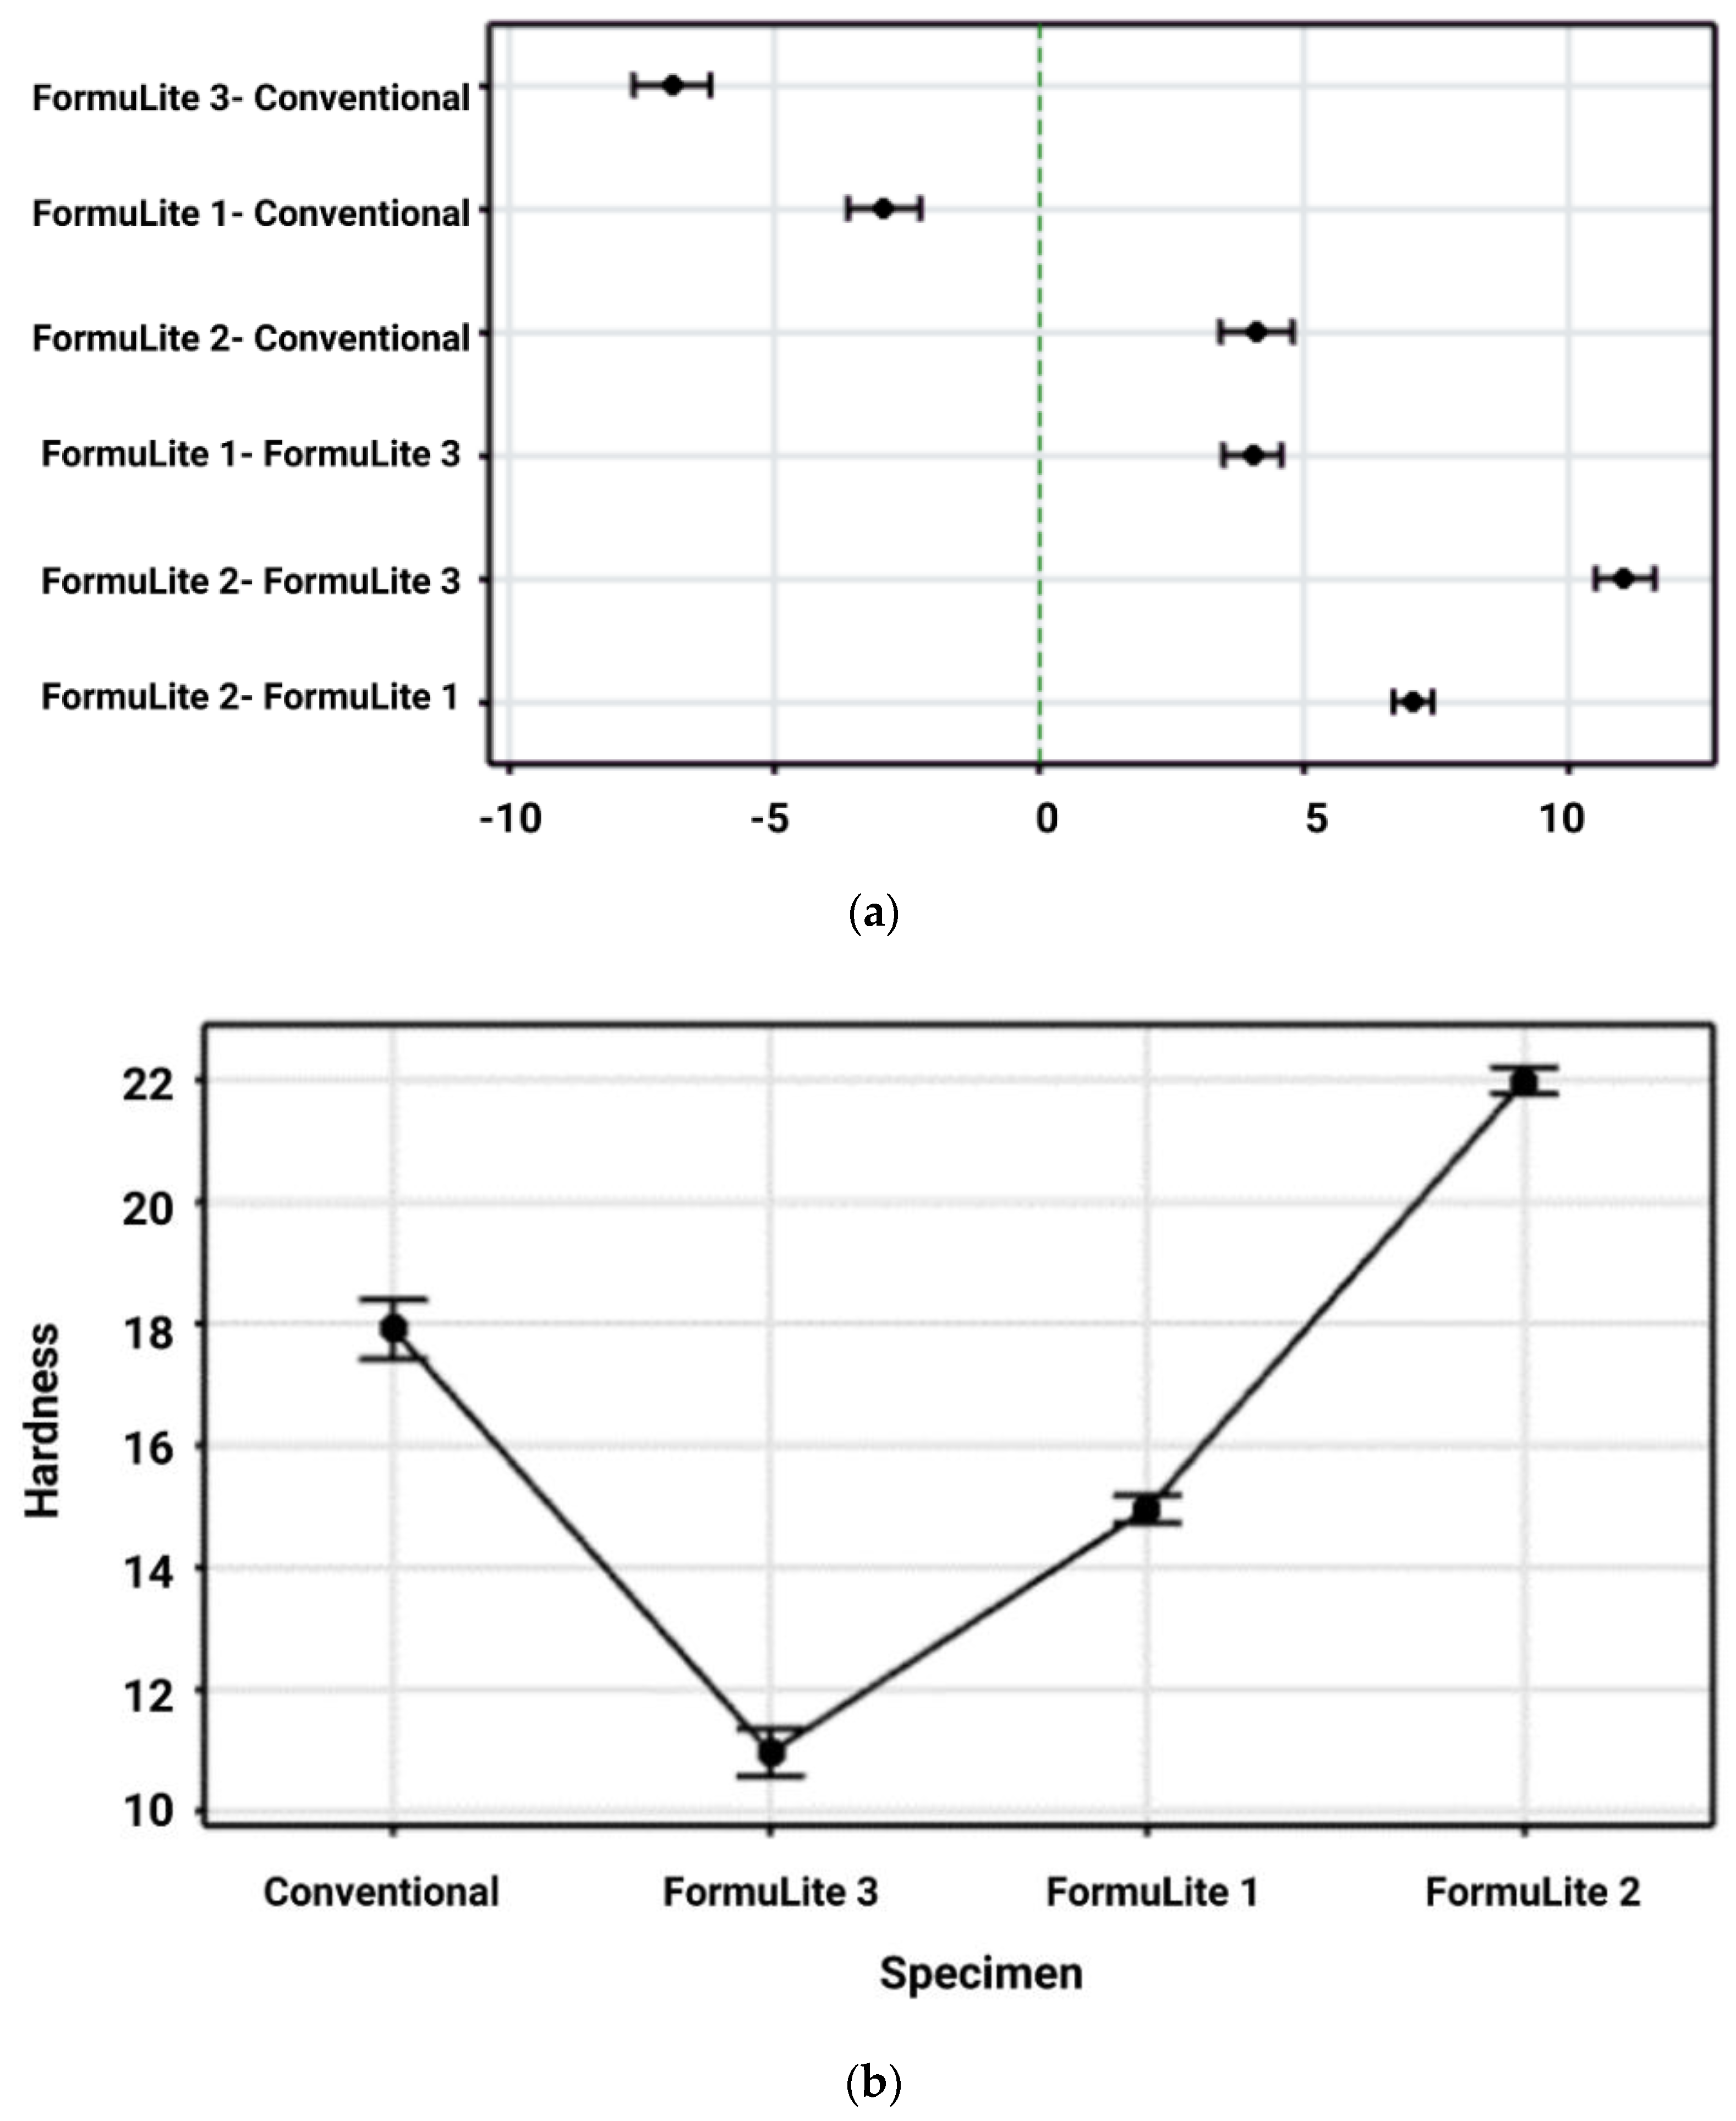
3.1. Results for Tensile Test
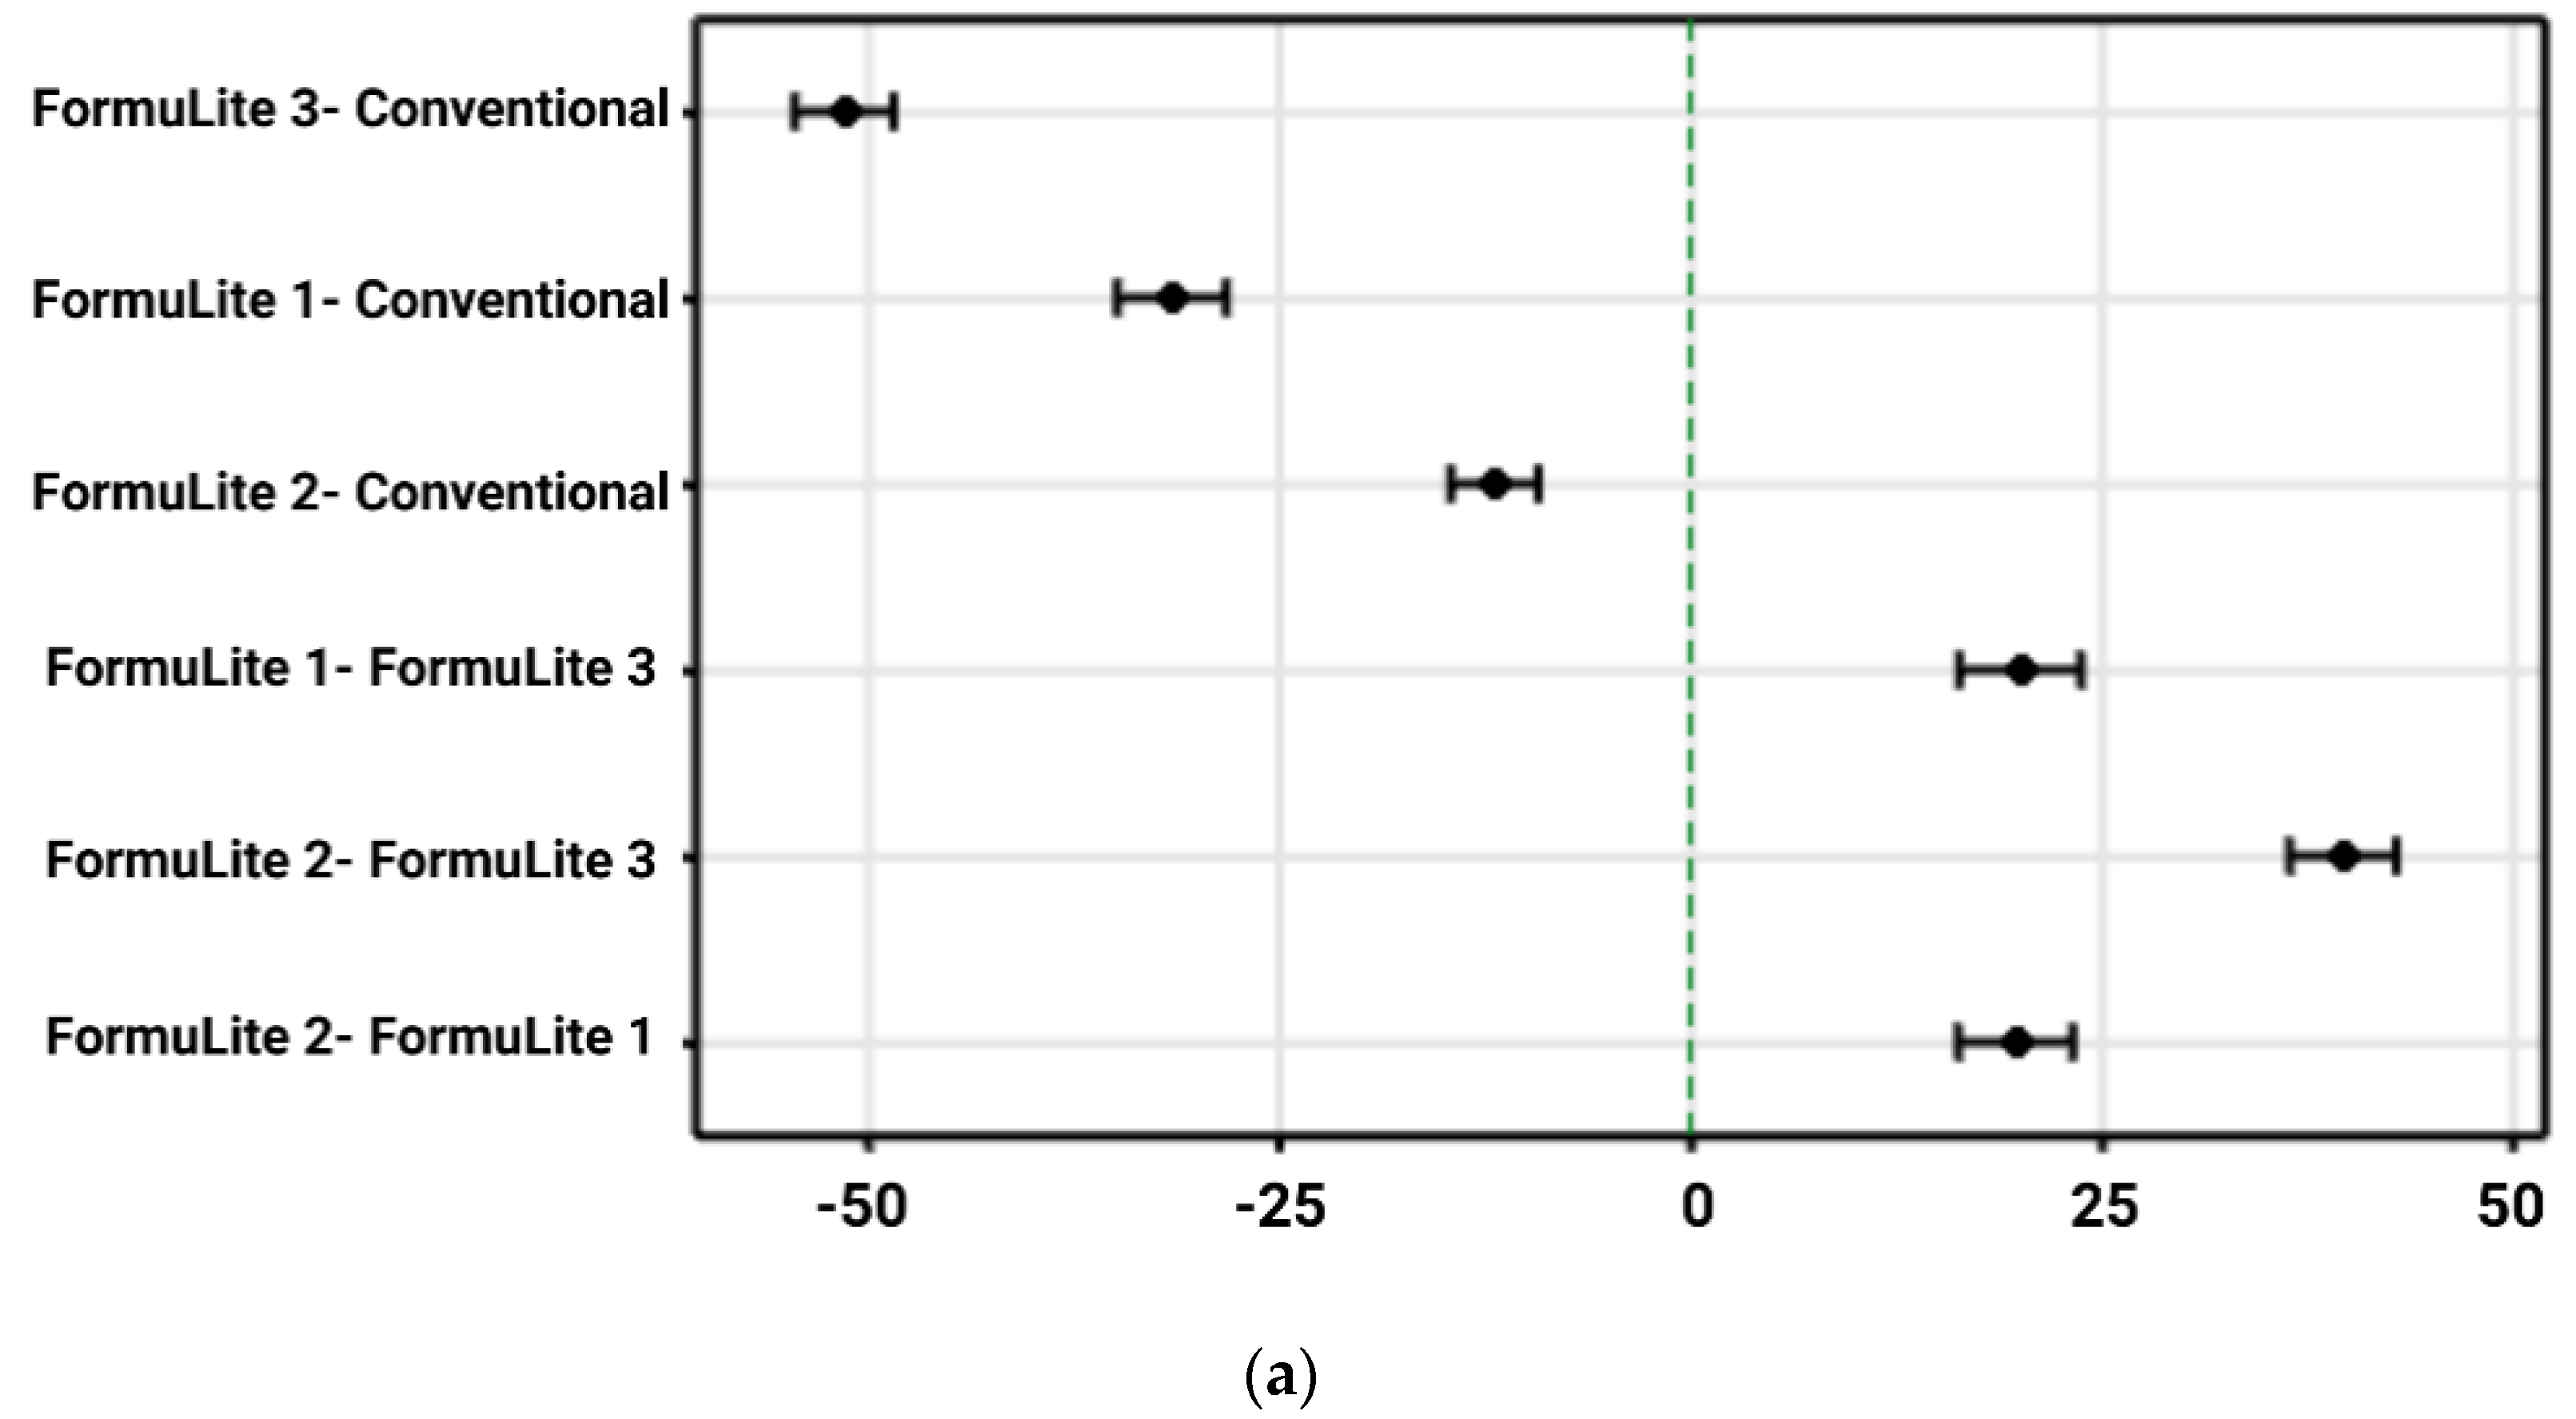
3.2. Results for Flexural Test
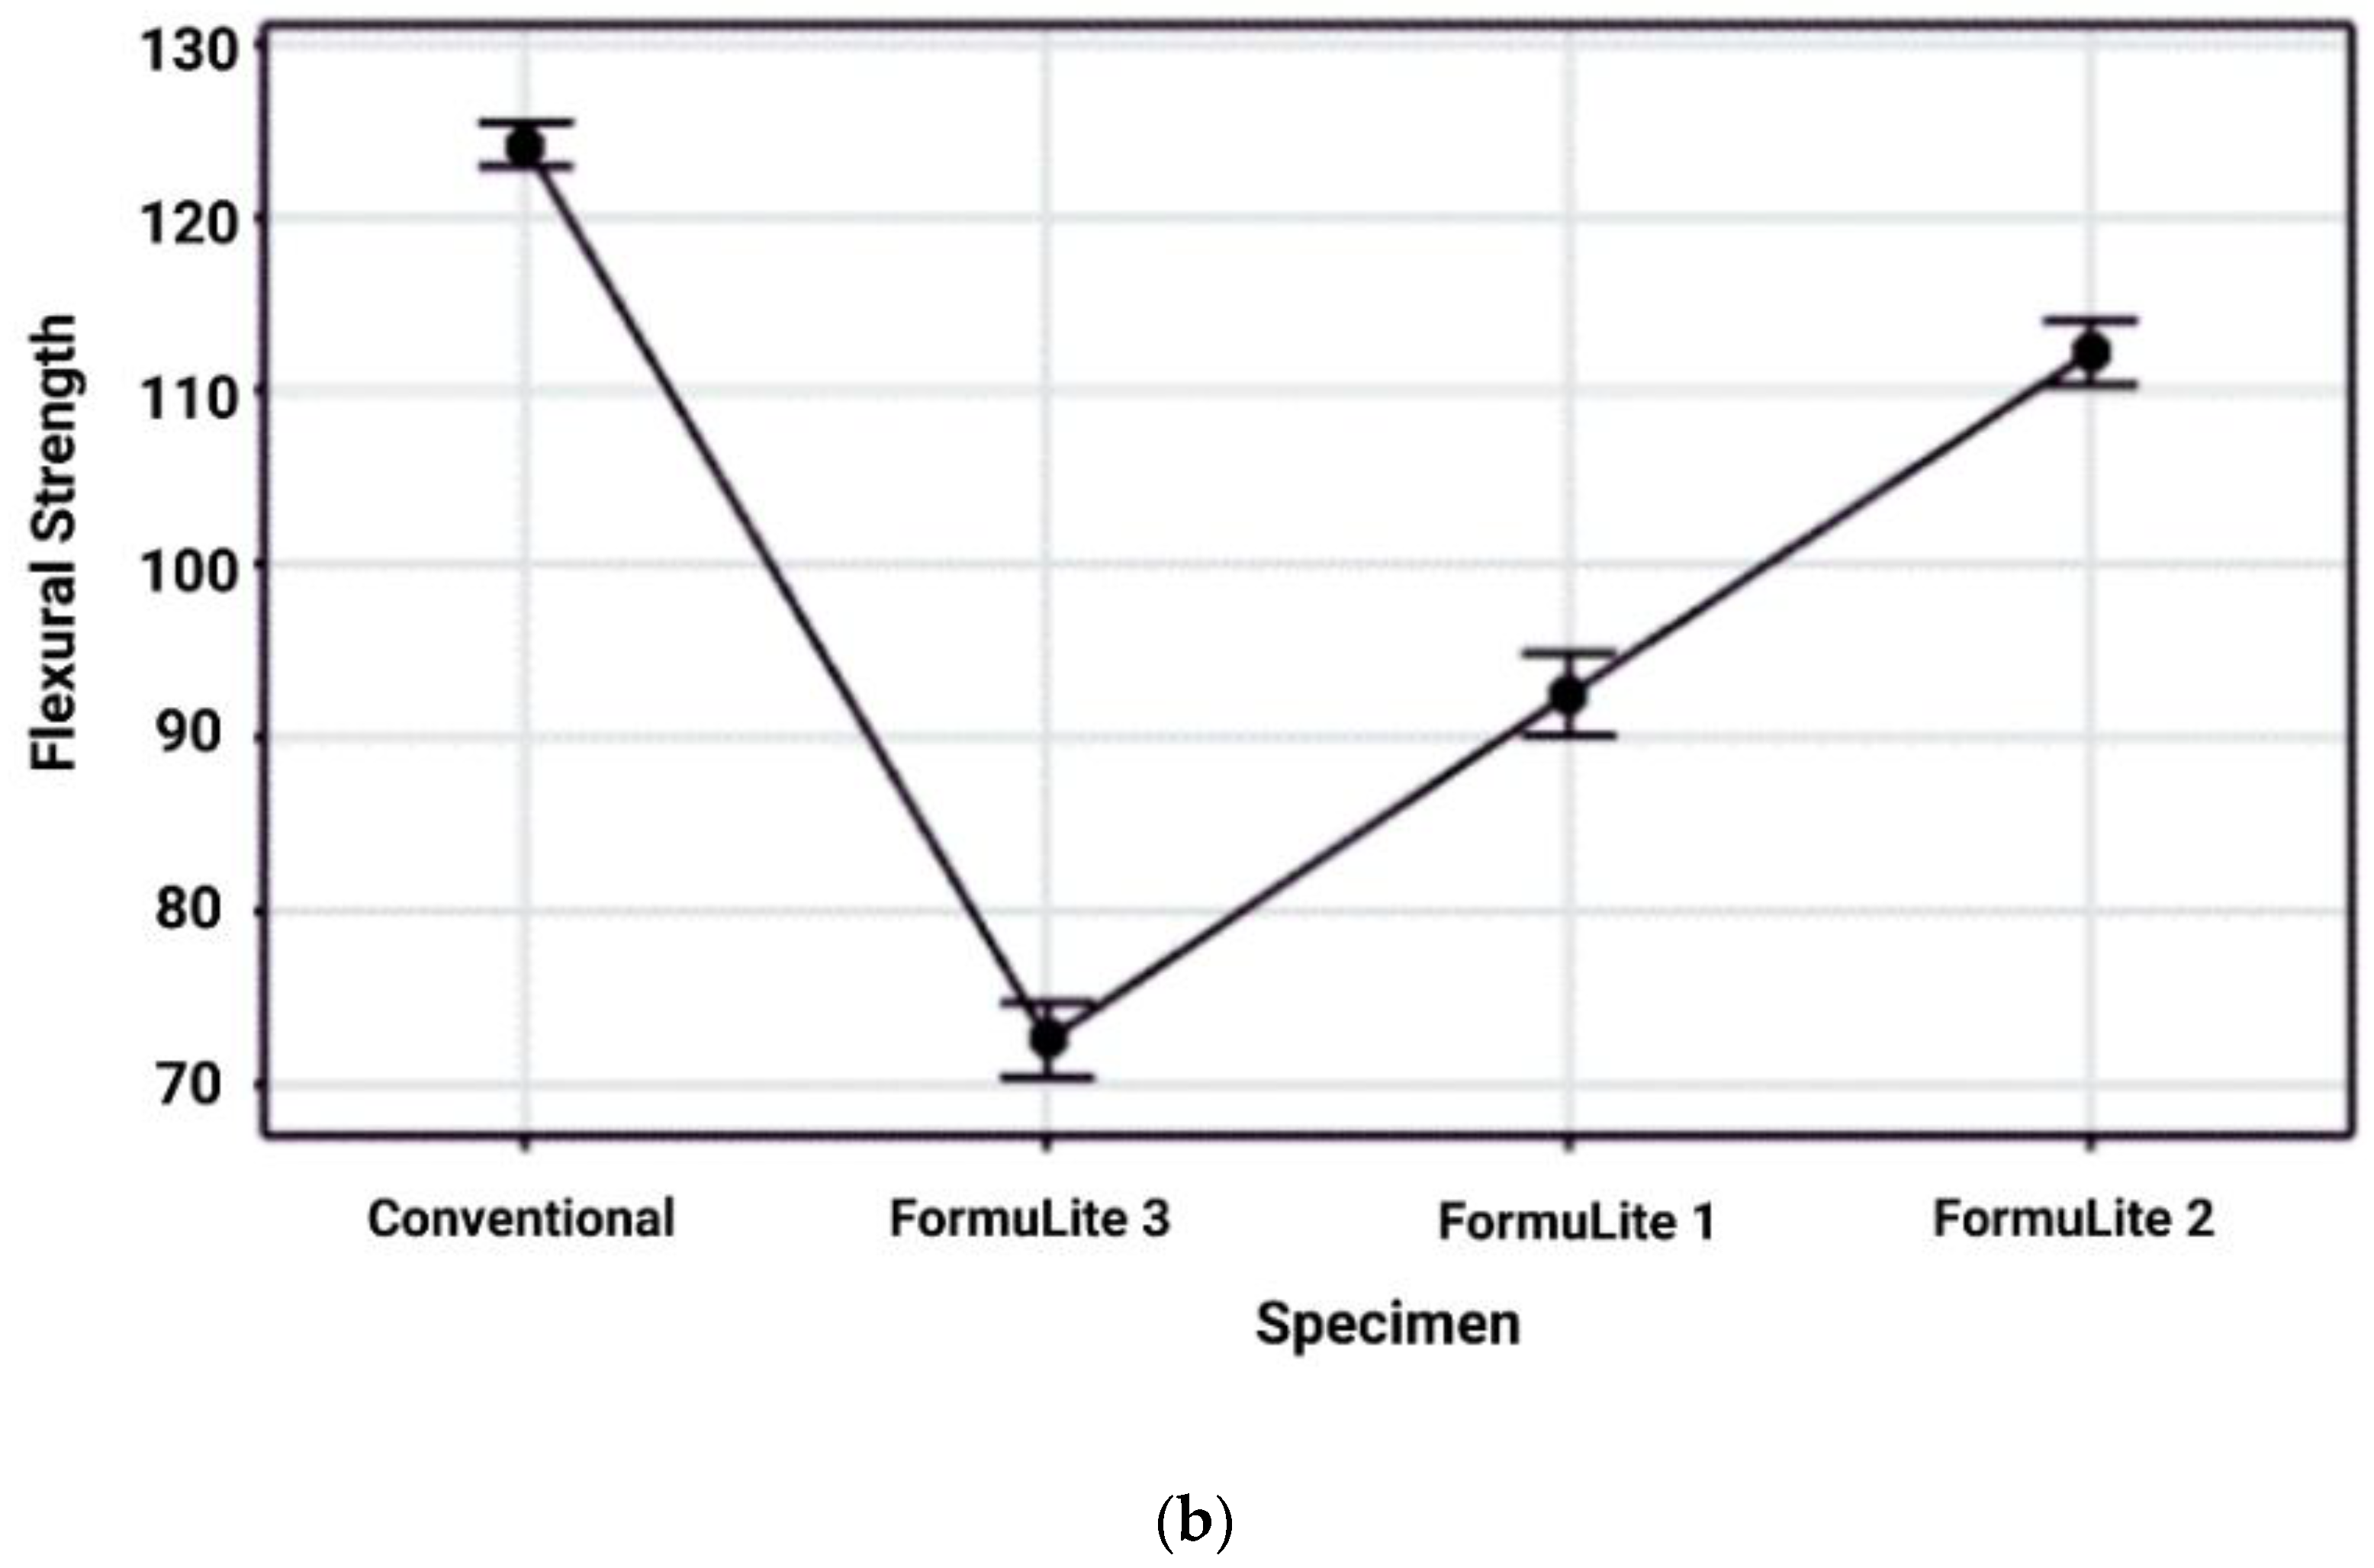
3.3. Results of Hardness Test
3.4. Results of Water Absorption Test
4. Discussion
5. Conclusions
Author Contributions
Funding
Data Availability Statement
Acknowledgments
Conflicts of Interest
References
- Afzal, A.; Nawab, Y. Polymer composites. In Composite Solutions for Ballistics; Elsevier: Amsterdam, The Netherlands, 2021; pp. 139–152. [Google Scholar]
- Greene, J.P. Polymer Composites. In Automotive Plastics and Composites; Elsevier: Amsterdam, The Netherlands, 2021; pp. 191–222. [Google Scholar]
- Abdellaoui, H.; Raji, M.; Bouhfid, R.; el kacem Qaiss, A. Investigation of the deformation behavior of epoxy-based composite materials. In Failure Analysis in Biocomposites, Fibre-Reinforced Composites and Hybrid Composites; Woodhead Publishing: Sawston, UK, 2018; pp. 29–49. [Google Scholar] [CrossRef]
- Gopalakrishna, K.; Reddy, N.; Zhao, Y. Biocomposites from biofibers and biopolymers. In Biofibers and Biopolymers for Biocomposites; Synthesis, Characterization and Properties; Springer Nature: Cham, Switzerland, 2020; pp. 91–110. [Google Scholar] [CrossRef]
- Rwahwire, S.; Tomkova, B.; Periyasamy, A.P.; Kale, B.M. Green thermoset reinforced biocomposites. In Green Composites for Automotive Applications; Woodhead Publishing: Sawston, UK, 2018; pp. 61–80. [Google Scholar] [CrossRef]
- Campaner, P.; D’Amico, D.; Longo, L.; Stifani, C.; Tarzia, A. Cardanol-based novolac resins as curing agents of epoxy resins. J. Appl. Polym. Sci. 2009, 114, 3585–3591. [Google Scholar] [CrossRef]
- Caillol, S. Cardanol: A promising building block for biobased polymers and additives. Curr. Opin. Green Sustain. Chem. 2018, 14, 26–32. [Google Scholar] [CrossRef]
- Balgude, D.; Sabnis, A.; Ghosh, S.K. Synthesis and characterization of cardanol based aqueous 2K polyurethane coatings. Eur. Polym. J. 2016, 85, 620–634. [Google Scholar] [CrossRef]
- Patil, D.M.; Phalak, G.A.; Mhaske, S.T. Enhancement of anti-corrosive performances of cardanol based amine functional benzoxazine resin by copolymerizing with epoxy resins. Prog. Org. Coat. 2017, 105, 18–28. [Google Scholar] [CrossRef]
- Wazarkar, K.; Kathalewar, M.; Sabnis, A. High performance polyurea coatings based on cardanol. Prog. Org. Coat. 2017, 106, 96–110. [Google Scholar] [CrossRef]
- Aggarwal, L.K.; Thapliyal, P.C.; Karade, S.R. Anticorrosive properties of the epoxy-cardanol resin based paints. Prog. Org. Coat. 2007, 59, 76–80. [Google Scholar] [CrossRef]
- da Rocha, J.C.; da Cunha Ponciano Gomes, J.A.; D’Elia, E. Corrosion inhibition of carbon steel in hydrochloric acid solution by fruit peel aqueous extracts. Corros. Sci. 2010, 52, 2341–2348. [Google Scholar] [CrossRef]
- Shen, G.P.; Liu, J.Z.; Wu, M.J.; Huang, Q. Synthesis and surface activity of quaternary ammonium salt surfactant prepared from cardanol. China Surf. Deterg. Cosmet. 2013, 3, 188–191. [Google Scholar]
- Lopes, A.A.S.; Carneiro, E.A.; Rios, M.A.S.; Filho, J.J.H.; Carioca, J.O.B.; Barros, G.G.; Mazzetto, S.E. Study of antioxidant property of a thiophosphorated compound derived from cashew nut shell liquid in hydrogenated naphthenics oils. Braz. J. Chem. Eng. 2008, 25, 119–127. [Google Scholar] [CrossRef] [Green Version]
- Philip, J.Y.N.; Buchweshaija, J.; Mwakalesi, A. Corrosion Inhibition of Amino Pentadecylphenols (APPs) Derived from Cashew Nut Shell Liquid on Mild Steel in Acidic Medium. Mater. Sci. Appl. 2016, 07, 396–402. [Google Scholar] [CrossRef] [Green Version]
- Lubi, M.C.; Thachil, E.T. Cashew nut shell liquid (CNSL)—A versatile monomer for polymer synthesis. Des. Monomers Polym. 2000, 3, 123–153. [Google Scholar] [CrossRef]
- Shukla, R.; Kumar, P. Self-curable epoxide resins based on cardanol for use in surface coatings. Pigment Resin Technol. 2011, 40, 311–333. [Google Scholar] [CrossRef]
- Kanehashi, S.; Yokoyama, K.; Masuda, R.; Kidesaki, T.; Nagai, K.; Miyakoshi, T. Preparation and characterization of cardanol-based epoxy resin for coating at room temperature curing. J. Appl. Polym. Sci. 2013, 130, 2468–2478. [Google Scholar] [CrossRef]
- Unnikrishnan, K.P.; Thachil, E.T. Studies on the modification of commercial epoxy resin using cardanol-based phenolic resins. J. Elastomers Plast. 2008, 40, 271–286. [Google Scholar] [CrossRef]
- Ionescu, M.; Petrović, Z.S. Phenolation of vegetable oils. J. Serbian Chem. Soc. 2011, 76, 591–606. [Google Scholar] [CrossRef]
- Darroman, E.; Durand, N.; Boutevin, B.; Caillol, S. New cardanol/sucrose epoxy blends for biobased coatings. Prog. Org. Coat. 2015, 83, 47–54. [Google Scholar] [CrossRef]
- Atta, A.M.; Al-Hodan, H.A.; Hameed, R.S.A.; Ezzat, A.O. Preparation of green cardanol-based epoxy and hardener as primer coatings for petroleum and gas steel in marine environment. Prog. Org. Coat. 2017, 111, 283–293. [Google Scholar] [CrossRef]
- Dallons, J.-L. High performance in a nutshell: Cashew-derived curing agent excels in metal and concrete primers. Eur. Coat. J. 2005, 6, 34–37. [Google Scholar]
- Anilkumar, P. Cashew nut shell liquid: A goldfield for functional materials. In Cashew Nut Shell Liquid; A Goldfield for Functional Materials; Springer: Cham, Switzerland, 2017; pp. 1–230. [Google Scholar] [CrossRef]
- Dai, Z.; Constantinescu, A.A.; Dalal, A.; Ford, C. Phenalkamine multipurpose epoxy resin curing agents. Cardolite Corp. 1994, 20, 1. [Google Scholar]
- Smith, P. Metallic Materials for Piping Components. In The Fundamentals of Piping Design; Gulf Publishing Company: Houston, TX, USA, 2007; pp. 115–136. [Google Scholar]
- Di Gianfrancesco, A. Technologies for chemical analyses, microstructural and inspection investigations. In Materials for Ultra-Supercritical and Advanced Ultra-Supercritical Power Plants; Elsevier Inc.: Amsterdam, The Netherlands, 2017; pp. 197–245. ISBN 9780081005583. [Google Scholar]
- Shatov, A.V.; Ponomarev, S.S.; Firstov, S.A. Hardness and Deformation of Hardmetals at Room Temperature. In Comprehensive Hard Materials; Elsevier Ltd.: Amsterdam, The Netherlands, 2014; Volume 1, pp. 267–299. ISBN 9780080965284. [Google Scholar]
- Papavinasam, S. Modeling—External Corrosion. In Corrosion Control in the Oil and Gas Industry; Elsevier: Amsterdam, The Netherlands, 2014; pp. 621–714. [Google Scholar]
- Xia, Y. Correlation and Association Analyses in Microbiome Study Integrating Multiomics in Health and Disease, 1st ed.; Elsevier Inc.: Amsterdam, The Netherlands, 2020; Volume 171. [Google Scholar]
- Christensen, R. Analysis of Variance and Generalized Linear Models. In International Encyclopedia of the Social & Behavioral Sciences; Elsevier: Amsterdam, The Netherlands, 2001; pp. 473–480. [Google Scholar]
- Ahmed, K.S.; Vijayarangan, S. Experimental characterization of woven jute-fabric-reinforced isothalic polyester composites. J. Appl. Polym. Sci. 2007, 104, 2650–2662. [Google Scholar] [CrossRef]
- Turner, D.T. Tensile strength elevation of brittle polymers by entanglements. Polymer 1982, 23, 626–629. [Google Scholar] [CrossRef]
- Barnard, M. Determining Epoxy’s Physical Properties. Epoxyworks. 2017. Available online: https://www.epoxyworks.com/index.php/determining-epoxys-physical-properties/ (accessed on 17 March 2022).
- Al-Maharma, A.Y.; Heider, Y.; Markert, B.; Stoffel, M. Mechanical Properties of Bioepoxy Polymers, Their Blends, and Composites. In Bio-Based Epoxy Polymers, Blends and Composites; Wiley: Hoboken, NJ, USA, 2021; pp. 215–248. [Google Scholar]
- Giesa, T.; Buehler, M.J. Nanoconfinement and the strength of biopolymers. Annu. Rev. Biophys. 2013, 42, 651–673. [Google Scholar] [CrossRef] [PubMed]


| Part A + Part B | Conventional Epoxy LY556 + HY951 | FormuLITE 1 FormuLITE 2500A + FormuLITE 2401B | FormuLITE 2 FormuLITE 2501A + FormuLITE 2401B | FormuLITE 3 FormuLITE 2501A + FormuLITE 2002B |
|---|---|---|---|---|
| Calculated bio-content (wt.%) | 0.0 | 36.60 | 34.00 | 45.40 |
| Suggested cure cycles | 24–32 h at RT 4 h at RT + 4 h at 60 °C | 4–8 h at RT 2–4 h at 50–70 °C 2–3 h at 80 °C | 4–8 h at RT 2–4 h at 50–70 °C 2–3 h at 80–100 °C | 4–8 h at RT 2–3 h at 70–80 °C |
| Viscosity 25 °C (cPs) | 10,000–12,000 | 700 | 905 | 1100 |
| Pot life (min) | 35 at 23 °C | 105 at 25 °C | 95 at 25 °C | 58 at 25 °C |
| Tested Tensile Property | Conventional Epoxy Samples | FormuLITE 1 | FormuLITE 2 | FormuLITE 3 |
|---|---|---|---|---|
| Ultimate tensile strength (MPa) | 83.63 | 61.57 | 68.32 | 51.40 |
| Strain at UTS (%) | 2.68 | 2.35 | 2.18 | 1.97 |
| Tensile modulus at UTS (GPa) | 3.12 | 2.62 | 3.13 | 2.60 |
| Tested Flexural Property | Conventional Epoxy Samples | FormuLITE 1 | FormuLITE 2 | FormuLITE 3 |
|---|---|---|---|---|
| Average flexural strength | 124.16 | 92.46 | 112.13 | 72.55 |
| Sample | Average Hardness Values of the Samples (HV) |
|---|---|
| Conventional epoxy samples | 17.91 |
| FormuLITE 1 | 14.96 |
| FormuLITE 2 | 22.00 |
| FormuLITE 3 | 10.95 |
| Sample | Mass Gained Due to 24 h Water Absorption for the Samples |
|---|---|
| Conventional epoxy samples | 0.08% |
| FormuLITE 1 | 0.22% |
| FormuLITE 2 | 0.10% |
| FormuLITE 3 | 0.28% |
Publisher’s Note: MDPI stays neutral with regard to jurisdictional claims in published maps and institutional affiliations. |
© 2022 by the authors. Licensee MDPI, Basel, Switzerland. This article is an open access article distributed under the terms and conditions of the Creative Commons Attribution (CC BY) license (https://creativecommons.org/licenses/by/4.0/).
Share and Cite
Naik, N.; Shivamurthy, B.; Thimmappa, B.H.S.; Guo, Z.; Bhat, R. Bio-Based Epoxies: Mechanical Characterization and Their Applicability in the Development of Eco-Friendly Composites. J. Compos. Sci. 2022, 6, 294. https://doi.org/10.3390/jcs6100294
Naik N, Shivamurthy B, Thimmappa BHS, Guo Z, Bhat R. Bio-Based Epoxies: Mechanical Characterization and Their Applicability in the Development of Eco-Friendly Composites. Journal of Composites Science. 2022; 6(10):294. https://doi.org/10.3390/jcs6100294
Chicago/Turabian StyleNaik, Nithesh, B. Shivamurthy, B. H. S. Thimmappa, Zhanhu Guo, and Ritesh Bhat. 2022. "Bio-Based Epoxies: Mechanical Characterization and Their Applicability in the Development of Eco-Friendly Composites" Journal of Composites Science 6, no. 10: 294. https://doi.org/10.3390/jcs6100294