Article

Impact of Fly Ash on Time-Dependent Properties of Agro-Waste Lightweight Aggregate Concrete

1
Department of Civil Engineering, Faculty of Engineering, University of Malaya, Kuala Lumpur 50603, Malaysia
2
Hume Concrete Sdn Bhd, Wisma Hume, Petaling Jaya 46100, Malaysia
3
Department of Civil Engineering, Faculty of Engineering, Arak Branch, Azad University, Arak 3836119131, Iran
4
Department of Civil Engineering, University of Victoria, Victoria, BC V8P 5C2, Canada
5
School of Mechanical Engineering, College of Engineering, University of Tehran, Tehran 1439957131, Iran
6
School of Civil Engineering, The University of Queensland, St. Lucia, QLD 4074, Australia
7
School of Civil Engineering, Faculty of Engineering, Universiti Teknologi Malaysia, Johor Bahru 81310, Malaysia
*
Author to whom correspondence should be addressed.
J. Compos. Sci. 2021, 5(6), 156; https://doi.org/10.3390/jcs5060156
Submission received: 22 May 2021 / Revised: 5 June 2021 / Accepted: 8 June 2021 / Published: 10 June 2021

Abstract

:
The utilization of by-products and waste materials to substitute for the natural or manufactured resources is considered as a practical way to obtain green building materials. In concrete mixtures, amongst the many available options, Fly Ash (FA) as a by-product pozzolan has been used as a partial replacement of cement. As for the aggregates, lightweight agro-waste oil palm shell (OPS) can be used as a replacement to conventional aggregate for the production of lightweight aggregate concrete. The present communication aims to investigate the impact of FA on time-dependent development properties of OPS lightweight aggregate concrete, including density, water absorption, compressive strength up to 120-days, and drying shrinkage up to the age of 365-days under standard moist curing, partially early curing, and non-curing conditions. Additionally, drying shrinkage crack development was investigated. In this study, two series of concrete mixtures with different substitution levels of OPS (0%, 50%, and 100%) and FA were tested. From the obtained results, it was concluded that the incorporation of fly ash in OPS concrete reduces the density and compressive strength values. Dually, the initial and final water absorption values plus the rate of drying shrinkage at early and long-term ages increased. On top of that, a high potential of drying shrinkage crack, especially for mixtures with 100% OPS, was identified.

Graphical Abstract

1. Introduction

The first use of lightweight aggregate concrete dates back to 1918 [1,2]. Since then, its applications have become increasingly frequent and have spread throughout the world. The reason why this material has been so successful is that it can attain a combination of high strengths with relatively low density. Application of lightweight concrete (LWC) provides a significant reduction in overall dead load of concrete structures, which also results in the improvement of the seismic capability of buildings [3,4]. Moreover, LWC possesses significantly better thermal insulation and fire resistance properties [5]. Other advantages of this type of concrete include reduction of propping and support for cast-in-place beams and slabs, lower haulage costs, and savings derived from the handling of precast concrete elements. Thus, LWC has opened the doorway to new and wider fields of application for reinforced, precast, and pre-stressed concrete construction.
According to the American Society for Testing and Materials (ASTM) C330 [6], concrete with a density of up to 1840 kg/m3 is considered lightweight concrete. There are different methods for the production of LWC but the common way is the utilization of lightweight aggregates (LWA), a generic name for the aggregates’ group, with a relatively lower density than normal-weight aggregates. Basically, aggregates with a bulk density of less than 1120 kg/m3 (70 lb/ft3) are considered as lightweight aggregates [7]. They can be used as a partial or whole substitution of normal-weight coarse or fine aggregates in concrete mixtures. LWA is generally categorized into 3 groups that consist of natural, artificial, and agricultural solid waste. After conducting a comprehensive literature search by authors, Table 1 represents the comparison between different types of LWA using for LWA concrete with relevant bulk density.
The construction industry that greatly impacts economic growth is known as one of the major consumers of natural resources and energy for the manufacturing of raw materials worldwide. In this context, concentration on implementing wastes and by-product materials to substitute for the existing manufactured and natural materials is becoming increasingly important to support the green product concept [11,12,13,14]. This substitution for the production of concrete could be applied for both cement and aggregate phases. In the binder phase, using by-product cementitious material including fly ash (FA) and micro silica is considered as a practical approach in reducing cement consumption; the intended result is a reduction in carbon dioxide emissions and obtaining greener products. Cement production is responsible for emissions of more than 5% of the manmade greenhouse gas in the world [15]. In addition, approximately one tonne of carbon dioxide is released in the production of each tonne of cement [16]. With regards to the estimated four billion tonnes of annual cement production by 2030 [17], a significant amount of carbon dioxide will be generated. Given the environmentally harmful attributes associated with cement manufacturing, the path of using alternative materials has two-pronged effects: it leads to recycling industrial and agricultural by-products, as well as reduced consumption of virgin natural resources.
In the aggregate phase, oil palm shell (OPS) as a common agro-waste in palm oil industry, has been utilized as a lightweight coarse aggregate in concrete mixtures [18]. Figure 1 indicates the extraction process of OPS from the palm. The approach of using OPS in concrete was introduced by Abdus Salam et al. in 1987 [19]. Since then, several experiments were conducted to investigate the mechanical and time-dependent properties of oil palm shell concrete (OPSC). Commonly, the compressive strength ranging from 13 to 22 MPa was reported by several researchers [20,21,22]. Moreover, OPSC by using granite and limestone (in the powder form), with a density ranging from 1870 to 1990 kg/m3 and 28-day compressive strength of 48 MPa, has been successfully tested [21,23]. However, having satisfactory mechanical properties does not indicate and guarantee the overall quality of the OPSC [24]. Maghfouri et al. [25] performed an experiment to investigate the optimum required OPS content in concrete concerning density, water absorption, mechanical properties, and drying shrinkage at both short-term and long-term ages. The investigation was carried out for different substitution levels of crushed granite by using OPS at 20%, 40%, 60%, 80%, and 100% (by volume). It was reported that OPS content in concrete mixtures shall be limited up to a maximum of 60% of the total volume of coarse aggregate; otherwise, a high rate of time-dependent properties such as drying shrinkage would impact the integrity and durability of such concrete.
Shrinkage, an inherent property of concrete, is classified as a time-dependent deformation reducing the volume and length of hardened concrete, resulting from the loss of moisture by evaporation. Shrinkage and other deformations induce a self-equilibrated stress field, which can lead to cracking in pre-restressed and reinforced concrete elements; as a result, they can increase the permeability of concrete. Among different types of shrinkage, drying shrinkage has a significant impact on concrete durability. The normal rate of drying shrinkage ranging from 200 to 800 microstrains has been reported [26], while the value of drying shrinkage for lightweight aggregate concrete could be 1.4–2 times higher than conventional concrete [27]. As stated in [28,29], full OPS substitution in normal-weight concrete increases the rate of shrinkage development drastically.
Apart from the aggregate phase, some types of supplementary cementitious materials like FA (as a partial cement replacement) could influence the rate of drying shrinkage. From previous studies, it has been reported that low water-to-binder ratio (w/b) concrete mixes containing FA show lower shrinkage than the control concrete mix [30,31,32]. On the other hand, an increase of drying shrinkage with the inclusion of FA has also been investigated [33,34].In summary, there is insufficient data regarding the impact of FA as a cementitious material on time-dependent properties and potential of drying shrinkage crack of OPS lightweight aggregate concrete over the short- and long-term period. Specially, there is a lack of knowledge regarding these time-dependent properties when the normal aggregate is replaced by agro-waste aggregates such as OPS. This study aims to assess the density, water absorption, compressive strength, drying shrinkage, and cracking development of a sustainable concrete containing OPS and FA as a coarse aggregate and partial cement replacement. Also, the results are compared with control mixtures (without FA), which has not been reported on previously. Besides, another innovation of the current study is evaluation of the time-dependent properties under different curing regimes.

2. Experimental Program

2.1. Materials

Ordinary Portland Cement (OPC) and FA (FA) were used as the blended binders. OPC complying ASTM C 150 [35] with Blaine surface area of 3710 cm2/g and a specific gravity of 3.15 g/cm3 was utilized. Commercially available low-calcium FA (class F) obtained from the Jimah Power Plant that is located in Negeri Sembilan, Malaysia was used as a secondary cementitious material conforming to the requirements of ASTM C618 [36] with the specific gravity and Blaine surface area of 2.18 g/cm3 and 4125 cm2/g, respectively. Table 2 represents the chemical compounds of cementitious materials.
Assuring proper dispersion of cement particles in the concrete mixture, the Polycarboxylate-based superplasticizer (SP) according to ASTM C494 [37] was used. In addition, potable water—because its chemical composition is known and well regulated—was utilized for the mixing and curing process of all concrete specimens.
For fine aggregate, mining sand with a maximum size of 4.75 mm and the fineness modulus of 2.89 was provided from local resources. Two types of locally available aggregate consisting of clean natural 12.5 mm granite and OPS—as replacement of granite by volume—were used in the present study. Figure 2 represents the particle size distribution of mining sand, OPS, and granite. Table 3 represents the mechanical and physical properties of the aggregates. To provide better bonding between the OPS aggregate and the cementitious materials, the fiber of the shell was removed after storing it in an open area for about 7 months. Figure 3 shows the difference between OPS with and without fibers.
In addition, OPS aggregate was washed by using detergent powder for possible surface oil and other impurities, followed by saturated surface dry condition before mixing of raw materials. Figure 4 shows the materials used in the current study.

2.2. Testing Method and Mix Proportions

To investigate the impact of FA on time-dependent properties of agro-waste OPSC, two series of concrete mixtures were prepared using crushed granite and OPS aggregate. Each series included three mixtures: the A-series represents the mixtures with cement as a binder, while in B-series the FA with a dosage of 20% by mass of total cementitious material was used throughout the experiment. Basically, impact assessment of the FA on mechanical properties and time-dependent properties of concrete can lead to regulation of the optimum level of FA. The recommended substitution percentage of class F fly ash, based on ACI 211.1–91 [38] ranges from 15% to 25% of the total binder. Therefore, 20% FA was considered as an average of the recommended range by ACI 211.1–91, and moderate classification level of FA in concrete mixtures (15–30%) recommended by Thomas [39]. In both series, the normal-weight concrete (A1 & B1 mixes) was considered as the control mix. Other mixes were designed by using pre-soaked (24-hr) OPS aggregates at an interval of 50% as a replacement for the normal-weight aggregate. Mixed proportions of concrete mixtures are given in Table 4. All raw materials were mixed by means of a rotating drum mixer in the laboratory according to the mix of designs presented in Table 4. In the first step, raw materials were dry-mixed for 2-min. Then a mixture of SP and 70% of water was added for 3-min of mixing. The water remainder was poured into the mixer for another 5-min of mixing. After completion of the mixing process, the fresh properties of concrete were measured according to ASTM C143 [40]. Slump value for all mixes is shown in Table 4.
After successful preparation of a homogenous concrete, molding of 100 mm cubes for the compression test, density test, water absorption test, and 100 × 100 × 300 mm prisms for drying shrinkage strain was carried out. The concrete samples were kept in the laboratory environment and demolded after 24-h. The next step was to measure the demolded density of the specimens complying with ASTM C642 [41]. Furthermore, the oven-dry density was recorded after a 28-day water curing of the cubes oven—a temperature of 105 ± 5 °C was employed for the drying process.
A water absorption test was performed in accordance with ASTM C642 [41] to determine the amount of water that could be absorbed by 100 mm cubes. For each mix proportion, the average of three cubes determined the water absorption value. After 28 days of moist curing, specimens were dried in an electric oven at 105 ± 5 °C for 24 h to achieve constant mass, then were allowed to be cooled to room temperature for 24 h. This was followed by recording the oven-dry mass of the cubes. In order to conduct initial and final water absorption tests, the dried cubes were immersed in water with a temperature of 22 ± 2 °C for 30-min and 72-hr. By reaching the required timing, concrete cubes were removed from the water tank, then the sample’s weight was measured under saturated-surface-dry condition, and the change in the mass was recorded. This test was similar to the test which was carried out by Razak et al. [42], Teo et al. [43], and Maghfouri et al. [24,25].
A compression test of the 100 mm cubes was conducted at the age of 1, 3, 7, 28, 56, 90, and 120 days. The 3000 kN hydraulic compression testing machine with the rate of loading by 3 kN/s was used for the test—the machine was equipped with a rate of the loading controller, according to the British Standard (BS) 1881. For each mix proportion and particular age, the average of three cubes determined the crushing strength of concrete.
For each mix proportion, two concrete prisms were prepared to determine the drying shrinkage value. To conduct the test of drying shrinkage in accordance with ASTM C157 [44], the pre-drilled stainless-steel discs (DEMEC points) were bonded with adhesive on three sides of the concrete prisms with a spacing of 200 mm. The value of drying shrinkage for each mix was recorded at short- and long-term ages up to 360-days. Figure 5 shows different steps of concrete prisms preparation and drying shrinkage measurement.
To evaluate the impact of the curing regime on compressive strength and time-dependent properties, three different curing conditions were applied for the cubes and prisms. A brief description of each curing condition is stated as follows:
7D (7 Days water curing)—the prisms were cured in water with an average temperature of 22 ± 2 °C for 7 days;
WC (Water Curing): the cubes and prisms were immersed in water at 22 ± 2 °C until the age of testing i.e., 28, 56, 90, and 120 days;
AC (Air Curing): the prism was kept in the laboratory environment with a relative humidity of 65 ± 10 °C and an average temperature of 22 ± 5 °C until the age of testing.

3. Results and Discussion

3.1. Density

The compacted bulk density of OPS aggregate is about 40% lower than the conventional aggregate [25]; thus, partial replacement of the aggregate with OPS considerably reduces the density of the concrete. As presented in Figure 6, an upward trend can be observed on demolded and dry densities of the specimens under the influence of OPS addition. In other words, the density of mixes containing 50% and 100% OPS aggregates (A2 and A3) is almost 12.1% and 18.8% lower than the concrete mix made with normal-weight aggregate (A1), respectively. Based on previous studies [40,45], it has been pointed out that the substitution of cement with supplementary cementitious materials causes a reduction in the density of concrete—this is due to the lower density of substituted materials such as FA and silica fume as compared to the density of ordinary Portland cement. Past investigations also confirmed that incorporation of FA results in a lower density of concrete [46,47]. Aslam et al. [18] claimed that by incorporating 10% and 15% FA as cement replacement in OPSC, the concrete density reduces by 2% and 3%, respectively. This investigation also showed that the reduction percentages in normal-weight concrete with the same mix proportions were 1% and 2%, respectively. In the present study, the obtained results showed that using FA (20% binder weight) as well as fully substitution of crushed granite by OPS in conventional concrete remarkably decreases the concrete density from 2340 to 1753 kg/m3 and 2400 to 1909 kg/m3 for dry and demolded density, respectively. In addition, from comparison between mixes in A and B series, it was observed that incorporating 20% FA (mixes in series B) can slightly reduce the density of concrete by about 3%, 0.2%, and 7.7% for A1, A2, and A3 mixes, respectively.

3.2. Water Absorption

The initial (30 min) and final (72 h) water absorption tests for the mixes in series A and B were carried out at the age of 28 days. The presented results in Figure 7 clearly show that concretes in series A absorbed a lower amount of water in comparison with corresponding mixes containing 20% FA in series B. The higher rate of water absorption in series B is associated with more total voids in the concrete mixtures due to the incorporation of FA that is porous in nature, particularly at early ages where a substantial amount of ashes have not participated in pozzolanic reactions. Similar results also were reported by various researchers that fly ash increases the water absorption of concrete [48,49]. It was reported by Ting et al. [50] that increasing the substitution of fly ash in OPS lightweight self-compacting concrete leads to formation of capillary pores, resulting in a permeable concrete with a high level of water absorption. In addition, it was noticed that by increasing OPS volume in both series, initial and final water absorption were increased in parallel; this substantial increase can be highlighted by comparing the water absorption value in each series of mixes.
In series A, initial water absorption was increased by 127% and 262%, respectively, for A2 and A3 mixes—with A1 considered as a control mix—containing 50% and 100% OPS, respectively; the trend was followed by series B by 70% and 231% increases for B2 and B3 mixes, respectively—with B1 considered as a control mix. Similarly, an increase in final water absorption value was recorded as 103% and 191%, respectively, for A2 and A3 mixes, and 45% and 208%, respectively, for B2 and B3 mixes. The discussed results confirmed that the combination of cement with FA generally increases the rate of water absorption for OPS concretes. It should be emphasized that the high rate of initial and final water absorption particularly for the B3 mix can be attributed to a high volume of OPS as well as FA in the mixture. Previous researchers have stated that the substitution of cement with FA up to 30% increased water absorption by almost 5% [51]. Shafigh et al. [52] also highlighted that using 30% and 50% FA as a partial cement replacement in OPSC resulted in higher water absorption than those mixes without FA by almost 27% and 60%, respectively. This is mainly because of the increase in the volume of the cement matrix and as a result of the capillary pore. Kurda et al. [48] reported that the total porosity of the concrete containing FA could be increased. However, it reduces the overall pore size in cement matrix.
In regard to initial water absorption test results, the quality of concrete is categorized by CEB-FIP [53] as poor, average, and good for the values of 5% and above, 3–5% and 0–3%, respectively. The obtained results show that, except for a B3 mix with 8.11% initial water absorption, all other mixes can be classified as good guilty concrete due to their values being lower than 5%. It has been also reported that concrete with good quality has no more than 5% of water absorption [54].

3.3. Compressive Strength

3.3.1. Compressive Strength under Standard Moist Curing

The percentage development of compressive strength for concrete mixes at the age of 1, 3, 7, 28, 56, 90, and 120 days are shown in Table 5. It shows that the growth of compressive strength during long-term ages was lower in comparison with early-ages. As can be observed in Figure 8, the compressive strength of all concrete mixes was increased with age. However, the values for concretes in series B are lower than those for series A in all ages. This remarkable reduction is attributed to the inclusion of FA in series B concrete mixtures. As can be observed in Figure 8, there are slight changes in the trend of compressive strength, which could be associated with the higher rate of water absorption. Previous studies have indicated that there is a correlation between water absorption and compressive strength. It has been reported that longer water curing results in increased absorption due to the nature of porous aggregates in concrete mixtures. It could have a minor impact on compressive strength during testing. Therefore, a slight variability in compressive strength results is believed to be affected by the water absorption [55,56].
Furthermore, the rates and ranges of compressive strength reduction in series B mixes are relatively higher than those in the A group, varying in the range of 36–49% for B2 and 48–68% for B3, in comparison with A2 and A3 which are 21–32% and 40–52%, respectively, from the age of 1 day to 120 days. However, as the age of concrete increases, growth in strength is naturally inevitable for both A and B groups, even though a minor decrease has been detected for A3 and B3 at 120-days. A previous study reported that increasing FA and OPS contents reduces the compressive strength under moist curing [52], which is in a good agreement with the present study. Zawawi et al. [47] investigated the mechanical properties of OPSC containing FA as partial sand replacement. They reported that incorporation of FA of more than 10% resulted in a stiff mixture with low workability and difficulties for compaction, which caused a remarkable reduction in compressive strength.
The Field Emission Scanning Electron Microscope Test (FESEM) was applied to show the condition of the calcium-silicate-hydrate (C-S-H) and interfacial transition zone (ITZ) for the control mix containing 20% FA. It can be clearly observed from Figure 9 that a weak ITZ (shown in points A and B) and un-hydrated FA with a particle size of 5 μm have been formed in some areas, which leads to a weaker bonding between the sand/aggregate and C-S-H, and eventually to a reduction in compressive strength.

3.3.2. Compressive Strength under Partially Early Curing

The compressive strength development for all concrete mixtures at 28-day under air, 7-day water, and continuous moist curing (28 D) is presented in Table 6. The table shows that the compressive strength of all mixes was increased under continuous moist curing. The obtained results confirmed that when the percentage of OPS incorporation increases, the compressive strength of the mixes without FA reduces. Under continuous moist curing conditions, through the replacement of 50% and 100% of OPS aggregates, a reduction in compressive strength at 28-day was recorded by almost 30% and 50%, respectively. According to Basri’s experiments [45], the compressive strength of OPSC at the age of 28-day decreased in comparison with normal-weight concrete by about 42–55%—which depended on the curing conditions. It has been reported that the reduction in mechanical properties of OPSC is mainly affected by the smooth surface texture of the OPS aggregates, which resulted in a weaker ITZ [18,57,58]. Mannan et al. [57] also pointed out that the reason behind the compressive strength reduction is because of the easy failure of bonding between the cement matrix and the shells. Furthermore, excessive use of FA would decrease concrete strength due to the dilution effect of FA that reduces the effective C3S and C2S in cement, hence the strength development will depend on pozzolanic activity of FA [59]. The pozzolanic reaction of FA only begins when calcium hydroxide (CH) is released from the cement hydration process. This hinders the early strength gain of concrete with FA [60]. The reduction in compressive strength could be due to the absence of moisture during the curing period, which inhibits the pozzolanic reaction by FA. This lowers the amount of binding gel produced as compared to the control specimen, which solely depends on the hydration process for increased compressive strength [61]. Similarly, incorporation of FA negatively affects the compressive strength value; the OPS concrete without FA has a higher 28-day compressive strength than those containing FA under various curing conditions.
Curing is a highly important practice in order to the maintain temperature and moisture content in various types of concrete during their early-ages or even long-term ages, ensuring that the desired properties develop appropriately [62]. Up to 7 days of moist curing was proposed for curing of the mixtures made with additive materials like FA or silica fume, to provide enough moisture for pozzolanic reaction and calcium-silicate-hydrate formation [8]. Table 6 also presents the impact of different curing regimes on 28-day compressive strength for all concrete mixtures. Based on the obtained data, it can be clearly observed that by using air curing (AC), the 28-day compressive strength cannot be substantially enhanced compared to 7-day and 28-day water curing. Moreover, the reduction rate of compressive strength is greater in the OPS concrete containing FA.
Under an air curing condition, the compressive strength of OPSC containing FA (B2 and B3 mixes) was lower than that of those cured under 7-day and 28-day water-soaked conditions. Mixes in series B showed almost 10% lower compressive strength in an air drying curing condition in comparison with mixes in series A (Table 6). The 28-day compressive strength of 32.40 MPa was recorded for a B3 mix, which is lower than B2 and B1 mixes by approximately 13 and 29 MPa under a 7-day water curing condition, respectively. Similarly, OPS lightweight concretes made with FA had lower compressive strength, in the range of 10% to 18%, than the concretes produced without FA under an AC condition. This means that the compressive strength of concrete containing OPS and FA is highly sensitive to a lack of curing. The figure also shows that there is a significant difference between the values of 28-day compressive strength for all concrete mixes (both series) under a 28-day water curing condition (WC). The A2 and A3 mixes showed almost a 30% and 23% reduction in compressive strength in comparison with A1. Incorporation of FA by 20% reduces the compressive strength of B1, B2, and B3 remarkably by 19%, 11%, and 16%, respectively.
Previous studies have reported that a lower amount of compressive strength in FA concrete is due to a slower hydration rate, which resulted from lack of adequate curing [63,64,65]. Other investigations also proposed that a proper curing method and adequate curing period should be selected and provided for concretes containing supplementary cementitious materials, as such concretes are sensitive in curing [66,67]. To overcome the aforementioned sensitivity in the event of using supplementary cementitious materials, providing adequate moisture through proper curing and casting under relatively high humidity is suggested.

3.4. Drying Shrinkage Development

The differential relative humidity between concrete and the environment leads to drying shrinkage in concrete. As the tensile strength of concrete is low, the shrinkage strain could be detrimental and induces cracking when the concrete is restrained. It may also cause a debonding at the steel-concrete interface, similar to debonding at the aggregates-cement paste interface [68]. However, drying shrinkage is not considered as a critical factor when concrete is being used for infill or insulation purpose [54]. In the following sections, the impact of partial and full substitution of granite with OPS as well as FA under different curing conditions are investigated.

3.4.1. Drying Shrinkage Development under the Standard Moist Curing

The sufficient duration of curing has a significant impact on the reduction and control of initial shrinkage in various types of concretes. As summarized in Table 7, dying shrinkage increases by increasing FA and OPS percentage under 28-day continuous water curing. In Figure 10a–c, three main variables (OPS, FA and age) were used to analyze their simultaneous impacts on drying shrinkage. In order to have a better comparison and understanding on the impact of three parameters namely OPS aggregate, FA, and age, on drying shrinkage strain, one parameter was considered as a constant at the maximum level and the other two were variables (Figure 10, Figure 11 and Figure 12).
Figure 10a shows that the maximum long-term—at the age of 365—drying shrinkage value was recorded for B3 mix by 1109 microstrain (µε) which confirms the impact of OPS and FA on the maximizing of drying shrinkage. The influence of the age and maturity of concrete on drying shrinkage at various OPS percentages can also be observed in Figure 10b. An upward trend is shown in Figure 10c for drying the shrinkage value by considering 20% of FA and a variable OPS percentage. Increasing the percentage of FA slightly increases the amount of drying shrinkage at different percentages of OPS. In general, it was concluded that the drying shrinkage is low when concrete was made with normal-weight aggregate and without FA. According to results obtained by Maghfouri et al. [27], there is a direct correlation between compressive strength and rate of drying shrinkage. A higher compressive strength correlates with a lower drying shrinkage. This was also confirmed by the results generated from shrinkage prediction models i.e., SAK, GL2000, EN1992, and ACI209R in which compressive strength factor is one of the main parameters during the prediction process.

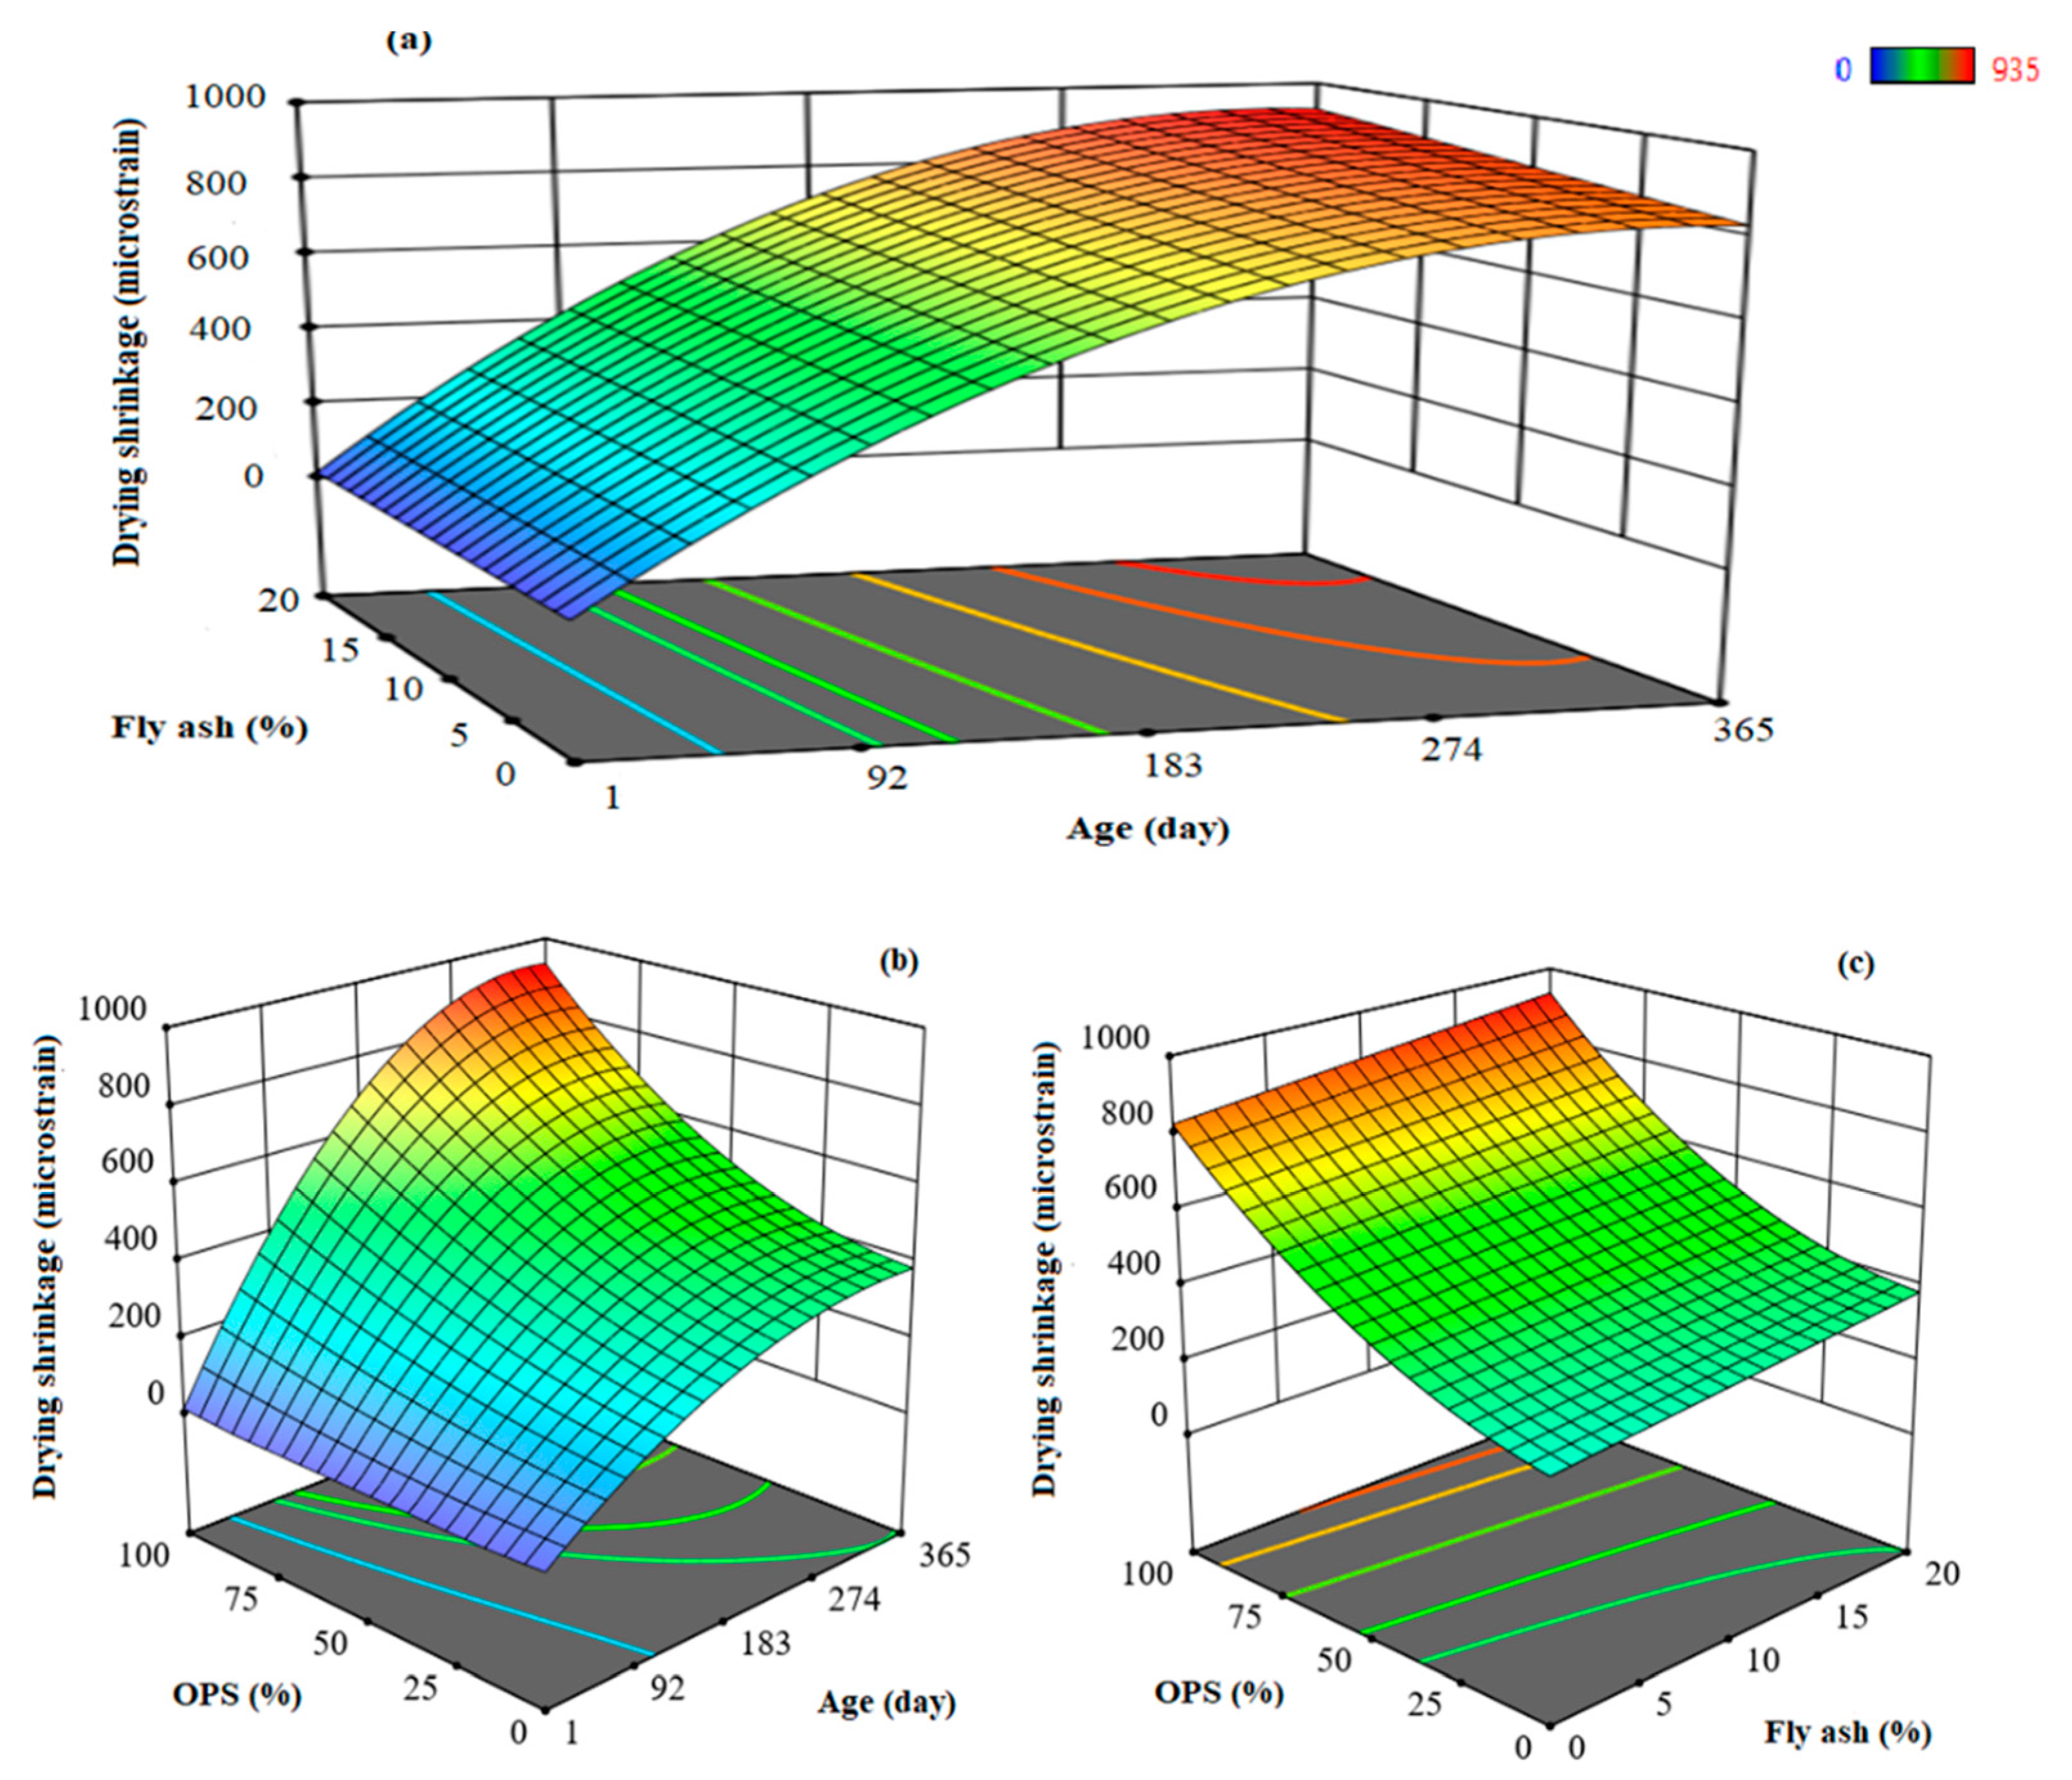
3.4.2. Drying Shrinkage Development under Partially Early Curing

In order to monitor the drying shrinkage process under partially curing, 7 days’ water curing was applied for the concrete samples. Table 8 indicates the relationship between the drying shrinkage value of the 7-day moist-cured samples at early and long-term ages. It was seen that at 7 days’ water curing, the A and B series mixes experienced an increased rate in drying shrinkage during 365 days. Amongst all mixes, B3 showed the highest drying shrinkage strain at early and long-term ages, which was mainly due to high volumes of OPS aggregates and FA.
Three main variables, including OPS, age, and FA were applied to study their impacts on drying shrinkage amounts of concrete mixes under 7 days’ continuous water curing. To consider the interaction of three variables, 3-D plots were proposed as useful tools to accurately analyze the relationship between the above-mentioned parameters and relevant responses.
Figure 11a was plotted by drying shrinkage (z-axis) against two independent factors—percentage of FA and age of the samples—and another independent variable (OPS%) was assumed to be constant at 100%. A three-dimensional response surface diagram (Figure 11a) was developed for drying shrinkage of OPS concretes by varying FA percentages between 0% to 20% and specimen ages between 1 and 365-days. At fixed OPS (100%), the drying shrinkage experienced an exponential increase, rising from 0 to almost 931 µε.
Figure 11b indicates the simultaneous effects of OPS and age parameters on the drying shrinkage of OPSC containing FA at 20%. It can be highlighted that the maximum drying shrinkage strain under 7-days of water curing can occur when OPS and age are at the highest level—100% and 365 days, respectively. Furthermore, the same tendency has been presented in Figure 11c when the OPS and FA figures increase up to 100% and 20% at the age of 365-days [69].

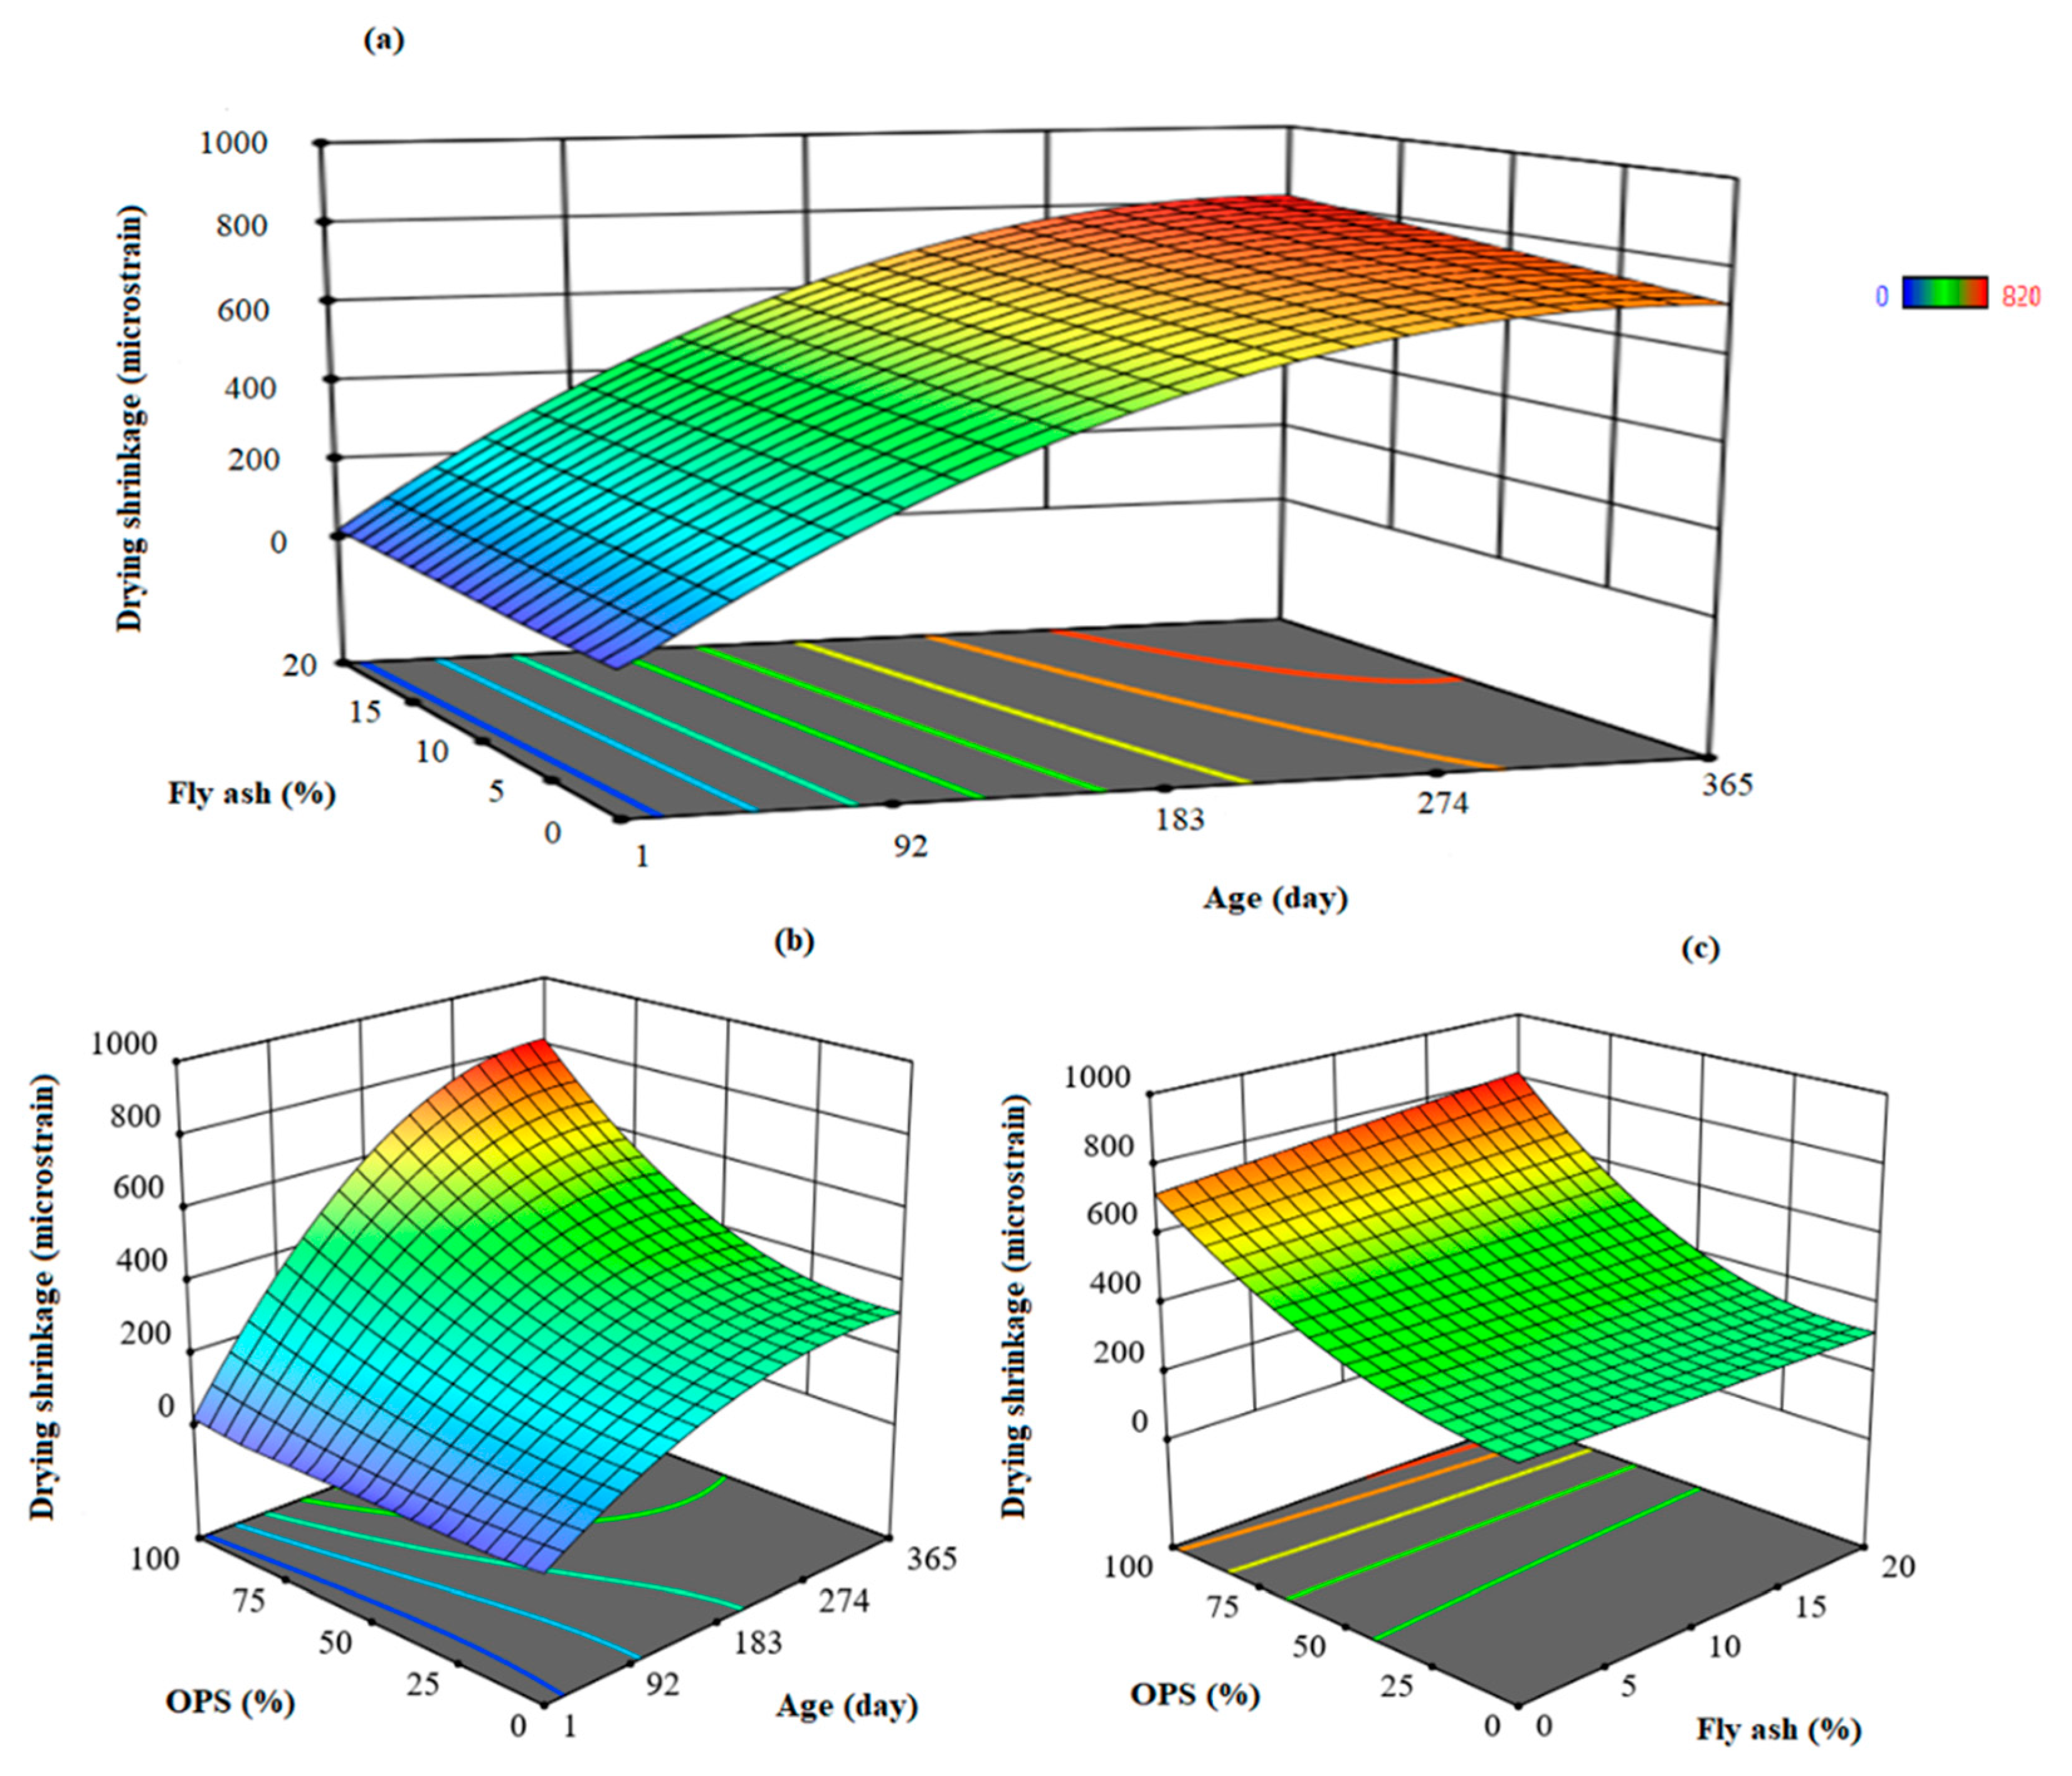
3.4.3. Drying Shrinkage Development under a Non-Curing Condition

Table 9 compares the drying shrinkage values of all concrete mixtures under a non-curing condition. From the obtained results in this study, it can be stated that concretes containing FA have a higher drying shrinkage than concretes without FA during a period of 365 days. Overall, the B3 mix had the highest drying shrinkage result under an air curing condition in comparison with other samples, which accounted for 820 µε.
The interactions between various parameters are shown by 3D-surface plots in Figure 12a–c. These plots provide more information on the interaction between impactful parameters affecting the drying shrinkage of the specimens cured under air conditions. According to 3D-plots, FA, age, and OPS have a direct impact on the drying shrinkage. Figure 12a describes the effect of the FA and age factor on drying shrinkage at an OPS 100%. Drying shrinkage increased slightly with increasing of FA at various ages, ranging from 70 to 500 µε.
Figure 12b illustrates the effect of OPS and the age of the specimen on drying shrinkage. The obtained results present the drying shrinkage of the lightweight concrete enhanced by almost 820 µε with the increase of the age and OPS contents (from 1 to 365 days and 0 to 100%) at the FA amount of 20% for all mixtures. Also, it can be observed that the drying shrinkage declined exponentially after the levels of age and OPS reached 1 day and 0%, respectively.
Figure 12c illustrates the three-dimensional surface diagram for drying shrinkage versus the variables of FA and OPS percentages replaced with cement and aggregates, respectively, under the age of 365-days. The results demonstrate that the drying shrinkage increased almost linearly to approximately 820 µε with the increasing shares of FA and OPS, reaching 20% and 100%, respectively. However, the 3D surface (drying shrinkage) decreased gradually and had its lowest value at minimum FA and OPS contents (0%). The surface plots in Figure 10a–c, Figure 11a–c and Figure 12a–c show that OPS and age variables tended to influence the drying shrinkage more markedly than the FA factor, which was also confirmed previous studies [70].
Comparison between Table 7, Table 8 and Table 9 indicates that the results of drying shrinkage under the non-curing condition (AC) were lower than 7D and WC. At early-ages, the shrinkage value of the specimens under AC was higher compared to the 7D and WC, which could be related to higher moisture loss. However, when the concrete matures about 28 days, the specimens have lost most of the moisture, thus there would be no additional charges in the cement matrix that contributed to the shrinkage. This finding somehow relates to the strength gain, where air-cured specimens has lower strength compared to the specimens under 7D or WC. It is known that higher strength is often attributed to higher drying shrinkage. Meanwhile, the moisture of aggregates could be considered as a reason for the higher drying shrinkage of concrete mixtures in this study. It has been revealed by Al-attar [57] that using the dry aggregate results in lower drying shrinkage compared to the saturated aggregates. This concept also can be considered to justify the higher rate of shrinkage for the concrete samples exposed to the water curing compared to the AC.
Table 10 summarizes drying shrinkage values of various OPS lightweight concretes containing different amounts of FA. According to the obtained results from previous studies and the current work, FA volume, OPS percentage, and curing conditions are considered as effective parameters on the drying shrinkage strain of concrete. It can be concluded that increasing the percentage of FA from 10% to 50% slightly increased the drying shrinkage at a certain quantity of OPS (25%). However, when the rate of OPS and FA increased to 65% and 70%, respectively, the drying shrinkage measurements rose exponentially. In the present study, the results showed that at a certain level of FA (20%), the drying shrinkage value was enhanced by the increment of OPS percentages from 50% to 100%.

3.5. Drying Shrinkage Crack Development

In essence, the drying process in structure of concrete which occurs in a non-homogeneous manner leads to the formation of micro-cracking with a different magnitude on the concrete skin [72]. Highlighting that, early-age shrinkage and the crack tendency of concrete could be increased in the event of insufficient bleed water on the concrete’s surface. In the other words, the lower the rate of early-age drying shrinkage, the lesser the shrinkage surface crack at short-term and long-term ages.
While focusing on the surface of the concrete specimens with 100% OPS (A3 and B3 mixes), considerable amounts of cracks from fine to visible and relatively shallow in depth can be observed. However, for the mixes containing 0 and 50% of OPS, no crack has been detected. Based on the crack width gauge, the maximum crack width for both series of mixes was measured to be about 0.1 mm. Nevertheless, the surface of the B3 mix—which contains FA—presents more cracks compared to the A3 mix. As already presented in Table 7, Table 8 and Table 9, drying shrinkage strain of A3 and B3 mixes under different curing conditions at early-age and long-term ages were considerably high, which caused the formation of the shrinkage crack on the surface of specimens, as indicated in Figure 13.
Technically, a flaky shape and smooth surface texture together with a low module of elasticity (MOE) of OPS aggregates are considered as impactful parameters for high drying the shrinkage rate of concrete, leading to surface crack formation. The importance of the aggregate shape in controlling shrinkage has been highlighted. Al-Attar [59] reported that the rate of drying shrinkage of concrete containing crushed granite is lower than the concrete made with uncrushed gravel aggregates. Stiffness and the MOE of aggregates can directly impact the shrinkage. The elastic modulus for the conventional concrete by using normal-weight aggregate was reported to be in the range of 14–41 GPa [23], while a much lower value was recorded for OPS concrete by 5.3 to 10.9 GPa [21]. Neville [73] stated that there is a correlation in which MOE of concrete is associated with the elastic modulus of its constituents and their volumetric proportions. With regard to the low MOE value of OPS aggregate, it could be stated that concrete containing OPS aggregate has a significantly lower MOE in comparison with conventional concrete. Correspondingly, concrete made from aggregate with low MOE would have a higher drying shrinkage value as compared to the normal aggregate concrete. Aslam et al. [74] investigated the impact of partial substation of OPS with lightweight oil-palm-clinker aggregate on drying shrinkage of concrete. They pointed out that if only OPS aggregates are utilized in concrete, then the potential of shrinkage crack would be increased drastically.
In addition, the inclusion of FA induced a higher rate of drying shrinkage, which could justify more drying shrinkage cracks on a concrete surface for the B3 mix; this is in agreement with the result of Boucherit et al. [75], who found out that incorporation of ground granulated blast furnace slag and FA in the concrete mixture increases the rate of drying shrinkage.
Concerning the discussed results from the present experiment and previous studies, it can be confirmed that the magnitude of drying shrinkage is an impactful factor on the development of concrete surface cracks. It is one of the most objectionable types of defects for the concrete surface elements. Nevertheless, the influence of this phenomenon is not significant for the concrete masonry units or for filling and insulating concrete, as presented in Table 1 [54]. Needless to say, micro-cracks development and further crack propagation which are due to shrinkage and creep, affect structural integrity and as a result reduce the durability of concrete [76,77].

4. Conclusions

Oil palm shell (OPS) and fly ash (FA) are solid wastes that can be used as replacements of aggregate and cement in various types of concrete. To investigate the features and potential applications of using these materials in concrete, mechanical, and time-dependent properties such as water absorption, compressive strength and drying shrinkage were compared. In the present study, 20% FA as replacement of cement was used to produce concrete made with 0%, 50%, and 100% OPS as aggregates. The focus of the present study was to experimentally evaluate the effect of FA on time-dependent properties of concrete with different substation levels of OPS. The obtained results were drawn as follows:
  • Using FA (20% binder weight) as well as full substitution of crushed granite by OPS in conventional concrete remarkably decreases the concrete density from 2340 to 1753 kg/m3 and 2400 to 1909 kg/m3 for dry and demolded density, respectively. Therefore, increasing the volume of OPS aggregate from 50% to 100% transformed the normal-weight concrete (A1 mix) into lightweight concrete. In addition, it has been observed that incorporation of 20% FA can slightly reduce the density of concrete by about 3%, 0.2%, and 7.7% for A1, A2, and A3 mixes, respectively.
  • Partial and full replacement of normal-weight aggregate with OPS in concrete leads to an increase in the slump value of the fresh concrete, and a decrease in compressive strength at 28 days by almost 30% and 50% under continuous moist curing conditions. Similarly, an incorporation of FA negatively affects the compressive strength value, as the OPS lightweight concrete without FA has a higher 28-day compressive strength than those containing FA under various curing conditions.
  • The water absorption value for concretes in series A was lower in comparison with corresponding mixes containing 20% FA in series B. This result confirms that FA incorporation increases the water absorption rate in concrete mixtures. In addition, it was noted that by increasing OPS volume in both series, the initial and final water absorption were remarkably increased.
  • FA incorporation in OPS concrete mixtures increases the drying shrinkage rate under various curing conditions at both early- and long-term ages (365 days), and under different curing conditions. Furthermore, the value of drying shrinkage remarkably increased due to the replacement of crushed granite with OPS with an interval of 50%.
  • The lowest drying shrinkage strain value was recorded for an A1 mix—with no OPS and FA—at early and long-term ages and under different curing conditions. Conversely, a B3 mix containing 20% FA and 100% OPS showed maximum drying shrinkage strains of 1109, 935, and 820 µε at 365 days under 28 days of continuous moist curing, 7 days of moist curing, and an air curing condition, respectively.
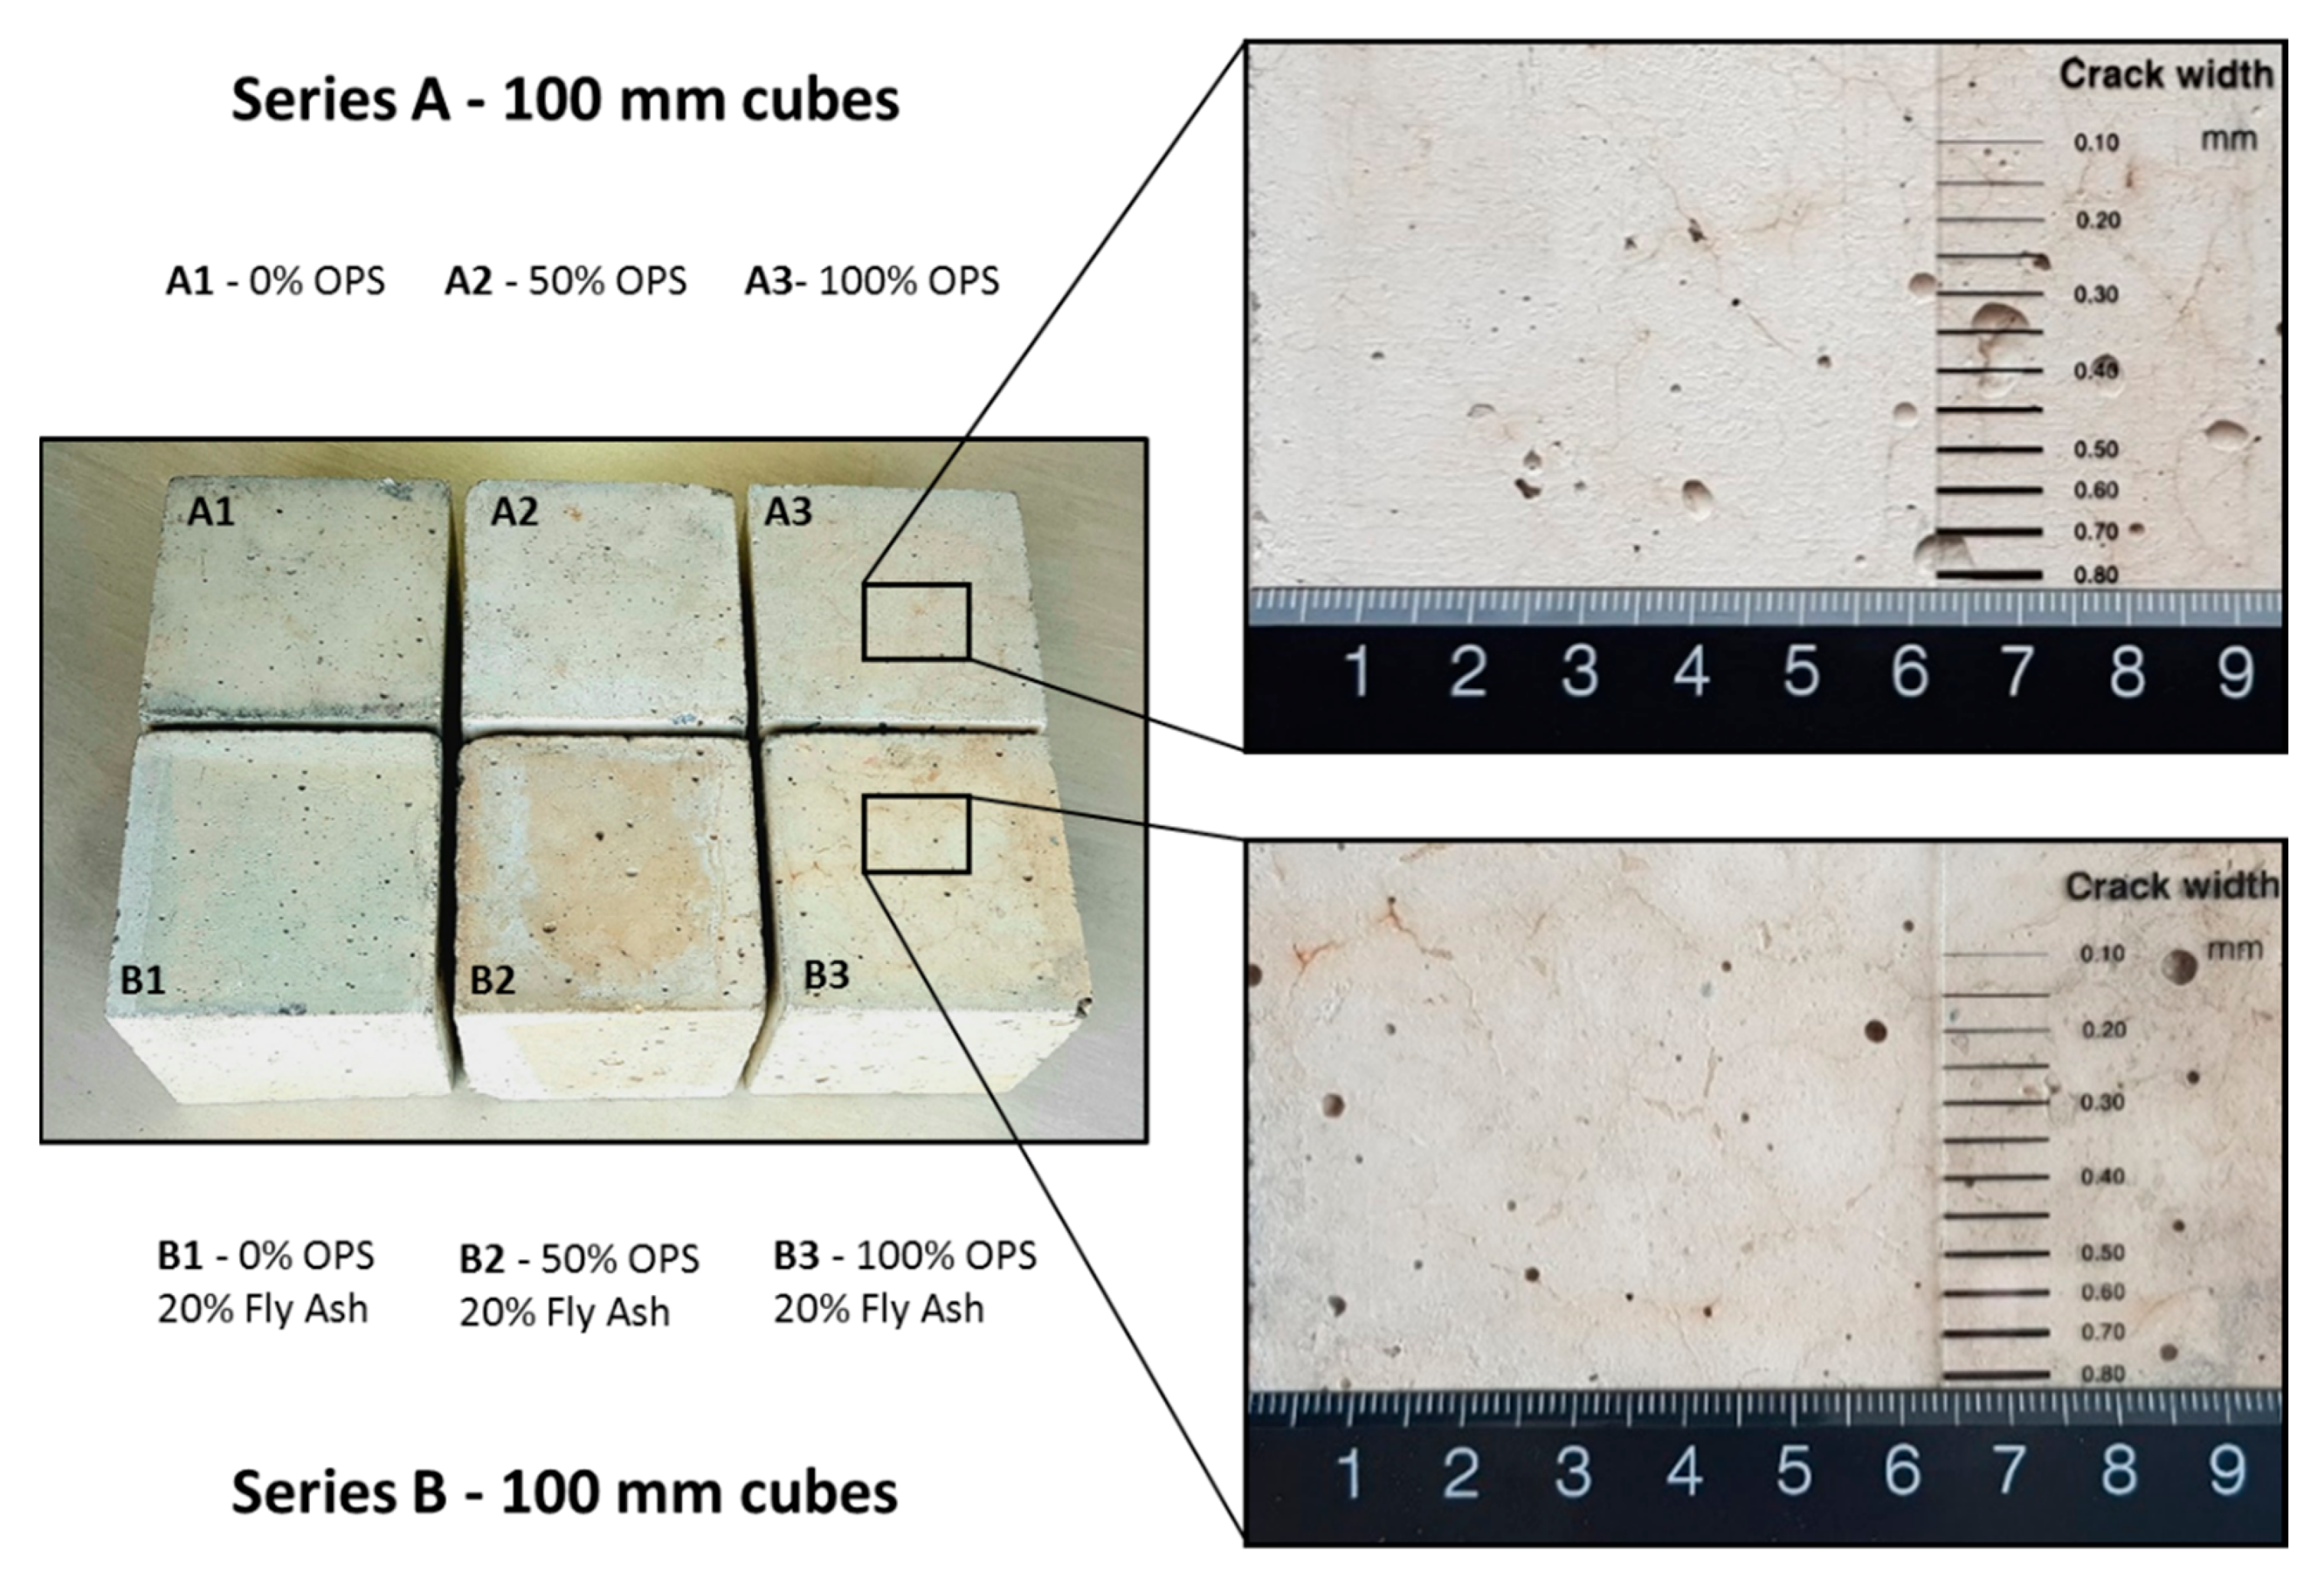
  • The surface of the concrete specimens containing 100% OPS (A3 and B3 mixes), showed a considerable amount of hairline cracks with 0.1 mm in width. However, the inclusion of 20% FA in the B3 mix induced a higher rate of drying shrinkage, which resulted in more cracks on the surface of the concrete.

Author Contributions

Conceptualization, M.M.; data curation, M.M., I.A. and Y.D.; formal analysis, M.M. and V.A.; investigation, M.M. and V.A.; methodology, M.M., V.A. and Y.D.; project administration, M.M.; software, M.M. and V.A.; supervision, M.M.; validation, M.M., V.A., P.A., I.A., Y.D. and B.B.; visualization, M.M. and V.A.; writing—original draft, M.M. and V.A.; writing—review & editing, M.M., V.A., I.A., Y.D. and B.B.; project administration, M.M.; funding acquisition, M.M. All authors have read and agreed to the published version of the manuscript.

Funding

This research received no external funding.

Data Availability Statement

The data will be made available upon request.

Conflicts of Interest

The authors declare no conflict of interest.

References

  1. Hung, M.F.; Hwang, C.L. Study of fine sediments for making lightweight aggregate. Waste Manag. Res. 2007, 25, 449–456. [Google Scholar] [CrossRef] [PubMed]
  2. Maghfouri, M. Optimum Oil Palm Shell Content as Coarse Aggregate in Concrete Based on Mechanical and Drying Shrinkage Properties. Master’s Thesis, University of Malaya, Kuala Lumpur, Malaysia, 2019. [Google Scholar]
  3. Yasar, E.; Atis, C.D.; Kilic, A.; Gulsen, H. Strength properties of lightweight concrete made with basaltic pumice and fly ash. Mater. Lett. 2003, 57, 2267–2270. [Google Scholar] [CrossRef]
  4. Mindess, S.Y.J.; Darwin, D. Concrete, 2nd ed.; Prentice-Hall: Englewood Cliffs, NJ, USA, 2003. [Google Scholar]
  5. Kim, H.K.; Jeon, J.; Lee, H.K. Workability, and mechanical, acoustic and thermal properties of lightweight aggregate concrete with a high volume of entrained air. Constr. Build. Mater. 2012, 29, 193–200. [Google Scholar] [CrossRef]
  6. ASTM Committee. 330-05. Standard specification for lightweight aggregates for structural concrete. In Annual Book of ASTM Standard; ASTM: West Conshohocken, PA, USA, 2006. [Google Scholar]
  7. Holm, T.A. Lightweight concrete and aggregates. In Significance of Tests and Properties of Concrete and Concrete-Making Materials; ASTM International: West Conshohocken, PA, USA, 1994. [Google Scholar]
  8. Mehta, P.K.; Monteiro, P.J. Concrete Microstructure, Properties and Materials; McGraw-Hill Education: New York, NY, USA, 2017. [Google Scholar]
  9. ASTM Committee. 331. Standard specification for Lightweight Aggregates for Concrete Masonry Units. In Annual Book of ASTM Standards; ASTM: West Conshohocken, PA, USA, 2007. [Google Scholar]
  10. ASTM Committee. 332–399. Standard Specification for Lightweight Aggregates for Insulating Concrete; ASTM: West Conshohocken, PA, USA, 2006. [Google Scholar]
  11. Shi, Y.; Liu, X. Research on the literature of green building based on the Web of Science: A scientometric analysis in CiteSpace (2002–2018). Sustainability 2019, 11, 3716. [Google Scholar] [CrossRef] [Green Version]
  12. Zhou, Z.; Wang, C.; Sun, X.; Gao, F.; Feng, W.; Zillante, G. Heating energy saving potential from building envelope design and operation optimization in residential buildings: A case study in northern China. J. Clean. Prod. 2018, 174, 413–423. [Google Scholar] [CrossRef]
  13. Mazraeh, H.M.; Pazhouhanfar, M. Effects of vernacular architecture structure on urban sustainability case study: Qeshm Island, Iran. Front. Archit. Res. 2018, 7, 11–24. [Google Scholar] [CrossRef]
  14. Asadi, I.; Shafigh, P.; Hashemi, M.; Akhiani, A.R.; Maghfouri, M.; Sajadi, B.; Norhayati, M.; Esfandiari, M.; Rezaei Talebi, H.; Cornelis Metselaar, H.S. Thermophysical properties of sustainable cement mortar containing oil palm boiler clinker (OPBC) as a fine aggregate. Constr. Build. Mater. 2021, 268, 121091. [Google Scholar] [CrossRef]
  15. Hendriks, C.A.; Worrell, E.; De Jager, D.; Blok, K.; Riemer, P. Emission Reduction of Greenhouse Gases from the Cement Industry. In Proceedings of the Fourth International Conference on Greenhouse Gas Control Technologies, Interlaken, Switzerland, 30 August–2 September 1998; IEA GHG R&D Programme: Cheltenham, UK, 1998. [Google Scholar]
  16. Meyer, C. The greening of the concrete industry. Cem. Concr. Compos. 2009, 31, 601–605. [Google Scholar] [CrossRef]
  17. Klee, H. Briefing: The Cement Sustainability Initiative. In Proceedings of the Institution of Civil Engineers-Engineering Sustainability; Thomas Telford Ltd.: London, UK, 2004. [Google Scholar]
  18. Aslam, M.; Shafigh, P.; Jumaat, M.Z.; Lachemi, M. Benefits of using blended waste coarse lightweight aggregates in structural lightweight aggregate concrete. J. Clean. Prod. 2016, 119, 108–117. [Google Scholar] [CrossRef]
  19. Salam, S.A.; Abdullah, A.A. Lightweight Concrete Using Oil Palm Shells as Aggregates; IPMKSM: Kuala Lumpur, Malaysia, 1987. [Google Scholar]
  20. Abdullah, A.A. Palm oil shell aggregate for lightweight concrete. In Waste Materials Used in Concrete Manufacturing; William Andrew Publishing: New York, NY, USA, 1996; pp. 624–636. [Google Scholar]
  21. Alengaram, U.J.; Al Muhit, B.A.; Bin Jumaat, M.Z. Utilization of oil palm kernel shell as lightweight aggregate in concrete—A review. Constr. Build. Mater. 2013, 38, 161–172. [Google Scholar] [CrossRef]
  22. Teo, D.C.L.; Mannan, M.A.; Kuran, V.J. Structural concrete using oil palm shell (OPS) as lightweight aggregate. Turk. J. Eng. Environ. Sci. 2006, 30, 251–257. [Google Scholar]
  23. Shafigh, P.; Mahmud, H.B.; Jumaat, M.Z.B.; Ahmmad, R.; Bahri, S. Structural lightweight aggregate concrete using two types of waste from the palm oil industry as aggregate. J. Clean. Prod. 2014, 80, 187–196. [Google Scholar] [CrossRef]
  24. Maghfouri, M.; Shafigh, P.; Ibrahim, Z.B.; Alimohammadi, V. Quality control of lightweight aggregate concrete based on initial and final water absorption tests. IOP Conf. Ser. Mater. Sci. Eng. 2017, 210, 012022. [Google Scholar] [CrossRef] [Green Version]
  25. Maghfouri, M.; Shafigh, P.; Aslam, M. Optimum Oil Palm Shell Content as Coarse Aggregate in Concrete Based on Mechanical and Durability Properties. Adv. Mater. Sci. Eng. 2018, 2018, 1–14. [Google Scholar] [CrossRef] [Green Version]
  26. Zia, P.; Ahmad, S.; Leming, M. High-Performance Concretes: A State-of-Art Report (1989–1994); FHWA-RD-97-030; Federal Highway Administration: McLean, VA, USA, 1997. [Google Scholar]
  27. Clarke, J. Structural Lightweight Aggregate Concrete; Blackie Academic & Professional: Glasgow, UK, an imprint of Chapman & Hall: London, UK; 1993; p. 19. [Google Scholar]
  28. Maghfouri, M.; Shafigh, P.; Alimohammadi, V. Drying Shrinkage Strain Development of Agro-Waste Oil Palm Shell Lightweight Aggregate Concrete by Using the Experimental Result, ACI and Eurocode Prediction Models. Int. J. Integ. Eng. 2019, 11, 255–263. [Google Scholar]
  29. Maghfouri, M.; Shafigh, P.; Alimohammadi, V.; Doroudi, Y.; Aslam, M. Appropriate drying shrinkage prediction models for lightweight concrete containing coarse agro-waste aggregate. J. Build. Eng. 2020, 29, 101148. [Google Scholar] [CrossRef]
  30. Atiş, C.D. High-volume fly ash concrete with high strength and low drying shrinkage. J. Mater. Civ. Eng. 2003, 15, 153–156. [Google Scholar] [CrossRef]
  31. Chindaprasirt, P.; Homwuttiwong, S.; Sirivivatnanon, V. Influence of fly ash fineness on strength, drying shrinkage and sulfate resistance of blended cement mortar. Cem. Concr. Res. 2004, 34, 1087–1092. [Google Scholar] [CrossRef]
  32. Kumar, B.; Tike, G.; Nanda, P. Evaluation of properties of high-volume fly-ash concrete for pavements. J. Mater. Civ. Eng. 2007, 19, 906–911. [Google Scholar] [CrossRef]
  33. Erdoğan, T.Y. Admixtures for Concrete; Middle East Technical University Press: Ankara, Turkey, 1997. [Google Scholar]
  34. Munday, J.G.L.; Ong, L.T.; Wong, L.B.; Dhir, R.K. Load independent movements in opc/pfa concrete. In Proceedings of the International Symposium on the Use of PFA in Concrete, University of Leeds, Leeds, UK, 24 April 1982. [Google Scholar]
  35. Standard, A. C150: Standard Specification for Portland Cement. In Annual Book of ASTM Standards; ASTM International: West Conshohocken, PA, USA, 2009. [Google Scholar]
  36. ASTM Committee. 09. Standard Specification for Coal Fly Ash and Raw or Calcined Natural Pozzolan for Use in Concrete; ASTM International: West Conshohocken, PA, USA, 2012. [Google Scholar]
  37. ASTM Committee. 494. Standard Specification for Chemical Admixtures for Concrete; ASTM International: West Conshohocken, PA, USA, 1999. [Google Scholar]
  38. Dixon, D.E.; Prestrera, J.R.; Burg, G.R.; Chairman, S.A.; Abdun-Nur, E.A.; Barton, S.G.; Bell, L.W.; Blas, S.J., Jr.; Carrasquillo, R.L.; Carrasquillo, P.M.; et al. Standard Practice for Selecting Proportions for Normal, Heavyweight, and Mass Concrete (ACI 211.1-91); American Concrete Institute: Farmington Hills, MI, USA, 1991. [Google Scholar]
  39. Thomas, M. Optimizing the Use of Fly Ash in Concrete; Portland Cement Association: Skokie, IL, USA, 2007; Volume 5420. [Google Scholar]
  40. ASTM Committee. 143. Standard Test Method for Slump of Hydraulic-Cement Concrete; ASTM International: West Conshohocken, PA, USA, 2012. [Google Scholar]
  41. ASTM Committee. C642-13. Standard Test Method for Density, Absorption, and Voids in Hardened Concrete; ASTM International: West Conshohocken, PA, USA, 2013. [Google Scholar]
  42. Razak, H.A.; Chai, H.; Wong, H. Near surface characteristics of concrete containing supplementary cementing materials. Cem. Concr. Compos. 2004, 26, 883–889. [Google Scholar] [CrossRef]
  43. Teo, D.C.L.; Mannan, M.A.; Kurian, V.J.; Ganapathy, C. Lightweight concrete made from oil palm shell (OPS): Structural bond and durability properties. Build. Sci. 2007, 42, 2614–2621. [Google Scholar] [CrossRef]
  44. ASTM Committee. C157. Standard test method for length change of hardened hydraulic-cement mortar and concrete. In Annual Book of ASTM Standards; ASTM International: West Conshohocken, PA, USA, 2006; Volume 4, pp. 96–101. [Google Scholar]
  45. Basri, H.; Mannan, M.; Zain, M.F.M. Concrete using waste oil palm shells as aggregate. Cem. Concr. Res. 1999, 29, 619–622. [Google Scholar] [CrossRef]
  46. Jagadesh, P.; Ramachandramurthy, A.; Murugesan, R. Evaluation of mechanical properties of Sugar Cane Bagasse Ash concrete. Constr. Build. Mater. 2018, 176, 608–617. [Google Scholar] [CrossRef]
  47. Zawawi, M.N.A.A.; Muthusamy, K.; Majeed, A.P.A.; Musa, R.M.; Budiea, A.M.A. Mechanical properties of oil palm waste lightweight aggregate concrete with fly ash as fine aggregate replacement. J. Build. Eng. 2020, 27, 100924. [Google Scholar] [CrossRef]
  48. Kurda, R.; de Brito, J.; Silvestre, J.D. Water absorption and electrical resistivity of concrete with recycled concrete aggregates and fly ash. Cem. Concr. Compos. 2019, 95, 169–182. [Google Scholar] [CrossRef]
  49. Zhang, Z.; Provis, J.L.; Reid, A.; Wang, H. Fly ash-based geopolymers: The relationship between composition, pore structure and efflorescence. Cem. Concr. Res. 2014, 64, 30–41. [Google Scholar] [CrossRef]
  50. Ting, T.Z.H.; Rahman, M.E.; Lau, H.H. Sustainable lightweight self-compacting concrete using oil palm shell and fly ash. Constr. Build. Mater. 2020, 264, 120590. [Google Scholar] [CrossRef]
  51. Gencel, O.; Koksal, F.; Ozel, C.; Brostow, W. Combined effects of fly ash and waste ferrochromium on properties of concrete. Constr. Build. Mater. 2012, 29, 633–640. [Google Scholar] [CrossRef]
  52. Shafigh, P.; Alengaram, U.J.; Mahmud, H.B.; Jumaat, M.Z. Engineering properties of oil palm shell lightweight concrete containing fly ash. Mater. Des. 2013, 49, 613–621. [Google Scholar] [CrossRef]
  53. Chinnaswamy, E. Diagnosis and Assessment of Concrete Structures; State-of-the-Art Report; CEB Bull: Lausanne, Switzerland, 1989; pp. 83–85. [Google Scholar]
  54. Kosmatka, S.H.; Kerkhoff, B.; Panarese, W.C. Design and Control of Concrete Mixtures; Portland Cement Association: Skokie, IL, USA, 2002; Volume 5420. [Google Scholar]
  55. Noor, N.M.; Xiang-ONG, J.; Noh, H.M.; Hamid, N.A.A.; Kuzaiman, S.; Ali, A. Compressive strength, flexural strength and water absorption of concrete containing palm oil kernel shell. IOP Conf. Ser. Mater. Sci. Eng. 2017, 271, 012073. [Google Scholar] [CrossRef]
  56. Medeiros, R.A.D.J.; Munhoz, G.D.S.; Medeiros, M.H.F.D. Correlations between water absorption, electrical resistivity and compressive strength of concrete with different contents of pozzolan. Rev. Alconpat 2019, 9, 152–166. [Google Scholar] [CrossRef] [Green Version]
  57. Mannan, M.A.; Basri, H.B.; Zain, M.F.M.; Islam, M.N. Effect of curing conditions on the properties of OPS-concrete. Build. Sci. 2002, 37, 1167–1171. [Google Scholar] [CrossRef]
  58. Shafigh, P.; Jumaat, M.Z.; Mahmud, H. Oil palm shell as a lightweight aggregate for production high strength lightweight concrete. Constr. Build. Mater. 2011, 25, 1848–1853. [Google Scholar] [CrossRef]
  59. Al-Attar, T.S. Effect of coarse aggregate characteristics on drying shrinkage of concrete. J. Eng. Technol. 2008, 26, 146–153. [Google Scholar]
  60. Shaikuthali, S.A.; Mannan, M.A.; Eethar Thanon, D.; Teo, D.C.L.; Raudhah, A.; Idawati, I. Workability and compressive strength properties of normal weight concrete using high dosage of fly ash as cement replacement. J. Build. Pathol. Rehabil. 2019, 4, 26. [Google Scholar] [CrossRef]
  61. Muthusamy, K.; Jaafar, M.S.; Azhar, N.W.; Zamri, N.; Samsuddin, N.; Budiea, A.M.A.; Jaafar, M.F.M. Properties of oil palm shell lightweight aggregate concrete containing fly ash as partial cement replacement. IOP Conf. Ser. Mater. Sci. Eng. 2020, 849, 012048. [Google Scholar] [CrossRef]
  62. ACI Committee. 308, Proposed ACI Standard: Standard Practice for Curing Concrete (ACI 308-80); American Concrete Institute: Farmington Hills, MI, USA, 1980; Volume 2, pp. 45–55. [Google Scholar]
  63. Newman, J.; Choo, B.S. Advanced Concrete Technology Set; Butterworth-Heinemann: Oxford, UK; Elsevier: Amsterdam, The Netherlands, 2003. [Google Scholar]
  64. Marsh, B.; Ali, M. Assessment of the effectiveness of curing on the durability of reinforced concrete. Int. Concr. Abstr. Portal 1994, 145, 1161–1176. [Google Scholar]
  65. Neville, A.M. Properties of Concrete; Longman: London, UK, 1995; Volume 4. [Google Scholar]
  66. Atiş, C.D.; Özcan, F.; Kılıç, A.; Karahan, O.K.A.N.; Bilim, C.; Severcan, M.H. Influence of dry and wet curing conditions on compressive strength of silica fume concrete. Build. Environ. 2005, 40, 1678–1683. [Google Scholar] [CrossRef]
  67. Tasdemir, C. Combined effects of mineral admixtures and curing conditions on the sorptivity coefficient of concrete. Cem. Concr. Res. 2003, 33, 1637–1642. [Google Scholar] [CrossRef]
  68. Lagier, F.; Jourdain, X.; De Sa, C.; Benboudjema, F.; Colliat, J.B. Numerical strategies for prediction of drying cracks in heterogeneous materials: Comparison upon experimental results. Eng. Struct. 2011, 33, 920–931. [Google Scholar] [CrossRef]
  69. Hammoudi, A.; Moussaceb, K.; Belebchouche, C.; Dahmoune, F. Comparison of artificial neural network (ANN) and response surface methodology (RSM) prediction in compressive strength of recycled concrete aggregates. Constr. Build. Mater. 2019, 209, 425–436. [Google Scholar] [CrossRef]
  70. Mohammed, B.S.; Khed, V.C.; Nuruddin, M.F. Rubbercrete mixture optimization using response surface methodology. J. Clean. Prod. 2018, 171, 1605–1621. [Google Scholar] [CrossRef]
  71. Shafigh, P.; Nomeli, M.A.; Alengaram, U.J.; Mahmud, H.B.; Jumaat, M.Z. Engineering properties of lightweight aggregate concrete containing limestone powder and high volume fly ash. J. Clean. Prod. 2016, 135, 148–157. [Google Scholar] [CrossRef]
  72. Concrete Basics: A Guide to Concrete Practice, 6th ed.; Cement Concrete and Aggregates Australia (CCAA): Melbourne, Australia, 2004.
  73. Neville, A.M. Hardened Concrete: Physical and Mechanical Aspects; American Concrete Institute (ACI): Farmington Hills, MI, USA, 1970. [Google Scholar]
  74. Aslam, M.; Shafigh, P.; Jumaat, M.Z. Drying shrinkage behaviour of structural lightweight aggregate concrete containing blended oil palm bio-products. J. Clean. Prod. 2016, 127, 183–194. [Google Scholar] [CrossRef]
  75. Boucherit, D.; Kenai, S.; Kadri, E.; Khatib, J.M. A simplified model for the prediction of long-term concrete drying shrinkage. KSCE J. Civ. Eng. 2014, 18, 2196–2208. [Google Scholar] [CrossRef]
  76. Lamond, J.F.; Pielert, J.H. Significance of Tests and Properties of Concrete and Concrete-Making Materials; ASTM: West Conshohocken, PA, USA, 2006. [Google Scholar]
  77. Bažant, Z.P.; Kim, J.K.; Panula, L. Improved prediction model for time-dependent deformations of concrete: Part 1-Shrinkage. Mater. Struct. 1991, 24, 327–345. [Google Scholar] [CrossRef]
Figure 1. The OPS extraction from the palm fruit.
Jcs 05 00156 g001
Figure 2. Gradation of mining sand, OPS, and natural granite.
Jcs 05 00156 g002
Figure 3. OPS aggregates before and after removing of the surface fibers.
Jcs 05 00156 g003
Figure 4. FA, OPS lightweight aggregate and crushed granite used for concrete mixtures.
Jcs 05 00156 g004
Figure 5. Steps of preparation (ad) for drying shrinkage measurement: (a) molding of 100 × 100 × 200 mm concrete prisms; (b) bonding of pre-drilled stainless; (c) keeping prisms in a drying shrinkage room until certain ages for shrinkage measurement; (d) drying shrinkage measurement by the digital strain gauge, with micro-strain accuracy.
Jcs 05 00156 g005
Figure 6. Demolded and dry density of specimens.
Jcs 05 00156 g006
Figure 7. Comparison of initial and final water absorption for concrete mixes in series A and B.
Jcs 05 00156 g007
Figure 8. Compressive strength development of concrete mixes (MPa).
Jcs 05 00156 g008
Figure 9. FESEM of the control mix containing FA. Due to the observed gap in the ITZ, points A and B were selected to be focused on.
Jcs 05 00156 g009
Figure 10. 3D response surface plots for drying shrinkage of LWC at (a): 100% OPS, (b): 20% FA, and (c): age of 365 days under 28-day water curing.
Jcs 05 00156 g010
Figure 11. 3D response surface plots for drying shrinkage of LWC at (a): 100% OPS, (b): 20% FA, and (c): age of 365 days under 7-day water curing.
Jcs 05 00156 g011
Figure 12. 3D response surface plot for drying shrinkage of LWC at (a): 100% OPS, (b): 20% FA, and (c): age of 365 days under air curing.
Jcs 05 00156 g012
Figure 13. Drying shrinkage cracks on the surface of specimens with 100% OPS.
Jcs 05 00156 g013
Table 1. Comparison Between different types of lightweight aggregate concrete.
Type of ConcreteStandard (ASTM)AggregateConcrete
SizeDensity (kg/m3)TypeDensity (kg/m3)Compressive Strength (MPa)
Structural
concrete
C330 [6]
  • Fine
  • Coarse
  • Combination of fine and coarse aggregate
>1120
>880
>1040
  • Blast-furnace slag
  • Sintered
  • pulverized ash
  • Foamed slag
  • Expanded clays
  • Expanded slate
  • Pumice
  • Scoria
  • Tuff
  • Diatomite
1360–192017–28 [8]
Concrete
Masonry units,
Fill concrete
C331 [9]
  • Fine
  • Coarse
  • Combination of fine and coarse aggregate
>1120
>880
>1040
  • Blast-furnace slag
  • Sintered
  • pulverized ash
  • Foamed slag
  • Expanded clays
  • Expanded slate
  • Pumice
  • Scoria
  • Tuff
  • Agro-waste
800–13607–14
Insulating
concrete
C332 [10]Group I
Aggregates prepared by expanding product
>196
>160
  • Perlite
  • vermiculite
300–8000.7–2.0
Group II
Aggregates prepared by expanding, calcining or sintering products
  • Fine
  • Coarse
  • Combination of fine and coarse aggregate
>1120
>880
>1040
  • Blast-furnace slag
  • Sintered
  • pulverized ash
  • Foamed slag
  • Expanded clays
  • Expanded slate
  • Pumice
  • Scoria
  • Tuff
  • Agro-waste
Table 2. Chemical compositions and LOI of cement and FA.
CompoundComposition (%)
CementFA
SiO219.8064.60
CaO63.403.67
Fe2O33.104.00
MgO2.500.66
Al2O35.1021.7
SO32.400.30
K2O1.001.20
Na2O0.190.32
Loss on ignition (LOI)1.805.10
Table 3. Physical and mechanical properties of sand and aggregate.
PropertiesAggregateMining Sand
OPSGranite
Specific gravity1.202.662.68
Compacted bulk density (kg/m3)61014801657
24-h water absorption (%)20.50.921.2
Crushing value (%)0.218.0-
Impact value (%)5.515.1-
Abrasion value (%)5.722.3-
Table 4. Concrete mix proportions.
SeriesMix CodeBinder (kg)Water (liter)SP (kg)Sand
(kg)
Aggregate (kg)Slump (mm)
OPCFAGraniteOPS
AA148001634.88198980205
A244920277
A3040640
BB1384961634.88198980235
B2449202105
B3040680
Table 5. Compressive strength development of concrete mixes.
Mix CodeCompressive Strength (MPa)
Early-AgeStandard AgeLong-Term Age
1 Day3 Days7 Days28 Days56 Days90 Days120 Days
A143.0 (58%) *55.6 (75%)63.2 (85%)74.474.1 (99%)76.3 (103%)79.0 (106%)
A233.8 (65%)42.1 (81%)46.2 (89%)52.252.0 (99%)53.2 (102%)53.4 (103%)
A322.3 (55%)33.4 (82%)36.3 (90%)40.539.5 (98%)40.5 (100%)37.8 (93%)
B128.7 (46%)42.9 (69%)45.7 (73%)62.262.3 (100%)72.5 (102%)75.5 (121%)
B222.1 (48%)34.7 (75%)40.6 (88%)46.346.2 (99%)48.0 (104%)49.8 (108%)
B313.9 (42%)23.2 (70%)27.9 (84%)33.133.7 (102%)33.9 (102%)32.4 (98%)
* Values in parenthesis present early and long-term ages compressive strength ratios to 28 days.
Table 6. Compressive strength at 28 days under different curing conditions (MPa).
SeriesMix CodeWC7DAC
AA174.4069.3066.30
A252.2051.5646.06
A340.5037.6034.70
BB162.2061.5555.72
B246.3045.9541.91
B333.0032.4028.30
Table 7. Drying shrinkage results under 28 days continuous moist curing.
Mix CodeDrying Shrinkage (µε)
Early-AgesLong-Term Age
3 Days7 Days14 Days28 Days180 Days365 Days
A1153571131274443
A273111151237451473
A3110240314515834879
B13071131215346446
B274129212329484524
B311525232959110441109
Table 8. Drying shrinkage results under 7 days continuing moist curing.
Mix CodeDrying Shrinkage (µε)
Early-AgesLong-Term Ages
3 Days7 Days14 Days28 Days180 Days365 Days
A16089102135353288
A296111156216465471
A3141301335456793826
B15696128231373386
B297128186324537544
B3157259375555912935
Table 9. Drying shrinkage results under the non-curing condition.
Mix CodeDrying Shrinkage (µε)
Early-AgesLong-Term Ages
3 Days7 Days14 Days28 Days180 Days365 Days
A1100121144183321319
A299134176228445456
A3203232264382668712
B176113153187322324
B2111148182231412419
B3172214297406764820
Table 10. Drying shrinkage comparisons with previous studies.
Age (Days)Curing ConditionFA (%)OPS (%)Drying Shrinkage (µε)Reference
120AC1025435[52]
30510
50470
365AC5065590[71]
70705
365AC2050419Present study
100820
7D2050544
100933
WC2050524
1001109
Publisher’s Note: MDPI stays neutral with regard to jurisdictional claims in published maps and institutional affiliations.

