
The Diagnostic Utility of Artificial Intelligence-Guided Computed Tomography-Based Severity Scores for Predicting Short-Term Clinical Outcomes in Adults with COVID-19 Pneumonia


Abstract
:1. Introduction
2. Materials and Methods
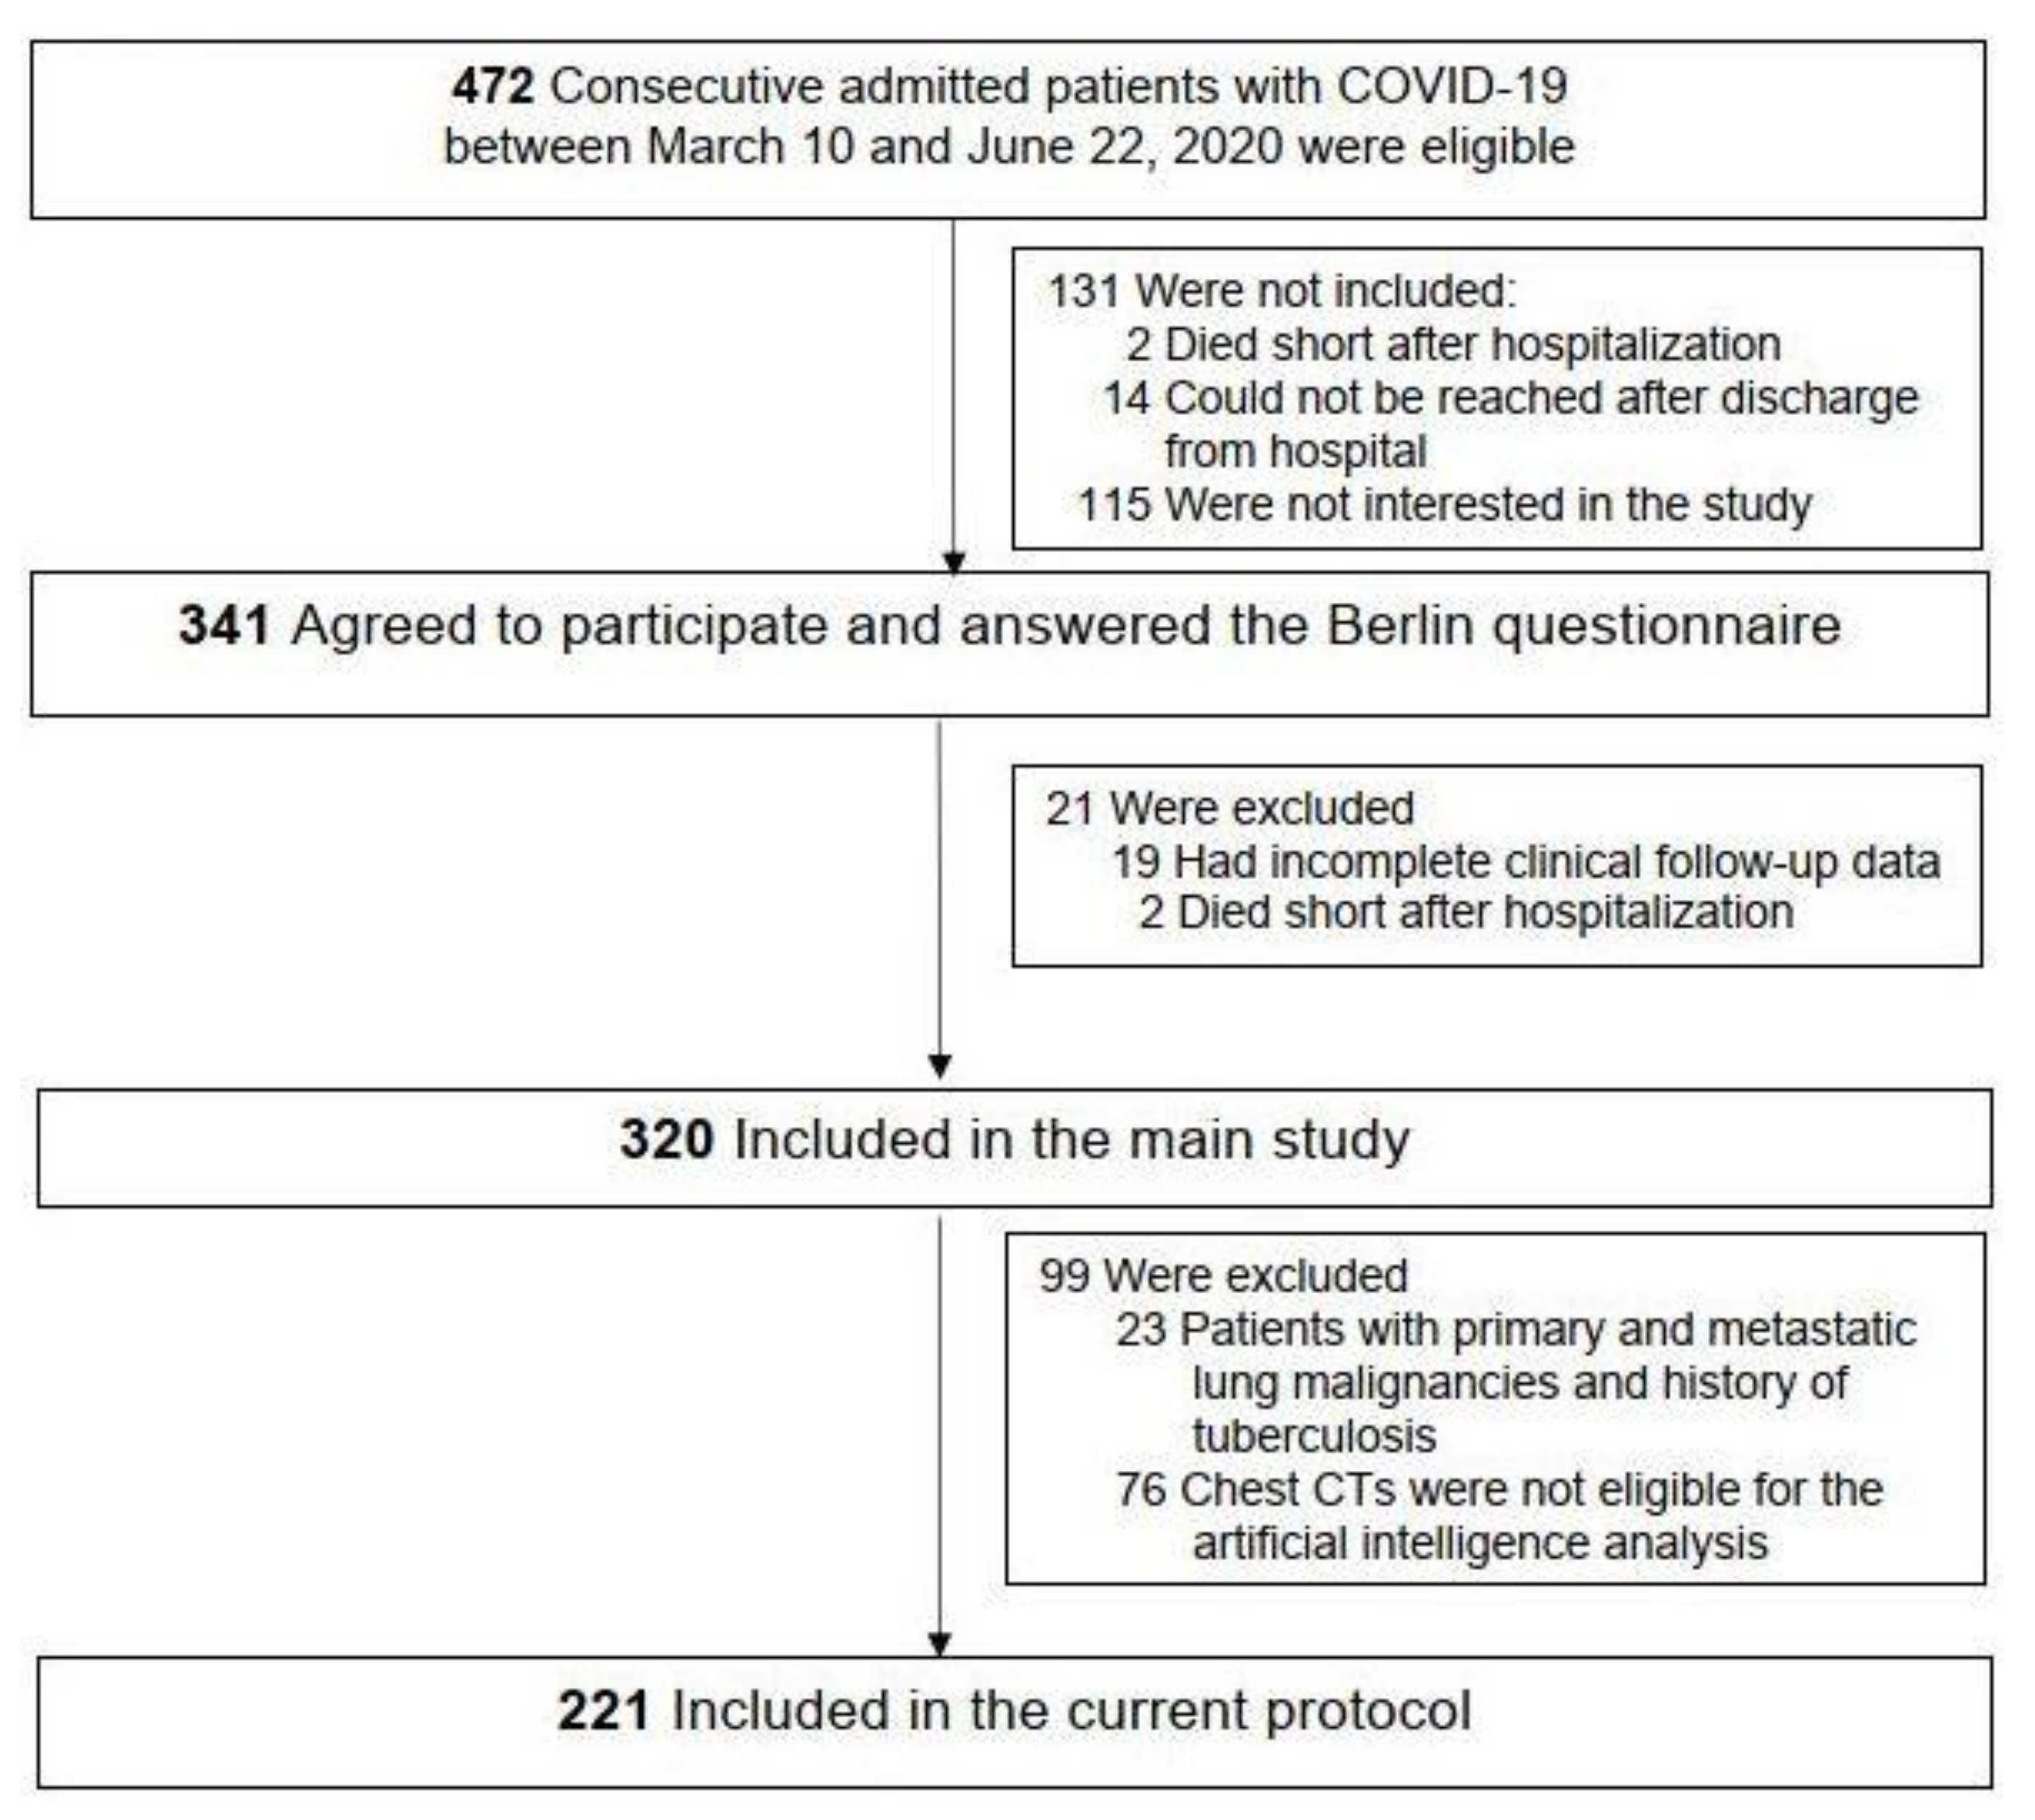
2.1. Study Population
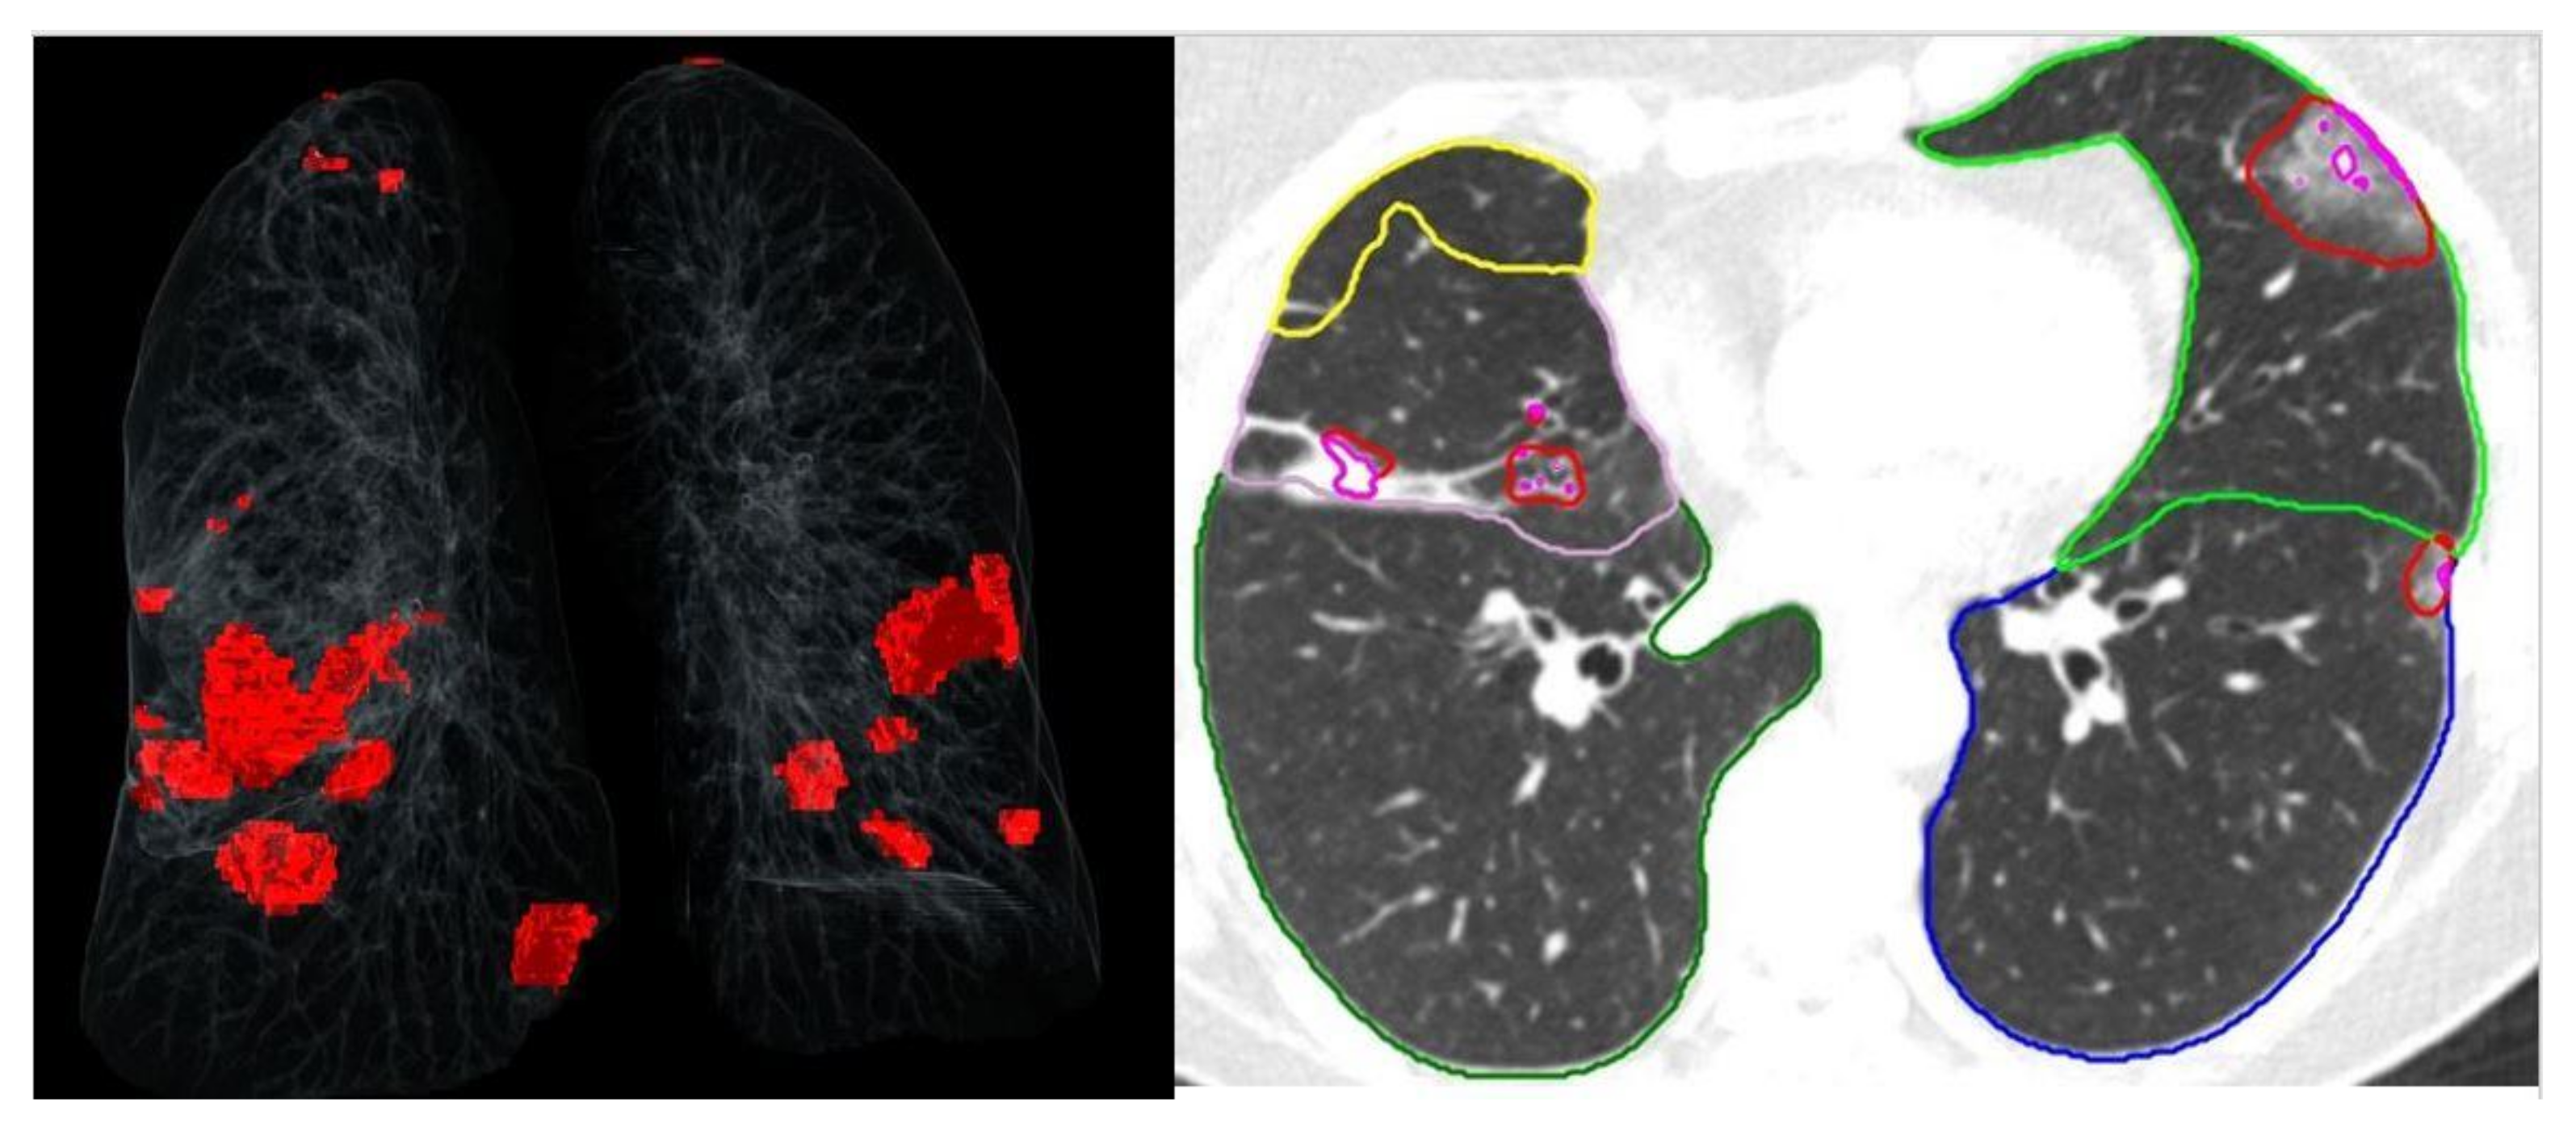
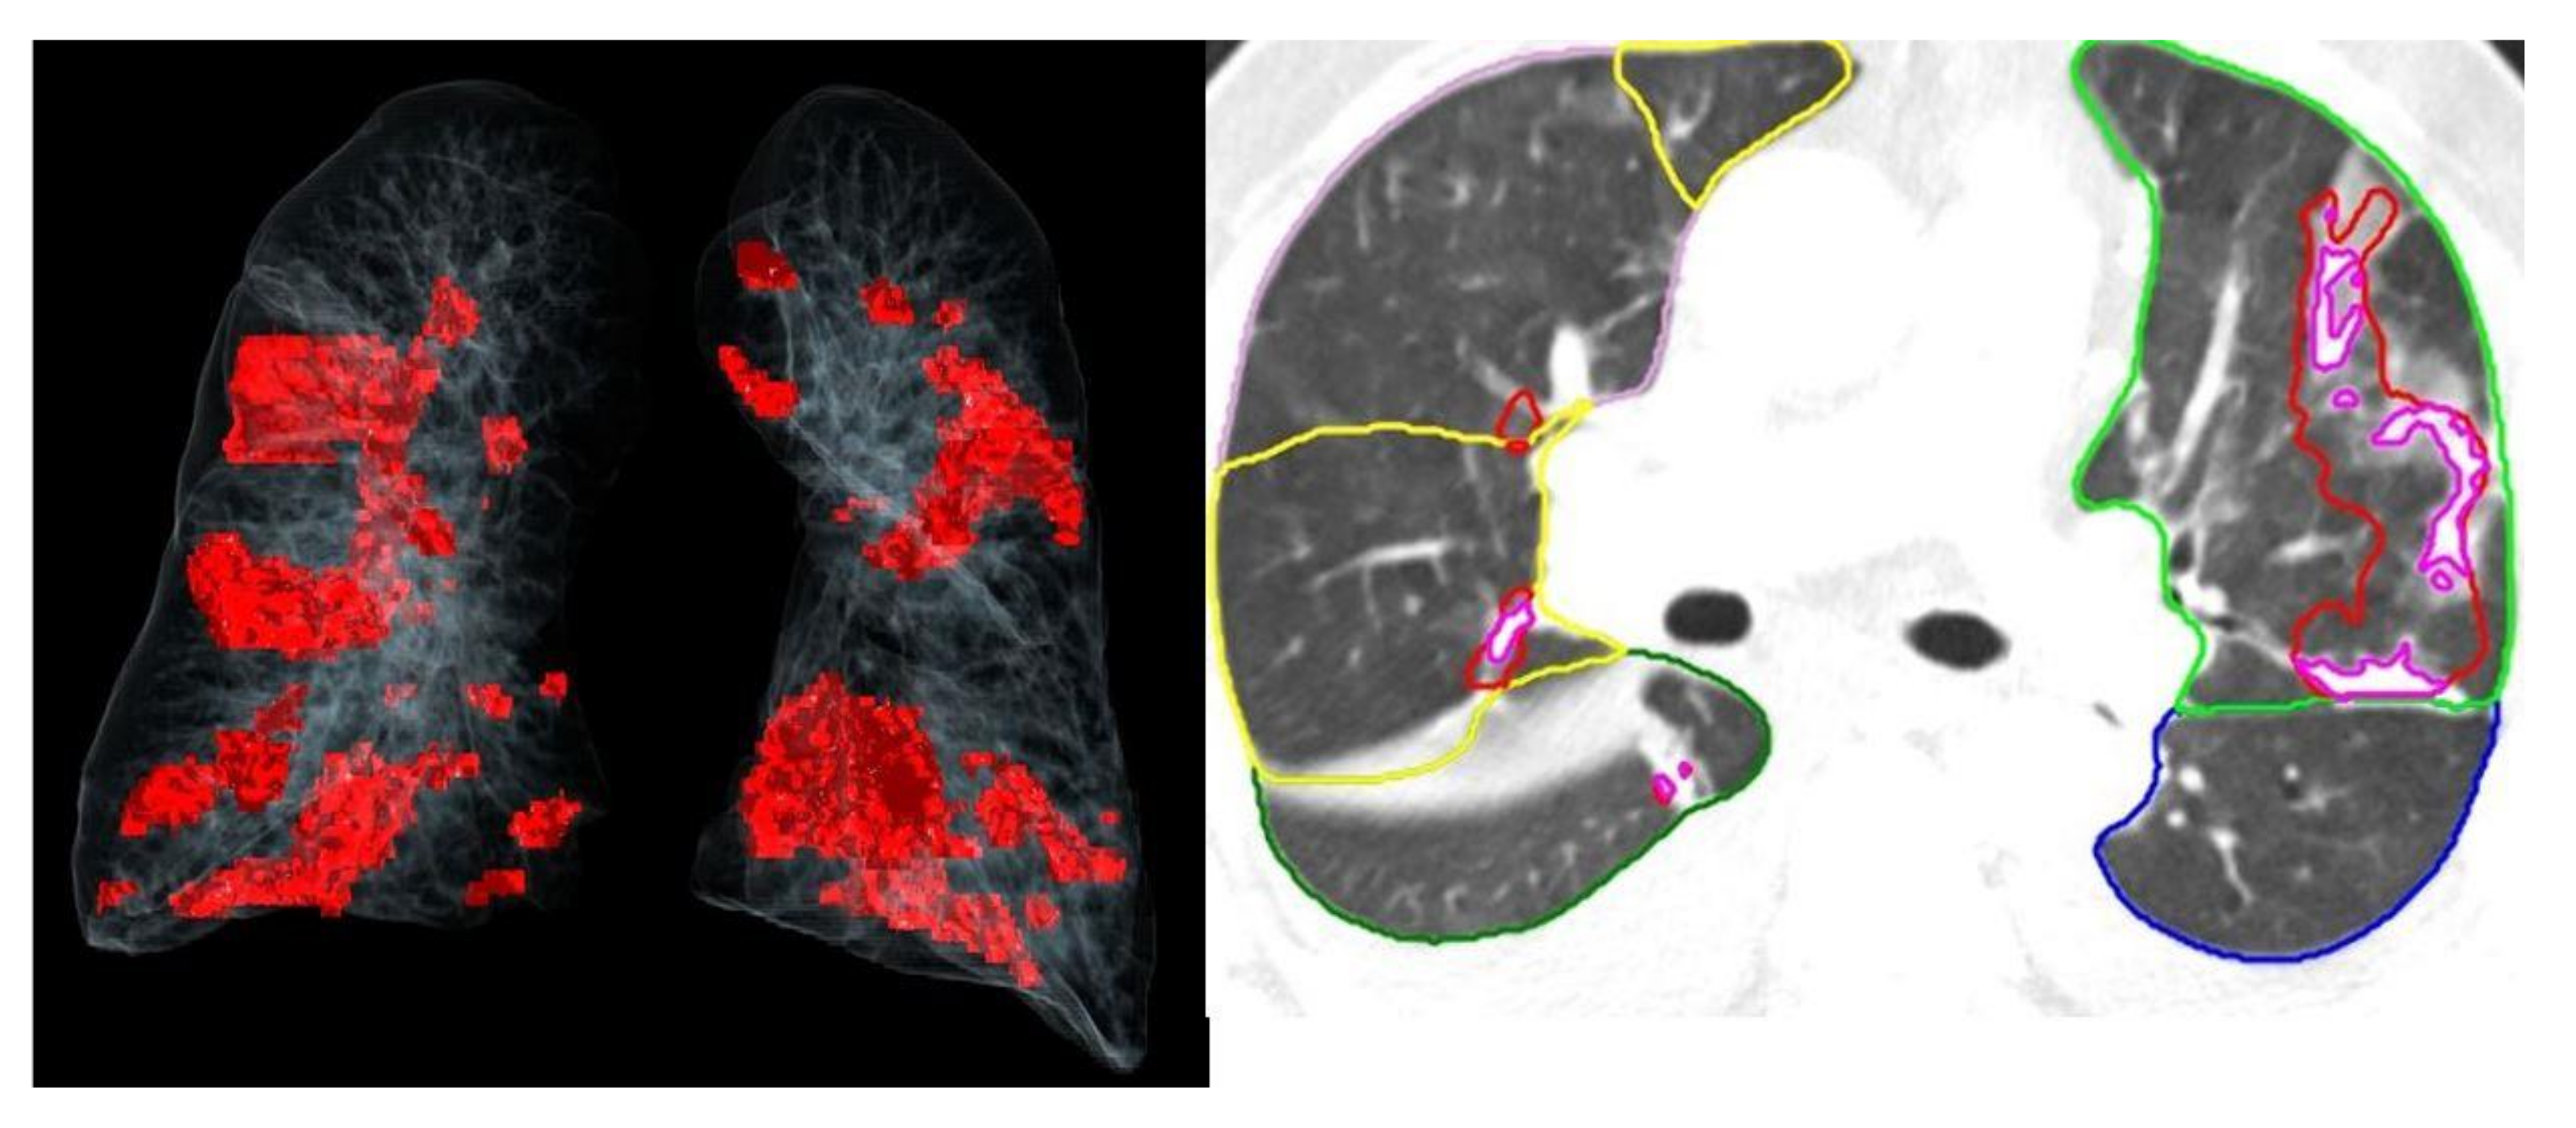
2.2. Chest MDCT Protocol and Assessment
2.3. Sample Size
2.4. Statistics
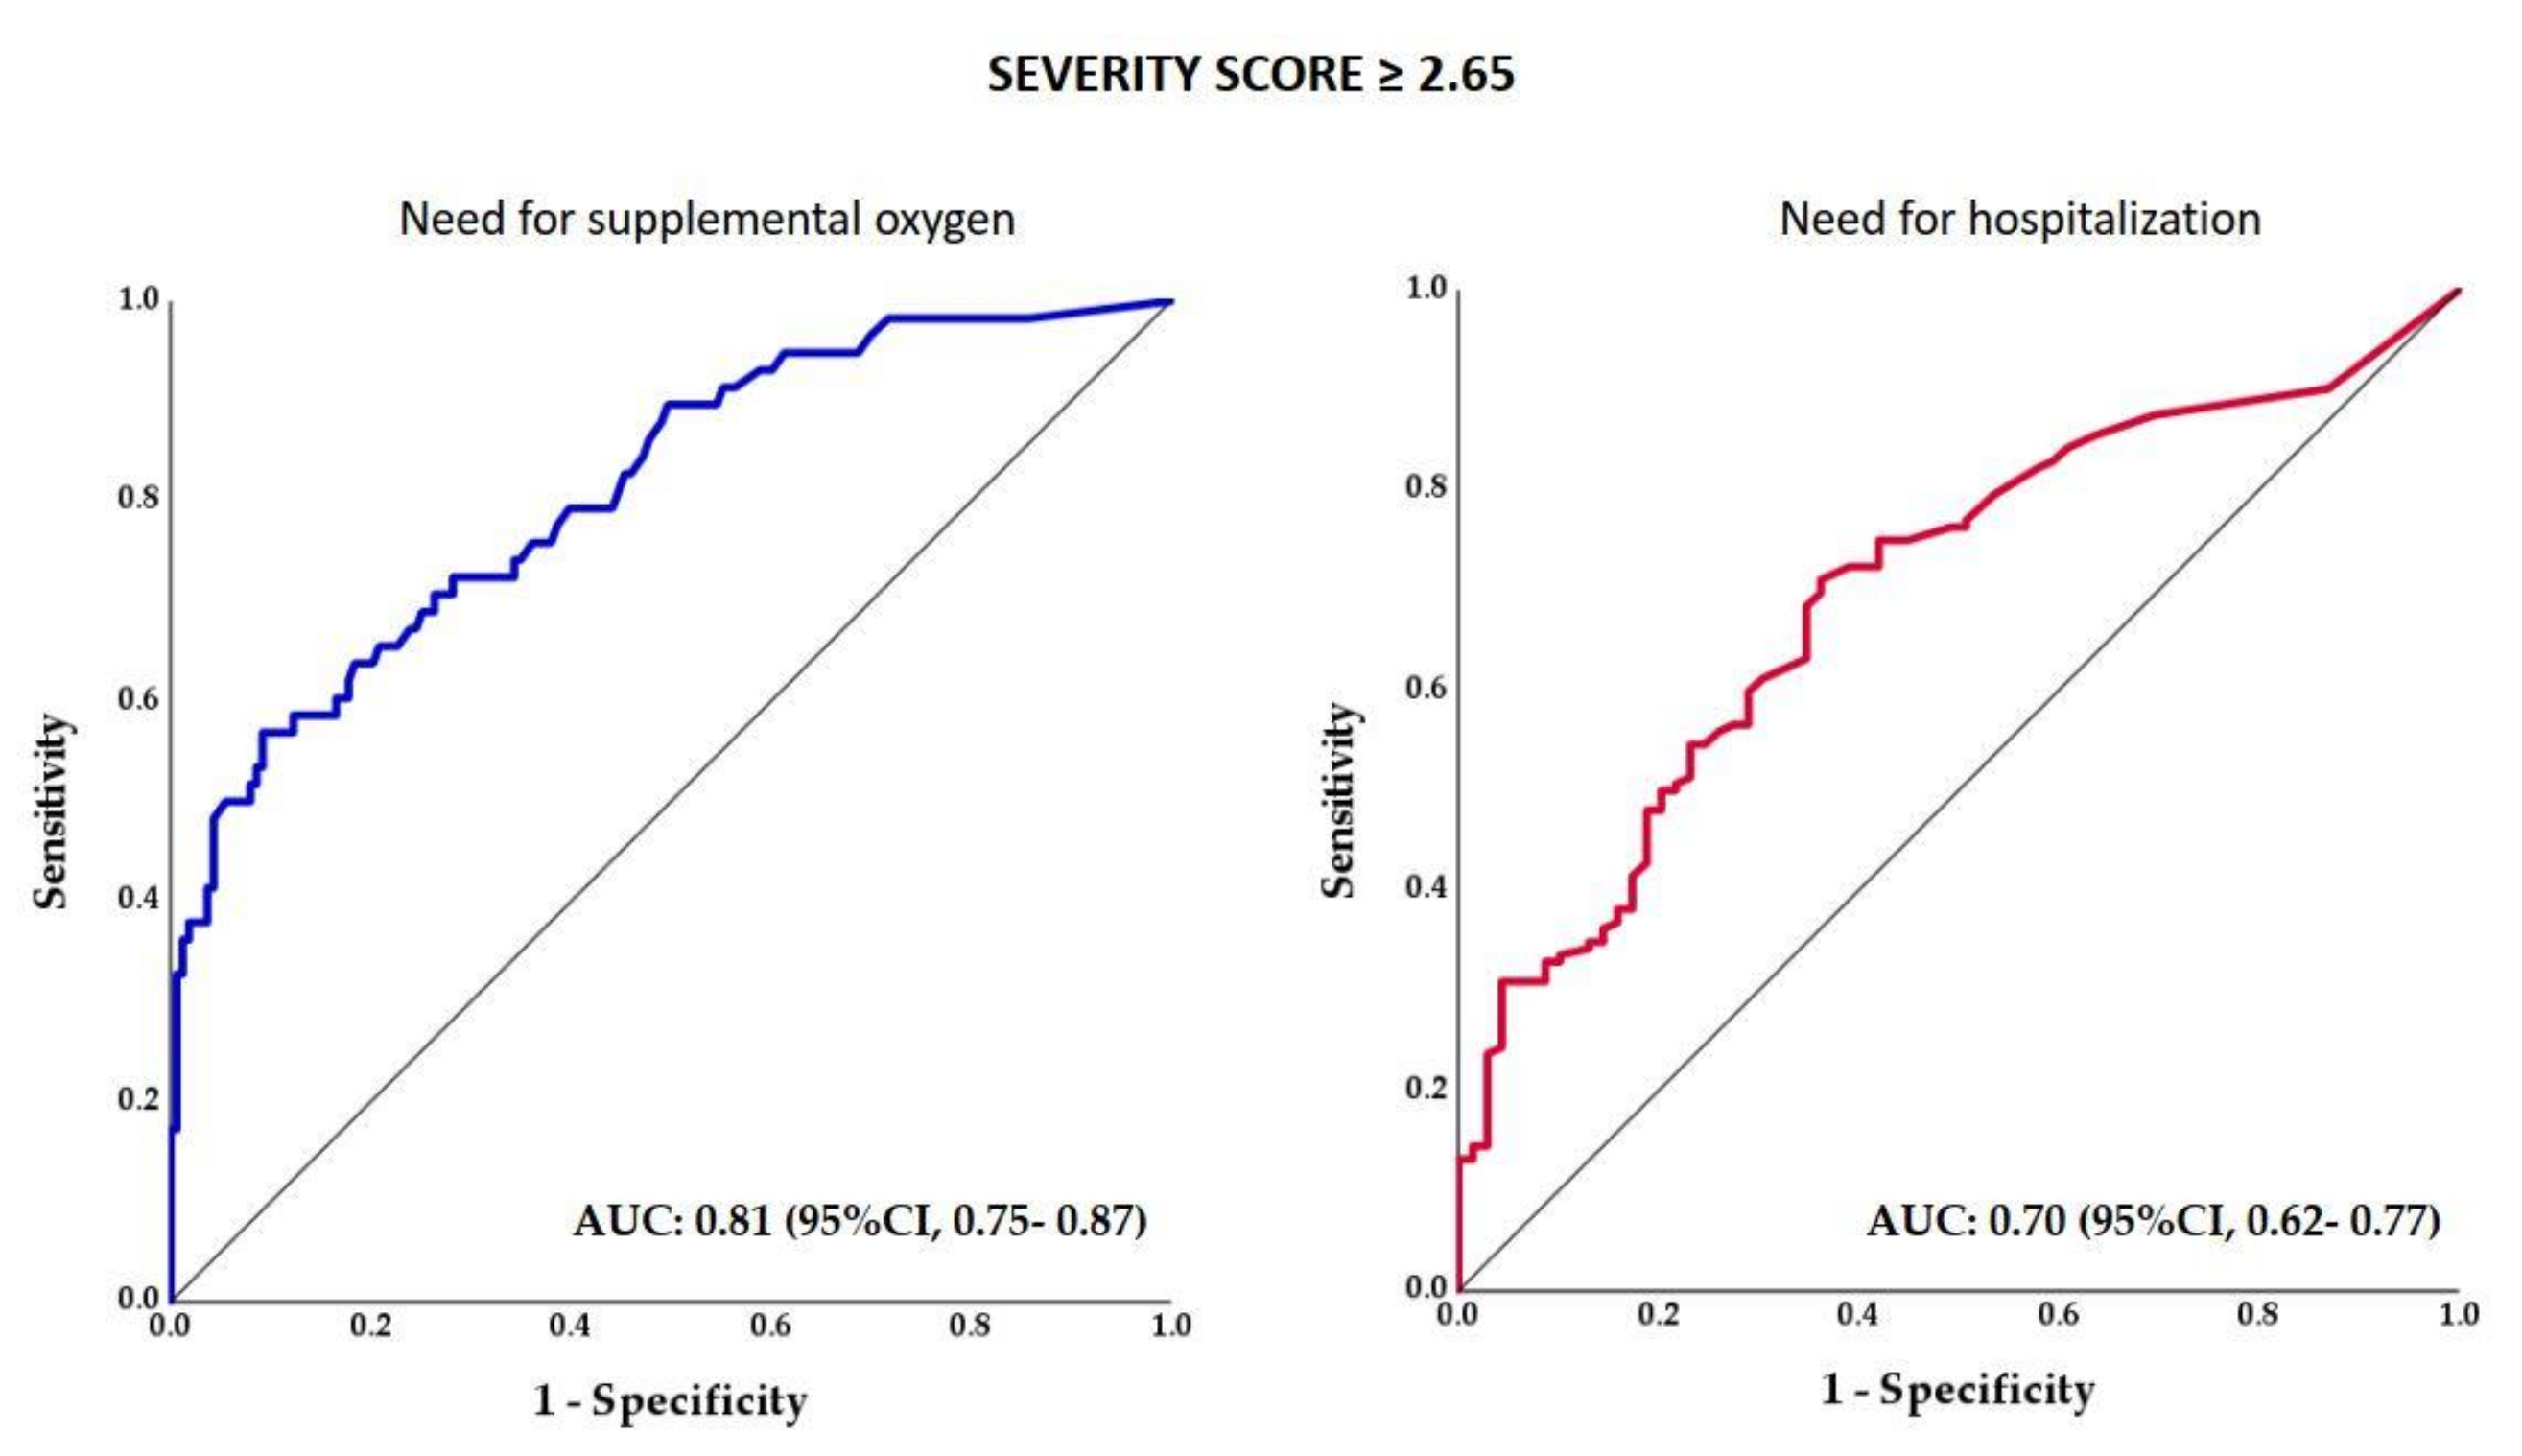
3. Results
4. Discussion
5. Conclusions
Author Contributions
Funding
Institutional Review Board Statement
Informed Consent Statement
Data Availability Statement
Acknowledgments
Conflicts of Interest
References
- Coronavirus Disease (COVID-19 Pandemic). Available online: https://www.who.int/emergencies/diseases/novel-coronavirus-2019 (accessed on 16 October 2023).
- Yang, W.; Sirajuddin, A.; Zhang, X.; Liu, G.; Teng, Z.; Zhao, S.; Lu, M. The role of imaging in 2019 novel coronavirus pneumonia (COVID-19). Eur. Radiol. 2020, 30, 4874–4882. [Google Scholar] [CrossRef] [PubMed]
- Jin, Y.-H.; Cai, L.; Cheng, Z.-S.; Cheng, H.; Deng, T.; Fan, Y.-P.; Fang, C.; Huang, D.; Huang, L.-Q.; Huang, Q.; et al. A rapid advice guideline for the diagnosis and treatment of 2019 novel coronavirus (2019-nCoV) infected pneumonia (standard version). Mil. Med. Res. 2020, 7, 4. [Google Scholar] [CrossRef] [PubMed]
- Xie, X.; Zhong, Z.; Zhao, W.; Zheng, C.; Wang, F.; Liu, J. Chest CT for Typical Coronavirus Disease 2019 (COVID-19) Pneumonia: Relationship to Negative RT-PCR Testing. Radiology 2020, 296, E41–E45. [Google Scholar] [CrossRef] [PubMed]
- Zhao, W.; Zhong, Z.; Xie, X.; Yu, Q.; Liu, J. Relation Between Chest CT Findings and Clinical Conditions of Coronavirus Disease (COVID-19) Pneumonia: A Multicenter Study. Am. J. Roentgenol. 2020, 214, 1072–1077. [Google Scholar] [CrossRef] [PubMed]
- Zhou, S.; Wang, Y.; Zhu, T.; Xia, L. CT Features of Coronavirus Disease 2019 (COVID-19) Pneumonia in 62 Patients in Wuhan, China. Am. J. Roentgenol. 2020, 214, 1287–1294. [Google Scholar] [CrossRef] [PubMed]
- Chung, M.; Bernheim, A.; Mei, X.; Zhang, N.; Huang, M.; Zeng, X.; Cui, J.; Xu, W.; Yang, Y.; Fayad, Z.A.; et al. CT imaging features of 2019 novel coronavirus (2019-nCoV). Radiology 2020, 295, 202–207. [Google Scholar] [CrossRef] [PubMed]
- Li, K.; Fang, Y.; Li, W.; Pan, C.; Qin, P.; Zhong, Y.; Liu, X.; Huang, M.; Liao, Y.; Li, S. CT image visual quantitative evaluation and clinical classification of coronavirus disease (COVID-19). Eur. Radiol. 2020, 30, 4407–4416. [Google Scholar] [CrossRef] [PubMed]
- Pan, F.; Ye, T.; Sun, P.; Gui, S.; Liang, B.; Li, L.; Zheng, D.; Wang, J.; Hesketh, R.L.; Yang, L.; et al. Time Course of Lung Changes at Chest CT during Recovery from Coronavirus Disease 2019 (COVID-19). Radiology 2020, 295, 715–721. [Google Scholar] [CrossRef]
- Saeed, G.A.; Gaba, W.; Shah, A.; Al Helali, A.A.; Raidullah, E.; Al Ali, A.B.; Elghazali, M.; Ahmed, D.Y.; Al Kaabi, S.G.; Almazrouei, S. Correlation between Chest CT Severity Scores and the Clinical Parameters of Adult Patients with COVID-19 Pneumonia. Radiol. Res. Pract. 2021, 2021, 6697677. [Google Scholar] [CrossRef]
- Xiong, Y.; Sun, D.; Liu, Y.; Fan, Y.; Zhao, L.; Li, X.; Zhu, W. Clinical and High-Resolution CT Features of the COVID-19 Infection: Comparison of the Initial and Follow-up Changes. Investig. Radiol. 2020, 55, 332–339. [Google Scholar] [CrossRef]
- Yang, R.; Li, X.; Liu, H.; Zhen, Y.; Zhang, X.; Xiong, Q.; Luo, Y.; Gao, C.; Zeng, W. Chest CT Severity Score: An Imaging Tool for Assessing Severe COVID-19. Radiol. Cardiothorac. Imaging 2020, 2, e200047. [Google Scholar] [CrossRef] [PubMed]
- Salahshour, F.; Mehrabinejad, M.-M.; Toosi, M.N.; Gity, M.; Ghanaati, H.; Shakiba, M.; Sheybani, S.N.; Komaki, H.; Kolahi, S. Clinical and chest CT features as a predictive tool for COVID-19 clinical progress: Introducing a novel semi-quantitative scoring system. Eur. Radiol. 2021, 31, 5178–5188. [Google Scholar] [CrossRef] [PubMed]
- Simpson, S.; Kay, F.U.; Abbara, S.; Bhalla, S.; Chung, J.H.; Chung, M.; Henry, T.S.; Kanne, J.P.; Kligerman, S.; Ko, J.P.; et al. Radiological Society of North America Expert Consensus Statement on Reporting Chest CT Findings Related to COVID-19. Endorsed by the Society of Thoracic Radiology, the American College of Radiology, and RSNA—Secondary Publication. J. Thorac. Imaging 2020, 35, 219–227. [Google Scholar] [CrossRef]
- Prokop, M.; Van Everdingen, W.; van Rees Vellinga, T.; Quarles van Ufford, H.; Stöger, L.; Beenen, L.; Geurts, B.; Gietema, H.; Krdzalic, J.; Schaefer-Prokop, C.; et al. CO-RADS: A Categorical CT Assessment Scheme for Patients Suspected of Having COVID-19—Definition and Evaluation. Radiology 2020, 296, E97–E104. [Google Scholar] [CrossRef] [PubMed]
- Li, K.; Wu, J.; Wu, F.; Guo, D.; Chen, L.; Fang, Z.; Li, C. The Clinical and Chest CT Features Associated with Severe and Critical COVID-19 Pneumonia. Investig. Radiol. 2020, 55, 327–331. [Google Scholar] [CrossRef] [PubMed]
- Yin, X.; Min, X.; Nan, Y.; Feng, Z.; Li, B.; Cai, W.; Xi, X.; Wang, L. Assessment of the Severity of Coronavirus Disease: Quantitative Computed Tomography Parameters versus Semiquantitative Visual Score. Korean J. Radiol. 2020, 21, 998–1006. [Google Scholar] [CrossRef] [PubMed]
- Soomro, T.A.; Zheng, L.; Afifi, A.J.; Ali, A.; Yin, M.; Gao, J. Artificial intelligence (AI) for medical imaging to combat coronavirus disease (COVID-19): A detailed review with direction for future research. Artif. Intell. Rev. 2021, 55, 1409–1439. [Google Scholar] [CrossRef]
- Chaganti, S.; Grenier, P.; Balachandran, A.; Chabin, G.; Cohen, S.; Flohr, T.; Georgescu, B.; Grbic, S.; Liu, S.; Mellot, F.; et al. Automated Quantification of CT Patterns Associated with COVID-19 from Chest CT. Radiol. Artif. Intell. 2020, 2, e200048. [Google Scholar] [CrossRef]
- Mei, X.; Lee, H.-C.; Diao, K.-Y.; Huang, M.; Lin, B.; Liu, C.; Xie, Z.; Ma, Y.; Robson, P.M.; Chung, M.; et al. Artificial intelligence–enabled rapid diagnosis of patients with COVID-19. Nat. Med. 2020, 26, 1224–1228. [Google Scholar] [CrossRef]
- Stegeman, I.; Ochodo, E.A.; Guleid, F.; Holtman, G.A.; Yang, B.; Davenport, C.; Deeks, J.J.; Dinnes, J.; Dittrich, S.; Emperador, D.; et al. Cochrane COVID-19 Diagnostic Test Accuracy Group. Routine laboratory testing to determine if a patient has COVID-19. Cochrane Database Syst. Rev. 2020, 2020, CD013787. [Google Scholar] [CrossRef]
- Peker, Y.; Celik, Y.; Arbatli, S.; Isik, S.R.; Balcan, B.; Karataş, F.; Uzel, F.I.; Tabak, L.; Çetin, B.; Baygül, A.; et al. Effect of High-Risk Obstructive Sleep Apnea on Clinical Outcomes in Adults with Coronavirus Disease 2019: A Multicenter, Prospective, Observational Clinical Trial. Ann. Am. Thorac. Soc. 2021, 18, 1548–1559. [Google Scholar] [CrossRef] [PubMed]
- Yacoub, B.; Varga-Szemes, A.; Schoepf, U.J.; Kabakus, I.M.; Baruah, D.; Burt, J.R.; Aquino, G.J.; Sullivan, A.K.; Doherty, J.O.; Hoelzer, P.; et al. Impact of Artificial Intelligence Assistance on Chest CT Interpretation Times: A Prospective Randomized Study. Am. J. Roentgenol. 2022, 219, 743–751. [Google Scholar] [CrossRef] [PubMed]
- Harmon, S.A.; Sanford, T.H.; Xu, S.; Turkbey, E.B.; Roth, H.; Xu, Z.; Yang, D.; Myronenko, A.; Anderson, V.; Amalou, A.; et al. Artificial intelligence for the detection of COVID-19 pneumonia on chest CT using multinational datasets. Nat. Commun. 2020, 11, 4080. [Google Scholar] [CrossRef] [PubMed]
- Li, L.; Qin, L.; Xu, Z.; Yin, Y.; Wang, X.; Kong, B.; Bai, J.; Lu, Y.; Fang, Z.; Song, Q.; et al. Using artificial intelligence to detect COVID-19 and community-acquired pneumonia based on pulmonary CT: Evaluation of the diagnostic accuracy. Radiology 2020, 296, E65–E71. [Google Scholar] [CrossRef] [PubMed]
- Kardos, A.S.; Simon, J.; Nardocci, C.; Szabó, I.V.; Nagy, N.; Abdelrahman, R.H.; Zsarnóczay, E.; Fejér, B.; Futácsi, B.; Müller, V.; et al. The diagnostic performance of deep-learning-based CT severity score to identify COVID-19 pneumonia. Br. J. Radiol. 2021, 95, 20210759. [Google Scholar] [CrossRef]
- Chrzan, R.; Wizner, B.; Sydor, W.; Wojciechowska, W.; Popiela, T.; Bociąga-Jasik, M.; Olszanecka, A.; Strach, M. Artificial intelligence guided HRCT assessment predicts the severity of COVID-19 pneumonia based on clinical parameters. BMC Infect. Dis. 2023, 23, 314. [Google Scholar] [CrossRef] [PubMed]
- Sezer, R.; Esendagli, D.; Erol, C.; Hekimoglu, K. New challenges for management of COVID-19 patients: Analysis of MDCT based “Automated pneumonia analysis program”. Eur. J. Radiol. Open 2021, 8, 100370. [Google Scholar] [CrossRef] [PubMed]
- Isaacs, D. Artificial intelligence in health care. J. Paediatr. Child Health 2020, 56, 1493–1495. [Google Scholar] [CrossRef]
- Khanna, N.N.; Maindarkar, M.A.; Viswanathan, V.; Fernandes, J.F.E.; Paul, S.; Bhagawati, M.; Ahluwalia, P.; Ruzsa, Z.; Sharma, A.; Kolluri, R.; et al. Economics of Artificial Intelligence in Healthcare: Diagnosis vs. Treatment. Healthcare 2022, 10, 2493. [Google Scholar] [CrossRef]


| Variables | All Patients n= 221 | SS < 2.65 n = 101 | SS ≥ 2.65 n = 120 | p-Value |
|---|---|---|---|---|
| SS | 3.3 (0.5–9.4) | 0.3 (0.1–1.2) | 8.8 (4.4–16.4) | <0.001 |
| Age, years | 53.5 (40.6–62.5) | 45.1 (35.8–58.0) | 55.5 (49.5–66.6) | <0.001 |
| Age ≥ 65 years | 43 (19.5) | 10 (9.9) | 33 (27.5) | <0.001 |
| Male sex | 130 (58.8) | 55 (54.5) | 75 (62.5) | 0.226 |
| BMI, kg/m2 | 27.1 (24.7–30.9) | 25.9 (23.1–30.1) | 27.8 (25.5–31.29) | <0.001 |
| Obesity | 68 (30.8) | 26 (11.8) | 42 (35) | 0.137 |
| Current smoking | 19 (9.2) | 8 (8.3) | 11 (9.9) | 0.695 |
| Diabetes mellitus | 32 (14.5) | 8 (7.9) | 24 (20.0) | 0.011 |
| Hypertension | 75 (33.9) | 24 (23.8) | 51 (42.5) | 0.003 |
| Congestive heart failure | 3 (1.4) | 0 (0) | 3 (2.5) | 0.252 |
| Atrial fibrillation | 3 (1.4) | 0 (0) | 3 (2.5) | 0.252 |
| Coronary artery disease | 17 (7.7) | 4 (4.0) | 13 (10.8) | 0.075 |
| COPD | 5 (2.3) | 3 (3.0) | 2 (1.7) | 0.662 |
| Asthma | 5 (2.3) | 2 (2.0) | 3 (2.5) | 1 |
| ICU | 14 (6.3) | 4 (4.0) | 10 (8.3) | 0.268 |
| Supplemental oxygen | 58 (26.2) | 11 (10.9) | 47 (39.2) | <0.001 |
| Hospitalization | 152 (68.8) | 56 (55.4) | 96 (80.0) | <0.001 |
| Parameter | All Patients n = 221 | SS < 2.65 n = 101 | SS ≥ 2.65 n = 120 | p-Value |
|---|---|---|---|---|
| Fever ≥ 38 °C, n (%) | 162 (73.3) | 68 (67.3) | 94 (78.3) | 0.065 |
| Cough, n (%) | 137 (62.0) | 62 (61.4) | 75 (62.5) | 0.865 |
| Dyspnea, n (%) | 63 (28.5) | 20 (19.8) | 43 (35.8) | 0.009 |
| Fatigue, n (%) | 92 (41.6) | 39 (38.6) | 53 (44.2) | 0.404 |
| PCR positivity at admission, n (%) | 103 (46.6) | 50 (49.5) | 53 (44.2) | 0.428 |
| Hemoglobin, g/dL | 13.6 (12.6–14.5) | 13.5 (12.7–14.5) | 13.7 (12.3–14.4) | 0.696 |
| WBC, 109/L | 5.7 (4.5–7.6) | 5.4 (4.3–7.6) | 6.0 (4.6–7.6) | 0.581 |
| Platelets, 109/L | 203 (165–240) | 211 (172–260) | 198 (164–263) | 0.462 |
| CRP, mg/dL | 25.8 (6.8–51.9) | 10.3 (2.4–27.0) | 39.9 (19.8–82.8) | <0.001 |
| Odds Ratio | 95% CI for Odds Ratio | p–Value | |||
|---|---|---|---|---|---|
| Lower | Upper | ||||
| Need forSupplemental Oxygen | |||||
| Severity score ≥ 2.65 | 3.98 | 1.80 | 8.78 | <0.001 | |
| Age | 1.02 | 0.99 | 1.05 | 0.13 | |
| BMI | 1.10 | 1.02 | 1.19 | 0.01 | |
| Male sex | 2.53 | 1.19 | 5.38 | 0.02 | |
| Hypertension | 2.18 | 0.99 | 4.79 | 0.05 | |
| Diabetes | 0.80 | 0.30 | 2.10 | 0.65 | |
| CAD | 0.31 | 0.08 | 1.13 | 0.08 | |
| Need for Hospitalization | |||||
| Severity score ≥ 2.65 | 2.40 | 1.23 | 4.71 | 0.01 | |
| Age | 1.04 | 1.01 | 1.06 | 0.01 | |
| BMI | 0.92 | 0.86 | 0.98 | 0.02 | |
| Male sex | 1.44 | 0.76 | 2.72 | 0.27 | |
| Hypertension | 2.32 | 0.96 | 5.60 | 0.06 | |
| Diabetes | 3.16 | 0.80 | 12.49 | 0.10 | |
| CAD | 0.43 | 0.09 | 1.96 | 0.27 | |
Disclaimer/Publisher’s Note: The statements, opinions and data contained in all publications are solely those of the individual author(s) and contributor(s) and not of MDPI and/or the editor(s). MDPI and/or the editor(s) disclaim responsibility for any injury to people or property resulting from any ideas, methods, instructions or products referred to in the content. |
© 2023 by the authors. Licensee MDPI, Basel, Switzerland. This article is an open access article distributed under the terms and conditions of the Creative Commons Attribution (CC BY) license (https://creativecommons.org/licenses/by/4.0/).
Share and Cite
Atceken, Z.; Celik, Y.; Atasoy, C.; Peker, Y. The Diagnostic Utility of Artificial Intelligence-Guided Computed Tomography-Based Severity Scores for Predicting Short-Term Clinical Outcomes in Adults with COVID-19 Pneumonia. J. Clin. Med. 2023, 12, 7039. https://doi.org/10.3390/jcm12227039
Atceken Z, Celik Y, Atasoy C, Peker Y. The Diagnostic Utility of Artificial Intelligence-Guided Computed Tomography-Based Severity Scores for Predicting Short-Term Clinical Outcomes in Adults with COVID-19 Pneumonia. Journal of Clinical Medicine. 2023; 12(22):7039. https://doi.org/10.3390/jcm12227039
Chicago/Turabian StyleAtceken, Zeynep, Yeliz Celik, Cetin Atasoy, and Yüksel Peker. 2023. "The Diagnostic Utility of Artificial Intelligence-Guided Computed Tomography-Based Severity Scores for Predicting Short-Term Clinical Outcomes in Adults with COVID-19 Pneumonia" Journal of Clinical Medicine 12, no. 22: 7039. https://doi.org/10.3390/jcm12227039