

Postoperative Discharge Destination Impacts 30-Day Outcomes: A National Surgical Quality Improvement Program Multi-Specialty Surgical Cohort Analysis
 , , , , and
Abstract
:1. Introduction
2. Materials and Methods
2.1. Data Source
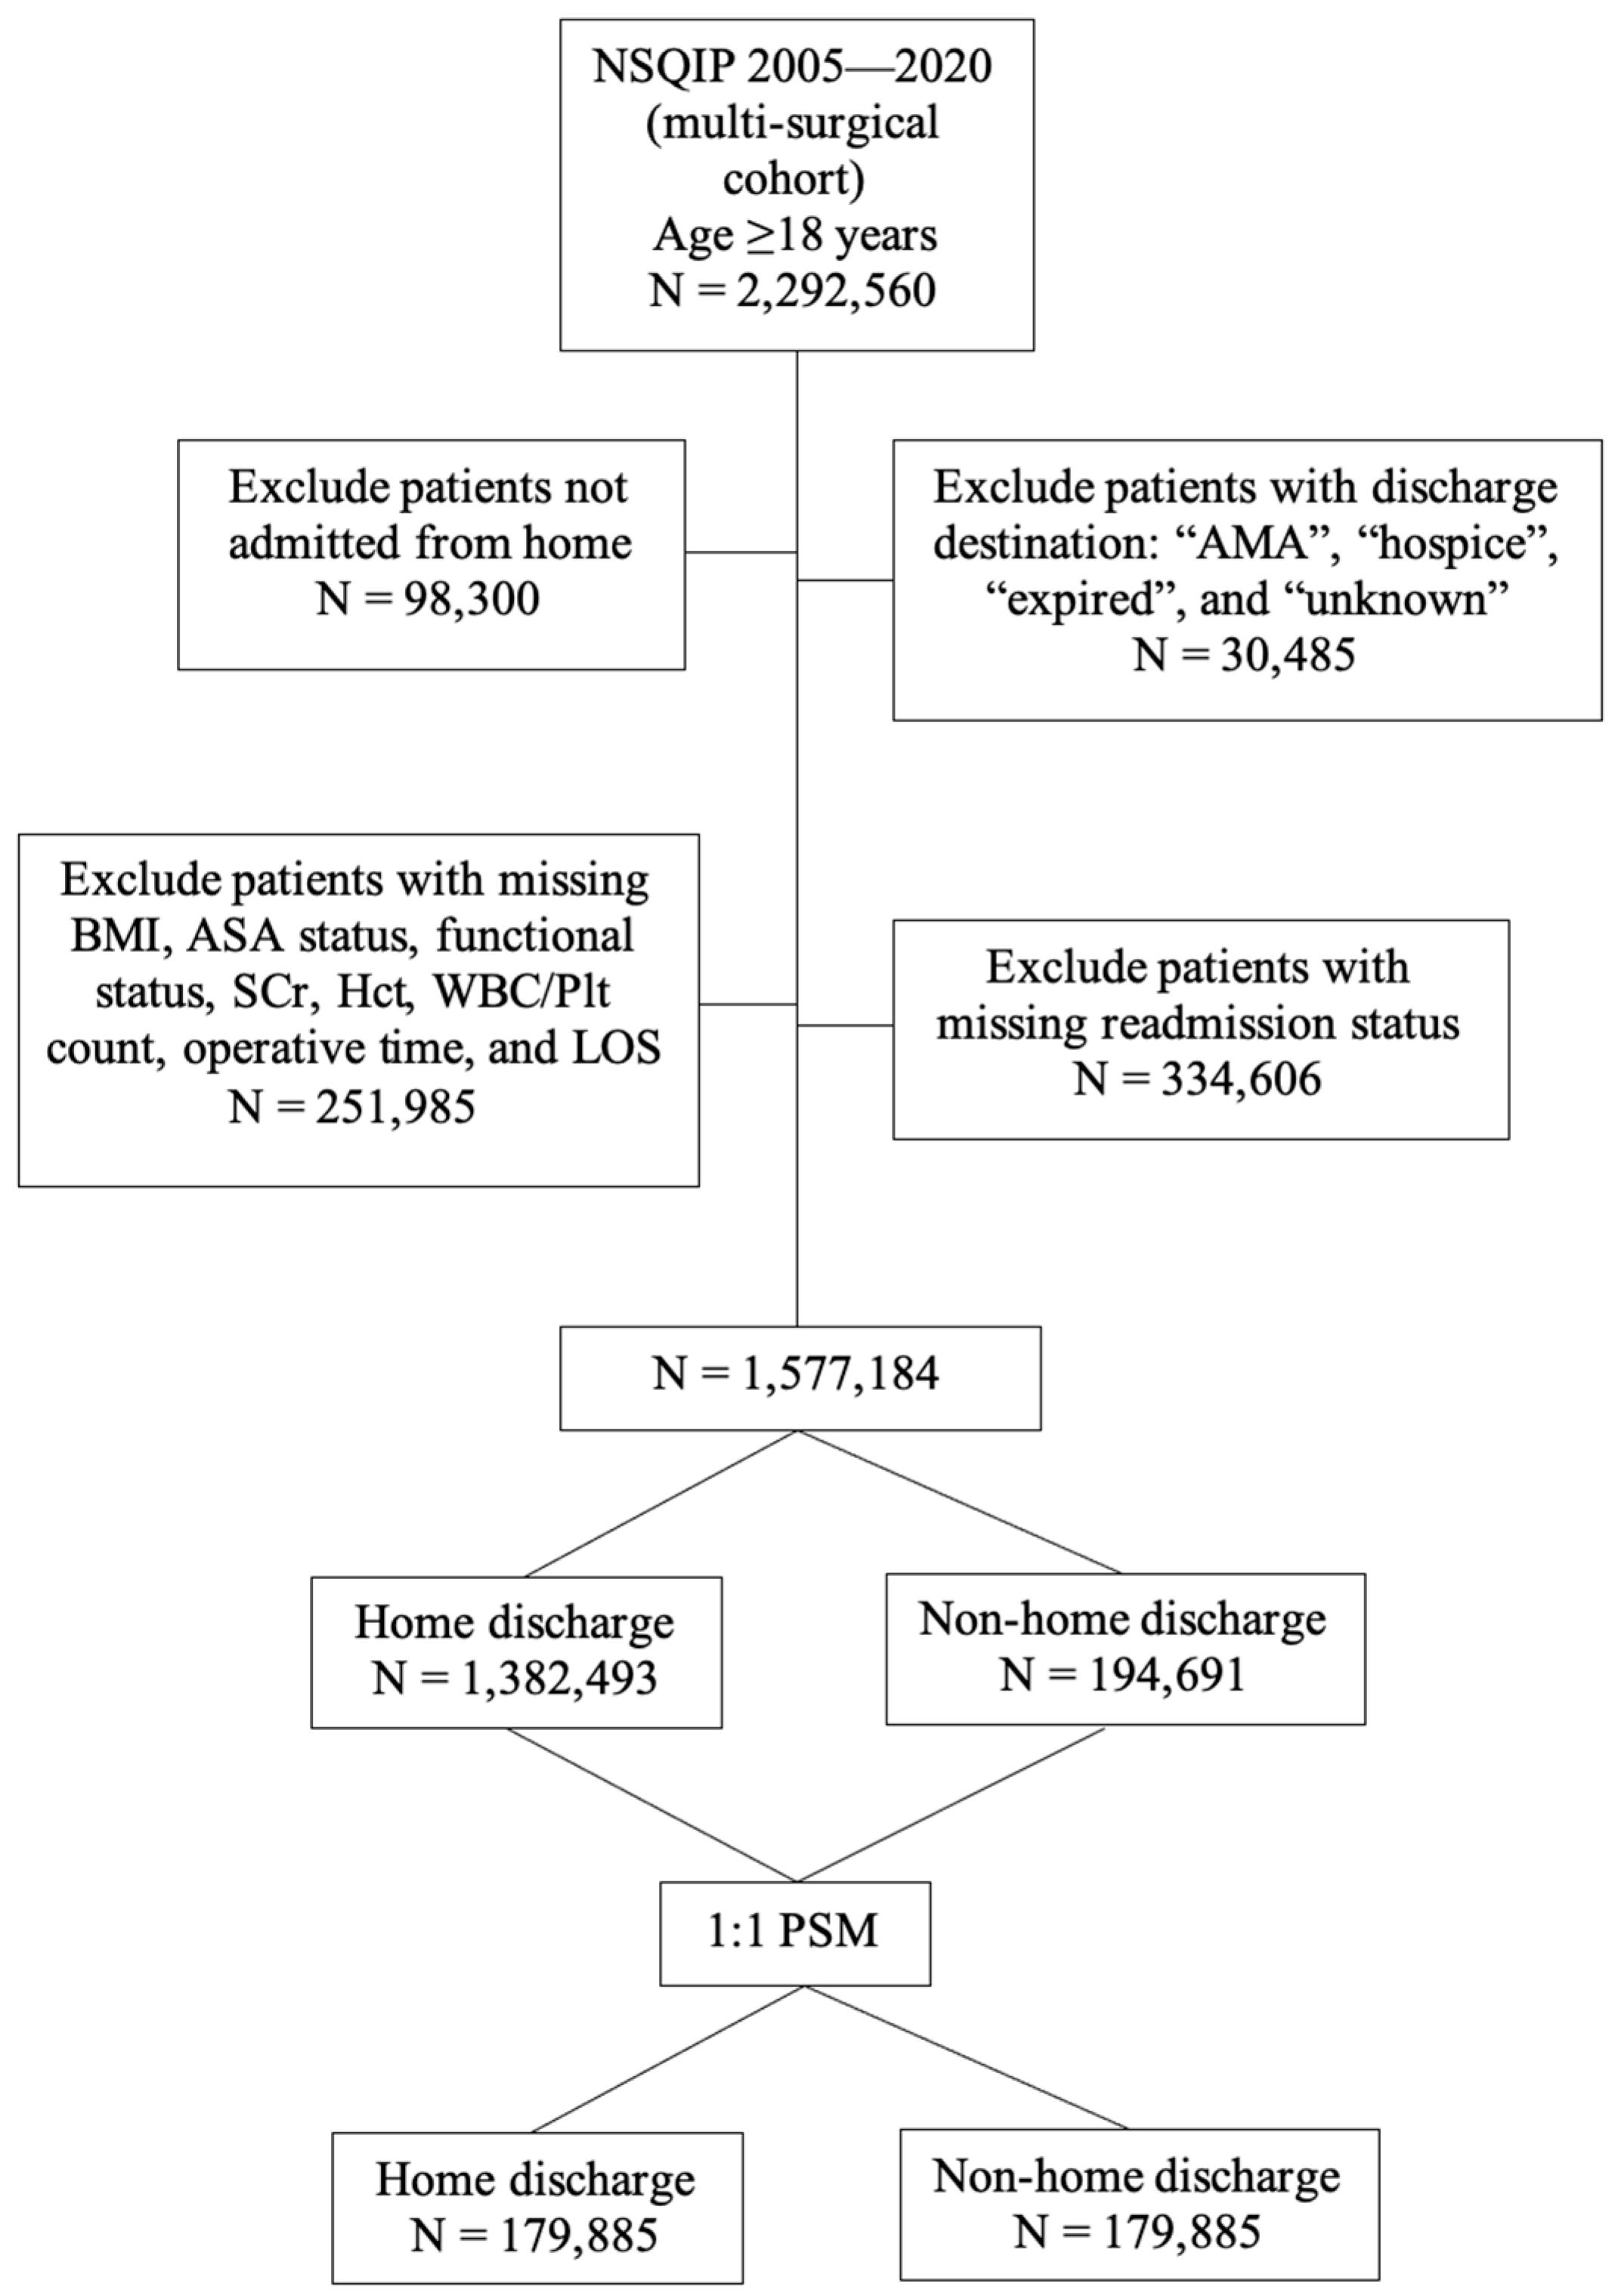
2.2. Cohort Selection
2.3. Outcome
2.4. Exposure
2.5. Covariates
2.6. Statistical Analysis
3. Results
3.1. Patient Demographics and Outcomes
3.2. Patient Characteristics Stratified by Discharge Destination
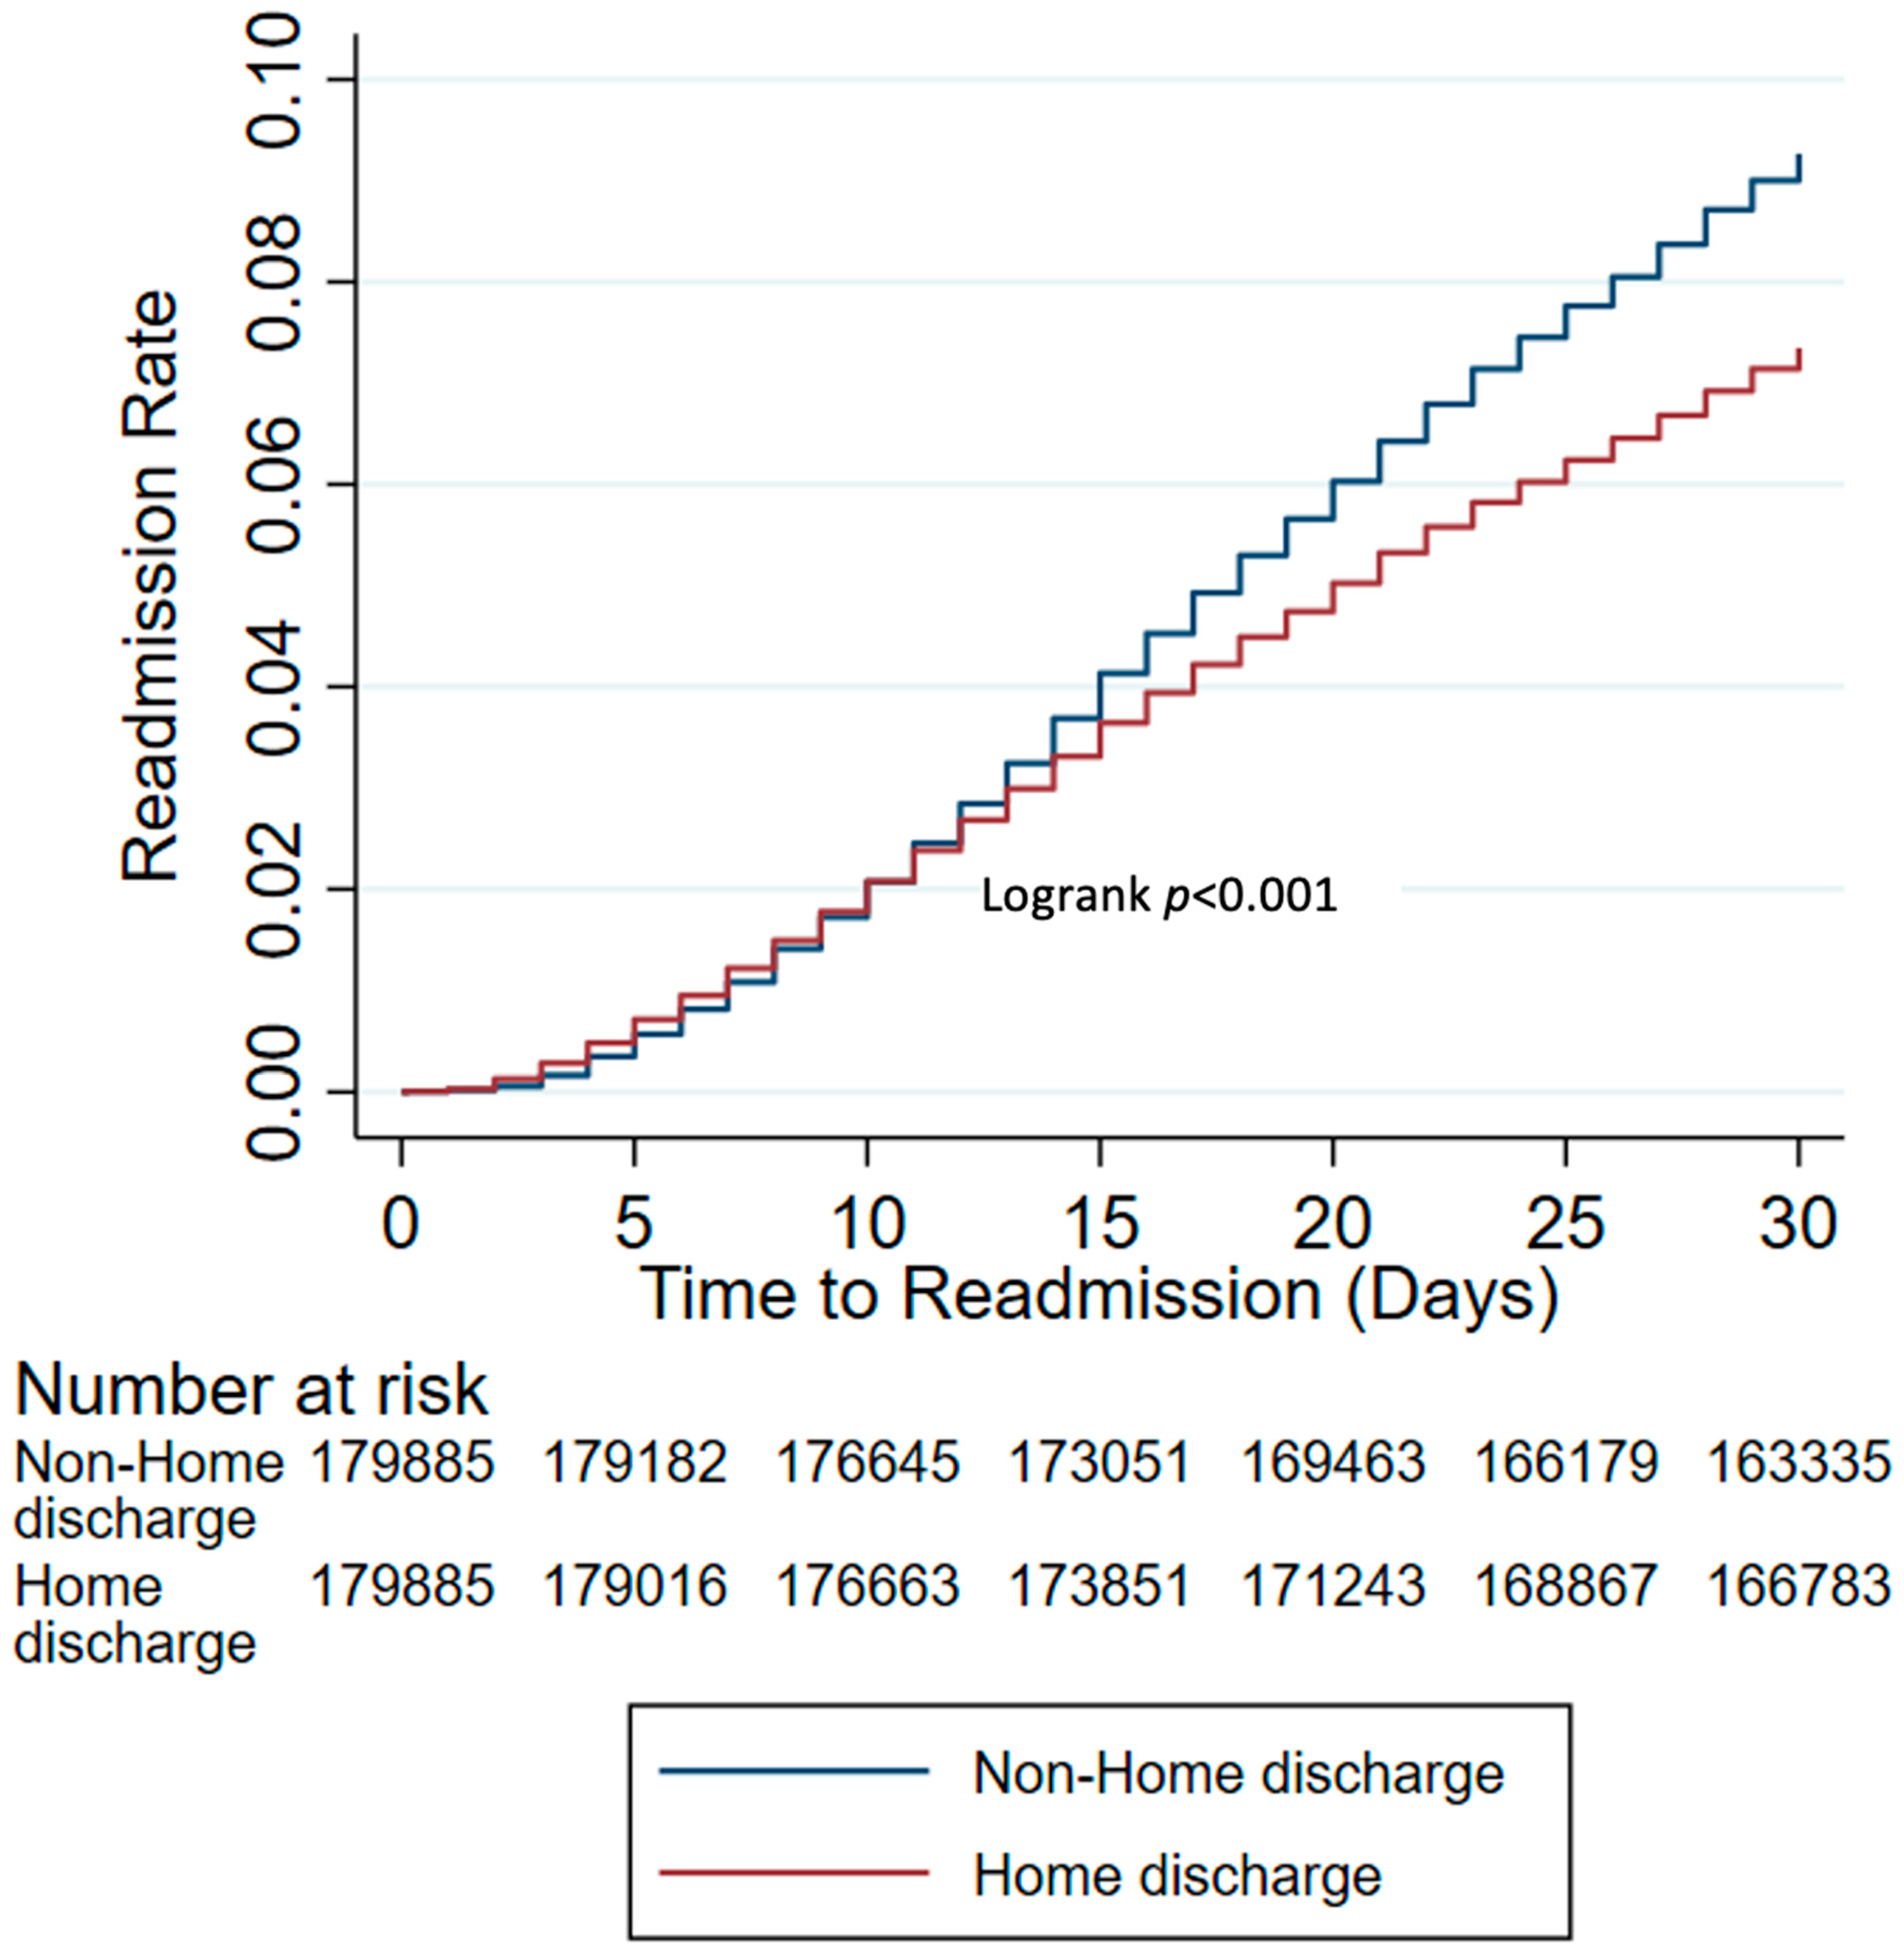
3.3. Readmission Rates and Post-Discharge Complications Stratified by Discharge Destination after PSM
4. Discussion
Supplementary Materials
Author Contributions
Funding
Institutional Review Board Statement
Informed Consent Statement
Data Availability Statement
Conflicts of Interest
References
- Center for Medicare and Medicaid Services. Bundled Payments for Care Improvement (BPCI) Quality Measures Fact Sheet. Available online: https://www.cms.gov/priorities/innovation/media/document/bpci-adv-quality-infographic (accessed on 10 September 2023).
- Jencks, S.F.; Williams, M.V.; Coleman, E.A. Rehospitalizations among patients in the Medicare fee-for-service program. N. Engl. J. Med. 2009, 360, 1418–1428. [Google Scholar] [CrossRef] [PubMed]
- Weiss, A.J.; Jiang, H.J. Overview of clinical conditions with frequent and costly hospital readmissions by payer, 2018. In Healthcare Cost and Utilization Project (HCUP) Statistical Briefs; Healthcare Cost and Utilization Project (HCUP): Rockville, MD, USA, 2006. [Google Scholar]
- Centers for Medicare & Medicaid Services. Hospital Readmissions Reduction Program (HRRP). Available online: https://www.cms.gov/Medicare/Medicare-Fee-for-Service-Payment/AcuteInpatientPPS/Readmissions-Reduction-Program (accessed on 10 September 2023).
- Lucas, D.J.; Haider, A.; Haut, E.; Dodson, R.; Wolfgang, C.L.; Ahuja, N.; Sweeney, J.; Pawlik, T.M. Assessing readmission after general, vascular, and thoracic surgery using ACS-NSQIP. Ann. Surg. 2013, 258, 430–439. [Google Scholar] [CrossRef] [PubMed]
- Sacks, G.D.; Lawson, E.H.; Dawes, A.J.; Gibbons, M.M.; Zingmond, D.S.; Ko, C.Y. Which Patients Require More Care after Hospital Discharge? An Analysis of Post-Acute Care Use among Elderly Patients Undergoing Elective Surgery. J. Am. Coll. Surg. 2015, 220, 1113–1121.e2. [Google Scholar] [CrossRef] [PubMed]
- Merkow, R.P.; Ju, M.H.; Chung, J.W.; Hall, B.L.; Cohen, M.E.; Williams, M.V.; Tsai, T.C.; Ko, C.Y.; Bilimoria, K.Y. Underlying reasons associated with hospital readmission following surgery in the United States. JAMA 2015, 313, 483–495. [Google Scholar] [CrossRef] [PubMed]
- American College of Surgeons National Surgical Quality Improvement Program (ACS NSQIP): Frequently Asked Questions. Available online: https://www.facs.org/quality-programs/data-and-registries/acs-nsqip/faq/ (accessed on 10 September 2023).
- Benchimol, E.I.; Smeeth, L.; Guttmann, A.; Harron, K.; Moher, D.; Petersen, I.; Sørensen, H.T.; von Elm, E.; Langan, S.M. The REporting of studies Conducted using Observational Routinely-collected health Data (RECORD) statement. PLoS Med. 2015, 12, e1001885. [Google Scholar] [CrossRef]
- Von Elm, E.; Altman, D.G.; Egger, M.; Pocock, S.J.; Gøtzsche, P.C.; Vandenbroucke, J.P. The Strengthening the Reporting of Observational Studies in Epidemiology (STROBE) statement: Guidelines for reporting observational studies. Ann. Intern. Med. 2007, 147, 573–577. [Google Scholar] [CrossRef]
- American College of Surgeons. ACS NSQIP Operations Manual: Chapter 4—Variables and Definitions; American College of Surgeons: Chicago, IL, USA, 2021. [Google Scholar]
- Weir, C.B.; Jan, A. BMI Classification Percentile and Cut Off Points; StatPearls: Treasure Island, FL, USA, 2022. [Google Scholar]
- Levey, A.S.; Stevens, L.A.; Schmid, C.H.; Zhang, Y.L.; Castro, A.F., 3rd; Feldman, H.I.; Kusek, J.W.; Eggers, P.; Van Lente, F.; Greene, T.; et al. A new equation to estimate glomerular filtration rate. Ann. Intern. Med. 2009, 150, 604–612. [Google Scholar] [CrossRef]
- Stevens, P.E.; Levin, A. Kidney Disease: Improving Global Outcomes Chronic Kidney Disease Guideline Development Work Group M. Evaluation and management of chronic kidney disease: Synopsis of the kidney disease: Improving global outcomes 2012 clinical practice guideline. Ann. Int. Med. 2013, 158, 825–830. [Google Scholar] [CrossRef]
- Wallis, C.J.; Bjarnason, G.; Byrne, J.; Cheung, D.C.; Hoffman, A.; Kulkarni, G.S.; Nathens, A.B.; Nam, R.K.; Satkunasivam, R. Morbidity and Mortality of Radical Nephrectomy for Patients with Disseminated Cancer: An Analysis of the National Surgical Quality Improvement Program Database. Urology 2016, 95, 95–102. [Google Scholar] [CrossRef]
- VanderWeele, T.J.; Ding, P. Sensitivity Analysis in Observational Research: Introducing the E-Value. Ann. Int. Med. 2017, 167, 268–274. [Google Scholar] [CrossRef]
- Haneuse, S.; VanderWeele, T.J.; Arterburn, D. Using the E-Value to Assess the Potential Effect of Unmeasured Confounding in Observational Studies. JAMA 2019, 321, 602–603. [Google Scholar] [CrossRef]
- VanderWeele, T.J.; Mathur, M.B. Commentary: Developing best-practice guidelines for the reporting of E-values. Int. J. Epidemiol. 2020, 49, 1495–1497. [Google Scholar] [CrossRef] [PubMed]
- Burke, R.E.; Ibrahim, S.A. Discharge Destination and Disparities in Postoperative Care. JAMA 2018, 319, 1653–1654. [Google Scholar] [CrossRef] [PubMed]
- Hood, C.M.; Gennuso, K.P.; Swain, G.R.; Catlin, B.B. County Health Rankings: Relationships Between Determinant Factors and Health Outcomes. Am. J. Prev. Med. 2016, 50, 129–135. [Google Scholar] [CrossRef]
- Mehta, B.; Goodman, S.; Ho, K.; Parks, M.; Ibrahim, S.A. Community Deprivation Index and Discharge Destination After Elective Hip Replacement. Arthritis Care Res. 2021, 73, 531–539. [Google Scholar] [CrossRef]
- Burke, R.E.; Canamucio, A.; Medvedeva, E.; Hume, E.L.; Navathe, A.S. Association of Discharge to Home vs Institutional Postacute Care with Outcomes After Lower Extremity Joint Replacement. JAMA Netw. Open 2020, 3, e2022382. [Google Scholar] [CrossRef] [PubMed]
- Strosberg, D.S.; Housley, B.C.; Vazquez, D.; Rushing, A.; Steinberg, S.; Jones, C. Discharge destination and readmission rates in older trauma patients. J. Surg. Res. 2017, 207, 27–32. [Google Scholar] [CrossRef]
- Stitzenberg, K.B.; Chang, Y.; Smith, A.B.; Nielsen, M.E. Exploring the burden of inpatient readmissions after major cancer surgery. J. Clin. Oncol. 2015, 33, 455–464. [Google Scholar] [CrossRef]
- Roger, C.; Debuyzer, E.; Dehl, M.; Bulaïd, Y.; Lamrani, A.; Havet, E.; Mertl, P. Factors associated with hospital stay length, discharge destination, and 30-day readmission rate after primary hip or knee arthroplasty: Retrospective Cohort Study. Orthop. Traumatol. Surg. Res. 2019, 105, 949–955. [Google Scholar] [CrossRef]
- Lakomkin, N.; Hadjipanayis, C.G. Non-routine discharge disposition is associated with post-discharge complications and 30-day readmissions following craniotomy for brain tumor resection. J. Neurooncol. 2018, 136, 595–604. [Google Scholar] [CrossRef]
- Dasenbrock, H.H.; Yan, S.C.; Smith, T.R.; Valdes, P.A.; Gormley, W.B.; Claus, E.B.; Dunn, I.F. Readmission After Craniotomy for Tumor: A National Surgical Quality Improvement Program Analysis. Neurosurgery 2017, 80, 551–562. [Google Scholar] [CrossRef] [PubMed]
- Bourgouin, S.; Mancini, J.; Monchal, T.; Bordes, J.; Balandraud, P. Response to “individualized care in patients undergoing laparoscopic cholecystectomy”. Am. J. Surg. 2019, 218, 1029. [Google Scholar] [CrossRef] [PubMed]
- Crouser, N.; Malik, A.T.; Jain, N.; Yu, E.; Kim, J.; Khan, S.N. Discharge to Inpatient Care Facility After Vertebroplasty/Kyphoplasty: Incidence, Risk Factors, and Postdischarge Outcomes. World Neurosurg. 2018, 118, e483–e488. [Google Scholar] [CrossRef] [PubMed]
- Werner, R.M.; Coe, N.B.; Qi, M.; Konetzka, R.T. Patient Outcomes After Hospital Discharge to Home with Home Health Care vs to a Skilled Nursing Facility. JAMA Int. Med. 2019, 179, 617–623. [Google Scholar] [CrossRef] [PubMed]
- Mechanic, R. Post-acute care—The next frontier for controlling Medicare spending. N. Engl. J. Med. 2014, 370, 692–694. [Google Scholar] [CrossRef]
- Hansen, L.O.; Young, R.S.; Hinami, K.; Leung, A.; Williams, M.V. Interventions to reduce 30-day rehospitalization: A systematic review. Ann. Intern. Med. 2011, 155, 520–528. [Google Scholar] [CrossRef]
- Levinson, D.R. Adverse Events in Skilled Nursing Facilities: National Incidence among Medicare Beneficiaries. Department of Health and Human Services—Office of Inspector General. 2014. Available online: https://oig.hhs.gov/oei/reports/oei-06-11-00370.pdf (accessed on 10 September 2023).
- Thornblade, L.W.; Arbabi, S.; Flum, D.R.; Qiu, Q.; Fawcett, V.J.; Davidson, G.H. Facility-level factors and outcomes after skilled nursing facility admission for trauma and surgical patients. J. Am. Med. Dir. Assoc. 2018, 19, 70–76.e1. [Google Scholar] [CrossRef]
- Burke, J.R.; Downey, C.; Almoudaris, A.M. Failure to Rescue Deteriorating Patients: A Systematic Review of Root Causes and Improvement Strategies. J. Patient Saf. 2022, 18, e140–e155. [Google Scholar] [CrossRef]
- Chandra, A.; Rahman, P.A.; Sneve, A.; McCoy, R.G.; Thorsteinsdottir, B.; Chaudhry, R.; Storlie, C.B.; Murphree, D.H.; Hanson, G.J.; Takahashi, P.Y. Risk of 30-Day Hospital Readmission Among Patients Discharged to Skilled Nursing Facilities: Development and Validation of a Risk-Prediction Model. J. Am. Med. Dir. Assoc. 2019, 20, 444–450.e2. [Google Scholar] [CrossRef]
- Chandra, A.; Visscher, S.L.; Lackore, K.A.; Chaudhry, R.; Takahashi, P.Y.; Hanson, G.J.; Borah, B.J. Health Care Costs and Utilization Predictions by the Skilled Nursing Facility Readmission Risk Instrument. J. Am. Med. Dir. Assoc. 2021, 22, 2154–2159.e1. [Google Scholar] [CrossRef]
- Singh, A.B.; Bronsert, M.R.; Henderson, W.G.; Lambert-Kerzner, A.; Hammermeister, K.E.; Meguid, R.A. Accurate Preoperative Prediction of Discharge Destination Using 8 Predictor Variables: A NSQIP Analysis. J. Am. Coll. Surg. 2020, 230, 64–75.e2. [Google Scholar] [CrossRef] [PubMed]
- Gibula, D.R.; Singh, A.B.; Bronsert, M.R.; Henderson, W.G.; Battaglia, C.; Hammermeister, K.E.; Glebova, N.O.; Meguid, R.A. Accurate preoperative prediction of unplanned 30-day postoperative readmission using 8 predictor variables. Surgery 2019, 166, 812–819. [Google Scholar] [CrossRef]
- Lacquaniti, A.; Ceresa, F.; Campo, S.; Barbera, G.; Caruso, D.; Palazzo, E.; Patanè, F.; Monardo, P. Acute Kidney Injury and Sepsis after Cardiac Surgery: The Roles of Tissue Inhibitor Metalloproteinase-2, Insulin-like Growth Factor Binding Protein-7, and Mid-Regional Pro-Adrenomedullin. J. Clin. Med. 2023, 12, 5193. [Google Scholar] [CrossRef] [PubMed]
- Chudgar, N.P.; Zhu, R.; Gray, K.D.; Chiu, R.; Carrera, A.D.; Lang, S.J.; Avgerinos, D.V.; Mack, C.A. Implementing a High-Value Care Discharge Protocol in Patients Undergoing CABG Reduces Readmission. Ann. Thorac. Surg. 2022, 113, 1112–1118. [Google Scholar] [CrossRef] [PubMed]
- Spiera, Z.; Ilonzo, N.; Kaplan, H.; Leitman, I.M. Loss of independence as a metric for racial disparities in lower extremity amputation for diabetes: A National Surgery Quality Improvement Program (NSQIP) analysis. J. Diabetes Complicat. 2022, 36, 108105. [Google Scholar] [CrossRef] [PubMed]
- Inneh, I.A.; Clair, A.J.; Slover, J.D.; Iorio, R. Disparities in Discharge Destination After Lower Extremity Joint Arthroplasty: Analysis of 7924 Patients in an Urban Setting. J. Arthroplast. 2016, 31, 2700–2704. [Google Scholar] [CrossRef] [PubMed]
- Balentine, C.J.; Naik, A.D.; Robinson, C.N.; Petersen, N.J.; Chen, G.J.; Berger, D.H.; Anaya, D.A. Association of high-volume hospitals with greater likelihood of discharge to home following colorectal surgery. JAMA Surg. 2014, 149, 244–251. [Google Scholar] [CrossRef]
- Morris, M.S.; Deierhoi, R.J.; Richman, J.S.; Altom, L.K.; Hawn, M.T. The relationship between timing of surgical complications and hospital readmission. JAMA Surg. 2014, 149, 348–354. [Google Scholar] [CrossRef]


| Total | Discharge Destination | SMD * | ||
|---|---|---|---|---|
| Non-Home | Home | |||
| n = 1,577,184 | n = 194,691 | n = 1,382,493 | ||
| Age (years), mean (SD) | 62.03 (13.53) | 71.19 (11.10) | 60.74 (13.34) | 0.852 |
| Sex | −0.025 | |||
| Female | 945,997 (59.98) | 118,856 (61.05) | 827,141 (59.83) | |
| Male | 631,187 (40.02) | 75,835 (38.95) | 555,352 (40.17) | |
| Race | −0.226 | |||
| White | 1,131,596 (71.75) | 148,368 (76.21) | 983,228 (71.12) | |
| Black | 151,101 (9.58) | 25,820 (13.26) | 125,281 (9.06) | |
| Others | 54,849 (3.48) | 5406 (2.78) | 49,443 (3.58) | |
| Unknown | 239,638 (15.19) | 15,097 (7.75) | 224,541 (16.24) | |
| Hispanic ethnicity | −0.176 | |||
| Yes | 99,874 (6.33) | 11,235 (5.77) | 88,639 (6.41) | |
| No | 1,249,645 (79.23) | 168,856 (86.73) | 1,080,789 (78.18) | |
| Unknown | 227,665 (14.43) | 14,600 (7.50) | 213,065 (15.41) | |
| BMI | −0.040 | |||
| Underweight (<18.5 kg/m2) | 21,647 (1.37) | 4495 (2.31) | 17,152 (1.24) | |
| Normal (18.5–24.9 kg/m2) | 317,095 (20.11) | 42,227 (21.69) | 274,868 (19.88) | |
| Overweight (25–29.9 kg/m2) | 469,138 (29.75) | 54,609 (28.05) | 414,529 (29.98) | |
| Obesity I (30–34.9 kg/m2) | 365,615 (23.18) | 43,747 (22.47) | 321,868 (23.28) | |
| Obesity II (35–39.9 kg/m2) | 213,230 (13.52) | 26,672 (13.70) | 186,558 (13.49) | |
| Obesity III (≥40 kg/m2) | 190,459 (12.08) | 22,941 (11.78) | 167,518 (12.12) | |
| Hypertension | 866,165 (54.92) | 141,935 (72.90) | 724,230 (52.39) | 0.434 |
| Diabetes mellitus | 285,369 (18.09) | 53,609 (27.54) | 231,760 (16.76) | 0.262 |
| Smoker within the past year | 241,397 (15.31) | 27,507 (14.13) | 213,890 (15.47) | −0.038 |
| ASA Status | 0.575 | |||
| 1—No disturbance | 41,055 (2.60) | 974 (0.50) | 40,081 (2.90) | |
| 2—Mild disturbance | 659,692 (41.83) | 45,720 (23.48) | 613,972 (44.41) | |
| 3—Severe disturbance | 775,482 (49.17) | 116,980 (60.08) | 658,502 (47.63) | |
| 4—Life-threatening disturbance | 99,346 (6.30) | 30,063 (15.44) | 69,283 (5.01) | |
| 5—Moribund | 1609 (0.10) | 954 (0.49) | 655 (0.05) | |
| Congestive heart failure | 12,748 (0.81) | 5024 (2.58) | 7724 (0.56) | 0.163 |
| Chronic obstructive pulmonary disease | 73,469 (4.66) | 17,576 (9.03) | 55,893 (4.04) | 0.203 |
| Functional status | −0.316 | |||
| Independent | 1,548,244 (98.17) | 180,433 (92.68) | 1,367,811 (98.94) | |
| Partially dependent | 25,892 (1.64) | 12,775 (6.56) | 13,117 (0.95) | |
| Totally dependent | 3048 (0.19) | 1483 (0.76) | 1565 (0.11) | |
| Ascites | 3288 (0.21) | 923 (0.47) | 2365 (0.17) | 0.053 |
| Dyspnea | 0.159 | |||
| At rest | 5238 (0.33) | 1648 (0.85) | 3590 (0.26) | |
| Moderate exertion | 100,487 (6.37) | 18,918 (9.72) | 81,569 (5.90) | |
| No | 1,471,459 (93.30) | 174,125 (89.44) | 1,297,334 (93.84) | |
| Bleeding disorder | 57,871 (3.67) | 16,880 (8.67) | 40,991 (2.97) | 0.246 |
| Chronic steroid use | 68,543 (4.35) | 11,174 (5.74) | 57,369 (4.15) | 0.073 |
| >10% weight loss | 29,128 (1.85) | 5064 (2.60) | 24,064 (1.74) | 0.059 |
| Chronic kidney disease | 0.533 | |||
| Stage 1 (≥90 mL/min/1.73 m2) | 605,108 (38.37) | 42,920 (22.05) | 562,188 (40.66) | |
| Stage 2 (60–89 mL/min/1.73 m2) | 718,002 (45.52) | 88,790 (45.61) | 629,212 (45.51) | |
| Stage 3a (45–59 mL/min/1.73 m2) | 157,670 (10.00) | 31,988 (16.43) | 125,682 (9.09) | |
| Stage 3b (30–44 mL/min/1.73 m2) | 62,938 (3.99) | 17,859 (9.17) | 45,079 (3.26) | |
| Stage 4 (15–29 mL/min/1.73 m2) | 18,833 (1.19) | 7318 (3.76) | 11,515 (0.83) | |
| Stage 5 (<15 mL/min/1.73 m2) | 14,633 (0.93) | 5816 (2.99) | 8817 (0.64) | |
| Preoperative hematocrit | −0.374 | |||
| <35 | 227,891 (14.45) | 53,206 (27.33) | 174,685 (12.64) | |
| ≥35 | 1,349,293 (85.55) | 141,485 (72.67) | 1,207,808 (87.36) | |
| Preoperative WBC | 0.194 | |||
| <4 k | 51,968 (3.29) | 5843 (3.00) | 46,125 (3.34) | |
| 4 k–12 k | 1,433,374 (90.88) | 167,151 (85.85) | 1,266,223 (91.59) | |
| ≥12 k | 91,842 (5.82) | 21,697 (11.14) | 70,145 (5.07) | |
| Preoperative platelets | −0.063 | |||
| 150 k | 83,902 (5.32) | 15,424 (7.92) | 68,478 (4.95) | |
| 150 k–450 k | 1,452,973 (92.12) | 172,503 (88.60) | 1,280,470 (92.62) | |
| >450 k | 40,309 (2.56) | 6764 (3.47) | 33,545 (2.43) | |
| Disseminated cancer | 52,799 (3.35) | 4929 (2.53) | 47,870 (3.46) | −0.055 |
| Surgical subspecialty | ||||
| Vascular surgery | 91,995 (5.83) | 28,844 (14.82) | 63,151 (4.57) | 0.352 |
| General surgery | 492,711 (31.24) | 42,235 (21.69) | 450,476 (32.58) | −0.247 |
| Thoracic surgery | 31,405 (1.99) | 1699 (0.87) | 29,706 (2.15) | −0.105 |
| Urology | 57,678 (3.66) | 3760 (1.93) | 53,918 (3.90) | −0.117 |
| Orthopedic surgery | 663,117 (42.04) | 111,905 (57.48) | 551,212 (39.87) | 0.358 |
| Neurosurgery | 4144 (0.26) | 2032 (1.04) | 2112 (0.15) | 0.116 |
| Cardiac surgery | 20,764 (1.32) | 3282 (1.69) | 17,482 (1.26) | 0.035 |
| Gynecology | 215,370 (13.66) | 934 (0.48) | 214,436 (15.51) | −0.577 |
| Operative time (min), median (IQR) | 115 (80–182) | 103 (75–160) | 116 (81–185) | −0.112 |
| Length of stay, median (IQR) | 3 (1–5) | 4 (3–8) | 2 (1–4) | 0.564 |
| Major pre-discharge complications | 31,364 (1.99) | 11,887 (6.11) | 19,477 (1.41) | 0.249 |
| Total | Discharge Destination | SMD * | ||
|---|---|---|---|---|
| Non-Home | Home | |||
| n = 359,770 | n = 179,885 | n = 179,885 | ||
| Age (years), mean (SD) | 70.31 ± 10.99 | 70.82 ± 11.05 | 69.80 ± 10.90 | 0.092 |
| Sex | 0.013 | |||
| Female | 221,251 (61.50) | 110,067 (61.19) | 111,184 (61.81) | |
| Male | 138,519 (38.50) | 69,818 (38.81) | 68,701 (38.19) | |
| Race | −0.024 | |||
| White | 275,247 (76.51) | 138,080 (76.76) | 137,167 (76.25) | |
| Black | 44,272 (12.31) | 22,480 (12.50) | 21,792 (12.11) | |
| Others | 10,351 (2.88) | 5034 (2.80) | 5317 (2.96) | |
| Unknown | 29,900 (8.31) | 14,291 (7.94) | 15,609 (8.68) | |
| Hispanic ethnicity | −0.013 | |||
| Yes | 20,798 (5.78) | 10,256 (5.70) | 10,542 (5.86) | |
| No | 309,984 (86.16) | 155,725 (86.57) | 154,259 (85.75) | |
| Unknown | 28,988 (8.06) | 13,904 (7.73) | 15,084 (8.39) | |
| BMI | −0.013 | |||
| Underweight (<18.5 kg/m2) | 7269 (2.02) | 3756 (2.09) | 3513 (1.95) | |
| Normal (18.5–24.9 kg/m2) | 74,501 (20.71) | 37,700 (20.96) | 36,801 (20.46) | |
| Overweight (25–29.9 kg/m2) | 101,591 (28.24) | 50,624 (28.14) | 50,967 (28.33) | |
| Obesity I (30–34.9 kg/m2) | 82,427 (22.91) | 41,115 (22.86) | 41,312 (22.97) | |
| Obesity II (35–39.9 kg/m2) | 50,602 (14.07) | 25,193 (14.01) | 25,409 (14.13) | |
| Obesity III (≥40 kg/m2) | 43,380 (12.06) | 21,497 (11.95) | 21,883 (12.16) | |
| Hypertension | 256,649 (71.34) | 129,786 (72.15) | 126,863 (70.52) | 0.036 |
| Diabetes mellitus | 93,248 (25.92) | 47,601 (26.46) | 45,647 (25.38) | 0.025 |
| Smoker within the past year | 50,483 (14.03) | 25,160 (13.99) | 25,323 (14.08) | −0.003 |
| ASA Status | 0.063 | |||
| 1—No disturbance | 2403 (0.67) | 966 (0.54) | 1437 (0.80) | |
| 2—Mild disturbance | 93,323 (25.94) | 45,216 (25.14) | 48,107 (26.74) | |
| 3—Severe disturbance | 218,046 (60.61) | 109,150 (60.68) | 108,896 (60.54) | |
| 4—Life-threatening disturbance | 45,012 (12.51) | 23,953 (13.32) | 21,059 (11.71) | |
| 5—Moribund | 986 (0.27) | 600 (0.33) | 386 (0.21) | |
| Congestive heart failure | 6928 (1.93) | 3805 (2.12) | 3123 (1.74) | 0.028 |
| Chronic obstructive pulmonary disease | 29,689 (8.25) | 15,222 (8.46) | 14,467 (8.04) | 0.015 |
| Functional status | −0.051 | |||
| Independent | 341,278 (94.86) | 169,626 (94.30) | 171,652 (95.42) | |
| Partially dependent | 16,614 (4.62) | 9271 (5.15) | 7343 (4.08) | |
| Totally dependent | 1878 (0.52) | 988 (0.55) | 890 (0.49) | |
| Ascites | 1384 (0.38) | 734 (0.41) | 650 (0.36) | 0.008 |
| Dyspnea | 0.012 | |||
| At rest | 2315 (0.64) | 1340 (0.74) | 975 (0.54) | |
| Moderate exertion | 33,498 (9.31) | 16,879 (9.38) | 16,619 (9.24) | |
| No | 323,957 (90.05) | 161,666 (89.87) | 162,291 (90.22) | |
| Bleeding disorder | 26,270 (7.30) | 13,843 (7.70) | 12,427 (6.91) | 0.030 |
| Chronic steroid use | 19,492 (5.42) | 9892 (5.50) | 9600 (5.34) | 0.007 |
| >10% weight loss | 8384 (2.33) | 4313 (2.40) | 4071 (2.26) | 0.009 |
| Chronic kidney disease | 0.056 | |||
| Stage 1 (≥90 mL/min/1.73 m2) | 84,879 (23.59) | 40,929 (22.75) | 43,950 (24.43) | |
| Stage 2 (60–89 mL/min/1.73 m2) | 168,790 (46.92) | 84,371 (46.90) | 84,419 (46.93) | |
| Stage 3a (45–59 mL/min/1.73 m2) | 58,081 (16.14) | 29,286 (16.28) | 28,795 (16.01) | |
| Stage 3b (30–44 mL/min/1.73 m2) | 30,014 (8.34) | 15,440 (8.58) | 14,574 (8.10) | |
| Stage 4 (15–29 mL/min/1.73 m2) | 10,467 (2.91) | 5656 (3.14) | 4811 (2.67) | |
| Stage 5 (<15 mL/min/1.73 m2) | 7539 (2.10) | 4203 (2.34) | 3336 (1.85) | |
| Preoperative hematocrit | −0.041 | |||
| <35 | 85,121 (23.66) | 44,138 (24.54) | 40,983 (22.78) | |
| ≥35 | 274,649 (76.34) | 135,747 (75.46) | 138,902 (77.22) | |
| Preoperative WBC | 0.033 | |||
| <4 k | 10,786 (3.00) | 5409 (3.01) | 5377 (2.99) | |
| 4 k–12 k | 316,457 (87.96) | 157,175 (87.38) | 159,282 (88.55) | |
| ≥12 k | 32,527 (9.04) | 17,301 (9.62) | 15,226 (8.46) | |
| Preoperative platelets | −0.006 | |||
| 150 k | 26,489 (7.36) | 13,579 (7.55) | 12,910 (7.18) | |
| 150 k–450 k | 322,105 (89.53) | 160,557 (89.26) | 161,548 (89.81) | |
| >450 k | 11,176 (3.11) | 5749 (3.20) | 5427 (3.02) | |
| Disseminated cancer | 9157 (2.55) | 4452 (2.47) | 4705 (2.62) | −0.009 |
| Surgical subspecialty | −0.061 | |||
| Vascular surgery | 44,260 (12.30) | 23,394 (13.00) | 20,866 (11.60) | |
| General surgery | 75,861 (21.09) | 37,906 (21.07) | 37,955 (21.10) | |
| Thoracic surgery | 3364 (0.94) | 1623 (0.90) | 1741 (0.97) | |
| Urology | 7313 (2.03) | 3562 (1.98) | 3751 (2.09) | |
| Orthopedic surgery | 215,565 (59.92) | 108,091 (60.09) | 107,474 (59.75) | |
| Neurosurgery | 2374 (0.66) | 1378 (0.77) | 996 (0.55) | |
| Cardiac surgery | 5869 (1.63) | 3000 (1.67) | 2869 (1.59) | |
| Gynecology | 5164 (1.44) | 931 (0.52) | 4233 (2.35) | |
| Operative time (min), median (IQR) | 102 (75–159) | 103 (75–158) | 101 (74–161) | −0.011 |
| Length of stay, median (IQR) | 3 (2–7) | 4 (3–7) | 3 (2–6) | 0.106 |
| Major pre-discharge complications | 15,766 (4.38) | 8755 (4.87) | 7011 (3.90) | 0.047 |
| Outcome | Discharge Destination | p-Value | OR (95% CI) a Ref: Home Discharge | E-Value b (Effect Estimate) | E-Value b (CI Limit) | |
|---|---|---|---|---|---|---|
| Non-Home (n = 179,885) | Home (n = 179,885) | |||||
| Unplanned readmission | 16,649 (9.26) | 13,209 (7.34) | <0.001 | 1.27 (1.23–1.30) | 1.85 | 1.77 |
| Post-discharge pulmonary complications | 894 (0.50) | 338 (0.19) | <0.001 | 2.63 (2.33–3.03) | 4.70 | 4.08 |
| Post-discharge infectious complications | 9596 (5.33) | 6970 (3.87) | <0.001 | 1.37 (1.32–1.41) | 2.08 | 1.96 |
| Post-discharge venous thromboembolism | 1822 (1.01) | 1204 (0.67) | <0.001 | 1.52 (1.41–1.61) | 2.40 | 2.17 |
| Post-discharge bleeding requiring transfusion | 882 (0.49) | 435 (0.24) | <0.001 | 2.56 (2.22–2.94) | 4.57 | 3.87 |
| Death | 1845 (1.03) | 773 (0.43) | <0.001 | 2.38 (2.17–2.63) | 4.19 | 3.77 |
Disclaimer/Publisher’s Note: The statements, opinions and data contained in all publications are solely those of the individual author(s) and contributor(s) and not of MDPI and/or the editor(s). MDPI and/or the editor(s) disclaim responsibility for any injury to people or property resulting from any ideas, methods, instructions or products referred to in the content. |
© 2023 by the authors. Licensee MDPI, Basel, Switzerland. This article is an open access article distributed under the terms and conditions of the Creative Commons Attribution (CC BY) license (https://creativecommons.org/licenses/by/4.0/).
Share and Cite
Riveros, C.; Ranganathan, S.; Shah, Y.B.; Huang, E.; Xu, J.; Geng, M.; Melchiode, Z.; Hu, S.; Miles, B.J.; Esnaola, N.; et al. Postoperative Discharge Destination Impacts 30-Day Outcomes: A National Surgical Quality Improvement Program Multi-Specialty Surgical Cohort Analysis. J. Clin. Med. 2023, 12, 6784. https://doi.org/10.3390/jcm12216784
Riveros C, Ranganathan S, Shah YB, Huang E, Xu J, Geng M, Melchiode Z, Hu S, Miles BJ, Esnaola N, et al. Postoperative Discharge Destination Impacts 30-Day Outcomes: A National Surgical Quality Improvement Program Multi-Specialty Surgical Cohort Analysis. Journal of Clinical Medicine. 2023; 12(21):6784. https://doi.org/10.3390/jcm12216784
Chicago/Turabian StyleRiveros, Carlos, Sanjana Ranganathan, Yash B. Shah, Emily Huang, Jiaqiong Xu, Michael Geng, Zachary Melchiode, Siqi Hu, Brian J. Miles, Nestor Esnaola, and et al. 2023. "Postoperative Discharge Destination Impacts 30-Day Outcomes: A National Surgical Quality Improvement Program Multi-Specialty Surgical Cohort Analysis" Journal of Clinical Medicine 12, no. 21: 6784. https://doi.org/10.3390/jcm12216784