
Sex Differences in the Correlation between Fatigue Perception and Regional Gray Matter Volume in Healthy Adults: A Large-Scale Study
Abstract
:1. Introduction
2. Materials and Methods
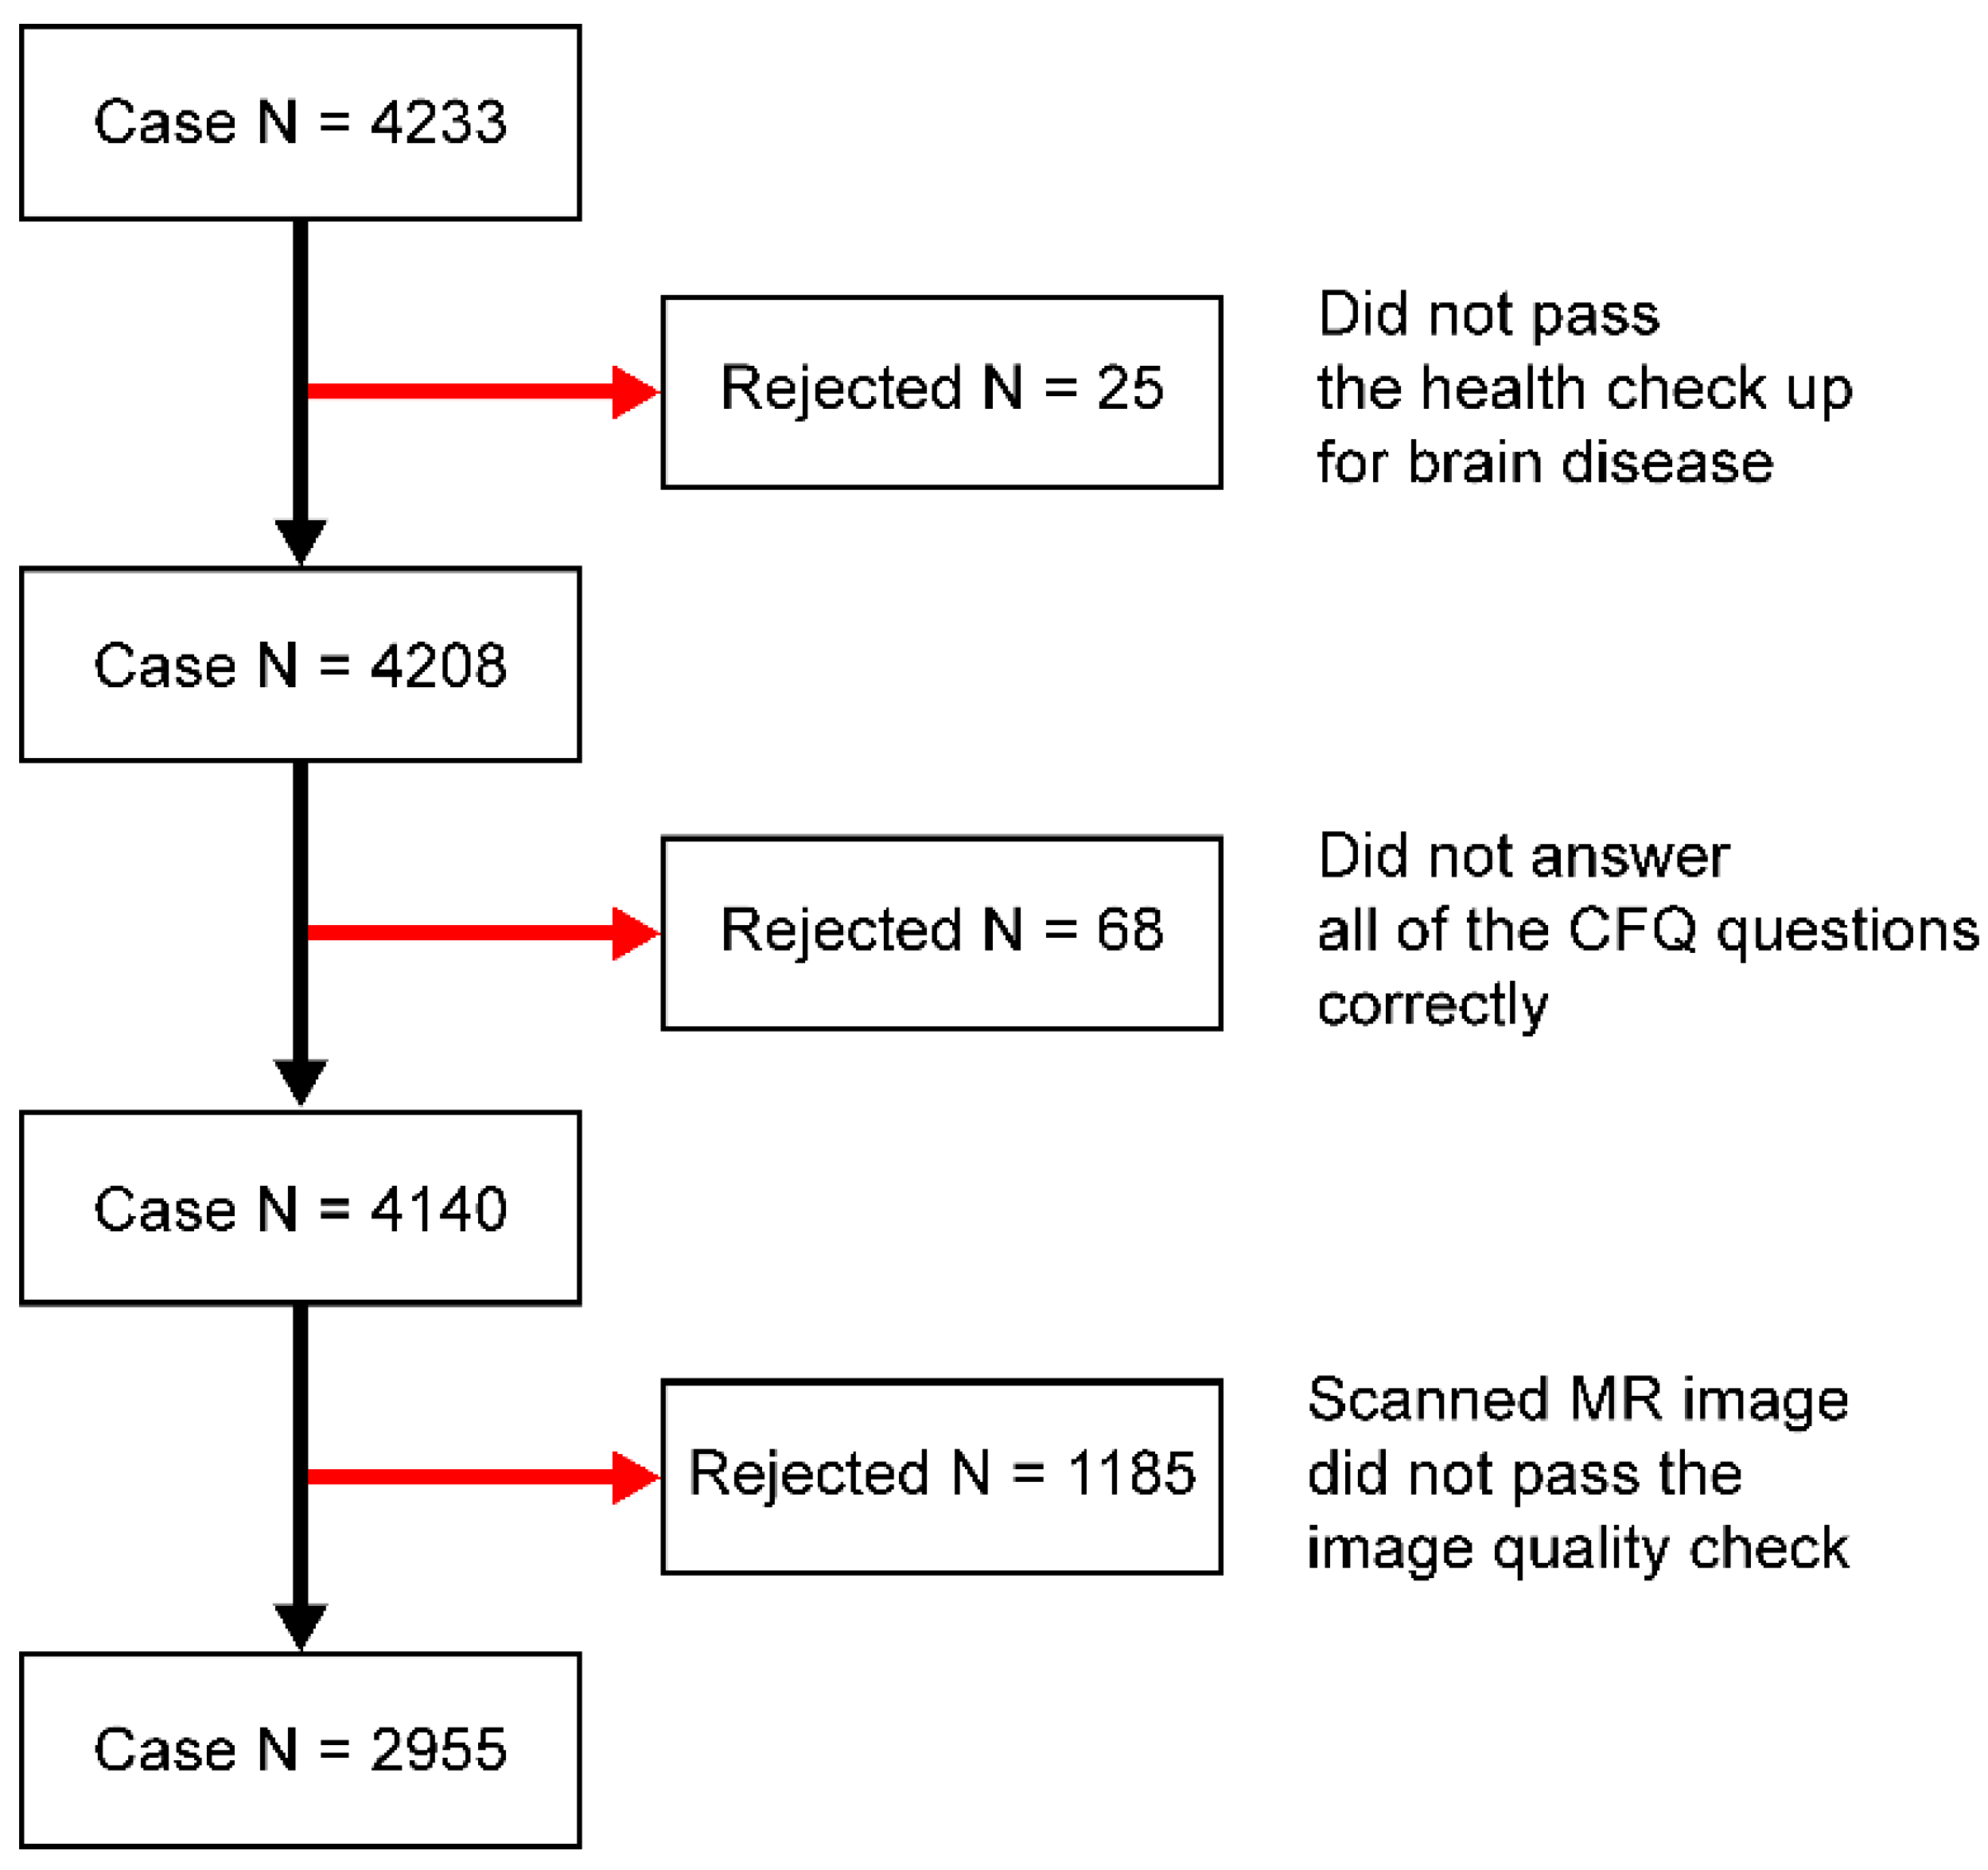
2.1. Participants
2.2. Assessment of Fatigue
2.3. MRI
2.4. Statistical Analysis
3. Results
3.1. Age, CFQ Scores, and Ratios of Several Brain Volumes to ICVs
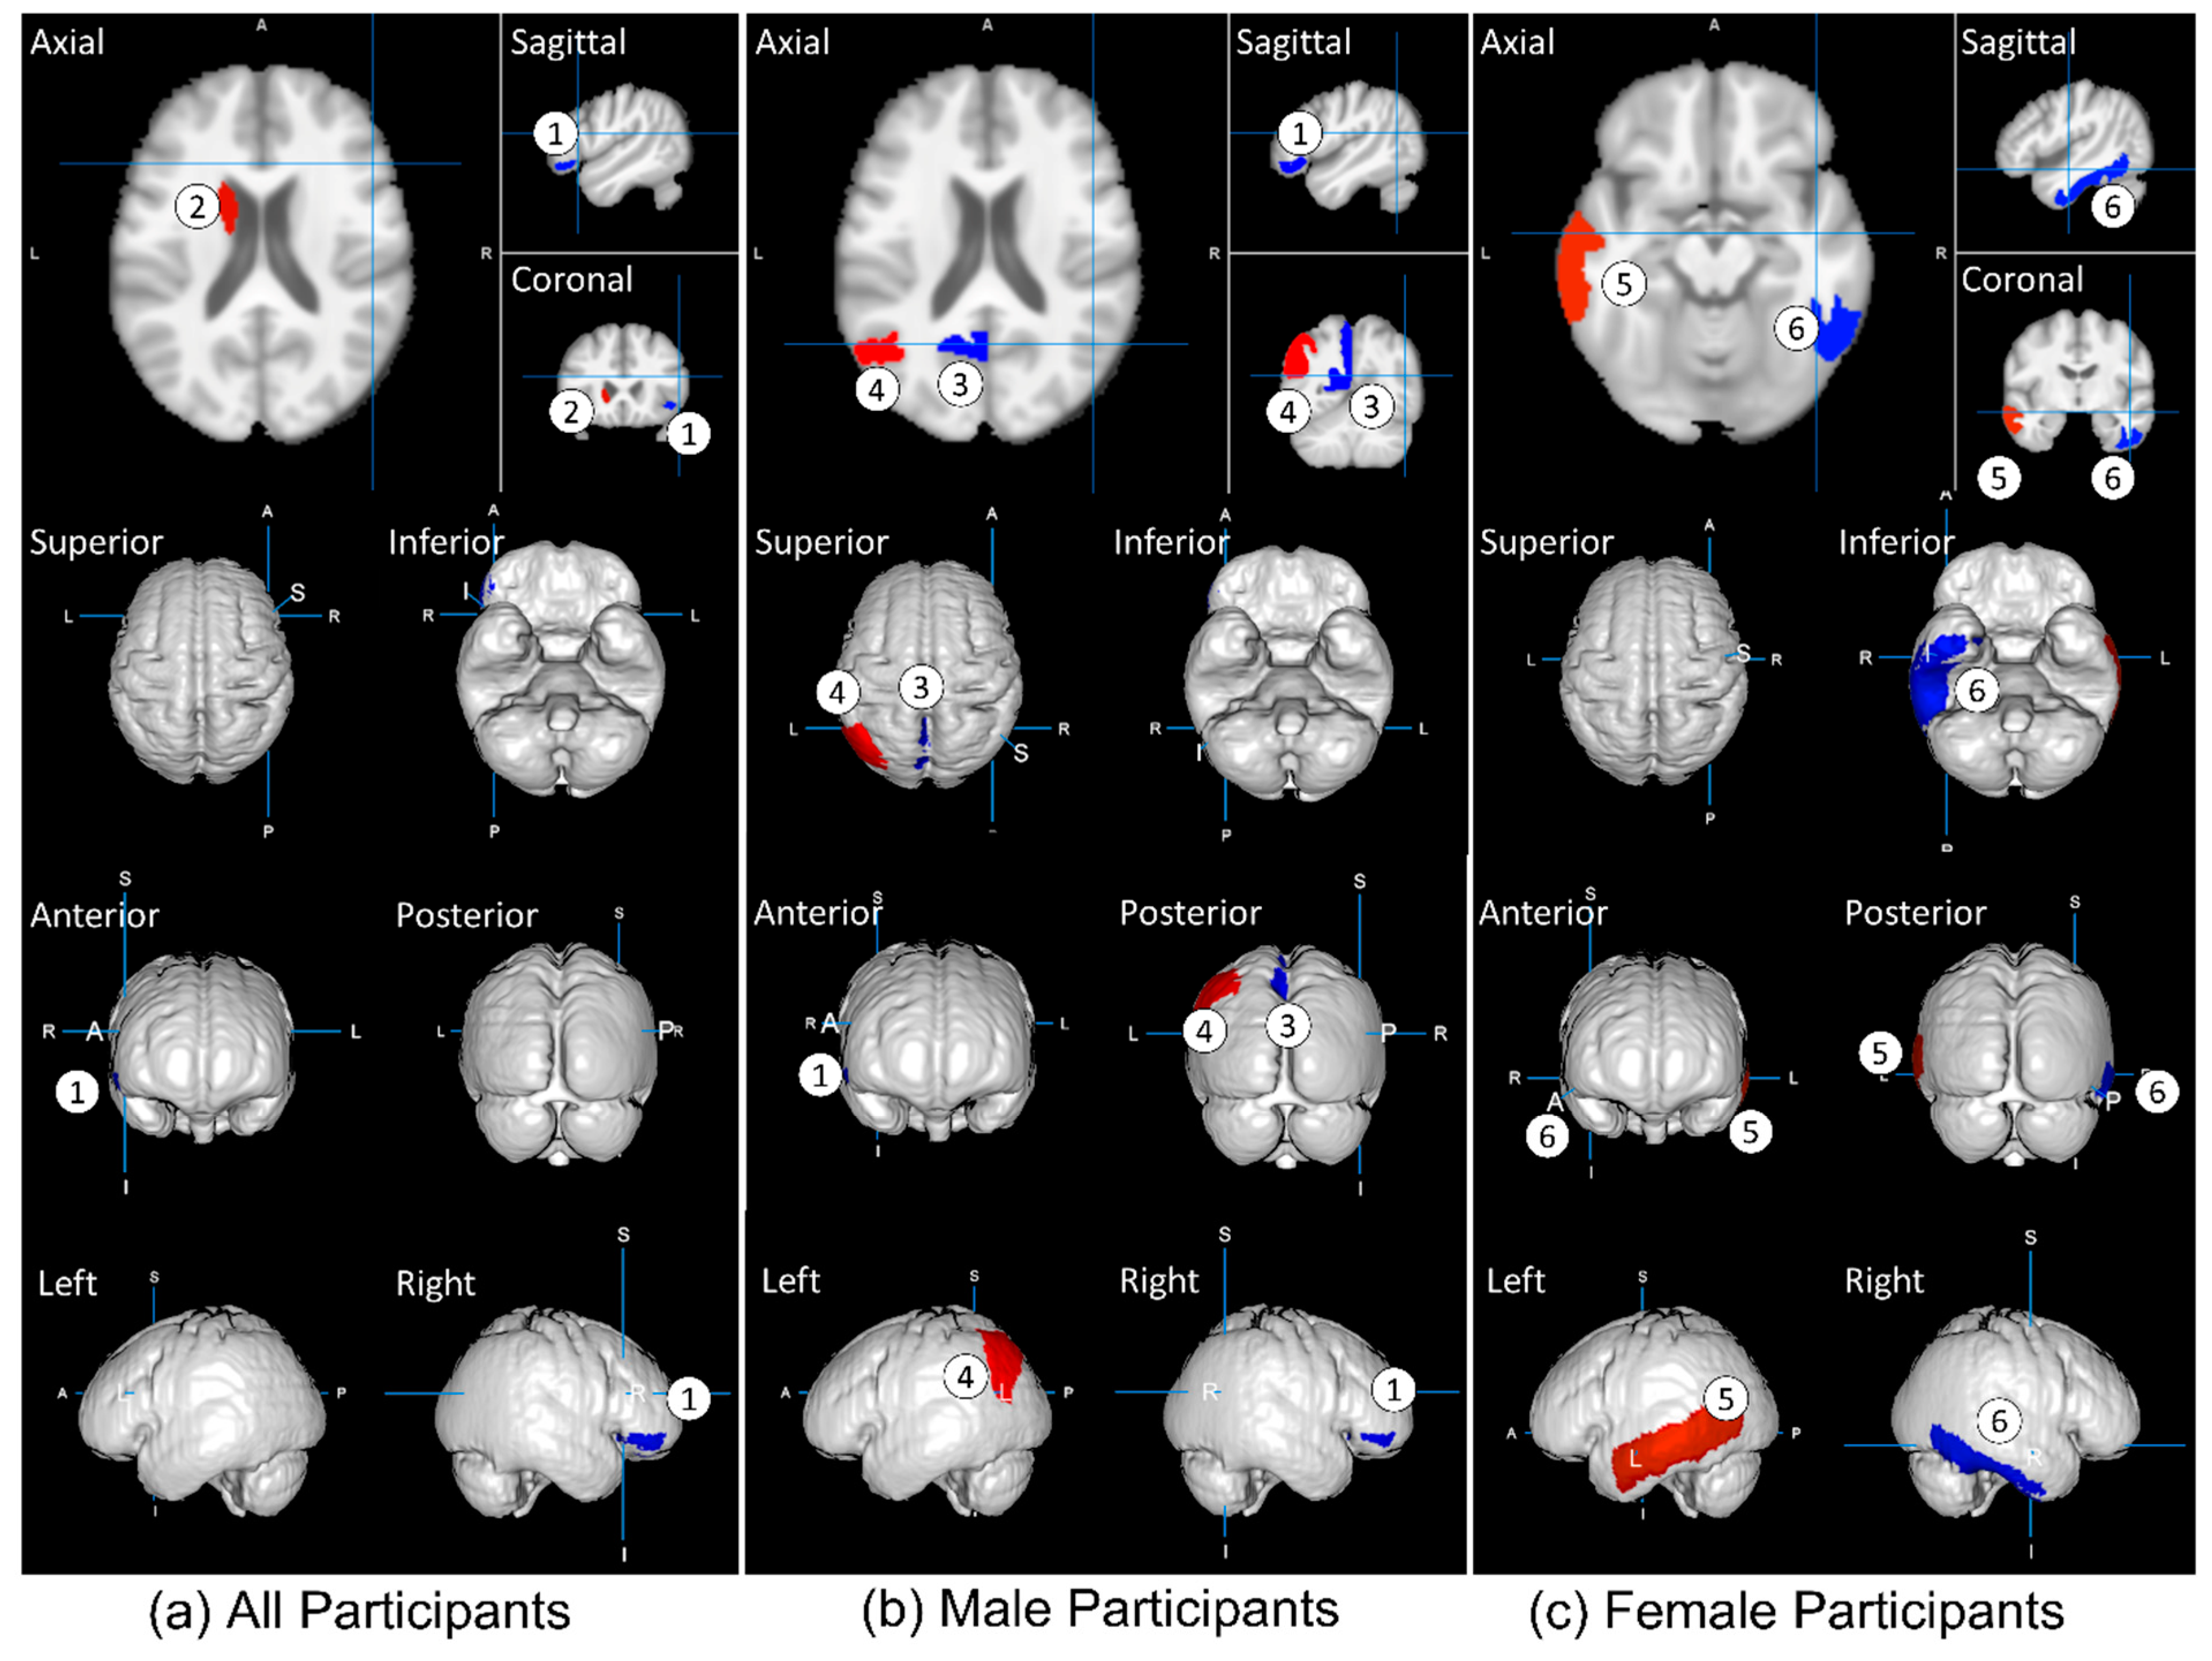
3.2. Analyses of rGMV
4. Discussion
Author Contributions
Funding
Institutional Review Board Statement
Informed Consent Statement
Data Availability Statement
Acknowledgments
Conflicts of Interest
References
- Cope, H.; David, A.S. Neuroimaging in chronic fatigue syndrome. J. Neurol. Neurosurg. Psychiatry 1996, 60, 471–473. [Google Scholar] [CrossRef] [PubMed] [Green Version]
- Fukuda, K.; Straus, S.E.; Hickie, I.; Sharpe, M.C.; Dobbins, J.G.; Komaroff, A.; International Chronic Fatigue Syndrome Study Group. The chronic fatigue syndrome: A comprehensive approach to its definition and study. International Chronic Fatigue Syndrome Study Group. Ann. Intern. Med. 1994, 121, 953–959. [Google Scholar] [CrossRef]
- Watanabe, Y. PET/SPECT/MRI/fMRI studies in the myalgic encephalomyelitis/chronic fatigue syndrome. In PET and SPECT in Psychiatry; Springer: Cham, Switzerland, 2021; pp. 985–1001. [Google Scholar]
- Kanai, A. ‘Karoshi (work to death)’ in Japan. J. Bus. Ethics 2009, 84, 209–219. [Google Scholar] [CrossRef]
- Finkelmeyer, A.; He, J.; Maclachlan, L.; Watson, S.; Gallagher, P.; Newton, J.L.; Blamire, A.M. Grey and white matter differences in chronic fatigue syndrome–A voxel-based morphometry study. NeuroImage Clin. 2018, 17, 24–30. [Google Scholar] [CrossRef] [Green Version]
- Nakagawa, S.; Takeuchi, H.; Taki, Y.; Nouchi, R.; Kotozaki, Y.; Shinada, T.; Maruyama, T.; Sekiguchi, A.; Iizuka, K.; Yokoyama, R.; et al. Basal ganglia correlates of fatigue in young adults. Sci. Rep. 2016, 6, 21386. [Google Scholar] [CrossRef] [PubMed] [Green Version]
- Derache, N.; Grassiot, B.; Mézenge, F.; Emmanuelle Dugué, A.E.; Desgranges, B.; Constans, J.M.; Defer, G.L. Fatigue is associated with metabolic and density alterations of cortical and deep gray matter in Relapsing-Remitting-Multiple Sclerosis patients at the earlier stage of the disease: A PET/MR study. Mult. Scler. Relat. Disord. 2013, 2, 362–369. [Google Scholar] [CrossRef]
- Suda, M.; Fukuda, M.; Sato, T.; Iwata, S.; Song, M.; Kameyama, M.; Mikuni, M. Subjective feeling of psychological fatigue is related to decreased reactivity in ventrolateral prefrontal cortex. Brain Res. 2009, 1252, 152–160. [Google Scholar] [CrossRef] [PubMed]
- Tang, L.W.; Zheng, H.; Chen, L.; Zhou, S.Y.; Huang, W.J.; Li, Y.; Wu, X. Gray matter volumes in patients with chronic fatigue syndrome. Evid. Based Complement. Altern. Med. 2015, 2015, 380615. [Google Scholar] [CrossRef] [Green Version]
- Tajima, S.; Yamamoto, S.; Tanaka, M.; Kataoka, Y.; Iwase, M.; Yoshikawa, E.; Okada, H.; Onoe, H.; Tsukada, H.; Kuratsune, H.; et al. Medial orbitofrontal cortex is associated with fatigue sensation. Neurol. Res. Int. 2010, 2010, 671421. [Google Scholar] [CrossRef] [PubMed] [Green Version]
- Gay, C.W.; Robinson, M.E.; Lai, S.; O’Shea, A.; Craggs, J.G.; Price, D.D.; Staud, R. Abnormal resting-state functional connectivity in patients with chronic fatigue syndrome: Results of seed and data-driven analyses. Brain Connect. 2016, 6, 48–56. [Google Scholar] [CrossRef]
- Kuratsune, H.; Yamaguti, K.; Lindh, G.; Evengård, B.; Hagberg, G.; Matsumura, K.; Iwase, M.; Onoe, H.; Takahashi, M.; Machii, T.; et al. Brain regions involved in fatigue sensation: Reduced acetylcarnitine uptake into the brain. Neuroimage 2002, 17, 1256–1265. [Google Scholar] [CrossRef] [Green Version]
- Putra, H.A.; Park, K.; Yamashita, F.; Nakagawa, Y.; Murai, T. Cerebral gray matter volume correlates with fatigue and var-ies between desk workers and non-desk workers. Front. Behav. Neurosci. 2022, 16, 370. [Google Scholar] [CrossRef]
- Heidari, S.; Ahumada, C.; Kurbanova, Z.; GENDRO Gender, Evidence and Health Network. Towards the real-time inclusion of sex- and age-disaggregated data in pandemic responses. BMJ Glob. Health 2020, 5, e003848. [Google Scholar] [CrossRef] [PubMed]
- Lancet, T. The gendered dimensions of COVID-19. Lancet 2020, 395, 1168. [Google Scholar] [CrossRef]
- Phillips, S.; Williams, M.A. Confronting our next national health disaster—Long-haul Covid. N. Engl. J. Med. 2021, 385, 577–579. [Google Scholar] [CrossRef] [PubMed]
- Faro, M.; Sàez-Francás, N.; Castro-Marrero, J.; Aliste, L.; Fernández de Sevilla, T.F.; Alegre, J. Gender differences in chronic fatigue syndrome. Reumatol. Clin. 2016, 12, 72–77. [Google Scholar] [CrossRef]
- Tanaka, M.; Fukuda, S.; Mizuno, K.; Kuratsune, H.; Watanabe, Y. Stress and coping styles are associated with severe fatigue in medical students. Behav. Med. 2009, 35, 87–92. [Google Scholar] [CrossRef]
- Chalder, T.; Berelowitz, G.; Pawlikowska, T.; Watts, L.; Wessely, S.; Wright, D.; Wallace, E.P. Development of a fatigue scale. J. Psychosom. Res. 1993, 37, 147–153. [Google Scholar] [CrossRef] [Green Version]
- Tanaka, M.; Fukuda, S.; Mizuno, K.; Imai-Matsumura, K.; Jodoi, T.; Kawatani, J.; Takano, M.; Miike, T.; Tomoda, A.; Watanabe, Y.; et al. Reliability and validity of the Japanese version of the Chalder Fatigue Scale among youth in Japan. Psychol. Rep. 2008, 103, 682–690. [Google Scholar] [CrossRef] [PubMed]
- Cella, M.; Chalder, T. Measuring fatigue in clinical and community settings. J. Psychosom. Res. 2010, 69, 17–22. [Google Scholar] [CrossRef]
- Morriss, R.K.; Wearden, A.J.; Mullis, R. Exploring the validity of the Chalder Fatigue scale in chronic fatigue syndrome. J. Psychosom. Res. 1998, 45, 411–417. [Google Scholar] [CrossRef]
- De Vries, J.; Michielsen, H.J.; Van Heck, G.L. Assessment of fatigue among working people: A comparison of six questionnaires. Occup. Environ. Med. 2003, 60 (Suppl. 1), i10–i15. [Google Scholar] [CrossRef]
- Whitwell, J.L. Voxel-based morphometry: An automated technique for assessing structural changes in the brain. J. Neurosci. 2009, 29, 9661–9664. [Google Scholar] [CrossRef] [Green Version]
- Kurth, F.; Luders, E.; Gaser, C. VBM8 Toolbox Manual; University of Jena: Jena, Germany, 2010. [Google Scholar]
- Ashburner, J. A fast diffeomorphic image registration algorithm. Neuroimage 2007, 38, 95–113. [Google Scholar] [CrossRef]
- Gur, R.C.; Gunning-Dixon, F.M.; Turetsky, B.I.; Bilker, W.B.; Gur, R.E. Brain region and sex differences in age association with brain volume: A quantitative MRI study of healthy young adults. Am. J. Geriatr. Psychiatry 2002, 10, 72–80. [Google Scholar] [CrossRef]
- Ntranos, A.; Krieger, S.; Fabian, M.; Leavitt, V.; Lewis, C.; Pelle, G.; Sumowski, J. Fatigue in Early Multiple Sclerosis and the Role of the Caudate Nucleus. (P4.412). Neurology. 2018. Available online: https://n.neurology.org/content/90/15_Supplement/P4.412 (accessed on 1 January 2020).
- Rolls, E.T.; Cheng, W.; Du, J.; Wei, D.; Qiu, J.; Dai, D.; Zhou, Q.; Xie, P.; Feng, J.; Xie, P.; et al. Functional connectivity of the right inferior frontal gyrus and orbitofrontal cortex in depression. Soc. Cogn. Affect. Neurosci. 2020, 15, 75–86. [Google Scholar] [CrossRef] [Green Version]
- Wylie, G.R.; Pra Sisto, A.J.; Genova, H.M.; DeLuca, J. Fatigue across the lifespan in men and women: State vs. trait. Front. Hum. Neurosci. 2022, 16, 790006. [Google Scholar] [CrossRef]
- Martens, M.; Filippini, N.; Masaki, C.; Godlewska, B.R. Functional connectivity between task-positive networks and the left precuneus as a biomarker of response to lamotrigine in bipolar depression: A pilot study. Pharmaceuticals 2021, 14, 534. [Google Scholar] [CrossRef]
- Shan, Z.Y.; Finegan, K.; Bhuta, S.; Ireland, T.; Staines, D.R.; Marshall-Gradisnik, S.M.; Barnden, L.R. Brain function characteristics of chronic fatigue syndrome: A task fMRI study. NeuroImage Clin. 2018, 19, 279–286. [Google Scholar] [CrossRef]
- Silva, L.S.; Joao, R.B.; Nogueira, M.H.; Aventurato, I.K.; de Campos, B.M.; de Brito, M.R.; Yasuda, C.L. Functional and microstructural brain abnormalities, fatigue, and cognitive dysfunction after mild COVID-19. Medrxiv 2021. [Google Scholar]
- Rocca, M.A.; Meani, A.; Riccitelli, G.C.; Colombo, B.; Rodegher, M.; Falini, A.; Comi, G.; Filippi, M.; Filippi, M. Abnormal adaptation over time of motor network recruitment in multiple sclerosis patients with fatigue. Mult. Scler. 2016, 22, 1144–1153. [Google Scholar] [CrossRef]
- Onitsuka, T.; Shenton, M.E.; Salisbury, D.F.; Dickey, C.C.; Kasai, K.; Toner, S.K.; Frumin, M.; Kikinis, R.; Jolesz, F.A.; McCarley, R.W.; et al. Middle and inferior temporal gyrus gray matter volume abnormalities in chronic schizophrenia: An MRI study. Am. J. Psychiatry 2004, 161, 1603–1611. [Google Scholar] [CrossRef] [Green Version]
- Riccitelli, G.C.; Rocca, M.; Meani, A.; Rodegher, M.; Colombo, B.; Falini, A.; Filippi, M. New Insights on the Pathophysiology of Fatigue in MS: A fMRI Study of the Motor Network (P6.141). Neurology. 2015. Available online: https://n.neurology.org/content/84/14_Supplement/P6.141 (accessed on 1 January 2020).
- Tanaka, M.; Tajima, S.; Mizuno, K.; Ishii, A.; Konishi, Y.; Miike, T.; Watanabe, Y. Frontier studies on fatigue, autonomic nerve dysfunction, and sleep-rhythm disorder. J. Physiol. Sci. 2015, 65, 483–498. [Google Scholar] [CrossRef] [Green Version]
- Tanaka, M.; Watanabe, Y. A new hypothesis of chronic fatigue syndrome: Co-conditioning theory. Med. Hypotheses 2010, 75, 244–249. [Google Scholar] [CrossRef]
- Michael, D.J.; Daugherty, S.; Santos, A.; Ruby, B.C.; Kalns, J.E. Fatigue biomarker index: An objective salivary measure of fatigue level. Accid. Anal. Prev. 2012, 45, 68–73. [Google Scholar] [CrossRef]
- Tanaka, M.; Mizuno, K.; Tajima, S.; Sasabe, T.; Watanabe, Y. Central nervous system fatigue alters autonomic nerve activity. Life Sci. 2009, 84, 235–239. [Google Scholar] [CrossRef]
- Hafiz, W.; Nori, R.; Bregasi, A.; Noamani, B.; Bonilla, D.; Lisnevskaia, L.; Silverman, E.; Bookman, A.A.M.; Johnson, S.R.; Landolt-Marticorena, C.; et al. Fatigue severity in anti-nuclear antibody-positive individuals does not correlate with pro-inflammatory cytokine levels or predict imminent progression to symptomatic disease. Arthritis Res. Ther. 2019, 21, 223. [Google Scholar] [CrossRef] [PubMed]


| All Participants (N = 2955) | Male (N = 1560) | Female (N = 1395) | p-Value | ||||
|---|---|---|---|---|---|---|---|
| Mean | SD | Mean | SD | Mean | SD | ||
| Age | 53.1536 | 9.7437 | 53.2314 | 10.4482 | 53.0667 | 8.8929 | >0.05 |
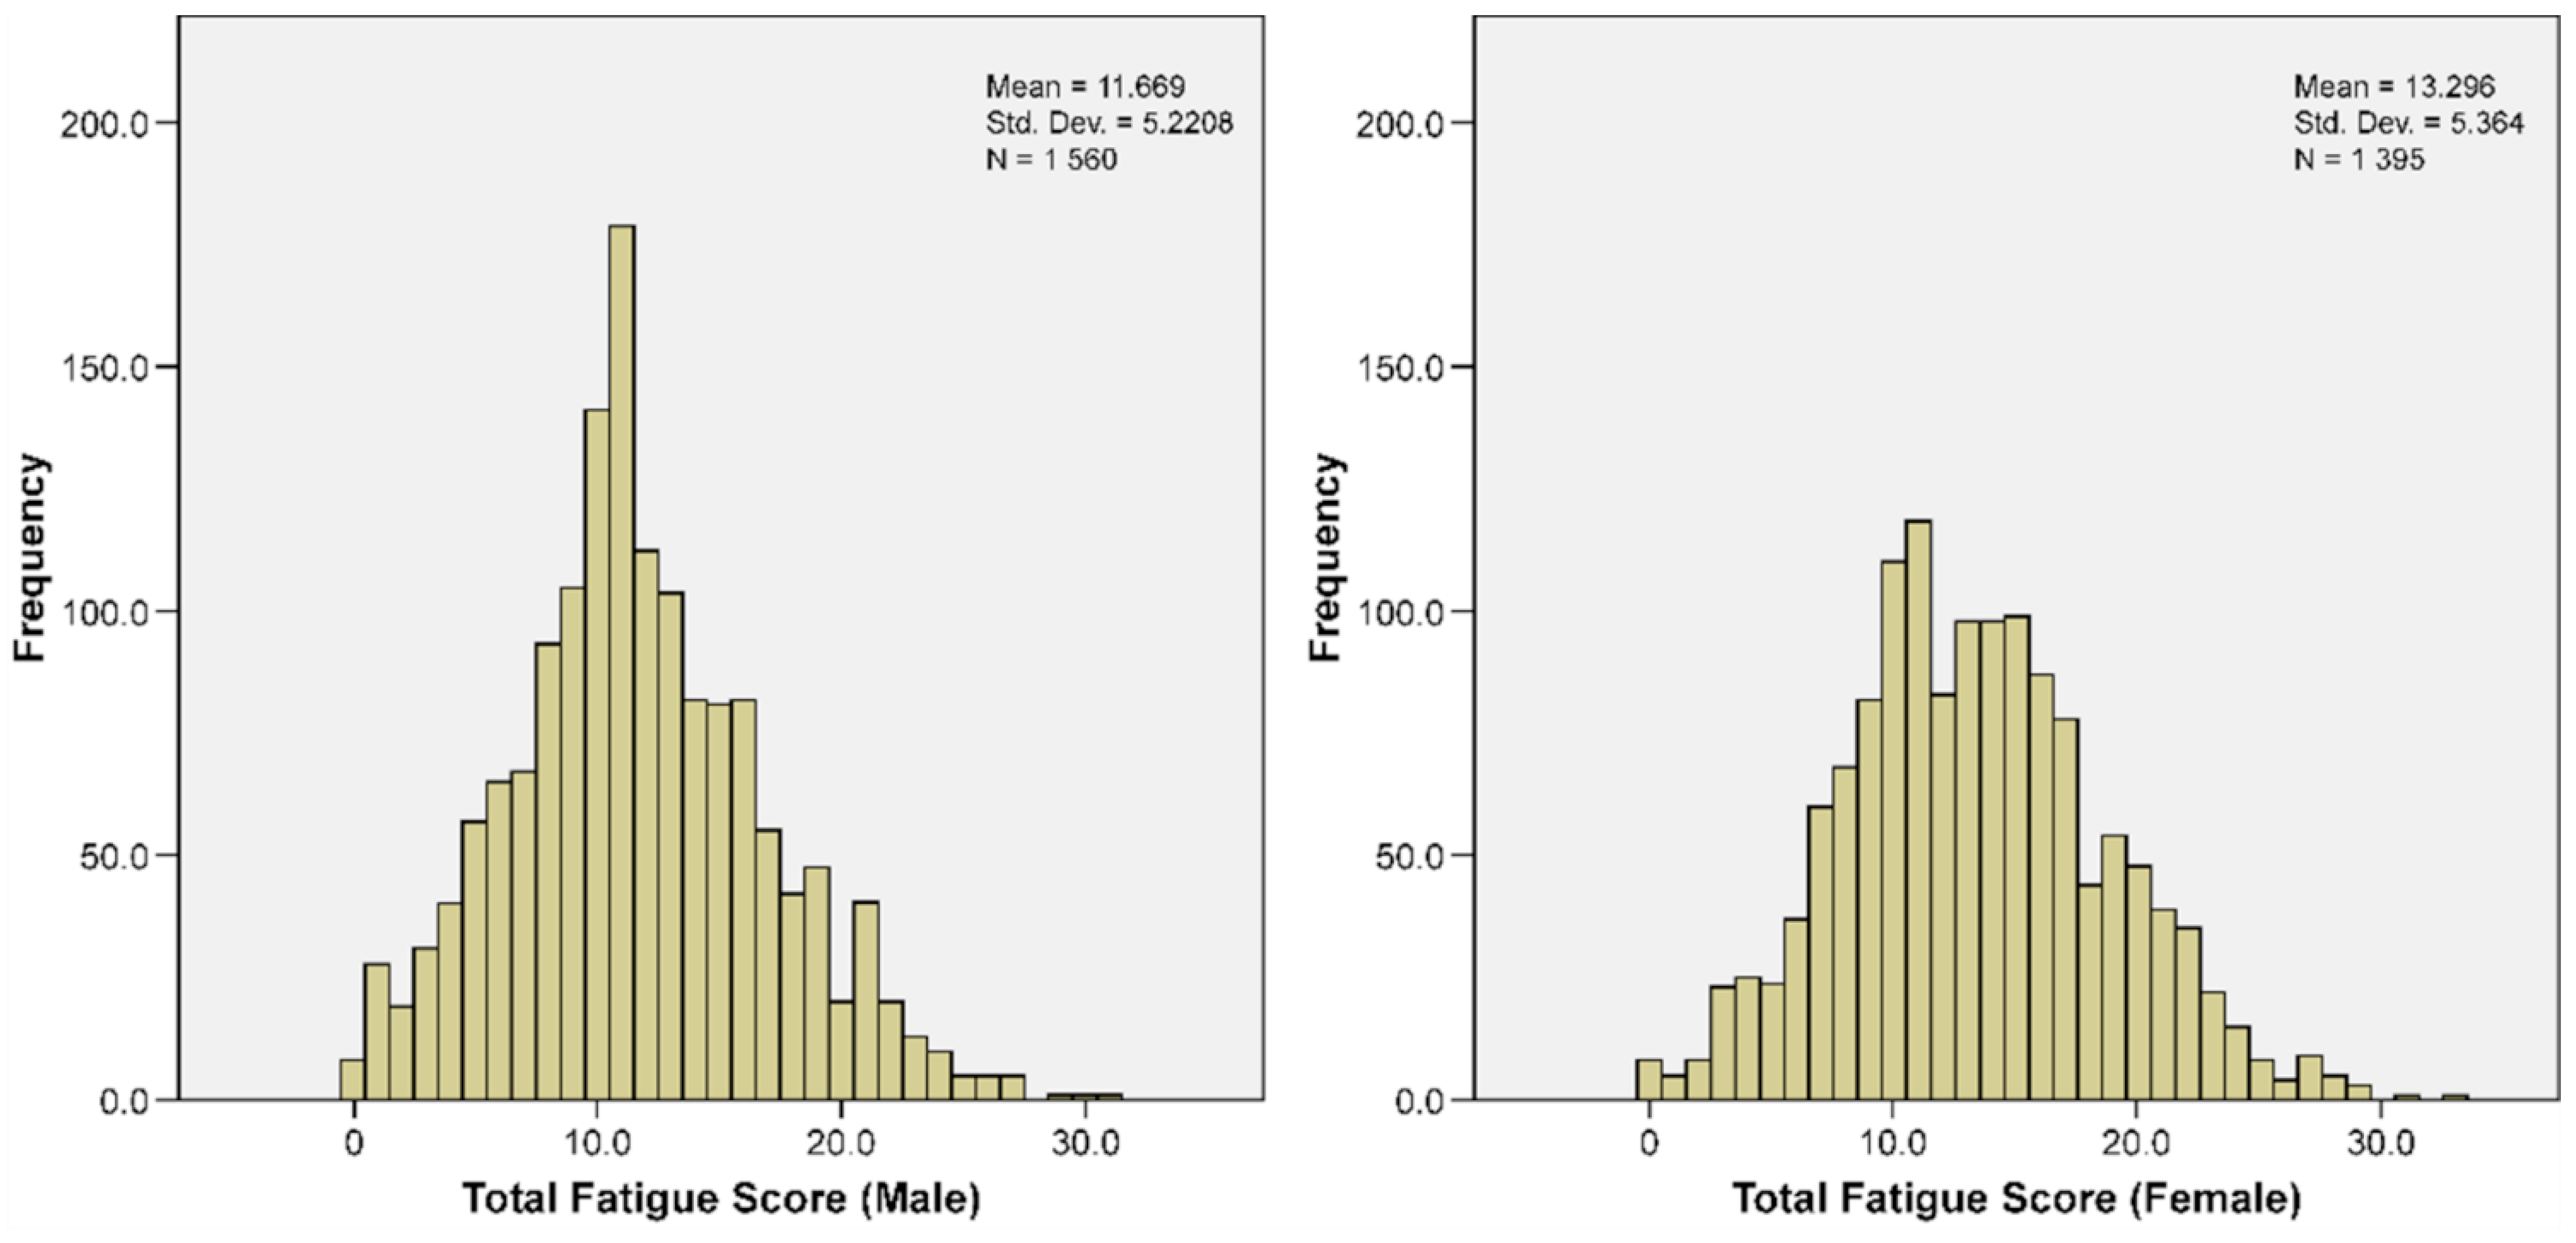
| Chalder’s Fatigue Score | 12.4372 | 5.3500 | 11.6692 | 5.2208 | 13.2961 | 5.3640 | <0.001 |
| Total Brain Volume/ICV | 0.8233 | 0.0211 | 0.8182 | 0.0217 | 0.8296 | 0.0190 | <0.001 |
| Total GMV/ICV | 0.4273 | 0.0209 | 0.4215 | 0.0213 | 0.4876 | 0.0185 | <0.001 |
| Total WMV/ICV | 0.3960 | 0.0182 | 0.3968 | 0.0182 | 0.4521 | 0.0182 | <0.05 |
| Parameters and Brain Regions that Significantly Predict CFQ Scores (Total Fatigue Score) | Coefficient (B) | Std. Error | t-Value | p-Value | |
|---|---|---|---|---|---|
| All Participants (N = 2955) | (Constant) | 17.554 | 1.344 | 13.066 | <0.001 |
| Sex | −1.548 | 0.199 | −7.796 | <0.001 | |
| Age | −0.074 | 0.011 | −6.899 | <0.001 | |
| Right orbital part of the inferior frontal gyrus | −2.003 | 0.797 | −2.513 | <0.05 | |
| Left caudate | 1.073 | 0.436 | 2.460 | <0.05 | |
| Male (N = 1560) | (Constant) | 20.636 | 2.385 | 8.652 | <0.001 |
| Age | −0.068 | 0.014 | −4.733 | <0.001 | |
| Right orbital part of the inferior frontal gyrus | −3.006 | 1.080 | −2.784 | 0.005 | |
| Left precuneus | −0.808 | 0.254 | −3.183 | 0.01 | |
| Left angular gyrus | 0.593 | 0.267 | 2.218 | <0.05 | |
| Female (N = 1395) | (Constant) | 16.195 | 2.606 | 6.214 | <0.001 |
| Age | −0.081 | 0.017 | −4.749 | <0.001 | |
| Left middle temporal gyrus | 0.628 | 0.203 | 3.095 | <0.01 | |
| Right inferior temporal gyrus | −0.658 | 0.300 | −2.194 | <0.05 | |
Publisher’s Note: MDPI stays neutral with regard to jurisdictional claims in published maps and institutional affiliations. |
© 2022 by the authors. Licensee MDPI, Basel, Switzerland. This article is an open access article distributed under the terms and conditions of the Creative Commons Attribution (CC BY) license (https://creativecommons.org/licenses/by/4.0/).
Share and Cite
Putra, H.A.; Park, K.; Yamashita, F. Sex Differences in the Correlation between Fatigue Perception and Regional Gray Matter Volume in Healthy Adults: A Large-Scale Study. J. Clin. Med. 2022, 11, 6037. https://doi.org/10.3390/jcm11206037
Putra HA, Park K, Yamashita F. Sex Differences in the Correlation between Fatigue Perception and Regional Gray Matter Volume in Healthy Adults: A Large-Scale Study. Journal of Clinical Medicine. 2022; 11(20):6037. https://doi.org/10.3390/jcm11206037
Chicago/Turabian StylePutra, Handityo Aulia, Kaechang Park, and Fumio Yamashita. 2022. "Sex Differences in the Correlation between Fatigue Perception and Regional Gray Matter Volume in Healthy Adults: A Large-Scale Study" Journal of Clinical Medicine 11, no. 20: 6037. https://doi.org/10.3390/jcm11206037