Physiological Age- and Sex-Related Profiles for Local (Aortic) and Regional (Carotid-Femoral, Carotid-Radial) Pulse Wave Velocity and Center-to-Periphery Stiffness Gradient, with and without Blood Pressure Adjustments: Reference Intervals and Agreement between Methods in Healthy Subjects (3–84 Years)

Abstract
:1. Introduction
2. Materials and Methods
2.1. Study Population
2.2. Anthropometric and Clinical Evaluation
2.3. Cardiovascular Evaluation
2.4. Carotid and Femoral Artery Ultrasound
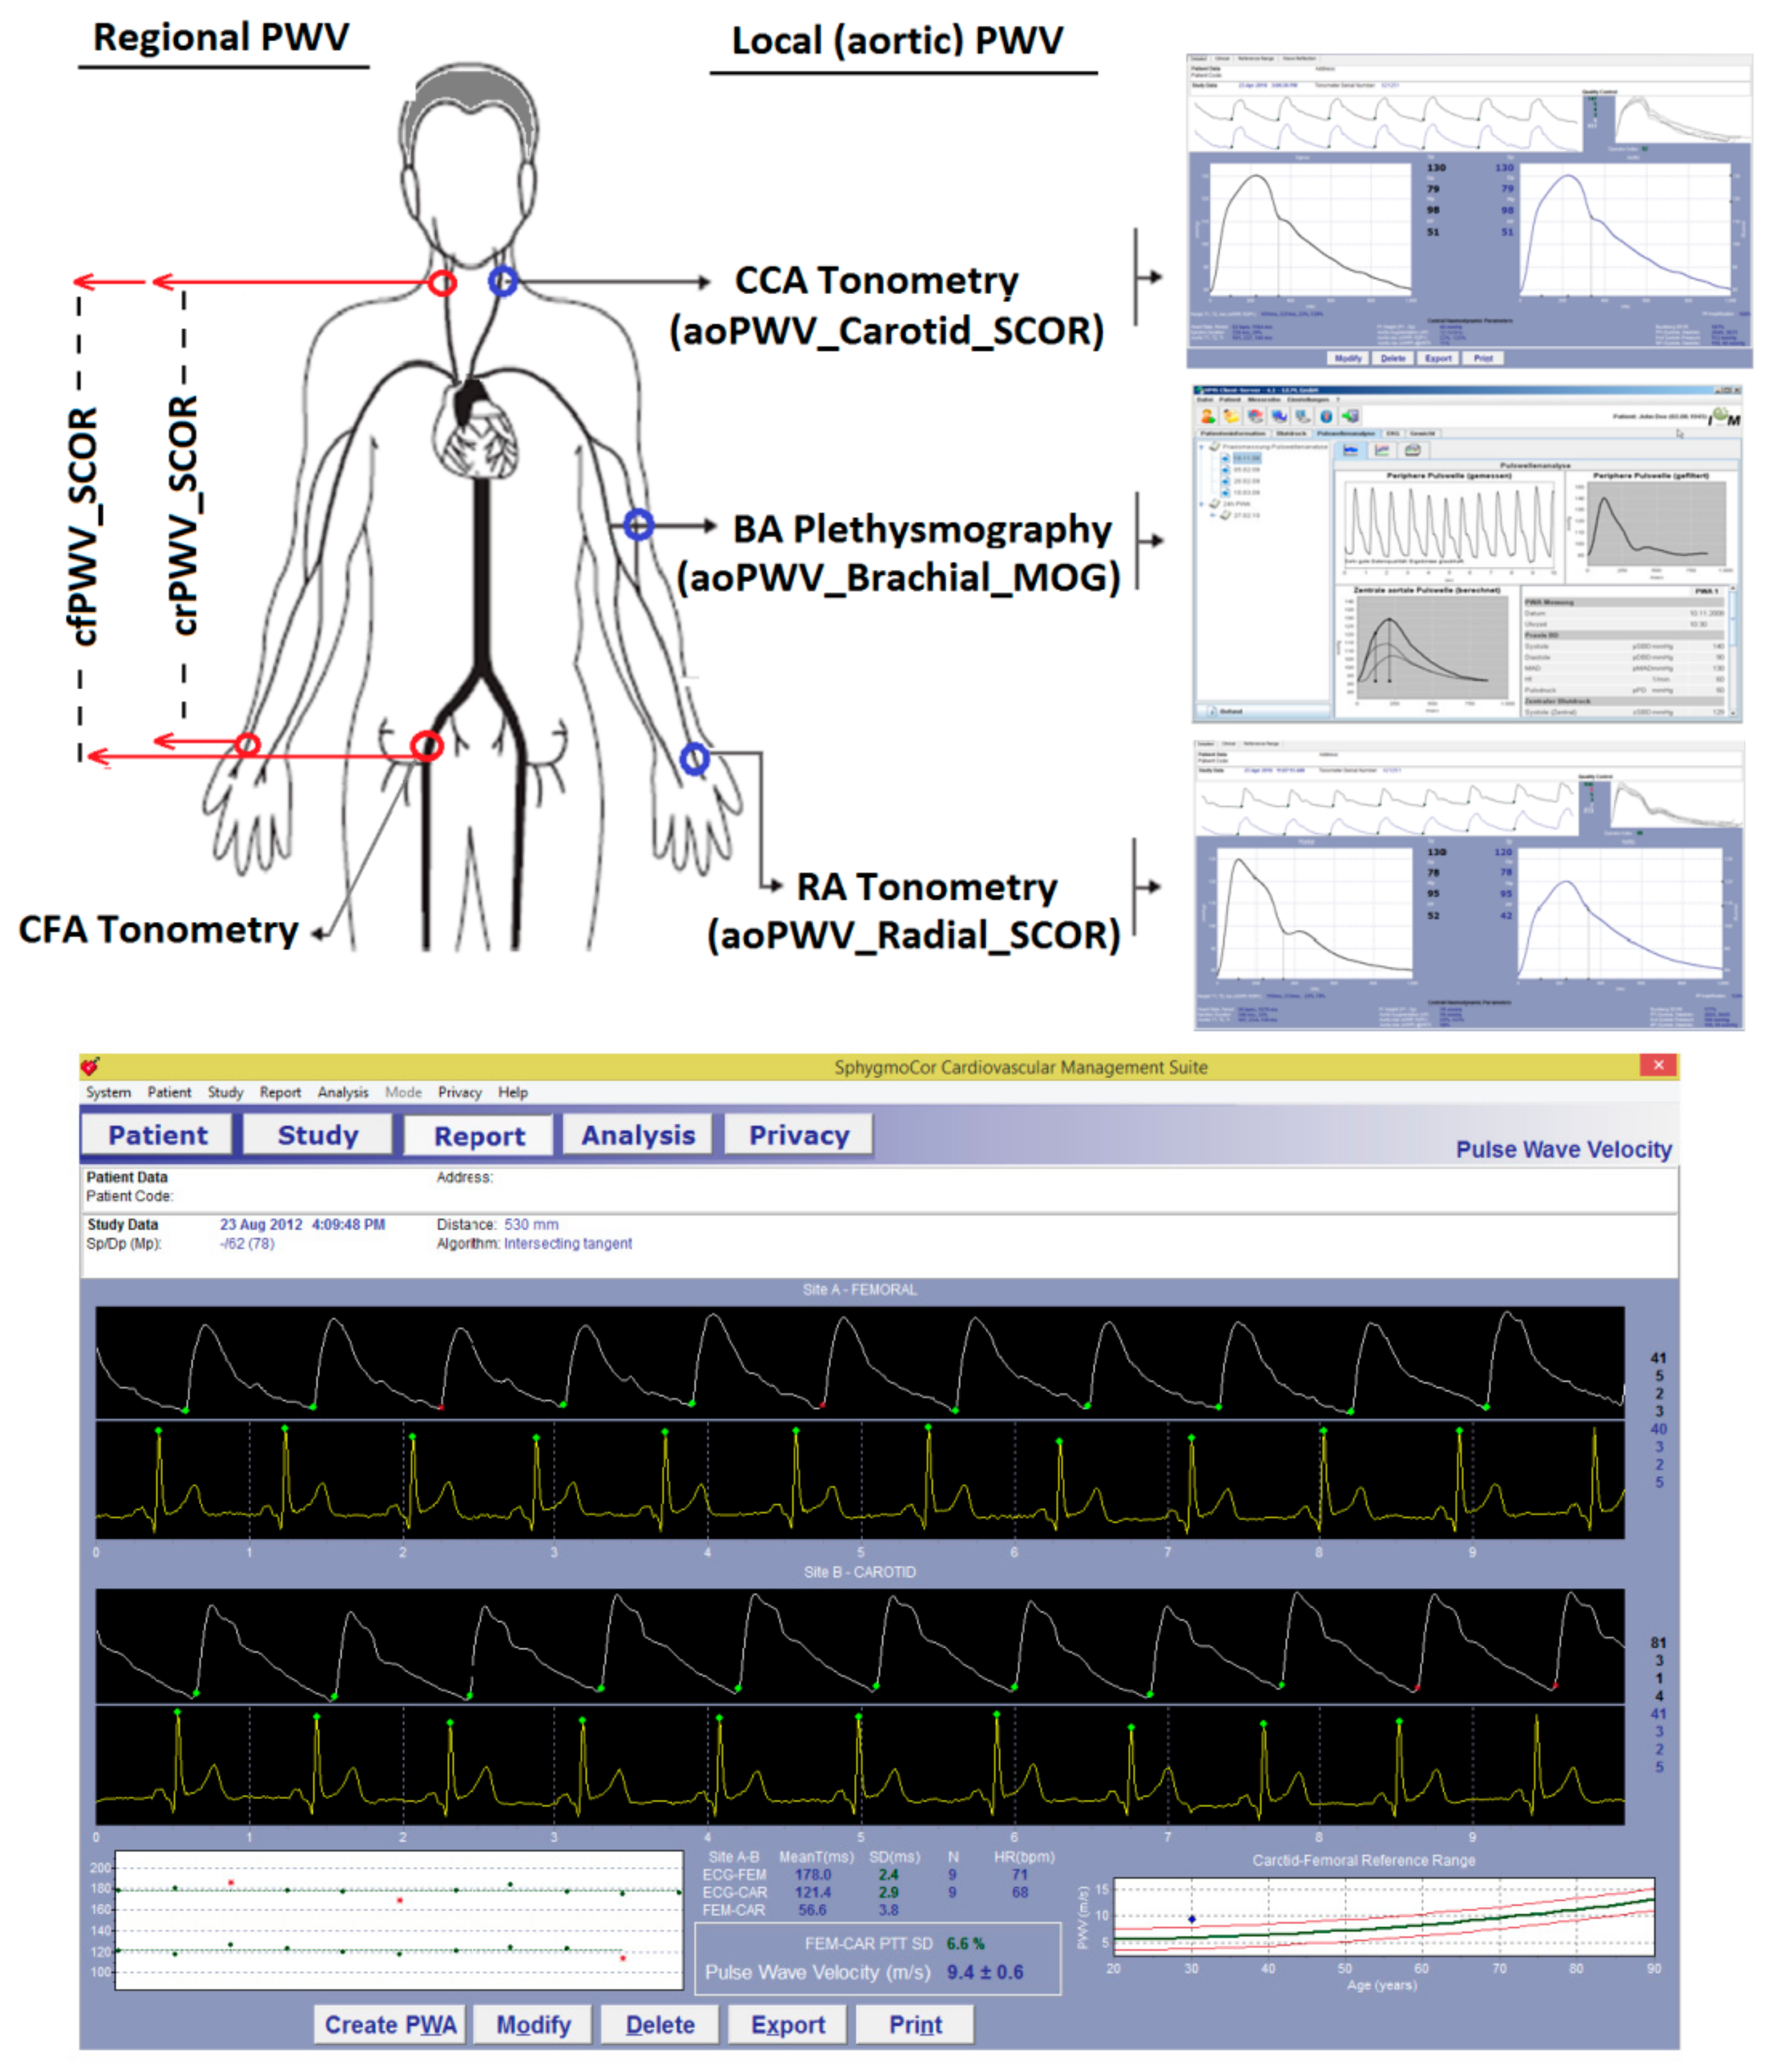
2.5. Regional PWV (cfPWV and crPWV) and Pulse Wave Velocity Ratio (PWV Ratio)
2.6. Local PWV: aoPWV_Radial_SCOR, aoPWV_Carotid_SCOR and aoPWV_Brachial_MOG
2.7. CAVI and CAVIo Determination
2.8. Arterial Stiffness Parameters
2.9. Data Analysis
3. Results
3.1. Subjects’ Characteristics
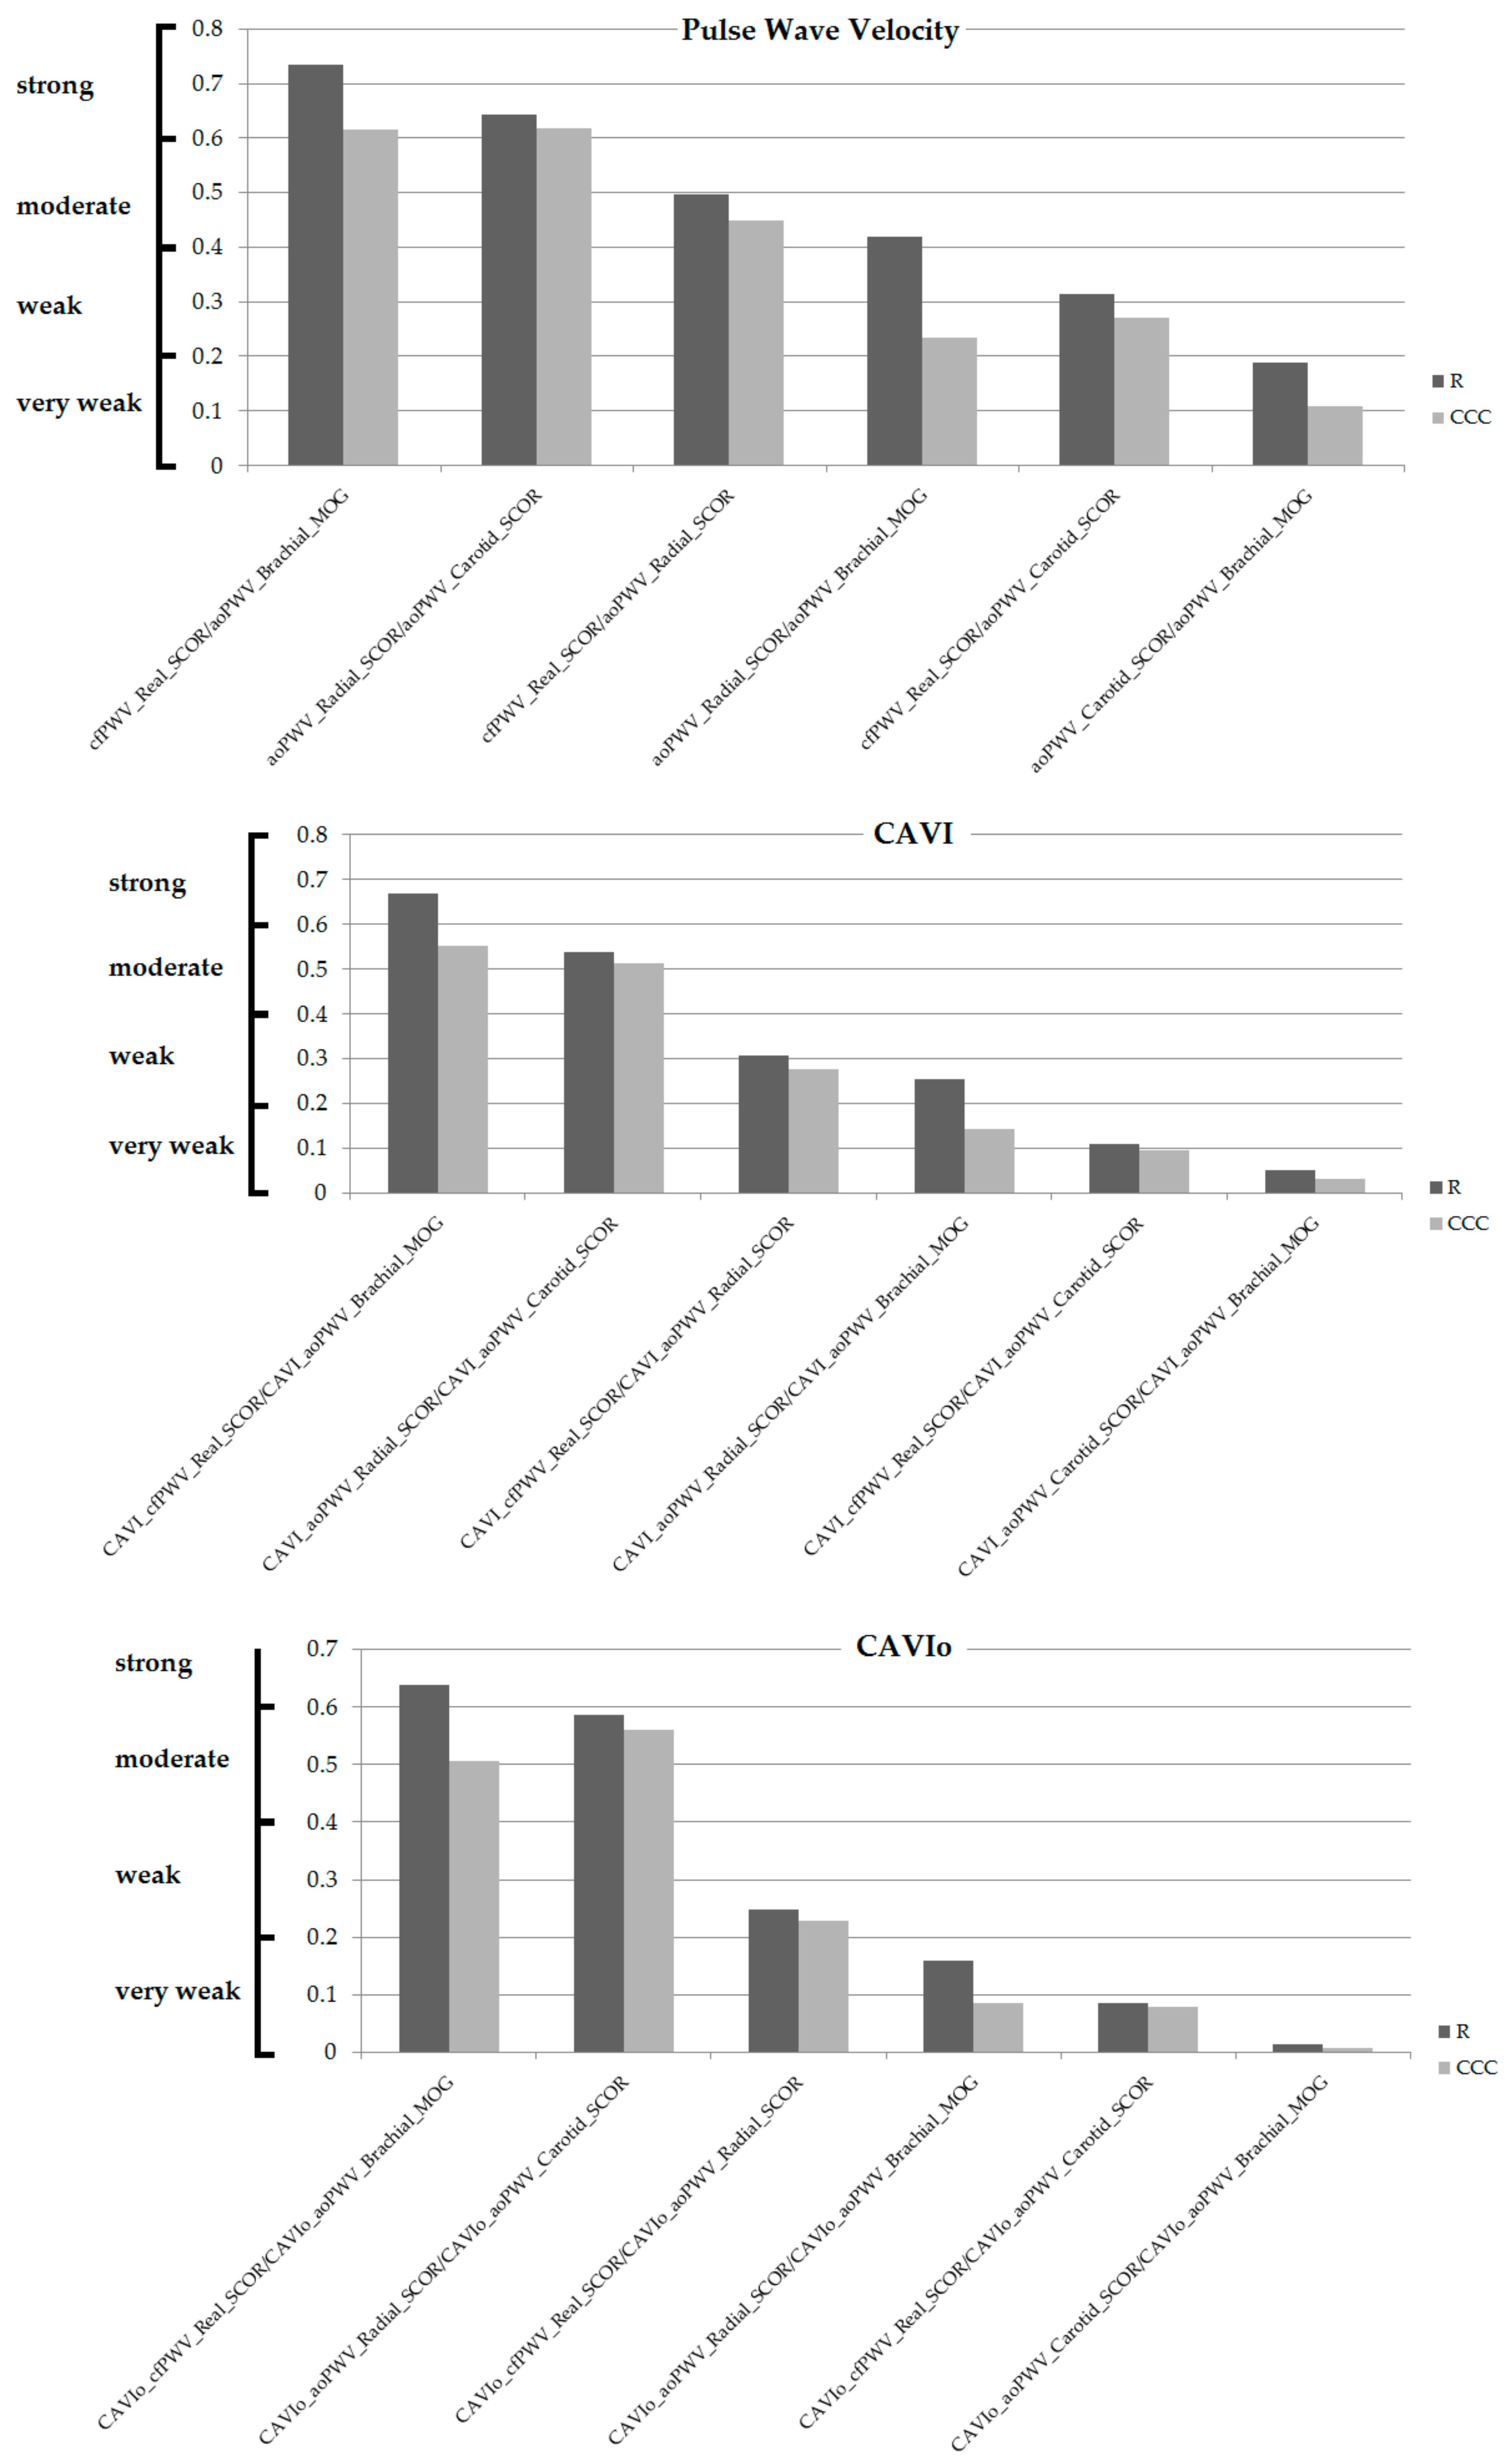
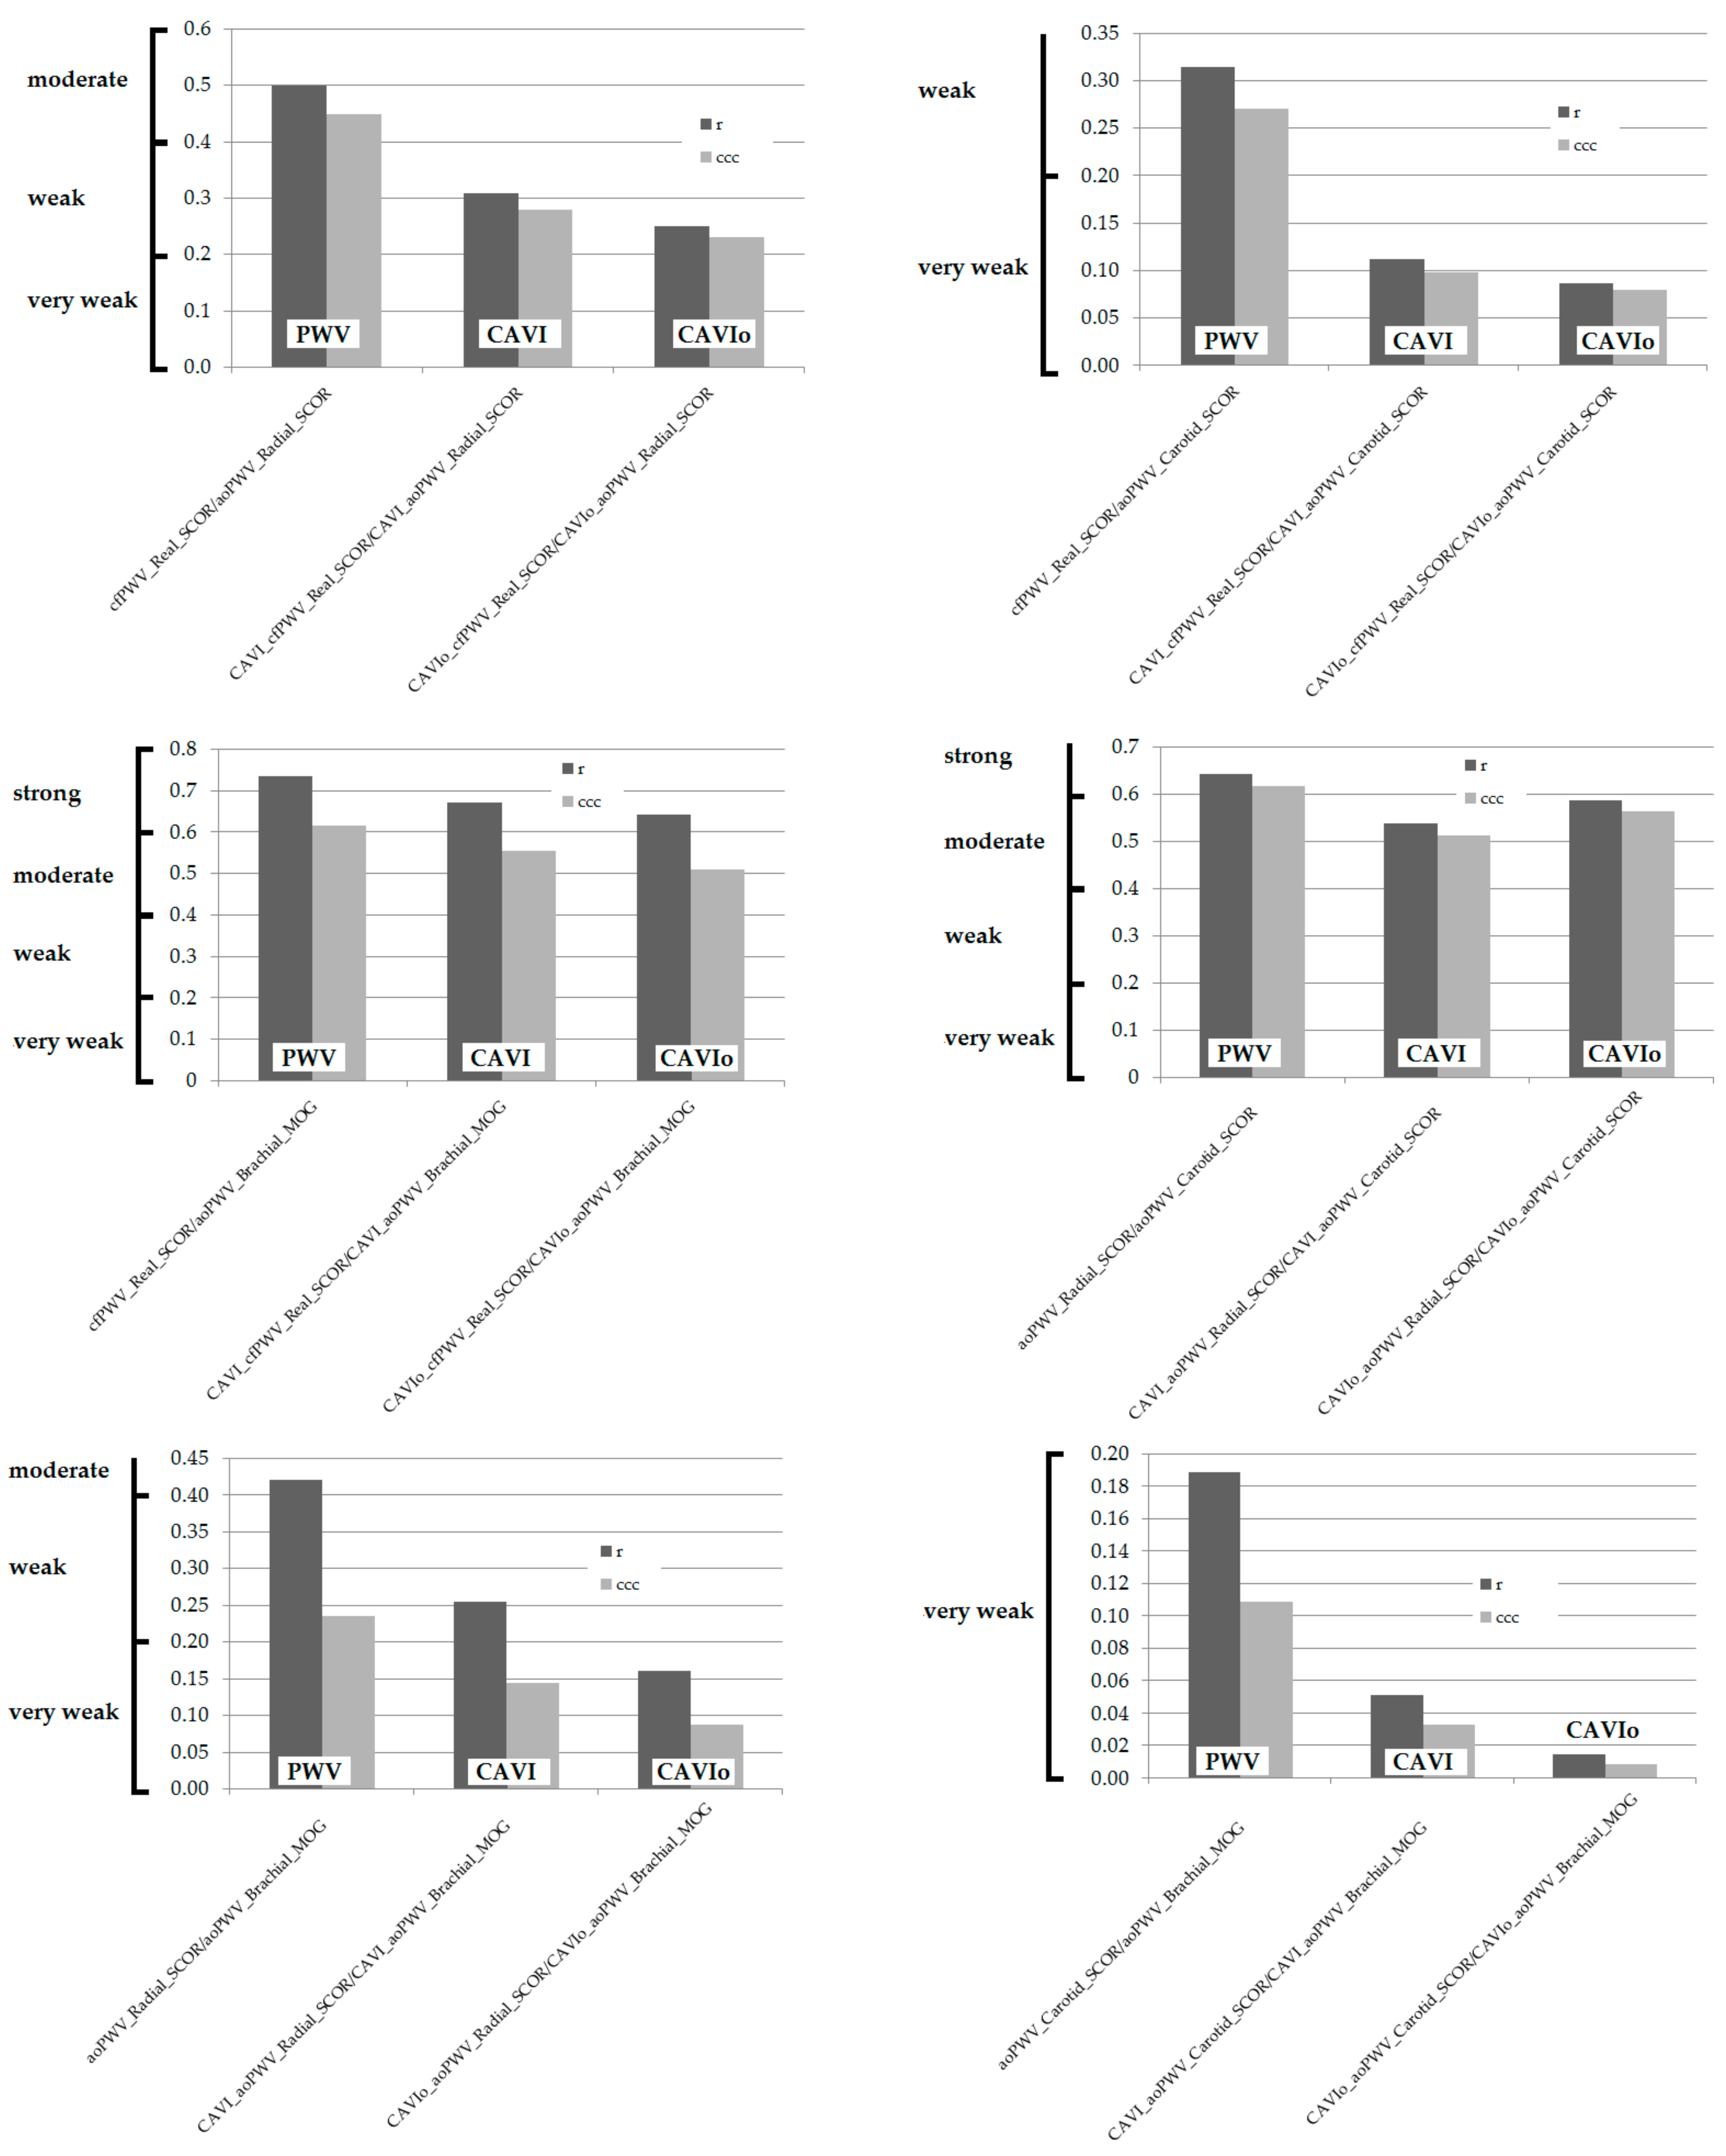
3.2. Association between Arterial Stiffness Parameters Obtained with Different Devices and/or Algorithms
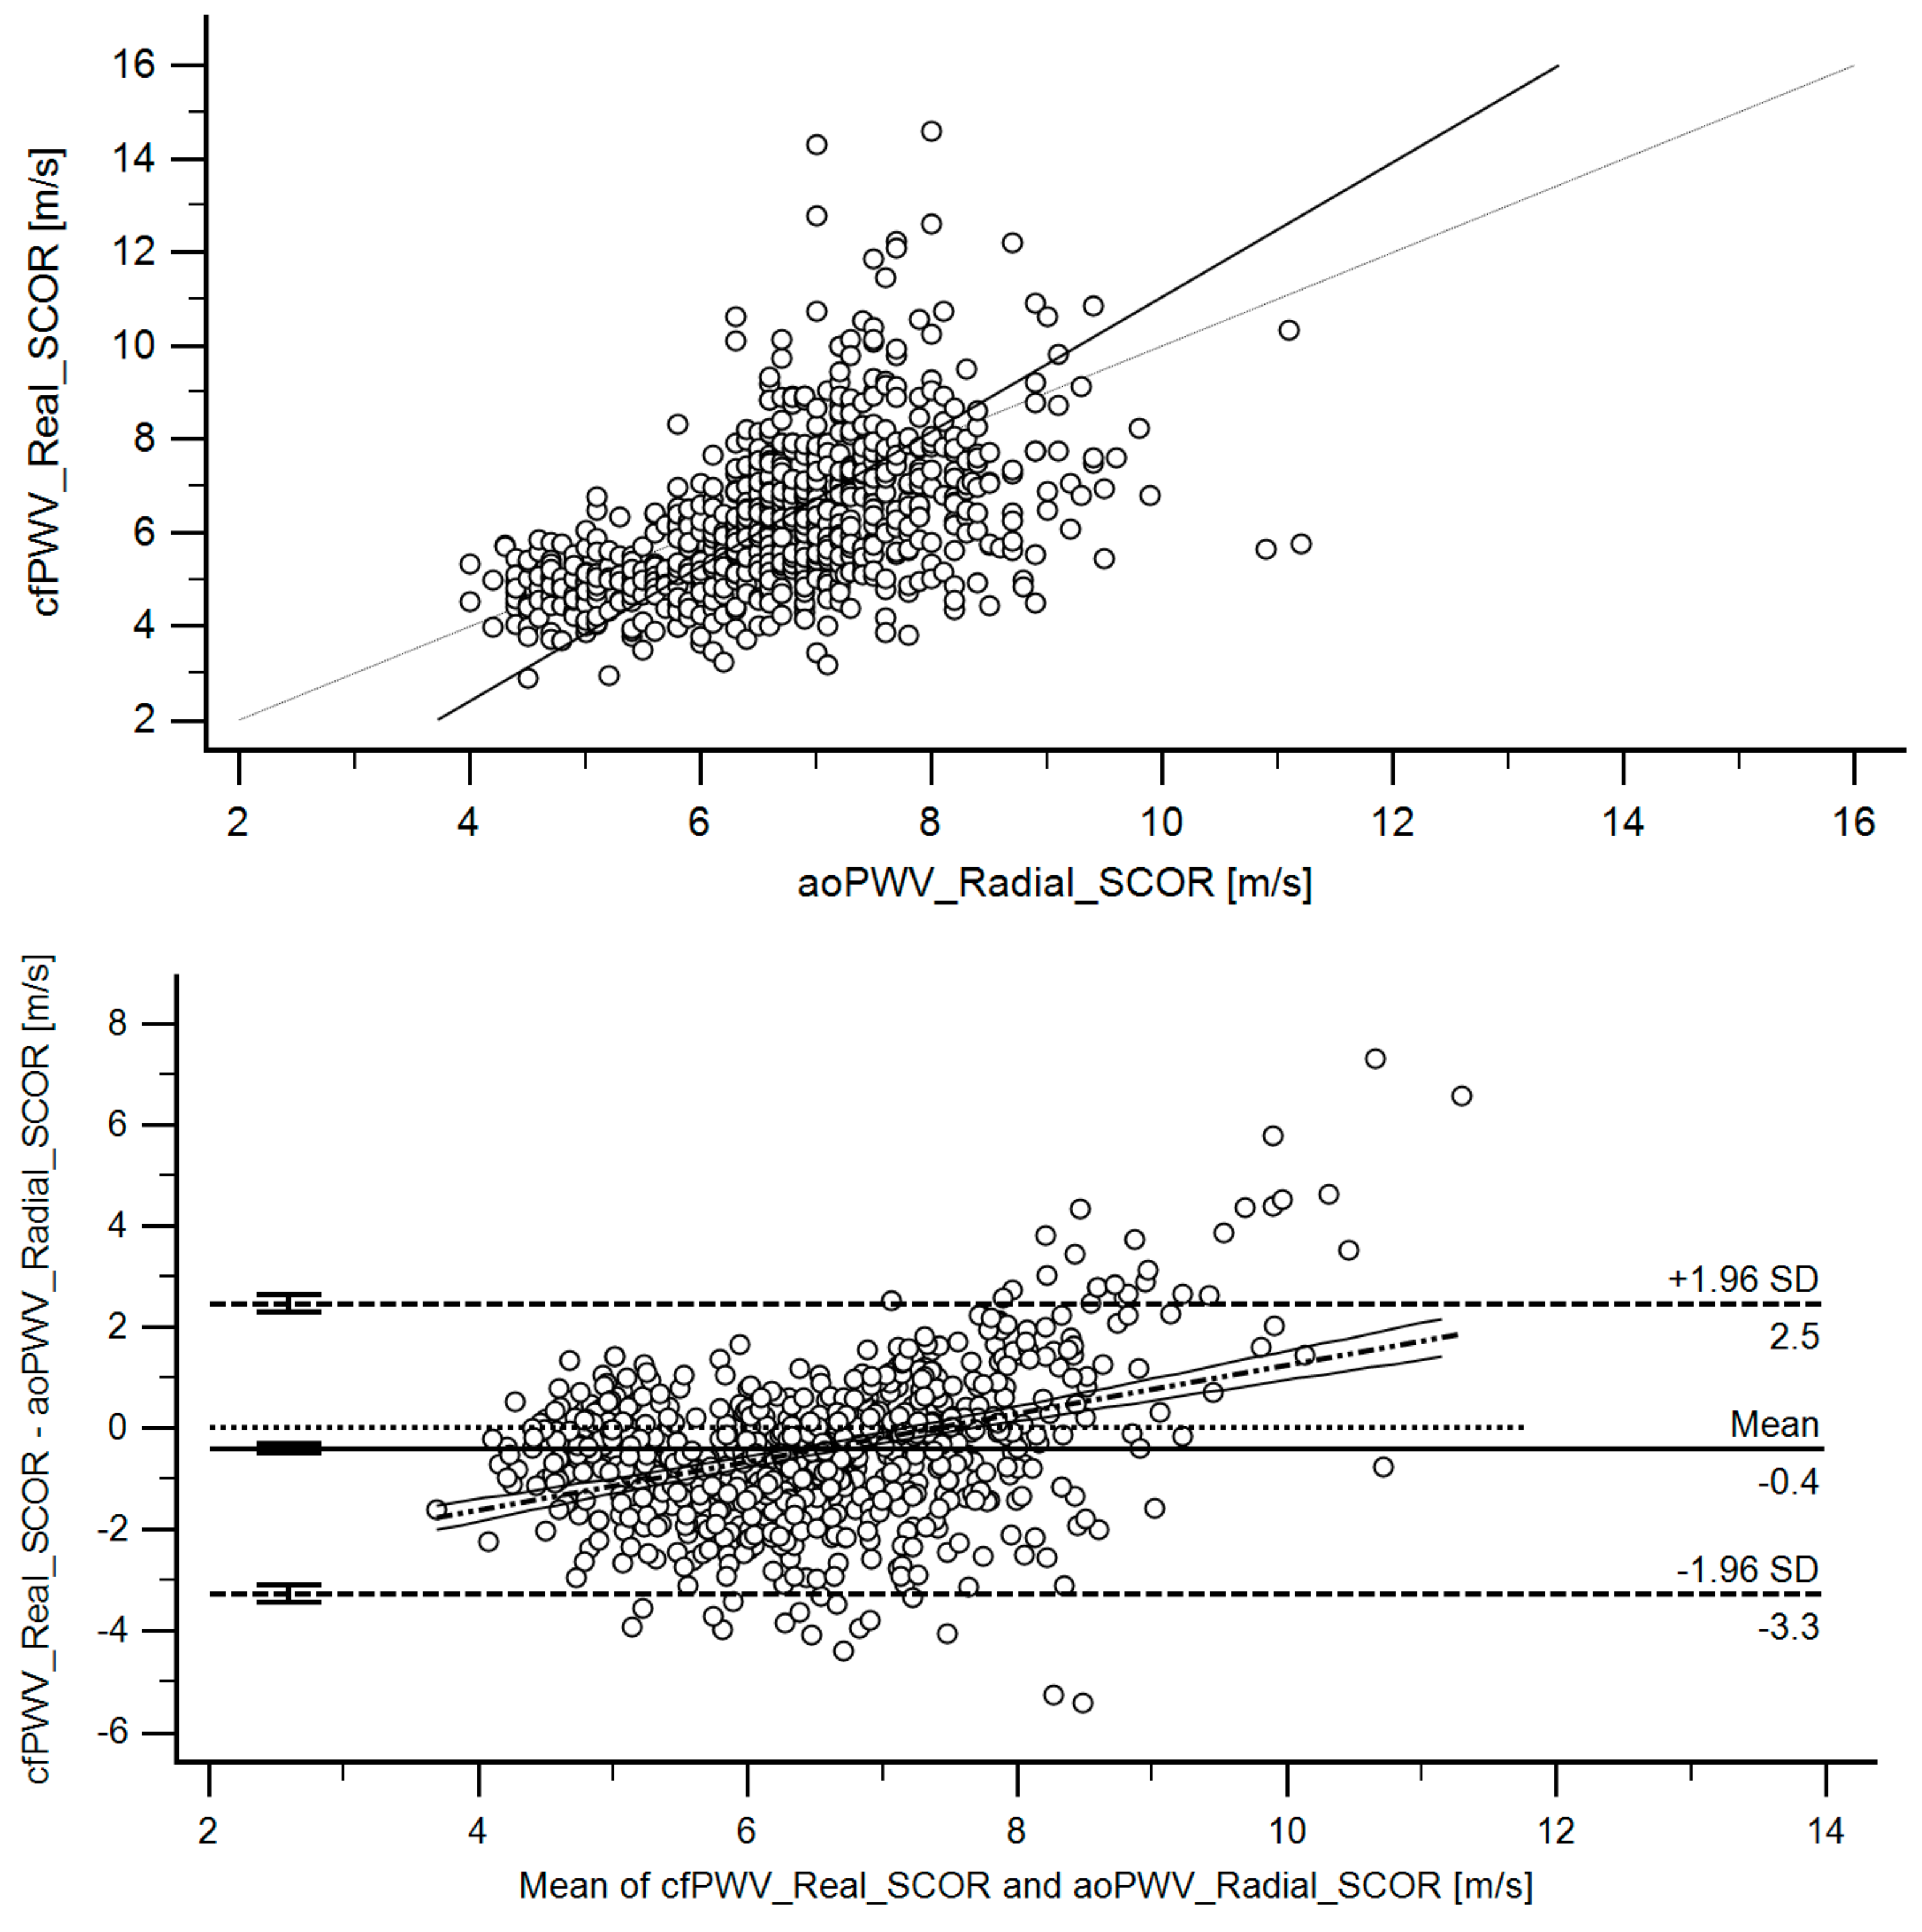
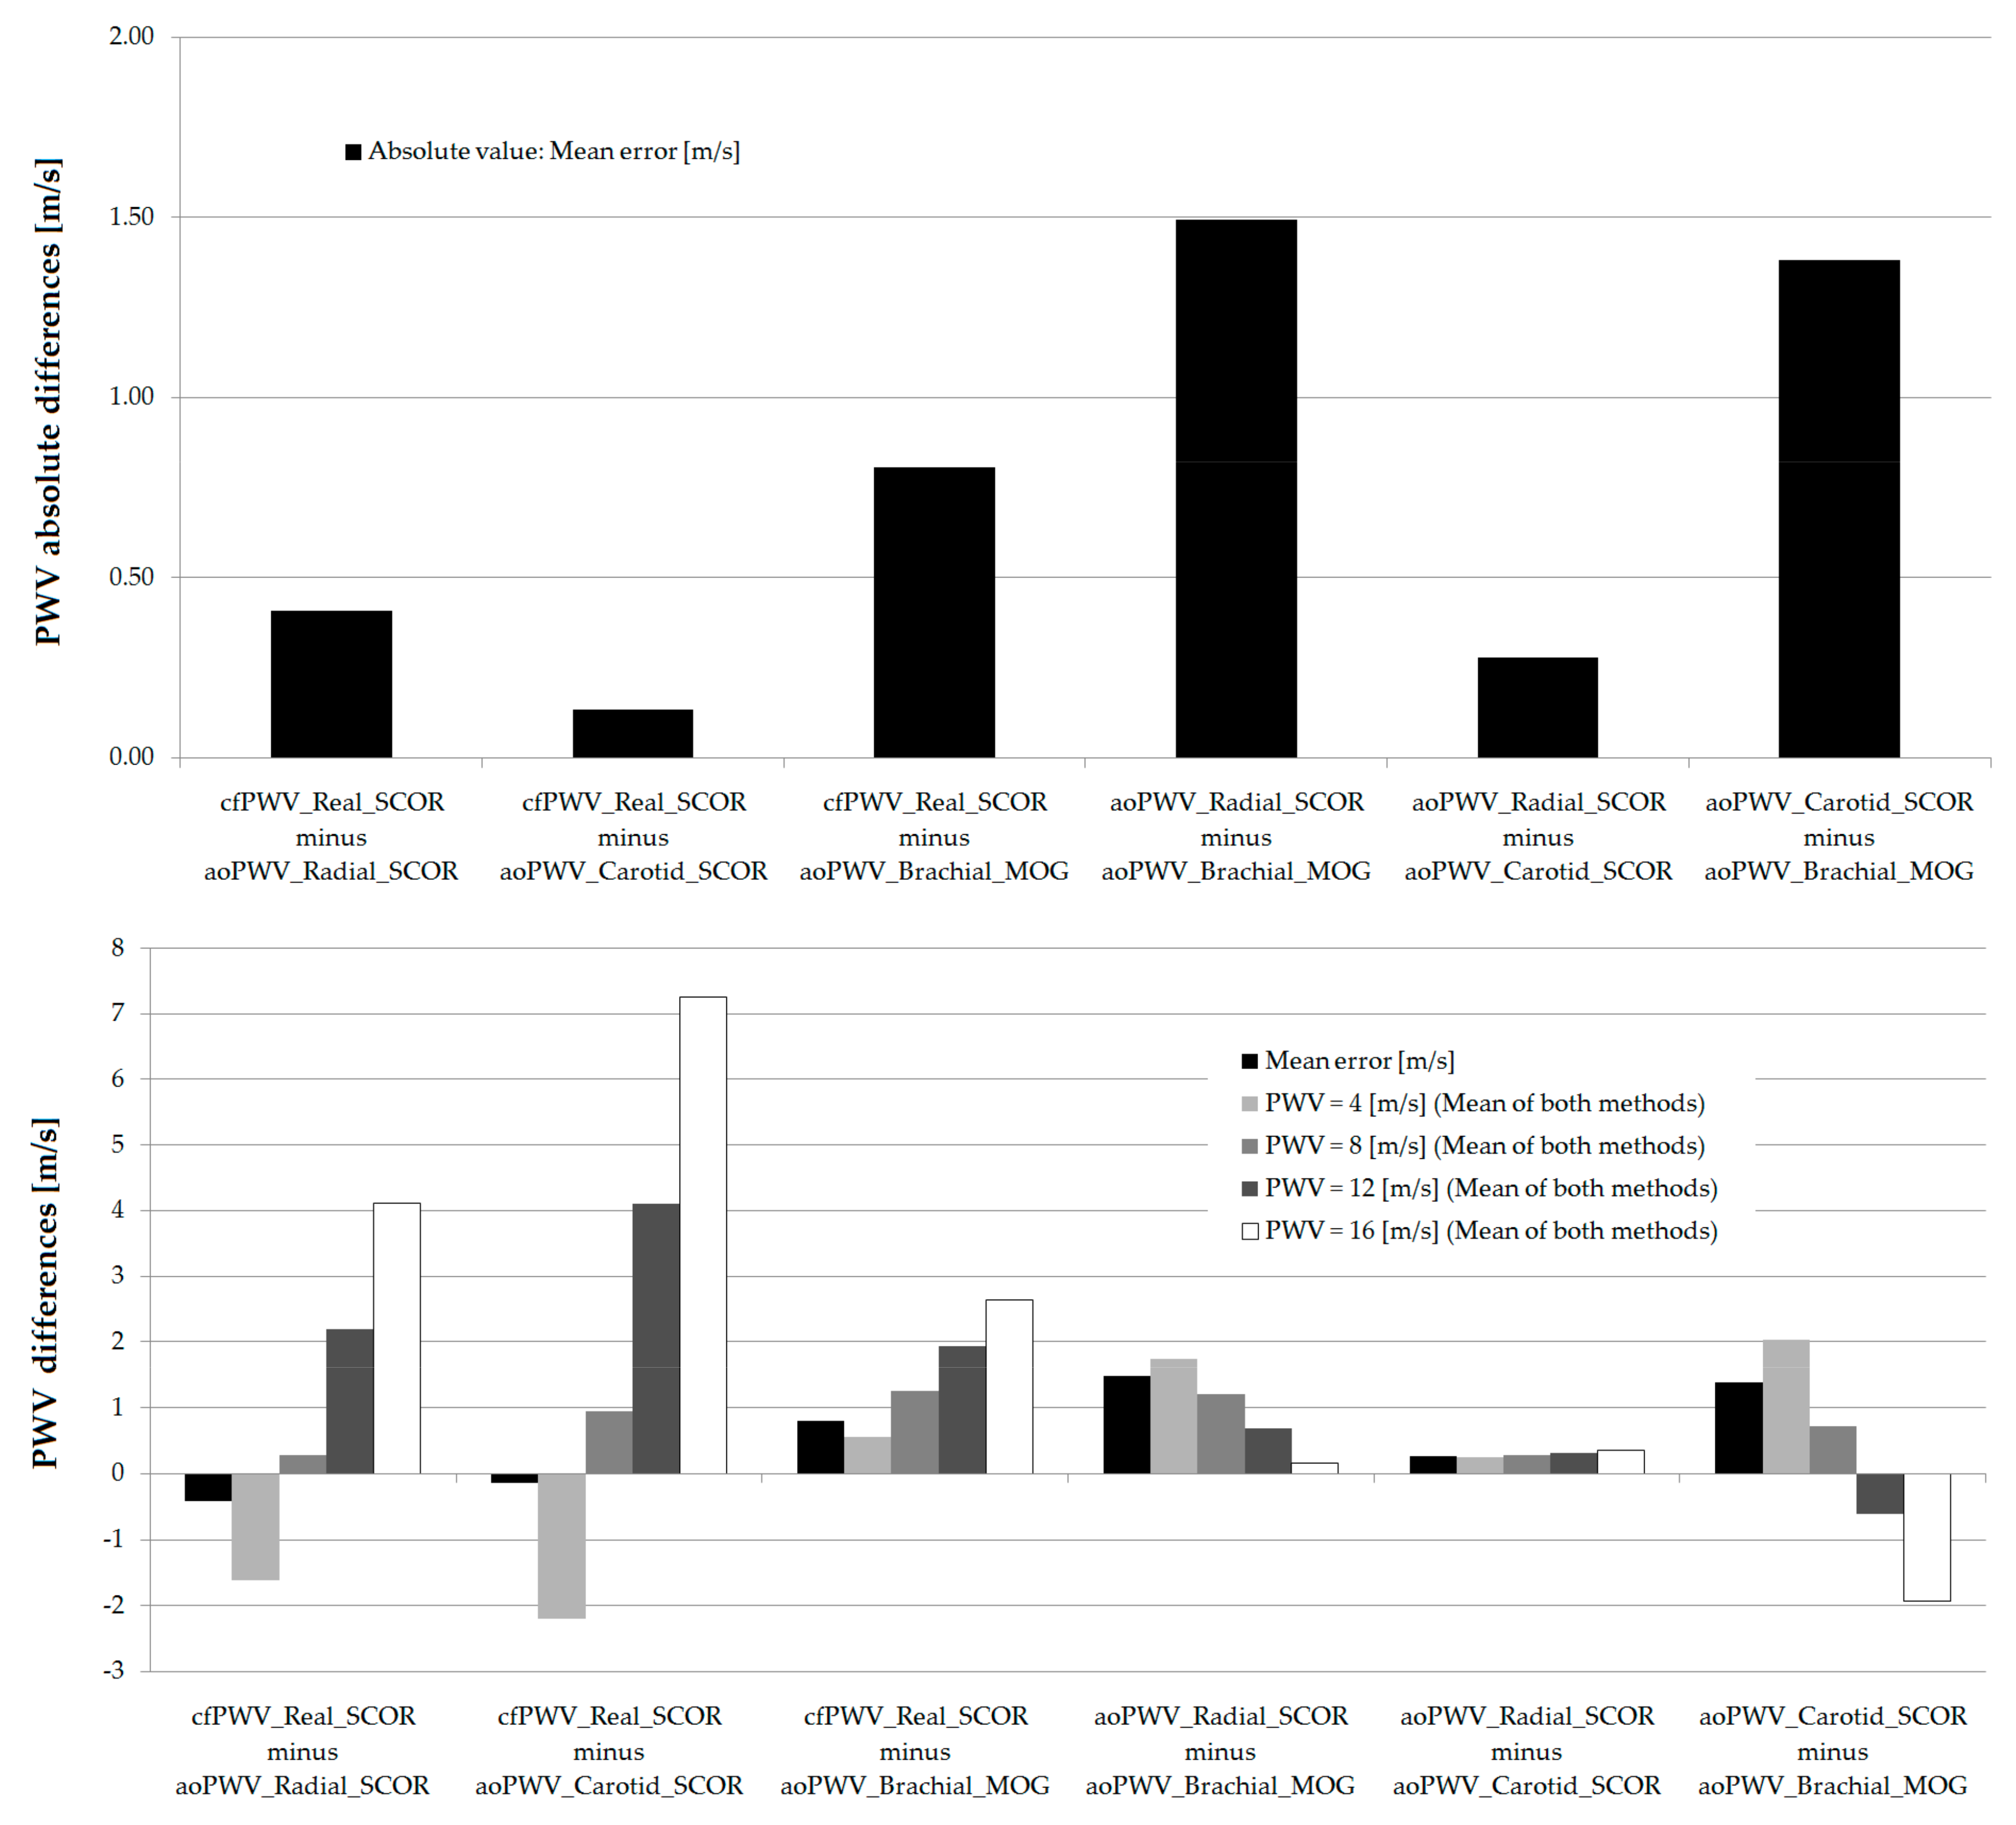
3.3. Agreement between Stiffness Parameters Obtained with Different Devices and/or Algorithms
3.4. Arterial Stiffness and Atherosclerotic Plaques in Asymptomatic Subjects
3.5. Arterial Stiffness and Sex Differences
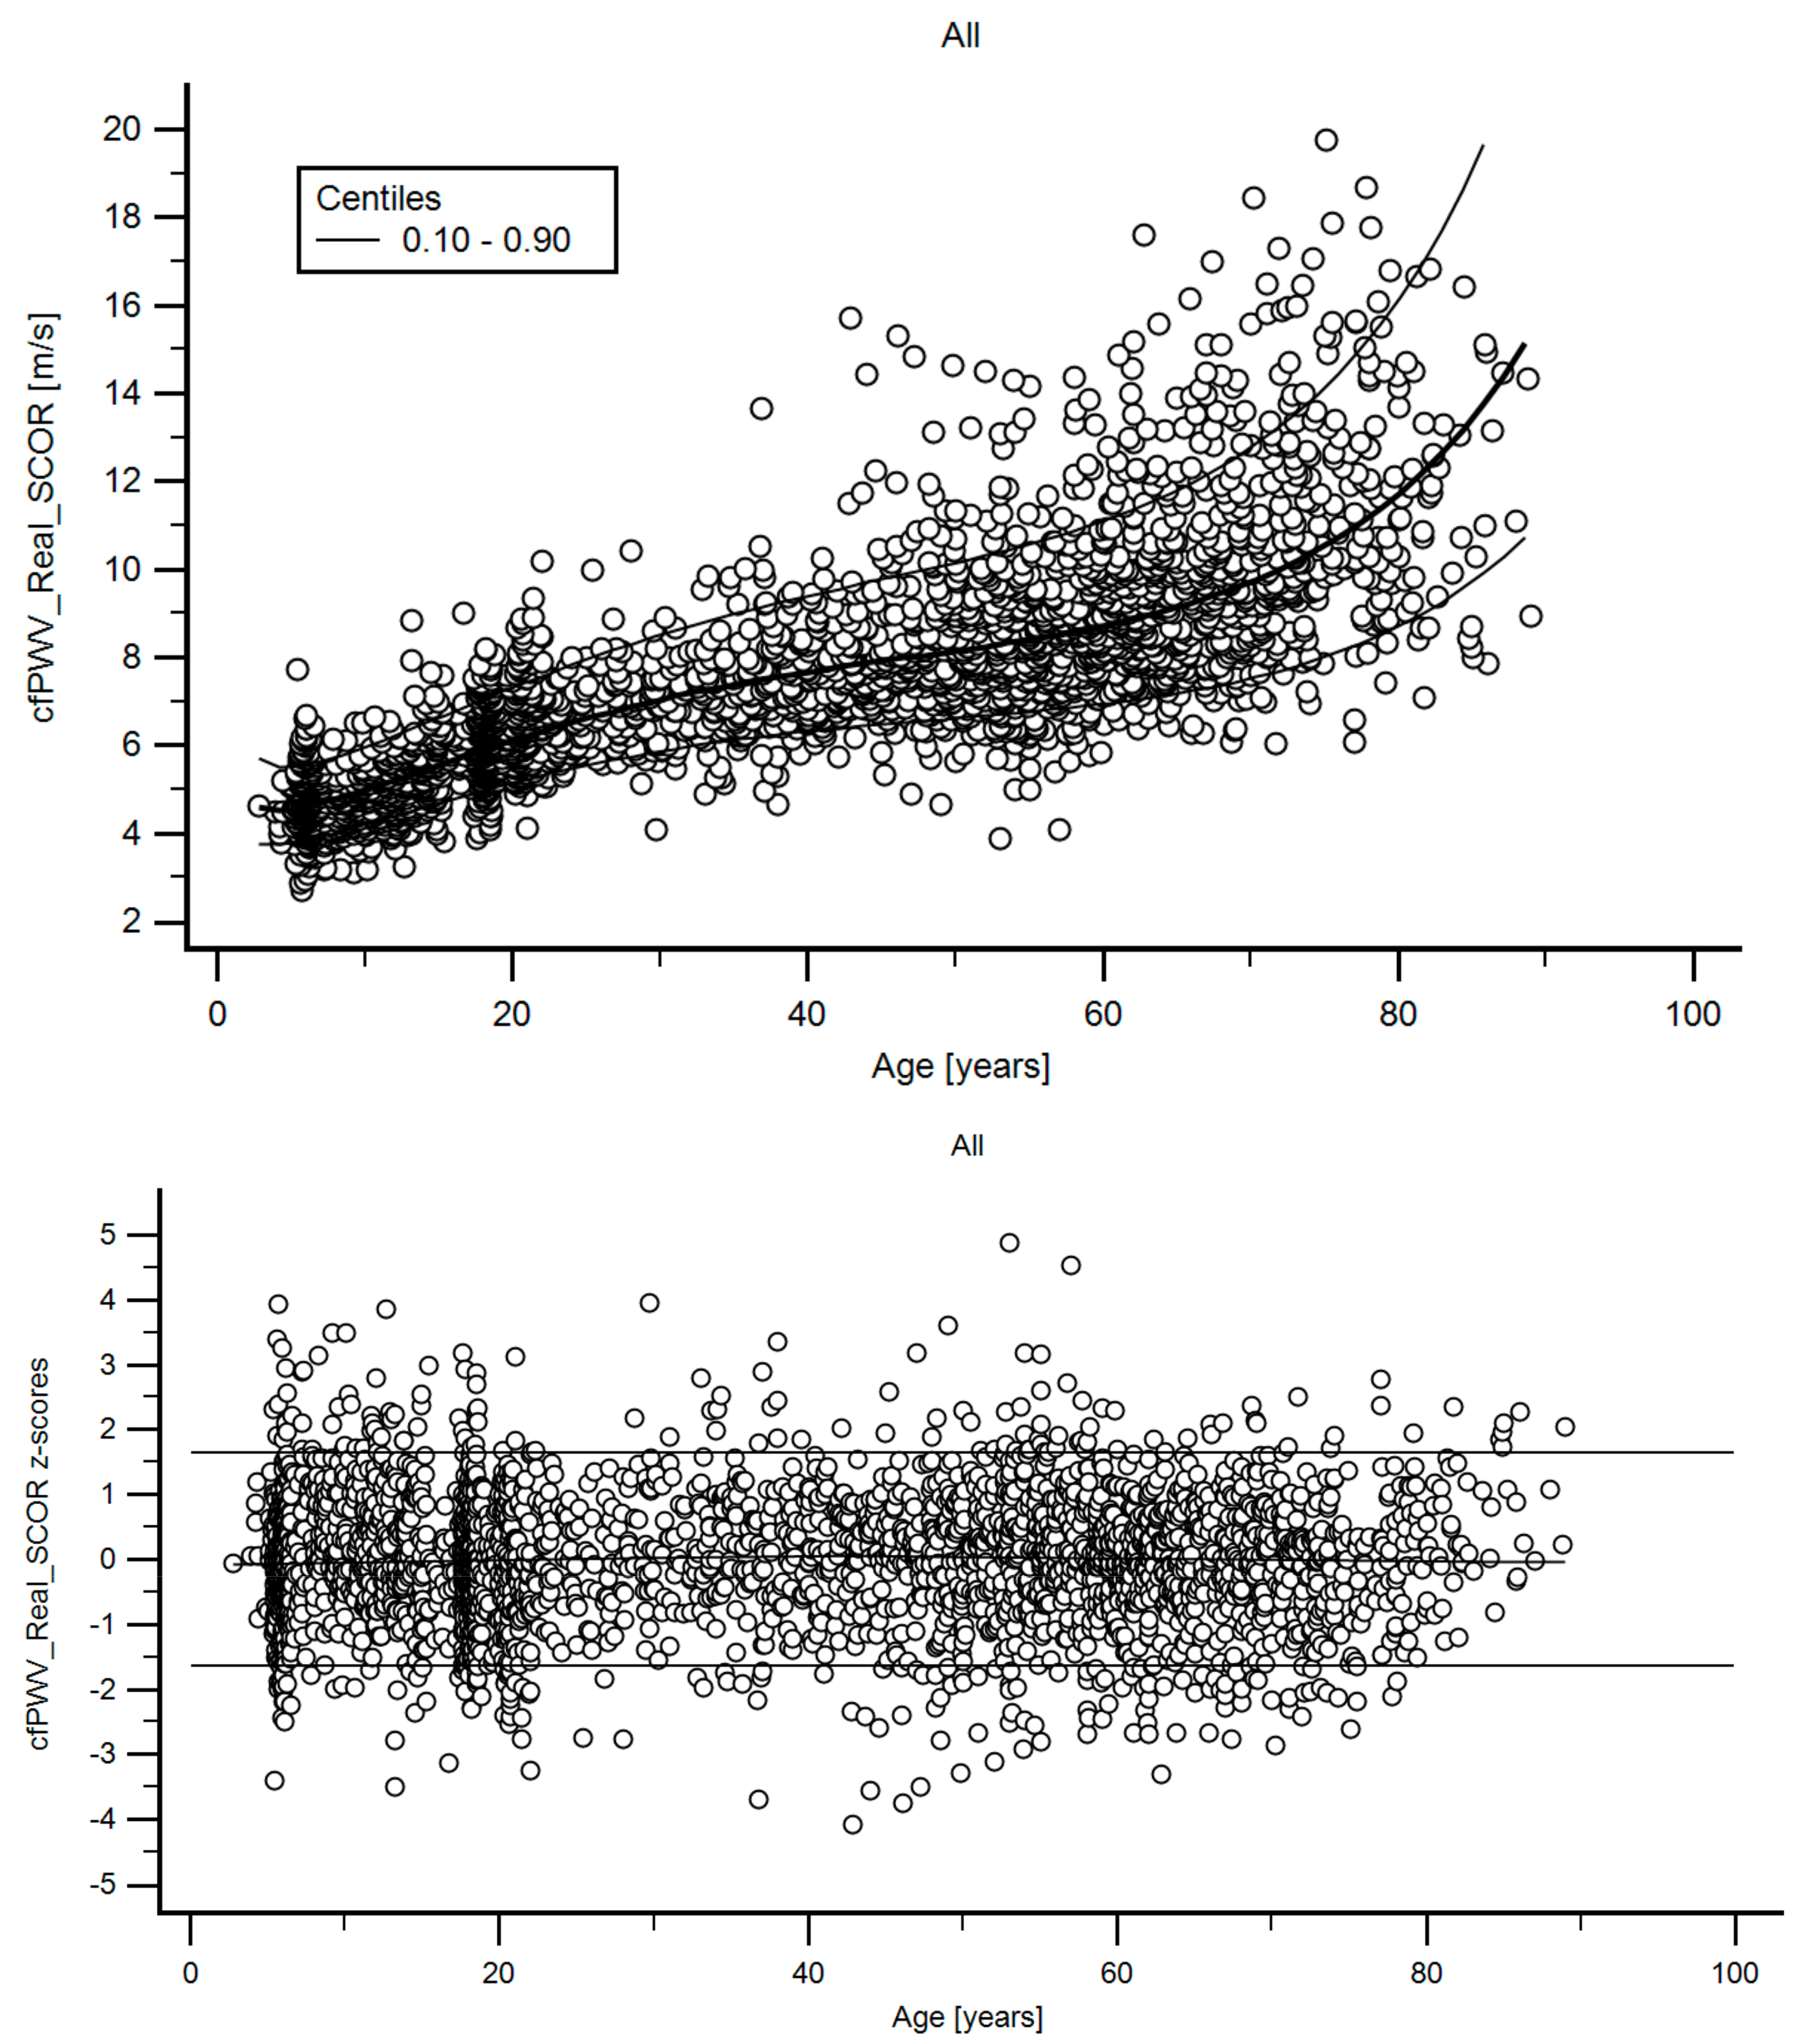
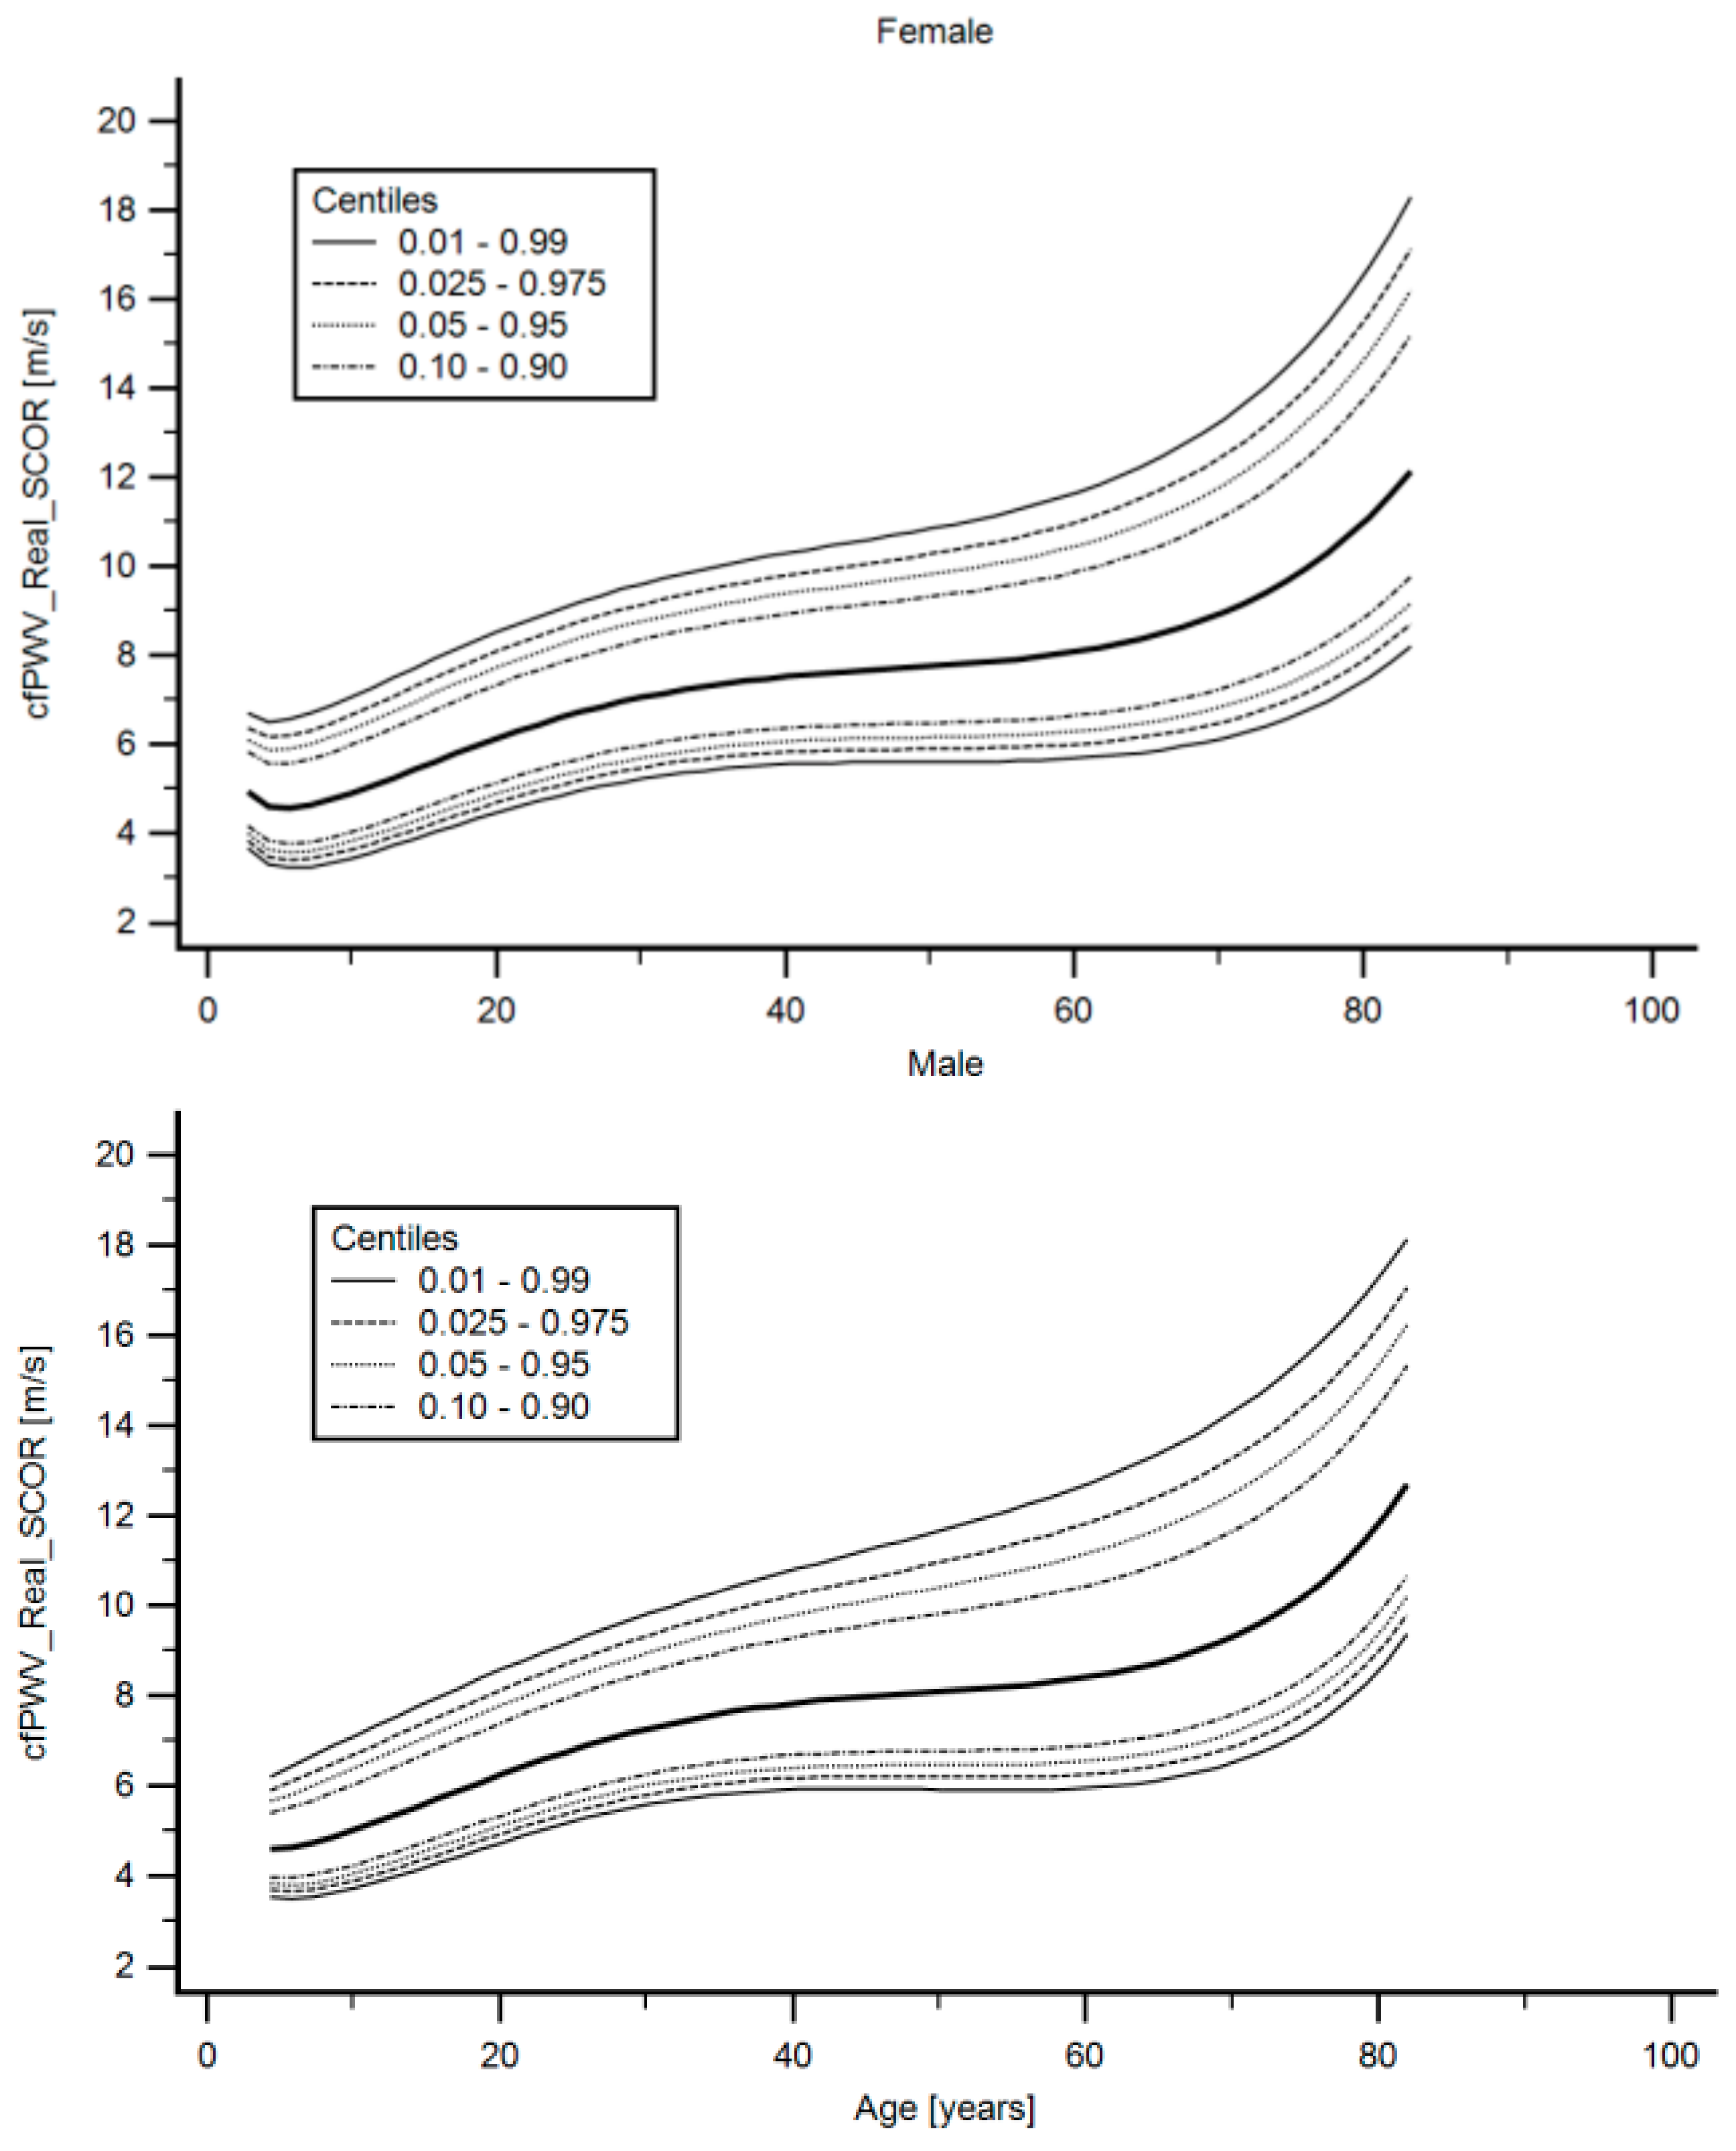
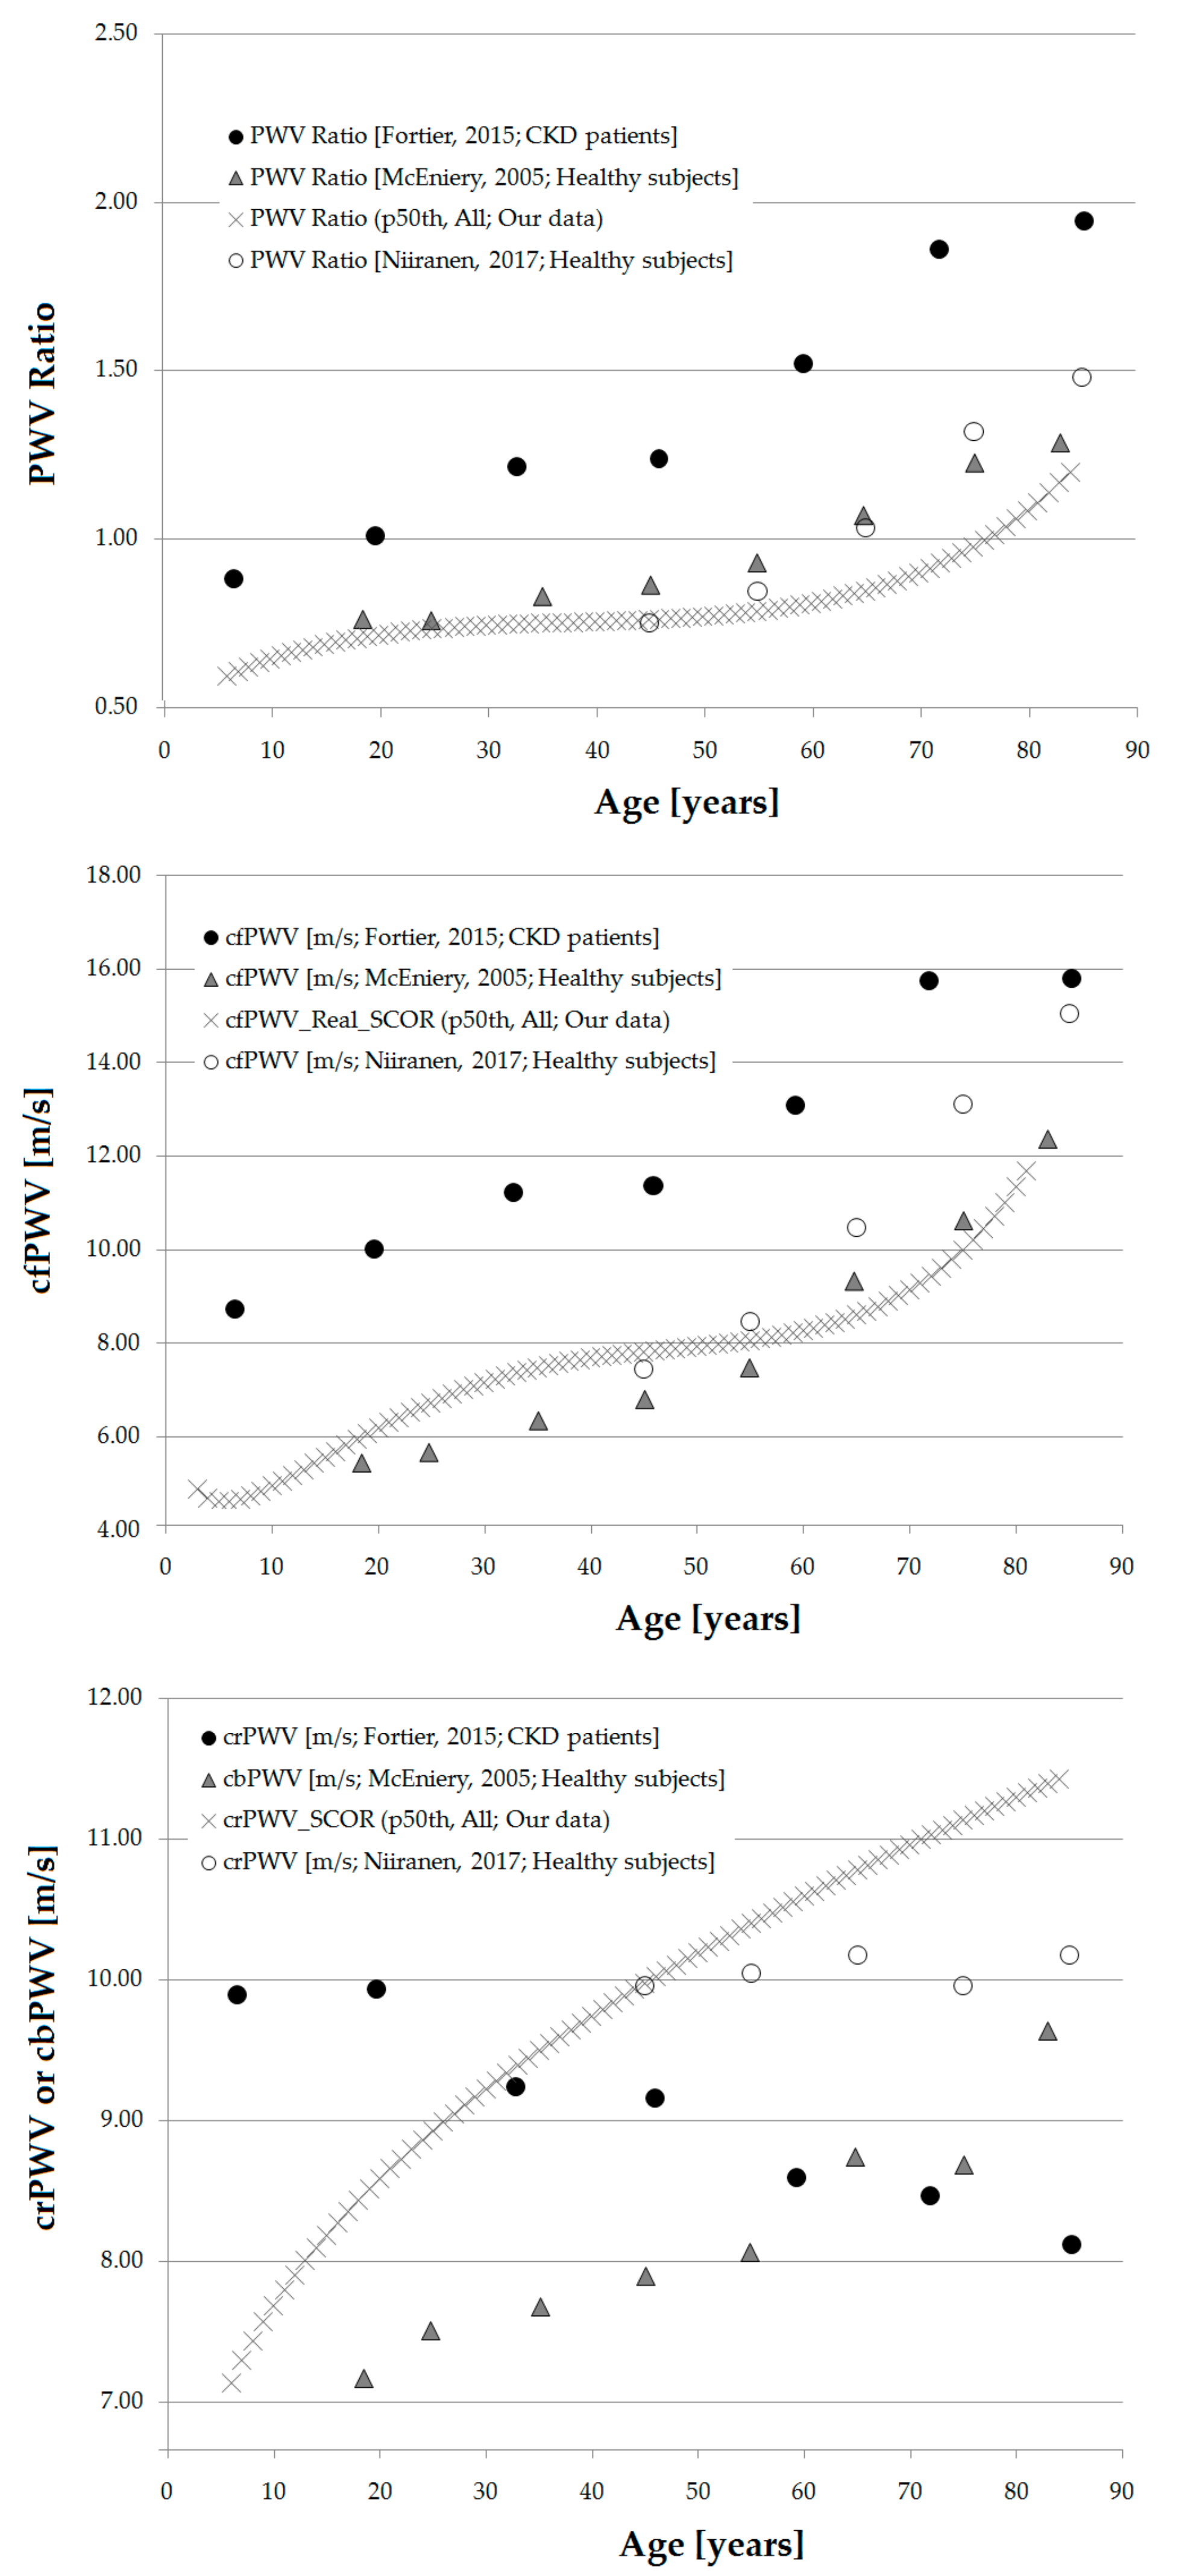
3.6. Age- and Sex-Related Reference Intervals
4. Discussion
4.1. Main Findings
- Third, the need for sex-specific arterial stiffness RIs relied on the approach used to assess stiffness and/or on the age considered. In this respect, according to the measurement system, sex-specific RIs were not necessary, necessary regardless of age or only needed after a certain age (Table 7).
- Fourth, this work’s main result is the definition of population-based reference values for PWV, CAVI and CAVIo indexes, obtained in the same subjects, with different non-invasive approaches. The definition of RIs is an important step when considering the introduction of PWV, CAVI and CAVIo indexes as a tool for the detection of subclinical target organ damage in the general population (Table 8, Table 9, Table 10, Table 11 and Table 12, Supplementary Material 1 (Tables S5–S55)). To our knowledge, this is the first time RIs are defined for the center-to-periphery arterial stiffness ratio (gradient) (Table 13, Supplementary Material 1 (Tables S56–S58)).
4.2. Strengths and Limitations
5. Conclusions
Supplementary Materials
Author Contributions
Funding
Institutional Review Board Statement
Informed Consent Statement
Data Availability Statement
Acknowledgments
Conflicts of Interest
Abbreviations
| Abbreviation | Term |
| aoPWV | Aortic pulse wave velocity |
| bBP | Brachial blood pressure |
| bDBP | Brachial diastolic blood pressure |
| BH | Body height |
| bMBP | Brachial mean blood pressure |
| BMI | Body mass index |
| BP | Blood pressure |
| bPP | Brachial pulse pressure |
| bSBP | Brachial systolic blood pressure |
| BW | Bodyweight |
| CAVI | Cardio-ankle vascular index |
| CCA | Common carotid artery |
| CCC | Concordance correlation coefficients |
| CFA | Common femoral artery |
| cfPWV | Carotid-femoral pulse wave velocity |
| CRFs | Cardiovascular risk factors |
| crPWV | Carotid-radial pulse wave velocity |
| CV | Cardiovascular |
| FPs | Fractional polynomials |
| GTF | General transfer function |
| HR | Heart rate |
| Ln | Natural logarithm |
| MOG | Mobil-O-Graph system or device |
| MV | Mean value |
| PWA | Pulse wave analysis |
| PWV | Pulse wave velocity |
| RIs | Reference intervals |
| SCOR | SphygmoCor system or device |
| SD | Standard deviation |
| WSA | Wave separation analysis |
| y | Years old |
| z- | Z score |
| β | Arterial stiffness index |
| β-PWV | Beta-PWV (or CAVI or CAVIo) |
| ρ | Blood mass density |
References
- Cavalcante, J.L.; Lima, J.A.; Redheuil, A.; Al-Mallah, M.H. Aortic stiffness: Current understanding and future directions. J Am. Coll. Cardiol. 2011, 57, 1511–1522. [Google Scholar] [CrossRef] [PubMed] [Green Version]
- Lee, H.Y.; Oh, B.H. Aging and arterial stiffness. Circ. J. 2010, 74, 2257–2262. [Google Scholar] [CrossRef] [PubMed] [Green Version]
- Kim, H.L.; Kim, S.H. Pulse Wave Velocity in Atherosclerosis. Front. Cardiovasc. Med. 2019, 6, 41. [Google Scholar] [CrossRef]
- Van Bortel, L.M.; Laurent, S.; Boutouyrie, P.; Chowienczyk, P.; Cruickshank, J.K.; De Backer, T.; Filipovsky, J.; Huybrechts, S.; Mattace-Raso, F.U.; Protogerou, A.D.; et al. European Society of Hypertension Working Group on Vascular Structure and Function; European Network for Noninvasive Investigation of Large Arteries. Expert consensus document on the measurement of aortic stiffness in daily practice using carotid-femoral pulse wave velocity. J. Hypertens. 2012, 30, 445–448. [Google Scholar] [PubMed] [Green Version]
- Jurko, T.; Mestanik, M.; Jurko, A., Jr.; Spronck, B.; Avolio, A.; Mestanikova, A.; Sekaninova, N.; Tonhajzerova, I. Pediatric reference values for arterial stiffness parameters cardio-ankle vascular index and CAVI0. J. Am. Soc. Hypertens. 2018, 12, e35–e43. [Google Scholar] [CrossRef]
- Shirai, K.; Utino, J.; Otsuka, K.; Takata, M. A novel blood pressure independent arterial wall stiffness parameter; cardio-ankle vascular index (CAVI). J. Atheroscler. Thromb. 2006, 13, 101–107. [Google Scholar] [CrossRef] [Green Version]
- Wassertheurer, S.; Hametner, B.; Mayer, C.C.; Hafez, A.; Negishi, K.; Papaioannou, T.G.; Protogerou, A.D.; Sharman, J.E.; Weber, T. Aortic systolic pressure derived with different calibration methods: Associations to brachial systolic pressure in the general population. Blood Press Monit. 2018, 23, 134–140. [Google Scholar] [CrossRef]
- Yu, S.; McEniery, C.M. Central Versus Peripheral Artery Stiffening and Cardiovascular Risk. Arterioscler. Thromb. Vasc. Biol. 2020, 40, 1028–1033. [Google Scholar] [CrossRef]
- Castro, J.M.; García-Espinosa, V.; Zinoveev, A.; Marin, M.; Severi, C.; Chiesa, P.; Bia, D.; Zócalo, Y. Arterial structural and functional characteristics at end of early Ccildhood and beginning of adulthood: Impact of body size gain during early, intermediate, late and global growth. J. Cardiovasc. Dev. Dis. 2019, 6, 33. [Google Scholar] [CrossRef] [Green Version]
- Santana, D.B.; Zócalo, Y.A.; Armentano, R.L. Integrated e-Health approach based on vascular ultrasound and pulse wave analysis for asymptomatic atherosclerosis detection and cardiovascular risk stratification in the community. IEEE Trans. Inf. Technol. Biomed. 2012, 16, 287–294. [Google Scholar] [CrossRef]
- Santana, D.B.; Zócalo, Y.A.; Ventura, I.F.; Arrosa, J.F.; Florio, L.; Lluberas, R.; Armentano, R.L. Health informatics design for assisted diagnosis of subclinical atherosclerosis, structural, and functional arterial age calculus and patient-specific cardiovascular risk evaluation. IEEE Trans. Inf. Technol. Biomed. 2012, 16, 943–951. [Google Scholar] [CrossRef] [PubMed]
- Zinoveev, A.; Castro, J.M.; García-Espinosa, V.; Marin, M.; Chiesa, P.; Bia, D.; Zócalo, Y. Aortic pressure and forward and backward wave components in children, adolescents and young-adults: Agreement between brachial oscillometry, radial and carotid tonometry data and analysis of factors associated with their differences. PLoS ONE 2019, 14, e0226709. [Google Scholar] [CrossRef] [PubMed] [Green Version]
- Zócalo, Y.; García-Espinosa, V.; Castro, J.M.; Zinoveev, A.; Marin, M.; Chiesa, P.; Díaz, A.; Bia, D. Stroke volume and cardiac output non-invasive monitoring based on brachial oscillometry-derived pulse contour analysis: Explanatory variables and reference intervals throughout life (3–88 years). Cardiol. J. 2020, in press. [Google Scholar]
- Mancia, G.; De Backer, G.; Dominiczak, A.; Cifkova, R.; Fagard, R.; Germano, G. Guidelines for the management of arterial hypertension: The Task Force for the Management of Arterial Hypertension of the European Society of Hypertension (ESH) and of the European Society of Cardiology (ESC). Eur. Heart J. 2007, 28, 1462–1536. [Google Scholar]
- World Health Organization. Definition, Diagnosis, and Classification of Diabetes Mellitus and Its Complications: Report of a WHO Consultation. Part 1: Diagnosis and Classification of Diabetes Mellitus; WHO: Geneva, Switzerland, 1999. [Google Scholar]
- Wilson, P.W.; D’Agostino, R.B.; Levy, D.; Belanger, A.M.; Silbershatz, H.; Kannel, W.B. Prediction of coronary heart disease using risk factor categories. Circulation 1998, 97, 1837–1847. [Google Scholar] [CrossRef] [Green Version]
- WHO. Obesity: Preventing and Managing the Global Epidemic; World Health Organization: Geneva, Switzerland, 2000. [Google Scholar]
- Bossuyt, J.; Engelen, L.; Ferreira, I.; Stehouwer, C.D.; Boutouyrie, P.; Laurent, S.; Segers, P.; Reesink, K.; Van Bortel, L.M. Reference Values for Arterial Measurements Collaboration. Reference values for local arterial stiffness. Part B: Femoral artery. J. Hypertens. 2015, 33, 1997–2009. [Google Scholar] [CrossRef]
- Engelen, L.; Bossuyt, J.; Ferreira, I.; van Bortel, L.M.; Reesink, K.D.; Segers, P.; Stehouwer, C.D.; Laurent, S.; Boutouyrie, P. Reference Values for Arterial Measurements Collaboration. Reference values for local arterial stiffness. Part A: Carotid artery. J. Hypertens. 2015, 33, 1981–1996. [Google Scholar] [CrossRef]
- Engelen, L.; Ferreira, I.; Stehouwer, C.D.; Boutouyrie, P.; Laurent, S. Reference Values for Arterial Measurements Collaboration. Reference intervals for common carotid intima-media thickness measured with echotracking: Relation with risk factors. Eur. Heart J. 2013, 34, 2368–2380. [Google Scholar] [CrossRef] [Green Version]
- Herbert, A.; Cruickshank, J.K.; Laurent, S.; Boutouyrie, P. Reference Values for Arterial Measurements Collaboration. Establishing reference values for central blood pressure and its amplification in a general healthy population and according to cardiovascular risk factors. Eur. Heart J. 2014, 35, 3122–3133. [Google Scholar] [CrossRef] [Green Version]
- Marin, M.; Bia, D.; Zócalo, Y. Carotid and Femoral Atherosclerotic Plaques in Asymptomatic and Non-Treated Subjects: Cardiovascular Risk Factors, 10-Years Risk Scores, and Lipid Ratios´ Capability to Detect Plaque Presence, Burden, Fibro-Lipid Composition and Geometry. J. Cardiovasc. Dev. Dis. 2020, 7, 11. [Google Scholar] [CrossRef] [Green Version]
- Zócalo, Y.; Bia, D. Ultrasonografía carotídea para detección de placas de ateroma y medición del espesor íntima-media; índice tobillo-brazo: Evaluación no invasivaen la práctica clínica: Importancia clínica y análisis de las bases metodológicas para su evaluación. Rev. Urug. Cardiol. 2016, 31, 47–60. [Google Scholar]
- Farro, I.; Bia, D.; Zócalo, Y.; Torrado, J.; Farro, F.; Florio, L.; Olascoaga, A.; Alallón, W.; Lluberas, R.; Armentano, R.L. Pulse wave velocity as marker of preclinical arterial disease: Reference levels in a uruguayan population considering wave detection algorithms, path lengths, aging, and blood pressure. Int. J. Hypertens. 2012, 2012, 169359. [Google Scholar] [CrossRef] [PubMed]
- Bia, D.; Zócalo, Y. Rigidez arterial: Evaluación no invasiva en la práctica clínica Importancia clínica y análisis de las bases metodológicas de los equipos disponibles para su evaluación. Rev. Urug. Cardiol. 2014, 29, 39–59. [Google Scholar]
- Boutouyrie, P.; Briet, M.; Collin, C.; Vermeersch, S.; Pannier, B. Assessment of pulse wave velocity. Artery Res. 2009, 3, 3–8. [Google Scholar] [CrossRef]
- Reference Values for Arterial Stiffness’ Collaboration. Determinants of pulse wave velocity in healthy people and in the presence of cardiovascular risk factors: ‘establishing normal and reference values’. Eur. Heart J. 2010, 31, 2338–2350. [Google Scholar] [CrossRef] [PubMed]
- Bia, D.; Valtuille, R.; Galli, C.; Wray, S.; Armentano, R.; Zócalo, Y.; Cabrera-Fischer, E. Aortic-Radial Pulse Wave Velocity Ratio in End-stage Renal Disease Patients: Association with Age, Body Tissue Hydration Status, Renal Failure Etiology and Five Years of Hemodialysis. High Blood Press Cardiovasc. Prev. 2017, 24, 37–48. [Google Scholar] [CrossRef] [PubMed]
- Bia, D.; Galli, C.; Zocalo, Y.; Valtuille, R.; Wray, S.; Pessana, F.; Cabrera-Fischer, E.I. Central-To-Peripheral Arterial Stiffness Gradient in Hemodialyzed Patients Depends on the Location of the Upper-limb Vascular Access. Curr. Hypertens. Rev. 2018, 14, 128–136. [Google Scholar] [CrossRef]
- Salvi, P.; Scalise, F.; Rovina, M.; Moretti, F.; Salvi, L.; Grillo, A.; Gao, L.; Baldi, C.; Faini, A.; Furlanis, G.; et al. Noninvasive Estimation of Aortic Stiffness Through Different Approaches. Hypertension 2019, 74, 117–129. [Google Scholar] [CrossRef] [Green Version]
- Wohlfahrt, P.; Krajčoviechová, A.; Seidlerová, J.; Mayer, O.; Bruthans, J.; Filipovský, J.; Laurent, S.; Cífková, R. Arterial stiffness parameters: How do they differ? Atherosclerosis 2013, 231, 359–364. [Google Scholar] [CrossRef]
- Bia, D.; Galli, C.; Valtuille, R.; Zócalo, Y.; Wray, S.A.; Armentano, R.L.; Cabrera-Fischer, E.I. Hydration Status Is Associated with Aortic Stiffness, but Not with Peripheral Arterial Stiffness, in Chronically Hemodialysed Patients. Int. J. Nephrol. 2015, 2015, 628654. [Google Scholar] [CrossRef] [Green Version]
- Spronck, B.; Delhaas, T.; Butlin, M.; Reesink, K.D.; Avolio, A.P. Options for Dealing with Pressure Dependence of Pulse Wave Velocity as a Measure of Arterial Stiffness: An Update of Cardio-Ankle Vascular Index (CAVI) and CAVI0. Pulse 2018, 5, 106–114. [Google Scholar] [CrossRef] [PubMed]
- Royston, P.; Wright, E. A method for estimating age-specific reference intervals (‘normal ranges’) based on fractional polynomials and exponential transformation. J. R. Stat. Soc. Ser. A Stat. Soc. 1998, 161, 79–101. [Google Scholar] [CrossRef]
- Díaz, A.; Zócalo, Y.; Bia, D. Percentile curves for left ventricle structural, functional and haemodynamic parameters obtained in healthy children and adolescents from echocardiography-derived data. J. Echocardiogr. 2020, 18, 16–43. [Google Scholar] [CrossRef] [PubMed]
- Diaz, A.; Bia, D.; Zócalo, Y.; Manterola, H.; Larrabide, I.; Lo Vercio, L.; Del Fresno, M.; Cabrera Fischer, E. Carotid Intima Media Thickness Reference Intervals for a Healthy Argentinean Population Aged 11–81 Years. Int. J. Hypertens. 2018, 2018, 8086714. [Google Scholar] [CrossRef] [PubMed] [Green Version]
- Díaz, A.; Zócalo, Y.; Bia, D. Normal percentile curves for left atrial size in healthy children and adolescents. Echocardiography 2019, 36, 770–782. [Google Scholar] [CrossRef] [PubMed]
- Bellera, C.A.; Hanley, J.A. A method is presented to plan the required sample size when estimating regression-based reference limits. J. Clin. Epidemiol. 2007, 60, 610–615. [Google Scholar] [CrossRef]
- Lumley, T.; Diehr, P.; Emerson, S.; Chen, L. The importance of the normality assumption in large public health data sets. Annu. Rev. Public Health 2002, 23, 151–169. [Google Scholar] [CrossRef]
- Hayes, A.F. Introduction to mediation, Moderation, and Conditional Proess Analysis (2nd Edition). Available online: http://www.guilford.com/p/hayes3 (accessed on 13 November 2020).
- Evans, J.D. Straightforward Statistics for the Behavioral Sciences; Brooks-Cole Publishing: Pacific Grove, CA, USA, 1996. [Google Scholar]
- Curcio, S.; García-Espinosa, V.; Arana, M.; Farro, I.; Chiesa, P.; Giachetto, G.; Zócalo, Y.; Bia, D. Growing-Related Changes in Arterial Properties of Healthy Children, Adolescents, and Young Adults Nonexposed to Cardiovascular Risk Factors: Analysis of Gender-Related Differences. Int. J. Hypertens. 2016, 2016, 4982676. [Google Scholar] [CrossRef] [Green Version]
- McEniery, C.M.; Yasmin, N.; Hall, I.R.; Qasem, A.; Wilkinson, I.B.; Cockcroft, J.R.; ACCT Investigators. Normal vascular aging: Differential effects on wave reflection and aortic pulse wave velocity: The Anglo-Cardiff Collaborative Trial (ACCT). J. Am. Coll. Cardiol. 2005, 46, 1753–1760. [Google Scholar] [CrossRef] [Green Version]
- Mitchell, G.F.; Hwang, S.J.; Vasan, R.S.; Larson, M.G.; Pencina, M.J.; Hamburg, N.M.; Vita, J.A.; Levy, D.; Benjamin, E.J. Arterial stiffness and cardiovascular events: The Framingham Heart Study. Circulation 2010, 121, 505–511. [Google Scholar] [CrossRef] [Green Version]
- Bia, D.; Aguirre, I.; Zócalo, Y.; Devera, L.; Cabrera-Fischer, E.; Armentano, R. Regional differences in viscosity, elasticity and wall buffering function in systemic arteries: Pulse wave analysis of the arterial pressure-diameter relationship. Rev. Esp. Cardiol. 2005, 58, 167–174. [Google Scholar] [CrossRef] [PubMed] [Green Version]
- Bia, D.; Zócalo, Y.; Cabrera-Fischer, E.; Wray, W.; Armentano, R. Quantitative Analysis of the Relationship between Blood Vessel Wall Constituents and Viscoelastic Properties: Dynamic Biomechanical and Structural In Vitro Studies in Aorta and Carotid Arteries. Physiol. J. 2014. [Google Scholar] [CrossRef]
- Fortier, C.; Desjardins, M.P.; Agharazii, M. Aortic-Brachial Pulse Wave Velocity Ratio: A Measure of Arterial Stiffness Gradient Not Affected by Mean Arterial Pressure. Pulse 2018, 5, 117–124. [Google Scholar] [CrossRef] [PubMed]
- Fortier, C.; Agharazii, M. Arterial Stiffness Gradient. Pulse 2016, 3, 159–166. [Google Scholar] [CrossRef] [Green Version]
- Hashimoto, J.; Ito, S. Central pulse pressure and aortic stiffness determine renal hemodynamics: Pathophysiological implication for microalbuminuria in hypertension. Hypertension 2011, 58, 839–846. [Google Scholar] [CrossRef] [Green Version]
- Tarumi, T.; Shah, F.; Tanaka, H.; Haley, A.P. Association between central elastic artery stiffness and cerebral perfusion in deep subcortical gray and white matter. Am. J. Hypertens. 2011, 24, 1108–1113. [Google Scholar] [CrossRef]
- Mitchell, G.F.; van Buchem, M.A.; Sigurdsson, S.; Gotal, J.D.; Jonsdottir, M.K.; Kjartansson, O.; Garcia, M.; Aspelund, T.; Harris, T.B.; Gudnason, V.; et al. Arterial stiffness, pressure and flow pulsatility and brain structure and function: The Age, Gene/Environment Susceptibility-Reykjavik study. Brain 2011, 134, 3398–3407. [Google Scholar] [CrossRef]
- McEniery, C.; Wilkinson, I.; Avolio, A. Age, hypertension and arterial function. Clin. Exp. Pharmacol. Physiol. 2007, 34, 665–671. [Google Scholar] [CrossRef]
- Niiranen, T.J.; Kalesan, B.; Larson, M.G.; Hamburg, N.M.; Benjamin, E.J.; Mitchell, G.F.; Vasan, R.S. Aortic-Brachial Arterial Stiffness Gradient and Cardiovascular Risk in the Community: The Framingham Heart Study. Hypertension 2017, 69, 1022–1028. [Google Scholar] [CrossRef]
- Armentano, R.L.; Barra, J.G.; Santana, D.B.; Pessana, F.M.; Graf, S.; Craiem, D.; Brandani, L.M.; Baglivo, H.P.; Sanchez, R.A. Smart damping modulation of carotid wall energetics in human hypertension: Effects of angiotensin-converting enzyme inhibition. Hypertension 2006, 47, 384–390. [Google Scholar] [CrossRef] [Green Version]
- Armentano, R.L.; Barra, J.G.; Pessana, F.M.; Craiem, D.O.; Graf, S.; Santana, D.B.; Sanchez, R.A. Smart smooth muscle spring-dampers. Smooth muscle smart filtering helps to more efficiently protect the arterial wall. IEEE Eng. Med. Biol. Mag. 2007, 26, 62–70. [Google Scholar] [CrossRef] [PubMed]
- Bia, D.; Zócalo, Y.; Armentano, R.; Camus, J.; De Forteza, E.; Cabrera-Fischer, E. Increased reversal and oscillatory shear stress cause smooth muscle contraction-dependent changes in sheep aortic dynamics: Role in aortic balloon pump circulatory support. Acta Physiol. 2008, 192, 487–503. [Google Scholar] [CrossRef] [PubMed]
- Bia, D.; Armentano, R.L.; Grignola, J.C.; Craiem, D.; Zócalo, Y.A.; Ginés, F.F.; Levenson, J. The vascular smooth muscle of great arteries: Local control site of arterial buffering function? Rev. Esp. Cardiol. 2003, 56, 1202–1209. [Google Scholar] [CrossRef]
- Fischer, E.C.; Santana, D.B.; Zócalo, Y.; Camus, J.; De Forteza, E.; Armentano, R. Effects of removing the adventitia on the mechanical properties of ovine femoral arteries in vivo and in vitro. Circ. J. 2010, 74, 1014–1022. [Google Scholar] [CrossRef] [Green Version]


| PWV-Related Parameter | CAVI-Related Parameter | CAVIo-Related Parameter |
|---|---|---|
| cfPWV_Real_SCOR | CAVI_cfPWV_Real_SCOR | CAVIo_cfPWV_Real_SCOR |
| crPWV_SCOR | CAVI_crPWV_SCOR | CAVIo_crPWV_SCOR |
| aoPWV_Radial_SCOR | CAVI_aoPWV_Radial_SCOR | CAVIo_aoPWV_Radial_SCOR |
| aoPWV_Carotid_SCOR | CAVI_aoPWV_Carotid_SCOR | CAVIo_aoPWV_Carotid_SCOR |
| aoPWV_Brachial_MOG | CAVI_aoPWV_Brachial_MOG | CAVIo_aoPWV_Brachial_MOG |
| PWV Ratio | CAVI_PWV_Ratio | CAVIo_PWV_Ratio |
| All Subjects (n = 3619) | Reference Intervals Group (n = 1289) | |||||||||||||||
|---|---|---|---|---|---|---|---|---|---|---|---|---|---|---|---|---|
| MV | SD | Min. | p25th | p50th | p75th | Max. | Range | MV | SD | Min. | p25th | p50th | p75th | Max. | Range | |
| Age (years) | 33.9 | 24.2 | 2.8 | 11.5 | 23.7 | 56.4 | 89.0 | 86.2 | 20.1 | 16.9 | 2.8 | 6.3 | 17.6 | 21.8 | 84.2 | 81.4 |
| BW (kg) | 61.1 | 25.3 | 12.3 | 45.6 | 63.2 | 78.1 | 150.6 | 138.3 | 47.9 | 22.8 | 12.3 | 22.6 | 52.8 | 65.2 | 105.0 | 92.7 |
| BH (m) | 1.55 | 0.23 | 0.90 | 1.46 | 1.62 | 1.71 | 1.97 | 1.07 | 1.47 | 0.26 | 0.90 | 1.17 | 1.58 | 1.69 | 1.94 | 1.04 |
| BMI (kg/m2) | 24.06 | 6.02 | 11.53 | 19.7 | 23.63 | 27.84 | 71.34 | 59.81 | 20.36 | 4.22 | 11.53 | 16.59 | 20 | 23.56 | 29.95 | 18.42 |
| z-BMI (SD) * | 0.94 | 1.45 | −4.63 | −0.05 | 0.74 | 1.77 | 8.03 | 12.66 | 0.34 | 0.92 | −4.63 | −0.27 | 0.41 | 1 | 1.98 | 6.61 |
| TC (mg/dL) | 200 | 44 | 94 | 170 | 196 | 227 | 379 | 285 | 195 | 26 | 99 | 179 | 198 | 214 | 238 | 139 |
| HDL (mg/dL) | 51 | 15 | 17 | 41 | 49 | 60 | 122 | 105 | 58 | 12 | 41 | 49 | 55 | 64 | 100 | 59 |
| LDL (mg/dL) | 123 | 40 | 28 | 95 | 119 | 146 | 323 | 295 | 118 | 26 | 31 | 101 | 121 | 134 | 180 | 149 |
| TG (mg/dL) | 133 | 86 | 24 | 80 | 111 | 158 | 783 | 759 | 93 | 39 | 24 | 65 | 86 | 113 | 272 | 248 |
| Glic. (mg/dL) | 94 | 19 | 40 | 85 | 92 | 100 | 307 | 267 | 88 | 9 | 40 | 83 | 88 | 93 | 121 | 81 |
| bSBP (mmHg) | 119 | 17 | 64 | 107 | 118 | 129 | 235 | 171 | 112 | 13 | 80 | 101 | 112 | 121 | 171 | 91 |
| bDBP (mmHg) | 69 | 10 | 41 | 61 | 68 | 76 | 129 | 88 | 65 | 8 | 47 | 59 | 63 | 70 | 97 | 51 |
| TC ≥240 mg/dL (%) | 7.20 | 0.00 | ||||||||||||||
| HDL <40 mg/dL (%) | 8.90 | 0.00 | ||||||||||||||
| Glic. ≥126 (%) mg/dL | 0.90 | 0.00 | ||||||||||||||
| Current Smoker (%) | 11.40 | 0.00 | ||||||||||||||
| Hypertension (%) | 26.40 | 0.00 | ||||||||||||||
| Diabetes (%) | 5.70 | 0.00 | ||||||||||||||
| History of CVD (%) | 8.80 | 0.00 | ||||||||||||||
| Obesity (%) | 22.60 | 0.00 | ||||||||||||||
| Family CVD (%) | 13.50 | 7.60 | ||||||||||||||
| Sedentarism (%) | 45.60 | 32.30 | ||||||||||||||
| Anti-hypertensive (%) | 21.70 | 0.00 | ||||||||||||||
| Anti-hyperlip. (%) | 13.50 | 0.00 | ||||||||||||||
| Anti-diabetic (%) | 4.10 | 0.00 | ||||||||||||||
| Atheroma plaques (%) | ||||||||||||||||
| 0 | 64.70 | 88.20 | ||||||||||||||
| 1 | 6.20 | 2.70 | ||||||||||||||
| 2 | 8.10 | 4.20 | ||||||||||||||
| 3 | 6.40 | 1.90 | ||||||||||||||
| 4 | 6.50 | 1.80 | ||||||||||||||
| 5 | 3.20 | 0.60 | ||||||||||||||
| 6 | 3.00 | 0.30 | ||||||||||||||
| 7 | 1.20 | 0.10 | ||||||||||||||
| 8 | 0.70 | 0.10 | ||||||||||||||
| All Subjects (n = 3619) | Reference Intervals Group (n = 1289) | |||||||||||||||
|---|---|---|---|---|---|---|---|---|---|---|---|---|---|---|---|---|
| MV | SD | Min. | p25th | p50th | p75th | Max. | Range | MV | SD | Min. | p25th | p50th | p75th | Max. | Range | |
| cfPWV_Real_SCOR | ||||||||||||||||
| bSBP (mmHg) | 120 | 17 | 63 | 110 | 120 | 130 | 211 | 148 | 114 | 14 | 79 | 103 | 113 | 122 | 167 | 88 |
| bDBP (mmHg) | 69 | 11 | 40 | 60 | 69 | 76 | 127 | 87 | 64 | 9 | 40 | 58 | 63 | 70 | 100 | 60 |
| HR (b.p.m.) | 73 | 15 | 35 | 62 | 71 | 82 | 149 | 114 | 75 | 15 | 40 | 64 | 74 | 85 | 134 | 94 |
| cfPWV_Real_SCOR (m/s) | 7.39 | 2.46 | 2.7 | 5.57 | 7 | 8.72 | 19.75 | 17.06 | 6.23 | 1.63 | 2.7 | 5.04 | 5.98 | 7.13 | 14.59 | 11.89 |
| CAVI_cfPWV_Real_SCOR | 10.06 | 6.6 | 1.61 | 5.73 | 8.3 | 12.32 | 65.22 | 63.62 | 7.34 | 3.56 | 1.61 | 4.97 | 6.57 | 8.84 | 33.43 | 31.82 |
| CAVIo_cfPWV_Real_SCOR | 13.89 | 9.09 | 2.62 | 8.2 | 11.45 | 16.47 | 97.39 | 94.77 | 10.31 | 4.68 | 2.7 | 7.13 | 9.36 | 12.24 | 46.84 | 44.14 |
| crPWV_SCOR | ||||||||||||||||
| bSBP (mmHg) | 120 | 15 | 71 | 110 | 119 | 129 | 195 | 124 | 115 | 13 | 71 | 106 | 114 | 124 | 162 | 91 |
| bDBP (mmHg) | 68 | 10 | 40 | 60 | 68 | 76 | 102 | 62 | 65 | 9 | 43 | 58 | 64 | 70 | 100 | 57 |
| HR (b.p.m.) | 71 | 13 | 35 | 61 | 69 | 79 | 140 | 105 | 72 | 14 | 40 | 62 | 70 | 81 | 131 | 91 |
| crPWV_SCOR (m/s) | 9.3 | 1.97 | 4.4 | 7.8 | 9.2 | 10.7 | 15.7 | 11.3 | 8.76 | 1.76 | 4.4 | 7.5 | 8.5 | 9.9 | 14.9 | 10.5 |
| CAVI_crPWV_SCOR | 15.47 | 5.6 | 3.11 | 11.32 | 15.03 | 19.04 | 47.5 | 44.39 | 14.38 | 5.18 | 4.46 | 10.87 | 13.35 | 17.27 | 47.5 | 43.04 |
| CAVIo_crPWV_SCOR | 21.11 | 7.14 | 3.8 | 15.9 | 20.72 | 25.59 | 63.07 | 59.28 | 19.86 | 6.72 | 6.79 | 15.18 | 18.73 | 23.49 | 63.07 | 56.28 |
| PWV Ratio (cfPWV_Real_SCOR/crPWV_SCOR) | ||||||||||||||||
| PWV_Ratio | 0.78 | 0.19 | 0.35 | 0.65 | 0.74 | 0.87 | 1.86 | 1.51 | 0.72 | 0.15 | 0.35 | 0.62 | 0.71 | 0.8 | 1.49 | 1.14 |
| CAVI_PWV_Ratio | 0.64 | 0.35 | 0.12 | 0.42 | 0.56 | 0.76 | 3.67 | 3.55 | 0.54 | 0.23 | 0.12 | 0.38 | 0.5 | 0.64 | 2.3 | 2.18 |
| CAVIo_PWV_Ratio | 0.65 | 0.34 | 0.13 | 0.43 | 0.57 | 0.76 | 3.87 | 3.74 | 0.55 | 0.23 | 0.13 | 0.39 | 0.52 | 0.65 | 2.36 | 2.23 |
| aoPWV_Radial_SCOR | ||||||||||||||||
| bSBP (mmHg) | 121 | 16 | 77 | 109 | 120 | 130 | 235 | 158 | 114 | 14 | 78 | 105 | 114 | 124 | 160 | 82 |
| bDBP (mmHg) | 69 | 11 | 37 | 61 | 69 | 76 | 130 | 93 | 65 | 9 | 42 | 59 | 64 | 71 | 95 | 53 |
| HR (b.p.m.) | 73 | 14 | 35 | 63 | 71 | 82 | 151 | 116 | 76 | 15 | 38 | 65 | 74 | 85 | 151 | 113 |
| aoPWV_Radial_SCOR (m/s) | 7.24 | 1.25 | 4 | 6.5 | 7.2 | 8 | 14.3 | 10.3 | 6.73 | 1.15 | 4 | 6 | 6.8 | 7.4 | 11.2 | 7.2 |
| CAVI_aoPWV_Radial_SCOR | 9.21 | 2.92 | 3.16 | 7.31 | 8.8 | 10.58 | 33.55 | 30.39 | 8.41 | 2.62 | 3.37 | 6.72 | 8.2 | 9.68 | 21.7 | 18.33 |
| CAVIo_aoPWV_Radial_SCOR | 12.82 | 4.07 | 4.51 | 10.12 | 12.28 | 14.76 | 46.81 | 42.3 | 11.9 | 3.71 | 4.51 | 9.56 | 11.44 | 13.77 | 28.85 | 24.34 |
| aoPWV_Carotid_SCOR | ||||||||||||||||
| bSBP (mmHg) | 121 | 18 | 78 | 109 | 120 | 131 | 239 | 161 | 114 | 15 | 78 | 104 | 114 | 124 | 217 | 139 |
| bDBP (mmHg) | 69 | 11 | 38 | 60 | 68 | 76 | 127 | 89 | 64 | 9 | 38 | 58 | 63 | 70 | 100 | 62 |
| HR (b.p.m.) | 72 | 14 | 32 | 61 | 70 | 80 | 145 | 113 | 75 | 15 | 40 | 64 | 74 | 84 | 145 | 105 |
| aoPWV_Carotid_SCOR (m/s) | 7.01 | 1.02 | 4 | 6.4 | 7 | 7.6 | 13.2 | 9.2 | 6.68 | 0.97 | 4 | 6.2 | 6.6 | 7.2 | 13.2 | 9.2 |
| CAVI_aoPWV_Carotid_SCOR | 8.51 | 2.44 | 2.94 | 6.95 | 8.11 | 9.58 | 29.7 | 26.76 | 8.08 | 2.42 | 2.94 | 6.68 | 7.73 | 8.98 | 28.59 | 25.65 |
| CAVIo_aoPWV_Carotid_SCOR | 11.85 | 3.46 | 3.99 | 9.66 | 11.25 | 13.41 | 40.02 | 36.03 | 11.47 | 3.54 | 3.99 | 9.37 | 10.84 | 12.79 | 39.94 | 35.95 |
| aoPWV_Brachial_MOG | ||||||||||||||||
| bSBP (mmHg) | 117 | 14 | 81 | 107 | 115 | 125 | 199 | 118 | 112 | 12 | 81 | 104 | 111 | 120 | 158 | 77 |
| bDBP (mmHg) | 68 | 11 | 36 | 60 | 67 | 75 | 131 | 95 | 65 | 9 | 39 | 58 | 64 | 70 | 106 | 67 |
| HR (b.p.m.) | 76 | 15 | 33 | 64 | 73 | 86 | 135 | 102 | 79 | 16 | 41 | 67 | 77 | 89 | 135 | 94 |
| aoPWV_Brachial_MOG (m/s) | 5.74 | 2.07 | 3.58 | 4.33 | 4.88 | 6.36 | 15.25 | 11.68 | 4.87 | 1.18 | 3.58 | 4.15 | 4.55 | 5.08 | 12.93 | 9.36 |
| CAVI_aoPWV_Brachial_MOG | 6.26 | 4.55 | 2.84 | 3.58 | 4.21 | 6.7 | 31.45 | 28.62 | 4.55 | 2.46 | 2.84 | 3.4 | 3.83 | 4.55 | 28.09 | 25.25 |
| CAVIo_aoPWV_Brachial_MOG | 8.64 | 5.84 | 3.86 | 5.21 | 6.25 | 9.15 | 46.01 | 42.15 | 6.51 | 3.19 | 3.9 | 4.92 | 5.57 | 6.74 | 38.9 | 35 |
| cfPWV (Variable Y) vs. aoPWV_Radial_SCOR, aoPWV_Carotid_SCOR or aoPWV_Brachial_MOG | |||
| Variable X | aoPWV_Radial_SCOR | aoPWV_Carotid_SCOR | aoPWV_Brachial_MOG |
| CCC | 0.448 | 0.271 | 0.614 |
| 95% C.I. CCC | 0.3963 to 0.4967 | 0.2073 to 0.3319 | 0.5727 to 0.6527 |
| Pearson ρ (precision) | 0.498 | 0.3145 | 0.7336 |
| p-value (Pearson) | <1.0 × 10⁻¹⁴ | <1.0 × 10⁻¹⁴ | <1.0 × 10⁻¹⁴ |
| aoPWV_Radial_SCOR vs. aoPWV_Carotid_SCOR vs. aoPWV_Brachial_MOG | |||
| Variable Y | aoPWV_Radial_SCOR | aoPWV_Radial_SCOR | aoPWV_Carotid_SCOR |
| Variable X | aoPWV_Carotid_SCOR | aoPWV_Brachial_MOG | aoPWV_Brachial_MOG |
| CCC | 0.617 | 0.235 | 0.109 |
| 95% C.I. CCC | 0.5661 to 0.6632 | 0.1851 to 0.2838 | 0.04981 to 0.1668 |
| Pearson ρ (precision) | 0.6425 | 0.4205 | 0.1882 |
| p-value (Pearson) | <1.0 × 10⁻¹⁴ | <1.0 × 10⁻¹⁴ | 0.000257 |
| CAVI_cfPWV (Variable Y) vs. CAVI_aoPWV: Radial_SCOR, Carotid_SCOR or Brachial_MOG | |||
| Variable Y | CAVI_cfPWV_Real_SCOR | CAVI_cfPWV_Real_SCOR | CAVI_cfPWV_Real_SCOR |
| Variable X | CAVI_aoPWV_Radial_SCOR | CAVI_aoPWV_Carotid_SCOR | CAVI_aoPWV_Brachial_MOG |
| CCC | 0.2779 | 0.09839 | 0.553 |
| 95% C.I. CCC | 0.2181 to 0.3355 | 0.02888 to 0.1670 | 0.5073 to 0.5956 |
| Pearson ρ (precision) | 0.3075 | 0.1115 | 0.6704 |
| p-value (Pearson) | <1.0 × 10⁻¹⁴ | 0.0057 | <1.0 × 10⁻¹⁴ |
| CAVI_aoPWV_Radial_SCOR vs. CAVI_aoPWV_Carotid_SCOR vs. CAVI_aoPWV_Brachial_MOG | |||
| Variable Y | CAVI_aoPWV_Radial_SCOR | CAVI_aoPWV_Radial_SCOR | CAVI_aoPWV_Carotid_SCOR |
| Variable X | CAVIo_aoPWV_Carotid_SCOR | CAVIo_aoPWV_Brachial_MOG | CAVIo_aoPWV_Brachial_MOG |
| CCC | 0.5133 | 0.1439 | 0.03279 |
| 95% C.I. CCC | 0.4538 to 0.5682 | 0.09252 to 0.1944 | −0.03191 to 0.09722 |
| Pearson ρ (precision) | 0.5389 | 0.2545 | 0.05159 |
| p-value (Pearson) | <1.0 × 10⁻¹⁴ | 2.36 × 10⁻⁸ | 0.3203 |
| CAVIo_cfPWV (variable Y) vs. CAVIo_aoPWV: Radial_SCOR, Carotid_SCOR or Brachial_MOG | |||
| Variable X | CAVIo_aoPWV_Radial_SCOR | CAVIo_aoPWV_Carotid_SCOR | CAVIo_aoPWV_Brachial_MOG |
| CCC | 0.2294 | 0.08023 | 0.5078 |
| 95% C.I. CCC | 0.1671 to 0.2898 | 0.007051 to 0.1526 | 0.4608 to 0.5518 |
| Pearson ρ (precision) | 0.25 | 0.08661 | 0.6402 |
| p-value (Pearson) | 2.02E−12 | 0.0319 | 1.00 × 10⁻¹⁴ |
| CAVIo_aoPWV_Radial_SCOR vs. CAVIo_aoPWV_Carotid_SCOR vs. CAVIo_aoPWV_Brachial_MOG | |||
| Variable Y | CAVIo_aoPWV_Radial_SCOR | CAVIo_aoPWV_Radial_SCOR | CAVIo_aoPWV_Carotid_SCOR |
| Variable X | CAVIo_aoPWV_Carotid_SCOR | CAVIo_aoPWV_Brachial_MOG | CAVIo_aoPWV_Brachial_MOG |
| CCC | 0.5623 | 0.08684 | 0.008803 |
| 95% C.I. CCC | 0.5064 to 0.6134 | 0.03752 to 0.1357 | −0.05276 to 0.07029 |
| Pearson ρ (precision) | 0.5864 | 0.1604 | 0.01454 |
| p-value (Pearson) | <1.0 × 10⁻¹⁴ | 4.97 × 10⁻⁴ | 7.80 × 10⁻¹ |
| Part 1 | |||||||||
| (1) cfPWV (Method A) vs. aoPWV: Radial_SCOR, Carotid_SCOR or Brachial_MOG | |||||||||
| Method B | aoPWV_Radial_SCOR | aoPWV_Carotid_SCOR | aoPWV_Brachial_MOG | ||||||
| Differences (Method A-Method B) | |||||||||
| Mean error (m/s) | −0.41 | −0.14 | 0.81 | ||||||
| Mean error, 95% CI (m/s) | −0.5123 to −0.3052 | −0.2624 to −0.009219 | 0.7308 to 0.8833 | ||||||
| Mean error, P (H0: Mean = 0) | 2.99 × 10⁻¹⁴ | 3.55 × 10⁻² | <1.0 × 10⁻¹⁴ | ||||||
| Mean error, Lower limit (m/s) | −3.2767 | −3.2661 | −1.1438 | ||||||
| Mean error, 95% CI (m/s) | −3.4538 to −3.0996 | −3.4826 to −3.0497 | −1.2742 to −1.0134 | ||||||
| Mean error, Upper limit (m/s) | 2.4592 | 2.9945 | 2.7578 | ||||||
| Mean error, 95% CI (m/s) | 2.2821 to 2.6363 | 2.7781 to 3.2110 | 2.6274 to 2.8882 | ||||||
| Mean error, Regression Eq. | y = −3.5184 + 0.4766x | y =−5.3391 + 0.7875x | y = −0.1298 + 0.1732x | ||||||
| Parameter | |||||||||
| Intercept, Coeff. (m/s) | −3.5184 | −5.3391 | −0.1298 | ||||||
| Intercept, Coeff. 95% CI (m/s) | −4.0397 to −2.9971 | −6.0251 to −4.6530 | −0.4615 to 0.2019 | ||||||
| Intercept, Coeff. p-value | <1.0 × 10⁻¹⁴ | <1.0 × 10⁻¹⁴ | 0.4425 | ||||||
| Slope | |||||||||
| Slope, Coeff. (m/s/y) | 0.4766 | 0.7875 | 0.1732 | ||||||
| Slope, Coeff. 95% CI (m/s/y) | 0.3980 to 0.5551 | 0.6850 to 0.8900 | 0.1135 to 0.2330 | ||||||
| Slope, Coeff. p-value | <1.0 × 10⁻¹⁴ | <1.0 × 10⁻¹⁴ | 0.000 | ||||||
| (2) aoPWV_Radial_SCOR vs. aoPWV_Carotid_SCOR vs. aoPWV_Brachial_MOG | |||||||||
| Method A | aoPWV_Radial_SCOR | aoPWV_Radial_SCOR | aoPWV_Carotid_SCOR | ||||||
| Method B | aoPWV_Carotid_SCOR | aoPWV_Brachial_MOG | aoPWV_Brachial_MOG | ||||||
| Differences (Method A-Method B) | |||||||||
| Mean error (m/s) | 0.28 | 1.49 | 1.38 | ||||||
| Mean error, 95% CI (m/s) | 0.2122 to 0.3457 | 1.3754 to 1.6096 | 1.2300 to 1.5345 | ||||||
| Mean error, P (H0: Mean = 0) | <1.0 × 10⁻¹⁴ | <1.0 × 10⁻¹⁴ | <1.0 × 10⁻¹⁴ | ||||||
| Mean error, Lower limit (m/s) | −1.3327 | −1.0341 | −1.5492 | ||||||
| Mean error, 95% CI (m/s) | −1.4469 to −1.2185 | −1.2344 to −0.8339 | −1.8097 to −1.2887 | ||||||
| Mean error, Upper limit (m/s) | 1.8907 | 4.0192 | 4.3137 | ||||||
| Mean error, 95% CI (m/s) | 1.7765 to 2.0049 | 3.8189 to 4.2194 | 4.0532 to 4.5742 | ||||||
| Mean error, Regression Eq. | y = 0.2207 + 0.008533x | y = 2.2722−0.1320x | y = 3.3683−0.3309x | ||||||
| Intercept | |||||||||
| Intercept, Coeff. (m/s) | 0.2207 | 2.2722 | 3.3683 | ||||||
| Intercept, Coeff. 95% CI (m/s) | −0.3024 to 0.7437 | 1.5775 to 2.9670 | 2.3609 to 4.3756 | ||||||
| Intercept, Coeff. p-value | 0.4077 | 3.23 × 10⁻¹⁰ | 1.65 × 10⁻¹⁰ | ||||||
| Slope | |||||||||
| Slope, Coeff. (m/s/y) | 0.008533 | −0.132 | −0.3309 | ||||||
| Slope, Coeff. 95% CI (m/s/y) | −0.06737 to 0.08444 | −0.2479 to −0.01605 | −0.4969 to −0.1649 | ||||||
| Slope, Coeff. p-value | 0.8253 | 0.0258 | 0.000 | ||||||
| Part 2 | |||||||||
| (3) CAVI_cfPWV_Real_SCOR (Method A) vs. CAVI_aoPWV: Radial_SCOR, Carotid_SCOR or Brachial_MOG | |||||||||
| Method B | CAVI_aoPWV_Radial_SCOR | CAVI_aoPWV_Carotid_SCOR | CAVI_aoPWV_Brachial_MOG | ||||||
| Differences (Method A-Method B) | |||||||||
| Mean error | −0.89 | −0.12 | 1.81 | ||||||
| Mean error, 95% CI | −1.1609 to −0.6148 | −0.4612 to 0.2183 | 1.6231 to 1.9921 | ||||||
| Mean error, P (H0: Mean = 0) | 3.00 × 10⁻¹⁰ | 4.83 × 10⁻¹ | <1.0 × 10⁻¹⁴ | ||||||
| Mean error, Lower limit | −8.4481 | −8.5235 | −2.9128 | ||||||
| Mean error, 95% CI | −8.9150 to −7.9813 | −9.1045 to −7.9426 | −3.2283 to −2.5973 | ||||||
| Mean error, Upper limit | 6.6724 | 8.2806 | 6.5281 | ||||||
| Mean error, 95% CI | 6.2055 to 7.1392 | 7.6997 to 8.8615 | 6.2126 to 6.8436 | ||||||
| Mean error, Regression Eq. | y = −5.1891 + 0.5399x | y = −6.9488 + 0.8540x | y = 0.5711 + 0.2188x | ||||||
| Intercept | |||||||||
| Intercept, Coeff. | −5.1891 | −6.9488 | 0.5711 | ||||||
| Intercept, Coeff. 95% CI | −6.0114 to −4.3667 | −8.0063 to −5.8912 | 0.1496 to 0.9925 | ||||||
| Intercept, Coeff. p-value | <1.0 × 10⁻¹⁴ | <1.0 × 10⁻¹⁴ | 0.008 | ||||||
| Slope | |||||||||
| Slope, Coeff. | 0.5399 | 0.854 | 0.2188 | ||||||
| Slope, Coeff. 95% CI | 0.4418 to 0.6381 | 0.7272 to 0.9809 | 0.1513 to 0.2862 | ||||||
| Slope, Coeff. p-value | <1.0 × 10⁻¹⁴ | <1.0 × 10⁻¹⁴ | <0.0001 | ||||||
| (4) CAVI_aoPWV_Radial_SCOR vs. CAVI_aoPWV_Carotid_SCOR vs. CAVI_aoPWV_Brachial_MOG | |||||||||
| Method A | CAVI_aoPWV_Radial_SCOR | CAVI_aoPWV_Radial_SCOR | CAVI_aoPWV_Carotid_SCOR | ||||||
| Method B | CAVI_aoPWV_Carotid_SCOR | CAVI_aoPWV_Brachial_MOG | CAVI_aoPWV_Brachial_MOG | ||||||
| Differences (Method A-Method B) | |||||||||
| Mean error | 0.76 | 3.34 | 3.02 | ||||||
| Mean error, 95% CI | 0.5752 to 0.9524 | 3.0420 to 3.6416 | 2.6246 to 3.4233 | ||||||
| Mean error, P (H0: Mean = 0) | <1.0 × 10⁻¹⁴ | <1.0 × 10⁻¹⁴ | <1.0 × 10⁻¹⁴ | ||||||
| Mean error, Lower limit | −3.7885 | −3.1272 | −4.6633 | ||||||
| Mean error, 95% CI | −4.1111 to −3.4660 | −3.6399 to −2.6145 | −5.3464 to −3.9803 | ||||||
| Mean error, Upper limit | 5.3161 | 9.8107 | 10.7112 | ||||||
| Mean error, 95% CI | 4.9936 to 5.6386 | 9.2980 to 10.3235 | 10.0282 to 11.3943 | ||||||
| Mean error, Regression Eq. | y = 0.8012 − 0.004401x | y = 3.9494 − 0.09117x | y = 4.3010 − 0.1895x | ||||||
| Intercept | |||||||||
| Intercept, Coeff. | 0.8012 | 3.9494 | 4.301 | ||||||
| Intercept, Coeff. 95% CI | 0.02191 to 1.5804 | 2.9684 to 4.9304 | 2.9409 to 5.6611 | ||||||
| Intercept, Coeff. p-value | 0.0439 | 1.87 × 10⁻¹⁴ | 1.36 × 10⁻⁹ | ||||||
| Slope | |||||||||
| Slope, Coeff. | −0.004401 | −0.09117 | −0.1895 | ||||||
| Slope, Coeff. 95% CI | −0.09345 to 0.08465 | −0.2313 to 0.04899 | −0.3825 to 0.003503 | ||||||
| Slope, Coeff. p-value | 0.9227 | 0.2018 | 0.054 | ||||||
| Part 3 | |||||||||
| (5) CAVIo_cfPWV_Real_SCOR (Method A) vs. CAVIo_aoPWV: Radial_SCOR, Carotid_SCOR orBrachial_MOG | |||||||||
| Method B | CAVIo_aoPWV_Radial_SCOR | CAVIo_aoPWV_Carotid_SCOR | CAVIo_aoPWV_Brachial_MOG | ||||||
| Differences (Method A-Method B) | |||||||||
| Mean error | −1.29 | −0.28 | 2.63 | ||||||
| Mean error, 95% CI | −1.6699 to −0.9076 | −0.7459 to 0.1913 | 2.3706 to 2.8798 | ||||||
| Mean error, P (H0: Mean = 0) | 6.03 × 10⁻¹¹ | 0.2456 | <1.0 × 10⁻¹⁴ | ||||||
| Mean error, Lower limit | −11.8424 | −11.8658 | −3.8891 | ||||||
| Mean error, 95% CI | −12.4942 to −11.1907 | −12.6671 to −11.0646 | −4.3245 to −3.4538 | ||||||
| Mean error, Upper limit | 9.2649 | 11.3112 | 9.1395 | ||||||
| Mean error, 95% CI | 8.6132 to 9.9166 | 10.5100 to 12.1125 | 8.7041 to 9.5748 | ||||||
| Mean error, Regression Eq. | y = −6.5225 + 0.4651x | y = −8.0619 + 0.6887x | y = 0.5729 + 0.2545x | ||||||
| Intercept | |||||||||
| Intercept, Coeff. | −6.5225 | −8.0619 | 0.5729 | ||||||
| Intercept, Coeff. 95% CI | −7.7702 to −5.2748 | −9.6582 to −6.4655 | −0.04940 to 1.1952 | ||||||
| Intercept, Coeff. p-value | <1.0 × 10⁻¹⁴ | <1.0 × 10⁻¹⁴ | 0.0711 | ||||||
| Slope | |||||||||
| Slope, Coeff. | 0.4651 | 0.6887 | 0.2545 | ||||||
| Slope, Coeff. 95% CI | 0.3591 to 0.5712 | 0.5528 to 0.8246 | 0.1836 to 0.3255 | ||||||
| Slope, Coeff. p-value | <1.0 × 10⁻¹⁴ | <1.0 × 10⁻¹⁴ | 4.61 × 10⁻¹² | ||||||
| (6) CAVIo_aoPWV_Radial_SCOR vs. CAVIo_aoPWV_Carotid_SCOR vs. CAVIo_aoPWV_Brachial_MOG | |||||||||
| Method A | CAVIo_aoPWV_Radial_SCOR | CAVIo_aoPWV_Radial_SCOR | CAVIo_aoPWV_Carotid_SCOR | ||||||
| Method B | CAVIo_aoPWV_Carotid_SCOR | CAVIo_aoPWV_Brachial_MOG | CAVIo_aoPWV_Brachial_MOG | ||||||
| Differences (Method A-Method B) | |||||||||
| Mean error | 1.02 | 4.82 | 4.45 | ||||||
| Mean error, 95% CI | 0.7615 to 1.2788 | 4.3819 to 5.2562 | 3.8948 to 5.0112 | ||||||
| Mean error, P (H0: Mean = 0) | 4.22 × 10⁻¹⁴ | <1.0 × 10⁻¹⁴ | <1.0 × 10⁻¹⁴ | ||||||
| Mean error, Lower limit | −5.2235 | −4.6138 | −6.2933 | ||||||
| Mean error, 95% CI | −5.6658 to −4.7812 | −5.3615 to −3.8662 | −7.2482 to −5.3384 | ||||||
| Mean error, Upper limit | 7.2638 | 14.2519 | 15.1993 | ||||||
| Mean error, 95% CI | 6.8215 to 7.7061 | 13.5042 to 14.9995 | 14.2444 to 16.1542 | ||||||
| Mean error, Regression Eq. | y = 1.4747 − 0.03782x | y = 3.9543 + 0.09114x | y = 4.3849 + 0.007097x | ||||||
| Intercept | |||||||||
| Intercept, Coeff. | 1.4747 | 3.9543 | 4.3849 | ||||||
| Intercept, Coeff. 95% CI | 0.4438 to 2.5056 | 2.4230 to 5.4856 | 2.3751 to 6.3948 | ||||||
| Intercept, Coeff. p-value | 0.0051 | 0.000000562 | 0.0000228 | ||||||
| Slope | |||||||||
| Slope, Coeff. | −0.03782 | 0.09114 | 0.007097 | ||||||
| Slope, Coeff. 95% CI | −0.1209 to 0.04522 | −0.06354 to 0.2458 | −0.1941 to 0.2083 | ||||||
| Slope, Coeff. p-value | 0.3714 | 0.2475 | 0.9447 | ||||||
| aoPWV | ||||||
|---|---|---|---|---|---|---|
| cfPWV_Real_SCOR (m/s) | crPWV_SCOR (m/s) | Radial_SCOR (m/s) | Carotid_SCOR (m/s) | Brachial_MOG (m/s) | ||
| Atherosclerotic plaques (Yes: 1; No:0) (*) | r * | 0.107 | −0.109 | −0.054 | −0.034 | 0.090 |
| p (2-tailed) | 0.072 | 0.066 | 0.362 | 0.563 | 0.130 | |
| Boot, Bias | −0.003 | 0.001 | −0.002 | −0.002 | 0.003 | |
| Boot, SE | 0.085 | 0.057 | 0.057 | 0.035 | 0.097 | |
| Boot 95%CI LL | −0.069 | −0.216 | −0.166 | −0.102 | −0.100 | |
| Boot 95%CI UL | 0.269 | −0.002 | 0.056 | 0.037 | 0.283 | |
| Atherosclerotic plaques (Yes: 1; No:0] (**) | r ** | 0.104 | −0.108 | −0.052 | −0.036 | 0.086 |
| p (2-tailed) | 0.080 | 0.071 | 0.384 | 0.552 | 0.149 | |
| Boot, Bias | −0.007 | −0.003 | 0.002 | −0.001 | 0.004 | |
| Boot, SE | 0.090 | 0.055 | 0.062 | 0.036 | 0.104 | |
| Boot 95%CI LL | −0.082 | −0.222 | −0.169 | −0.104 | −0.110 | |
| Boot 95%CI UL | 0.272 | −0.006 | 0.070 | 0.037 | 0.294 | |
| Sex (Female: 1; Male:0) (*) | r * | −0.123 | 0.079 | 0.091 | −0.038 | −0.224 |
| p (2-tailed) | 0.039 | 0.184 | 0.127 | 0.526 | 0.000 | |
| Boot, Bias | 0.002 | 0.003 | 0.002 | −0.001 | −0.005 | |
| Boot, SE | 0.056 | 0.059 | 0.055 | 0.060 | 0.060 | |
| Boot 95%CI, LL | −0.229 | −0.038 | −0.016 | −0.153 | −0.351 | |
| Boot 95%CI UL | −0.009 | 0.192 | 0.194 | 0.076 | −0.115 | |
| Part 1 | |||||||||||||||
| Model Summary (y: cfPWV_Real_SCOR; x: Sex; w: Age): R = 0.803; R2 = 0.6534; p = <0.0001 | |||||||||||||||
| Coeff | SE | p | 95% CI LL | 95% CI UL | |||||||||||
| Intercept | 4.4829 | 0.0617 | <0.0001 | 4.3618 | 4.604 | ||||||||||
| Sex (Female: 1; Male: 0) | 0.0641 | 0.0882 | 0.4671 | −0.1088 | 0.2371 | ||||||||||
| Age (years) | 0.0784 | 0.0021 | <0.0001 | 0.0743 | 0.0825 | ||||||||||
| Sex * Age | −0.0087 | 0.003 | 0.0041 | −0.0146 | −0.0028 | ||||||||||
| Moderator value(s) defining Johnson-Neyman significance region(s) | |||||||||||||||
| Value (years) | % below | % above | |||||||||||||
| 19.6737 | 60.4344 | 39.5656 | |||||||||||||
| Conditional effect of focal predictor at values of the moderator | |||||||||||||||
| Age (years) | Effect | SE | p | 95% CI LL | 95% CI UL | ||||||||||
| 2.80 | 0.0398 | 0.0816 | 0.626 | −0.1203 | 0.1998 | ||||||||||
| 6.87 | 0.0044 | 0.0727 | 0.952 | −0.1384 | 0.1471 | ||||||||||
| 10.94 | −0.031 | 0.065 | 0.633 | −0.1586 | 0.0966 | ||||||||||
| 15.01 | −0.0665 | 0.0589 | 0.260 | −0.1821 | 0.0491 | ||||||||||
| 19.08 | −0.1019 | 0.0549 | 0.064 | −0.2096 | 0.0059 | ||||||||||
| 19.67 | −0.107 | 0.0546 | 0.050 | −0.2141 | 0 | ||||||||||
| 23.15 | −0.1373 | 0.0535 | 0.011 | −0.2423 | −0.0323 | ||||||||||
| 27.22 | −0.1727 | 0.0549 | 0.002 | −0.2804 | −0.0649 | ||||||||||
| 31.29 | −0.2081 | 0.0589 | 0.000 | −0.3237 | −0.0925 | ||||||||||
| 35.36 | −0.2435 | 0.065 | 0.000 | −0.3711 | −0.1159 | ||||||||||
| 39.43 | −0.2789 | 0.0728 | 0.000 | −0.4216 | −0.1362 | ||||||||||
| 43.50 | −0.3143 | 0.0816 | 0.000 | −0.4744 | −0.1542 | ||||||||||
| 47.57 | −0.3497 | 0.0913 | 0.000 | −0.5288 | −0.1707 | ||||||||||
| 51.64 | −0.3851 | 0.1015 | 0.000 | −0.5842 | −0.186 | ||||||||||
| 55.71 | −0.4205 | 0.1121 | 0.000 | −0.6405 | −0.2005 | ||||||||||
| 59.78 | −0.456 | 0.1231 | 0.000 | −0.6975 | −0.2144 | ||||||||||
| 63.85 | −0.4914 | 0.1343 | 0.000 | −0.7548 | −0.2279 | ||||||||||
| 67.92 | −0.5268 | 0.1457 | 0.000 | −0.8126 | −0.241 | ||||||||||
| 71.99 | −0.5622 | 0.1572 | 0.000 | −0.8706 | −0.2538 | ||||||||||
| 76.06 | −0.5976 | 0.1688 | 0.000 | −0.9288 | −0.2664 | ||||||||||
| 80.13 | −0.633 | 0.1806 | 0.001 | −0.9872 | −0.2788 | ||||||||||
| 84.20 | −0.6684 | 0.1924 | 0.001 | −1.0458 | −0.291 | ||||||||||
| Part 2 | |||||||||||||||
| Model Summary (y: crPWV_SCOR; x: Sex; w: Age): R = 0.5664; R2 = 0.3208; p = <0.0001 | |||||||||||||||
| Coeff | SE | P | 95% CI LL | 95% CI UL | |||||||||||
| Intercept | 7.3354 | 0.1244 | 0.000 | 7.0913 | 7.5796 | ||||||||||
| Sex (Female: 1; Male: 0) | 0.1806 | 0.1831 | 0.324 | −0.1789 | 0.5401 | ||||||||||
| Age (years) | 0.0615 | 0.0042 | 0.000 | 0.0532 | 0.0697 | ||||||||||
| Sex * Age | −0.0139 | 0.006 | 0.022 | −0.0257 | −0.002 | ||||||||||
| Moderator value(s) defining Johnson-Neyman significance region(s): | |||||||||||||||
| Value | % below | % above | |||||||||||||
| 28.9325 (years) | 74.3017 | 25.6983 | |||||||||||||
| Conditional effect of focal predictor at values of the moderator: | |||||||||||||||
| Age (years) | Effect | SE | P | 95% CI LL | 95% CI UL | ||||||||||
| 5.20 | 0.1085 | 0.159 | 0.496 | −0.2038 | 0.4207 | ||||||||||
| 9.15 | 0.0536 | 0.1427 | 0.707 | −0.2265 | 0.3337 | ||||||||||
| 13.10 | −0.0012 | 0.1286 | 0.993 | −0.2537 | 0.2513 | ||||||||||
| 17.05 | −0.056 | 0.1178 | 0.634 | −0.2872 | 0.1752 | ||||||||||
| 21.00 | −0.1109 | 0.111 | 0.319 | −0.3289 | 0.1072 | ||||||||||
| 24.95 | −0.1657 | 0.1092 | 0.130 | −0.3801 | 0.0487 | ||||||||||
| 28.90 | −0.2205 | 0.1125 | 0.050 | −0.4414 | 0.0004 | ||||||||||
| 28.93 | −0.221 | 0.1125 | 0.050 | −0.4419 | 0 | ||||||||||
| 32.85 | −0.2753 | 0.1205 | 0.023 | −0.5119 | −0.0388 | ||||||||||
| 36.80 | −0.3302 | 0.1324 | 0.013 | −0.59 | −0.0703 | ||||||||||
| 40.75 | −0.385 | 0.1471 | 0.009 | −0.6739 | −0.0961 | ||||||||||
| 44.70 | −0.4398 | 0.1641 | 0.008 | −0.7619 | −0.1177 | ||||||||||
| 48.65 | −0.4946 | 0.1825 | 0.007 | −0.853 | −0.1363 | ||||||||||
| 52.60 | −0.5495 | 0.2021 | 0.007 | −0.9463 | −0.1526 | ||||||||||
| 56.55 | −0.6043 | 0.2225 | 0.007 | −1.0412 | −0.1674 | ||||||||||
| 60.50 | −0.6591 | 0.2436 | 0.007 | −1.1373 | −0.1809 | ||||||||||
| 64.45 | −0.714 | 0.2651 | 0.007 | −1.2344 | −0.1935 | ||||||||||
| 68.40 | −0.7688 | 0.2869 | 0.008 | −1.3322 | −0.2054 | ||||||||||
| 72.35 | −0.8236 | 0.3091 | 0.008 | −1.4305 | −0.2167 | ||||||||||
| 76.30 | −0.8784 | 0.3315 | 0.008 | −1.5293 | −0.2276 | ||||||||||
| 80.25 | −0.9333 | 0.3541 | 0.009 | −1.6284 | −0.2381 | ||||||||||
| 84.20 | −0.9881 | 0.3768 | 0.009 | −1.7279 | −0.2483 | ||||||||||
| Part 3 | |||||||||||||||
| Model Summary (y: aoPWV_Radial_SCOR; x: Sex; w: Age): R = 0.5356; R2 = 0.2869; p = <0.0001 | |||||||||||||||
| Coeff | SE | p | 95% CI LL | 95% CI UL | |||||||||||
| Intercept | 5.7863 | 0.0808 | 0.000 | 5.6277 | 5.945 | ||||||||||
| Sex (Female: 1; Male: 0) | 0.2259 | 0.1176 | 0.055 | −0.0049 | 0.4567 | ||||||||||
| Age (years) | 0.0362 | 0.0026 | <0.0001 | 0.0311 | 0.0412 | ||||||||||
| Sex * Age | −0.0059 | 0.0038 | 0.121 | −0.0134 | 0.0016 | ||||||||||
| aoPWV_Carotid_SCOR (m/s) | |||||||||||||||
| Model Summary (y: aoPWV_Carotid_SCOR; x: Sex; w: Age): R = 0.2791; R2 = 0.0779; p = <0.0001 | |||||||||||||||
| Coeff | SE | p | 95% CI LL | 95% CI UL | |||||||||||
| Intercept | 6.3469 | 0.0937 | 0.000 | 6.1629 | 6.5308 | ||||||||||
| Sex (Female: 1; Male: 0) | −0.1391 | 0.1356 | 0.306 | −0.4055 | 0.1273 | ||||||||||
| Age (years) | 0.0139 | 0.0028 | <0.0001 | 0.0085 | 0.0194 | ||||||||||
| Sex * Age | 0.0009 | 0.0041 | 0.823 | −0.0072 | 0.009 | ||||||||||
| aoPWV_Brachial_MOG (m/s)) | |||||||||||||||
| Model Summary (y: aoPWV_Brachial_MOG; x: Sex; w: Age): R = 0.8928; R2 = 0.797; p = <0.0001 | |||||||||||||||
| Coeff | SE | p | 95% CI LL | 95% CI UL | |||||||||||
| Intercept | 3.7984 | 0.042 | <0.0001 | 3.7158 | 3.8811 | ||||||||||
| Sex (Female: 1; Male: 0) | −0.262 | 0.058 | <0.0001 | −0.376 | −0.1481 | ||||||||||
| Age (years) | 0.0715 | 0.002 | <0.0001 | 0.0676 | 0.0754 | ||||||||||
| Sex * Age | 0.0034 | 0.003 | 0.2074 | −0.002 | 0.0086 | ||||||||||
| cfPWV_Real_SCOR (m/s) | CAVI_cfPWV_Real_SCOR | CAVIo_cfPWV_Real_SCOR | ||||||||||||||||
|---|---|---|---|---|---|---|---|---|---|---|---|---|---|---|---|---|---|---|
| Age (y) | 50th | 75th | 90th | 95th | 97.5th | 99th | 50th | 75th | 90th | 95th | 97.5th | 99th | 50th | 75th | 90th | 95th | 97.5th | 99th |
| 5 | 4.6 | 5.1 | 5.5 | 5.8 | 6.1 | 6.5 | 4.5 | 5.5 | 6.7 | 7.5 | 8.3 | 9.3 | 6.4 | 7.8 | 9.2 | 10.3 | 11.3 | 12.6 |
| 10 | 5.0 | 5.5 | 6.0 | 6.3 | 6.6 | 7.0 | 4.8 | 5.7 | 6.8 | 7.6 | 8.4 | 9.4 | 7.1 | 8.5 | 10.0 | 11.1 | 12.2 | 13.6 |
| 15 | 5.6 | 6.1 | 6.7 | 7.0 | 7.4 | 7.8 | 5.7 | 6.8 | 8.0 | 8.9 | 9.7 | 10.8 | 8.4 | 10.0 | 11.7 | 12.9 | 14.1 | 15.6 |
| 20 | 6.2 | 6.8 | 7.4 | 7.8 | 8.1 | 8.5 | 6.8 | 8.1 | 9.4 | 10.4 | 11.3 | 12.4 | 9.8 | 11.5 | 13.4 | 14.8 | 16.1 | 17.7 |
| 25 | 6.7 | 7.4 | 8.0 | 8.4 | 8.8 | 9.2 | 7.9 | 9.2 | 10.8 | 11.8 | 12.8 | 14.1 | 11.0 | 12.9 | 15.0 | 16.5 | 17.8 | 19.6 |
| 30 | 7.2 | 7.8 | 8.5 | 8.9 | 9.3 | 9.8 | 8.7 | 10.3 | 11.9 | 13.0 | 14.1 | 15.5 | 12.0 | 14.1 | 16.3 | 17.8 | 19.3 | 21.2 |
| 35 | 7.5 | 8.2 | 8.9 | 9.3 | 9.7 | 10.2 | 9.4 | 11.0 | 12.8 | 14.0 | 15.2 | 16.7 | 12.7 | 14.9 | 17.3 | 18.9 | 20.5 | 22.5 |
| 40 | 7.7 | 8.4 | 9.2 | 9.6 | 10.1 | 10.6 | 9.8 | 11.6 | 13.5 | 14.8 | 16.1 | 17.8 | 13.2 | 15.5 | 18.0 | 19.8 | 21.4 | 23.6 |
| 45 | 7.8 | 8.6 | 9.4 | 9.9 | 10.4 | 11.0 | 10.2 | 12.1 | 14.1 | 15.5 | 16.9 | 18.7 | 13.6 | 16.0 | 18.7 | 20.5 | 22.3 | 24.6 |
| 50 | 7.9 | 8.8 | 9.6 | 10.2 | 10.7 | 11.3 | 10.5 | 12.5 | 14.7 | 16.2 | 17.7 | 19.7 | 13.9 | 16.5 | 19.4 | 21.4 | 23.3 | 25.8 |
| 55 | 8.1 | 9.0 | 9.8 | 10.4 | 11.0 | 11.7 | 10.8 | 13.0 | 15.4 | 17.1 | 18.8 | 20.9 | 14.4 | 17.2 | 20.4 | 22.6 | 24.7 | 27.5 |
| 60 | 8.3 | 9.2 | 10.2 | 10.8 | 11.4 | 12.2 | 11.4 | 13.8 | 16.5 | 18.4 | 20.3 | 22.7 | 15.2 | 18.4 | 21.9 | 24.4 | 26.8 | 30.0 |
| 65 | 8.6 | 9.6 | 10.7 | 11.4 | 12.0 | 12.8 | 12.4 | 15.1 | 18.2 | 20.4 | 22.6 | 25.4 | 16.6 | 20.2 | 24.3 | 27.2 | 30.1 | 33.9 |
| 70 | 9.1 | 10.3 | 11.4 | 12.1 | 12.8 | 13.7 | 14.1 | 17.3 | 21.0 | 23.7 | 26.3 | 29.8 | 19.0 | 23.3 | 28.3 | 31.8 | 35.4 | 40.1 |
| 75 | 10.0 | 11.2 | 12.5 | 13.3 | 14.1 | 15.1 | 17.0 | 21.0 | 25.7 | 29.1 | 32.5 | 36.9 | 23.0 | 28.6 | 34.9 | 39.6 | 44.2 | 50.4 |
| 80 | 11.3 | 12.7 | 14.1 | 15.0 | 15.9 | 17.0 | 22.0 | 27.6 | 33.9 | 38.6 | 43.2 | 49.4 | 30.2 | 37.8 | 46.7 | 53.2 | 59.7 | 68.5 |
| crPWV_SCOR (m/s) | CAVI_crPWV_SCOR | CAVIo_crPWV_SCOR | ||||||||||||||||
|---|---|---|---|---|---|---|---|---|---|---|---|---|---|---|---|---|---|---|
| Age (y) | 50th | 75th | 90th | 95th | 97.5th | 99th | 50th | 75th | 90th | 95th | 97.5th | 99th | 50th | 75th | 90th | 95th | 97.5th | 99th |
| 5 | 7.0 | 7.9 | 8.9 | 9.5 | 10.0 | 10.7 | 10.5 | 13.4 | 16.5 | 18.7 | 20.7 | 23.2 | 14.4 | 18.1 | 22.1 | 24.7 | 27.2 | 30.3 |
| 10 | 7.7 | 8.6 | 9.5 | 10.0 | 10.5 | 11.2 | 11.6 | 14.4 | 17.4 | 19.3 | 21.2 | 23.5 | 16.4 | 20.2 | 24.0 | 26.6 | 29.0 | 32.0 |
| 15 | 8.2 | 9.1 | 10.0 | 10.5 | 11.0 | 11.6 | 12.6 | 15.4 | 18.3 | 20.2 | 22.0 | 24.2 | 17.8 | 21.6 | 25.5 | 28.0 | 30.4 | 33.3 |
| 20 | 8.6 | 9.5 | 10.4 | 10.9 | 11.4 | 12.0 | 13.4 | 16.2 | 19.1 | 21.1 | 22.8 | 25.1 | 19.0 | 22.8 | 26.6 | 29.2 | 31.6 | 34.5 |
| 25 | 8.9 | 9.8 | 10.7 | 11.3 | 11.8 | 12.4 | 14.1 | 17.0 | 20.0 | 21.9 | 23.7 | 26.0 | 19.9 | 23.7 | 27.7 | 30.2 | 32.6 | 35.6 |
| 30 | 9.2 | 10.2 | 11.1 | 11.6 | 12.2 | 12.8 | 14.9 | 17.8 | 20.8 | 22.8 | 24.6 | 26.9 | 20.7 | 24.6 | 28.6 | 31.2 | 33.6 | 36.5 |
| 35 | 9.5 | 10.5 | 11.4 | 12.0 | 12.5 | 13.1 | 15.5 | 18.6 | 21.6 | 23.7 | 25.5 | 27.9 | 21.5 | 25.4 | 29.4 | 32.1 | 34.5 | 37.5 |
| 40 | 9.7 | 10.7 | 11.7 | 12.3 | 12.8 | 13.5 | 16.2 | 19.3 | 22.4 | 24.5 | 26.4 | 28.8 | 22.2 | 26.2 | 30.2 | 32.9 | 35.3 | 38.3 |
| 45 | 10.0 | 11.0 | 12.0 | 12.6 | 13.1 | 13.8 | 16.8 | 20.0 | 23.2 | 25.4 | 27.3 | 29.7 | 22.8 | 26.9 | 31.0 | 33.7 | 36.1 | 39.2 |
| 50 | 10.2 | 11.2 | 12.3 | 12.9 | 13.5 | 14.1 | 17.4 | 20.7 | 24.0 | 26.2 | 28.2 | 30.7 | 23.4 | 27.5 | 31.7 | 34.4 | 36.9 | 40.0 |
| 55 | 10.4 | 11.5 | 12.5 | 13.2 | 13.8 | 14.5 | 18.0 | 21.4 | 24.8 | 27.0 | 29.1 | 31.7 | 23.9 | 28.1 | 32.4 | 35.1 | 37.7 | 40.8 |
| 60 | 10.6 | 11.7 | 12.8 | 13.4 | 14.1 | 14.8 | 18.6 | 22.1 | 25.6 | 27.9 | 30.0 | 32.6 | 24.5 | 28.7 | 33.0 | 35.8 | 38.4 | 41.6 |
| 65 | 10.8 | 11.9 | 13.0 | 13.7 | 14.3 | 15.1 | 19.2 | 22.7 | 26.3 | 28.7 | 30.9 | 33.6 | 25.0 | 29.3 | 33.7 | 36.5 | 39.1 | 42.3 |
| 70 | 11.0 | 12.1 | 13.3 | 14.0 | 14.6 | 15.4 | 19.7 | 23.4 | 27.1 | 29.5 | 31.7 | 34.5 | 25.5 | 29.8 | 34.3 | 37.1 | 39.8 | 43.0 |
| 75 | 11.1 | 12.3 | 13.5 | 14.2 | 14.9 | 15.7 | 20.3 | 24.0 | 27.8 | 30.3 | 32.6 | 35.5 | 25.9 | 30.4 | 34.9 | 37.8 | 40.4 | 43.7 |
| 80 | 11.3 | 12.5 | 13.7 | 14.5 | 15.2 | 16.0 | 20.8 | 24.7 | 28.6 | 31.1 | 33.5 | 36.4 | 26.4 | 30.9 | 35.4 | 38.4 | 41.1 | 44.4 |
| aoPWV_Radial_SCOR (m/s) | CAVI_aoPWV_Radial_SCOR | CAVIo_aoPWV_Radial_SCOR | ||||||||||||||||
|---|---|---|---|---|---|---|---|---|---|---|---|---|---|---|---|---|---|---|
| Age (y) | 50th | 75th | 90th | 95th | 97.5th | 99th | 50th | 75th | 90th | 95th | 97.5th | 99th | 50th | 75th | 90th | 95th | 97.5th | 99th |
| 5 | 4.9 | 5.4 | 5.9 | 6.2 | 6.5 | 6.8 | 5.1 | 6.2 | 7.3 | 8.0 | 8.7 | 9.6 | 7.4 | 8.9 | 10.5 | 11.6 | 12.6 | 13.9 |
| 10 | 6.0 | 6.6 | 7.1 | 7.4 | 7.7 | 8.0 | 6.9 | 8.2 | 9.6 | 10.5 | 11.3 | 12.4 | 10.0 | 12.0 | 14.1 | 15.5 | 16.8 | 18.4 |
| 15 | 6.6 | 7.1 | 7.7 | 8.0 | 8.2 | 8.6 | 8.0 | 9.4 | 10.9 | 11.9 | 12.8 | 13.9 | 11.4 | 13.7 | 16.0 | 17.6 | 19.0 | 20.9 |
| 20 | 6.9 | 7.5 | 8.0 | 8.3 | 8.6 | 8.9 | 8.6 | 10.1 | 11.7 | 12.7 | 13.7 | 14.9 | 12.3 | 14.6 | 17.1 | 18.8 | 20.3 | 22.2 |
| 25 | 7.2 | 7.7 | 8.2 | 8.6 | 8.8 | 9.1 | 9.0 | 10.6 | 12.2 | 13.3 | 14.3 | 15.5 | 12.8 | 15.2 | 17.7 | 19.4 | 21.0 | 23.0 |
| 30 | 7.3 | 7.9 | 8.4 | 8.7 | 9.0 | 9.3 | 9.3 | 10.9 | 12.6 | 13.7 | 14.7 | 15.9 | 13.1 | 15.5 | 18.1 | 19.8 | 21.4 | 23.4 |
| 35 | 7.4 | 8.0 | 8.5 | 8.8 | 9.1 | 9.4 | 9.5 | 11.1 | 12.8 | 13.9 | 14.9 | 16.2 | 13.2 | 15.7 | 18.2 | 19.9 | 21.5 | 23.5 |
| 40 | 7.5 | 8.1 | 8.6 | 8.9 | 9.2 | 9.5 | 9.6 | 11.2 | 12.9 | 14.0 | 15.0 | 16.3 | 13.3 | 15.7 | 18.2 | 19.9 | 21.5 | 23.5 |
| 45 | 7.6 | 8.1 | 8.6 | 8.9 | 9.2 | 9.5 | 9.6 | 11.3 | 13.0 | 14.1 | 15.1 | 16.4 | 13.2 | 15.6 | 18.2 | 19.8 | 21.4 | 23.3 |
| 50 | 7.6 | 8.1 | 8.7 | 9.0 | 9.2 | 9.5 | 9.6 | 11.3 | 13.0 | 14.1 | 15.1 | 16.4 | 13.1 | 15.5 | 18.0 | 19.6 | 21.2 | 23.1 |
| 55 | 7.6 | 8.2 | 8.7 | 9.0 | 9.2 | 9.5 | 9.6 | 11.3 | 13.0 | 14.1 | 15.1 | 16.4 | 13.0 | 15.3 | 17.8 | 19.4 | 20.9 | 22.7 |
| 60 | 7.6 | 8.2 | 8.7 | 9.0 | 9.2 | 9.5 | 9.6 | 11.2 | 12.9 | 14.0 | 15.0 | 16.3 | 12.8 | 15.1 | 17.5 | 19.1 | 20.5 | 22.4 |
| 65 | 7.6 | 8.2 | 8.7 | 9.0 | 9.2 | 9.5 | 9.5 | 11.2 | 12.8 | 13.9 | 15.0 | 16.2 | 12.7 | 14.9 | 17.2 | 18.8 | 20.2 | 22.0 |
| 70 | 7.6 | 8.2 | 8.6 | 8.9 | 9.2 | 9.5 | 9.4 | 11.1 | 12.7 | 13.8 | 14.9 | 16.1 | 12.5 | 14.7 | 16.9 | 18.4 | 19.8 | 21.5 |
| 75 | 7.6 | 8.1 | 8.6 | 8.9 | 9.2 | 9.5 | 9.3 | 11.0 | 12.6 | 13.7 | 14.7 | 16.0 | 12.2 | 14.4 | 16.6 | 18.1 | 19.4 | 21.1 |
| 80 | 7.6 | 8.1 | 8.6 | 8.9 | 9.1 | 9.4 | 9.2 | 10.9 | 12.5 | 13.6 | 14.6 | 15.8 | 12.0 | 14.1 | 16.3 | 17.7 | 19.0 | 20.7 |
| aoPWV_Carotid_SCOR (m/s) | CAVI_aoPWV_Carotid_SCOR | CAVIo_aoPWV_Carotid_SCOR | ||||||||||||||||
|---|---|---|---|---|---|---|---|---|---|---|---|---|---|---|---|---|---|---|
| Age (y) | 50th | 75th | 90th | 95th | 97.5th | 99th | 50th | 75th | 90th | 95th | 97.5th | 99th | 50th | 75th | 90th | 95th | 97.5th | 99th |
| 5 | 5.9 | 6.7 | 7.4 | 7.8 | 8.2 | 8.7 | 7.0 | 8.8 | 11.0 | 12.5 | 14.1 | 16.2 | 10.5 | 13.3 | 16.4 | 18.6 | 20.7 | 23.5 |
| 10 | 6.2 | 6.9 | 7.5 | 7.9 | 8.2 | 8.6 | 7.3 | 8.9 | 10.7 | 12.0 | 13.2 | 14.9 | 10.7 | 13.1 | 15.7 | 17.4 | 19.2 | 21.4 |
| 15 | 6.4 | 7.0 | 7.6 | 7.9 | 8.2 | 8.6 | 7.5 | 9.0 | 10.6 | 11.7 | 12.8 | 14.1 | 10.8 | 12.9 | 15.3 | 16.8 | 18.3 | 20.2 |
| 20 | 6.6 | 7.1 | 7.6 | 7.9 | 8.2 | 8.6 | 7.7 | 9.0 | 10.5 | 11.5 | 12.4 | 13.7 | 10.9 | 12.9 | 15.0 | 16.4 | 17.7 | 19.4 |
| 25 | 6.7 | 7.2 | 7.7 | 8.0 | 8.2 | 8.5 | 7.8 | 9.0 | 10.4 | 11.3 | 12.2 | 13.3 | 10.9 | 12.8 | 14.8 | 16.1 | 17.3 | 18.8 |
| 30 | 6.7 | 7.2 | 7.7 | 8.0 | 8.2 | 8.5 | 7.9 | 9.1 | 10.3 | 11.2 | 12.0 | 13.0 | 11.0 | 12.8 | 14.6 | 15.8 | 16.9 | 18.4 |
| 35 | 6.8 | 7.3 | 7.7 | 8.0 | 8.2 | 8.5 | 7.9 | 9.1 | 10.3 | 11.1 | 11.8 | 12.8 | 11.0 | 12.7 | 14.4 | 15.6 | 16.6 | 18.0 |
| 40 | 6.9 | 7.3 | 7.7 | 8.0 | 8.2 | 8.5 | 8.0 | 9.1 | 10.2 | 11.0 | 11.7 | 12.6 | 11.1 | 12.7 | 14.3 | 15.4 | 16.4 | 17.6 |
| 45 | 6.9 | 7.4 | 7.8 | 8.0 | 8.2 | 8.5 | 8.1 | 9.1 | 10.2 | 10.9 | 11.6 | 12.4 | 11.1 | 12.6 | 14.2 | 15.2 | 16.2 | 17.4 |
| 50 | 7.0 | 7.4 | 7.8 | 8.0 | 8.2 | 8.5 | 8.1 | 9.1 | 10.2 | 10.8 | 11.5 | 12.2 | 11.1 | 12.6 | 14.1 | 15.1 | 16.0 | 17.1 |
| 55 | 7.0 | 7.4 | 7.8 | 8.0 | 8.2 | 8.5 | 8.2 | 9.1 | 10.1 | 10.8 | 11.4 | 12.1 | 11.2 | 12.6 | 14.0 | 15.0 | 15.8 | 16.9 |
| 60 | 7.1 | 7.5 | 7.8 | 8.0 | 8.2 | 8.4 | 8.2 | 9.2 | 10.1 | 10.7 | 11.3 | 12.0 | 11.2 | 12.6 | 13.9 | 14.8 | 15.7 | 16.7 |
| 65 | 7.1 | 7.5 | 7.8 | 8.0 | 8.2 | 8.4 | 8.3 | 9.2 | 10.1 | 10.7 | 11.2 | 11.8 | 11.2 | 12.5 | 13.9 | 14.7 | 15.5 | 16.5 |
| 70 | 7.2 | 7.5 | 7.8 | 8.0 | 8.2 | 8.4 | 8.3 | 9.2 | 10.0 | 10.6 | 11.1 | 11.7 | 11.2 | 12.5 | 13.8 | 14.6 | 15.4 | 16.3 |
| 75 | 7.2 | 7.5 | 7.9 | 8.1 | 8.2 | 8.4 | 8.4 | 9.2 | 10.0 | 10.6 | 11.0 | 11.6 | 11.3 | 12.5 | 13.7 | 14.5 | 15.3 | 16.2 |
| 80 | 7.2 | 7.6 | 7.9 | 8.1 | 8.2 | 8.4 | 8.4 | 9.2 | 10.0 | 10.5 | 11.0 | 11.6 | 11.3 | 12.5 | 13.7 | 14.5 | 15.2 | 16.0 |
| aoPWV_Brachial_MOG (m/s) | CAVI_aoPWV_Brachial_MOG | CAVIo_aoPWV_Brachial_MOG | ||||||||||||||||
|---|---|---|---|---|---|---|---|---|---|---|---|---|---|---|---|---|---|---|
| Age (y) | 50th | 75th | 90th | 95th | 97.5th | 99th | 50th | 75th | 90th | 95th | 97.5th | 99th | 50th | 75th | 90th | 95th | 97.5th | 99th |
| 5 | 4.0 | 4.1 | 4.2 | 4.3 | 4.4 | 4.5 | 3.3 | 3.5 | 3.6 | 3.7 | 3.8 | 3.9 | 4.9 | 5.3 | 5.7 | 5.9 | 6.2 | 6.4 |
| 10 | 4.5 | 4.7 | 5.0 | 5.1 | 5.3 | 5.4 | 3.7 | 4.1 | 4.4 | 4.6 | 4.8 | 5.1 | 5.5 | 6.2 | 6.8 | 7.3 | 7.6 | 8.1 |
| 15 | 4.8 | 5.1 | 5.4 | 5.5 | 5.7 | 5.9 | 4.1 | 4.6 | 5.1 | 5.4 | 5.7 | 6.0 | 6.0 | 6.8 | 7.7 | 8.3 | 8.8 | 9.5 |
| 20 | 5.0 | 5.4 | 5.7 | 5.8 | 6.0 | 6.2 | 4.5 | 5.1 | 5.7 | 6.0 | 6.4 | 6.8 | 6.4 | 7.4 | 8.5 | 9.2 | 9.8 | 10.6 |
| 25 | 5.3 | 5.6 | 6.0 | 6.2 | 6.3 | 6.6 | 4.9 | 5.5 | 6.2 | 6.6 | 7.1 | 7.6 | 6.8 | 8.0 | 9.1 | 9.9 | 10.6 | 11.5 |
| 30 | 5.6 | 5.9 | 6.3 | 6.5 | 6.7 | 6.9 | 5.3 | 6.0 | 6.7 | 7.2 | 7.7 | 8.2 | 7.3 | 8.5 | 9.7 | 10.6 | 11.4 | 12.3 |
| 35 | 5.9 | 6.3 | 6.6 | 6.9 | 7.1 | 7.3 | 5.7 | 6.5 | 7.3 | 7.8 | 8.3 | 8.9 | 7.8 | 9.1 | 10.4 | 11.3 | 12.1 | 13.1 |
| 40 | 6.2 | 6.6 | 7.0 | 7.3 | 7.5 | 7.8 | 6.3 | 7.1 | 8.0 | 8.5 | 9.1 | 9.7 | 8.4 | 9.7 | 11.1 | 12.0 | 12.9 | 13.9 |
| 45 | 6.6 | 7.0 | 7.5 | 7.8 | 8.0 | 8.3 | 6.9 | 7.8 | 8.8 | 9.4 | 10.0 | 10.7 | 9.2 | 10.6 | 12.0 | 12.9 | 13.8 | 14.9 |
| 50 | 7.0 | 7.5 | 8.0 | 8.3 | 8.6 | 9.0 | 7.8 | 8.8 | 9.8 | 10.5 | 11.1 | 11.9 | 10.2 | 11.6 | 13.1 | 14.1 | 15.0 | 16.1 |
| 55 | 7.4 | 8.0 | 8.6 | 8.9 | 9.3 | 9.7 | 8.8 | 10.0 | 11.2 | 11.9 | 12.6 | 13.5 | 11.5 | 13.0 | 14.6 | 15.6 | 16.5 | 17.7 |
| 60 | 7.9 | 8.6 | 9.2 | 9.7 | 10.0 | 10.5 | 10.3 | 11.6 | 13.0 | 13.9 | 14.7 | 15.8 | 13.3 | 14.9 | 16.6 | 17.7 | 18.7 | 20.0 |
| 65 | 8.4 | 9.2 | 10.0 | 10.5 | 10.9 | 11.4 | 12.2 | 13.9 | 15.6 | 16.7 | 17.8 | 19.1 | 15.7 | 17.6 | 19.4 | 20.7 | 21.8 | 23.2 |
| 70 | 9.0 | 9.9 | 10.8 | 11.4 | 11.9 | 12.5 | 14.8 | 17.0 | 19.2 | 20.8 | 22.2 | 23.9 | 19.0 | 21.3 | 23.5 | 24.9 | 26.2 | 27.9 |
| 75 | 9.6 | 10.7 | 11.7 | 12.4 | 13.0 | 13.8 | 18.4 | 21.4 | 24.6 | 26.8 | 28.8 | 31.3 | 23.9 | 26.6 | 29.4 | 31.2 | 32.9 | 34.9 |
| 80 | 10.3 | 11.5 | 12.8 | 13.6 | 14.3 | 15.2 | 23.5 | 28.0 | 32.8 | 36.1 | 39.2 | 43.2 | 30.9 | 34.6 | 38.3 | 40.7 | 43.0 | 45.7 |
| PWV_Ratio | CAVI_PWV_Ratio | CAVIo_PWV_Ratio | ||||||||||||||||
|---|---|---|---|---|---|---|---|---|---|---|---|---|---|---|---|---|---|---|
| Age (y) | 50th | 75th | 90th | 95th | 97.5th | 99th | 50th | 75th | 90th | 95th | 97.5th | 99th | 50th | 75th | 90th | 95th | 97.5th | 99th |
| 5 | 0.58 | 0.67 | 0.76 | 0.82 | 0.88 | 0.95 | 0.33 | 0.44 | 0.57 | 0.67 | 0.76 | 0.89 | 0.35 | 0.46 | 0.59 | 0.68 | 0.78 | 0.90 |
| 10 | 0.64 | 0.73 | 0.82 | 0.87 | 0.93 | 0.99 | 0.41 | 0.53 | 0.66 | 0.76 | 0.85 | 0.98 | 0.43 | 0.54 | 0.68 | 0.77 | 0.87 | 0.99 |
| 15 | 0.69 | 0.77 | 0.85 | 0.90 | 0.95 | 1.01 | 0.47 | 0.59 | 0.72 | 0.82 | 0.91 | 1.03 | 0.48 | 0.60 | 0.74 | 0.83 | 0.92 | 1.04 |
| 20 | 0.71 | 0.79 | 0.87 | 0.92 | 0.97 | 1.03 | 0.51 | 0.63 | 0.76 | 0.86 | 0.95 | 1.06 | 0.52 | 0.64 | 0.77 | 0.86 | 0.95 | 1.07 |
| 25 | 0.73 | 0.81 | 0.89 | 0.93 | 0.98 | 1.03 | 0.53 | 0.66 | 0.79 | 0.88 | 0.97 | 1.08 | 0.54 | 0.66 | 0.80 | 0.89 | 0.97 | 1.08 |
| 30 | 0.74 | 0.82 | 0.89 | 0.94 | 0.98 | 1.04 | 0.55 | 0.67 | 0.80 | 0.89 | 0.98 | 1.09 | 0.56 | 0.68 | 0.81 | 0.90 | 0.98 | 1.09 |
| 35 | 0.75 | 0.82 | 0.90 | 0.95 | 0.99 | 1.04 | 0.56 | 0.68 | 0.81 | 0.90 | 0.99 | 1.10 | 0.57 | 0.69 | 0.82 | 0.91 | 0.99 | 1.10 |
| 40 | 0.75 | 0.83 | 0.91 | 0.95 | 1.00 | 1.05 | 0.57 | 0.69 | 0.83 | 0.92 | 1.01 | 1.12 | 0.58 | 0.70 | 0.83 | 0.92 | 1.01 | 1.12 |
| 45 | 0.76 | 0.84 | 0.92 | 0.96 | 1.01 | 1.07 | 0.58 | 0.71 | 0.84 | 0.94 | 1.03 | 1.15 | 0.59 | 0.71 | 0.85 | 0.95 | 1.04 | 1.15 |
| 50 | 0.77 | 0.85 | 0.93 | 0.98 | 1.03 | 1.09 | 0.59 | 0.73 | 0.87 | 0.98 | 1.07 | 1.20 | 0.60 | 0.74 | 0.88 | 0.98 | 1.08 | 1.20 |
| 55 | 0.78 | 0.87 | 0.96 | 1.01 | 1.06 | 1.13 | 0.62 | 0.76 | 0.92 | 1.03 | 1.14 | 1.28 | 0.63 | 0.77 | 0.93 | 1.04 | 1.15 | 1.28 |
| 60 | 0.81 | 0.90 | 1.00 | 1.06 | 1.11 | 1.18 | 0.66 | 0.82 | 1.00 | 1.12 | 1.24 | 1.40 | 0.67 | 0.83 | 1.01 | 1.13 | 1.25 | 1.41 |
| 65 | 0.85 | 0.95 | 1.05 | 1.12 | 1.18 | 1.25 | 0.72 | 0.90 | 1.11 | 1.25 | 1.39 | 1.58 | 0.73 | 0.92 | 1.12 | 1.27 | 1.41 | 1.59 |
| 70 | 0.90 | 1.01 | 1.13 | 1.20 | 1.27 | 1.36 | 0.82 | 1.03 | 1.28 | 1.45 | 1.62 | 1.84 | 0.83 | 1.05 | 1.29 | 1.47 | 1.64 | 1.86 |
| 75 | 0.98 | 1.11 | 1.24 | 1.32 | 1.40 | 1.50 | 0.96 | 1.23 | 1.53 | 1.75 | 1.96 | 2.24 | 0.97 | 1.24 | 1.55 | 1.77 | 1.98 | 2.27 |
| 80 | 1.08 | 1.23 | 1.39 | 1.49 | 1.58 | 1.69 | 1.19 | 1.53 | 1.92 | 2.20 | 2.48 | 2.84 | 1.19 | 1.54 | 1.94 | 2.23 | 2.51 | 2.89 |
Publisher’s Note: MDPI stays neutral with regard to jurisdictional claims in published maps and institutional affiliations. |
© 2021 by the authors. Licensee MDPI, Basel, Switzerland. This article is an open access article distributed under the terms and conditions of the Creative Commons Attribution (CC BY) license (http://creativecommons.org/licenses/by/4.0/).
Share and Cite
Bia, D.; Zócalo, Y. Physiological Age- and Sex-Related Profiles for Local (Aortic) and Regional (Carotid-Femoral, Carotid-Radial) Pulse Wave Velocity and Center-to-Periphery Stiffness Gradient, with and without Blood Pressure Adjustments: Reference Intervals and Agreement between Methods in Healthy Subjects (3–84 Years). J. Cardiovasc. Dev. Dis. 2021, 8, 3. https://doi.org/10.3390/jcdd8010003
Bia D, Zócalo Y. Physiological Age- and Sex-Related Profiles for Local (Aortic) and Regional (Carotid-Femoral, Carotid-Radial) Pulse Wave Velocity and Center-to-Periphery Stiffness Gradient, with and without Blood Pressure Adjustments: Reference Intervals and Agreement between Methods in Healthy Subjects (3–84 Years). Journal of Cardiovascular Development and Disease. 2021; 8(1):3. https://doi.org/10.3390/jcdd8010003
Chicago/Turabian StyleBia, Daniel, and Yanina Zócalo. 2021. "Physiological Age- and Sex-Related Profiles for Local (Aortic) and Regional (Carotid-Femoral, Carotid-Radial) Pulse Wave Velocity and Center-to-Periphery Stiffness Gradient, with and without Blood Pressure Adjustments: Reference Intervals and Agreement between Methods in Healthy Subjects (3–84 Years)" Journal of Cardiovascular Development and Disease 8, no. 1: 3. https://doi.org/10.3390/jcdd8010003