
A Testbed Platform to Support an IoT City Lab
by
 , , , ,
Carlo Impagliazzo
*,
Muriel Cabianca
,
Maria Laura Clemente
*,
Giuliana Siddi Moreau
,
Matteo Vocale
and
Lidia Leoni
CRS4, Center for Advanced Studies, Research and Development in Sardinia, Loc. Piscina Manna Bld. 1, 09050 Pula, Italy
*
Authors to whom correspondence should be addressed.
IoT 2024, 5(1), 35-57; https://doi.org/10.3390/iot5010003
Submission received: 13 December 2023
/
Revised: 15 January 2024
/
Accepted: 17 January 2024
/
Published: 24 January 2024
Abstract
:This paper describes the development activity that has been carried out for a living laboratory for the city of Cagliari aimed at functioning as a learning center for local SMEs willing to improve their skills in IoT and create applications that will be integrated in an open innovation ecosystem. The many users belonging to the various SMEs involved in the project required an ICT laboratory with a platform that could manage them and provide a multi-tenant environment for the development of IoT applications. The architecture also had to be scalable and interoperable, and the resulting platform had to collect many kinds of data from sensors or other data sources, elaborate them, and show georeferenced information on a 3D satellite interactive view along with statistics on side panels. This work was based on a platform already developed by CRS4 for a previous project. Preserving the concept of the decision-making tool for Smart Cities, almost every component was redesigned, and, in this paper, we describe the new solutions that have been implemented. Starting from the former structure, further features were added in a novel way in order to offer an enhanced framework that can deal with the activities of the laboratory, exploiting the scalability of the open-source systems involved, their robustness and flexibility, and leveraging domain standards. In this article, the main challenges involved in the development of the platform are described, as well as the solutions that have been implemented so far.
1. Introduction
The Internet of Things (IoT) has led the world to a new epoch, in which gadgets, sensors, and actuators can be networked to share data with each other, generating massive amounts of data with the potential to alter industries and improve the quality of our lives. In this interconnected system, an IoT platform is required as underlying infrastructure to provide important features such as smooth integration through interoperability, management, and analysis of the data coming from all IoT devices; on top of that, particularly important are data presentation and visualization. A Smart City is an example of such a multi-domain that needs an IoT platform to manage all the available data and services.
The global emergency in the last few years has led to a route conversion in urban planning. The idea of walkable distance is not new, but the remedies against climate change have renewed the importance of this old idea [1,2,3], opening the door to the concept of “chrono-urbanism”. The COVID-19 pandemic added urgency to climate change toward the realization of this new polycentric urban model. In [4], a 15 min city is described as a polycentric city where everything is reachable in only 15 min, on foot or by bicycle. The digital revolution has made possible and pragmatically achievable the transition toward a polycentric city of this kind through innovation in IoT technologies, which has led to the emergence of the Smart City. This transformation moves toward the actualization of the Sustainable Development Goals (SDGs), defined in July 2017 by the United Nations within the context of the 2030 Agenda [5]. In particular, paper [4] mentions SDG 11, which is related to safety, sustainability, resilience, and inclusivity. In other words, the Smart City concept can further boost the transition toward the 15-minute city, because urban data, service digitalization, and broader and faster internet connections are able to drastically decrease the need to use a car to purchase daily necessities or reach one’s place of work.
The increasing production of geo-referenced digital data has caused the diffusion of an incredible number of thematic maps that can already be used, not only by urban planners and entrepreneurs but by any citizen through their mobile phones to obtain georeferenced information about a Smart City, or this could be called a Senseable City, as in [6]. Unfortunately, very often, most of the data are not made available and, when available, they must very often be translated into a proper format because of interoperability issues.
In recent years, the European Commission has promoted big-living labs for AI, called testing and experimental facilities (TEFs), for dedicated projects, as mentioned in [7], which focuses on intelligence for Smart Cities and other initiatives [8].
In the literature, similar actions have already been presented. An example is in [9], where a framework for managing an IoT-based laboratory platform is described, detailing the architecture in its main parts, such as back-end, data storage, and front-end. The REST API is implemented in Python with Flask, JSON is the data-interchange format used, and MySQL is chosen as the database. A very comprehensive review of the research literature on IoT-enabled Smart City platforms is presented in [10], starting with a prediction about the disruptive IoT-based technologies reported by Ericson and Statista Research (both dated back to 2019), and this paper describes the main trends and open challenges in Smart City platforms. As far as the challenges are concerned, great importance is given to interoperability, scalability, and the sharing of components. In the same paper, instead of the usual six applicable domains, eight main topics are identified for the integration of IoT and Smart City solutions, such as governance; living and infrastructures; healthcare, mobility, and transportation; economy; energy and environment; industry and production.
All these levels of complexity require a micro-service-based architecture, a reliable broad and fast connection to the Internet, a back-end made of a cluster of servers and distributed storage infrastructure.
An interesting survey of IoT platforms is presented by [11], who explore the design, implementation, and evaluation of an advanced platform aimed at addressing the challenges posed by the heterogeneity, scalability, and security requirements of IoT ecosystems.
In [12], a novel IoT interworking architecture providing a semantic-driven integration framework suitable for Smart Cities was presented, focusing on interworking proxies. This solution was also tested in the Santander Smart City, and the results demonstrated that it was able to discover and manage IoT sensors connected to both oneM2M [13] and FIWARE [14].
Furthermore, the work of [15] explores the integration of IoT technologies in various sectors, emphasising the need for interoperable and scalable platforms.
Several seminal works in this area have laid the foundation for understanding the intricacies of IoT platforms. In particular, the work of [16] provides a comprehensive survey of IoT architectures, protocols, and application domains, providing a valuable foundation for the conceptualisation of our platform. Another of their works shows how different generations of technologies can affect smart cities and, therefore, the technological environment in which they operate [17].
In the last few years, FIWARE has become the standard for smart solutions based on data spaces, enabling the exchange of near-real-time (also called right-time) digital twin data [18]. As a result, many FIWARE applications have been developed worldwide to implement smart solutions in various contexts [19,20,21,22].
An impressive initiative based on FIWARE for Smart Cities is Snap4City [23], which has been used to build solutions for several cities, such as Florence, Antwerp, Pisa, Livorno, Modena, Santiago de Compostela, Valencia, Dubrovnik, Lonato del Garda, and many more.
In addition, [24] describes another application of FIWARE in IoT that deals with interoperability issues related to the integration of various data formats and communication protocols.
In the context of complex and holistic platforms to manage urban environments, such as the one developed by CRS4, the challenge is to enhance and harmonize the security layer at all the levels and components of the platform. This can be achieved by adopting state-of-the-art technologies and methodologies, such as multi-factor authentication (MFA) and identity and access management (IAM), using well-known and widely used frameworks like OpenID, OAuth, and SAML.
Building on these foundational works, our paper introduces an innovative IoT platform that incorporates cutting-edge technologies and methodologies to address the key challenges in the domain. We conduct comparative analysis with existing platforms and evaluate their performance in real-world scenarios to advance the state of the art in IoT platforms. The platform presented here serves as a living lab for IoT-based applications related to the Cagliari Digital Lab project (CDL). Its purpose is to facilitate cooperation between academia and industry to promote IoT-based innovation and automation in SMEs.
This paper is structured as follows:
- -
- Section 2, Materials and Methods, describes the main challenges considered in designing the platform for the CDL project;
- -
- Section 3 describes the context and how we approached the infrastructural design and solutions adopted;
- -
- Section 3.1 explains the context and background;
- -
- Section 3.2 describes the overall microservice architecture;
- -
- Section 3.3 details the novel solution implemented to achieve bring multi-tenancy to every layer of the platform;
- -
- Section 3.4 focuses on the front-end and presentation layers;
- -
- Section 3.5 explains the IoT agent component and its use in the integration of AI-based services into the platform.
- -
- Lastly, Section 4 provides the Discussions, including conclusions and future works.
2. Materials and Methods
This section presents the main challenges related to design and development of an IoT platform in general. The specific implementation for the CDL project is described in Section 3.
One of the most significant challenges is multi-tenancy. In a multi-layer platform, it is essential to address the multitenancy of groups of users to ensure smooth operation at all levels and components, from the service of the back-end to the front-end components.
To effectively manage a Smart City, it is crucial to ensure proper separation of data from various sources throughout the entire workflow, from acquisition to presentation. Additionally, shared data must be accessible and managed in an interoperable manner. The use of simple username and password combinations is considered a naive approach and can result in a weak system that is prone to errors and security issues This issue has been widely addressed in the literature, and it is recommended to avoid this approach. Therefore, a better solution is to adopt a consolidated identity and access management system.
An IAM framework is a comprehensive system that provides secure and efficient control over user identities in an organization’s IT setup. Its main focus is on securely managing user access to applications and data. The framework ensures a smooth and secure user journey from onboarding to ongoing management and offboarding.
Authentication is a crucial aspect of IAMs as it validates user identity through methods, such as passwords or biometrics. User permissions are determined by authorization based on roles and responsibilities. IAMs often facilitate Single Sign-On (SSO), which allows users to access multiple applications with a single set of credentials.
IAMs adhere to the principle of least privilege, granting users only the access they require. The system maintains audit logs to track user activities, aiding in compliance and security assessments. IAMs are typically flexible, allowing for seamless integration with a wide range of systems and applications. To enhance security, they may employ security tokens and multi-factor authentication (MFA). IAMs continuously monitor user activity, identifying and responding to potential security threats in real time.
A challenge faced by platforms that receive massive amounts of data is that of scalability and data management. Various solutions have been proposed over time to overcome this problem, but the most beneficial one appears to be the one that replicates the Unix approach: an isolated, atomic service that focuses solely on solving a specific problem. Through this approach, as the load increases, each service can be replicated to ensure horizontal scalability. In a microservice architecture, all the main components are made of services running in different containers, such as Docker, and interacting with each other. For example, the front-end alone requires a service for data collection, a service for data elaboration, etc.
However, to effectively manage incoming data, it is necessary to use a shared and flexible standard that allows data sources of heterogeneous types to send data in a simple way and with standard protocols. This in addition to the multi-tenancy management and scalability mentioned in the previous paragraph. Furthermore, it is necessary to guarantee the interoperability of the stored data, in order to enable seamless interaction with third-party applications outside the system. To achieve this, RESTful APIs based on the HTTP protocol were developed, and FIWARE and its standard were selected for data ingestion.
Additionally, a challenge is posed by the front-end and the presentation layer. The back-end collects a variety of devices and data that require an effective visualization tool. Further, 3D satellite visualization was chosen to facilitate the end user in understanding what is going on in the detailed context of the city. Due to the growth in computing power over the years, 3D visualization is now being widely used in many GIS systems. This approach allows for the creation of front-ends that do not require the installation of specialized software, making it easy to access high-quality GIS maps with 3D visualization directly from web browsers.
3. The Platform within the Cagliari Digital Lab Initiative
3.1. Context and Background
The platform implemented for the project is an improvement on a previous release, developed by CRS4 as a deliverable of the Joint Innovation Center project related to IoT for Smart Cities, partially supported by the Sardinian Local Government (RAS), within the Joint Innovation Center (JIC) project [25]. The new release has undergone significant redesign and includes new features and modules, making it more scalable and adaptable to various contexts. It remains a valuable decision-making tool for Smart Cities. These new activities are part of the “Cagliari Digital Lab” project, which is co-funded by the Ministry for Enterprises and Made in Italy (MIMIT). Cagliari Digital Lab is an interdisciplinary technological research and innovation hub where stakeholders and startups can develop new ideas.
The new release of the platform is one of the practical laboratories, which are at the core of the project.
The platform for the Smart Cities laboratory has been improved to include multi-tenancy, smart data definition, data flow management, and a user-friendly front-end.
The platform also needed to integrate external services for data analysis and to run AI and optimization algorithms that could provide useful functionalities, such as intelligent transportation services and decision support systems, tailored to the needs of a Smart City. This requires an effective and efficient solution to integrate these services within the platform, adding another level of complexity. This article describes an example of integration, involving a service that optimizes vehicle itineraries to be displayed on the front-end map. It is important to note that the operation and algorithms of the optimizer service are beyond the scope of this article, which focuses solely on the description of its integration into the platform. As described in Section 3.5, the proposed solution for the CDL platform considers the service as a device managed through the FIWARE IoT agent [26].
To present the information stored within the platform to the user, an effective visualization tool is necessary. This tool should go beyond the basic features of a 2D map and utilize modern three-dimensional WebGIS systems.
One important consideration when using client-side applications is that the client has to be a public client as there is no secure way to store client credentials in a client-side application. Therefore, it is necessary to take particular care to ensure security and multi-tenancy. To manage both aspects, a JavaScript client was developed for the presentation layer. The client is based on the open-source library CesiumJS for the interactive 3D map part and integrates Keycloak’s JavaScript adapter for the security and multi-tenancy aspects.
3.2. Overall Architecture
This section provides an overview of the platform and outlines each component developed to address the challenges listed in Section 2.
Due to the reasons elucidated in the previous sections, the architecture of the platform for the CDL project follows a microservice-oriented approach to facilitate scalability and to enhance interoperability. The platform is designed to handle various standards for IoT formats and protocols, making it easier to extend to additional application domains. To streamline development, certain components of the framework FIWARE have been integrated. As is known, FIWARE consists of a set of open-source components that expose open standard APIs (like NGSI-LD), which prove valuable in the development of smart solutions in general. The FIWARE Foundation, established in 2016 with co-funding from the European Commission, originated from work initiated in 2010 as a back-end platform developed for the Future Internet Public–Private Partnership program (Future Internet PPP). Initially named the Future Internet Core Platform in the EU-funded FI-ware project [27,28], it represents a solution capable of addressing issues related to interoperability, accessibility, resource efficiency, security, and trustworthiness.
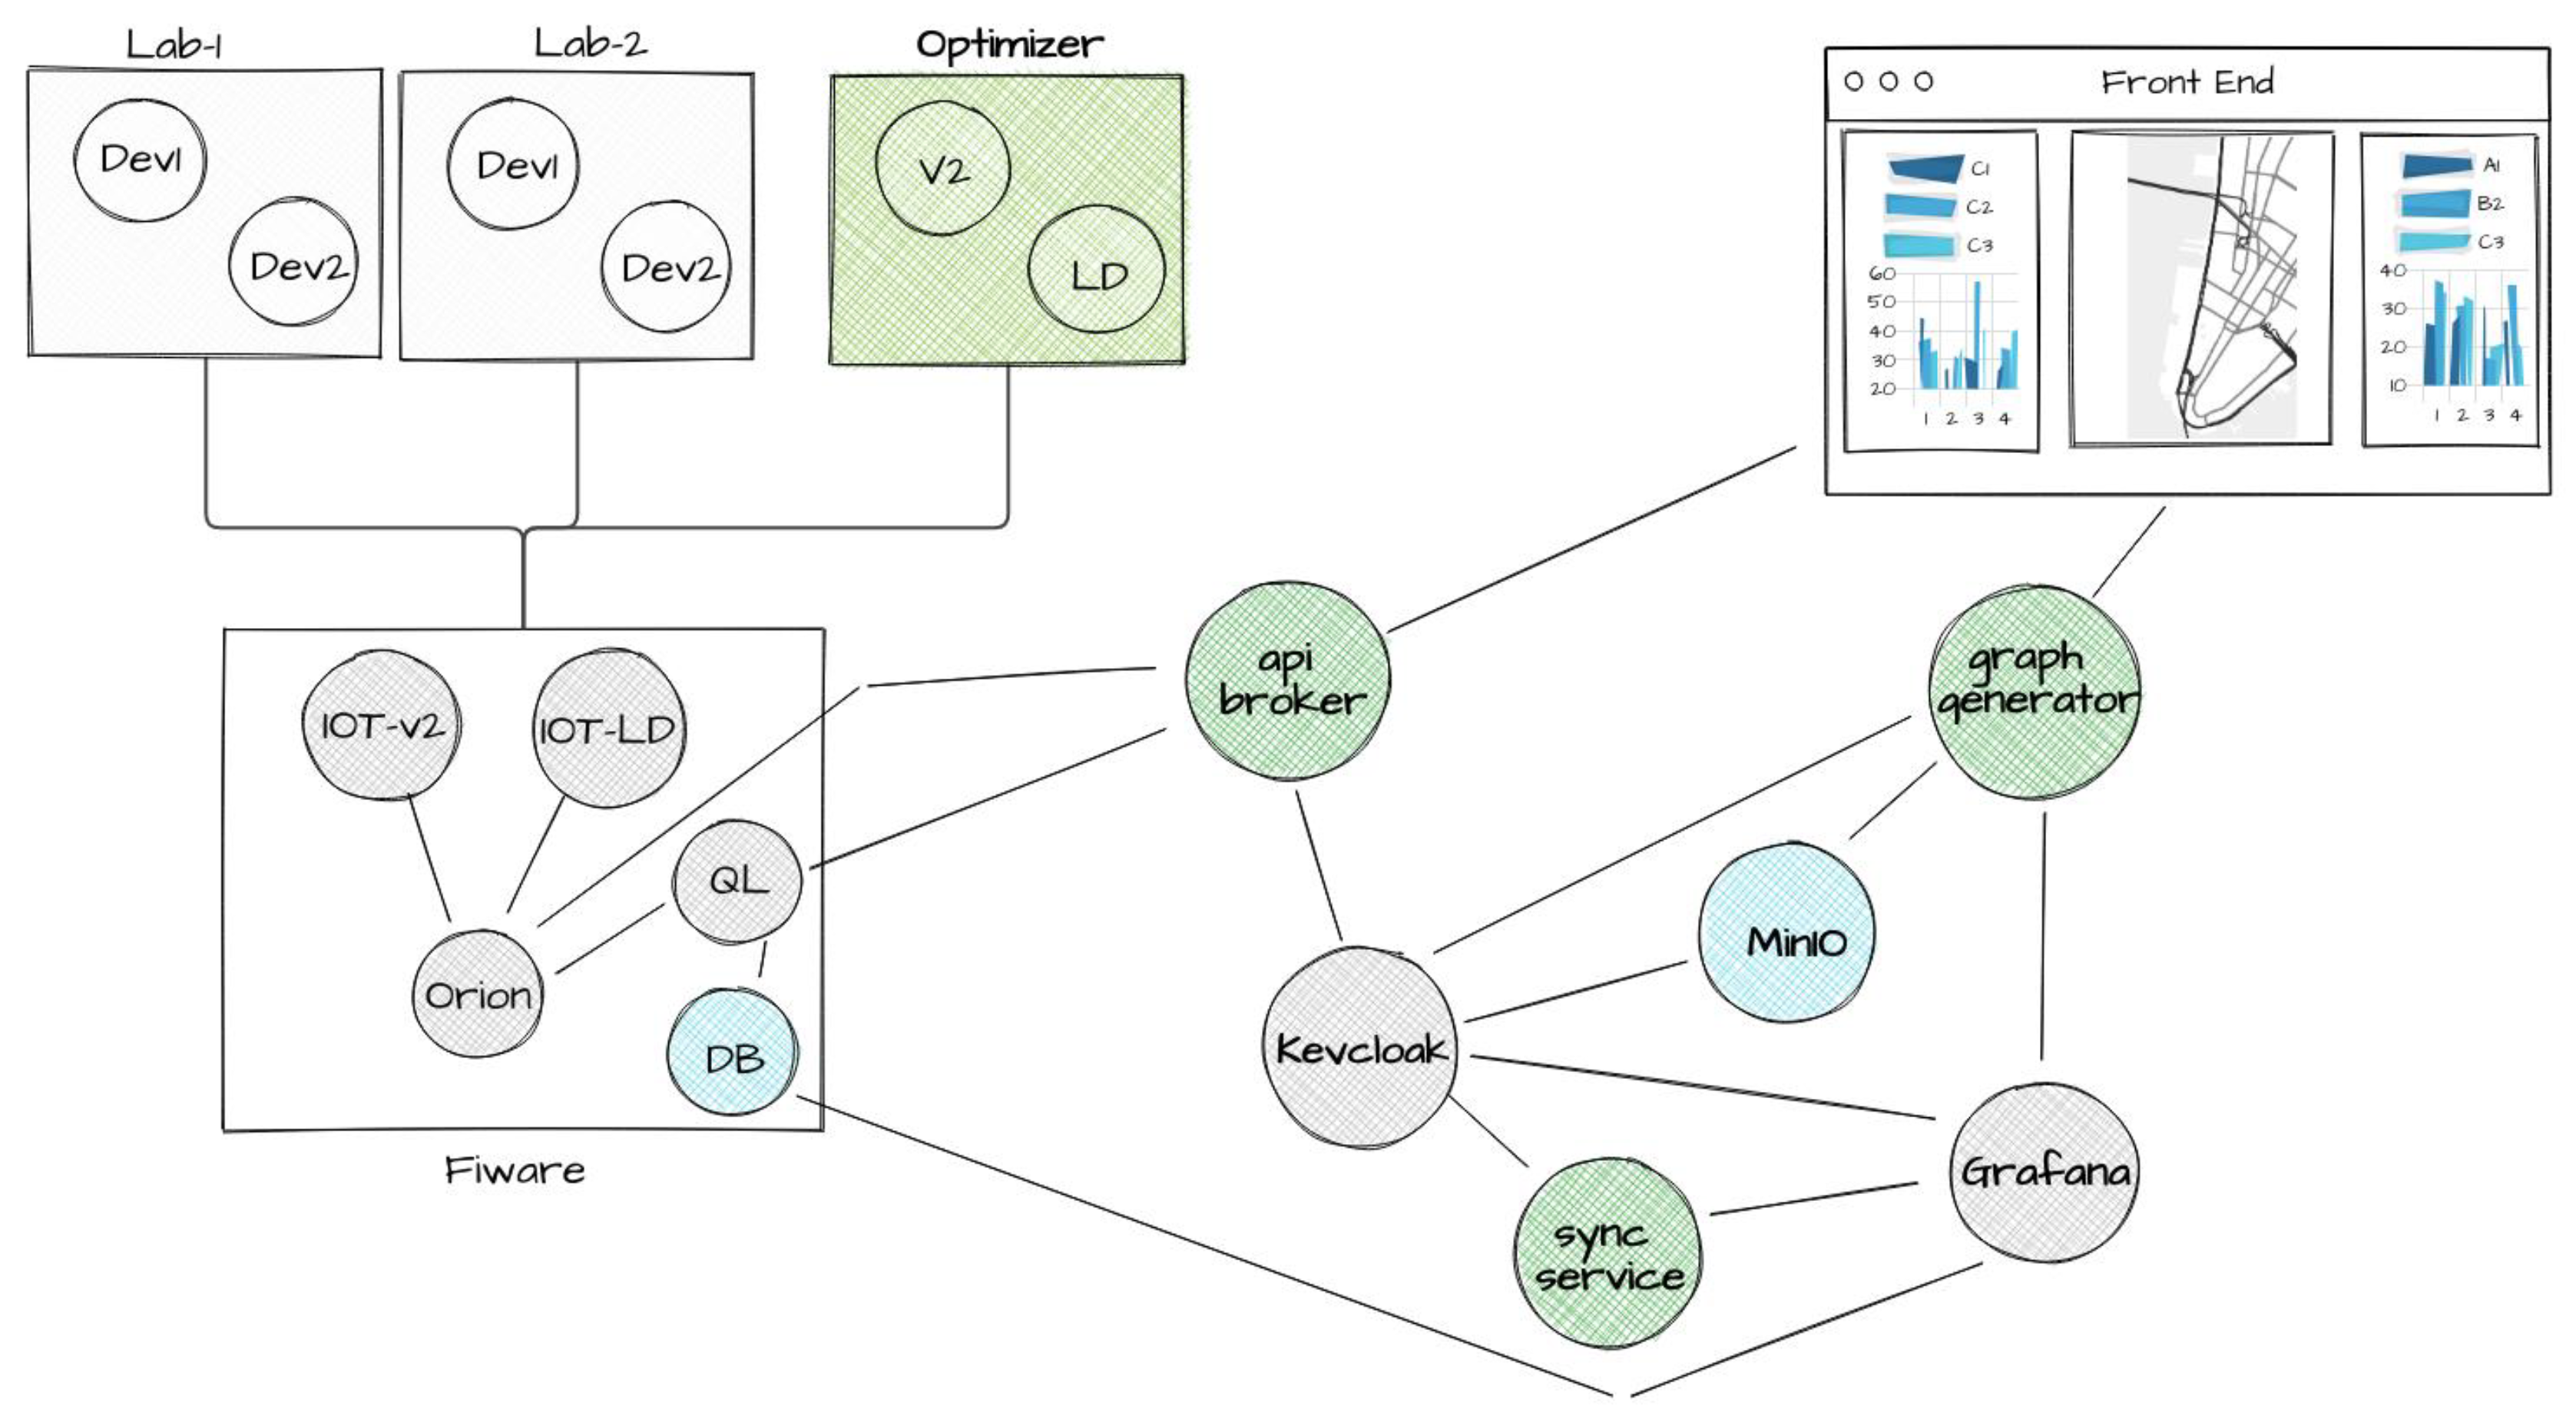
The platform utilizes a collection of components from the open-source community to provide fundamental services, including:
- IAM (Keycloak)
- Device and data management (FIWARE)
- Data analysis (Grafana)
Figure 1 shows the services and components used to deliver basic functionalities and their connections, highlighted in green.
For the CDL project’s specific implementation, the front-end comprises two main parts: a 3D satellite interactive map and the side panels displaying statistics.
The infrastructure relies on two core components: one manages user information to feed presentation systems linked to the front-end, while the other manages the internal communication system responsible for transporting and dispatching messages.
3.3. Multi-Tenancy
The platform needed to be accessible to users from multiple groups, so multi-tenancy and multi-user management were necessary features. Specifically, addressing the multi-tenancy of user groups was crucial for smooth operation across all levels and components, from the back-end services to the front-end layer.
In this complex system, where the user interacts with multiple autonomous services, a username-and-password-based solution is limiting and complicated to implement. Therefore, the CDL lab has chosen to adopt a consolidated identity and access management (IAM) solution such as Keycloak [29,30], which is an open-source software developed mainly by Red Hat Inc. This system is essential to ensure the efficient and secure management of user identities in an IT system, for many reasons, as explained below. The first reason is that an IAM system, such as Keycloak [31], helps to centralise and standardise user authentication, thereby simplifying the login process and reducing the risk of vulnerabilities due to weak passwords or insecure authentication practices. Another reason is that by providing granular access control, an IAM can effectively manage user privileges, ensuring that each user has only the access they need to perform their job, reducing the risk of unauthorised access or security breaches. In addition, Keycloak provides advanced session and permission management capabilities, making it easy for the system administrator to monitor and track user activity, improving overall system security. Ultimately, adopting an IAM such as Keycloak is critical to ensuring security and efficient management and also facilitates compliance with General Data Protection Regulation (GDPR).
Keycloak has numerous features, including Single Sign-On (SSO), which enables users to authenticate only once to access multiple applications without having to enter credentials repeatedly. This feature is particularly useful in the context of the CDL, where users will be interested in working using many different applications during the same session. Another important feature is that Keycloak can be used either as a standalone service or integrated into existing applications, such as the microservice-based architecture of the platform for the CDL. Keycloak offers the ability to manage users, identities, and related authentication through various methods, including username/password, two-factor authentication, and identity federation using protocols, such as OpenID Connect and SAML. This feature also simplifies integration with other applications and services that comply with these standards.
Keycloak offers a comprehensive authorization system that enables the precise definition and management of user access rights to resources. This ensures that only authorised individuals can access private data or functionalities.
Additionally, the platform administrator has complete control over the authentication flow, including the ability to define session duration and securely manage logout, thanks to the session management system.
Specifically, the platform exploits several peculiarities to ensure consistent authentication between modules’ manage authentication in a secure and efficient manner. Microservices can use regenerable tokens for authentication, allowing each service to identify the correct user of the generated data flow.
The platform ecosystem includes several services that authorize users based on their group membership. This means that Keycloak users can access authorized resources only for their respective groups.
Keycloak centralizes permission control, allowing operations to be performed only once, during token issuance. This avoids services having to repeat the operation each time. Furthermore, the validation of the token’s information can be performed directly by the relevant service, providing an alternative to calling Keycloak introspection endpoints and, expediting the processing of the information.
Although Keycloak has many advantages, it also has some disadvantages. It is a complex and reliable system, with a strong development momentum, which means that significant changes can occur between releases. For instance, approximately seven years after the first release, the major release 20.0.0 was launched in July 2023 and introduced behaviours that were incompatible with previous versions. However, due to the abundance of existing materials and tutorials, many developers did not adapt to the changes, resulting in the need to determine what no longer functions.
3.4. The Components of the Front-End Service
This section explains the organization of the front-end, the developed components, and the main challenges.
The front-end is a web application that allows users to access and navigate the different application domains and the data associated, based on the type of user.
The portal’s structure is based on four elements, as shown in Figure 2:
Figure 2.
The portal wireframe. Image drawn with MockFlow (https://mockflow.com/).
Figure 2.
The portal wireframe. Image drawn with MockFlow (https://mockflow.com/).

Each element in the front-end is available depending on the group (or groups) of the specific user logged in. It is, therefore, possible to customize, with a reasonable level of detail, the type of information to show, depending on the user.
In Figure 2, point 1 concerns the classic concept of a “menu”, where all the different themes are listed, providing the possibility of selecting and exploring a single domain in detail.
In Figure 2, points 2 and 3 show the analytics, with in-depth dashboards on time series and related contents; the ways they can be used and aligned are the subject of the following sections.
In Figure 2, point 4 is the primary component of the front-end, providing a navigable map where georeferenced points of interest are displayed with their related real-time values; the Points of Interest (PoIs) are presented as dots in fuchsia color.
3.4.1. The Dashboard Creation System
This section describes the “graph generator” component shown in Figure 1. Its purpose is essentially to provide analytical reports in the form of graphs related to the data of the context of interest. As expected, the information available at the front-end is filtered according to the group (or groups) of the logged-in user.
The implementation of this system could basically follow two paths: The first choice implied the direct use of libraries, such as D3.js, Chart.js, or Plotly charts, to produce graphs; these libraries work at a very low level, requiring the creation of the ecosystem to manage data access and automation in the presentation layer. The other choice implied the use of an open-source platform that already provides the developer with the necessary features, while leaving freedom in data access management, choice of components (and related types), and user federation.
After an overview of the main platforms available dedicated to this purpose, two systems that could meet the needs were studied: Apache Superset [32] and Grafana [33]. The following sections will describe these systems.
Apache Superset is an open-source business intelligence platform that aims to make data analysis easier. It has interactive dashboards, access to many data sources, connectivity to Apache Druid and relational databases, and an SQL Lab module for building SQL queries. Users can inspect real-time data, create graphical visualisations, and use data exploration tools. Superset allows for custom widgets and customisation to meet specific needs. The platform encourages collaboration by allowing users to share dashboards and visualisations while providing security and advanced permissions. As an open-source project maintained by the Apache Software Foundation, Superset benefits from an active community of developers. In summary, Apache Superset facilitates data analysis by providing a versatile, collaborative, and accessible platform.
Grafana is an open-source visualization and monitoring software designed to effectively analyse and present data. It provides interactive dashboards that allow users to combine and view data from different sources, such as databases, cloud services, and monitoring systems. Grafana offers a wide range of plug-ins, allowing for easy integration with systems, such as Prometheus, InfluxDB, and others. To monitor data in real time, the platform allows for the creation of custom panels, charts, and alarms. Grafana is renowned for its user-friendly interface and its ability to produce engaging and informative visualisations. It also provides a very versatile data analysis experience, with customisable drill-down capabilities, filters, and themes. Grafana is often used in system and application monitoring because it provides advanced query and analysis capabilities to effectively support decision makers through proactive performance monitoring.
Ultimately, a comparison of the two systems favours Grafana because it is more versatile in use, allows dashboard customisation, and is designed to be integrated into a modular ecosystem, where Keycloak handles identity and access management. These are the reasons why Grafana was chosen to be integrated into the platform, but there were some hurdles to its adoption. In fact, the key issue in its integration into the platform is the mapping between how Keycloak understands users/groups/roles and how Grafana understands them; for this mapping, Grafana’s Team Sync [34] is only available in the paid tiers Premium Enterprise and Cloud versions. For the CDL platform, the Grafana Community Edition was chosen, which is free, so this important mapping between Keycloak and Grafana had to be developed.
Although hooks can be used for Keycloak events, it is recommended to use calls via the system’s normal API.
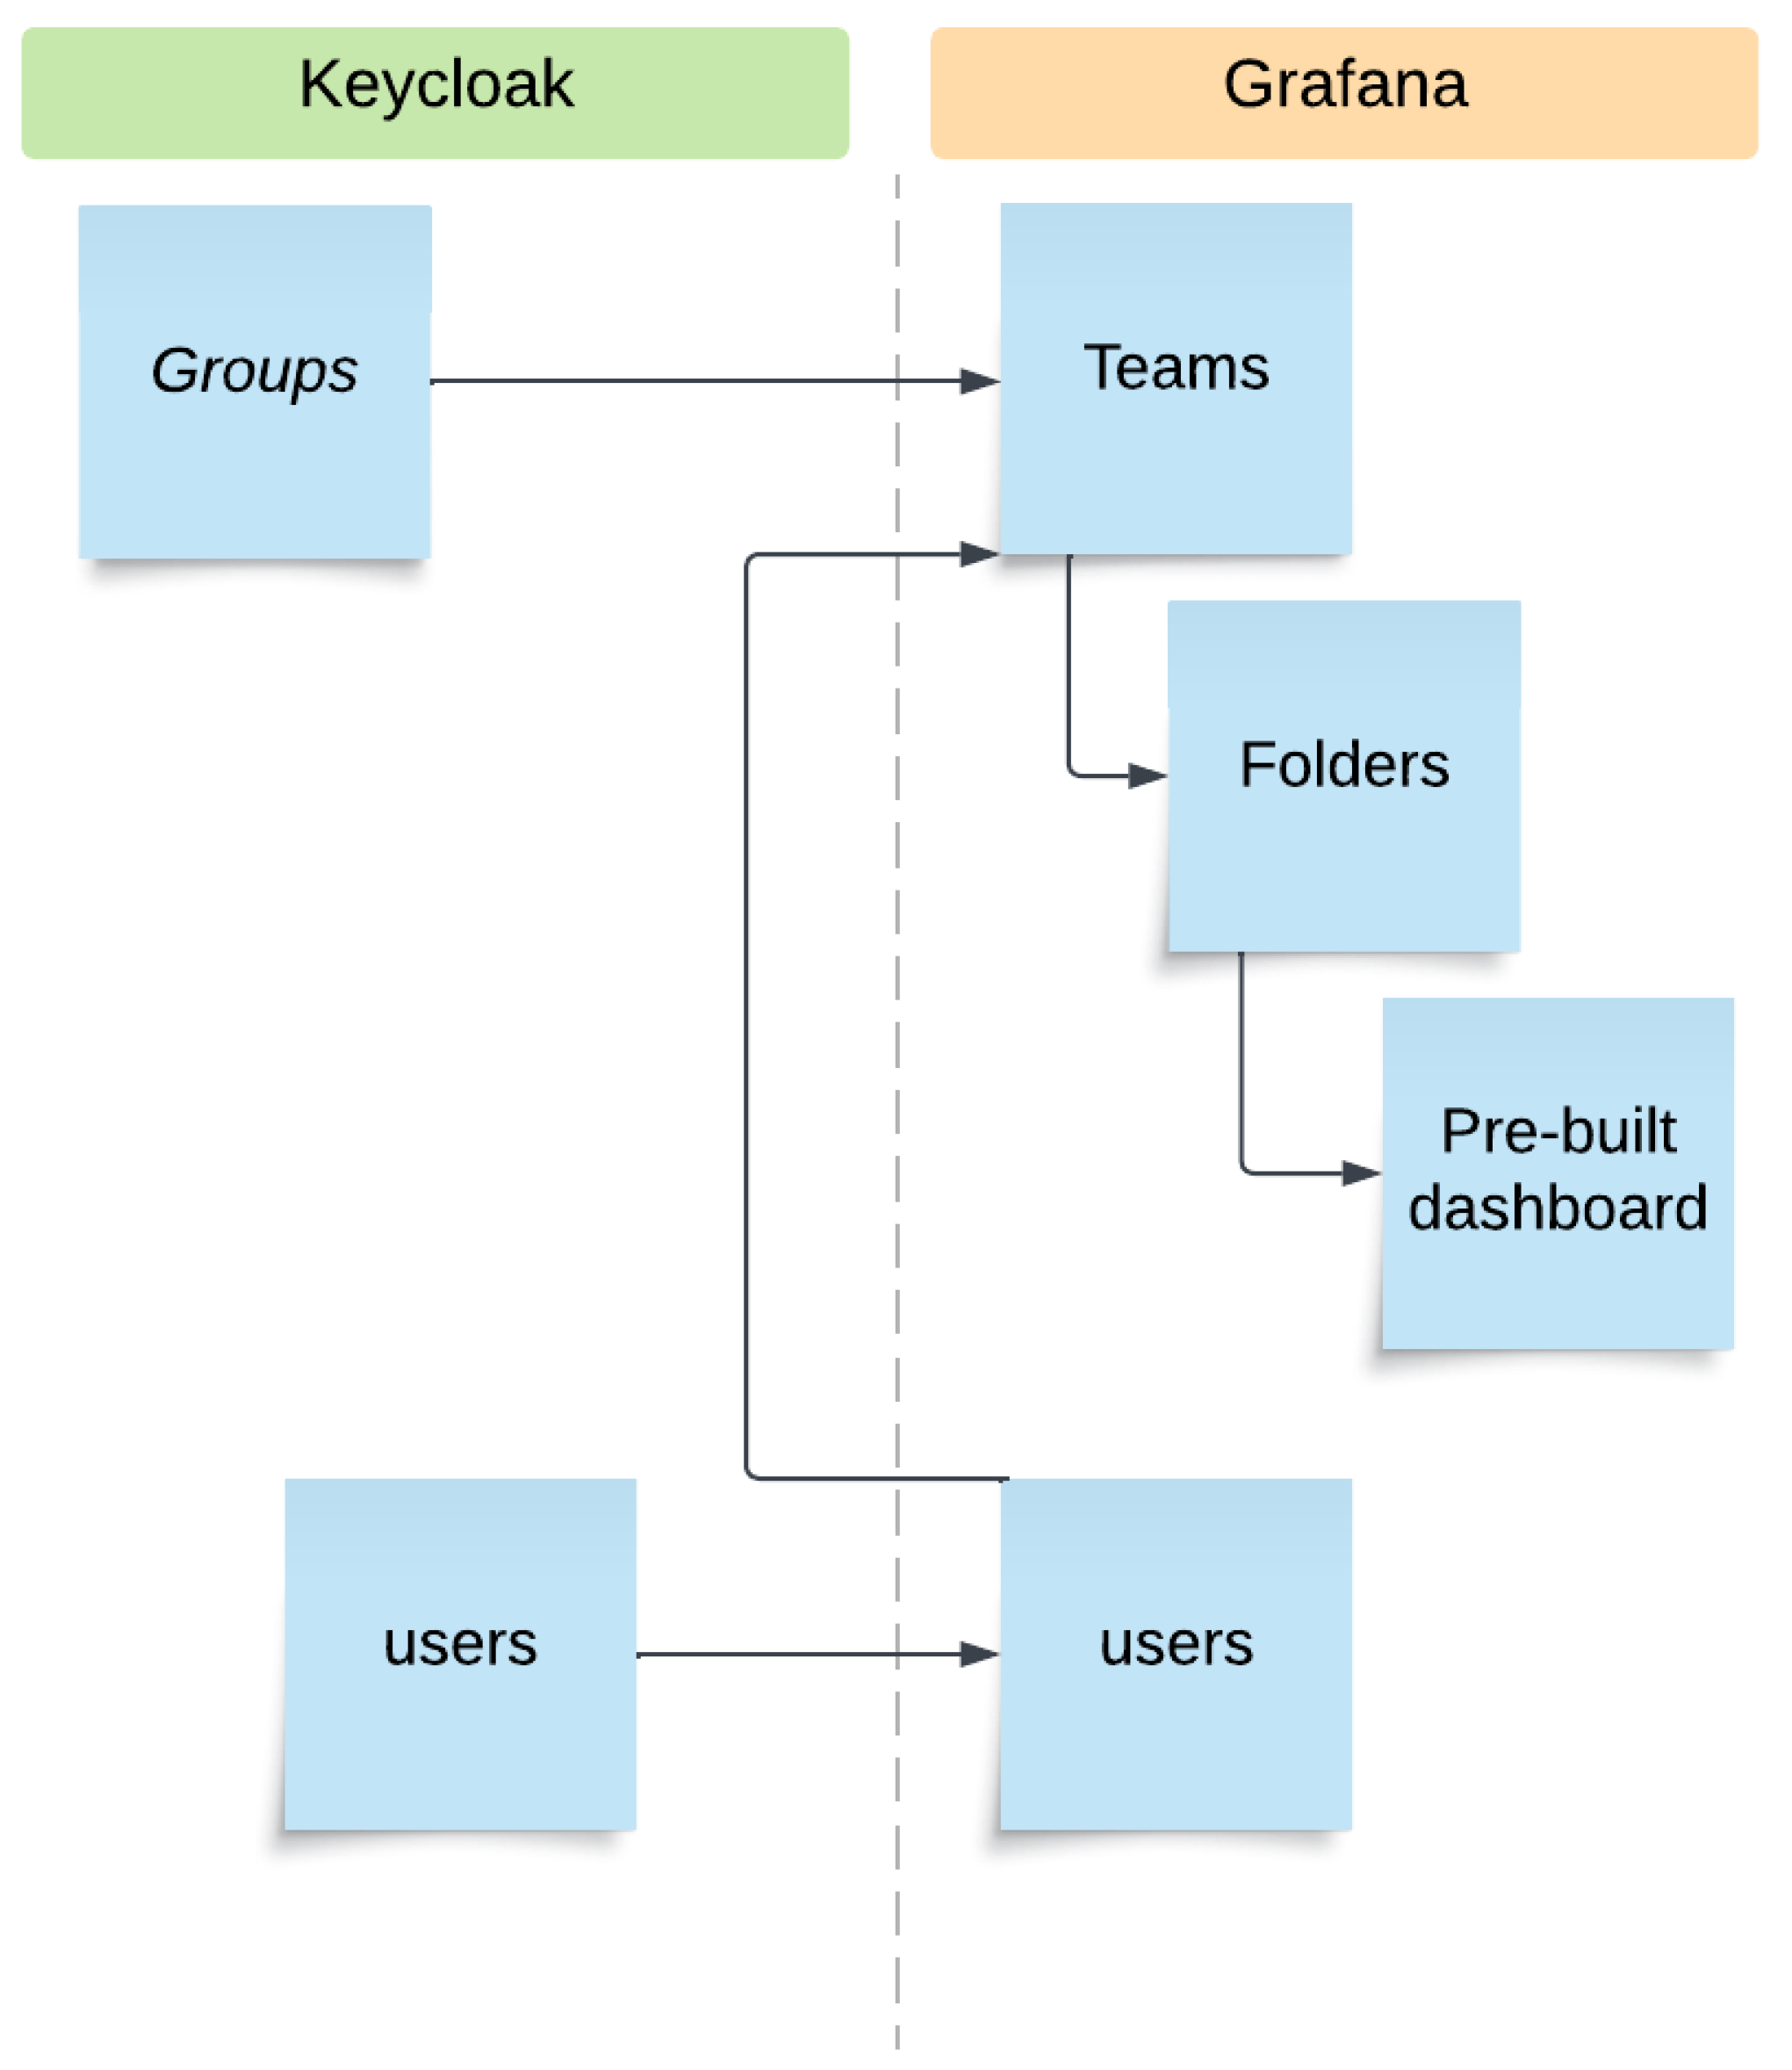
Table 1 presents mapping of the main key concepts between Keycloak and Grafana.
In Figure 3, the dotted line separates the two environments, and the arrows between environments show the mapping between the key concepts and how to match them using the services we developed.
Figure 3 shows the mechanism for synchronizing Keycloak with Grafana, which starts with connecting groups on Keycloak and teams on Grafana. The Grafana API allows this type of operation efficiently. At this stage, folders are created to contain the dashboard with the graphic widgets. The output is intended for the two side panels of the front-end, located on the left and on the right of the central map; these folders were given the naming convention “overall_sx”, “overall_dx”, or, more generically, “_sx” and “_dx”.
This structure allows the system administrator to filter access to each part of the front-end according to team-based criteria, protecting the folders from unauthorised access.
The dashboard-naming convention makes it possible to establish a link between the vertical application, defined by the part of the name preceding the “_” symbol and all the other modules used on the platform that work on the same theme.
In order for Grafana and Keycloak to communicate, some standard configurations are required.
In this case, access to the Grafana platform is achieved according to a configuration that allows the use of the OpenID managed by Keycloak, and this means that the users are not allowed in the Grafana database until they log in for the first time.
However, this behaviour does not work when it is necessary to update and synchronise group permissions, since it is not possible to intercept the user login and registration mechanism in Grafana.
Grafana’s API allows a privileged user to register local users in the local database but not those logging in using OpenID. For this reason, a workaround was used, which is detailed hereafter. First, Grafana was launched, with PostgreSQL as its internal database instead of SQLite. Subsequently, upon analysing each login via OpenID, it was possible to see that this event was reflected in three tables of the internal database (see Table 2).
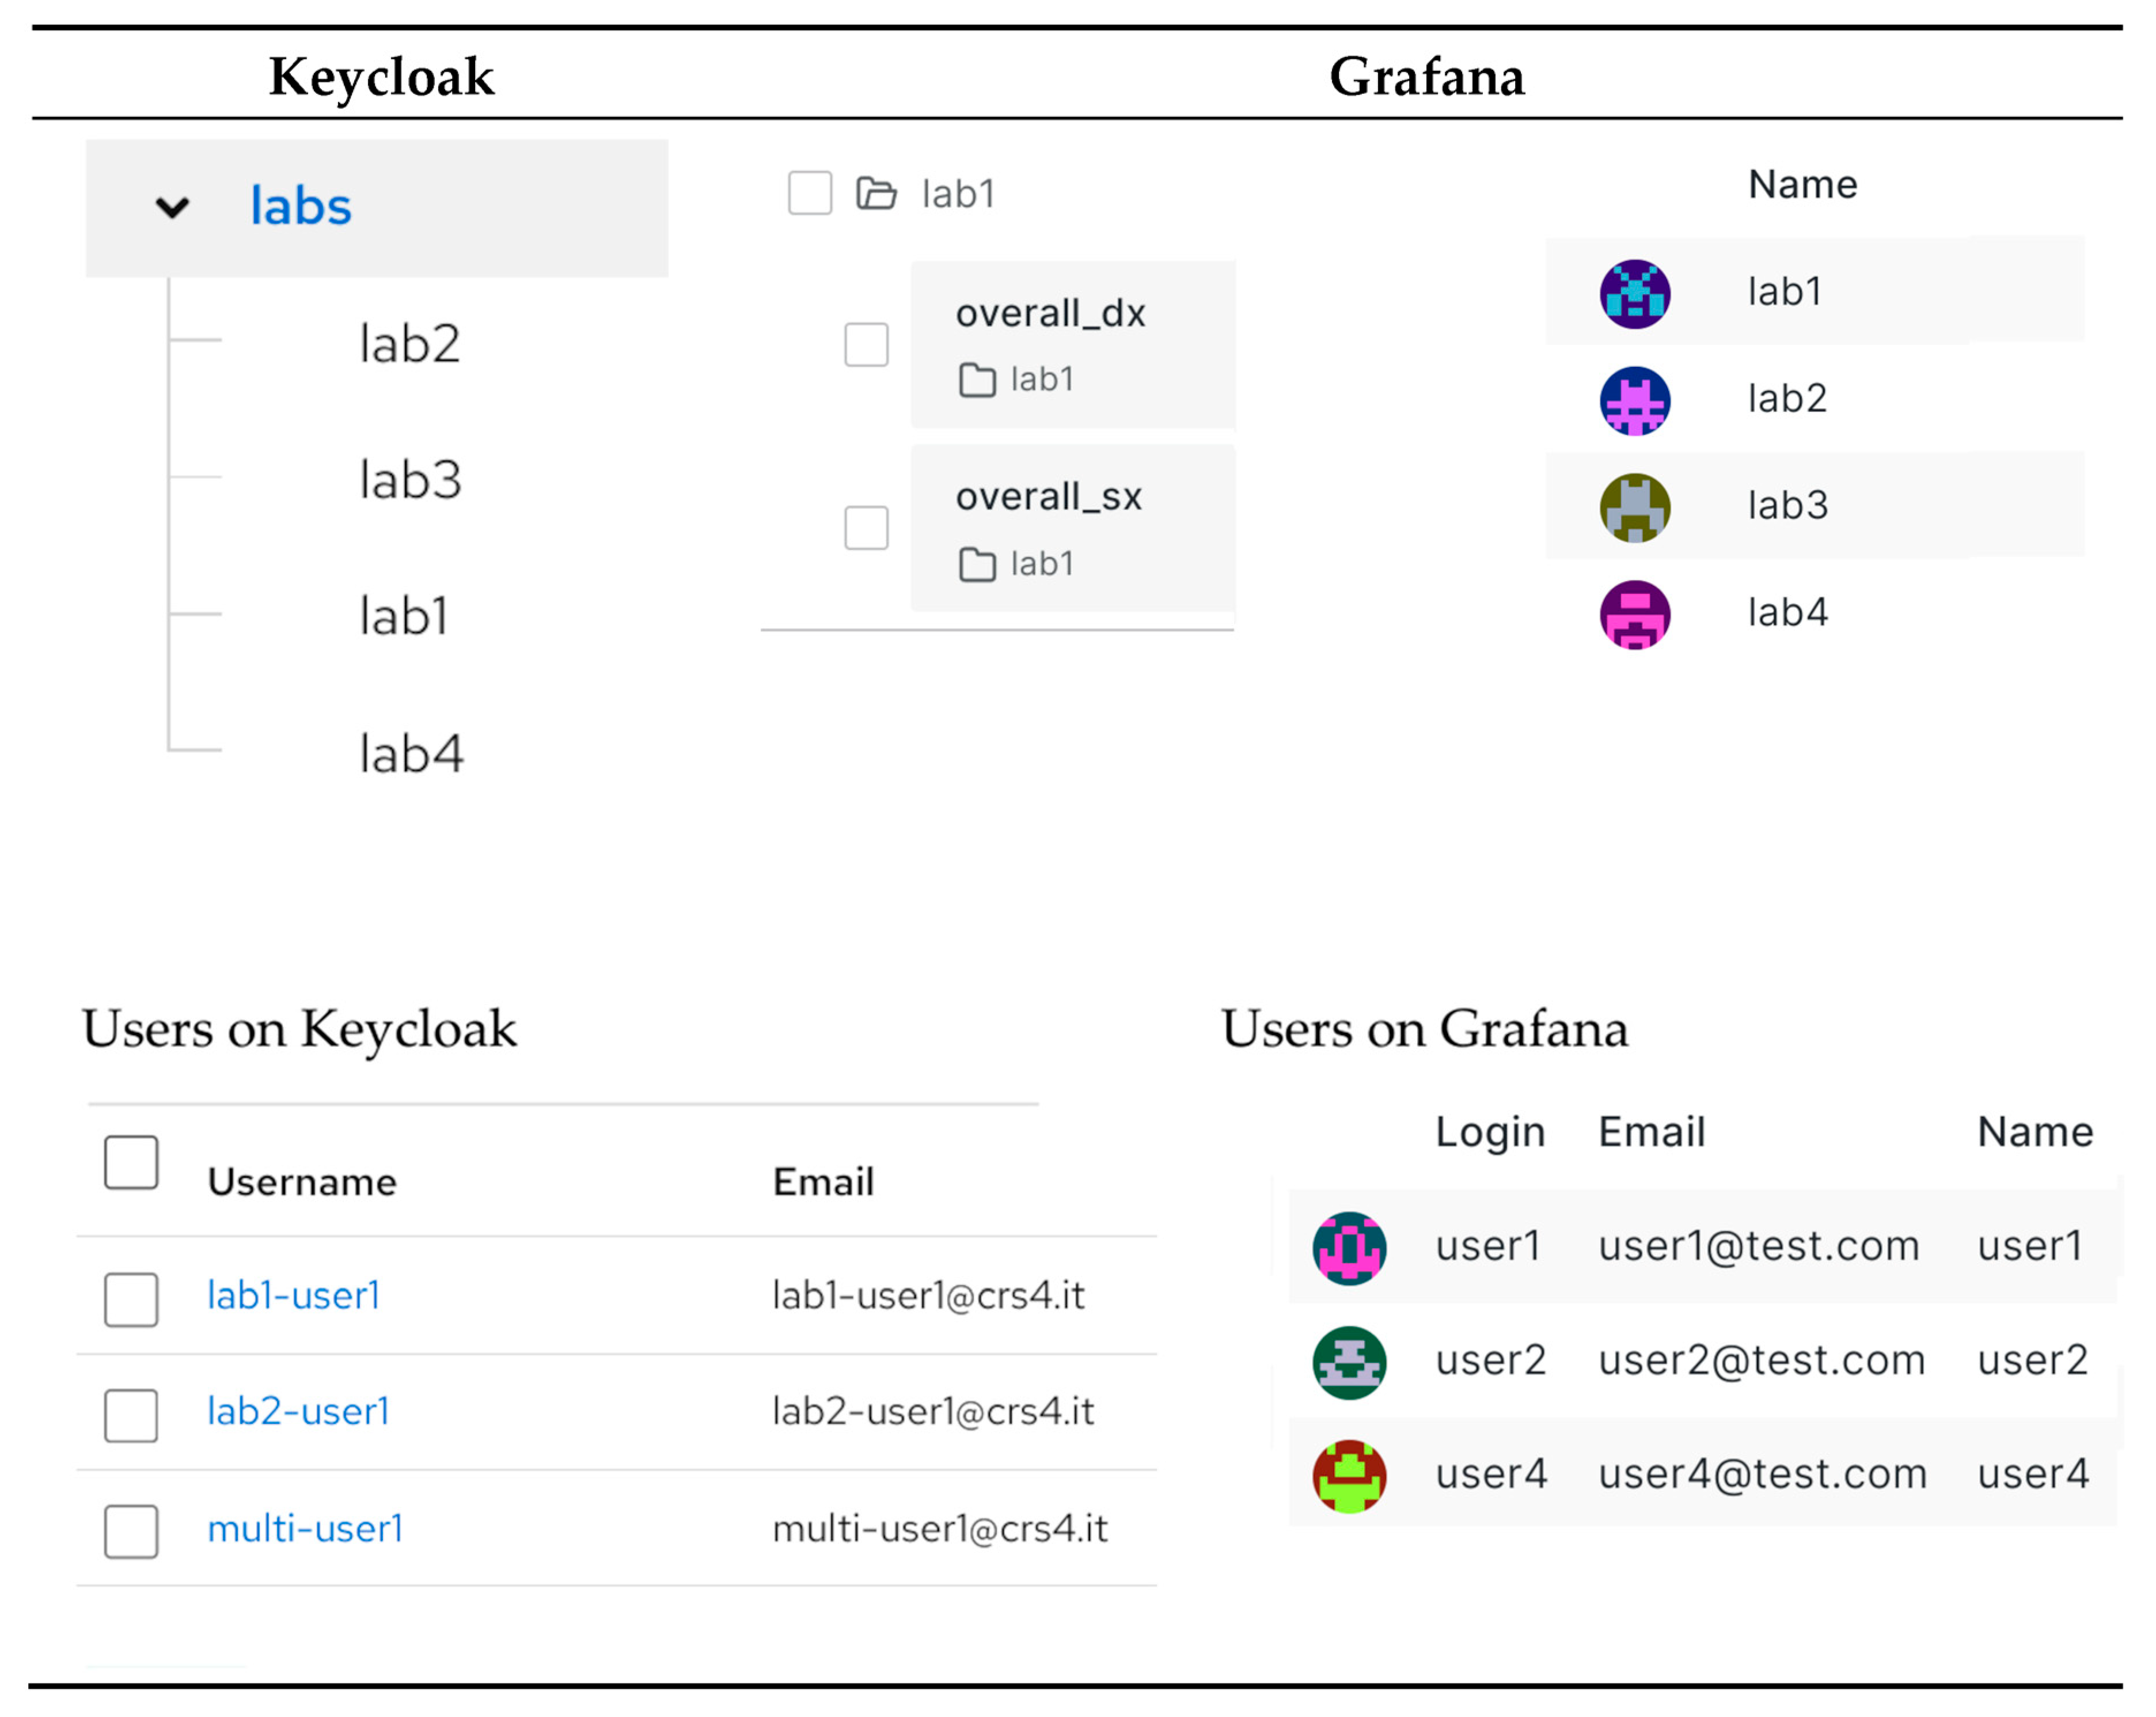
Therefore, this synchronization mechanism offers a twofold advantage: it provides direct API access to Grafana and also exploits direct access to the database. Access is limited only to strictly necessary information in order to avoid corrupting any internal mechanisms. This system enables the synchronization of users, groups, and permissions. Moreover, it initializes a basic structure for the dashboards, which will then be displayed in a portal through other mechanisms and services, which will convey the content to the front-end. Figure 4 shows the results of the syncing action between Keycloak groups and users and Grafana users and teams.
3.4.2. The System to Export the Dashboards
This paragraph explains how to transfer information from the back-end environment to the portal in order to build and populate its structure.
A system that enables a customisation of the presentation was necessary to display the content of the Grafana dashboards in the portal.
The development of a user synchronization service between Keycloak and Grafana also affects the sidebars of the front-end (identified with numbers 2 and 3 in Figure 2). The information comprises two HTML files that contain the page layout and references of the dashboards that can be exported from Grafana.
The developed module uses asynchronous technology to improve performance and consists of REST APIs that serve as an interface to the underlying logic.
The aim of this module is to supply an interface that powers the portal sidebars by providing files that constitute the structure of the analytical bars, menu, and any data sources to manage additional logic directly on the map upon request.
MinIO [35] was selected to manage object persistence, specifically for storing unstructured data such as photos and videos. It provides APIs for interactive queries and a web console for easy data updates. MinIO is an open-source project based on Amazon’s S3 standards for managing object storage. Minio natively supports OAuth2 and OpenID Connect, making it ideal to interconnect environments with centralized authentication management, especially in Kubernetes-related infrastructures.
As with Grafana, a new structure was required to reflect the hierarchy of the user, group, and application. Custom access policies have been implemented to ensure correct access to authorised resources. These policies can be modified and bind users to folders through group names.
Policies in Minio are JSON blocks such as in Figure 5.
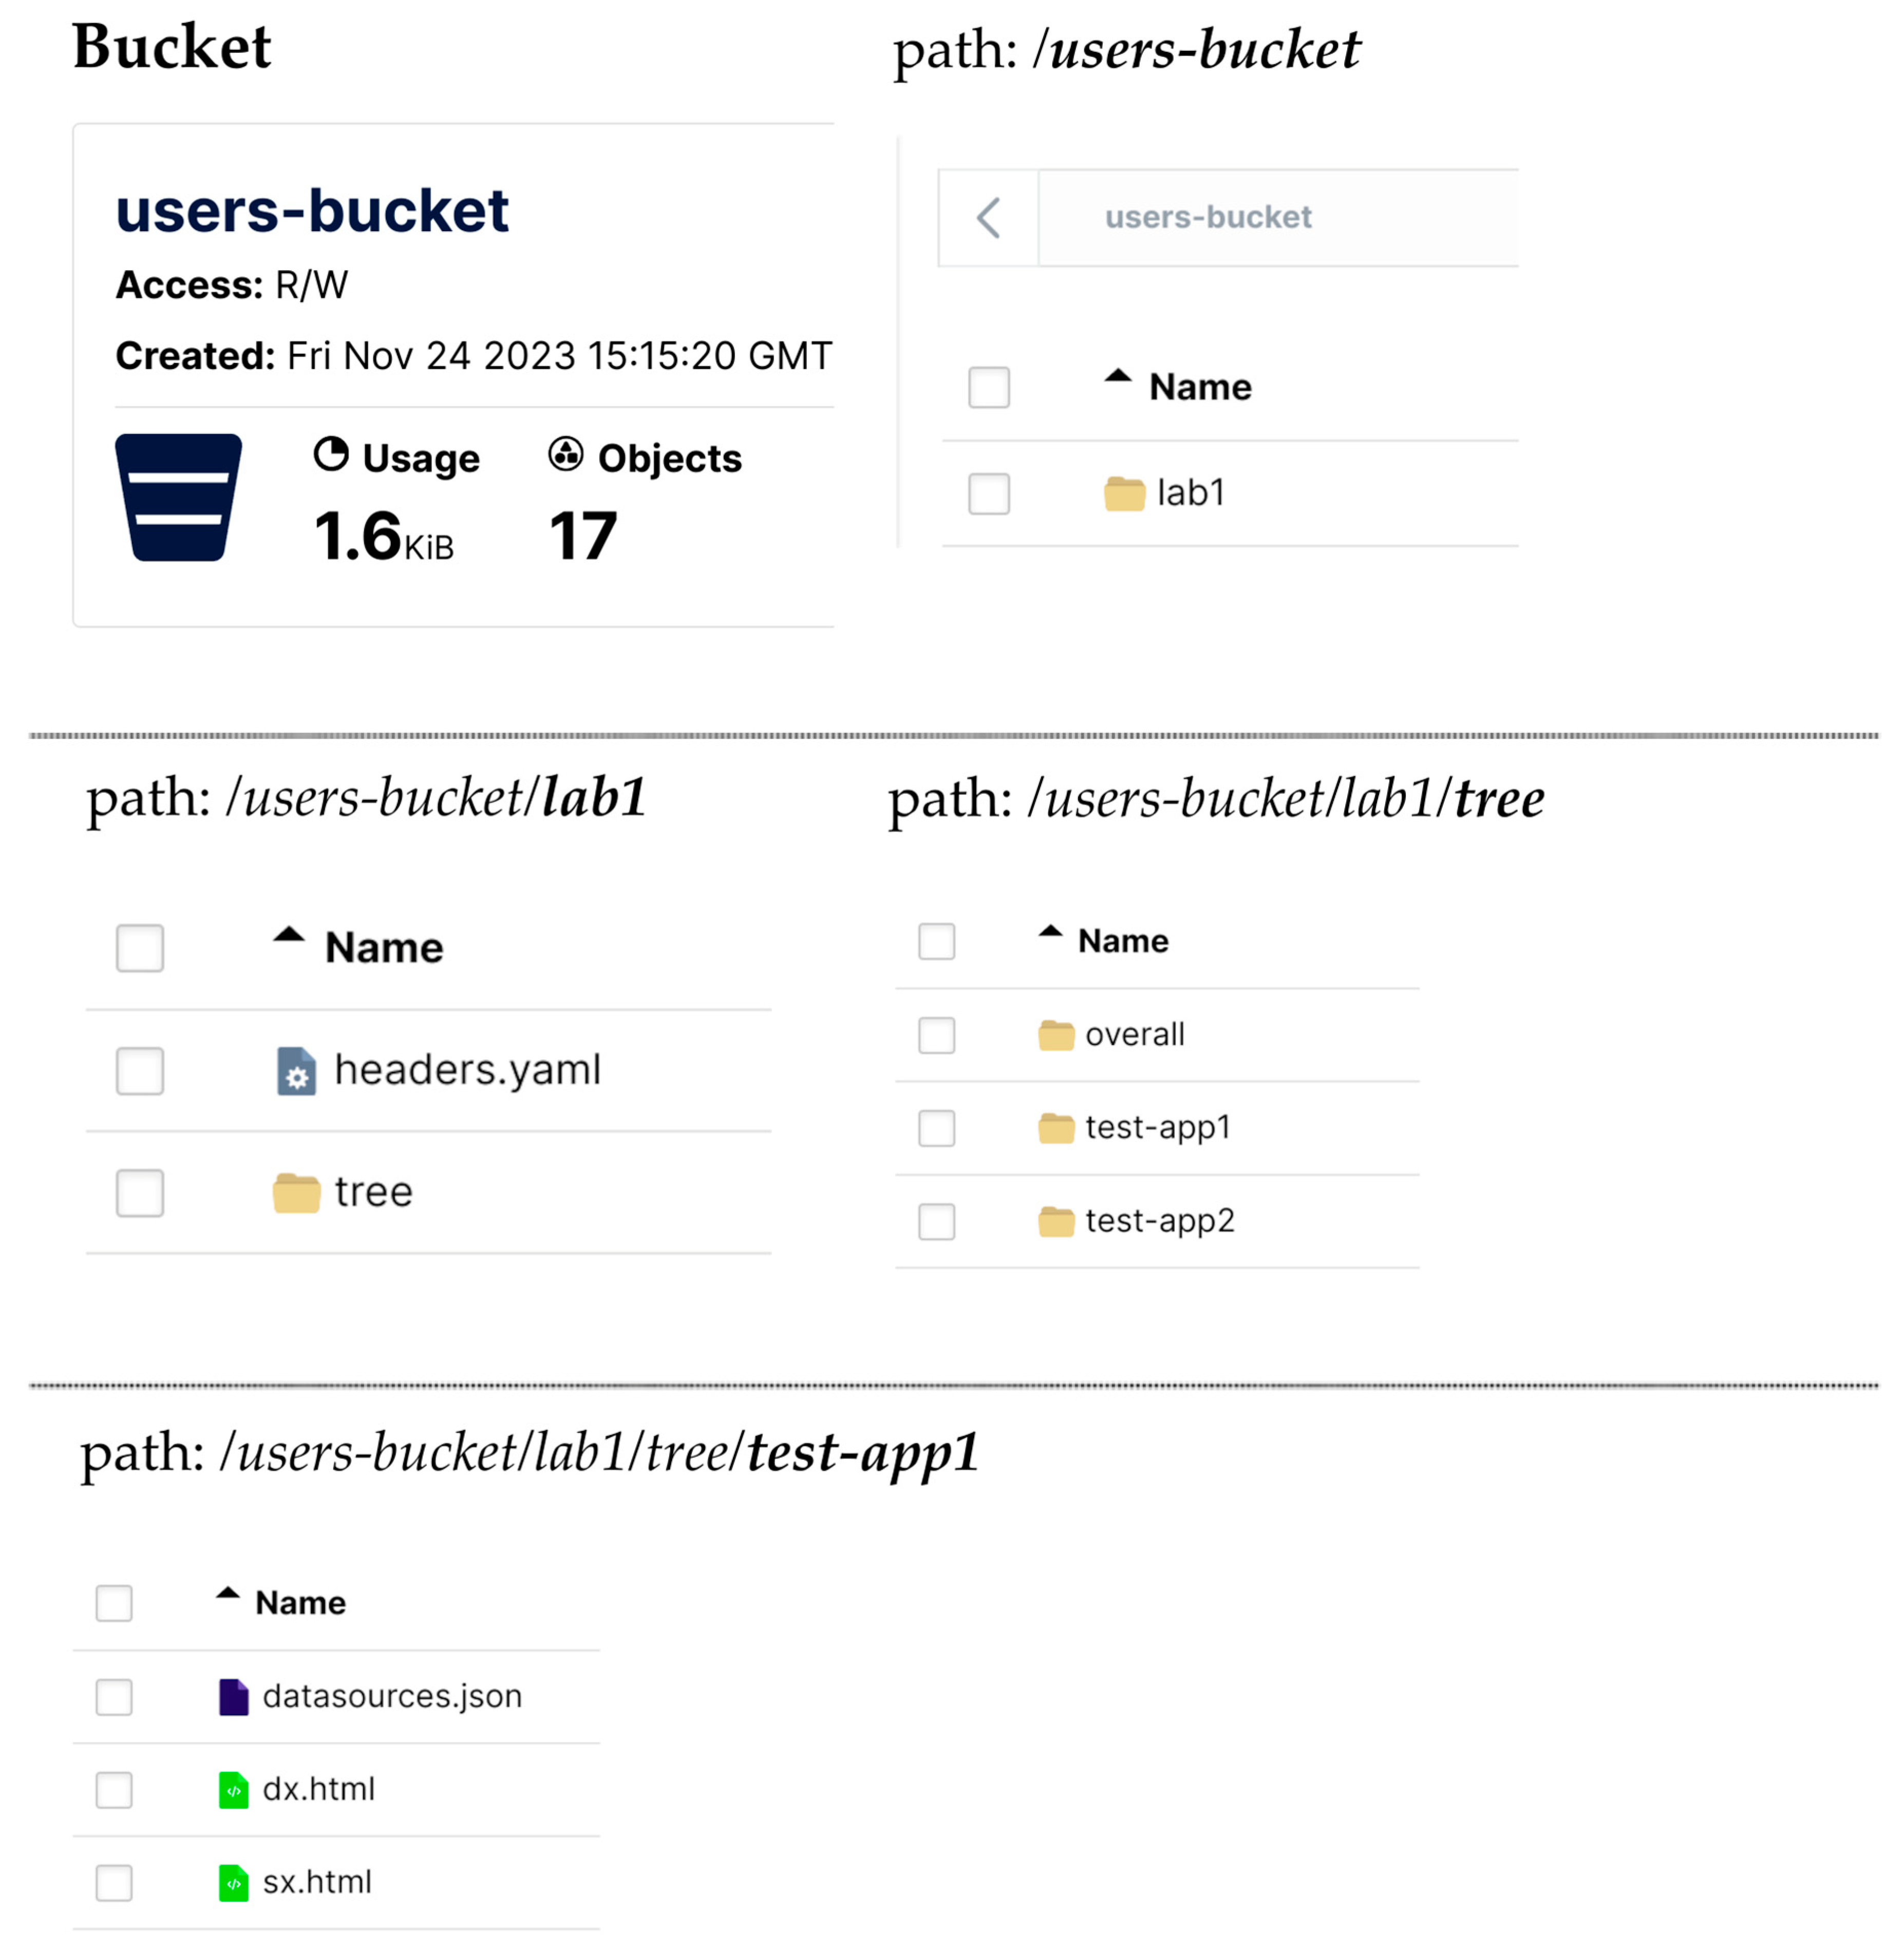
In the next block, the “users-bucket” resource for AWS is defined as the object on which the rule will be applied, that is, precisely, a container bucket, like Figure 6.
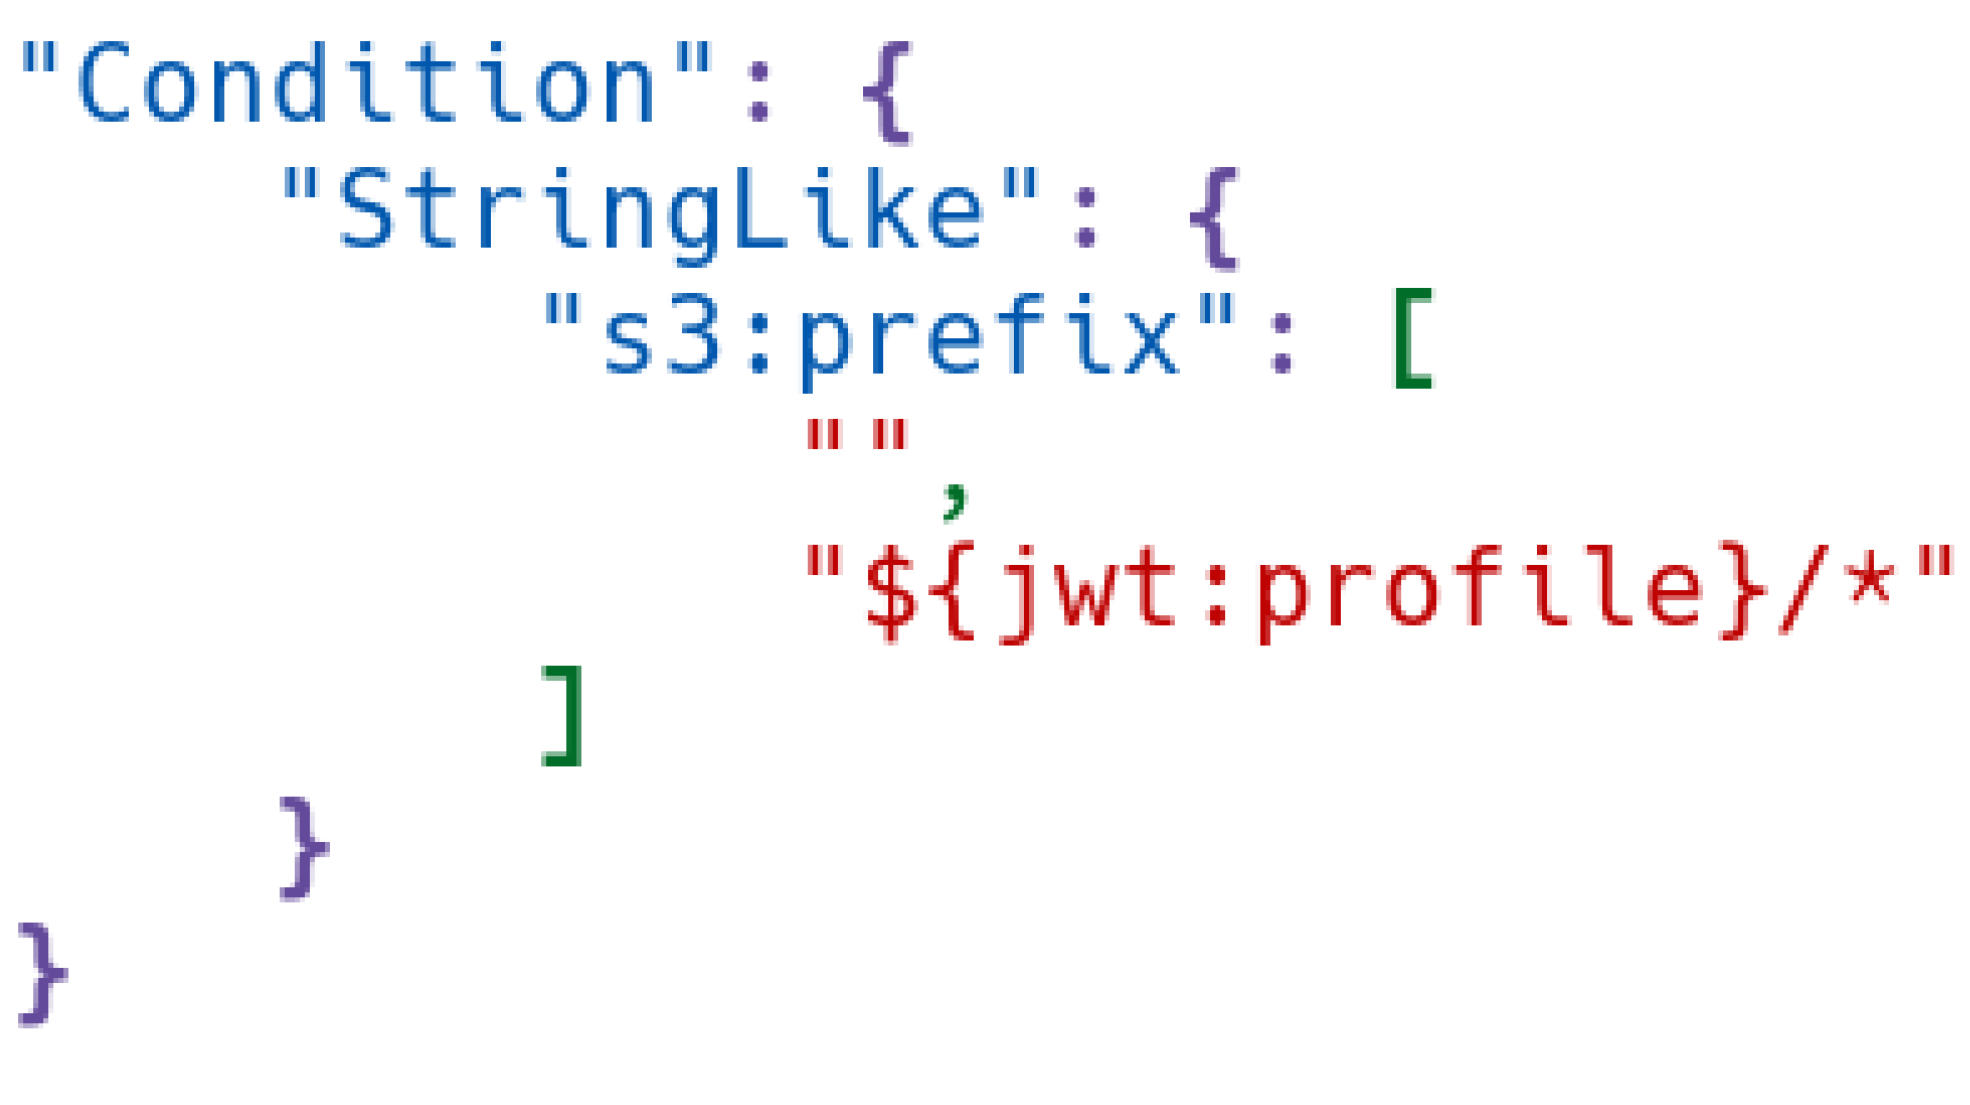
Access to the folders will only be granted to users with the ‘profile’ claim in their token, starting with the name of the folder, as shown in Figure 7.
On the Keycloak side, the “client” used to identify MinIO users has a “client scope” that allows for the propagation of an attribute (also known as “claim”) through the token payload. This claim provides information about the group name of the user that is attempting to access the resource. In this case, the claim must be named “profile” due to some restrictions in MinIO regarding the “claim” field.
The token in Appendix A has the value “lab1” in “profile”. According to the policy listed above, the user will, therefore, only have access to the following path:
users-bucket / lab1 / *
Figure 8 shows the first folder hierarchy in a boilerplate structure.
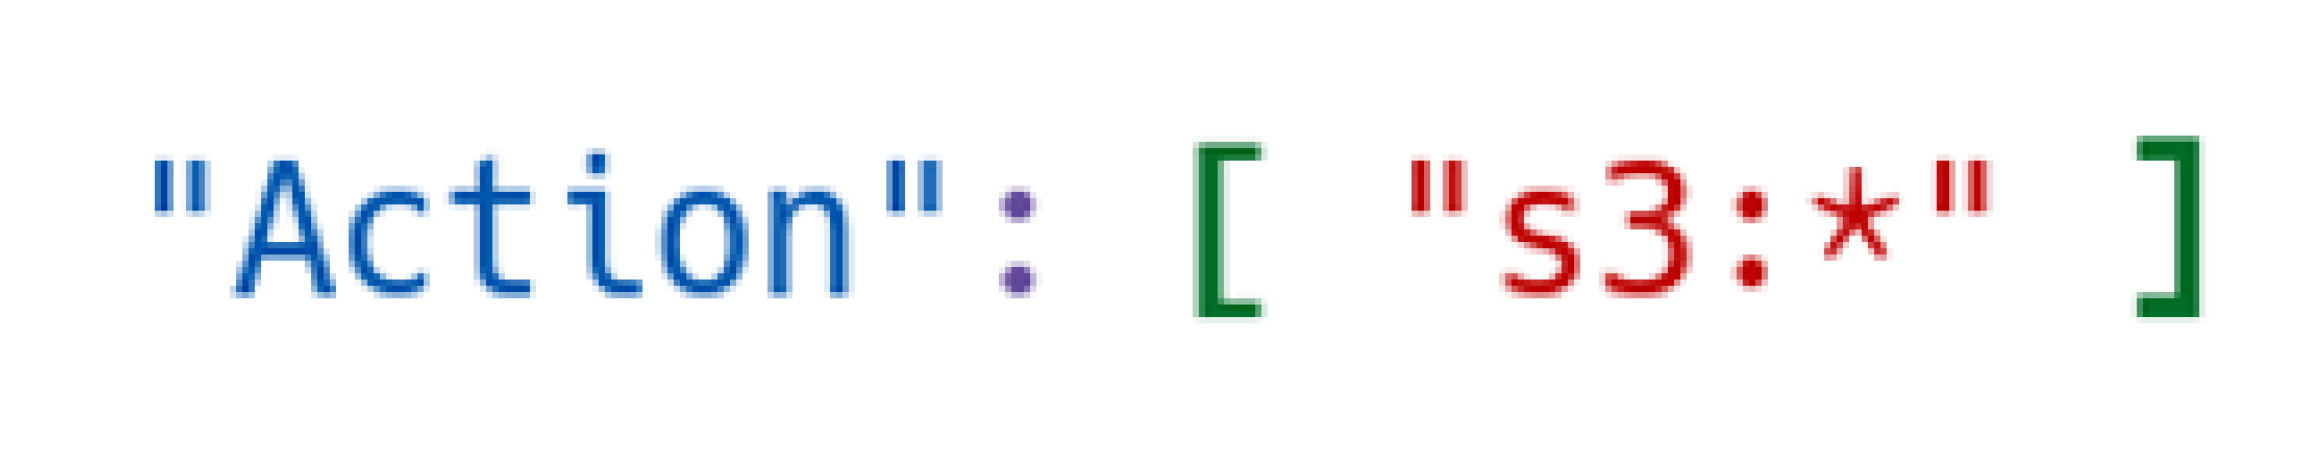
The type of operations allowed to this user is defined by the block illustrated in Figure 9.
In this specific case, any operation is allowed as the wildchar “*” is used.
MinIO is a very stable and solid system that reflects the AWS S3 API quite closely. However, some parts were difficult both to understand and to use; in particular, the use of the policy engine is found to be very time-consuming because it does not send any output to the console log. For this reason, the rules must be written without any assistance in debugging, and bug fixing can be very complicated. Unlike Amazon’s products, which provide a web interface to aid in policy creation, MinIO does not offer this useful functionality. Although the documentation includes a cross-reference to Amazon’s own products, exporting the rules created with these tools can be frustrating because the relationship between Amazon’s and MinIO’s features is not one to one.
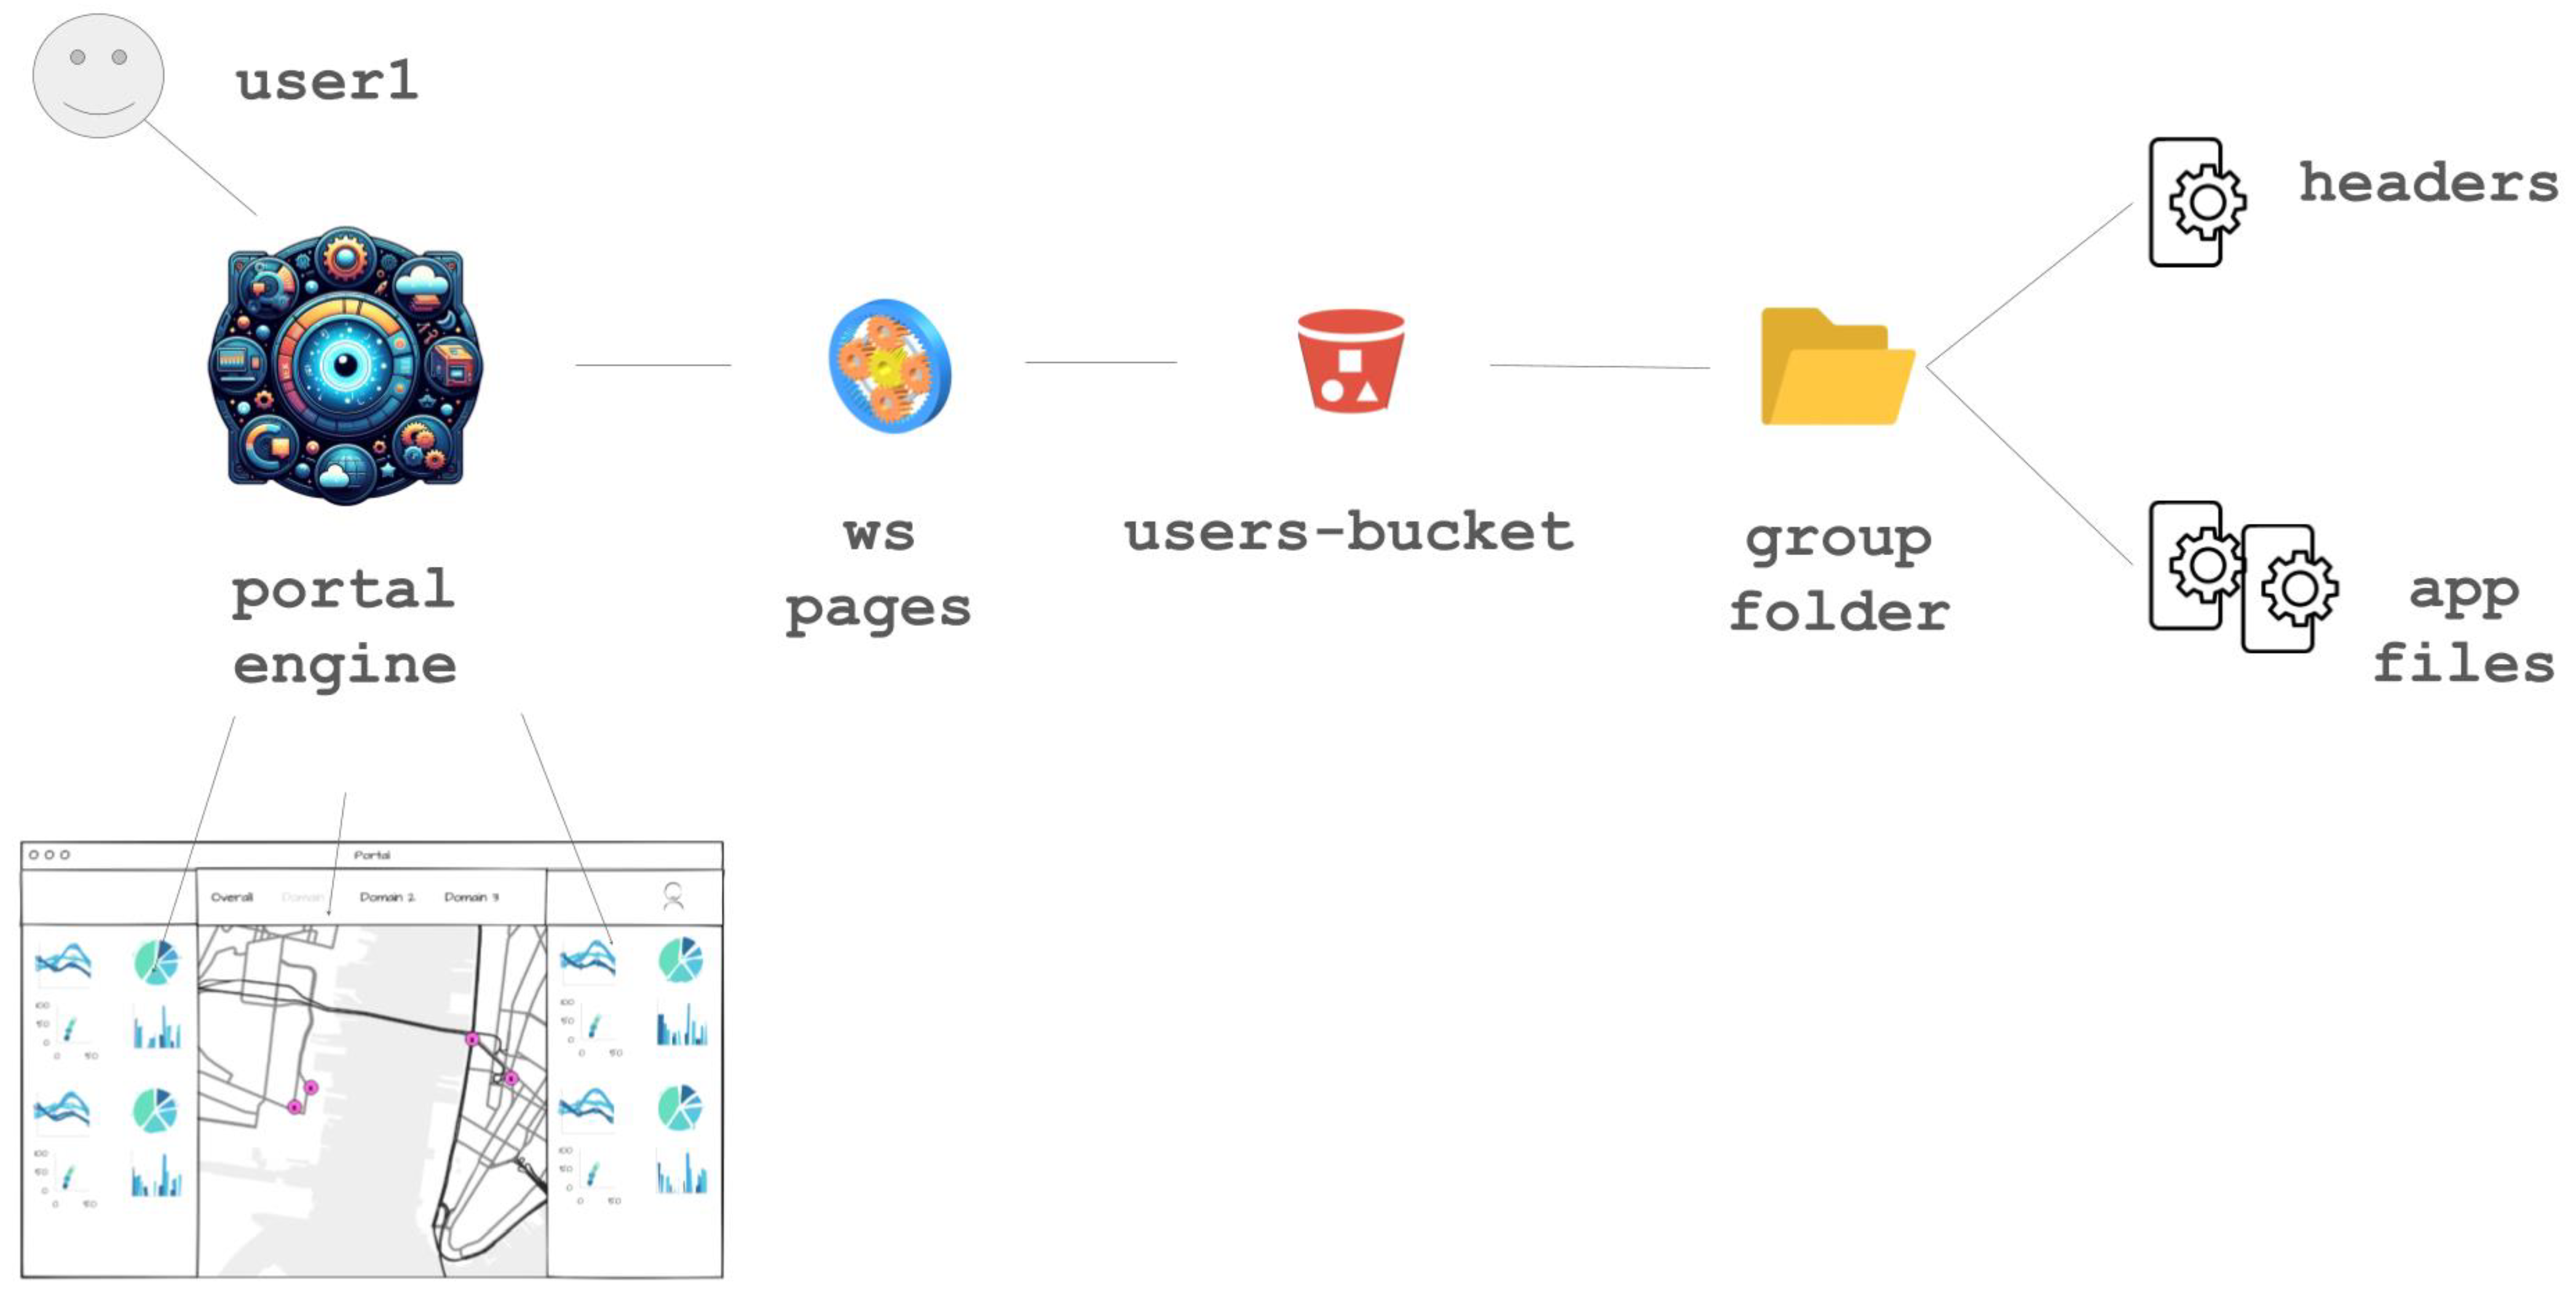
The process for feeding dashboards to the sidebars can be described as follows (shown in Figure 10): A user with a valid token accesses the portal and selects a topic from the main menu. This triggers a request to the service related to the selected topic to obtain the information, which will be shown in the header and in the two sidebars. The service verifies the validity of the token and queries MinIO, based on the group information. At this point, the service returns the header YAML file along with the HTML files defining the two sidebars. The convenience of this approach is that these files can be locally built, updated, and sent to MinIO via the web interface. Another useful feature of this system is that MinIO allows for versioning, although it has not yet been developed in the CDL platform.
3.4.3. The Map Logic
This section explains how to interact with the map, which is the primary component of the front-end and is identified as number 4 in Figure 2. The central area of the front-end contains the map, which is developed using CesiumJS [36], and a Javascript GIS library that enables the creation of a virtual globe using maps from different sources. Through the CZML (Cesium Language) format, Cesium enables the creation of web clients that provide graphical descriptions of events on a map, maintaining precise temporal references [37]. This approach enables the dynamic visualisation of elements on the map, changing features based on their most recent state and, potentially, displaying the states assumed at each time interval [38].
From here on, we will call “client” a JavaScript application built with the CesiumJS library; in this project, CesiumJS is loaded inside the portal front-end to manage the communication with the modules of the back-end modules, as well as the rendering of the widgets on the map. In order to secure the client and allow for multi-tenancy when displaying information on the map, the client was also integrated with KeyCloak using the specific adapter.
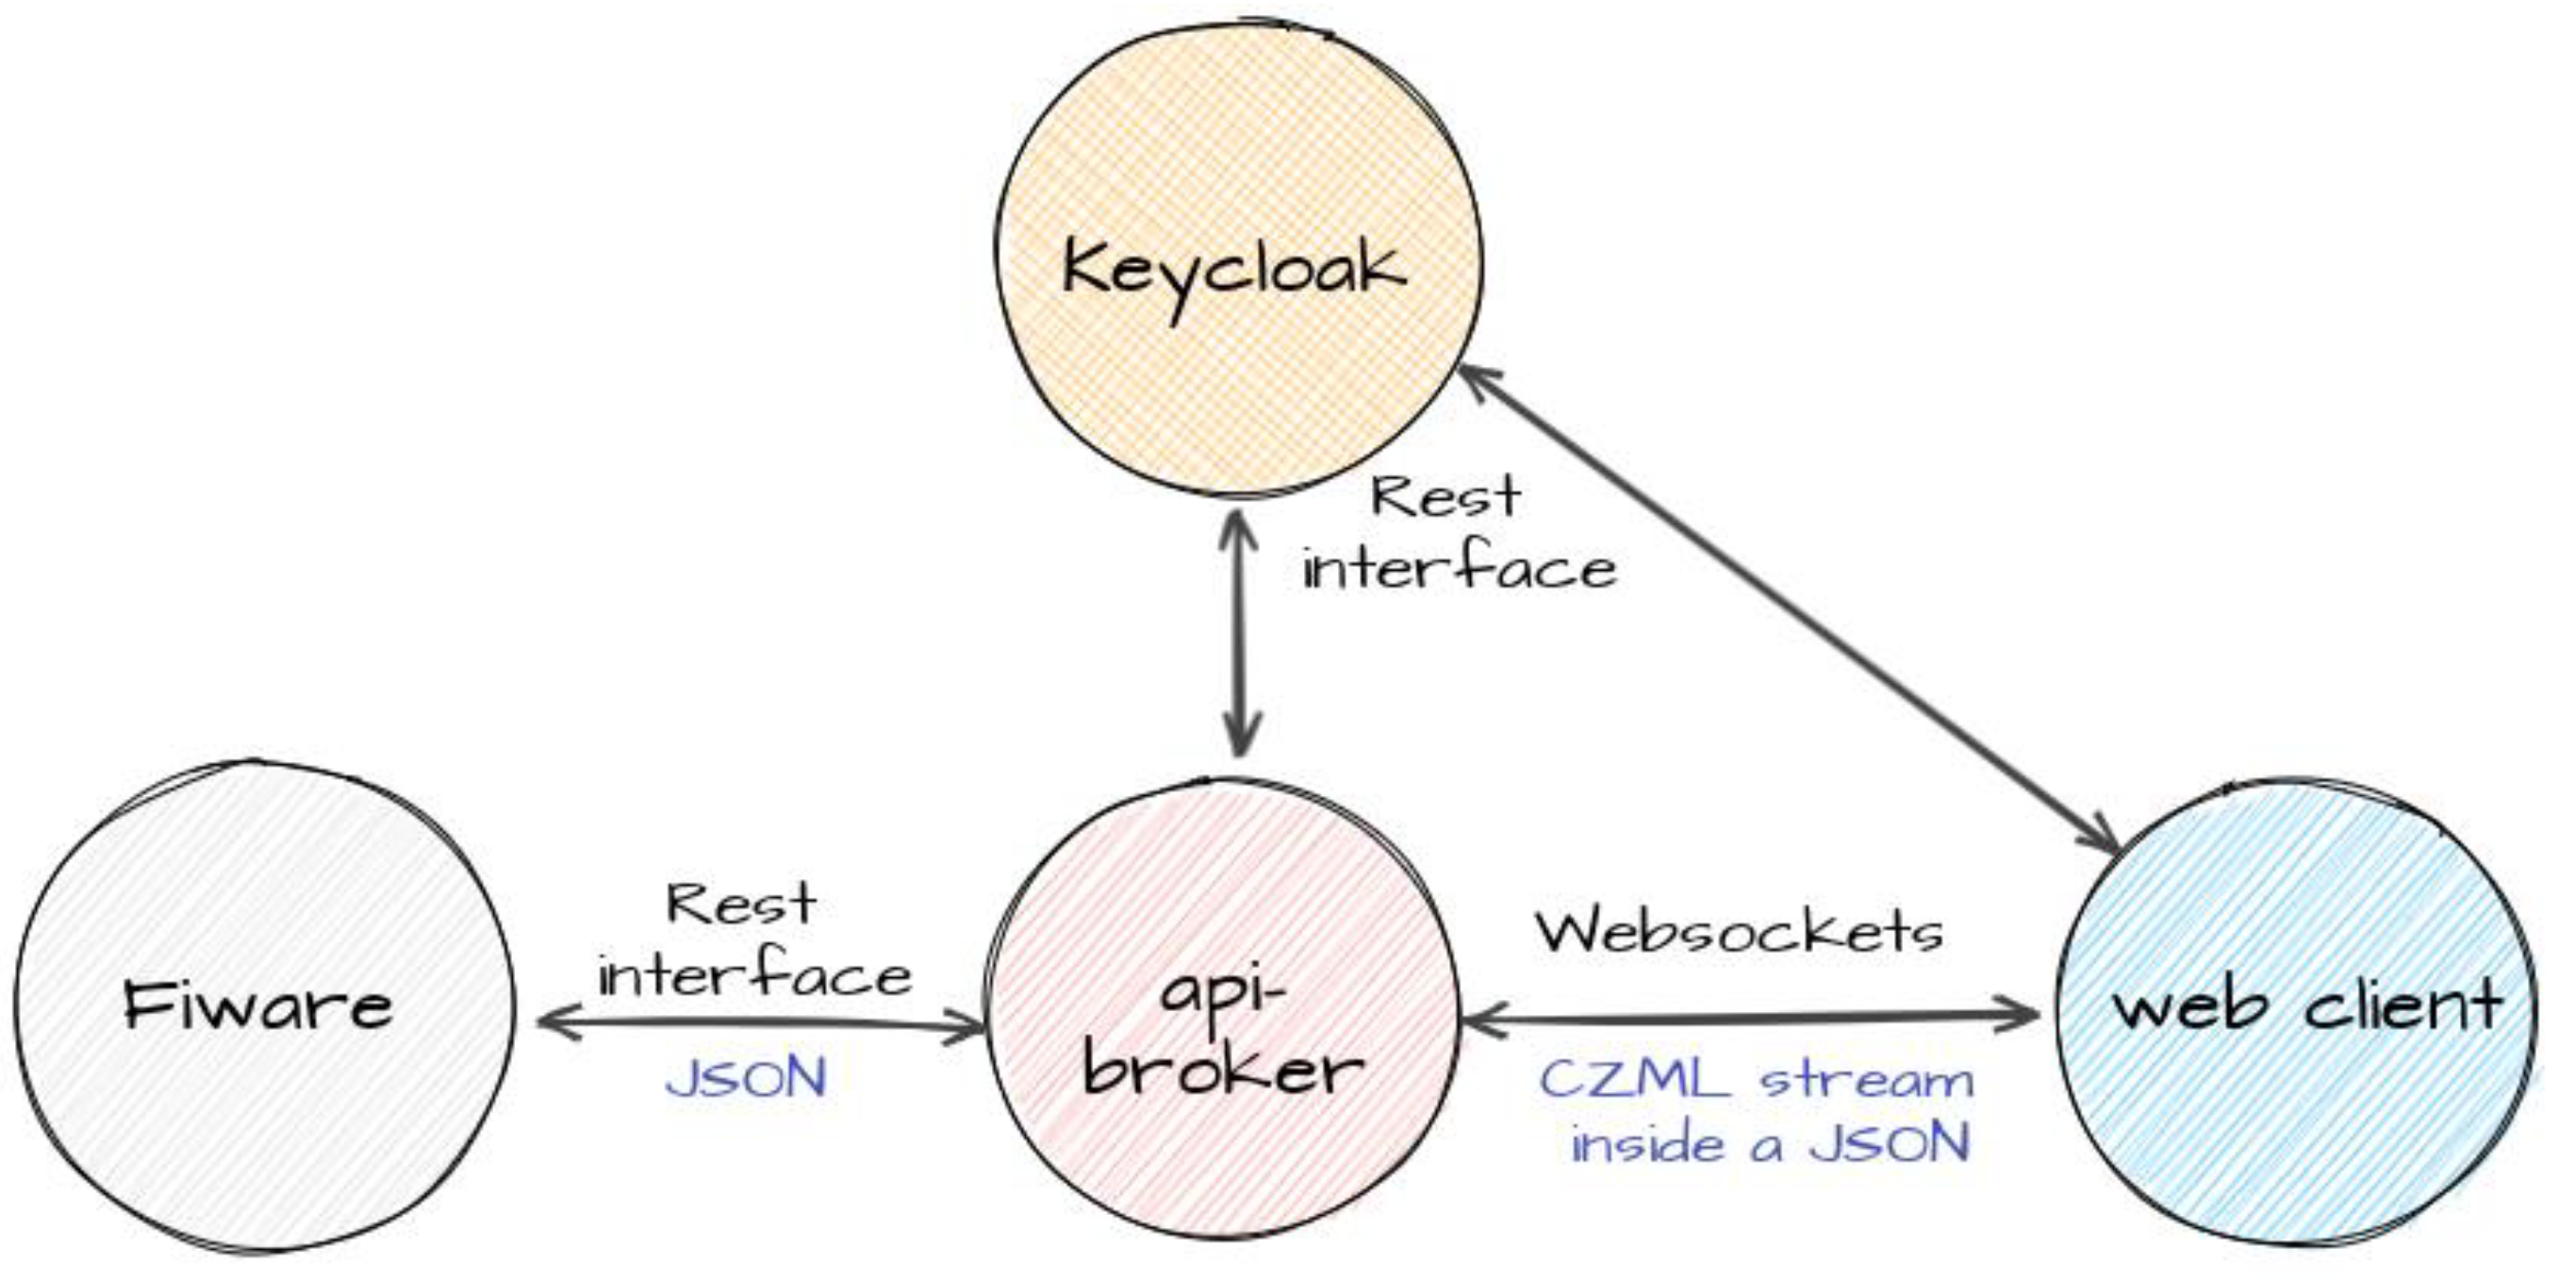
The conversion of the information collected and stored by the FIWARE components into data in a format usable by CesiumJS is handled by the API broker, a microservice that exposes two types of interfaces: the REST APIs to the FIWARE environment and a websockets-based interface to clients running CesiumJS, as shown in Figure 11.
The CZML format used by Cesium is based on JSON, so a properly corrected CZML file is a valid JSON file designed to efficiently and incrementally stream data to a client built with CesiumJS. The client does not need to have finished loading the entire document before the scene is presented. Individual clients can join and leave the stream as it is transmitted. The CZML file format allows both static and timed information to be dynamically added to extend the functionality of the client, adding information to the objects in the scene.
More specifically, a CZML document consists of a single JSON array, where each object element is a CZML packet. The graphical characteristics and properties of a single object in the scene, such as a single sensor, are described in a CZML packet. Of course, in order to be located on the map, each object must contain information about its position, expressed in coordinates (latitude, longitude, and altitude). A possible document will have the structure illustrated in Figure 12.
The communication between these clients and the API broker follows two main streams: the first stream is related to the initial connection of the client, and the second stream is related to the push of updates coming from the sensors. This aspect will be described in more detail below.
In the first case, the web client obtains the access token from Keycloak on behalf of the user and establishes the connection on the websocket interface of the API broker. Unfortunately, the WebSocket protocol does not define an authentication and authorisation system, and in the JavaScript WebSockets API, there is no way to specify additional headers to send to the WebSocket server [39]. A common workaround to achieve this is to pass the token in the URL/query string when establishing a WebSocket connection, but this also means exposing it to possible logging systems. To avoid this problem, the token is included in each message that the client sends to the service, and communication between the two takes place under a Secure Sockets Layer (SSL) certificate. The server will only allow the initial connection to continue if the token is valid.
Websocket communication between the client and the API broker is based on the exchange of JSON messages: the client sends the desired command to the service, which checks the validity of the token contained in it and sends a response. For example, for the client’s first connection, the message will have the structure illustrated in Figure 13.
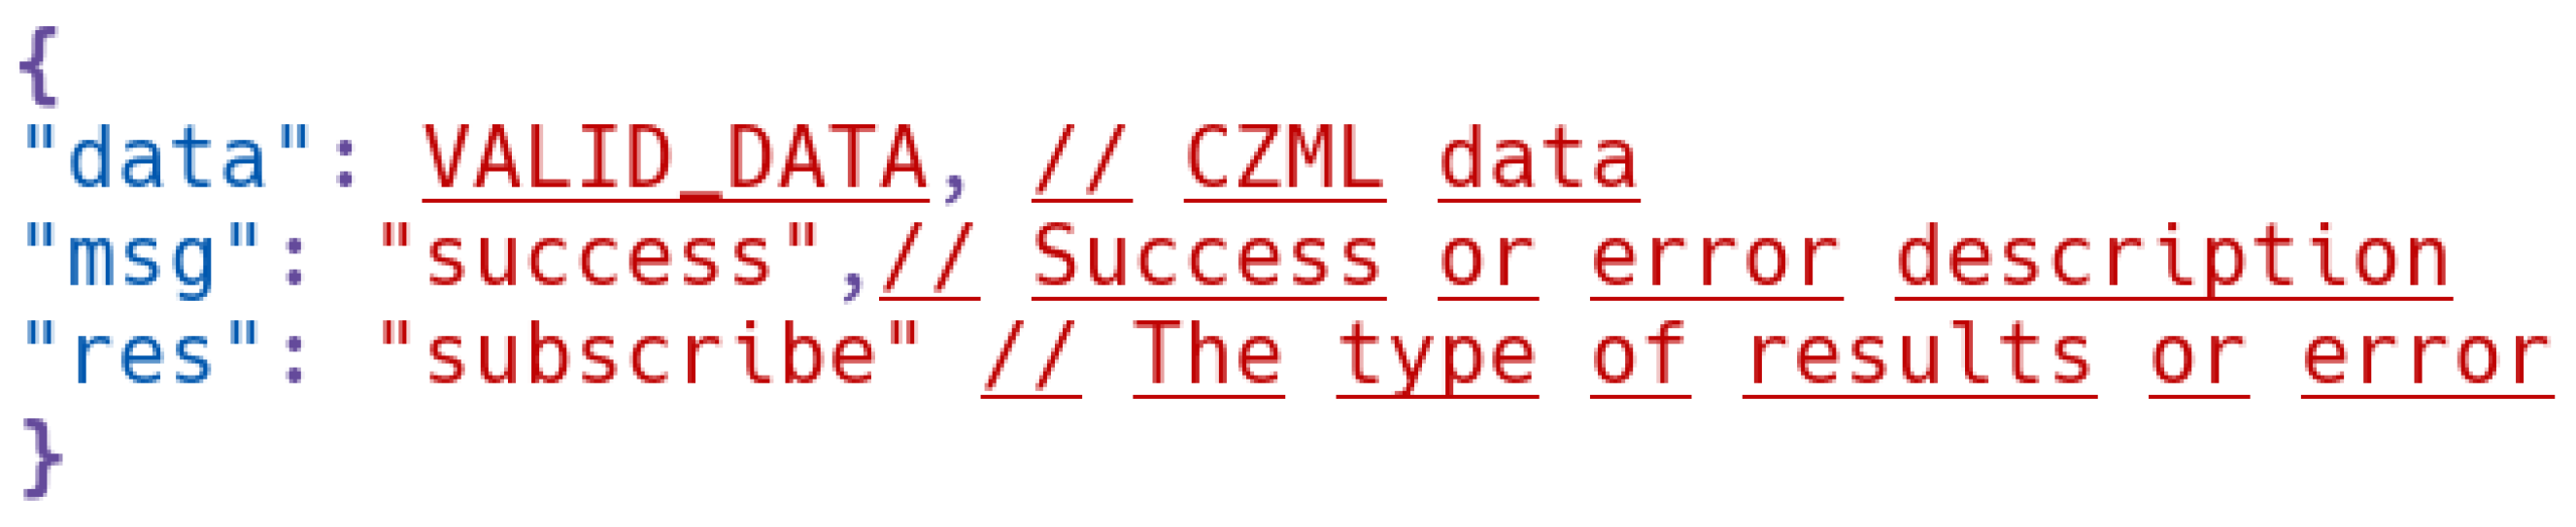
The response to this request sent by the API broker to the Cesium client will have the format illustrated in Figure 14.
Like the other services described so far, the API broker is integrated into the Keycloak infrastructure, and the websocket only accepts commands from clients that are associated with a valid token, as described above. One of the tasks of the API broker is also to recognise which resources a user can access by parsing the “groups” claim contained in the token provided by the client. At the global platform level, Keycloak groups are mapped 1:1 to the tenants implemented by FIWARE.
The FIWARE Orion Context Broker implements a basic multi-tenant model based on a logical database separation. With this implementation, when the Orion receives a request that includes the “FIWARE-Service” HTTP header, this header is used to determine the correct tenant and ensure that the entities/attributes/subscriptions of that tenant are kept “invisible” to the others.
The second type of data flow, relating to updates, follows a similar logic to the first, but in this case, the triggering event is not in the Javascript client but in the FIWARE part. Within the API broker service, the user group is then used to manage all connections that have access to the same set of resources, so that any updates received from FIWARE can be sent to all connected clients. When Orion notifies the API broker using the REST interface, it sets the HTTP header “FIWARE-Service” to match the tenant from which the data were generated. The API broker uses this information to determine the group of users connected to the websocket and propagates the message accordingly after converting it to CZML.
The token in Appendix A refers to the values “/lab/group1” and “/lab/group2” in the claim “groups”.
Whenever a client connects to the API broker with this token, the connection is added to two different groupings: one for group1 and one for group2. From now on, FIWARE can be queried using the name of each group to retrieve all the information about the two tenants. At this point, the information is transformed into CZML and sent directly over the link to the individual connected client. From now on, when data from the sensors in tenant group1 (or group2) are sent by FIWARE to the API broker, the data received are converted to CZML and sent to the grouping group1 (or group2) of all connected clients.
3.5. The IoT Agent and the Connection of AI-Based Services
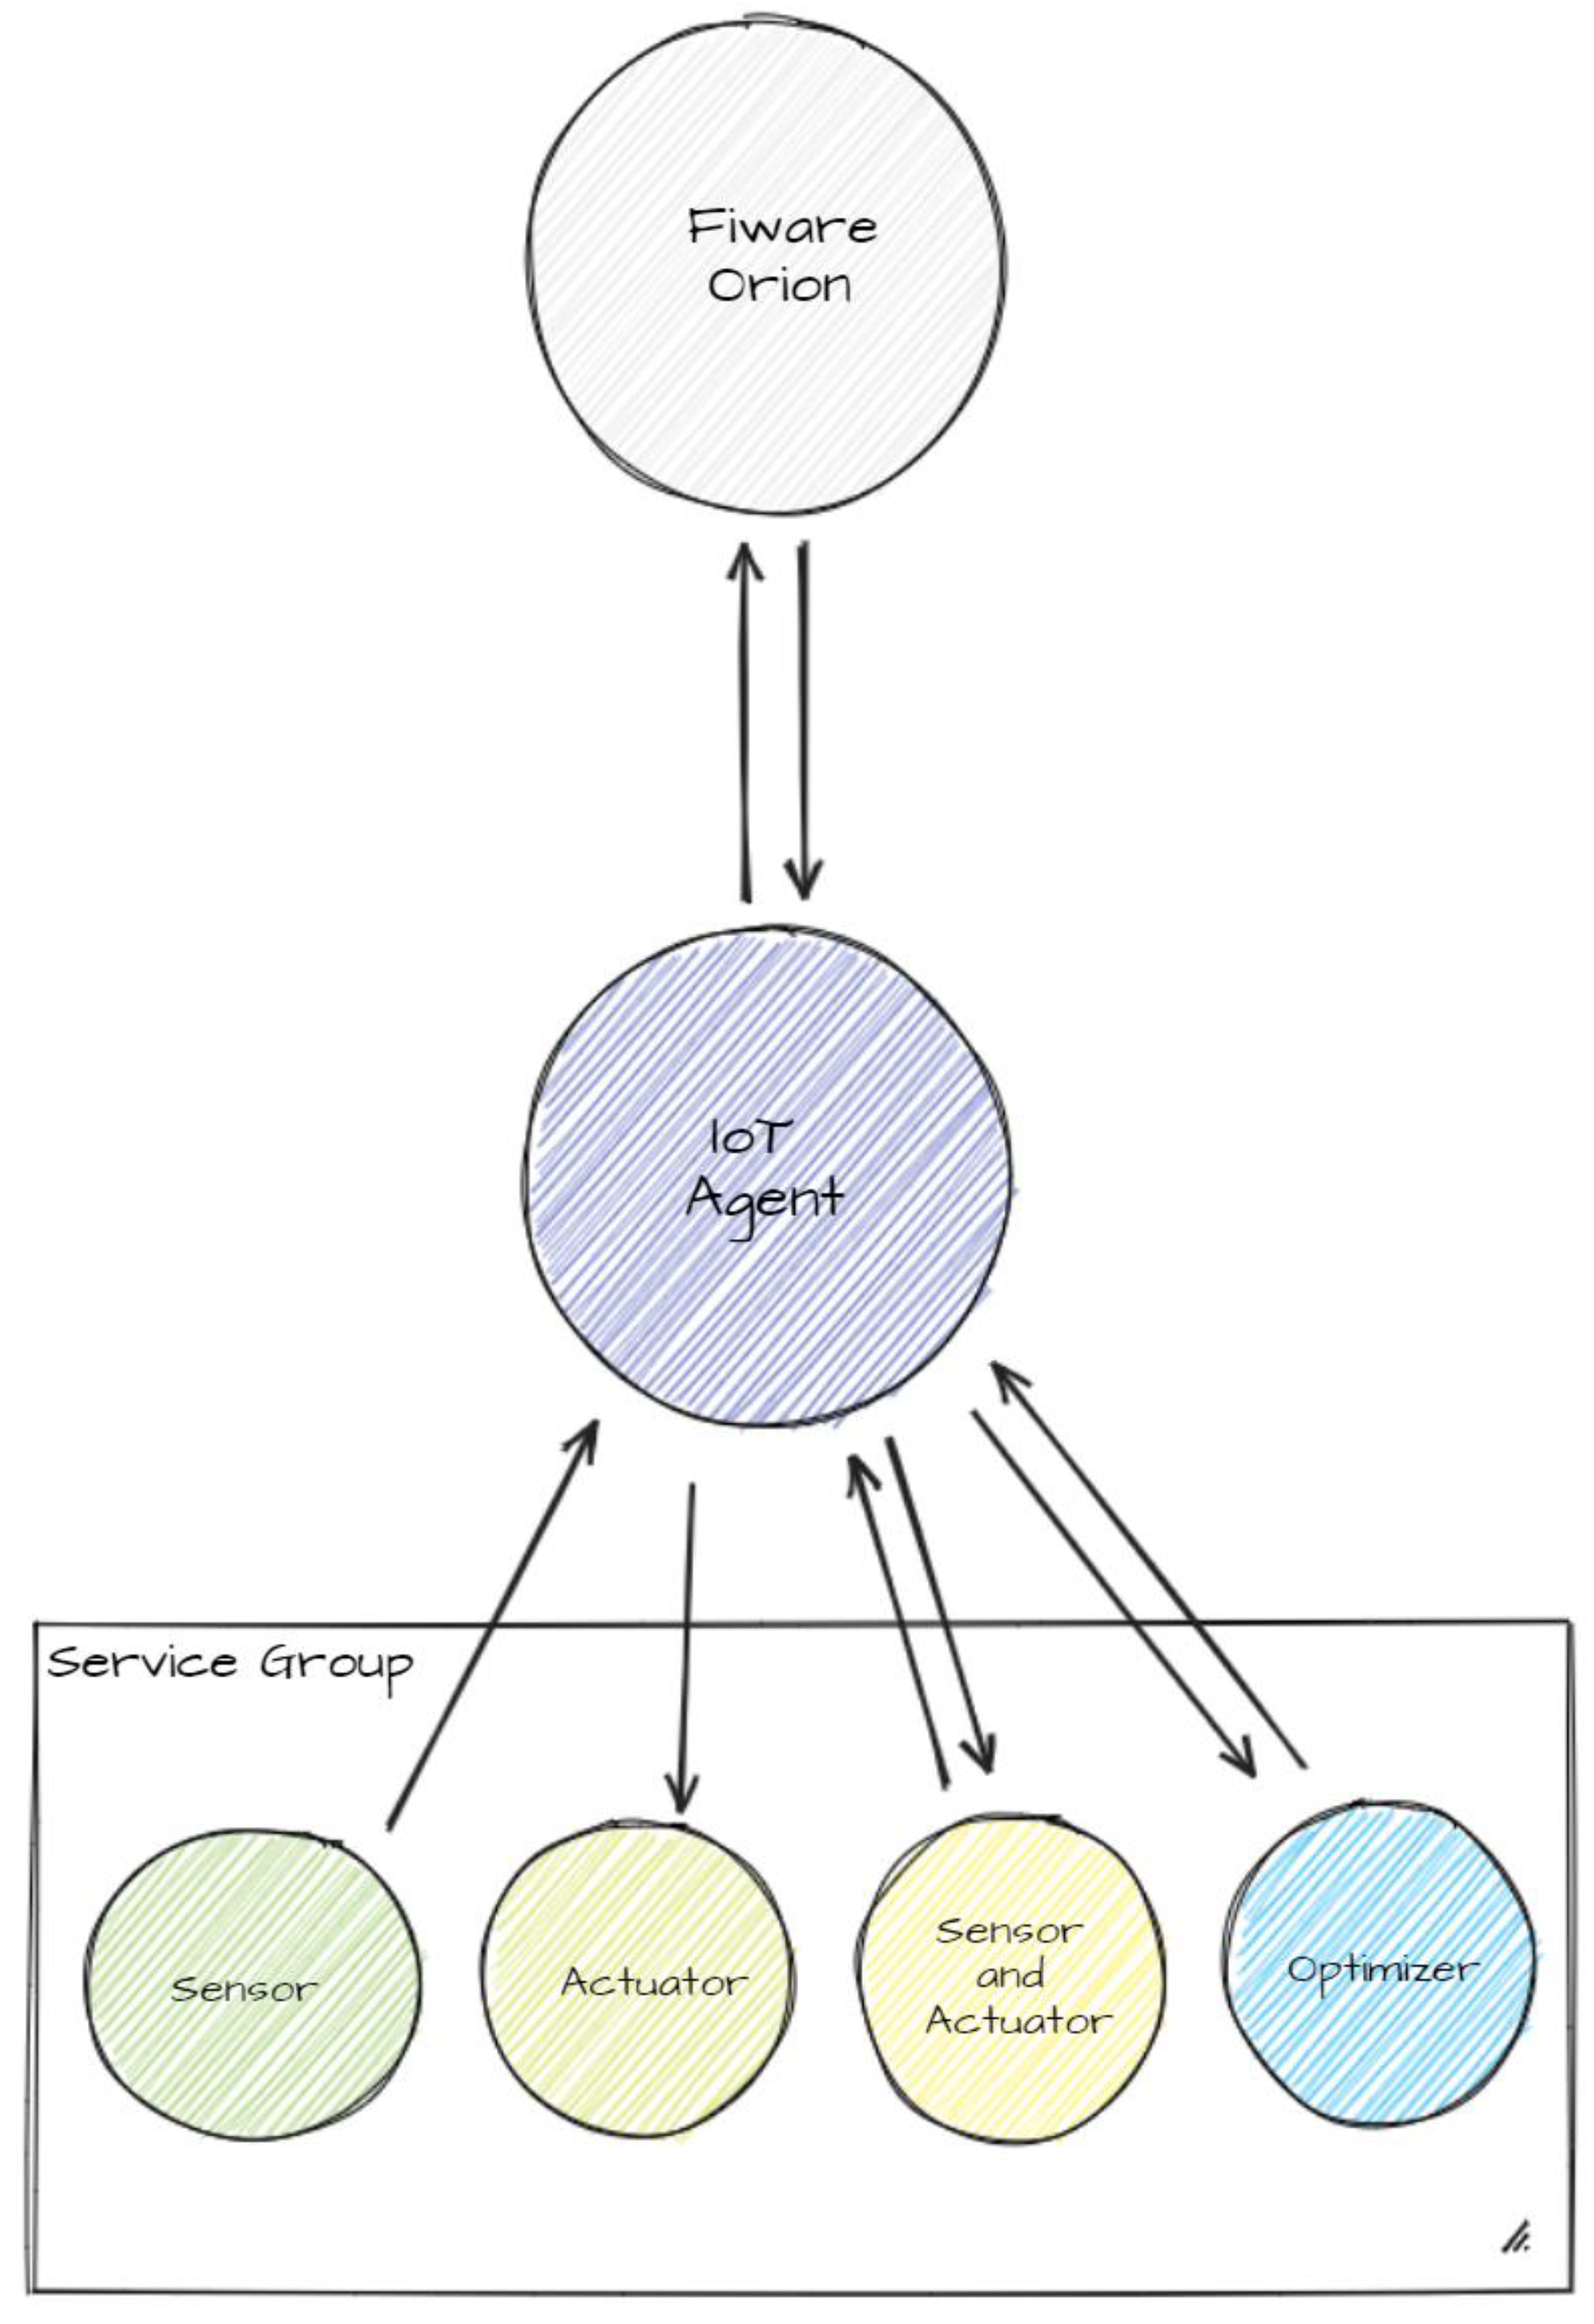
This section describes the components of the platform and the data workflow used to integrate IoT devices, sensors, and actuators in the platform for the CDL, where the same type of mechanism is being developed to integrate AI-based services. In the previous section, the data flow from sensors to the Orion was mentioned; in this section, the focus is more on the IoT agent component, which is the interface between any device (sensor or actuator) and the FIWARE Orion. In order to better explain this aspect, an example of the integration of a service for minimising road itineraries (Optimiser) is described here. Supposing an end user needs the best itinerary to reach a certain location with a certain mode of transport, a request of an optimised itinerary could be sent through the interactive front-end of the application. From there, the request is sent to the Optimiser, and then the best itinerary is asynchronously sent back to the presentation layer, through the same components but in reverse order.
Figure 15 shows the overall architecture of the FIWARE Orion, IoT agent, and devices.
To complete this task, several steps are necessary. Firstly, the components must be configured correctly. The central element of the FIWARE-based architecture is the Orion. It is worth noting that the Orion, when working with linked data (in short LD), is backward compatible and can manage entities without context. The IoT agent JSON (IoTA) component connects Orion with devices such as sensors and actuators. The CDL project platform uses the same connection to integrate AI-based services, such as the Optimiser.
Unlike Orion, two different IoTAs are used to manage entities: IoTA-LD, which is compliant with a specific context (a FIWARE smart data model), and IoTA-v2, which deals with entities that do not refer to any context. For simplicity, we will refer to both as IoTA.
To establish communication between the components, certain operations are necessary. Figure 15 illustrates the three layers from the Orion to the Optimiser passing through the IoTA.
Table 3 provides an example of IoTA configuration that specifies communication with FIWARE Orion, MongoDB, and devices in general. In the case of IoTA-LD, it is crucial to set the IOTA_JSON_LD_CONTEXT field to the appropriate context that defines the smart data model used in the application. In the configuration, other important parameters are as follows: IOTA_DEFAULT_RESOURCE, which defines the channel used by devices to direct the information; IOTA_TIMESTAMP, which must be set to true to automatically add timestamps to sensor measurements; IOTA_AUTOCAST, which must be set to true to read JSON number values read as numbers instead of strings.
To inform the IoTA of a new group of devices, a provision must be made, specifying a unique combination of apikey and resource. This combination must be equal to the one defined as IOTA_DEFAULT_RESOURCE in the IoTA configuration, and it will work as a separate channel.
After that, each device (such as the Optimiser) must be registered or provided to the IoTA. This registration should include the device’s id, entity_name, entity_type, attributes, commands, and other relevant information. Depending on the type of device, the sensor provision should specify the details of the measures sent to the IoTA. For actuators, the key information is the endpoint used by the device to receive commands from Orion. Devices that work as both sensors and actuators, such as the Optimiser service, must provide all the necessary information for each type. The information from each provision sent to IoTA is shared with the Orion. This allows Orion to store each device as a new entity and can communicate with it through IoTA.
While, in the example, tutorials demonstrate smooth operations, setting up a new actuator can be challenging depending on the versions of IoTA coupled with Orion. This mechanism has undergone changes from one release to another.
The Optimiser is a Node.js application that runs on a Docker container and has an endpoint for each type of unit processing. It will be able to run computations on three different types of processors: a central processing unit (CPU), a graphical processing unit (GPU), or a quantum processing unit (QPU).
Different algorithms are used to optimise an itinerary depending on the type of processor. Therefore, specific input parameters are required along with a set of common static information, such as the road network. This is why the Optimiser’s Node.js application has dedicated endpoints. The output of the Optimiser is the minimum itinerary, enriched with metadata containing information about the algorithm’s input.
4. Discussion
The ICT laboratory had diverse requirements, including (i) supporting multiple groups of users from different SMEs involved in the project in a multi-tenant environment, (ii) collecting and streamlining different types of data from heterogeneous sensors and sources in a scalable and interoperable architecture, (iii) processing and analysing data, and (iv) representing outputs and data as georeferenced information on a 3D satellite interactive view, accompanied by relevant statistics on side panels.
The previous sections discussed the main building blocks of the framework and how they integrate into the platform.
4.1. Conclusions
This paper describes the development work which has been carried out to establish a living laboratory in Cagliari. This laboratory serves as a learning centre for local small- and medium-sized enterprises (SMEs) to create new products, services, and technologies in an open and real-life environment, such as that of Smart Cities. The key features of this work in progress are as follows: a novel way to synchronise information between two environments such as Keycloak and Grafana, a way to feed a portal with data from a federated system, an approach to multi-tenancy using an open-source IAM as a hub, a way to bring data from FIWARE to Cesium and vice versa, securing access with a token and IAM, integrating devices and AI-based services into the platform.
4.2. Future Works
Some aspects of the platform orchestration system implemented so far remain unexplored, while others have only been partially explored but will be considered for future development; for example, it would be interesting to provide the user with additional ways of interacting with the map, such as using a scroll bar (or similar widget) to follow the changes in geo-referenced information over time.
In addition to these aspects, cybersecurity concerns have become much more prevalent in recent years, affecting all areas of digital communication, from healthcare to academia and industry. Data breaches and ransomware attacks have been observed almost everywhere, with an alarming increase since the COVID-19 pandemic. Today, it is imperative to protect the transactions of critical data as much as technological advances allow.
The adoption of appropriate security technologies is not easy, and this work laid the foundation for an infrastructure that can use them, albeit with room for optimisation that will be the subject of future development, for example, by supporting further user/privilege models.
Given the importance of the security issue, a forthcoming publication will focus on this aspect.
The platform implements Group-based Access Control (GBAC), which provides sufficient granularity for its intended purposes but does not allow for very fine control of permissions, except through an explosion of groups and roles. If the functionality of the current implementation would limit the use of the platform, other types of permissions managed by Keycloak will be explored.
Other improvements, such as orchestration with Kubernetes and the exploration of new use cases, deserve additional attention. In order to achieve orchestration between the individual modules, each of them needs to have specific configurations, in particular to allow for correct dialogue with Keycloak. Kubernetes would add another level of abstraction on top of the Docker containers already used, but most of the Docker images could be kept unchanged; particular attention would be paid to the connection of the services with a database replica set.
Each of the open-source modules used in this project offers a basic configuration that can be extended, and this has been carried out, so in order to avoid reporting configurations that are too similar to those already published, we chose to omit them from this publication. In terms of optimisation, it was found that policies on the MinIO side can be particularly difficult to develop, but, conceptually, they can be refined to allow a user to belong to multiple groups.
In conclusion, due to the limited time available, it has only been possible to develop the minimum set of required functionalities, as documented in this paper, but the platform design allows for further improvements to the user experience with more capabilities, which will be the subject of future work.
Author Contributions
Conceptualization, C.I., M.C., M.L.C., G.S.M., M.V. and L.L.; methodology, C.I., M.C., M.L.C., G.S.M., M.V. and L.L.; software: C.I., M.C., M.L.C. and G.S.M.; validation, all authors; formal analysis, C.I., M.C. and M.L.C.; investigation, all authors; project administration, L.L. All authors have read and agreed to the published version of the manuscript.
Funding
This work was partially supported by the Italian Ministry of Enterprises and Made in Italy (MIMIT), within the 5G technology support program, on axis 1 “House of Emerging Technologies” (CTE), Project Name “Cagliari Digital Lab” (ID: G27F22000040008).
Data Availability Statement
Data sharing is not applicable (No new data were created or analyzed in this study). In fact, the platform for the CDL project actually does not generate any data. It will collect, elaborate and transform all the data made available by SMEs and other end users during the activity of the ICT Lab.
Conflicts of Interest
The authors declare no conflict of interest. All authors are employed by CRS4. The funders had no role in the design of the study; in the collection, analyses, or interpretation of data; in the writing of the manuscript, or in the decision to publish the results.
Appendix A
Here is a token generated for a hypothetical user “user1”:
| { |
| “exp”: 1701681488, |
| “iat”: 1701681188, |
| “auth_time”: 1701681186, |
| “jti”: “c996a102-f697-4151-80e1-1660a2f0dd6c”, |
| “iss”: “http://auth.test.com/realms/test”, |
| “aud”: “account”, |
| “sub”: “ffe2e034-ca4f-490d-9ee0-8c1c912f9e86”, |
| “typ”: “Bearer”, |
| “azp”: “account-console”, |
| “nonce”: “a96da2ec-8c1a-3e2d-86d4-67037663c7ba”, |
| “session_state”: “dff7124c-012d-458b-b45b-fb5aa8b2caec”, |
| “acr”: “1”, |
| “resource_access”: { |
| “account”: { |
| “roles”: [ |
| “manage-account”, |
| “manage-account-links” |
| ] |
| } |
| }, |
| “scope”: “openid ubidp-users profile email”, |
| “sid”: “dfd7120c-012d-458b-f45b-fb5fa8b2caec”, |
| “email_verified”: true, |
| “name”: “user1 user1”, |
| “groups”: [ |
| “/lab/group1”, |
| “/lab/group2” |
| ], |
| “preferred_username”: “user1”, |
| “given_name”: “user1”, |
| “family_name”: “user1”, |
| “email”: “[email protected]” |
| } |
References
- Kent Larson of the MIT Media Lab, 2012, talk: “Brilliant Designs to Fit More People in Every City”. TED.com (Video). Available online: https://www.ted.com/talks/kent_larson_brilliant_designs_to_fit_more_people_in_every_city (accessed on 6 December 2023).
- Moreno, C. La Ville du Quart D’heure: Pour un Nouveau Chrono-Urbanisme. Available online: https://www.latribune.fr/regions/smart-cities/la-tribune-de-carlos-moreno/la-ville-du-quart-d-heure-pour-un-nouveau-chrono-urbanisme-604358.html (accessed on 6 December 2023).
- Capasso Da Silva, D.; King, D.A.; Lemar, S. Accessibility in Practice: 20-Minute City as a Sustainability Planning Goal”. Sustainability 2019, 12, 129. [Google Scholar] [CrossRef]
- Moreno, C.; Allam, Z.; Chabaud, D.; Gall, C.; Pratlong, F. Introducing the “15-Minute City”: Sustainability, Resilience and Place Identity in Future Post-Pandemic Cities. Smart Cities 2021, 4, 93–111. [Google Scholar] [CrossRef]
- UN-GGMI Report, Resolution Adopted by the General Assembly on 6 July 2017. Available online: https://ggim.un.org/documents/a_res_71_313.pdf (accessed on 6 December 2023).
- Picon, A.; Ratti, C. Atlas of the Senseable City; Yale University Press: New Haven, CT, USA, 2023; ISBN 13978-0300247510. [Google Scholar]
- EU Funded Project Citcom.ai 2023–2027. Available online: https://citcom.ai/ (accessed on 6 December 2023).
- AI Watch 2022, National Strategies on Artificial Intelligence. Available online: https://link.springer.com/chapter/10.1007/978-3-031-27953-9_7 (accessed on 6 December 2023).
- Khriji, S.; El Houssaini, D.; Barioul, R.; Rehman, T.; Kanoun, O. Smart-Lab: Design and Implementation of an IoT-based Laboratory Platform. In Proceedings of the 2020 IEEE 6th World Forum on Internet of Things (WF-IoT), New Orleans, LA, USA, 2–16 June 2020; pp. 1–5. [Google Scholar] [CrossRef]
- Bellini, P.; Nesi, P.; Pantaleo, G. IoT-Enabled Smart Cities: A Review of Concepts, Frameworks and Key Technologies. Appl. Sci. 2022, 12, 1607. [Google Scholar] [CrossRef]
- Fahmideh, M.; Zowghi, D. An exploration of IoT platform development. Inf. Syst. 2020, 87, 101409. [Google Scholar] [CrossRef]
- An, J.; Le Gall, F.; Kim, J.; Yun, J.; Hwang, J.; Bauer, M.; Zhao, M.; Song, J. Toward Global IoT-Enabled Smart Cities Interworking Using Adaptive Semantic Adapter. IEEE Internet Things J. 2019, 6, 5753–5765. [Google Scholar] [CrossRef]
- oneM2M. Available online: https://www.onem2m.org/ (accessed on 6 December 2023).
- FIWARE. Available online: https://www.fiware.org/ (accessed on 6 December 2023).
- Vermesan, O.; Friess, P. Internet of Things: Converging Technologies for Smart Environments and Integrated Ecosystems; River Publishers Series in Communications; River Publishers: Gistrup, Denmark, 2013; ISBN 9788792982735. [Google Scholar]
- Atzori, L.; Iera, A.; Morabito, G. The Internet of Things: A survey. Comput. Netw. 2010, 54, 2787–2805. [Google Scholar] [CrossRef]
- Atzori, L.; Iera, A.; Morabito, G. Understanding the Internet of Things: Definition, potentials, and societal role of a fast evolving paradigm. Ad Hoc Netw. 2017, 56, 122–140. [Google Scholar] [CrossRef]
- Ahale, U.; Hierro, J.J. FIWARE for Data Spaces, Book Chapter in Otto, Boris, Michael ten Hompel, and Stefan Wrobel. In Designing Data Spaces: The Ecosystem Approach to Competitive Advantage; Springer Nature: Berlin/Heidelberg, Germany, 2022; Chapter 24; pp. 395–417. [Google Scholar]
- Cirillo, F.; Solmaz, G.; Berz, E.L.; Bauer, M.; Cheng, B.; Kovacs, E. A Standard-Based Open Source IoT Platform: FIWARE. IEEE Internet Things Mag. 2019, 2, 12–18. [Google Scholar] [CrossRef]
- Bauer, M. FIWARE: Standard-based Open Source Components for Cross-Domain IoT Platforms. In Proceedings of the 2022 IEEE 8th World Forum on Internet of Things (WF-IoT), Yokohama, Japan, 26 October–11 November 2022; pp. 1–6. [Google Scholar] [CrossRef]
- Berbes Villalón, D.M.; Sánchez Jiménez, L.; de la Iglesia Campos, M.; Díaz Aguirre, M.E.; Delgado Fernández, T. An IoT architecture for smart cities based on the FIWARE platform. RECyT 2022, 38, 20–27. [Google Scholar] [CrossRef]
- Barriga, J.A.; Clemente, P.J.; Hernández, J.; Pérez-Toledano, M.A. SimulateIoT-FIWARE: Domain specific language to design, code generation and execute IoT simulation environments on FIWARE. IEEE Access 2022, 10, 7800–7822. [Google Scholar] [CrossRef]
- Badii, C.; Bellini, P.; Cenni, D.; Marazzini, M.; Nesi, P.; Pantaleo, G.; Paolucci, M.; Soderi, M.; Zaza, I.; Belay, E.G.; et al. Snap4City: A scalable IOT/IOE platform for developing smart city applications. In Proceedings of the 2018 IEEE SmartWorld, Ubiquitous Intelligence & Computing, Advanced & Trusted Computing, Scalable, Computing & Communications, Cloud & Big Data Computing, Internet of People and Smart City Innovations, Guangzhou, China, 8–12 October 2018. [Google Scholar]
- Gaggero, M.; Busonera, G.; Pireddu, L.; Zanetti, G. TDM Edge Gateway: A Flexible Microservice-Based Edge Gateway Architecture for Heterogeneous Sensors. In Euro-Par 2019: Parallel Processing Workshops; Schwardmann, U., Ed.; Lecture Notes in Computer Science; Springer: Cham, Switzerland, 2020; p. 11997. [Google Scholar] [CrossRef]
- Joint Innovation Center. Available online: https://www.jicsardegna.it/en/ioc-intelligent-operation-center-2/ (accessed on 6 December 2023).
- FIWARE IoT Agent. Available online: https://www.fiware.org/catalogue/ (accessed on 6 December 2023).
- FIWARE Foundation. Available online: www.fiware.org (accessed on 6 December 2023).
- Hoorens, S.; Cattaneo, G.; Elixmann, D.; Li, M.S.; Cave, J. Towards a Competitive European Internet Industry: A Socio-Economic Analysis of the European Internet Industry and the Future Internet Public-Private Partnership, RAND Corporation. United States. Available online: https://policycommons.net/artifacts/4830293/towards-a-competitive-european-internet-industry/5666981/ (accessed on 4 December 2023).
- Divyabharathi, D.N.; Nagaraj, G.C. A review on identity and access management server (keycloak). Int. J. Secur. Priv. Pervasive Comput. 2020, 12, 46–53. [Google Scholar] [CrossRef]
- Christie, M.A.; Bhandar, A.; Nakandala, S.; Marru, S.; Abeysinghe, E.; Pamidighantam, S.; Pierce, M.E. Using keycloak for gateway authentication and authorization. Future Gener. Comput. Syst. 2017, 111, 780–785. [Google Scholar] [CrossRef]
- Keycloak. Available online: https://www.keycloak.org/ (accessed on 6 December 2023).
- Apache Superset. Available online: https://superset.apache.org/ (accessed on 6 December 2023).
- Grafana. Available online: https://grafana.com/ (accessed on 6 December 2023).
- Grafana Team Sync. Available online: https://grafana.com/docs/grafana/latest/setup-grafana/configure-security/configure-team-sync/ (accessed on 6 December 2023).
- MinIO. Available online: https://min.io (accessed on 6 December 2023).
- CesiumJS. Available online: https://cesium.com/platform/cesiumjs/ (accessed on 6 December 2023).
- Zhu, L.; Li, Z.; Wang, Z.; Zhong, L. Representing time-dynamic geospatial objects on virtual globes using CZML—Part ii: Impact, comparison, and future developments. ISPRS Int. J. Geo-Inf. 2018, 7, 102. [Google Scholar] [CrossRef]
- Gede, M.; Jeney, J. Thematic mapping with Cesium. In Proceedings of the 6th International Conference on Cartography and Gis. 2016; p. 280. Available online: https://link.springer.com/article/10.1007/BF03544604#citeas (accessed on 6 December 2023).
- Erkkilä, J.P. Websocket Security Analysis. Aalto University School of Science, 2012; pp. 2–3. Available online: https://api.semanticscholar.org/CorpusID:202893081 (accessed on 6 December 2023).
Figure 1.
The overall architecture; the developed services are highlighted in green. Image drawn with MockFlow (https://mockflow.com/).
Figure 1.
The overall architecture; the developed services are highlighted in green. Image drawn with MockFlow (https://mockflow.com/).

Figure 3.
A schematic flow of the synchronization process.

Figure 4.
Mapping between Keycloak and Grafana in detail.

Figure 5.
An example of MinIO rule in JSON format.

Figure 6.
Resource statement.

Figure 7.
The condition to match the folder name.

Figure 8.
The MinIO structure.

Figure 9.
The action statement to select the rules to apply.

Figure 10.
A schematic flow of the data to feed the structure of the portal.

Figure 11.
The data flow, from FIWARE to Cesium. Image drawn with MockFlow (https://mockflow.com/).
Figure 11.
The data flow, from FIWARE to Cesium. Image drawn with MockFlow (https://mockflow.com/).

Figure 12.
The structure of a CZML document.

Figure 13.
The structure of initial message.

Figure 14.
An example response of a successful command.

Figure 15.
Overall architecture of FIWARE Orion, IoT agent, and devices. Image drawn with MockFlow (https://mockflow.com/).
Figure 15.
Overall architecture of FIWARE Orion, IoT agent, and devices. Image drawn with MockFlow (https://mockflow.com/).


Table 1.
Users, groups, and roles in Keycloak and Grafana.
| Keycloak | Grafana |
|---|---|
| user | User |
| group | Team |
| Fine grained rules | 3 fixed and pre-defined rules (admin/editor/viewer) |
Table 2.
The three internal tables of Grafana reflect a user login.
| Table Names in Grafana | Description |
|---|---|
| user | Table used to store users and profile data. |
| user_auth | Table used to store some aspects of the user linked to the type of login, for example whether it occurs via OAuth and whether he has access keys. |
| data_keys | Protection key storage table with which some sensitive fields are encoded. |
Table 3.
An example of configuration of IoTA-LD.
| Example of Configuration of the IoT Agent |
|---|
| IOTA_CB_HOST = orion IOTA_CB_PORT = 1026 IOTA_NORTH_PORT = 4041 IOTA_REGISTRY_TYPE = mongodb IOTA_LOG_LEVEL = DEBUG IOTA_TIMESTAMP = true IOTA_CB_NGSI_VERSION = LD IOTA_AUTOCAST = true IOTA_MONGO_HOST = mongodb IOTA_MONGO_PORT = 27017 IOTA_MONGO_DB = iotagentjson IOTA_HTTP_PORT = 7896 IOTA_PROVIDER_URL = <link to iotald server> IOTA_DEFAULT_RESOURCE = /cteld/json IOTA_JSON_LD_CONTEXT = <link to actual-context.jsonld> IOTA_FALLBACK_TENANT = traffic |
Disclaimer/Publisher’s Note: The statements, opinions and data contained in all publications are solely those of the individual author(s) and contributor(s) and not of MDPI and/or the editor(s). MDPI and/or the editor(s) disclaim responsibility for any injury to people or property resulting from any ideas, methods, instructions or products referred to in the content. |
© 2024 by the authors. Licensee MDPI, Basel, Switzerland. This article is an open access article distributed under the terms and conditions of the Creative Commons Attribution (CC BY) license (https://creativecommons.org/licenses/by/4.0/).
Share and Cite
MDPI and ACS Style
Impagliazzo, C.; Cabianca, M.; Clemente, M.L.; Siddi Moreau, G.; Vocale, M.; Leoni, L. A Testbed Platform to Support an IoT City Lab. IoT 2024, 5, 35-57. https://doi.org/10.3390/iot5010003
AMA Style
Impagliazzo C, Cabianca M, Clemente ML, Siddi Moreau G, Vocale M, Leoni L. A Testbed Platform to Support an IoT City Lab. IoT. 2024; 5(1):35-57. https://doi.org/10.3390/iot5010003
Chicago/Turabian StyleImpagliazzo, Carlo, Muriel Cabianca, Maria Laura Clemente, Giuliana Siddi Moreau, Matteo Vocale, and Lidia Leoni. 2024. "A Testbed Platform to Support an IoT City Lab" IoT 5, no. 1: 35-57. https://doi.org/10.3390/iot5010003