
A Portable Low-Cost Ultrasound Measurement Device for Concrete Monitoring


Bundesanstalt für Materialforschung und -prüfung (BAM), Unter den Eichen 87, 12205 Berlin, Germany
*
Author to whom correspondence should be addressed.
Inventions 2021, 6(2), 36; https://doi.org/10.3390/inventions6020036
Submission received: 7 April 2021
/
Revised: 3 May 2021
/
Accepted: 10 May 2021
/
Published: 20 May 2021
(This article belongs to the Special Issue Low-Cost Inventions and Patents)
Abstract
:This paper describes a new ultrasonic measuring device called “W-Box”. It was developed based on the requirements of the DFG Forschergruppe (research unit) CoDA for a portable device for monitoring of concrete specimens, models and actual structures using embedded ultrasonic transducers as well as temperature and humidity sensors. The W-Box can send ultrasonic pulses with a variable frequency of 50–100 kHz to one selectable transducer and records signals from up to 75 multiplexed channels with a sample rate of 1 MHz and a resolution of 14 bits. In addition, it measures temperature and humidity with high accuracy, adjustable amplification, restarts automatically after a power failure and can be fully controlled remotely. The measured data are automatically stored locally on-site data quality checks and transferred to remote servers. The comparison of the W-Box with a laboratory setup using commercial devices proves that it is equally reliable and precise, at much lower cost. The W-Box also shows that their measurement capacities, with the used embedded ultrasonic transducers, can reach above 6 m in concrete.
1. Introduction
Monitoring and non-destructive testing (NDT) has become a major topic in civil engineering (CE) in recent decades, as safety and environmental issues have shown the need for methods to ensure the structural integrity and increase the lifespan of constructions such as bridges. One of the most researched and widely spread methods of NDT is measuring with ultrasound. With the increasing demand for ultrasound measurements—especially for long-term monitoring—the need for a cost efficient, easy to build, and reliable measurement system has been identified by researchers at the NDT-CE department of the German Federal Institute for Materials Research and Testing (BAM).
Ultrasound transmission experiments for concrete are considered as a standard procedure for quality assessment. Time of flight (TOF) measurements with compressional waves are applied in a standardized manner to estimate concrete strength using ultrasonic velocity as a proxy [1]. The method is also used to follow the hardening of fresh concrete [2]. In research, ultrasound is used to monitor changes in concrete in controlled experiments by following changes certain features such as velocity and/or amplitudes, e.g., to assess fatigue strength [3].
Since around 2000, several researchers have started to extend the capabilities of ultrasonic monitoring either by using more sensitive data evaluation techniques. This includes but is not limited to coda wave interferometry (CWI) or nonlinear acoustic features. Several laboratory experiments have been published in recent years showing that ultrasonic monitoring combined with these newly developed sensitive feature extraction techniques are very sensitive to stress, temperature, moisture, cracking and any material changes in general, even if they are minute or local. The potential of these approaches and progress of the early years has been compiled in several publications (see [4,5,6]). The background of this research is to provide additional means for structural health monitoring of degrading concrete structures such as transportation infrastructure or in nuclear power generation and waste storage.
Recently the results of several experiments have been published which show the potential of CWI and other techniques for practical implementation (see [7,8,9,10]). In these experiments either commercial transducers mounted on the surface [7] or special embedded transducers [11] have been applied. For signal generation and data acquisition customized setups of commercial instruments have been applied so far. Most of them have limitations in terms of cost, ruggedness and availability. In the frame of the DFG FOR 2825 CoDA research unit, a collaboration of several German universities and BAM working on the improvement of CWI for concrete monitoring, the need arose for a compact, robust and affordable measurement device which can be built at university labs with limited resources in significant numbers. The device should not be limited to the purpose of the research unit, but also be useful in traditional ultrasonic transmission experiments. It will be made available in public the domain.
In cooperation with students from TU Berlin, a first prototype of a 5-channel ultrasound measurement system based on a Raspberry Pi was developed in 2015 [12]. This prototype, called the W-Box due to its initial design, was further developed and improved over the years and is now being used by the research unit “CoDA” funded by the German Research Foundation (DFG) to investigate the changes in ultrasonic signals in reinforced concrete structures in order to detect changes and damage. Within the project, the system was extended to connect to up to 75 ultrasonic transducers, options for temperature and humidity measurements were added, automatic data upload and remote control were introduced, and the system was made more resistant to environmental effects such as rain or high humidity. In this paper, we will explain the design of the W-Box by describing the requirements and the individual components of the system. Detailed descriptions of each electronic board are presented, followed by a comparison between the measurement results acquired with the W-Box and those acquired with a commercially available measurement system, such as the system used in [11,13], which has been used in the past at BAM.
2. Materials and Methods
In the following, we will explain the design of the W-Box, the required electronic components, and their characteristics. Firstly, in Section 2.1 and Section 2.2, the general requirements posed to the system by the ultrasonic measurement task and the system design are explained. This is followed by a detailed explanation of the shared Raspberry Pi pins connection necessary for communication between the individual electronic components (Section 2.3). The short introduction to the Raspberry Pi and the operating system (Section 2.4) is followed by a detailed description of the individual boards of the measurement system (Section 2.5–Section 2.9).
2.1. System Requirements
The W-Box originated from the need for portable equipment with which to carry out ultrasound monitoring. Therefore, it needed to be small, light, easy to operate, simple to repair, and inexpensive. This would allow it to be used in variable locations which are often remote or hard to access. As several sensors are usually required for monitoring, the W-Box should be capable of connecting to at least 20 ultrasonic transducers, all operating as transmitters and receivers, adjustable signal amplification, switching between them using multiplexers and sending variable pulses of up to 300 Vpp. It also must be capable of restarting measurements after power outage, of saving data onto an external server, and being protected against high humidity (e.g., for operation in climate chambers). As ultrasonic wave propagation is influenced by temperature and moisture content in addition to the main objectives (damage, deterioration), additional capacities for connecting of temperature and humidity sensors had to be added to allow compensation. The main features and parameters are listed in Table 1.
2.2. System Design
The system is designed around a Raspberry Pi 3 B+ and runs with an Ubuntu operating system. The W-Box is capable of providing a I2C protocol for communication between all micro-controllers, of connecting to the internet (because of embedded Wi-Fi or an RJ45 internet port), of connecting to an external server, of automatically restarting after power outage, and of being easily and fully remote-controlled, if required.
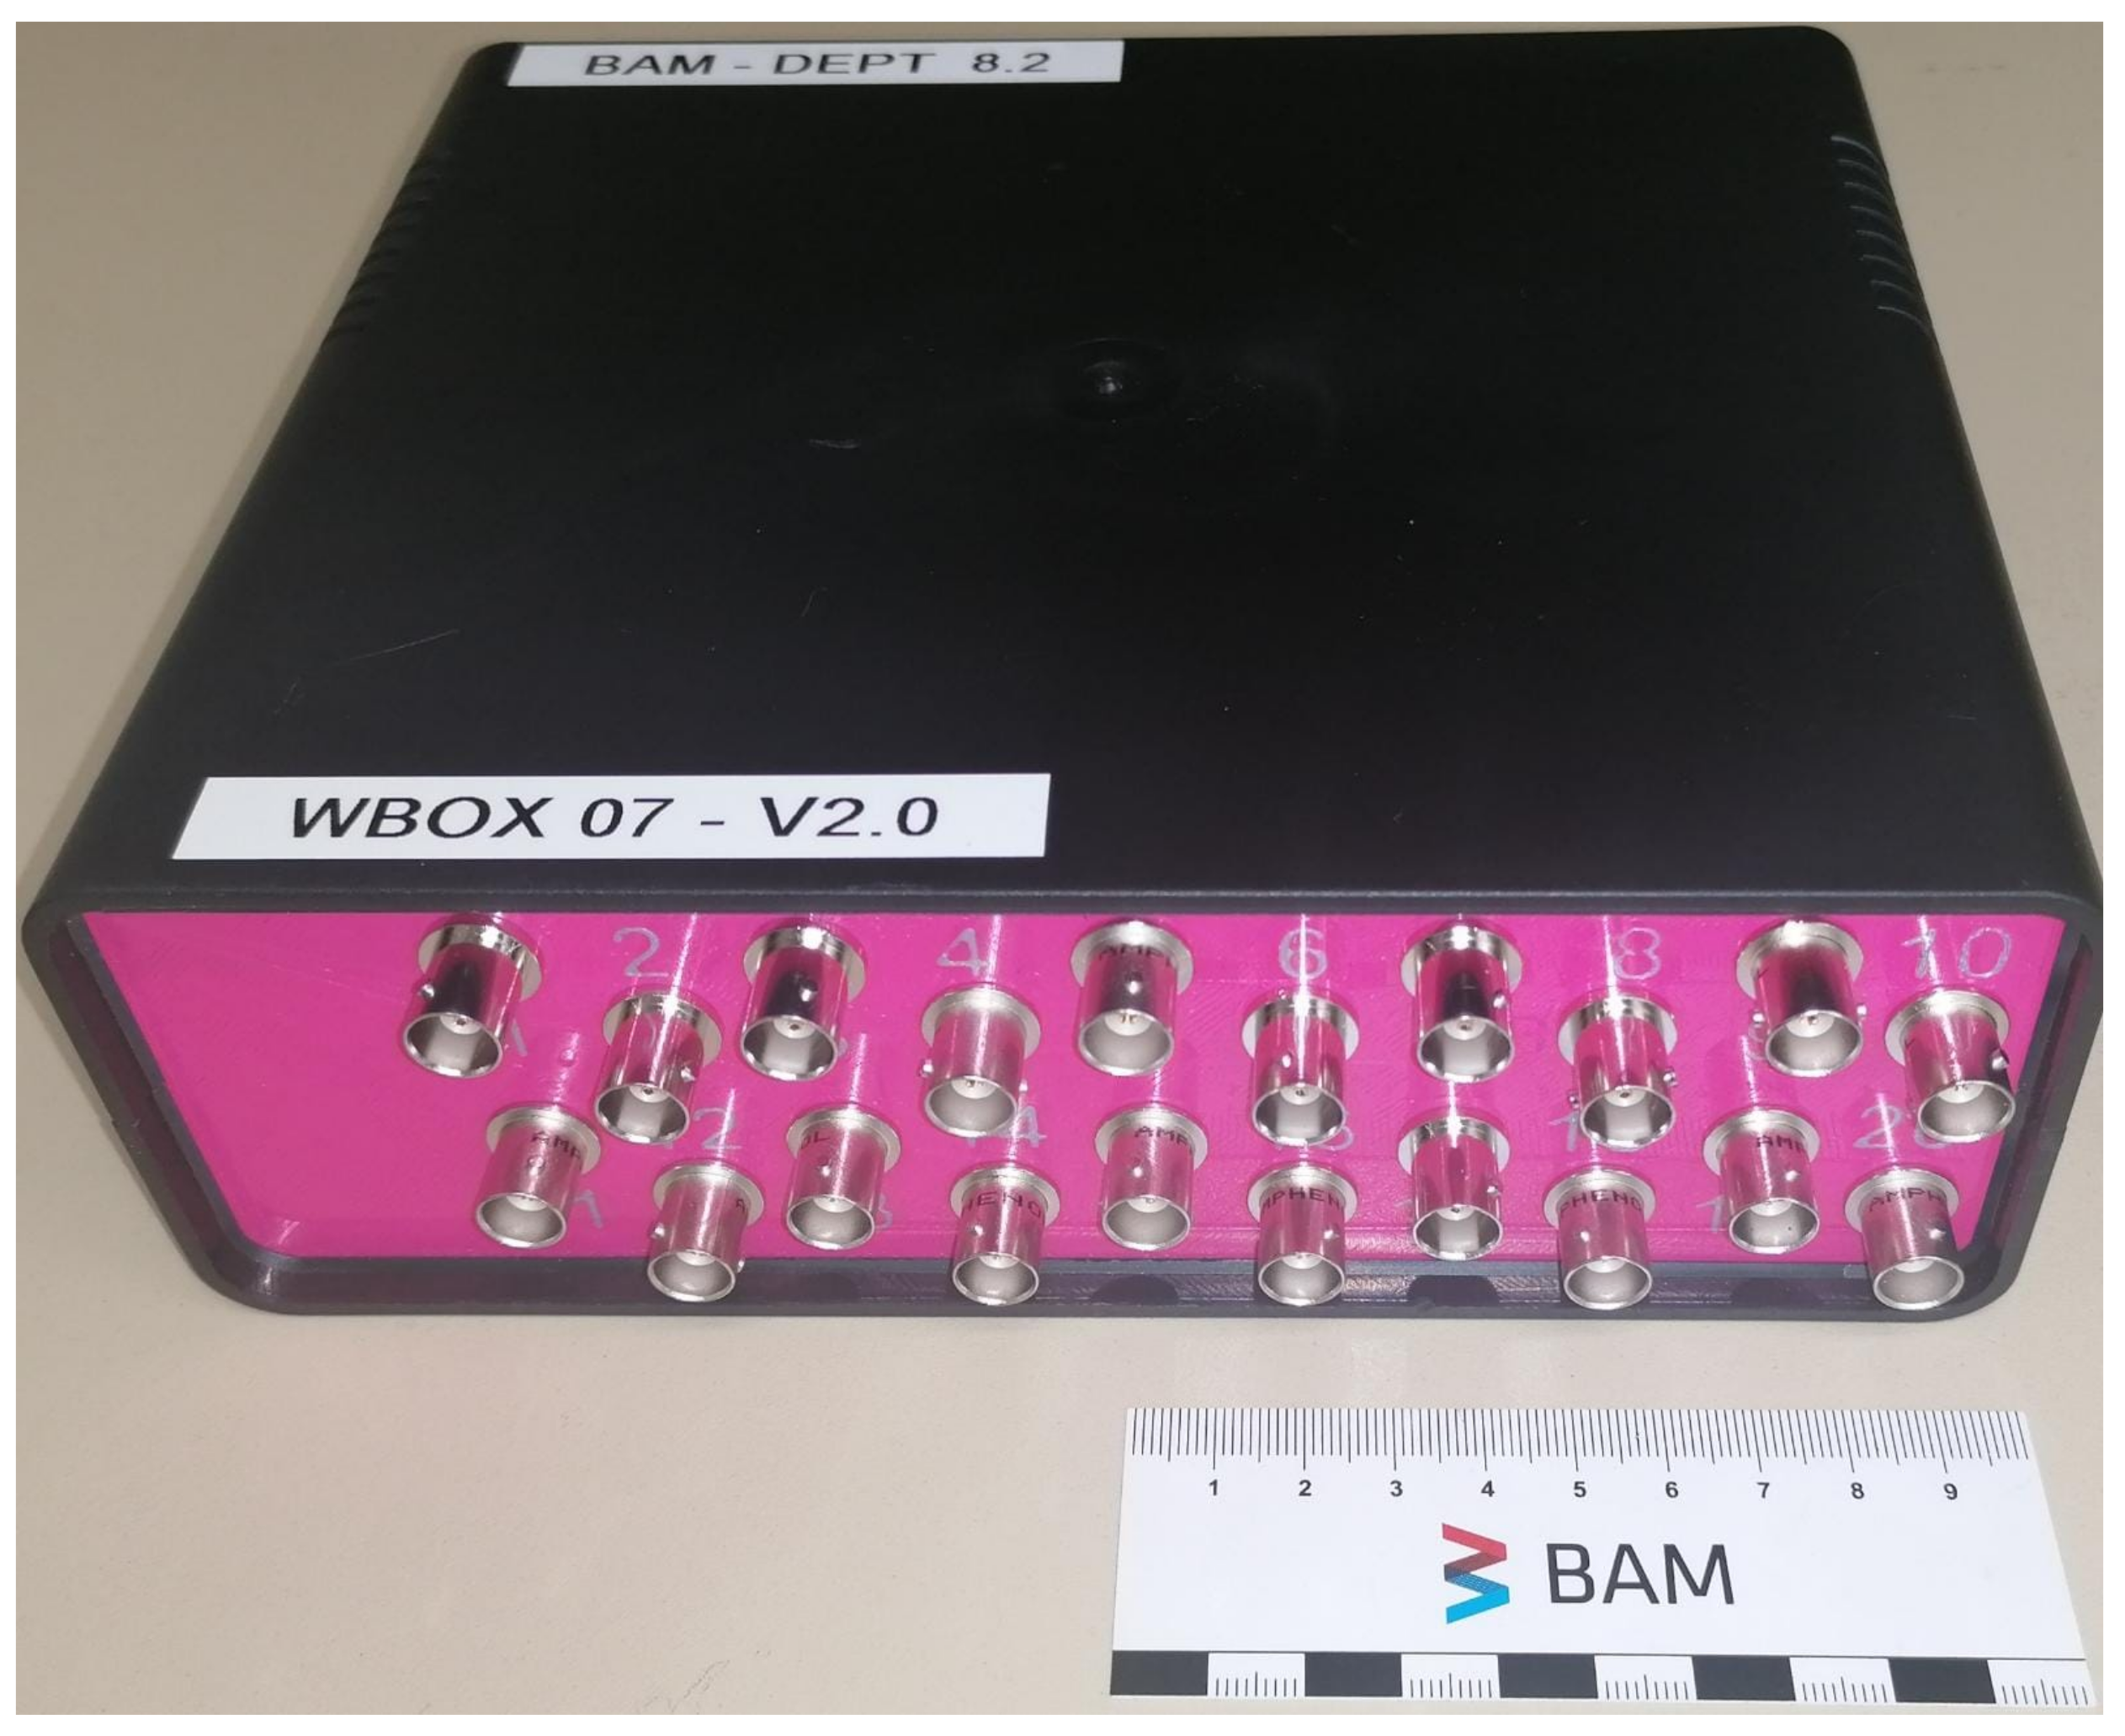
Figure 1 shows the latest version of the W-Box. It has 20 connectors for ultrasonic transducers (BNC female). The temperature and humidity board are in the final stage of development. It is capable of measuring with 3 NTC temperature sensors and 1 humidity sensor. The black case is a standard case and the frontal pink board is 3D printed. All circuits have the same Raspberry Pi pins between them in order to supply power and to communicate as described in Figure 2. Its communication functions are explained in Figure 3.
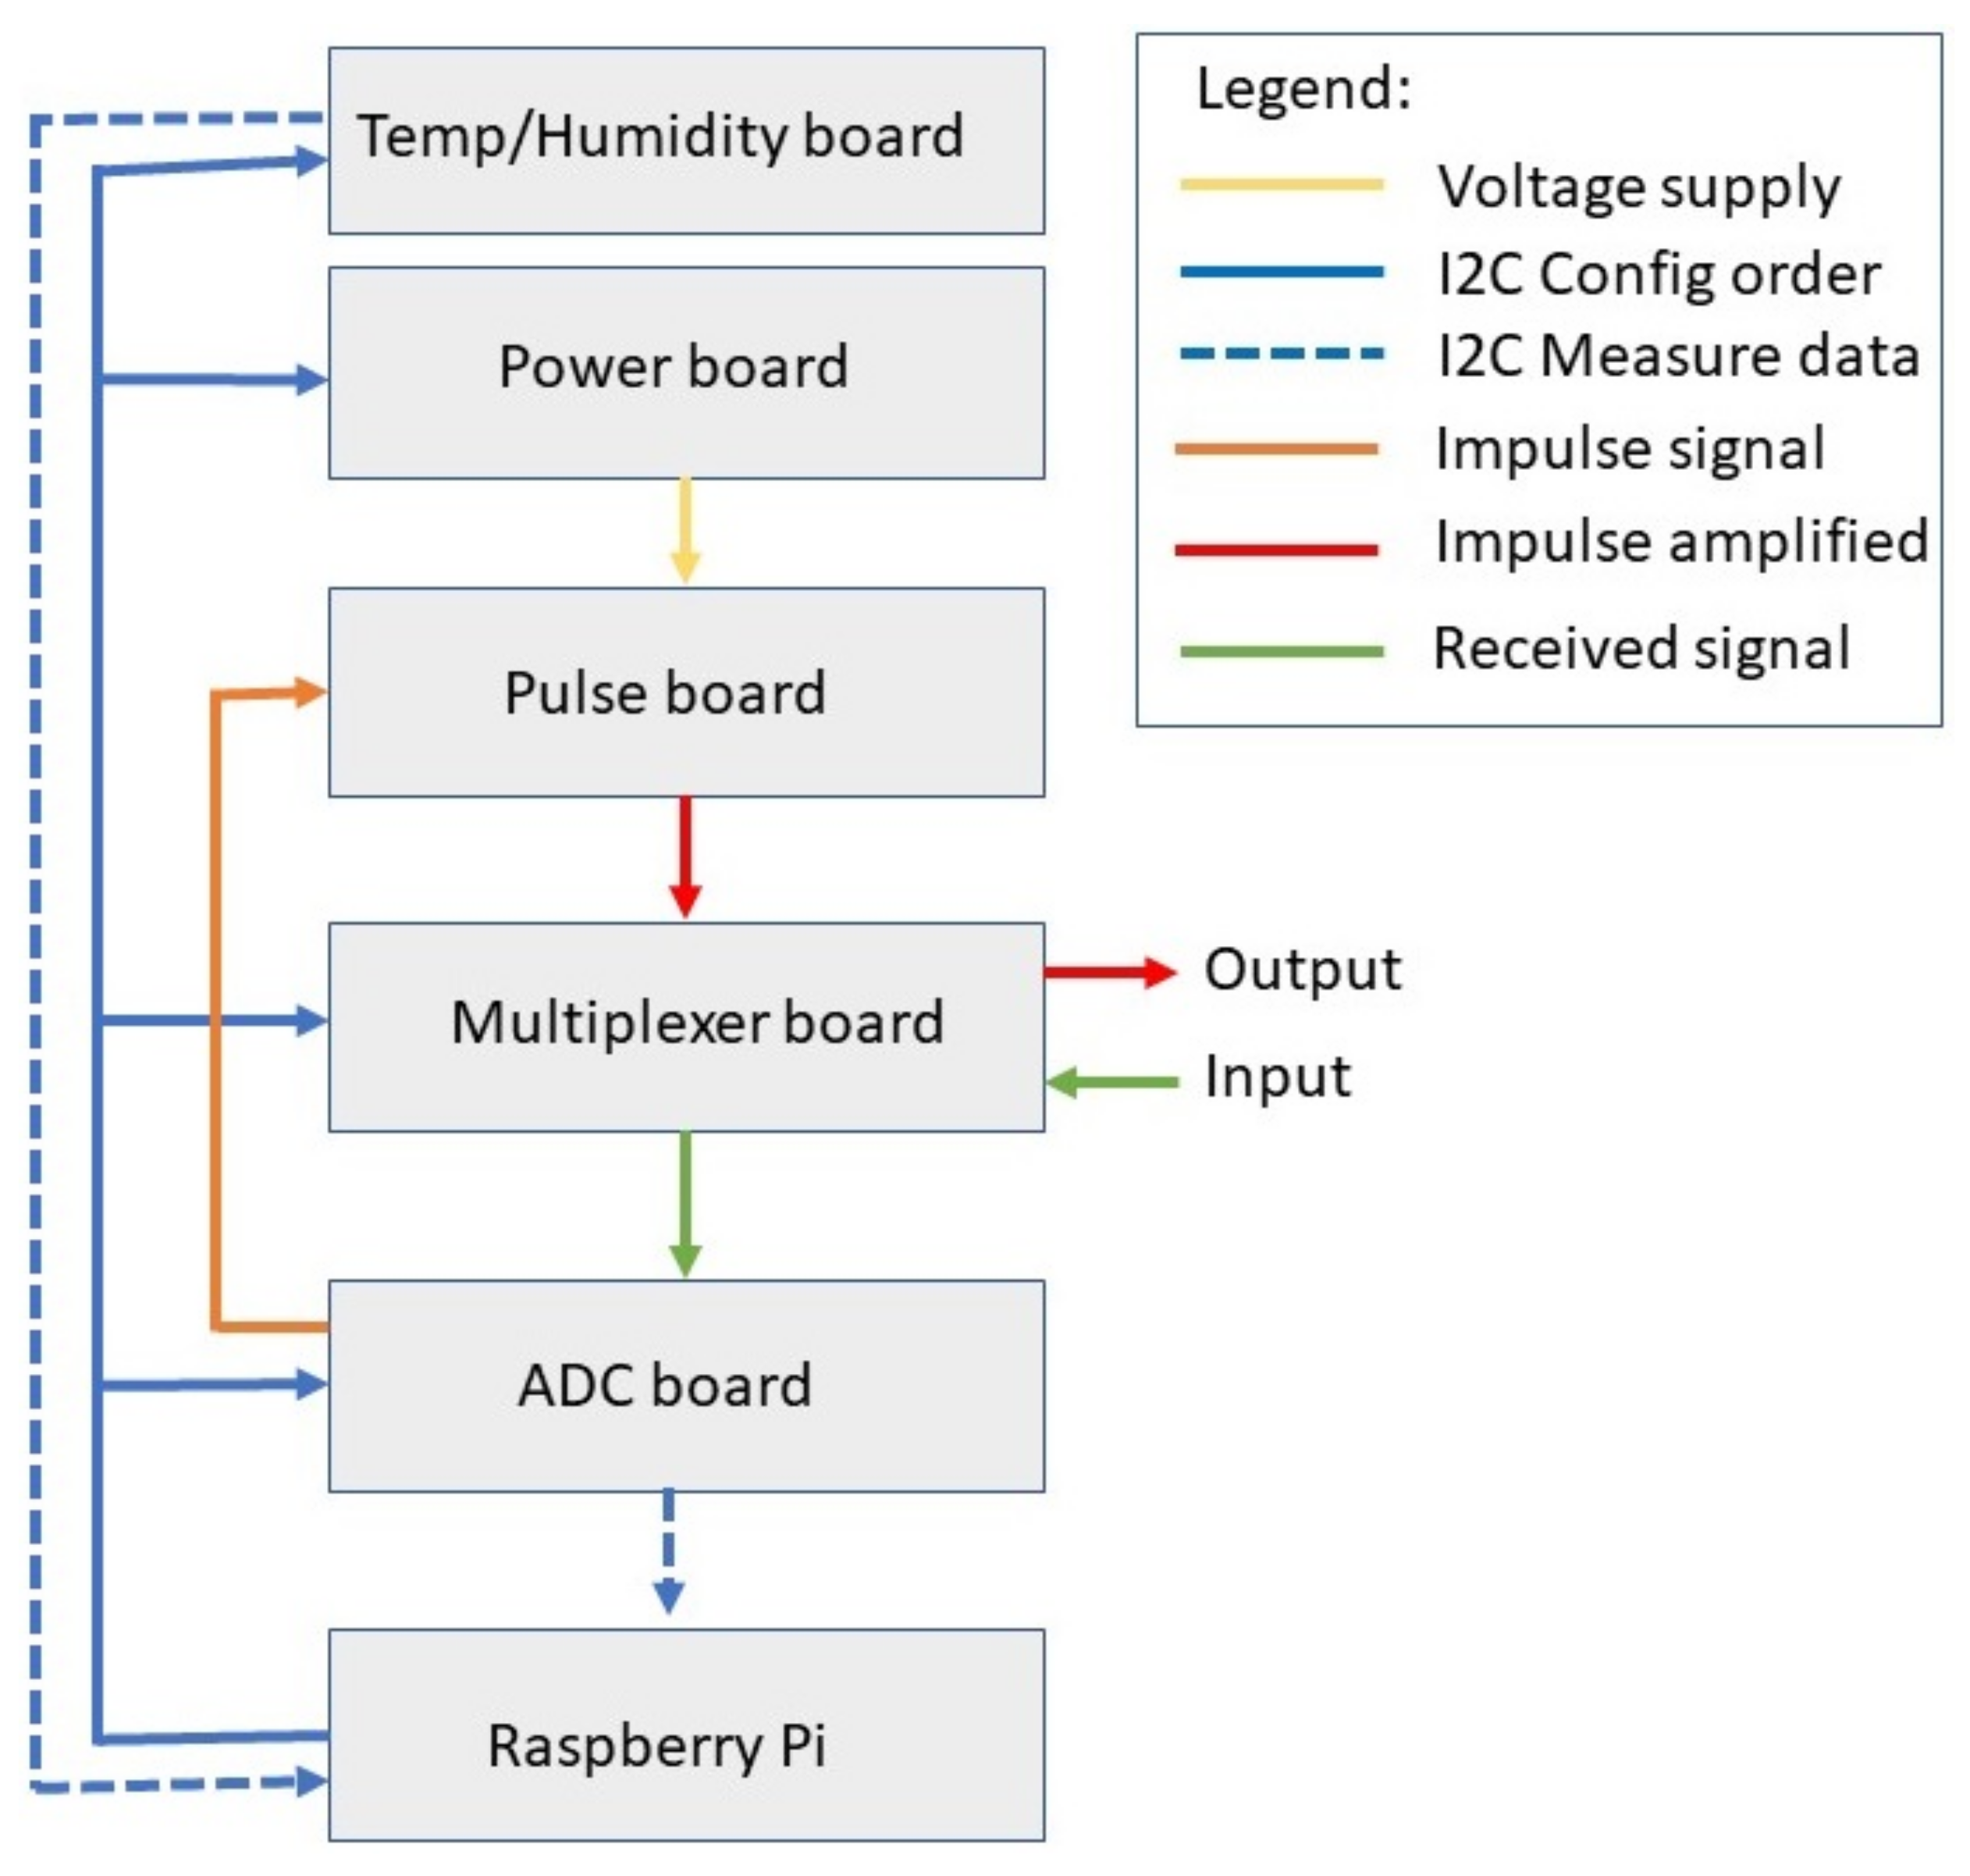
In Figure 3, a schematic of the communication between all systems is shown. First, the Raspberry Pi sends the desired values for measurement to all boards, except the pulser board, via I2C. The power board provides the selected transmitter output voltage. The multiplexer prepares the chosen input/output combination of the ultrasonic sensors. The temp/humidity board sends the acquired values back to the Raspberry Pi via I2C. After that, the whole system is prepared for the pulse. The ADC board sends the digital pulse to the pulser board (orange arrow in Figure 3), which forwards it to the selected transmitting transducer and records the input signal (green arrow in Figure 3). After the ultrasonic signal from the currently selected receiving transducer is recorded on the ADC board, it is digitally sent to the Raspberry Pi via I2C. This measurement sequence takes around four seconds, depending on the number of samples recorded.
2.3. Protocol and Electric Communication Design
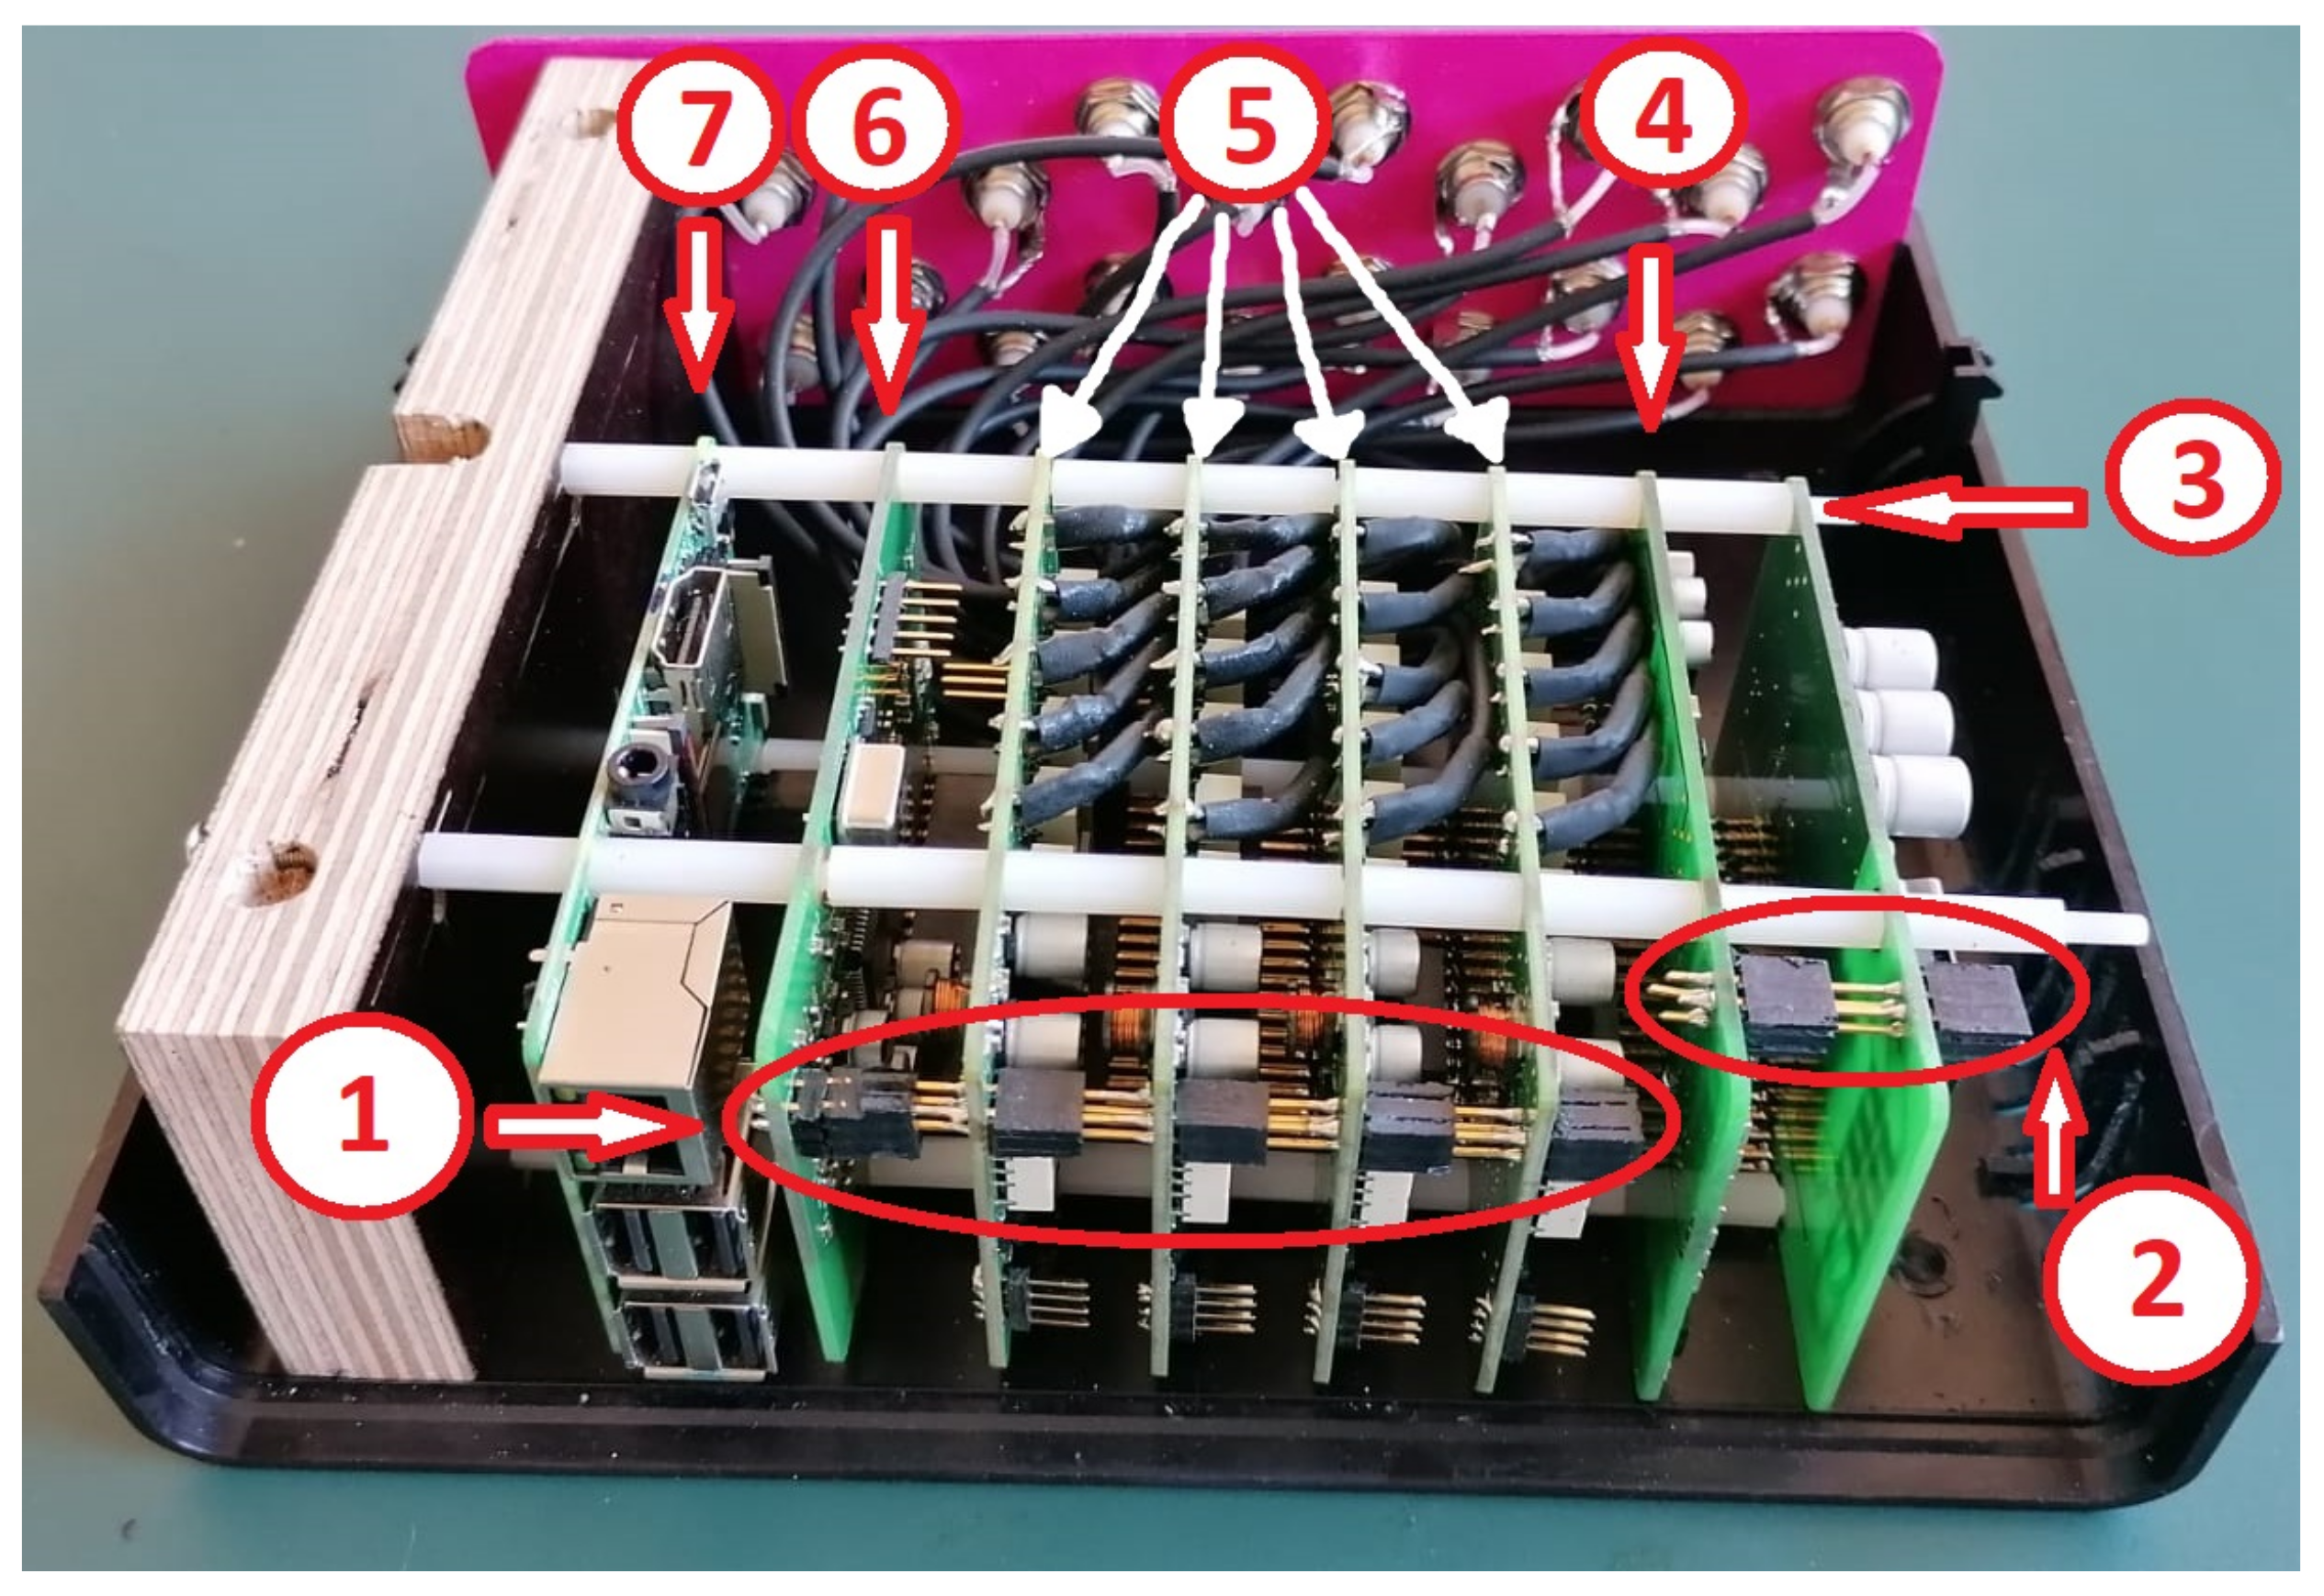
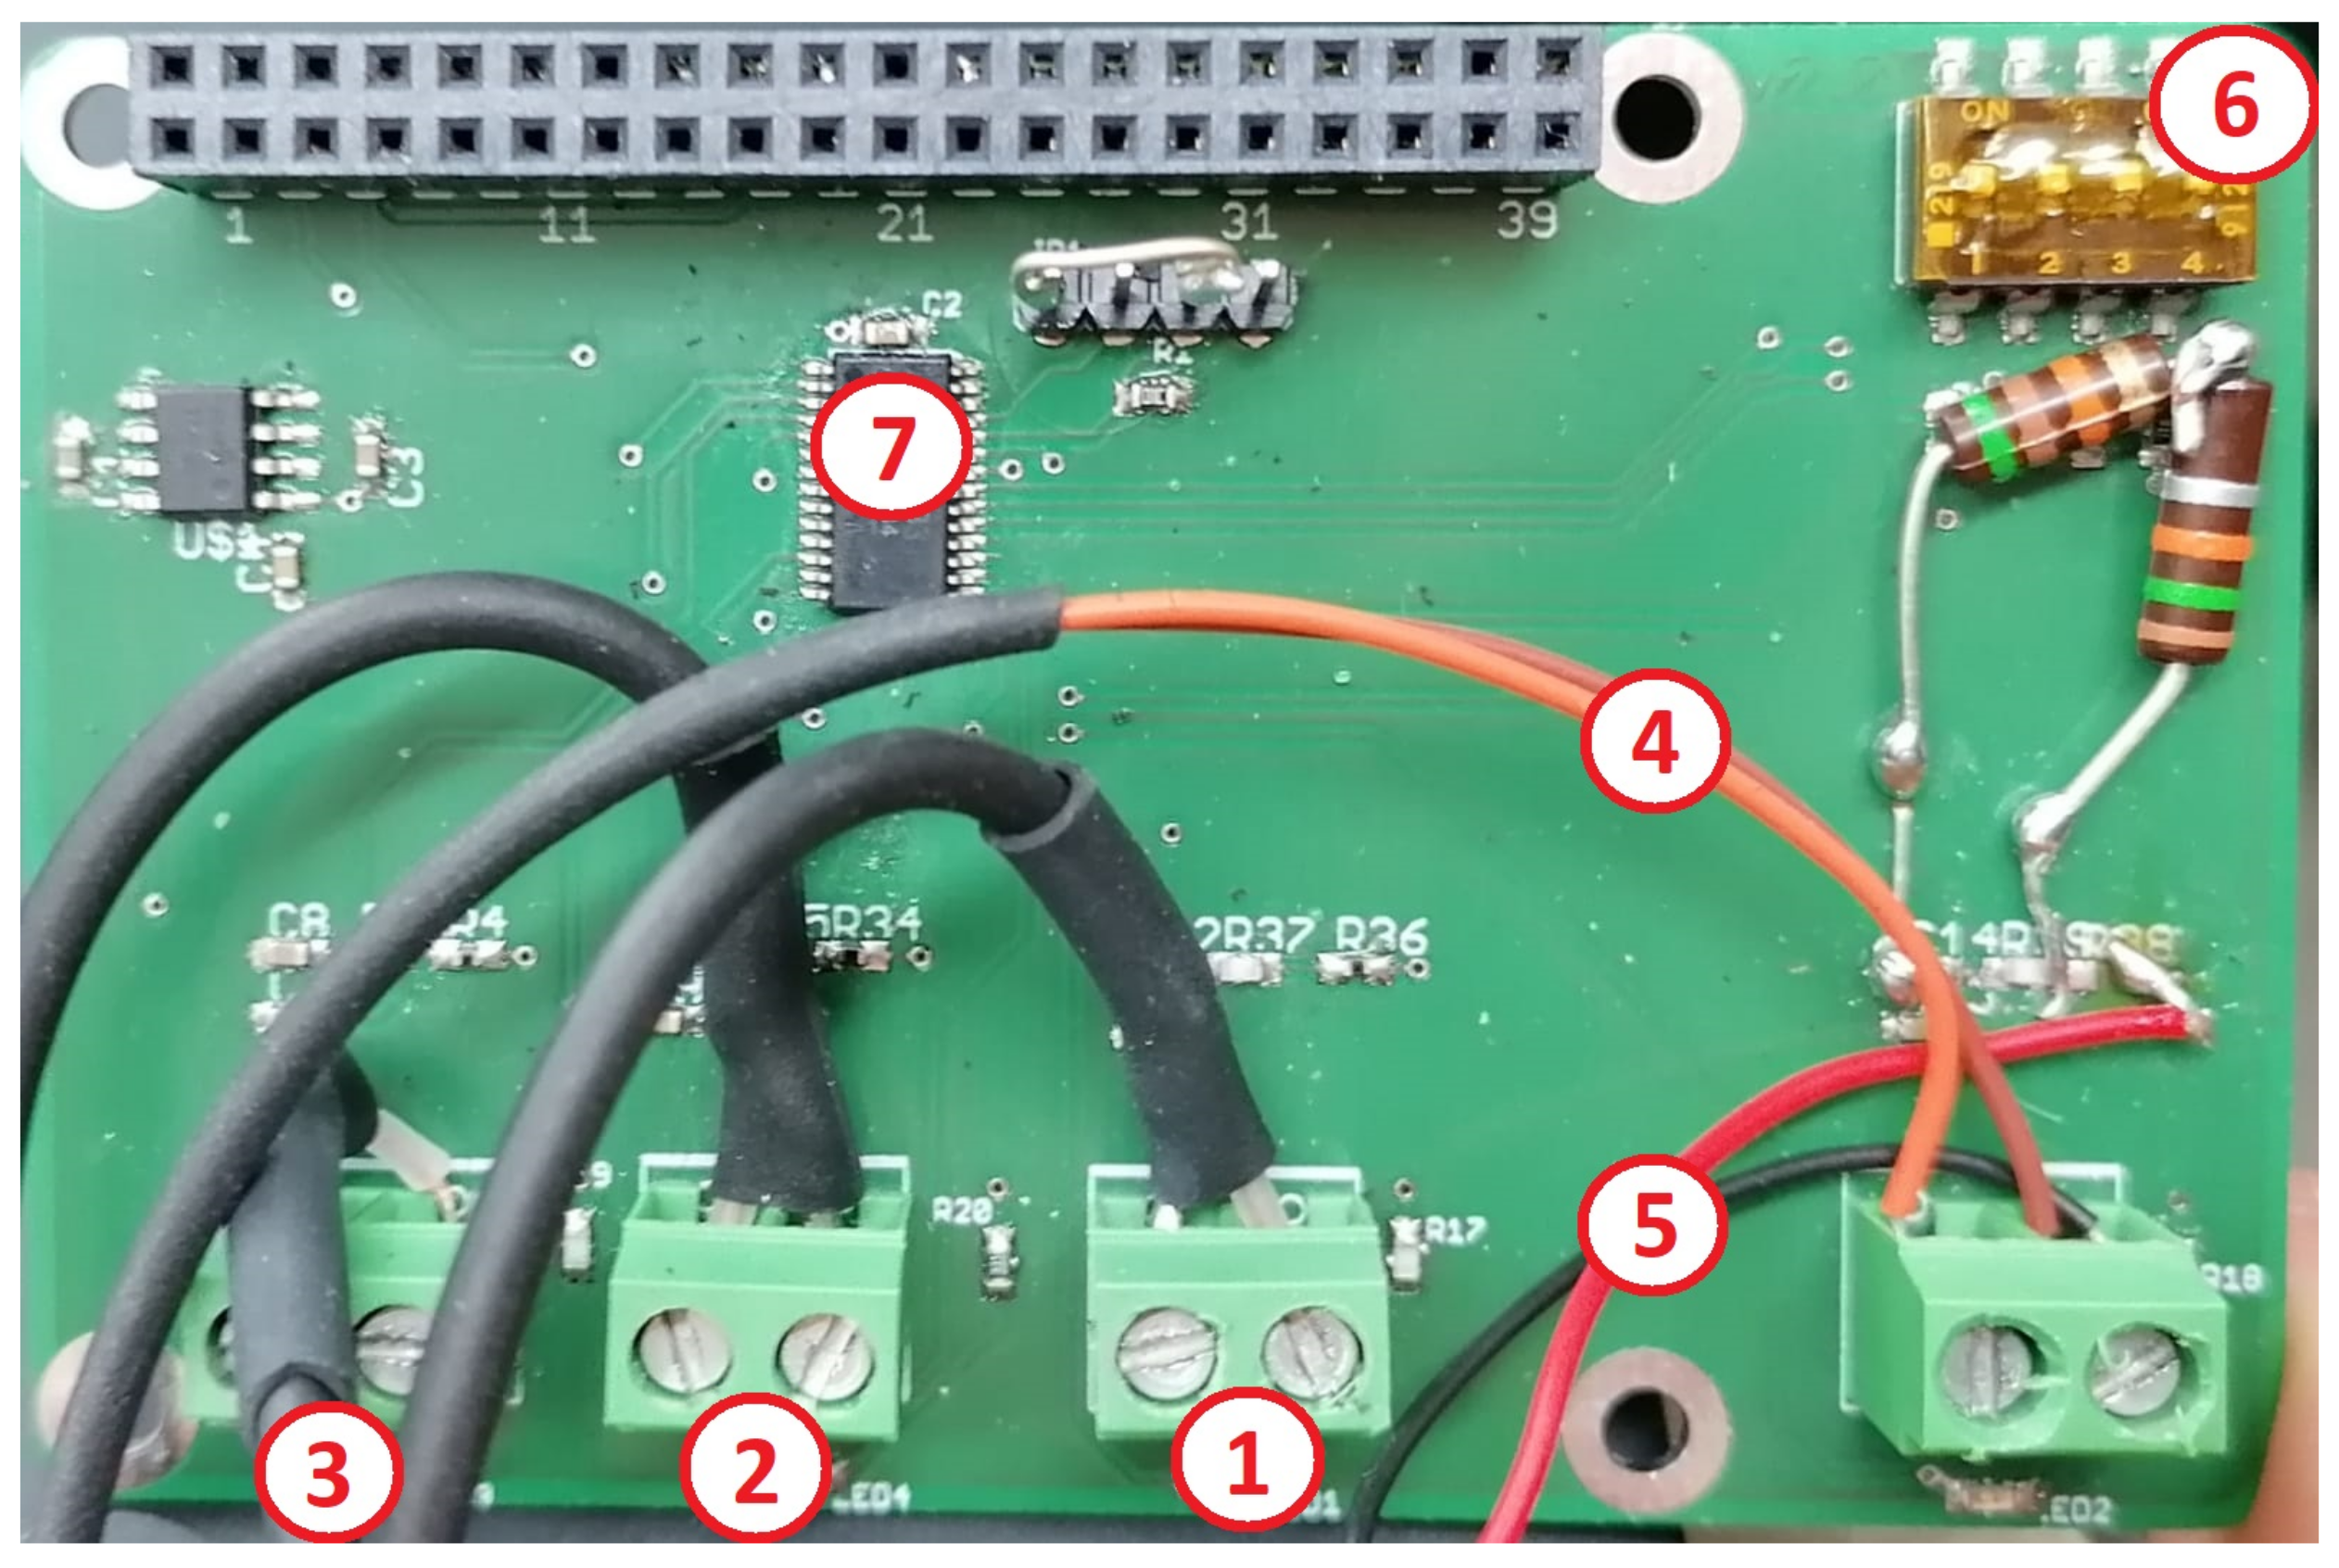
There are 3 electric connections between the boards. The first connection’s only function is to deliver the required voltage supply from the power board to the pulser board (Figure 4 number 2). The second connection delivers the pulse from the pulser board, via the multiplexer, to the sending transducer (Figure 5 number 1). The third connection opens the circuit for the measurement data; this travels from the receiving transducer through the multiplexer to the ADC board (Figure 4 number 1).
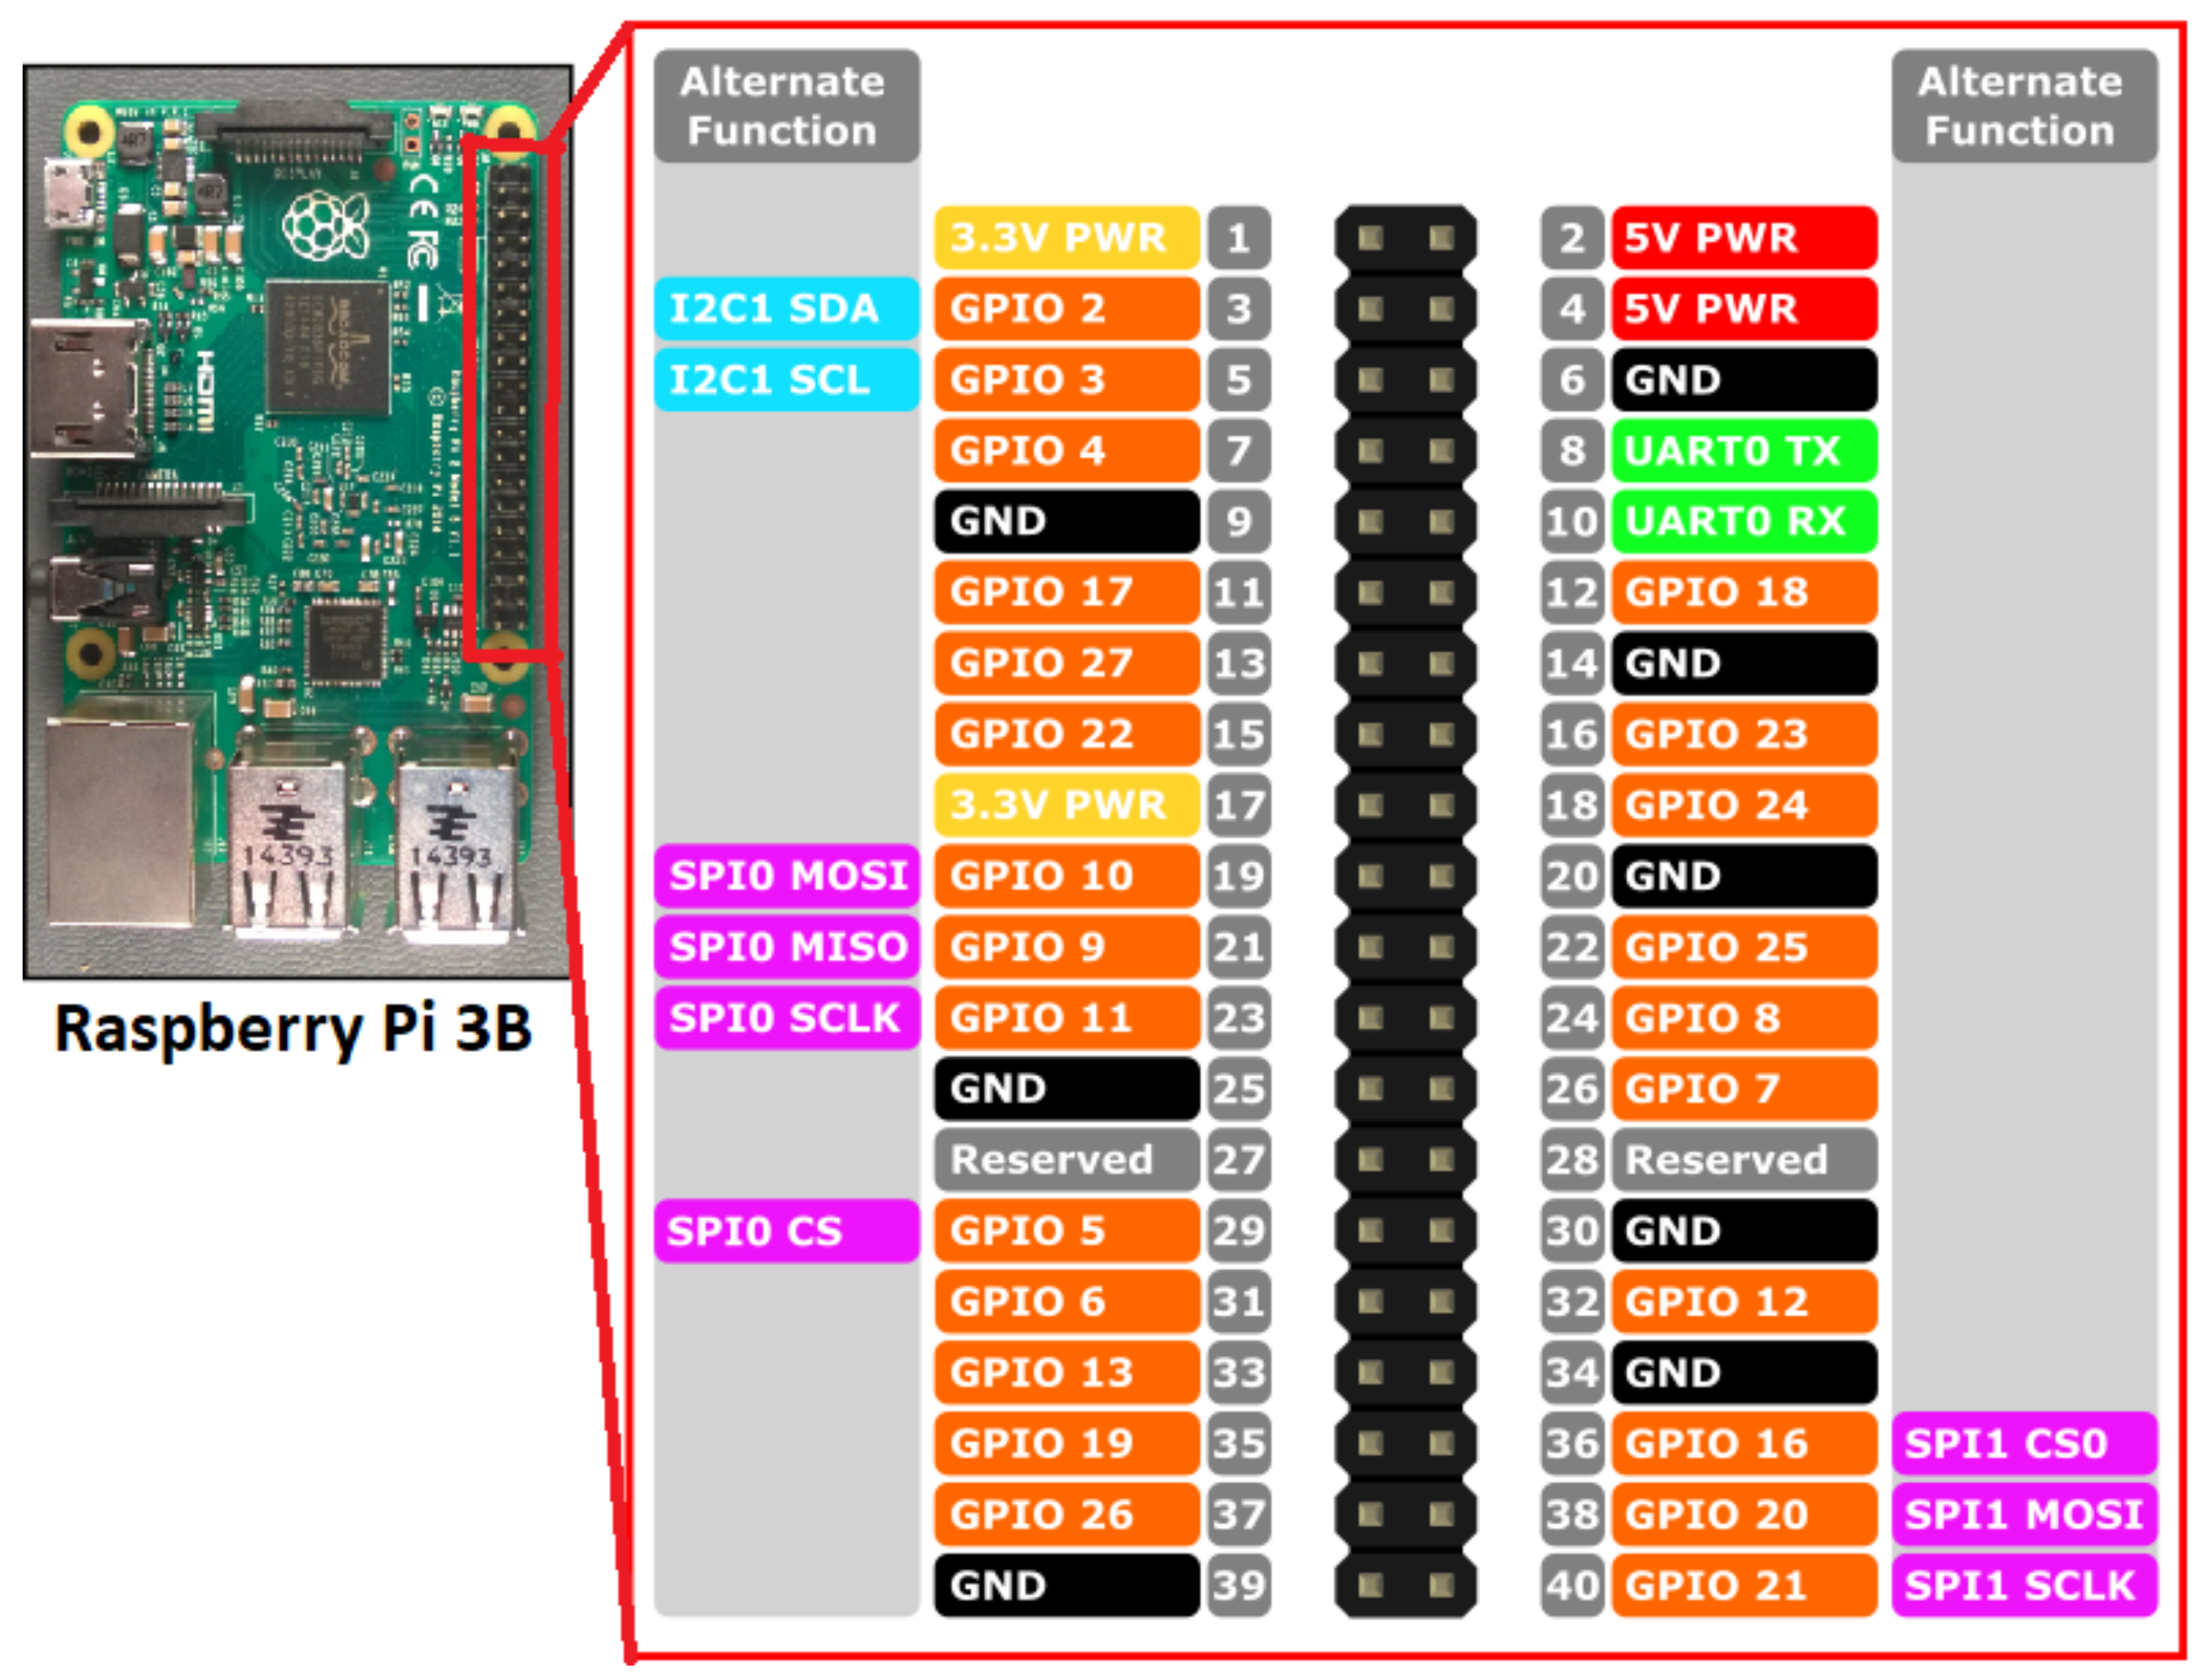
In order to clarify how the boards communicate and how they are connected with each other, all data/electric connections between the boards and the Raspberry Pi will be explained in the following. As shown in Figure 2, it provides the 5 V and 3.3 V needed for all circuits. GPIO 2 and 3 support the I2C communication protocol between each main microcontroller and the Raspberry Pi, allowing all the predetermined functions to be triggered and the measured data to be received after each measurement. This is also shown later in Figure 12 in the final section as a continuous blue line.
GPIO 16, 20 and 21 are used to trigger the pulse to the pulser board. This digital trigger is controlled by the microcontroller TM4C123GH6PM, which sends two digital pulses with a predetermined length defining the center frequency. This will be explained in Section 2.8.
The Raspberry Pi extension pins are shown in Figure 5, number 2. There are also three electrical connections out of the pins. They are shown Figure 4, numbers 1 and 2, and also in Figure 5, number 1.
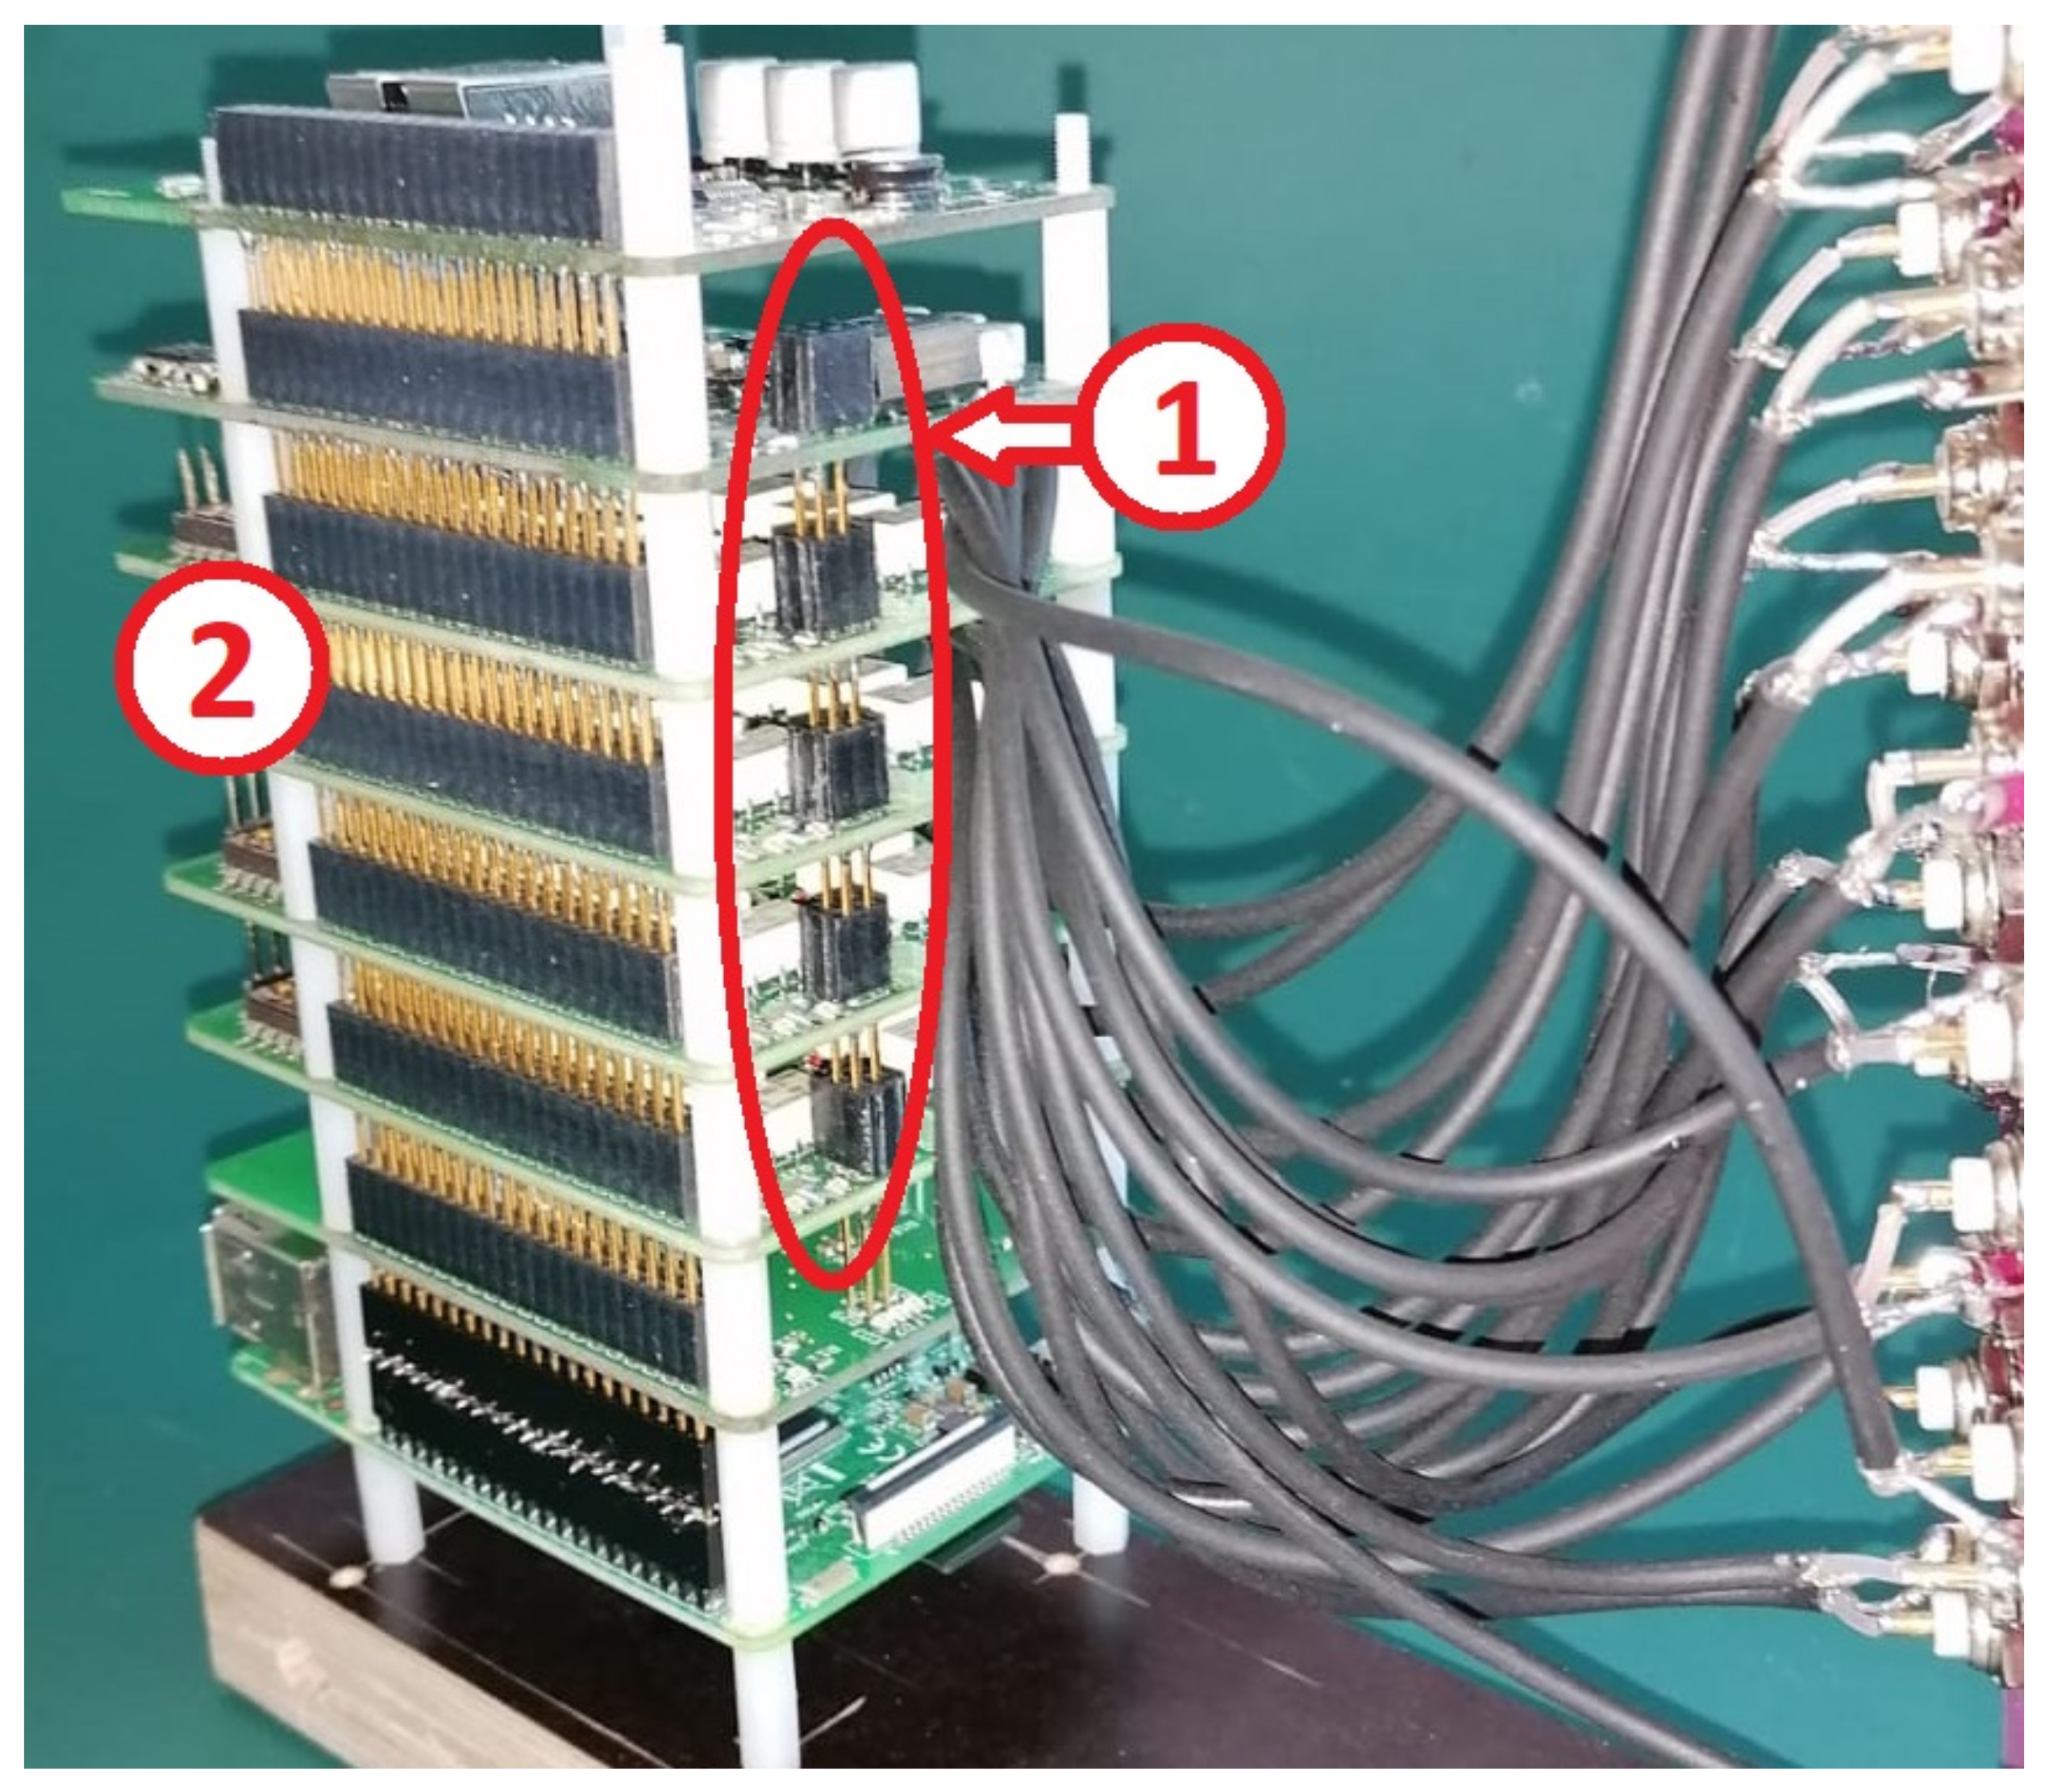
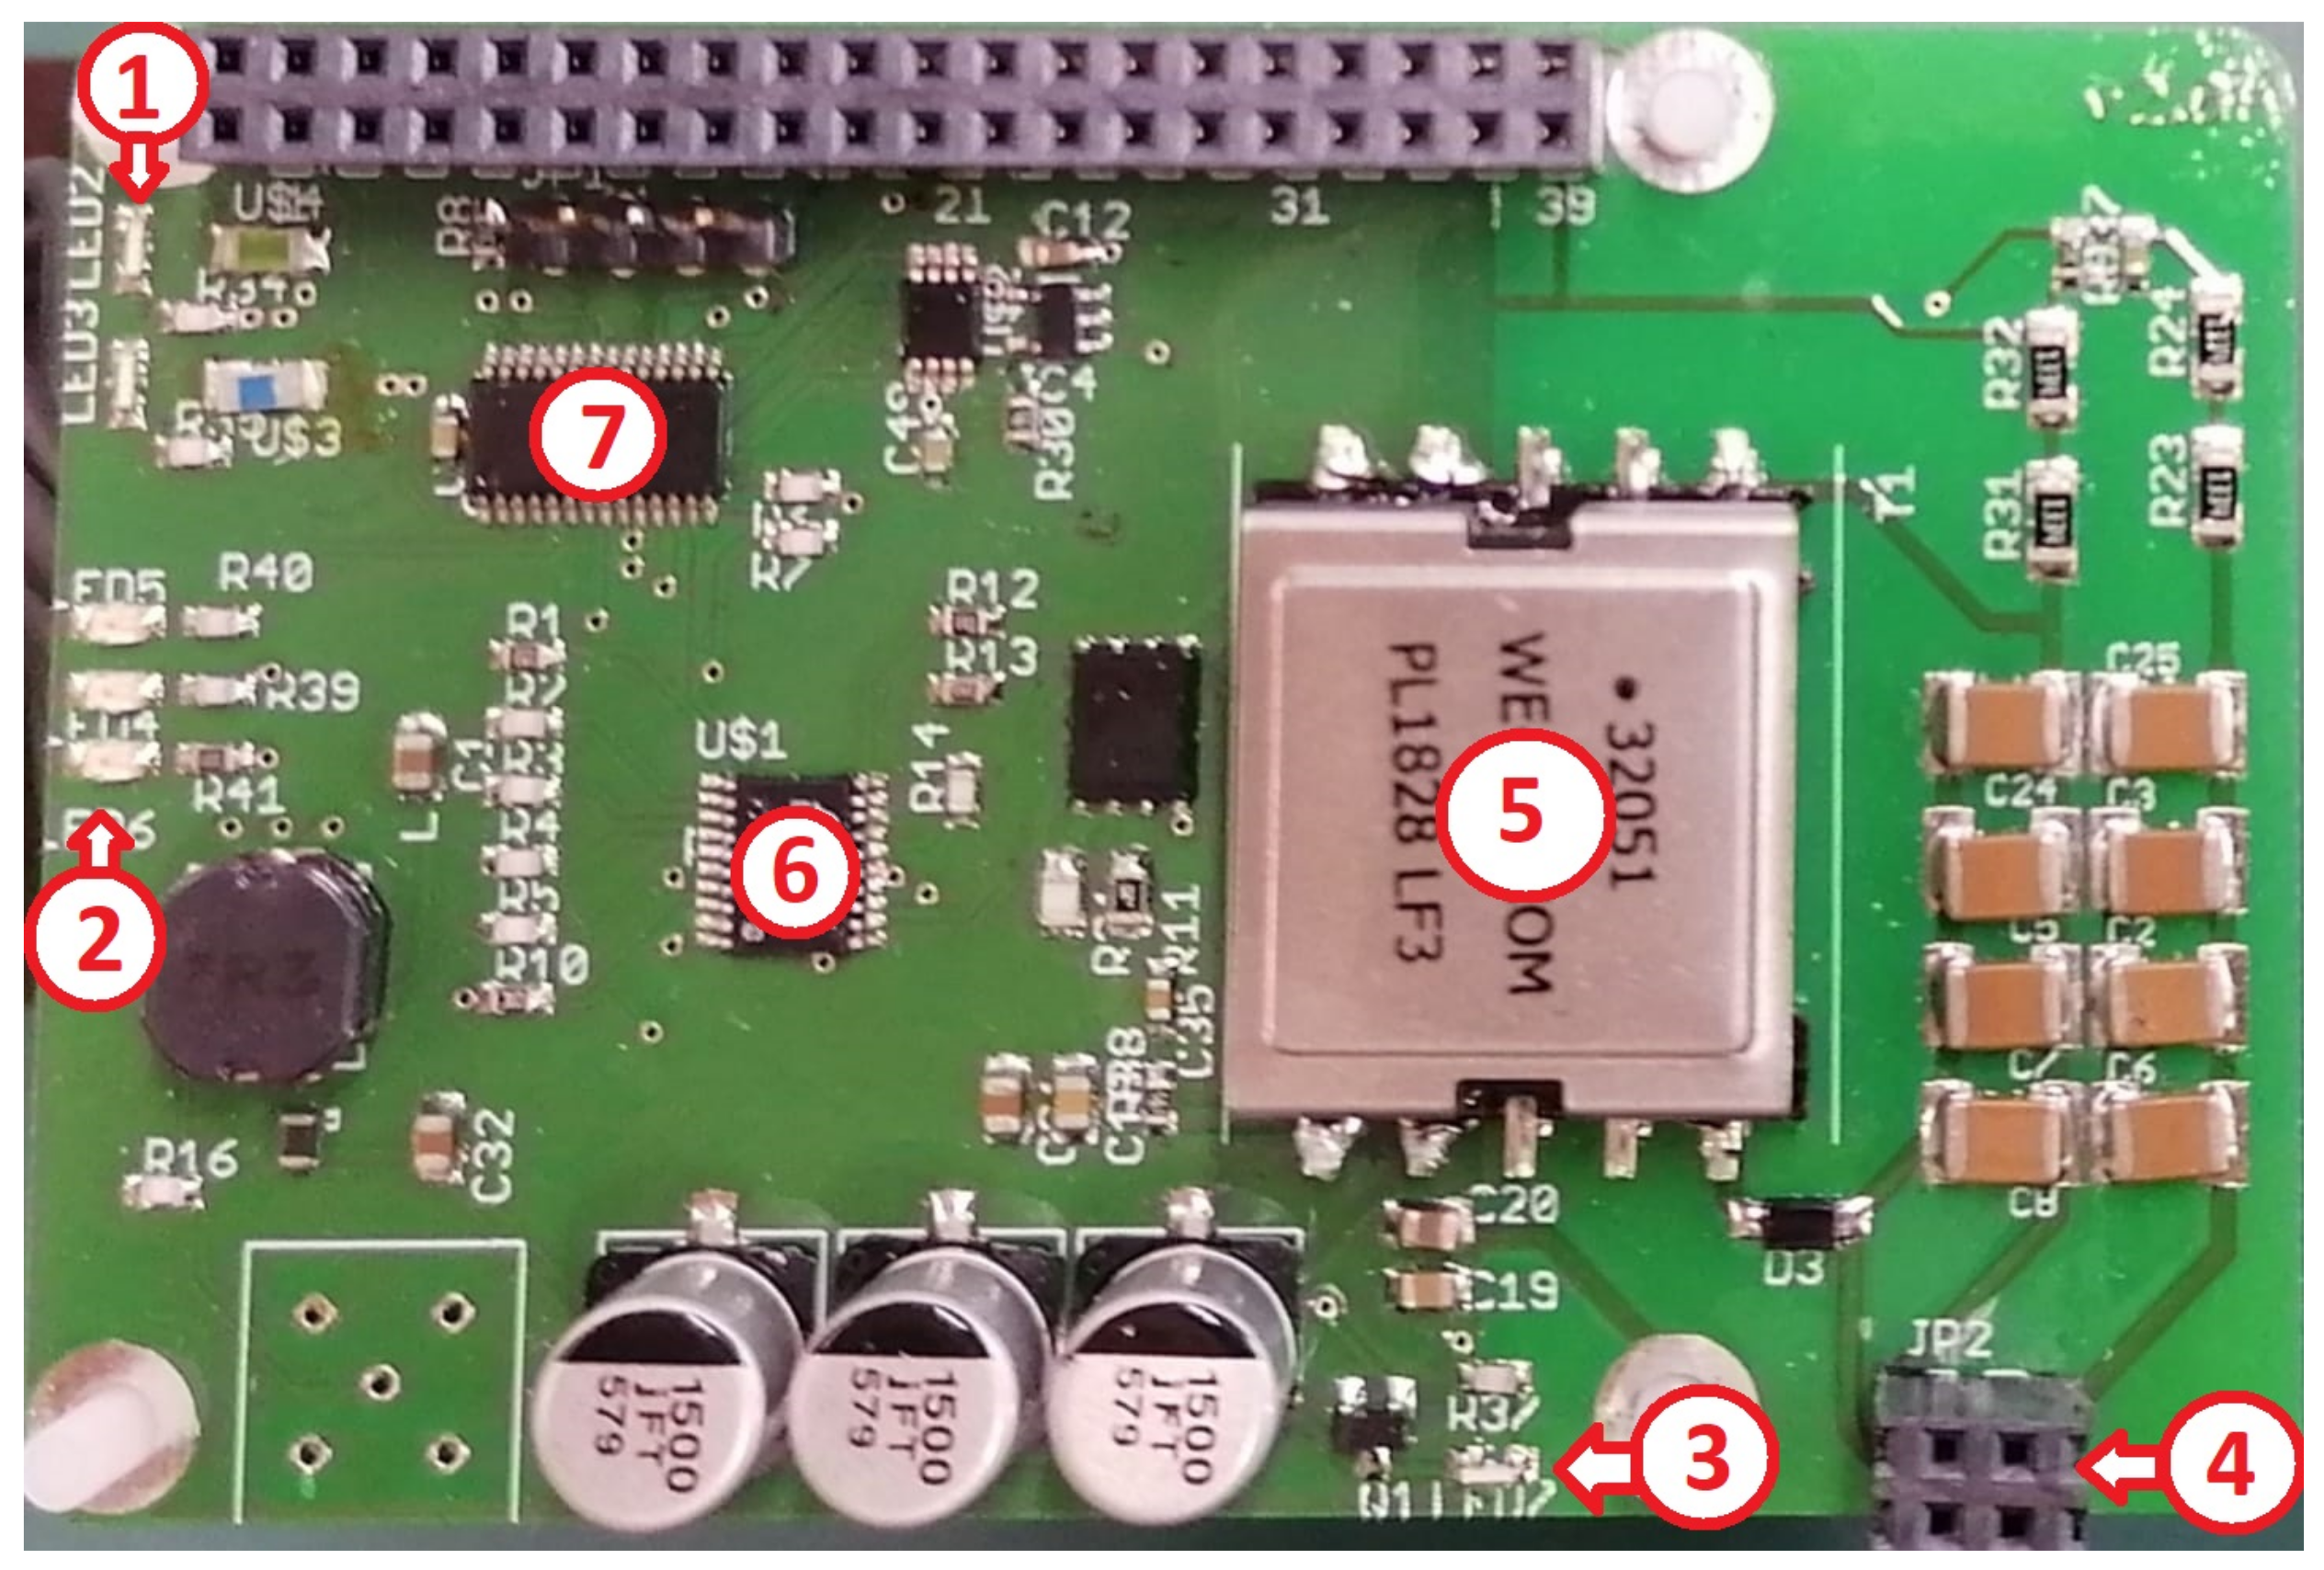
Figure 4 shows an internal front view of the W-Box. Number 1 shows a section containing plates indicating the connection between the ultrasound input and the ADC board, via the multiplexers. Number 2 highlights the connection between the power board and the pulser board. Numbers 3, 4, 5, 6, and 7, indicate, respectively, the power board, the pulser board, the 4 multiplexer boards, the ADC board, and the Raspberry Pi.
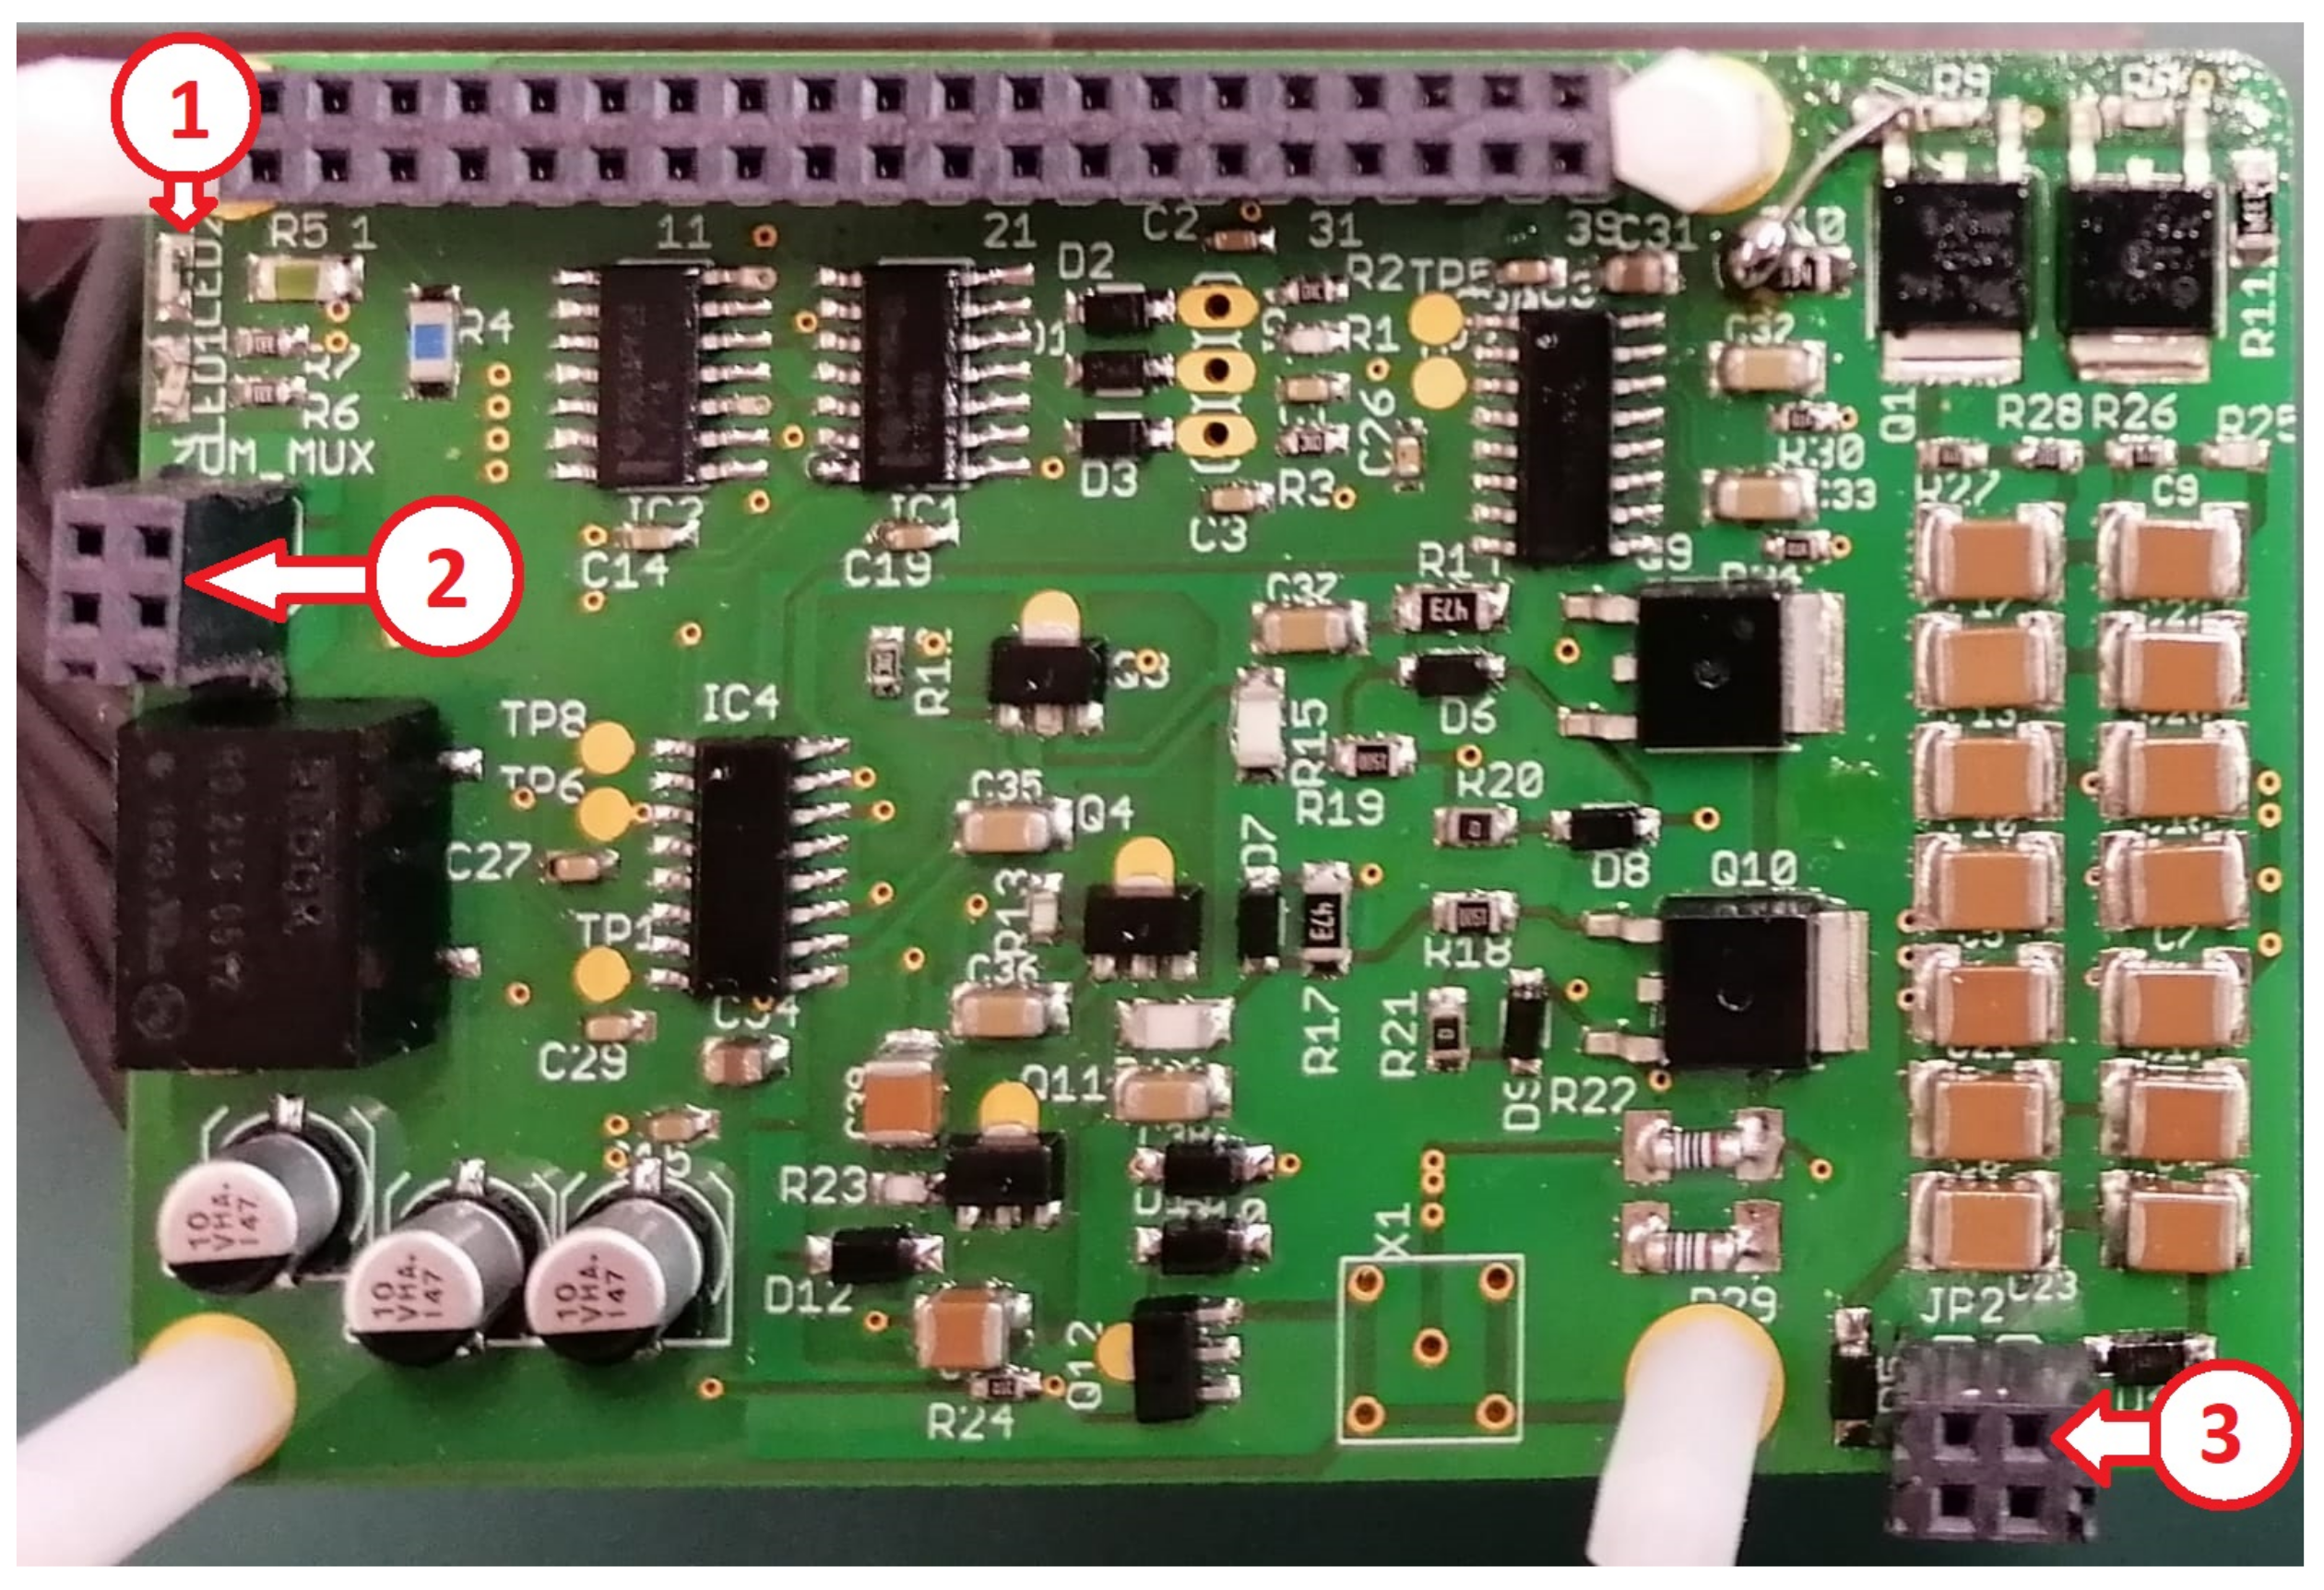
Figure 5 shows an internal rear view of the W-Box. Number 1 indicates the connection between the pulser board and all 4 multiplexer boards. Number 2 indicates the Raspberry Pi pins explained in Figure 2. Although UART0 TX, UART0 TX, GPIO 9, GPIO 10 and GPIO 11 are connected into the ADC board, they are not yet in use. However, these circuit connections are prepared for possible future protocol communication enhancements.
2.4. Software and Ubuntu OS
There are 3 main functions for the OS and the control software developed in Python. The first is to provide a graphic interface for the user (GUI), the second is to save the measured data in its own memory or on the internet, and the third is to send commands and receive data via the I2C protocol. As soon as the W-Box is connected to the power source, the operating system (Ubuntu) is booted and the ultrasound program automatically starts a measurement with the previously prepared configuration. After an eventual power failure, the W-Box restarts automatically and continues to acquire and store/send data.
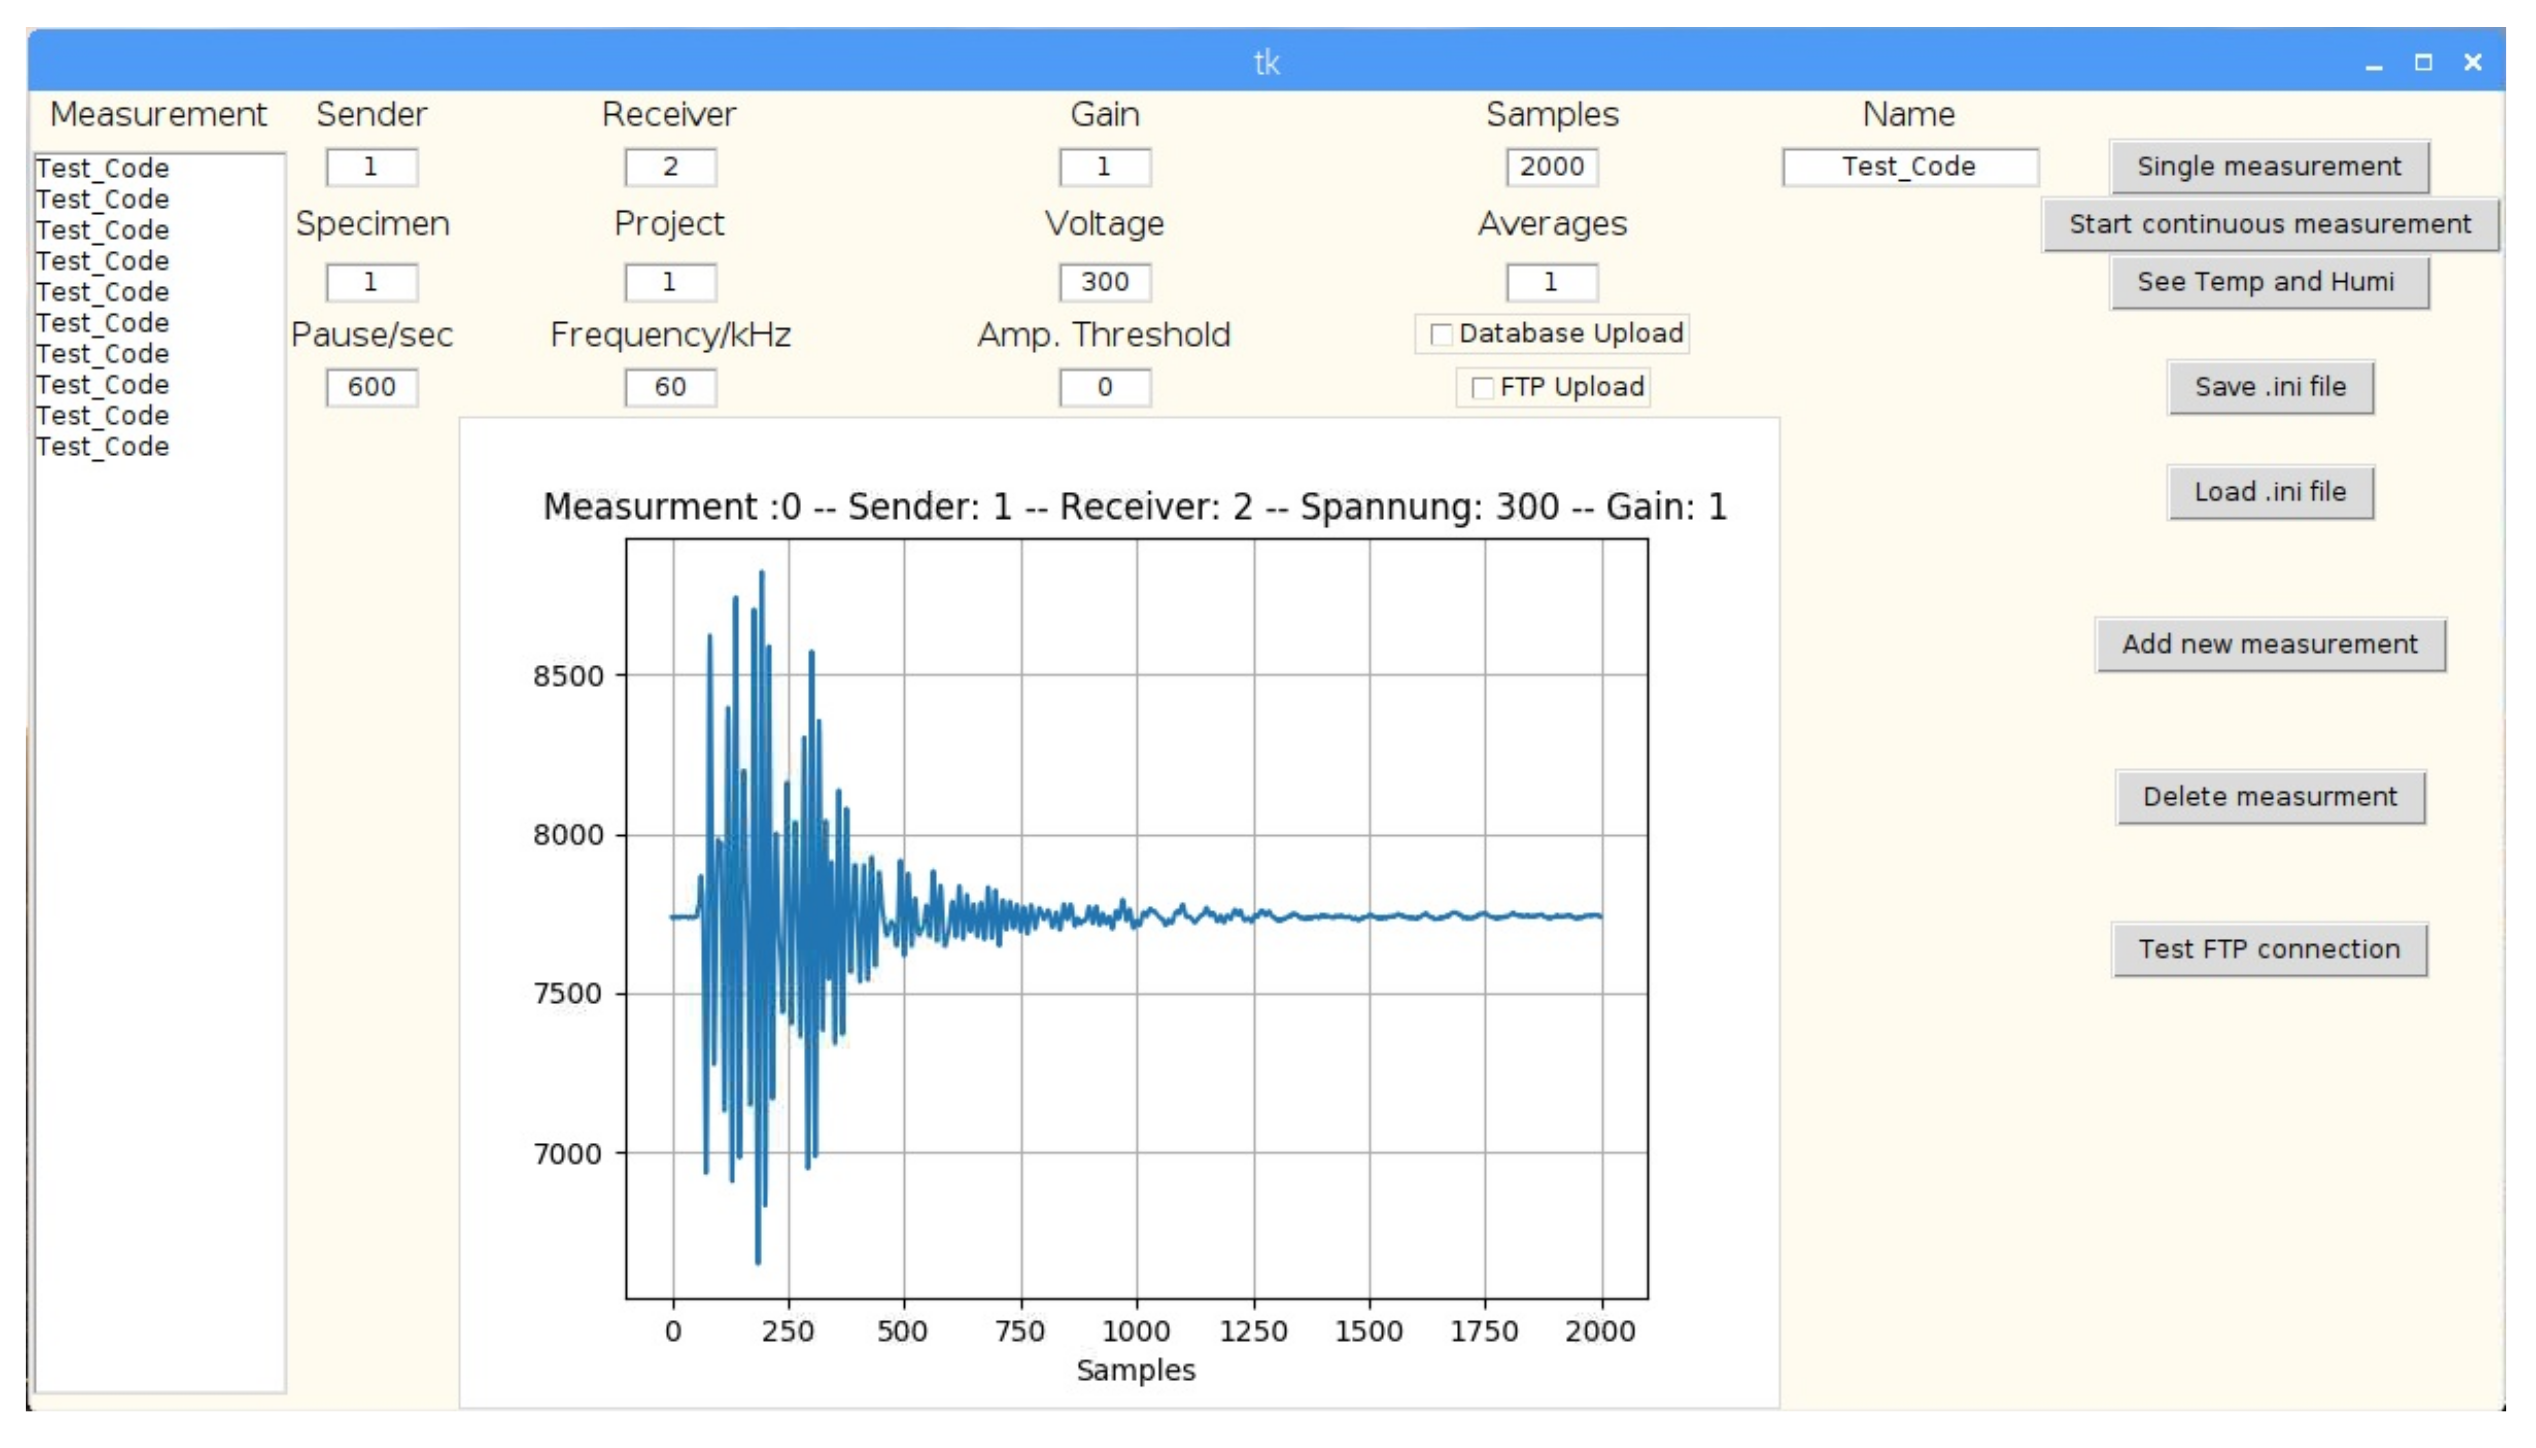
Figure 6 shows the GUI after a single test between two embedded ultrasonic transducers (S0807, ACS International). The amplitude of the signal (from 7000 to 8500) is within the 16,384 possible values of a 14-bit ADC. The user can customize how the data are sent to an external server. He can as well access the internal memory via VNC and copy the saved data using Ubuntu automatic servers or native Linux VNC controllers. A “configuration.ini” file defines the parameters for the repeated and the automatically started measurements. The data are stored as integer values in a single file for every measurement.
2.5. Multiplexer Board
The function of the multiplexer is to define the channels for transmitting and receiving ultrasonic signals to and from the transducers. The board is directly controlled by the Raspberry Pi via I2C and switches between the output and input connectors before the transmitter impulse signal is sent.
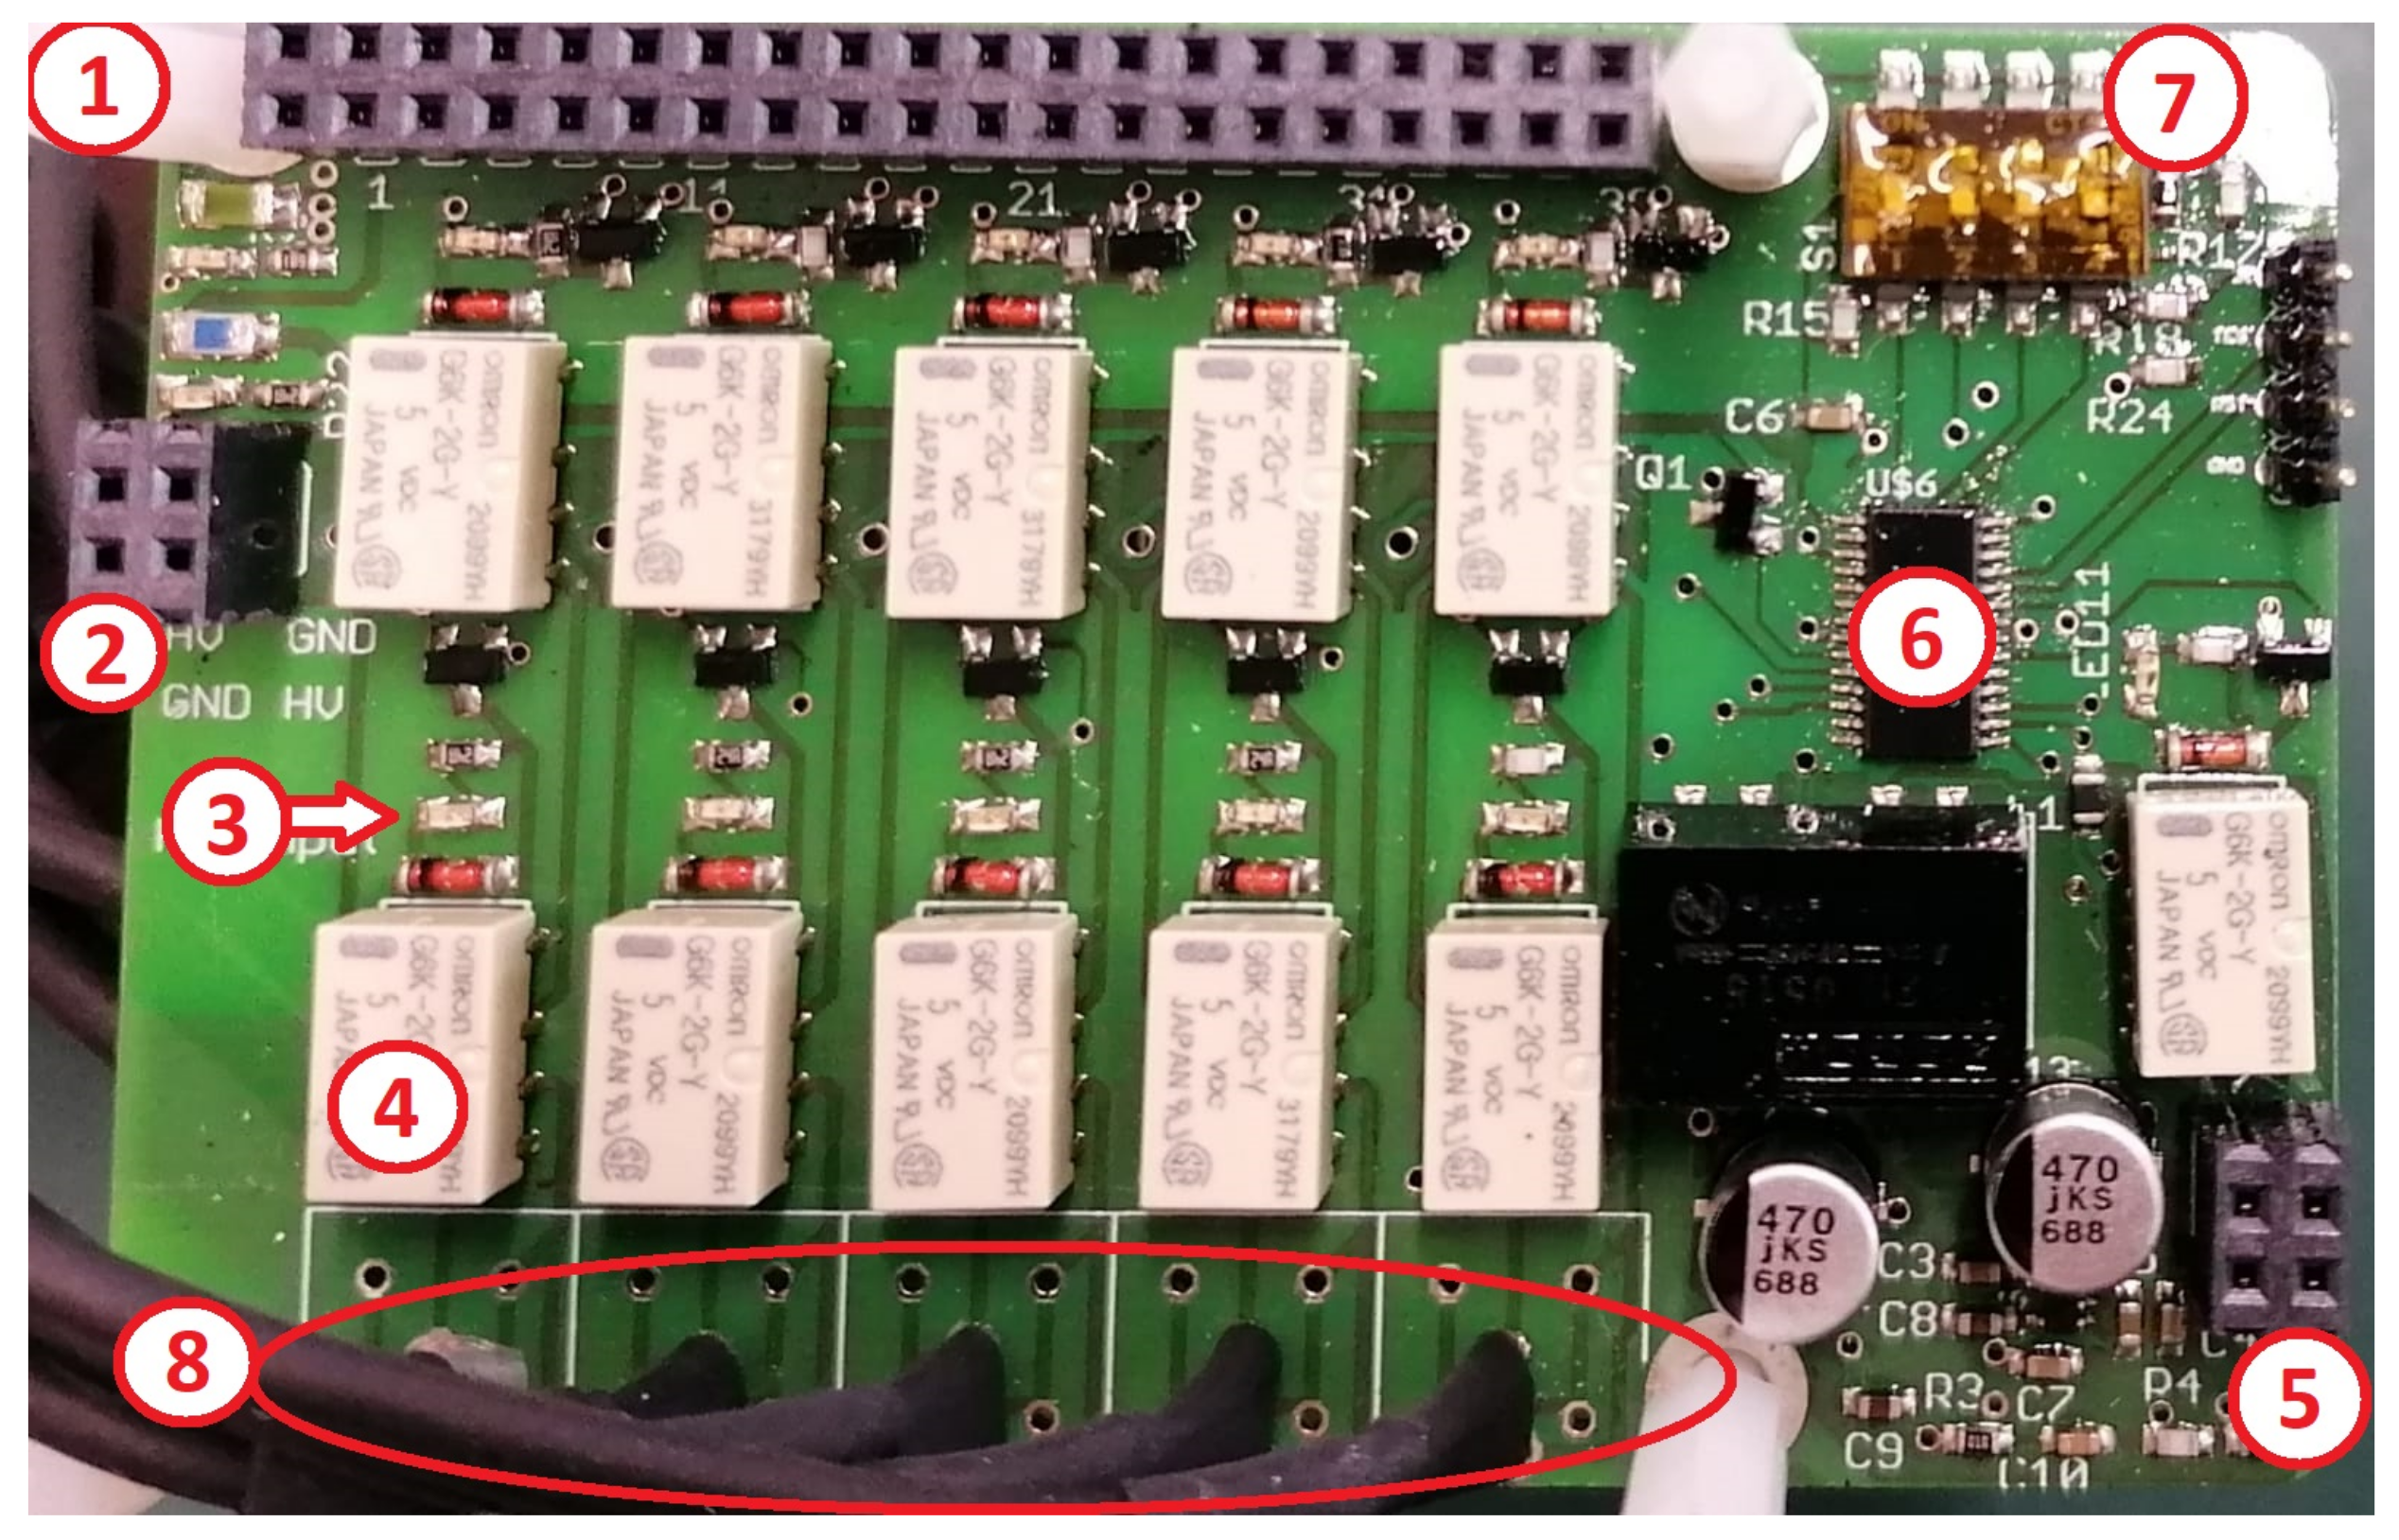
In order to allow for additional multiplexer boards as well as easier testing, a DIP switch (see Figure 7, number 7) is integrated on each multiplexer board. In this way, it is possible to manually change the address of each board between 0000 and 1110, allowing the use of up to 15 boards. When set to 1111, it automatically initiates the test mode. In test mode, all input and output channels of the multiplexer board are tested. The functionality of the W-Box can be easily checked with a multimeter. LEDs (Number 3) are integrated at the top of each relay (Number 4) to show if they are closed. Additional two LEDs at the top left of the board (Number 1) confirm that the 5 V and 3.3 V circuit currents are flowing through the board. They are protected against short circuit with a 2 A and 1 A fuse; (Number 1, green and blue SMD components). Number 2 in Figure 7 shows the connection to the ADC. Number 5 shows the connection to the multiplexer. Number 6 is the programmable microcontroller (MSP430G2303 from Texas Instruments) which receives I2C commands from the Raspberry Pi and digitally controls all multiplexer board functions. Number 8 shows the five connections to the BNC connectors.
2.6. ADC Board
The ADC board is dedicated to acquire data and send a trigger pulse to the pulser board. The measurements begin when the trigger is sent, which goes through the GPIO 20 and GPIO 21, with positive and negative trigger signaling, respectively (see Figure 12).
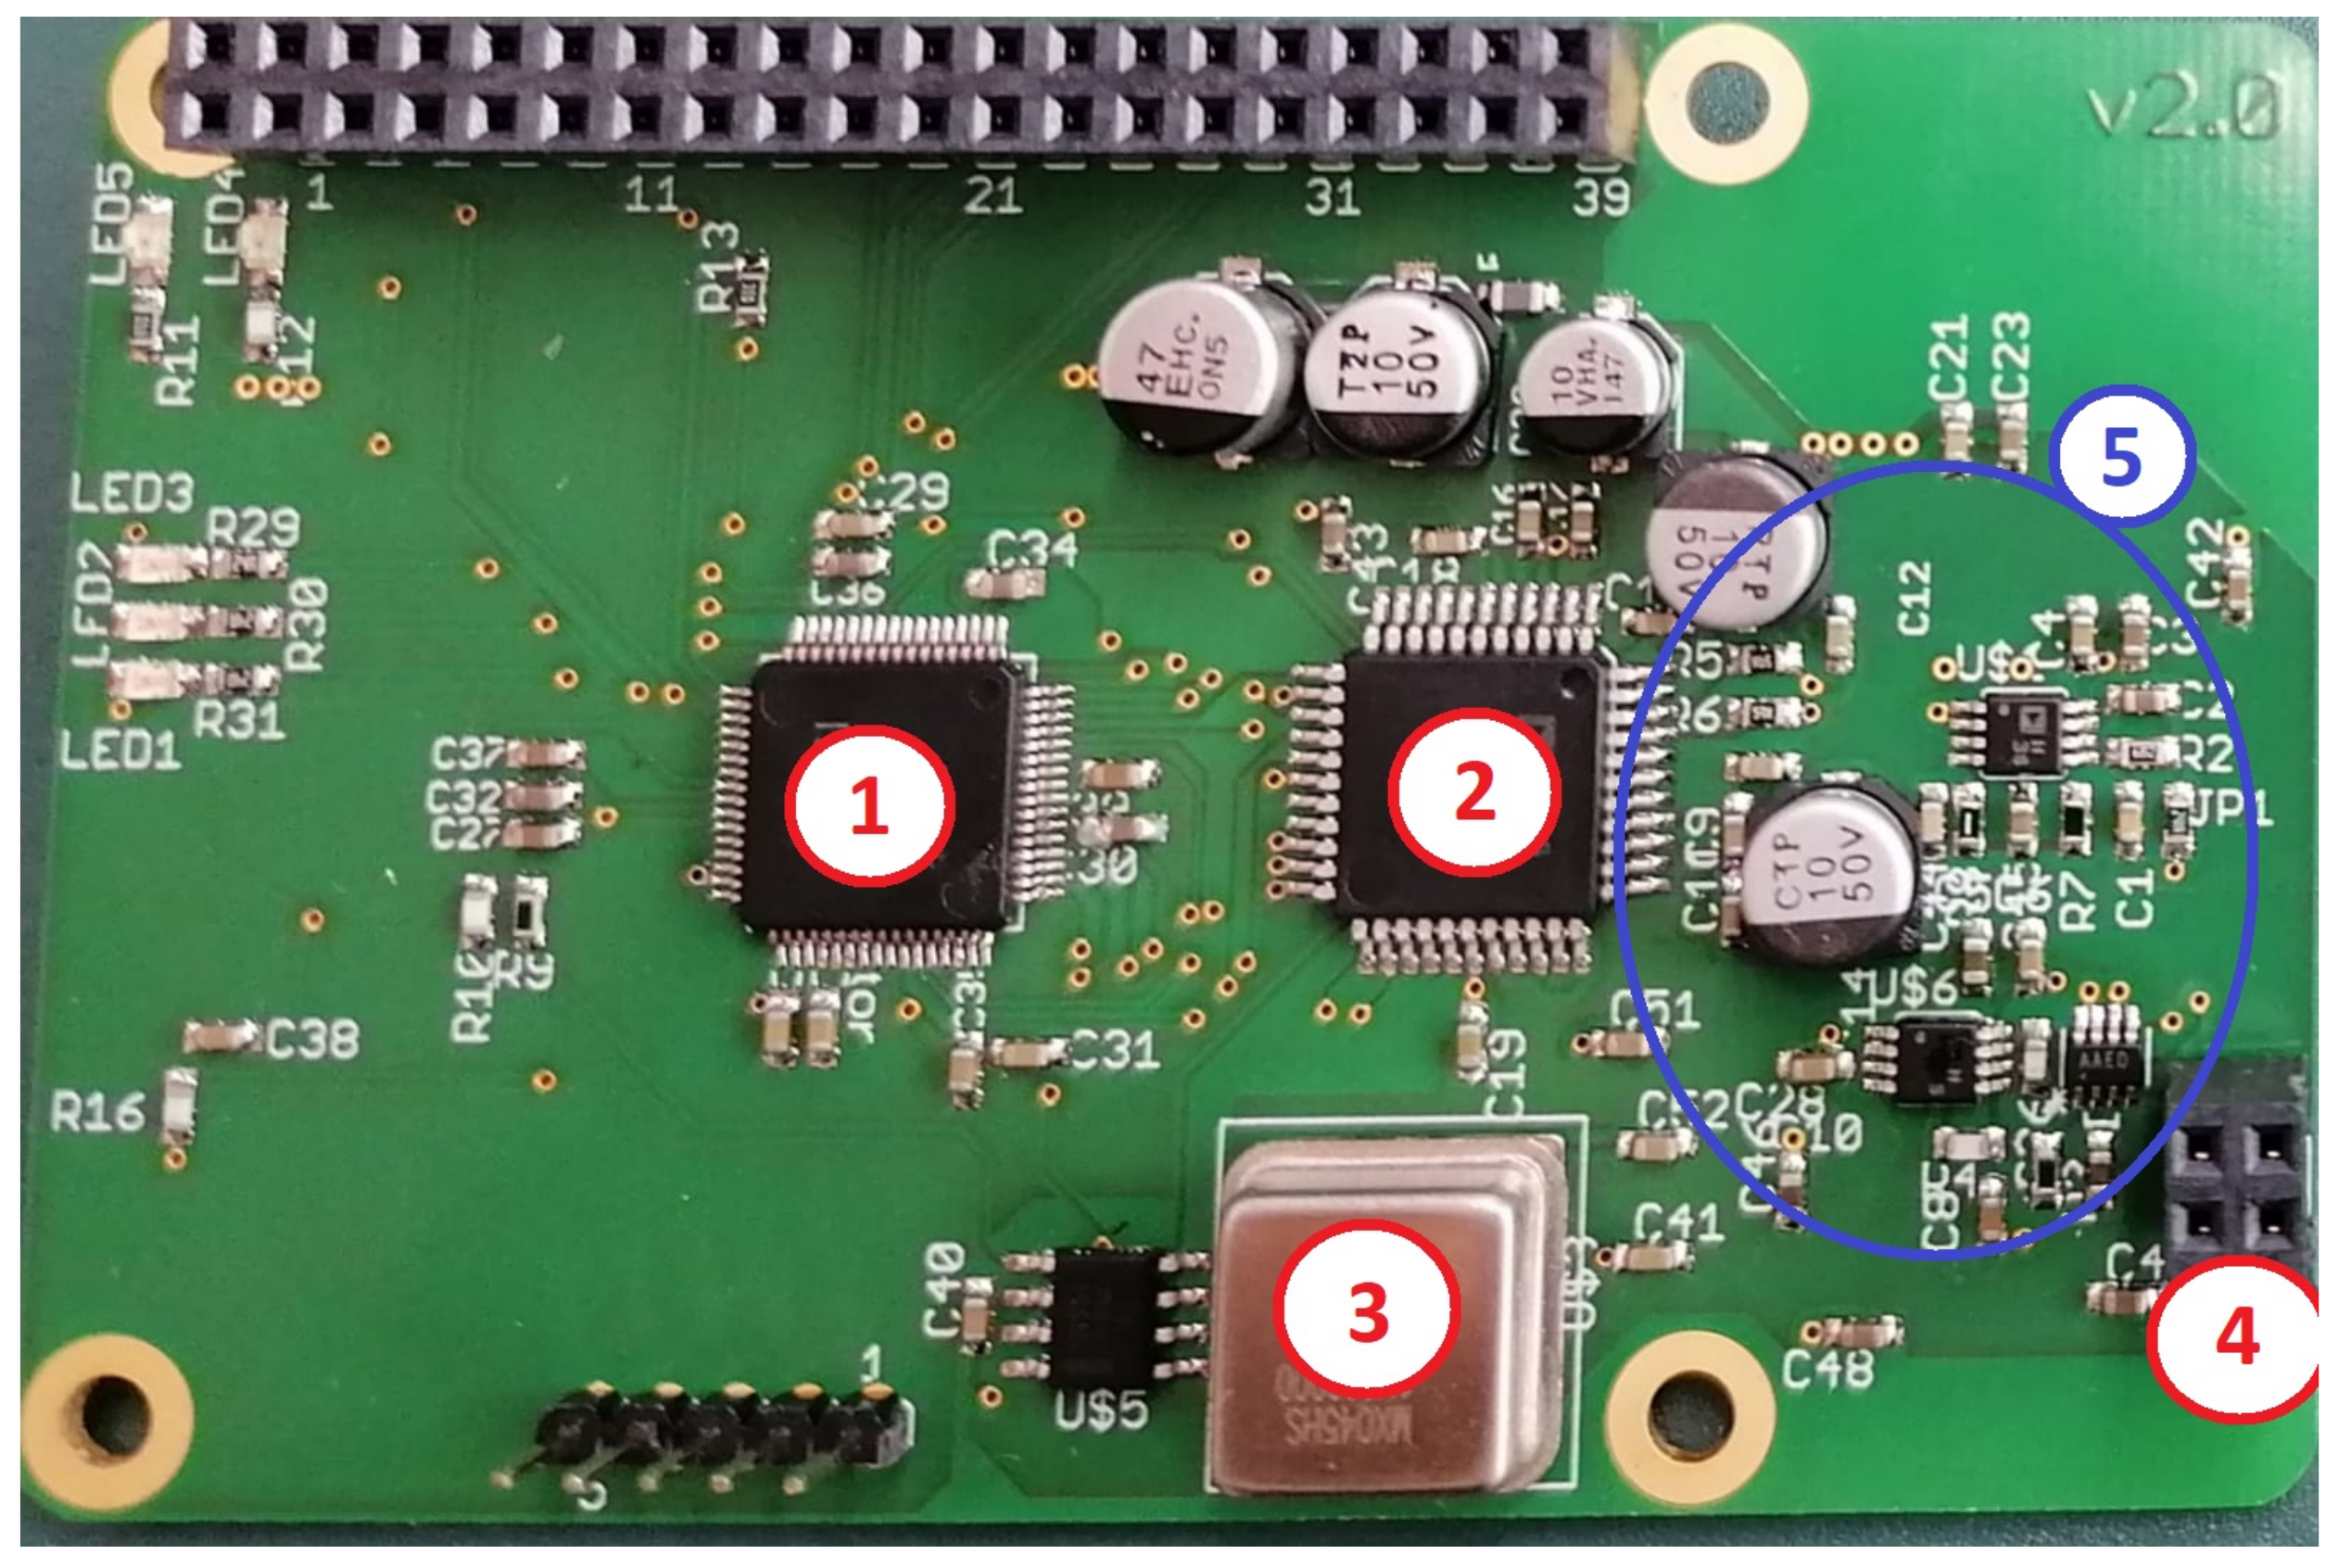
On the ADC board, there are 2 main components (see Figure 8, numbers 1 and 2); both have multiple connections in the middle. The first (TM4C123GH6PM from Texas Instruments), number 1, is a microcontroller programmed to receive and send I2C commands and to send the digital pulse to the pulser board. It also controls the second main component, number 2, which is an analog-to-digital converter (AD9241ASZ from Analog Devices Inc.) responsible for receiving the analog data and sending it back digitally to number 1. Number 4 shows the analog ultrasound signal received from the multiplexer. Before this signal goes into the ADC (Number 2), it is amplified and filtered in an analog filtering circuit (Number 5), as explained in the filtering and amplification paragraph.
Considering that the AD9241ASZ has 14 bits and is adjusted to measure between ±5 V, the resolution of the system without amplification is 610 µV.
Filtering and Amplification
The received signal is electronically amplified for each individual measurement by a factor of up to 150. The amplification gain is controlled by a variable resistor, which is controlled by the ADC board microprocessor.
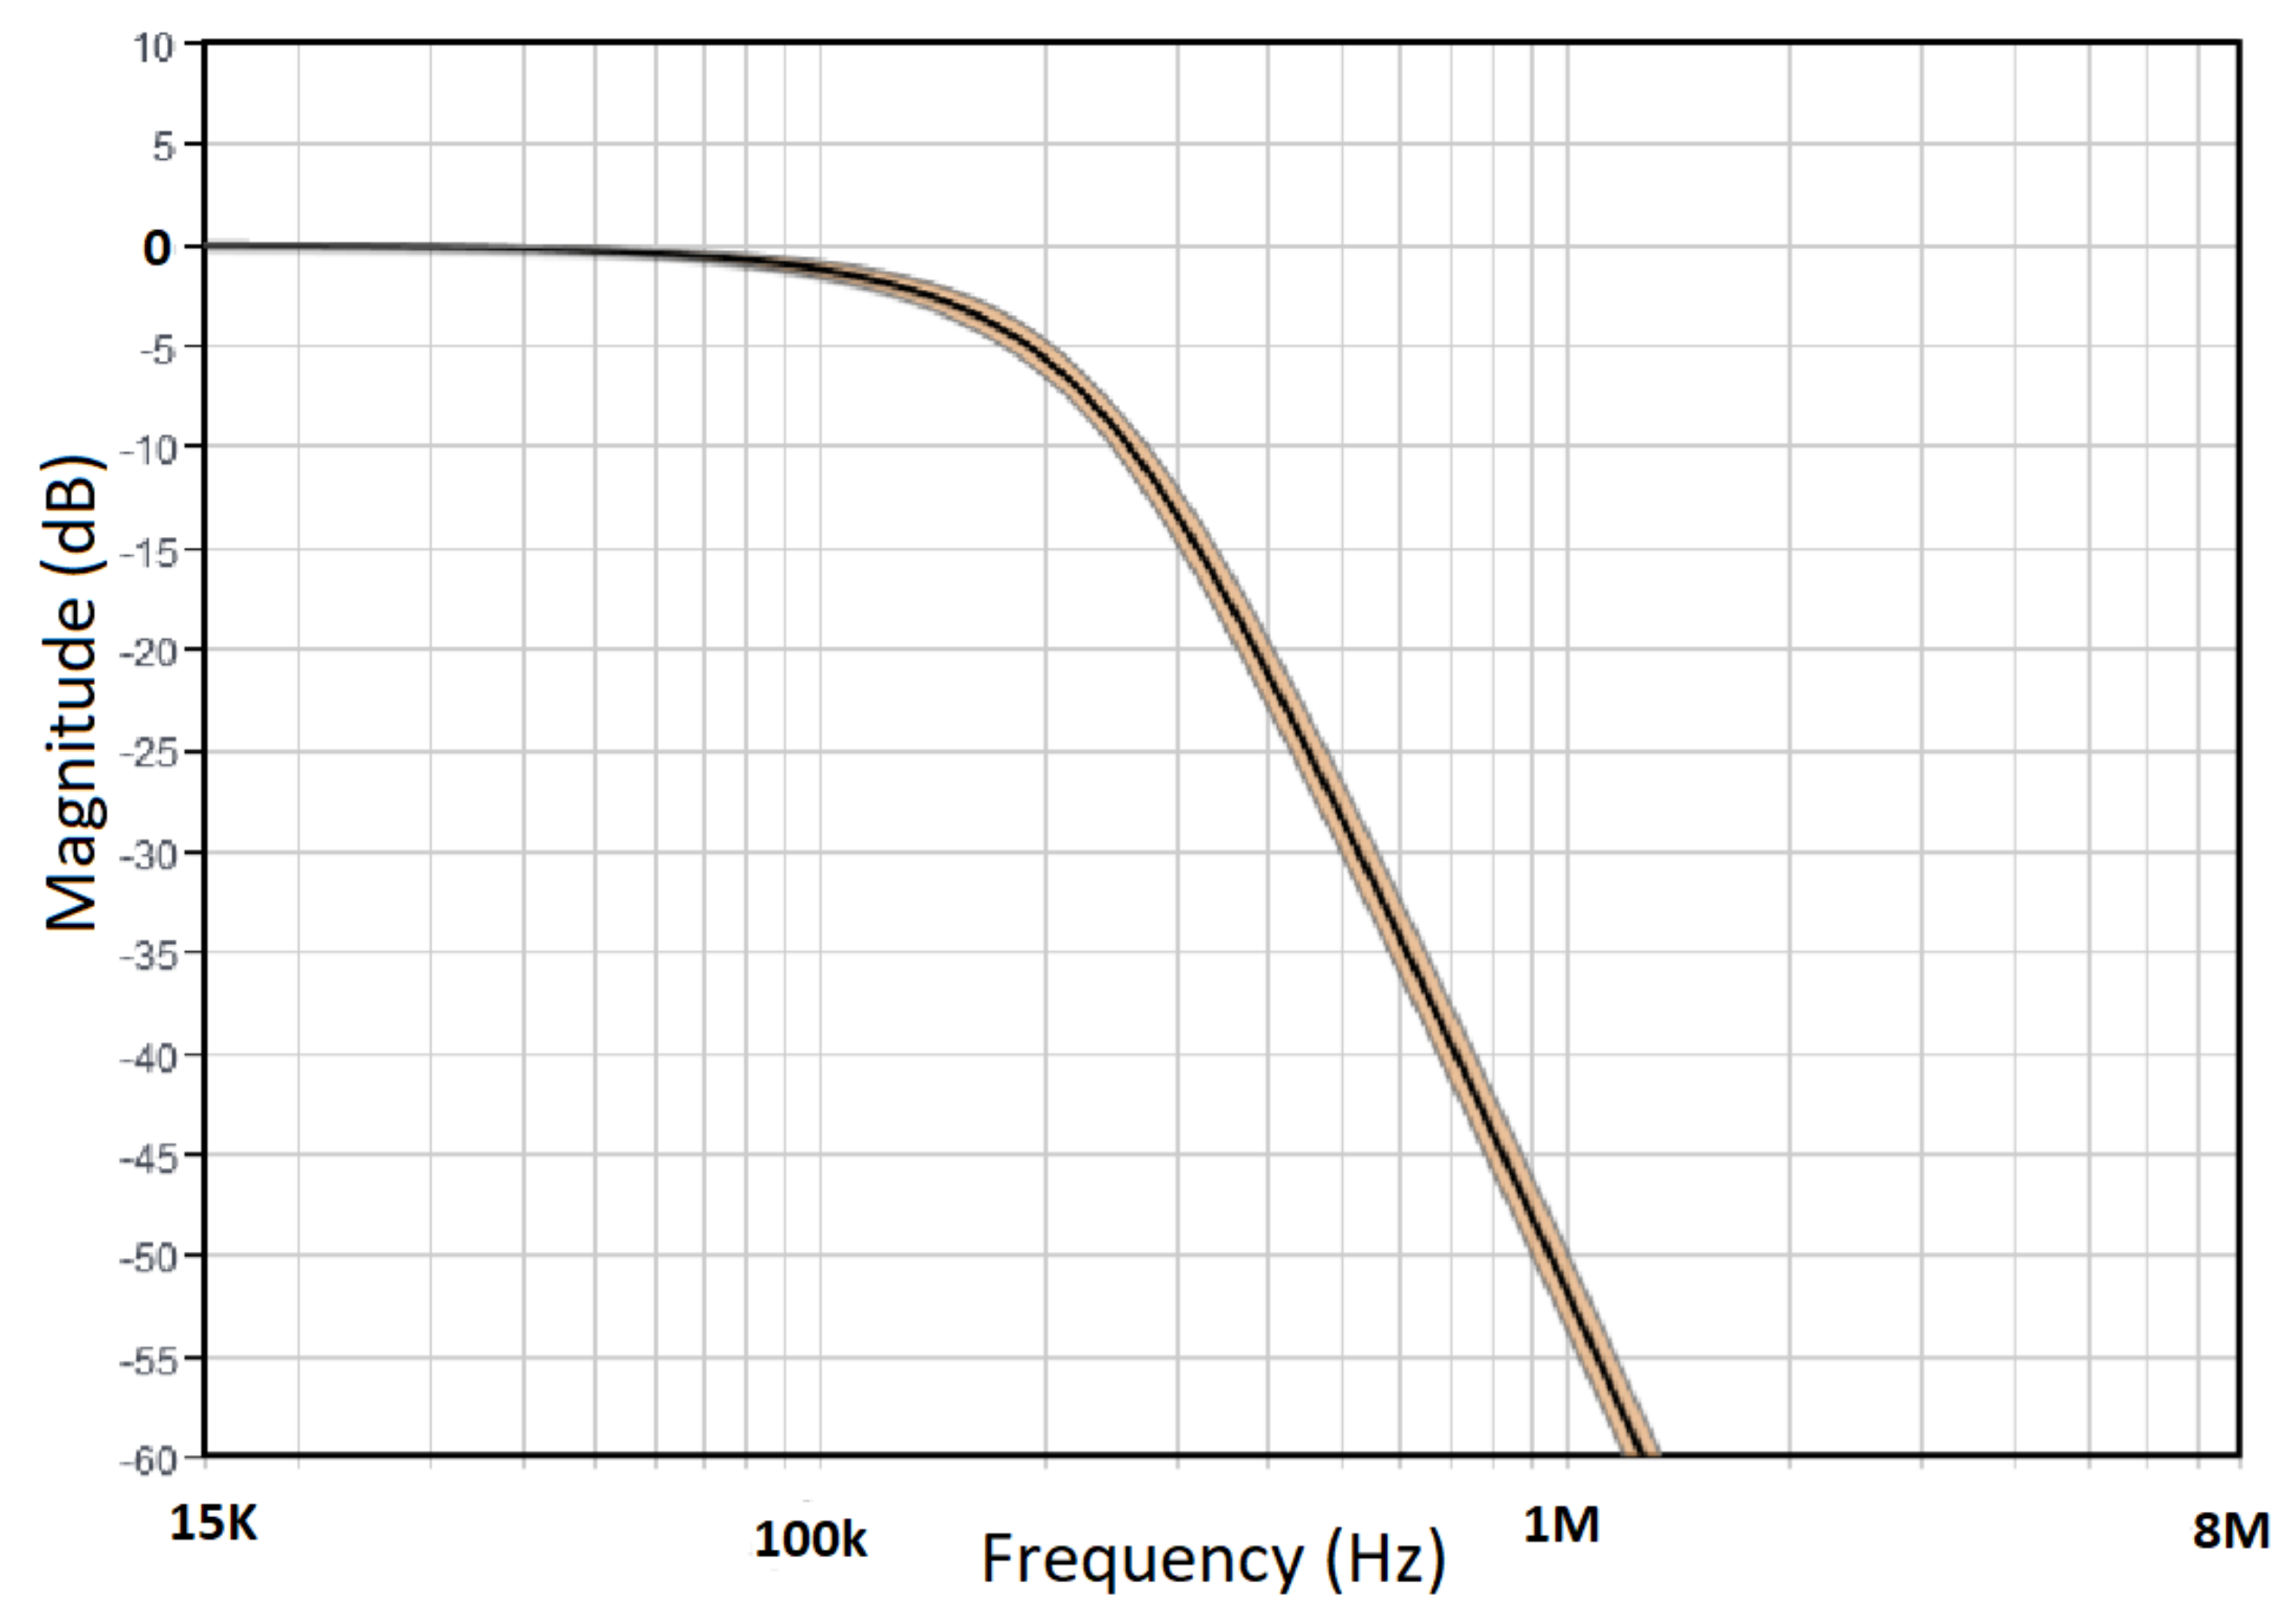
To prevent aliasing effects and to reduce noise, the received analog signal is filtered after amplification. The analog filter is located between the analog input to the ADC (Figure 8, number 2) and the output from the multiplexer (Figure 7, number 4). The filter and amplifier electronics are positioned on the ADC board, as shown in Figure 8, number 5. The filter used is a low-pass 4th order Bessel-Filter. This filter was chosen because of the small amount of overshoot compared to other filters, meaning that the signal will preserve the wave shape of filtered signals in the passband.
Figure 9 shows the calculated frequency response of the designed Bessel-Filter. As the system is supposed to work with piezoceramic ultrasonic sensors with a 60 kHz center frequency, the filter design results are in line with expectations. The input calculated specifications are: +Vs = 5 V, Vs = 0, GBW (gain–bandwidth product). Filter specifications are: Gain: 0 dB. Passband: −3 dB at 150 kHz, Stopband: −40 dB at 800 kHz. Component tolerances are: capacitor: 1 %; resistor: 0.5 %; inductor: 5 %; op amp GBW: 20 %.
2.7. Power Board
The power board is responsible for providing the desired voltage for the pulser board. It receives information from the Raspberry Pi via an I2C protocol, produces the chosen voltage, and is deactivated after the measurements.
In Figure 10, number 1, there are 2 LEDs and fuses to indicate the normal energy supply and to protect the 5 V and 3.3 V circuits. The blue fuse is for protection of up to 1 A for the 3.3V circuit and the green is for 2 A for the 5 V circuit. The other LEDs in Figure 10 (Numbers 2 and 3) serve to indicate the functionality in other circuits. Number 4 is the electronic connection to the pulser board. Number 5 is the transformer for the voltage capacitor charger controlled by the controller (Model LT3751 from Analog Devices), which is positioned in number 6. The main controller is the same as for the multiplexer board (MSP430G2303, number 7).
2.8. Pulser Board
The pulser board receives the user selected voltage from the power board and sends the pulse to the multiplexer board via the connectors indicated in Figure 11, number 2. The pulse frequency and triggering are digitally controlled from the ADC board. These commands are sent through the GPIO 20 with positive pulse reference and through the GPIO 21 with negative pulse reference, while the GPIO 16 is the trigger reference (GPIO 16, 20, 21, as seen in Figure 2). Briefly explained, the board is just waiting for a trigger signal to pulse the signal through the multiplexer. This board has no microprocessor due to its purely analogue function to replicate and amplify the received digital signal from the trigger input.
Figure 11, number 1 shows two LEDs which indicate whether energy is going through the 5 V and 3.3 V circuits. These circuits are also protected with the same fuse as the power board and multiplexer. These fuses are positioned at the left side of the LEDs. Number 2 is the connection to the multiplexer board and number 3 is the power voltage supply connection from the power board.
Pulse Signal
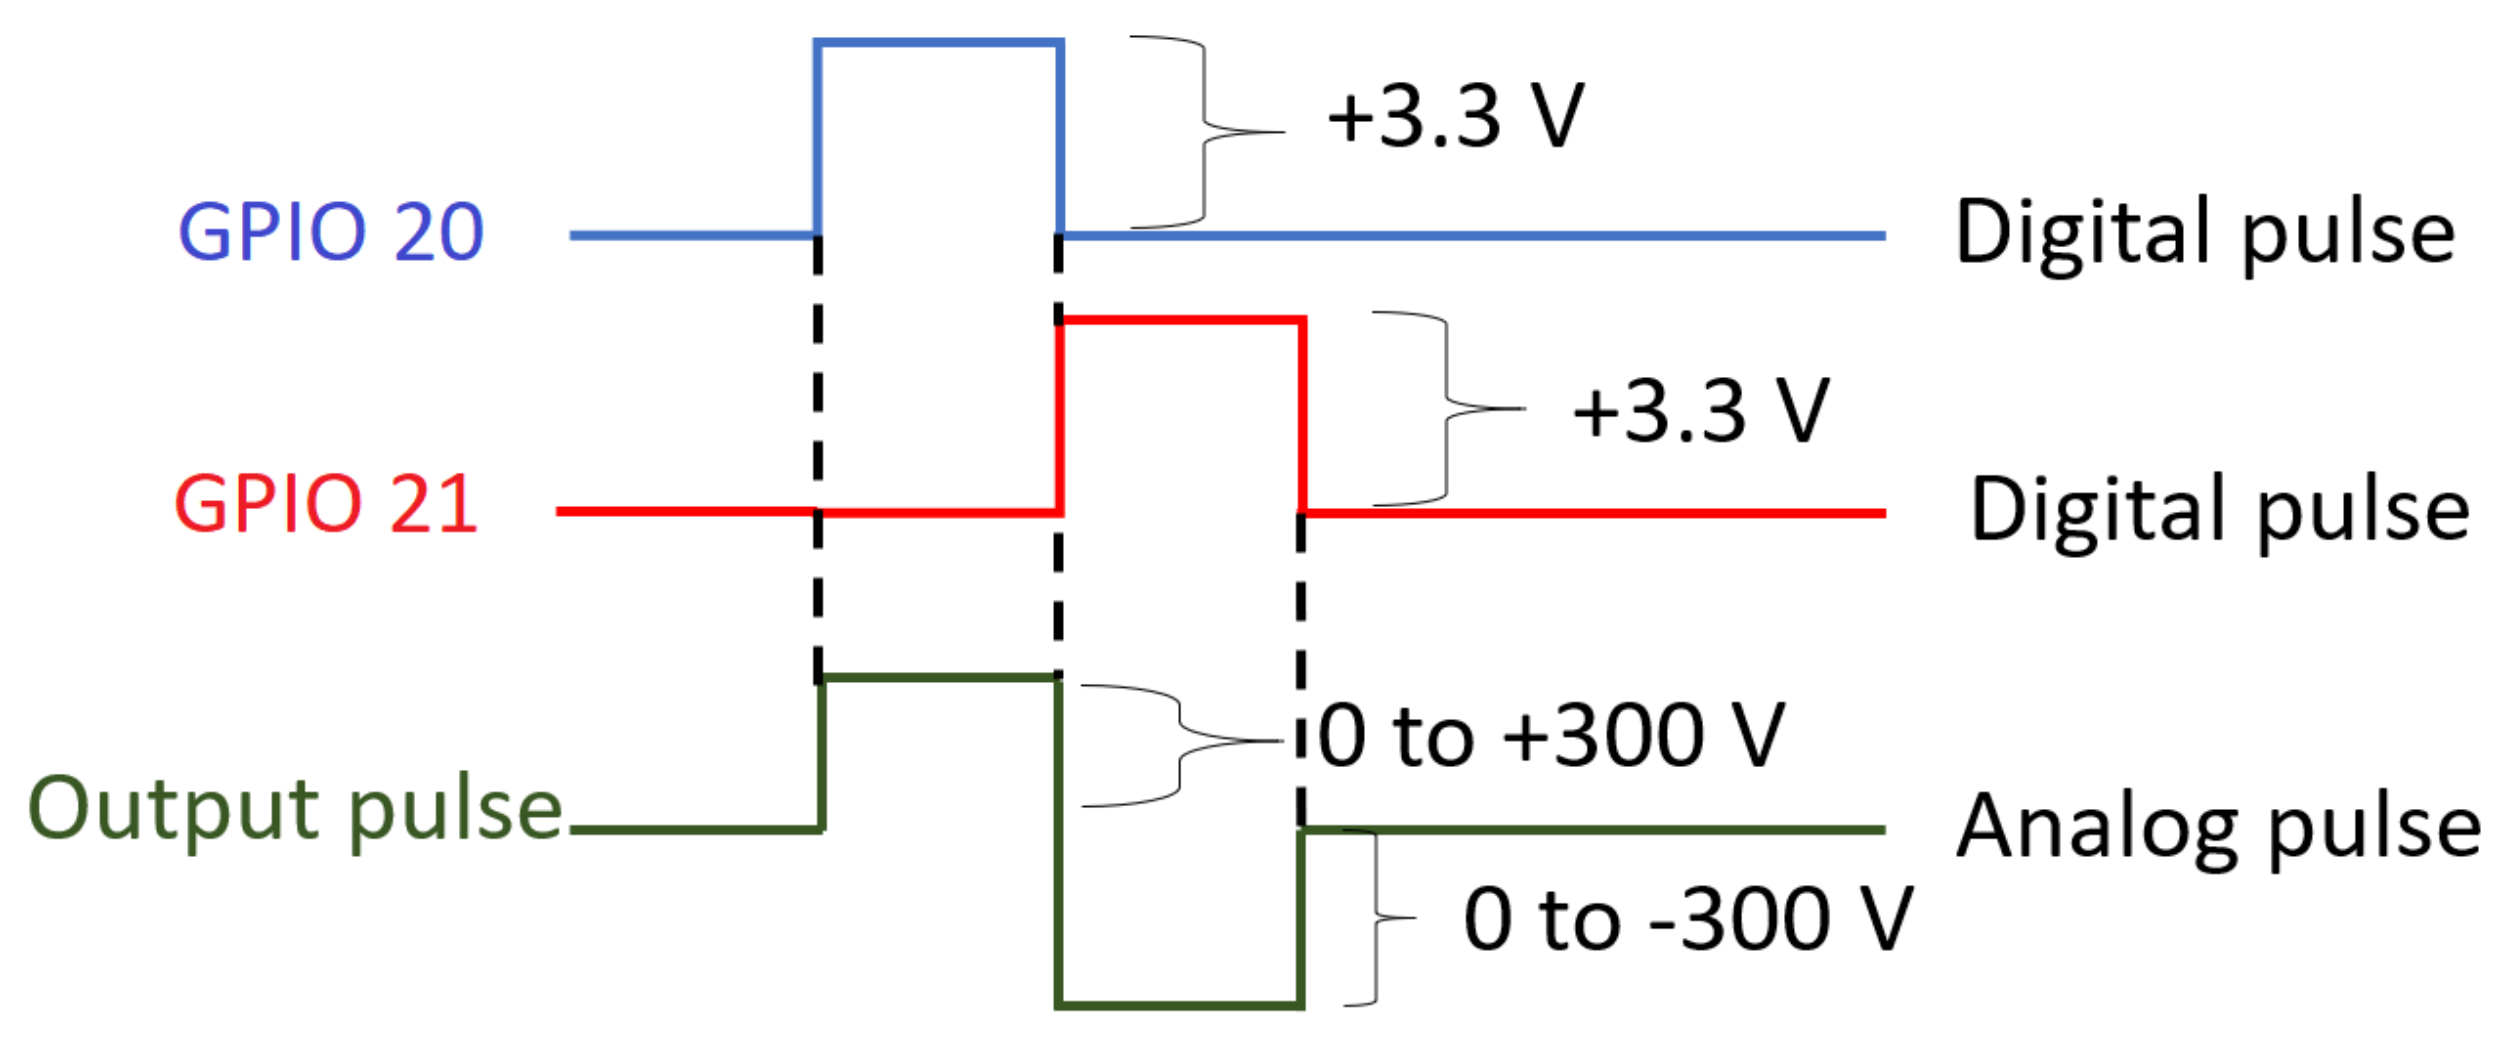
The square wave transmit pulse has been used in [15,16,17]. It is also widely used by commercial ultrasound measurement equipment. Because of the simplicity, comparability and ease construction of the pulse electronics, the square wave transmit pulse was chosen in this project as well. The format of the sent impulse is detailed in Figure 12, where it is labeled as the “Output pulse” and shown in green.
The length of the positive and negative parts of the output pulse are controlled by the digital signals GPIO 20 and GPIO 21, respectively, from the ADC board. These digital signals are shown in Figure 12 in blue and red, respectively. The analog pulse frequency and amplitude can be modified from 20 kHz up to 100 kHz, and the voltage up to ±300 V.
2.9. Temperature and Humidity Board
The temperature and humidity board is in its last stage of development. It can acquires values data from up top three temperature NTC 10K Ω sensors and one humidity sensor in each measurement cycle.
As can be seen in Figure 13, there are 5 outputs in the temperature board. Numbers 1, 2, and 3 show the connection to the temperature sensors. Number 4 (orange and brown cables) is the reference to the humidity sensor and number 5 (red and black cables) provides a specific voltage to the humidity sensor. Number 6 is the DIP switch in 1111, the I2C address of the board. Number 7 is the controller MSP430G2333.
The chosen temperature sensor (TT0210KC3-T105-1500 from TEWA sensors) was also used in the experiment described in [18]. It is weatherproof (IP68) and thus ready to be embedded into wet concrete due to stranded tinned copper and insulation. It works accurate between −50 ∘C and +105 ∘C, and only loses precision up to 0.02 ∘C per year, whereas a normal NTC sensor loses up to 0.2 ∘C per year. The humidity sensor chosen for our experiment is the Honeywell HIH-5031 because of its low energy demand, linearity, reliability, and an embedded hydrophobic filter. According to the NTC thermo sensor specifications and its developed electronics, it is possible to calculate its repeatability, within the range of −10 ∘C and +40 ∘C, of 0.5 ∘C for the temperature value. The accuracy has not been determined yet. The specified precision of the humidity sensor is 0.5%, and its accuracy is about 3% of the relative humidity values.
3. Results
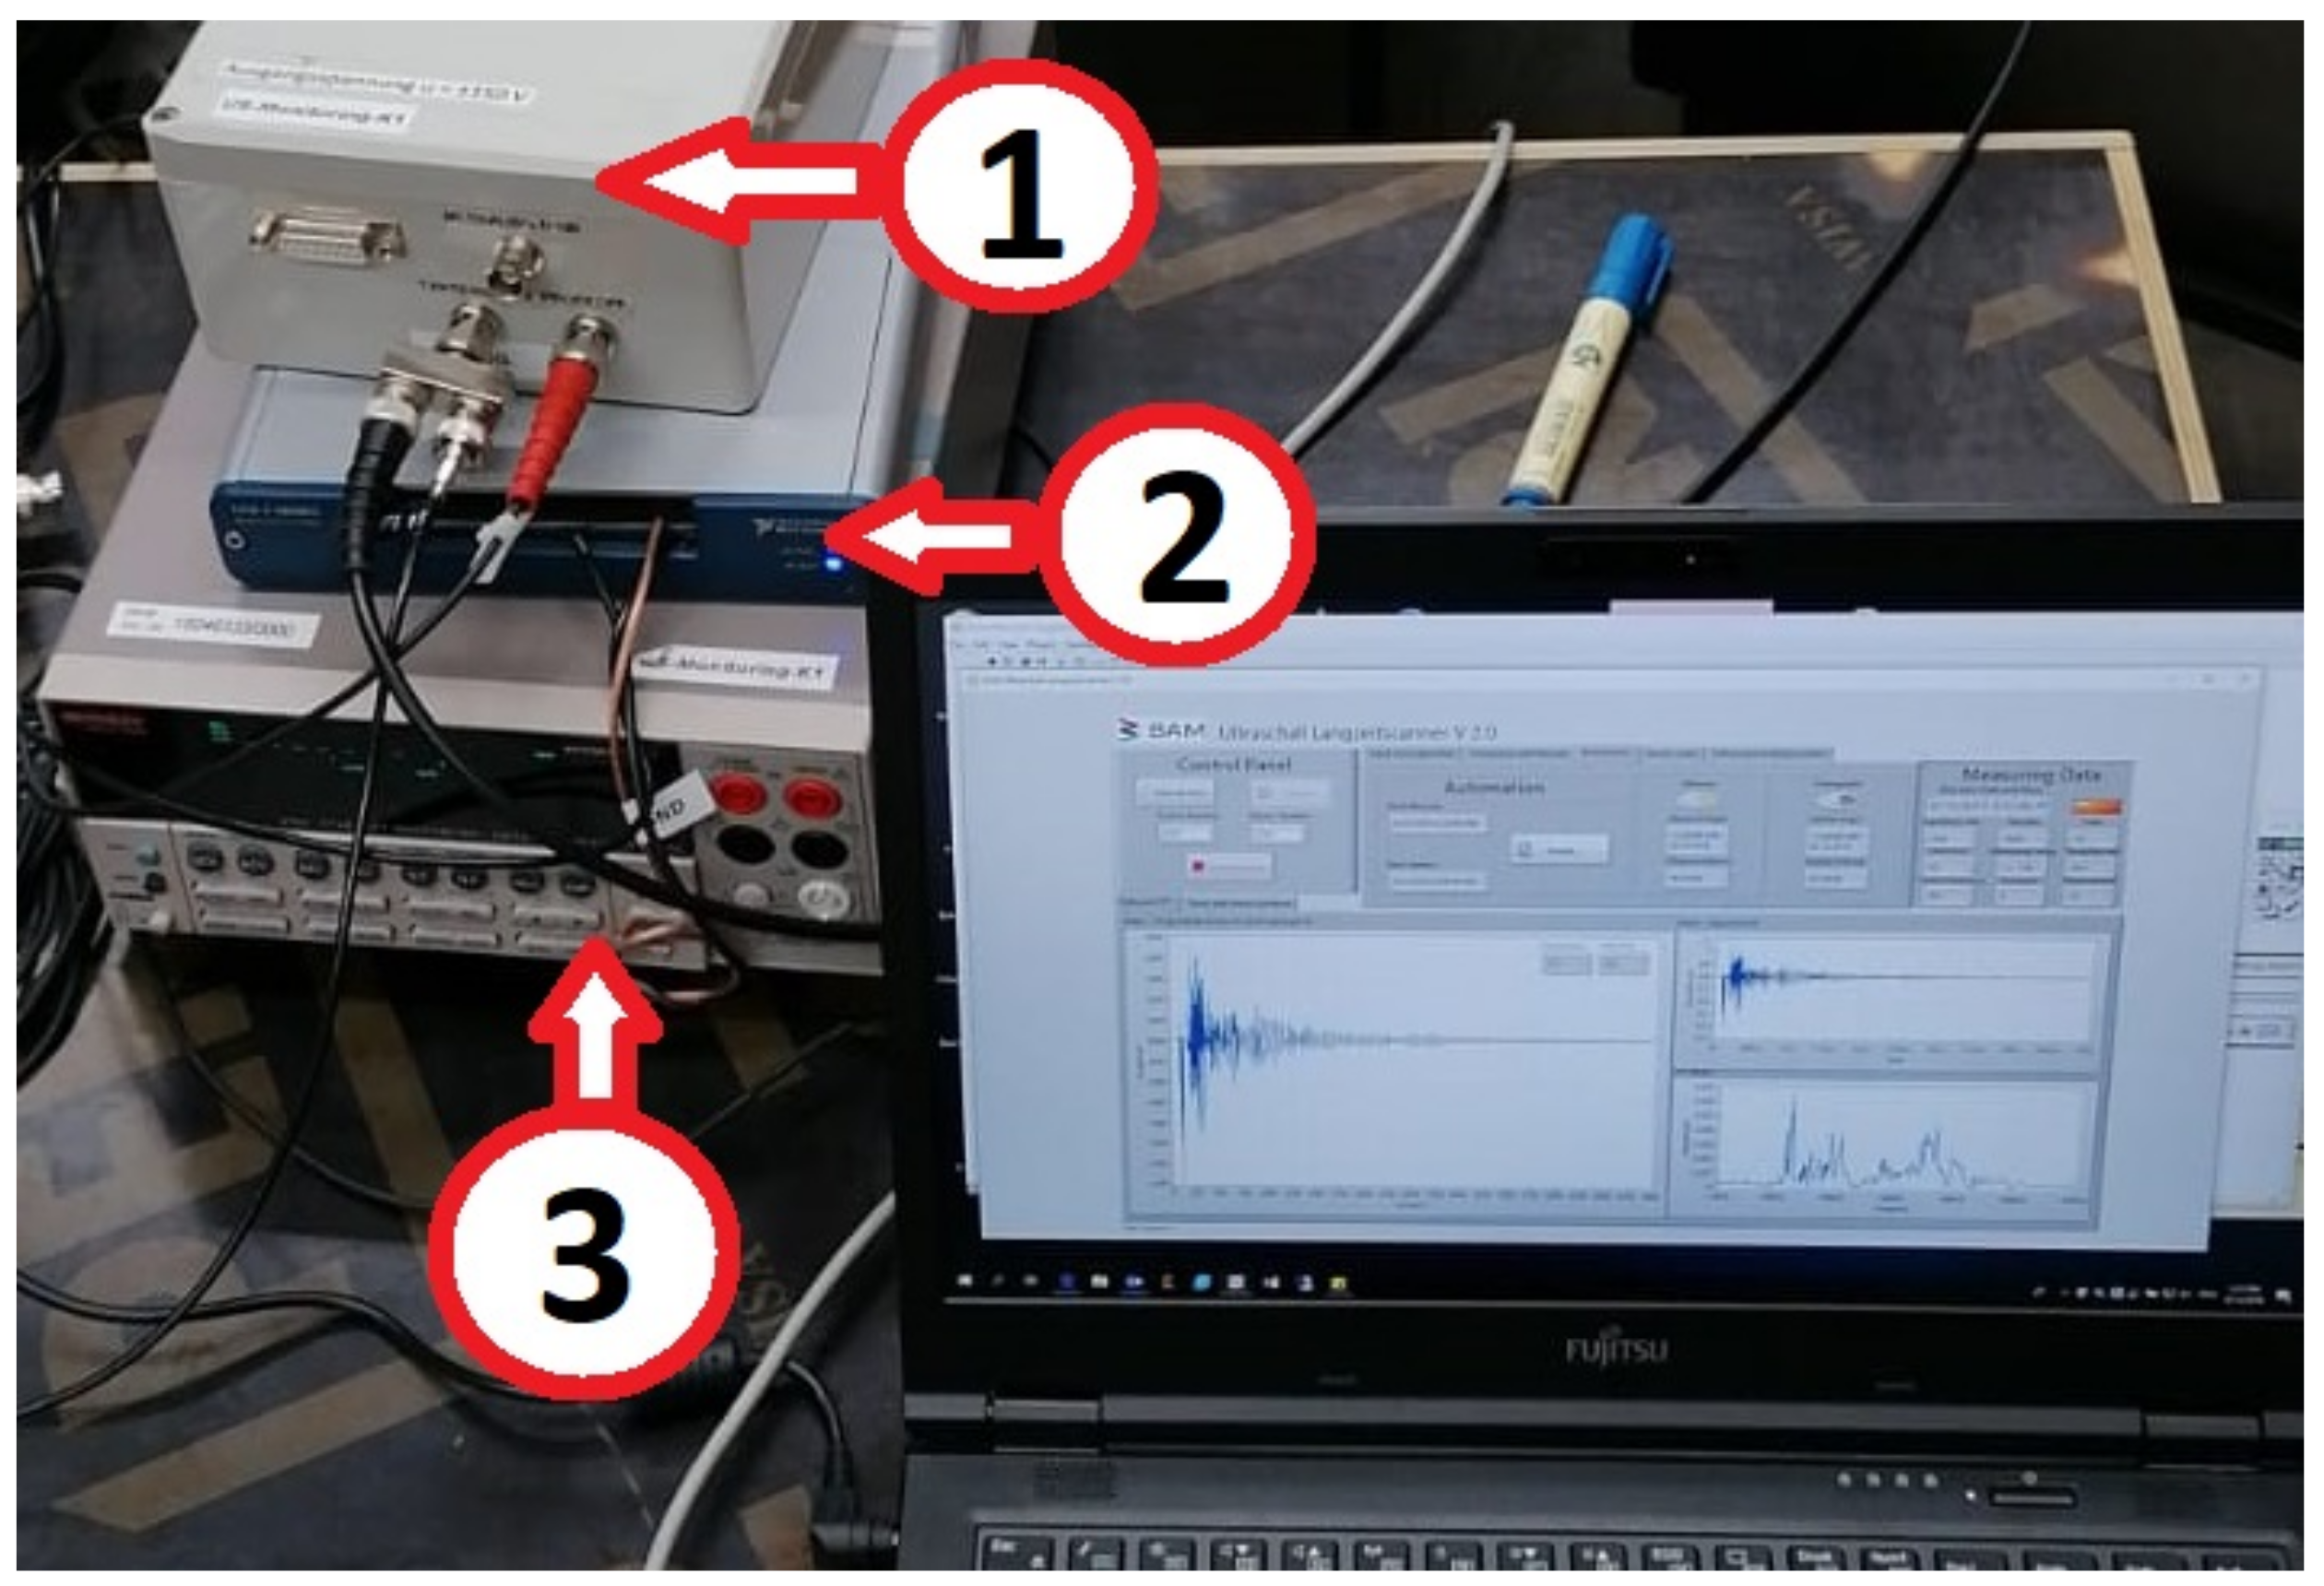
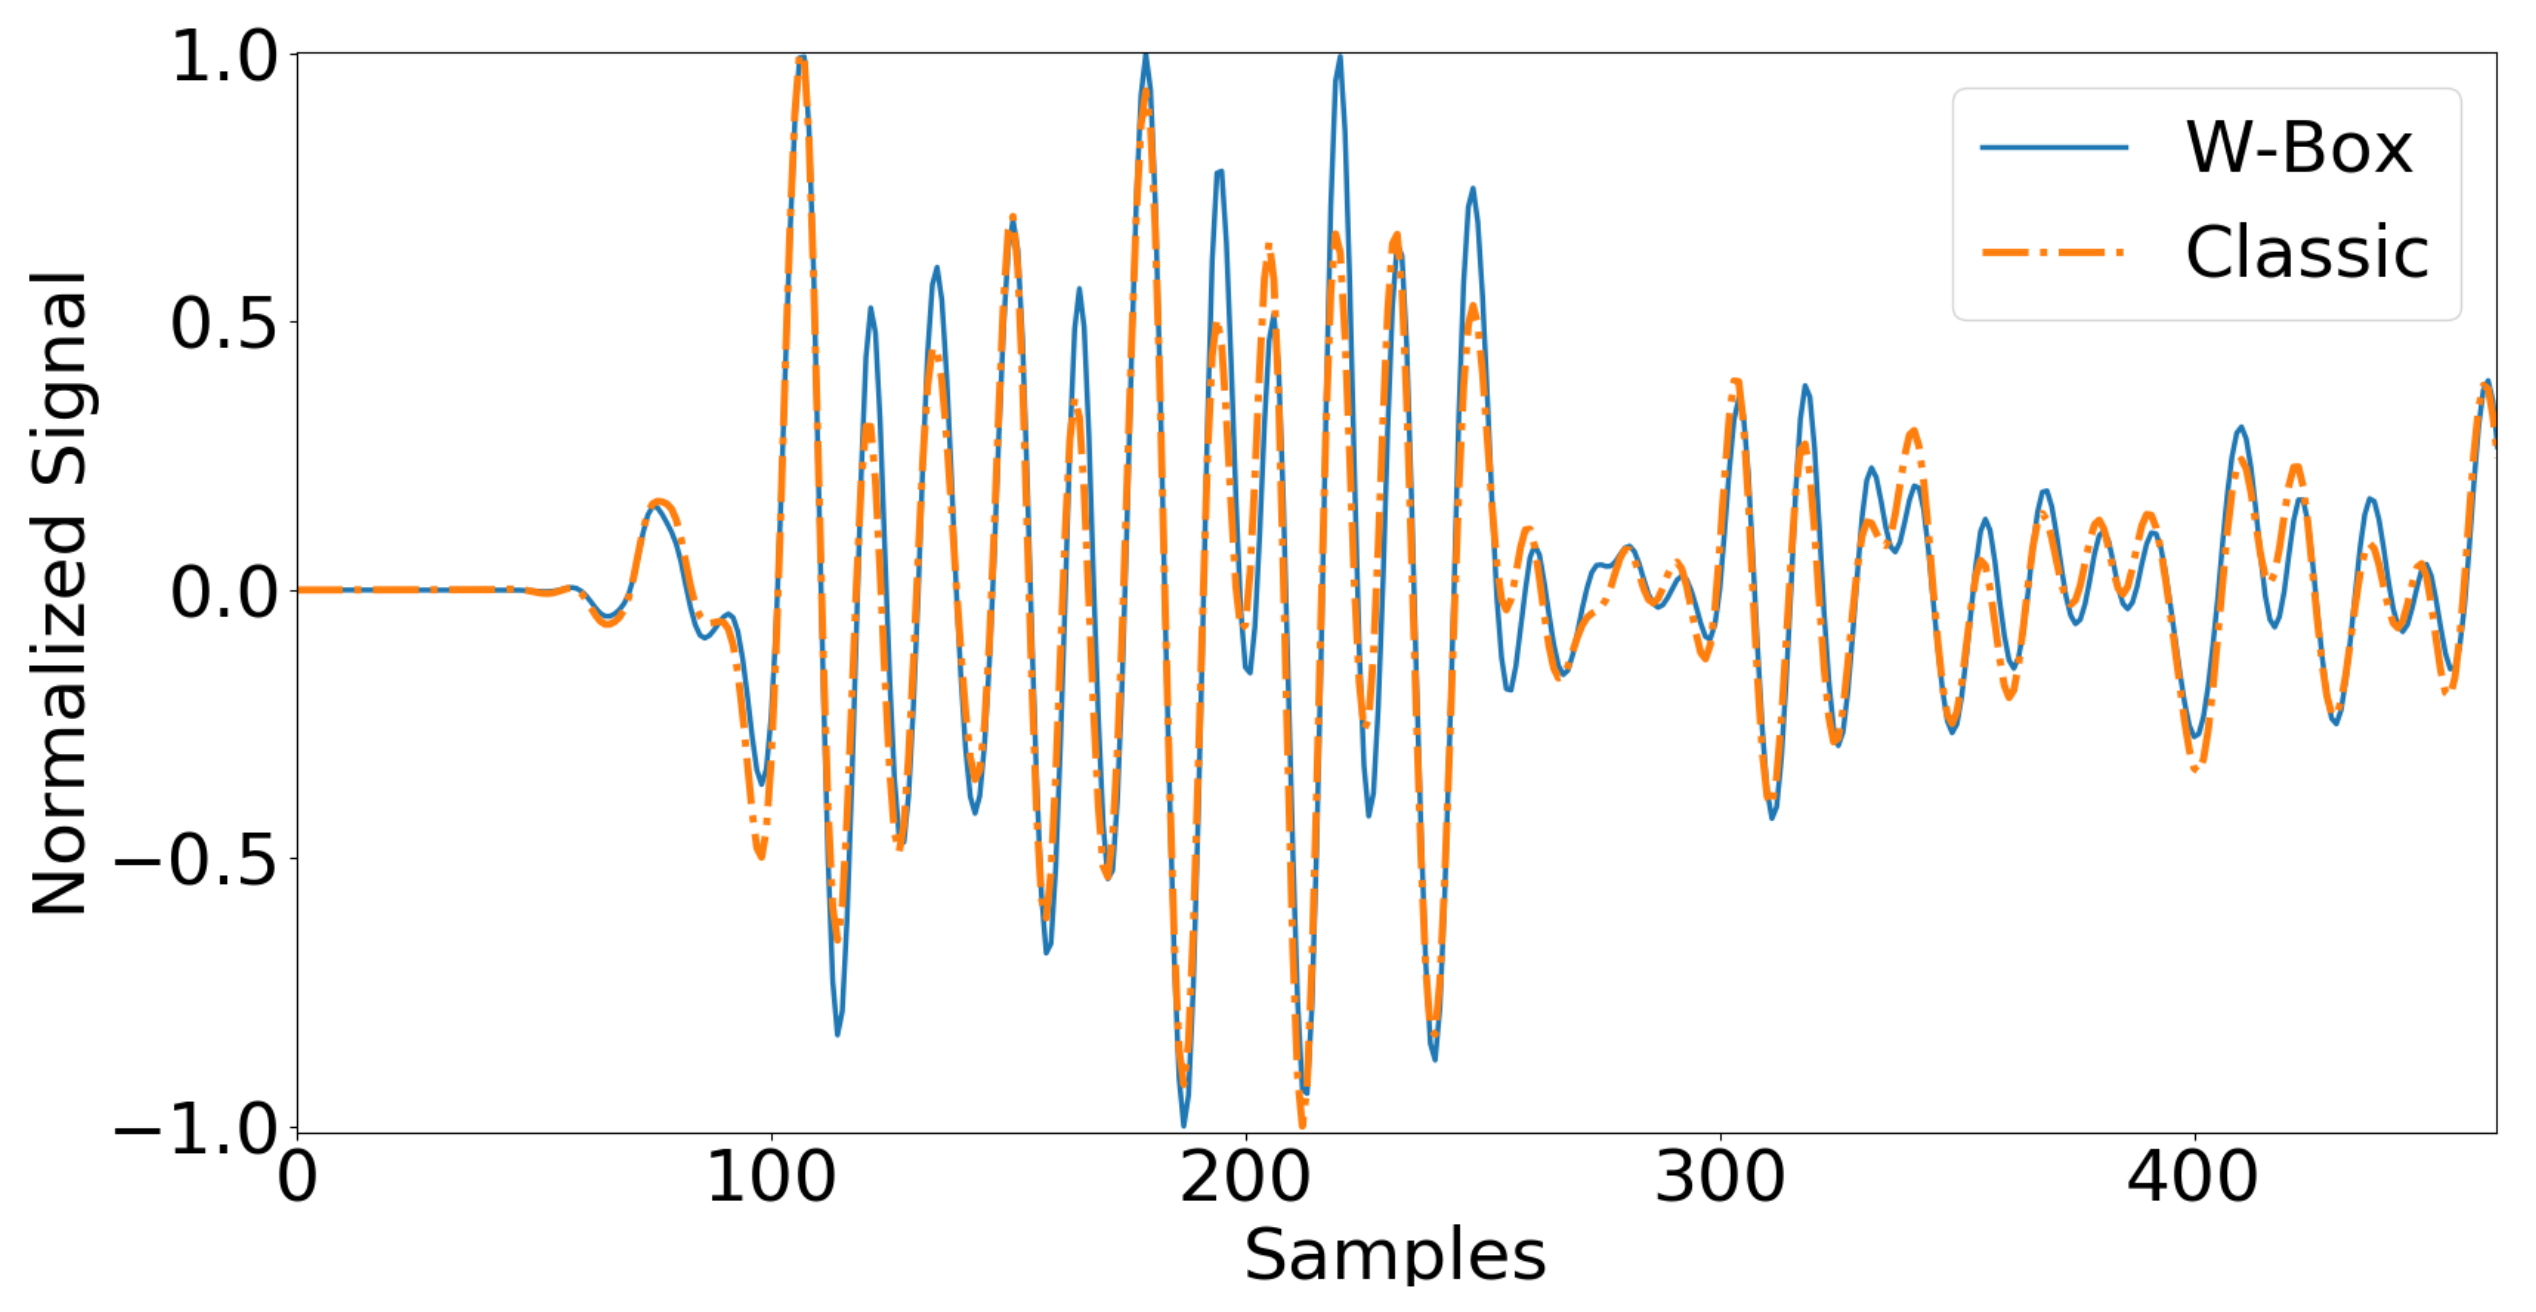
In order to prove the functionality and accuracy of the W-Box, we have compared the measurements acquired with this novel system to a state-of-the-art industrial grade measurement system. At BAM, US measurements are typically conducted with a National Instruments DAQmx 6361 ADC, a custom build pulse generator, a Keithley 2700 multiplexer and a Stanford Research Amplifier as described in [13]. In the following, we will compare results from both measurement systems and give an estimation of the measurement quality of the novel W-Box system. For this experiment, we used a concrete prism (40 × 10 × 10 cm) with two embedded ultrasonic sensors (see Figure 14 and Figure 15), the same as those used in [11,13,18]. In the following, the results from the NI system displayed in Figure 16 will be called “classic measurement”, or just “classic”, when comparing them to the measurements recorded with the W-Box.
In Figure 16, the classic measurement equipment is shown together with the computer and the measurement program: an analog signal amplifier (1), DAQmx (2), and Keithley 2700 multiplexer (3). Even though the DAQmx can measure up to 2 MHz, for this comparison experiment it was adjusted to 1 MHz, the same sampling frequency as the W-Box. It is also important to acknowledge that DAQmx can measure with 16-bit and the W-Box with 14-bit resolution. This results in a precision difference of 2 bits, resulting in 4 times more precision in amplitude for DAQmx measurements. The maximum pulse capacity is 150 Vpp for Classic, and 300 Vpp for the W-Box.
Data acquired using both classic instrumentation and the W-Box are pre-processed by a Python script to remove the offset, suppress crosstalk (crosstalk is expected at the beginning of each measurement because of the electric pulse), to perform digital filtering with a band-pass filter from 10 kHz up to 150 kHz (based on the expected frequency range from our transducers), and to remove the pre-trigger samples (first 50 samples for the W-Box and 100 samples for classic instrumentation). The signals are averaged 24-fold, temporally interleaved between both setups, for a period of approximately one hour at the same temperature and humidity.
For normalization of the graphs in Figure 17, the maximum received voltage values from both systems were acquired, showing the maximal voltage value of 0.270 Vpp for Classic and 0.513 Vpp for the W-Box. To compare the signals, it is necessary to use a regular method of error. According to [20], the root-mean-square error (RMSE) is a widely used equation to compare a measurement with a predicted model or reference measurement. Additionally, according to [21], some researchers recommend the use of the Mean Absolute Error (MAE) instead of RMSE. The method has some interpretability advantages over the RMSE. MAE is fundamentally the average magnitude of the errors and it is also easier to understand. One of MAE’s main characteristics is that each error influences in direct proportion to the absolute value of the error, which is not the case for RMSE. Due to this, both methods will be used. Both errors are calculated after the normalization and adjustment of the two graphs in order to facilitate correct error correlation calculation.
The square roots of the differences between Classic measurements values and W-Box values for each sample are the quadratic mean of these differences, as the Equation (1) shows.
Quite similar to RMSE, MAE (Equation (2)) is calculated with the average of the squares of the errors, corresponding to the expected value of the squared error loss. In both equations, and represent the value read on each of the compared measurement systems in the same time interval. n represents the total number of data measurements (for this measurement 5000 samples).
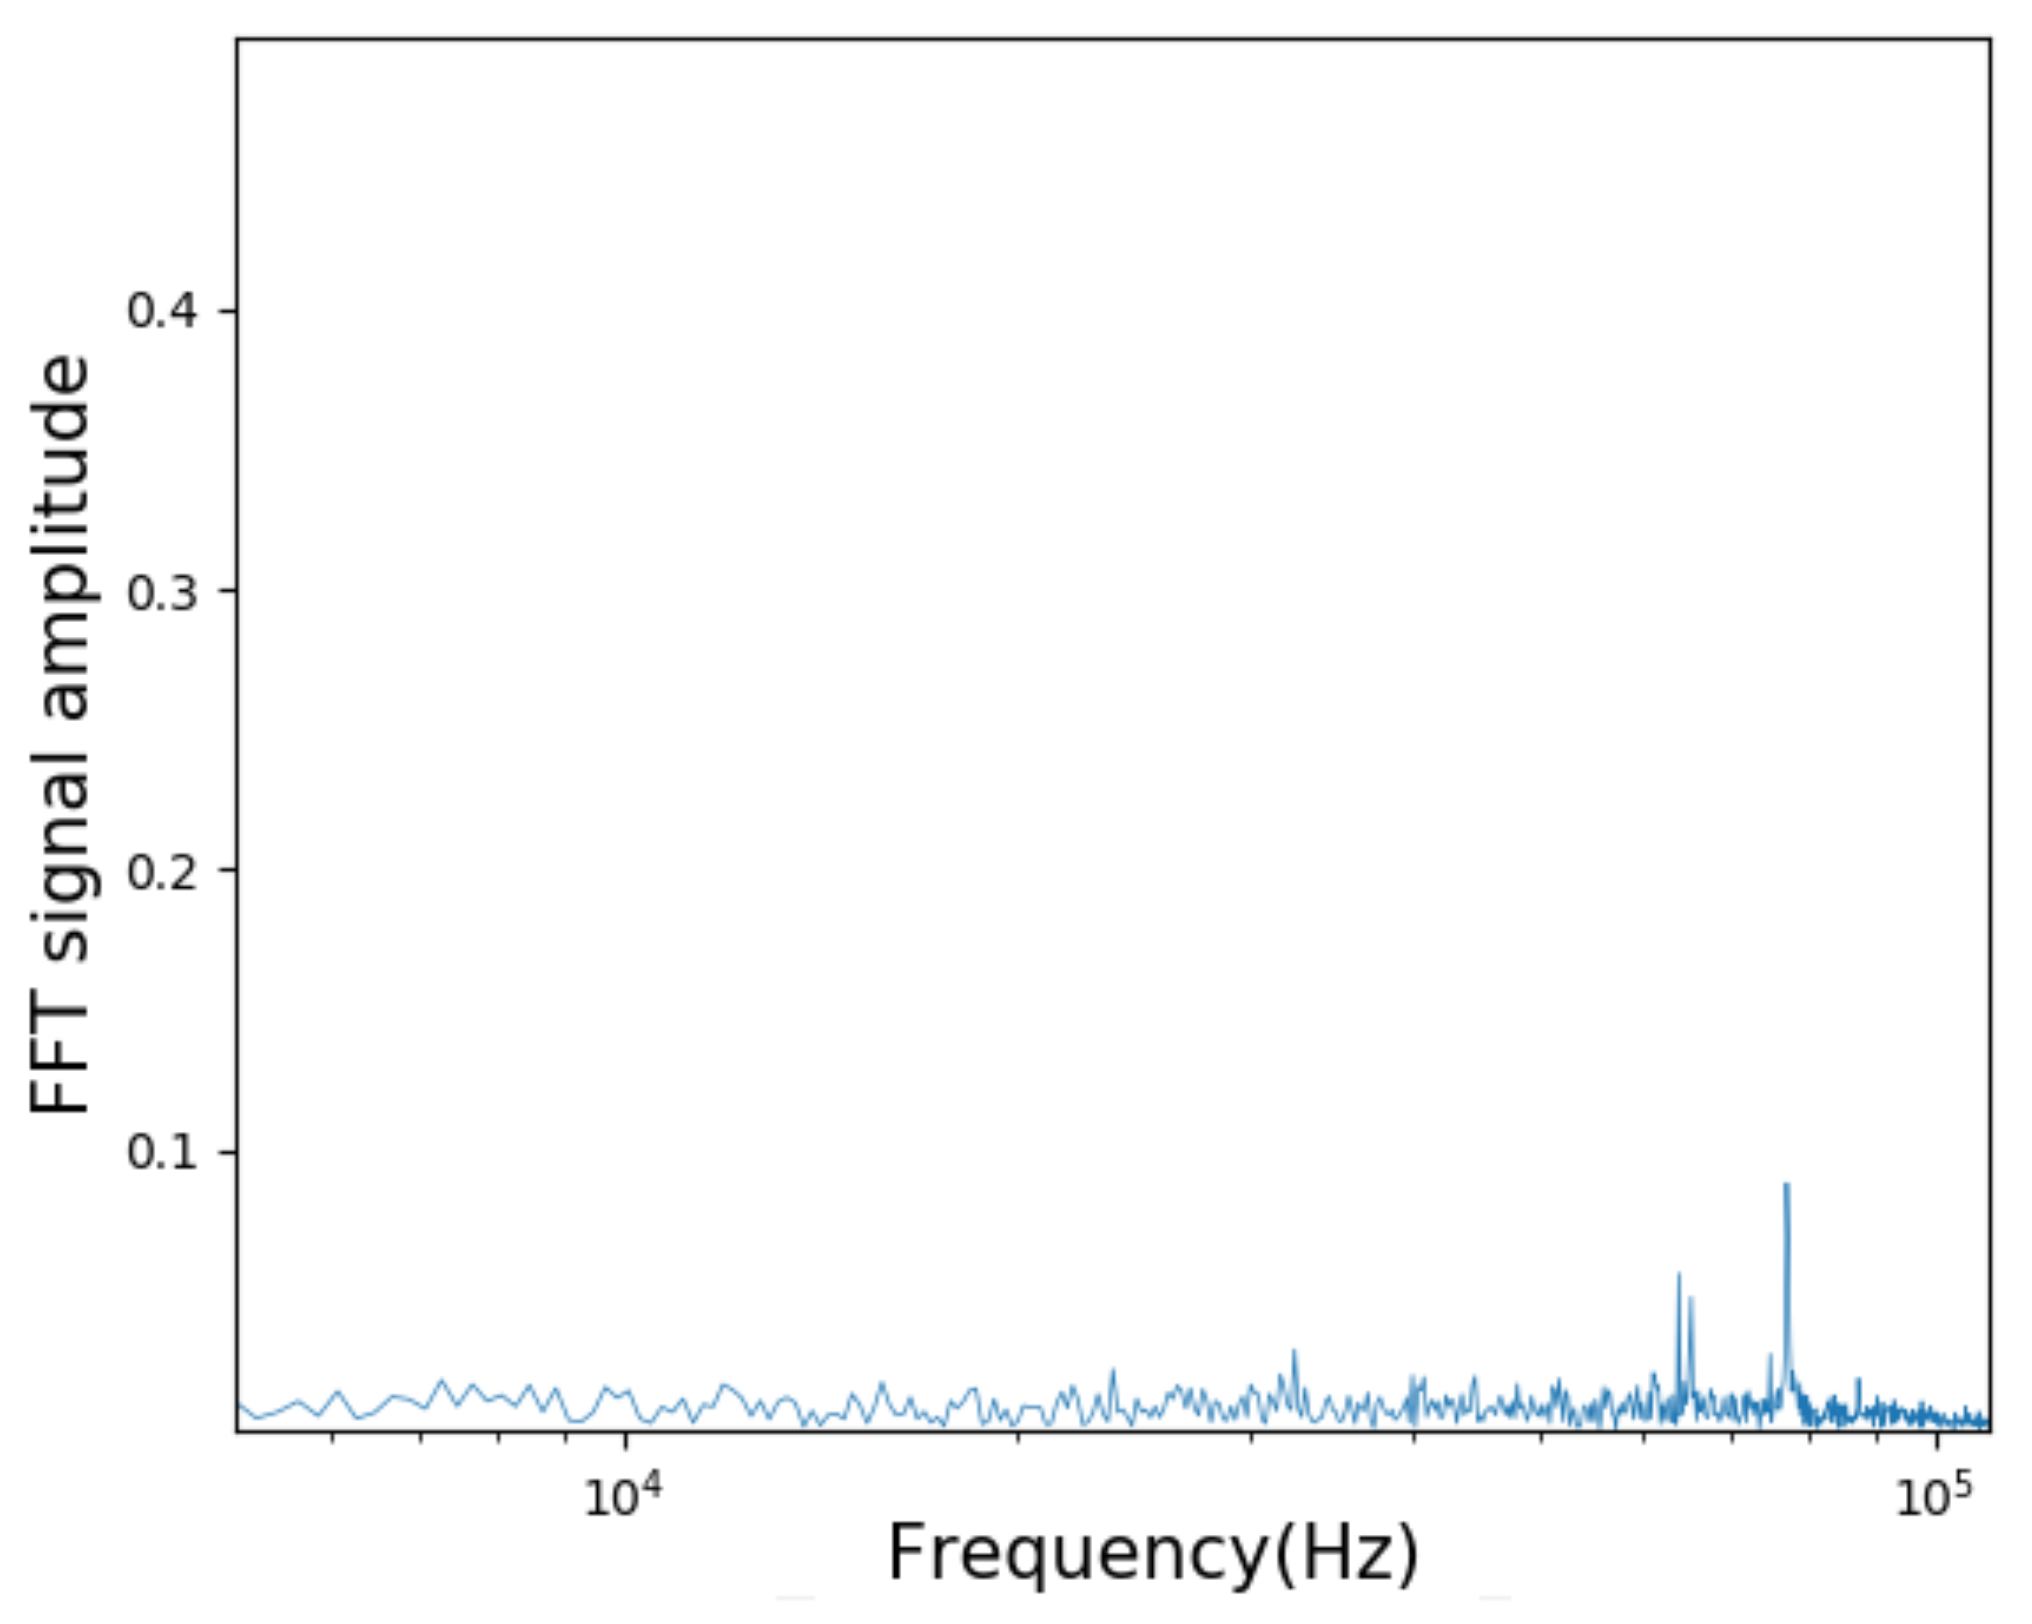
In order to assess the sensibility of the system, a white measurement was made to assess the noise floor of the system. Figure 18 shows the Fast Fourier Transform (FFT) of the raw signal in the frequency range of interest between 5 kHz to 110 kHz. The noise of the raw data is oscillating around ±1.22 mV, well below any actual signals.
According to [15,19,22], a signal to noise ratio of 2:1 is required to clearly identify the maximum of a signal. Therefore, we assume that the sensitivity of the W-Box system is twice the system noise. Considering the measured white noise raw data ±1.22 mV, the sensitivity is ±2.44 mV. After maximal amplification of 150-fold, a sensibility of approximately 16.2 µV is calculated.
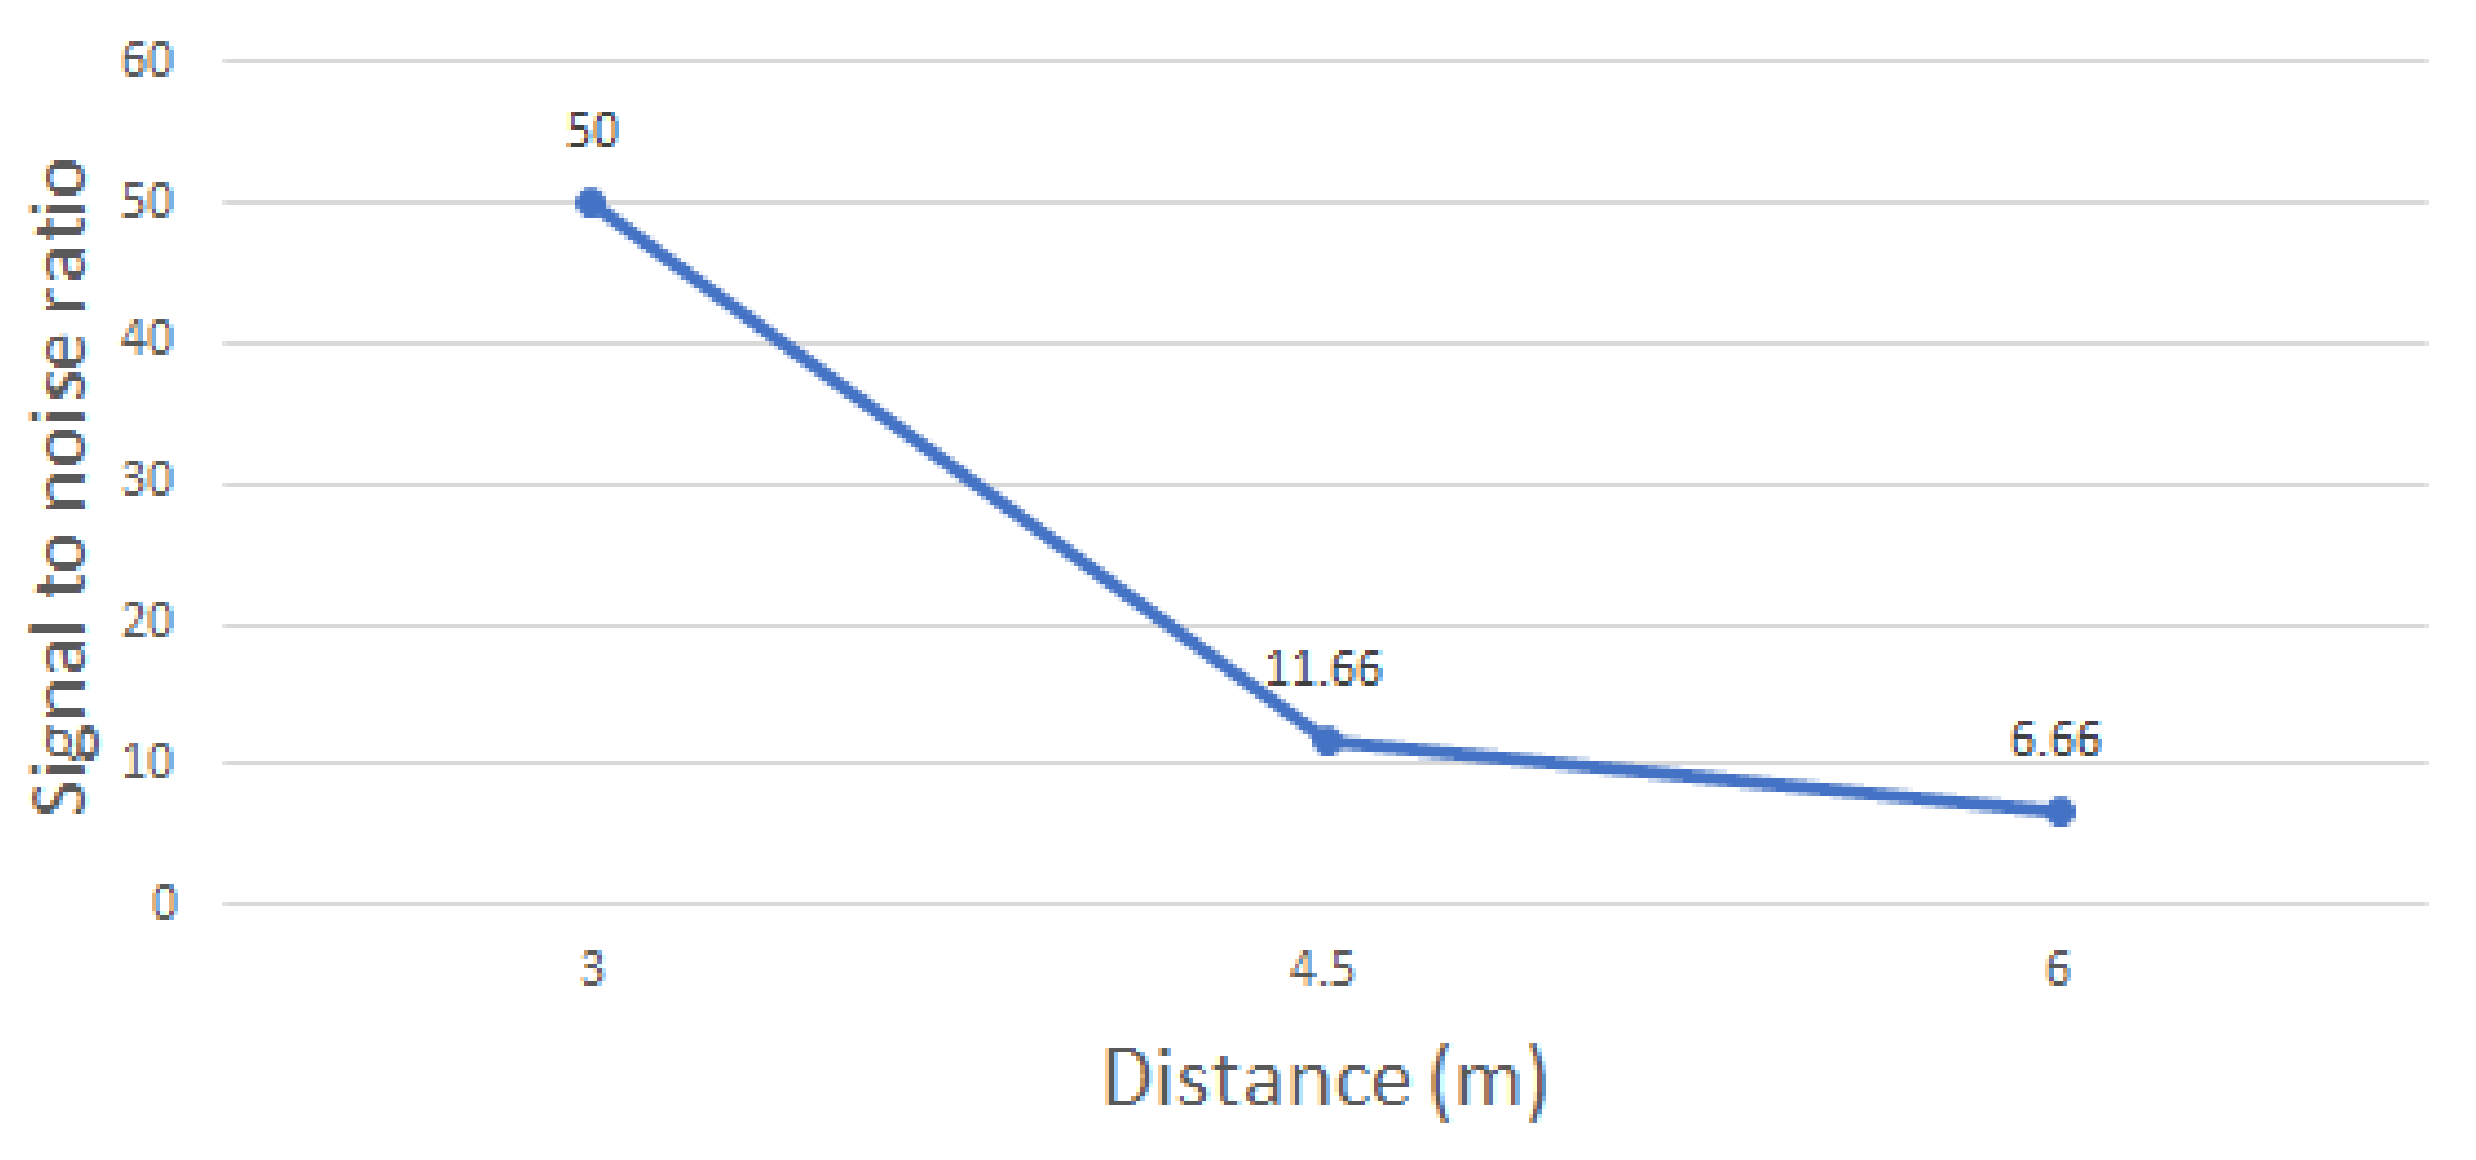
To demonstrate the real measurement limits of the transducers with the W-Box, a preliminary field test was made. With full power and amplification, the signal to noise ratio was calculated and compared with the transducer’s distance. This is shown in Figure 19.
4. Discussion
The discussion focuses on the comparison between a reliable reference and the W-Box. The reliable reference used is a DAQmx from National Instruments and is in this paper referred as classic measurement device. The error results from the last section indicate 4.0% error with the RMSE method and 2.1% error with the MAE method. Regarding differences that spread the error, such as precision differences (14 bits for the W-Box ADC board and 16 bits for DAQmx) and different signal amplifiers, the calculated errors demonstrate satisfactory readability. The noise floor in Figure 18 is considerably low, despite the small peak at around 78 kHz.
The amplification limits in the field will be discussed in future articles with ongoing experiments. However, preliminary tests have shown that measurements at a distance of 6 m can achieve a signal to noise ratio of 6.7. This value exceeds the maximum reached in previous experiments using the same sensors, such as [11,13,19].
One point to acknowledge is that the new system is comparatively slower than the traditional system. This is because it has multiple boards depending on the I2C protocol to communicate. The higher the demand for samples, the longer the time to perform a measurement, which can vary from 5 to 20 s per measurement pair. A possible solution to speed up the measurements is to change the communication protocol of the ADC board from I2C to SPI. Replacing the relays for solid state high-voltage transistors could also greatly increase the measurement speed. However, these are suggestions for the next generations of the W-Box if increasing the speed of measurement is necessary. Since the development of the temperature measurement system, several W-Boxes have been used in experiments. The temperature measurement system works well and with the calculated precision [23]. In a long-term bridge monitoring experiment, which was ongoing at the time this paper was written, the W-Box worked well even after several months. The system for sending data to the external server also worked correctly, as did the auto start system after a power outage in field tests.
Industrial equipment such as Consonic C2 (GS, ES and KS versions) from Geotron, V-Meter MK IV from James Instruments and Pundit Lab(+) from Prosec are available on the market. All of them exceed the W-Box in acquisition speed and other technical areas. Nevertheless, the W-Box has some significant advantages. Its design and the open source concept allow minimizing costs and simple reproduction, while the commercial systems are often more than 10,000 Euros, with limitations to raw data access, compatibility to different sensors and limited channels. The W-Box can measure up to 75 channels, be easily adapted to ones needs and integrated in, e.g., student projects, and other academic and teaching areas. The compact and robust design, combined with the open linux operating system allows monitoring experiments in remote locations and easy and cost efficient maintenance. The W-Box is not considered an industrial equipment, as it has no industrial certifications and no protection against vibration or electromagnetic induction.
5. Conclusions
In terms of the objective of developing a system capable of ultrasonic monitoring with comparable performance to what is available on the market, the W-Box project has fulfilled the expectations. All project requirements were met and the durability and repeatability of the W-Box measurements, which have been used in research at BAM and our CoDA research partners for the past year, demonstrate system reliability. Just considering the parts and materials, the final cost for a 20-channel system with a temperature board is around € 450. The W-Box project will be published on GitHub with all the files for building the electronics and the necessary codes for the microprocessors and Raspberry Pi.
Author Contributions
Conceptualization, D.F.B.; methodology, D.F.B.; software, D.F.B.; validation, D.F.B. and N.E.; resources, E.N.; writing—original draft preparation, D.F.B.; writing—review and editing, N.E. and E.N.; visualization, D.F.B.; supervision, E.N.; project administration, E.N.; funding acquisition, E.N.; All authors have read and agreed to the published version of the manuscript.
Funding
This research was funded by the German Research Foundation (DFG) funding project FOR 2825.
Institutional Review Board Statement
Not applicable.
Informed Consent Statement
Not applicable.
Data Availability Statement
Not applicable.
Acknowledgments
The W-Box concept is based on an idea of Herbert Wiggenhauser and was initiated as a student project of Florian Knopp, supervised by Frank Mielentz.
Conflicts of Interest
The authors declare no conflict of interest.
References
- C597-02, A. Standard test method for pulse velocity through concrete. In Annual Book of ASTM Standards, American Society for Testing and Materials; ASTM International: West Conshohocken, PA, USA, 2002; Volume 4. [Google Scholar]
- Reinhardt, H.W.; Grosse, C.U. Report 31: Advanced Testing of Cement-Based Materials during Setting and Hardening-Report of RILEM Technical Committee 185-ATC; RILEM Publications: Bagneux, France, 2005; Volume 31. [Google Scholar]
- Thiele, M. Experimental Investigation and Analysis of Damage Evolution in Concrete Due to High-Cycle Fatigue Loading. Ph.D. Thesis, Technische Universität Berlin, Berlin, Germany, 2015. [Google Scholar]
- Payan, C.; Garnier, V.; Moysan, J. Potential of nonlinear ultrasonic indicators for nondestructive testing of concrete. Adv. Civil Eng. 2010, 2010. [Google Scholar] [CrossRef] [Green Version]
- Planès, T.; Larose, E. A review of ultrasonic Coda Wave Interferometry in concrete. Cem. Concr. Res. 2013, 53, 248–255. [Google Scholar] [CrossRef]
- Legland, J.B.; Zhang, Y.; Abraham, O.; Durand, O.; Tournat, V. Evaluation of crack status in a meter-size concrete structure using the ultrasonic nonlinear coda wave interferometry. J. Acoust. Soc. Am. 2017, 142, 2233–2241. [Google Scholar] [CrossRef] [PubMed]
- Zhang, Y.; Planès, T.; Larose, E.; Obermann, A.; Rospars, C.; Moreau, G. Diffuse ultrasound monitoring of stress and damage development on a 15-ton concrete beam. J. Acoust. Soc. Am. 2016, 139, 1691–1701. [Google Scholar] [CrossRef] [PubMed] [Green Version]
- Hafiz, A.; Schumacher, T. Monitoring of stresses in concrete using ultrasonic coda wave comparison technique. J. Nondestruct. Eval. 2018, 37, 1–13. [Google Scholar] [CrossRef]
- Niederleithinger, E.; Wang, X.; Herbrand, M.; Müller, M. Processing ultrasonic data by coda wave interferometry to monitor load tests of concrete beams. Sensors 2018, 18, 1971. [Google Scholar] [CrossRef] [PubMed] [Green Version]
- Wang, X.; Niederleithinger, E.; Lange, M.; Stolpe, H. Implementation of Ultrasonic Coda Wave Interferometry on a Real Bridge. Struct. Health Monitor. 2019, 2019. [Google Scholar] [CrossRef] [Green Version]
- Niederleithinger, E.; Wolf, J.; Mielentz, F.; Wiggenhauser, H.; Pirskawetz, S. Embedded ultrasonic transducers for active and passive concrete monitoring. Sensors 2015, 15, 9756–9772. [Google Scholar] [CrossRef] [PubMed] [Green Version]
- Knopp, F.; Mielentz, F.; Bernstein, T. Ultraschall-Messsystem für die Langzeitüberwachung von Betonkonstruktionen. In Proceedings of the DGZfP Jahrestagung 2019, Friedrichschafen, Germany, 27–29 May 2019. [Google Scholar]
- Wang, X.; Chakraborty, J.; Bassil, A.; Niederleithinger, E. Detection of multiple cracks in four-point bending tests using the coda wave interferometry method. Sensors 2020, 20, 1986. [Google Scholar] [CrossRef] [PubMed] [Green Version]
- The Robotics Back-End. Available online: https://roboticsbackend.com/raspberry-pi-3-pins/ (accessed on 15 January 2021).
- Krautkrämer, J.; Krautkrämer, H. Werkstoffprüfung mit Ultraschall; Springer: Berlin, Germany, 2013. [Google Scholar]
- Tietze, U.; Schenk, C. Halbleiter-Schaltungstechnik; Springer: Berlin, Germany, 2013. [Google Scholar]
- Mielentz, F.; Krause, M.; Wüstenberg, H. Entwicklung einer Gruppenstrahler-Sendeeinheit für Ultraschalluntersuchungen von Betonbauteilen. DGZfP-JAHRESTAGUNG 2002. Available online: https://www.ndt.net/article/dgzfp02/papers/v44/v44.htm (accessed on 18 May 2021).
- Epple, N.; Barroso, D.F.; Niederleithinger, E. Towards Monitoring of Concrete Structures with Embedded Ultrasound Sensors and Coda Waves—First Results of DFG for CoDA. In European Workshop on Structural Health Monitoring; Springer: Berlin, Germany, 2013; pp. 266–275. [Google Scholar]
- Wolf, J. Schadenserkennung in Beton Durch Überwachung mit Eingebetteten Ultraschallprüfköpfen. Ph.D. Thesis, Universität Potsdam, Potsdam, Germany, 2017. [Google Scholar]
- Hyndman, R.J.; Koehler, A.B. Another look at measures of forecast accuracy. Int. J. Forecast. 2006, 22, 679–688. [Google Scholar] [CrossRef] [Green Version]
- Pontius, R.G.; Thontteh, O.; Chen, H. Components of information for multiple resolution comparison between maps that share a real variable. Environ. Ecol. Stat. 2008, 15, 111–142. [Google Scholar] [CrossRef]
- Merkblatt B 04. Ultraschallverfahren zur Zerstörungsfreien Prüfung im Bauwesen. Deutsche Gesellschaft für Zerstörungsfreie Prüfung e.V. -DGZfP-, Fachausschuss Zerstörungsfreie Prüfung im Bauwesen, Unterausschuss Ultraschallprüfung. 2018. ISBN 978-3-940283-98-6. Available online: https://www.baufachinformation.de/merkblatt-b-04/buecher/252875 (accessed on 18 May 2021).
- Epple, N.; Fontoura Barroso, D.; Hau, J.; Epple, N. Accounting for Long Term Environmental Influences on Ultrasonic Monitoring Measurements of Reinforced Concrete Constructions with Embedded Transducers; Accepted for SHMII 10, July 2021; Porto, Portugal.
Figure 1.
The W-Box. The 3D-printed pink side panel holds 20 BNC transducer connectors.

Figure 2.
Schematic zoom of the Raspberry Pi 3 B+ pins. Adapted from [14].
Figure 2.
Schematic zoom of the Raspberry Pi 3 B+ pins. Adapted from [14].

Figure 3.
W-Box communication schematic. The gray boxes represent each circuit of the W-Box and the colored arrows the communication between them.
Figure 3.
W-Box communication schematic. The gray boxes represent each circuit of the W-Box and the colored arrows the communication between them.

Figure 4.
Interior view of the W-Box, after removing the top and rear cover. 1 and 2: Electronic connections between the circuits. 3: Power board. 4: Pulser board. 5: Four multiplexer boards. 6: ADC (Analog-to-digital converter) board. 7: Raspberry Pi.
Figure 4.
Interior view of the W-Box, after removing the top and rear cover. 1 and 2: Electronic connections between the circuits. 3: Power board. 4: Pulser board. 5: Four multiplexer boards. 6: ADC (Analog-to-digital converter) board. 7: Raspberry Pi.

Figure 5.
Rear photo of the W-Box electronics without the protective case. Right: rear side of BNC connectors. 1: Electrical connections between the boards. 2: Pin connections trough all boards.
Figure 5.
Rear photo of the W-Box electronics without the protective case. Right: rear side of BNC connectors. 1: Electrical connections between the boards. 2: Pin connections trough all boards.

Figure 6.
User interface of the measurement program installed on the Raspberry Pi. The settings for all measurements can be adapted individually. Data quality can be checked using the plot of an ultrasound signal.
Figure 6.
User interface of the measurement program installed on the Raspberry Pi. The settings for all measurements can be adapted individually. Data quality can be checked using the plot of an ultrasound signal.

Figure 7.
Multiplexer board, front view. 1: Fuse: 2. Connection to the pulser board. 3: LED. 4: Relay. 5: Connection to the ADC board. 6: Microcontroller. 7: Dip switch. 8: Output cable connection to the BNC connectors.
Figure 7.
Multiplexer board, front view. 1: Fuse: 2. Connection to the pulser board. 3: LED. 4: Relay. 5: Connection to the ADC board. 6: Microcontroller. 7: Dip switch. 8: Output cable connection to the BNC connectors.

Figure 8.
ADC board, front view. 1: Microcontroller. 2: Analog-to-digital converter. 3: 1Mhz crystal oscillator. 4: Connection to the multiplexer board. 5: Analog filter electronics position.
Figure 8.
ADC board, front view. 1: Microcontroller. 2: Analog-to-digital converter. 3: 1Mhz crystal oscillator. 4: Connection to the multiplexer board. 5: Analog filter electronics position.

Figure 9.
ADC board 4th order Bessel−Filter, calculation of frequency response.

Figure 10.
Power board, top view. 1, 2 and 3: LED’s indicators. 4: Connection to the pulser board. 5: DC/DC converter. 6 and 7: Microcontrollers.
Figure 10.
Power board, top view. 1, 2 and 3: LED’s indicators. 4: Connection to the pulser board. 5: DC/DC converter. 6 and 7: Microcontrollers.

Figure 11.
Pulser board, top view. 1: LED’s: 2. Connection to the multiplexer board. 3: Connection to the power board.
Figure 11.
Pulser board, top view. 1: LED’s: 2. Connection to the multiplexer board. 3: Connection to the power board.

Figure 12.
The analog output pulse (green) sent to the transducer is provided by a combination of two digital pulses (blue and red) created by GPIO 20 and GPIO 21.
Figure 12.
The analog output pulse (green) sent to the transducer is provided by a combination of two digital pulses (blue and red) created by GPIO 20 and GPIO 21.

Figure 13.
Temperature and humidity board prototype. 1, 2 and 3: Temperature sensors output. 4 and 5: Output connection to the humidity sensor. 6: DIP switch. 7: Microcontroller.
Figure 13.
Temperature and humidity board prototype. 1, 2 and 3: Temperature sensors output. 4 and 5: Output connection to the humidity sensor. 6: DIP switch. 7: Microcontroller.

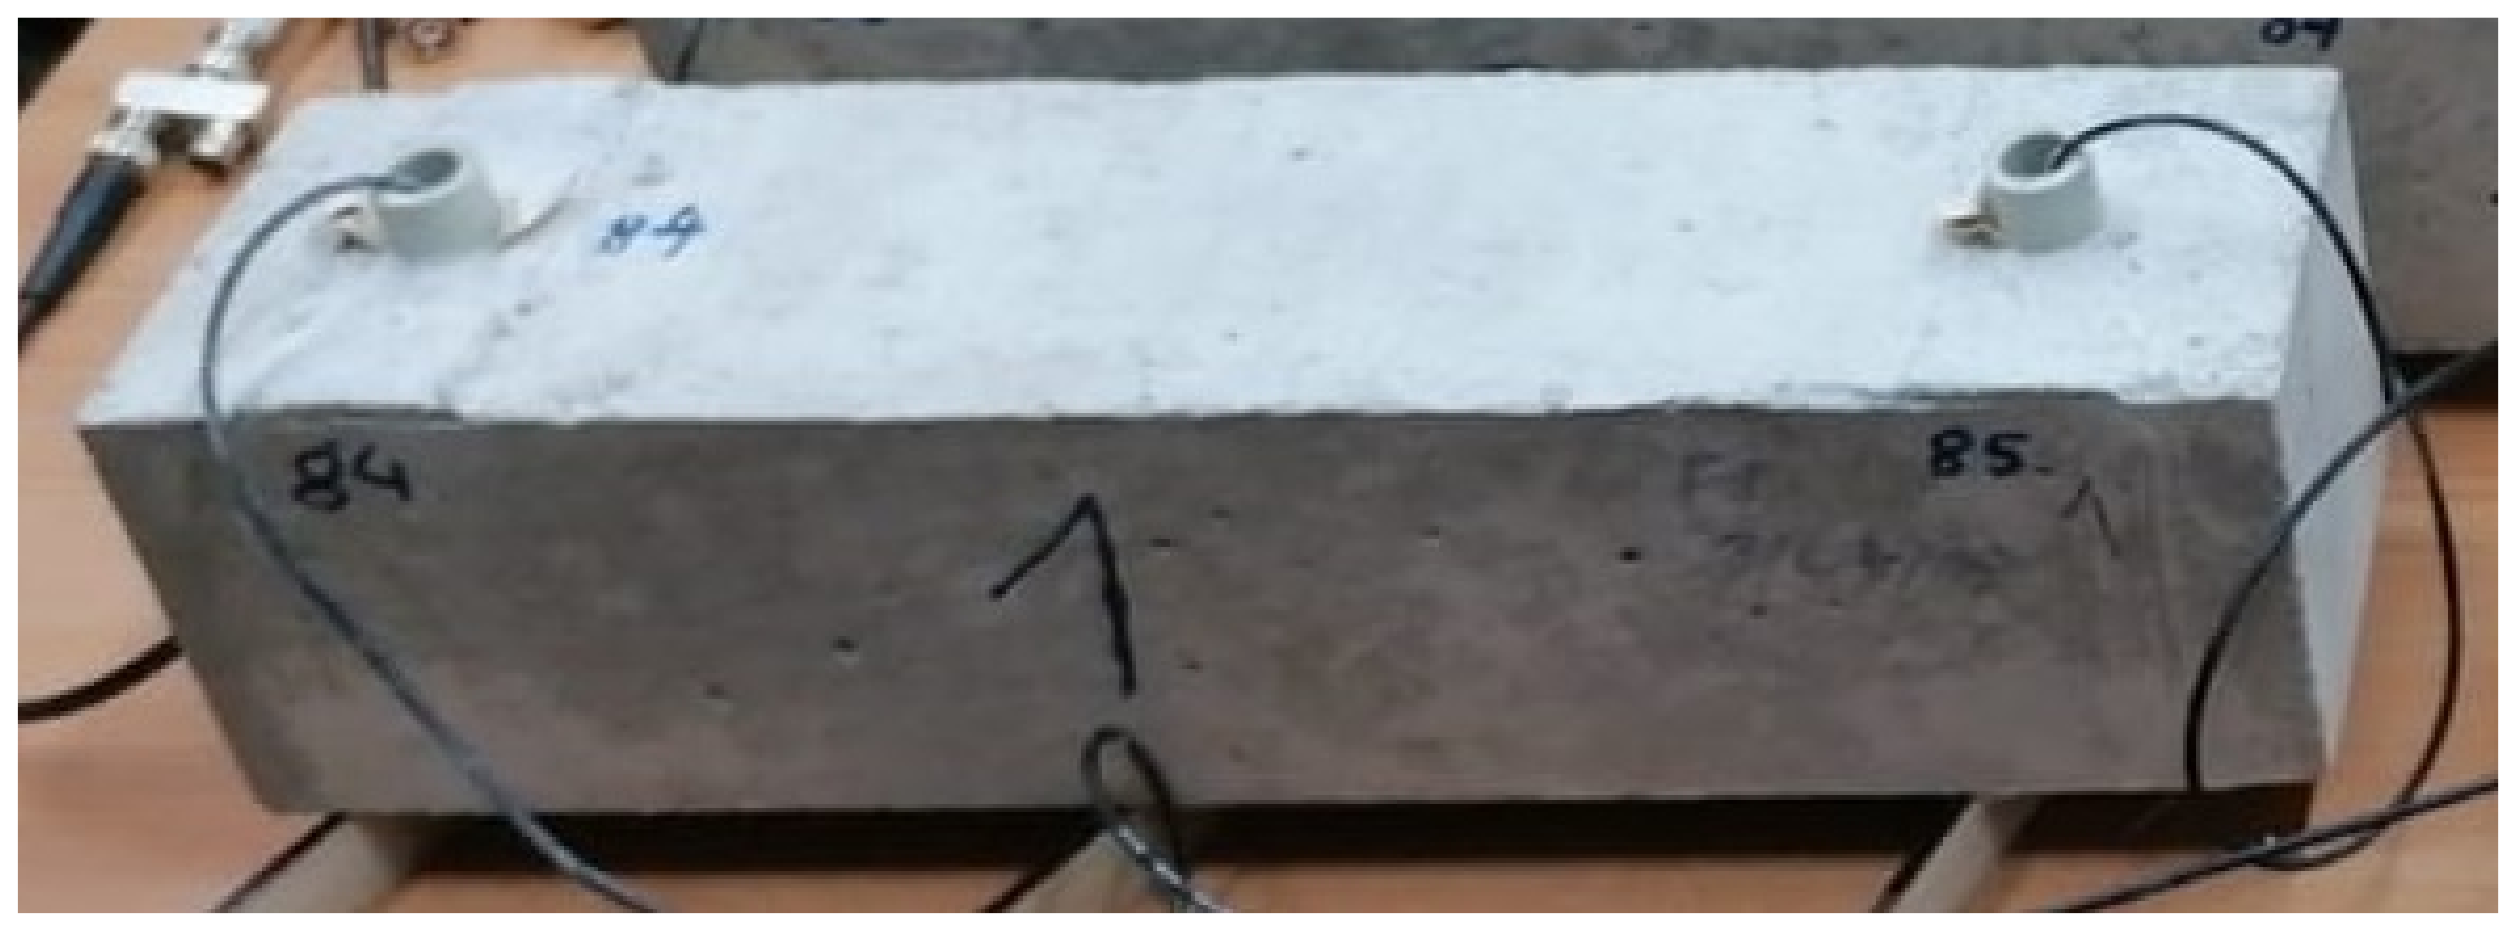
Figure 14.
Concrete beam of 40 cm × 10 cm × 10 cm and two embedded ultrasonic sensors (S0807 from ACSYS, as used in [11,13,18,19]).

Figure 15.
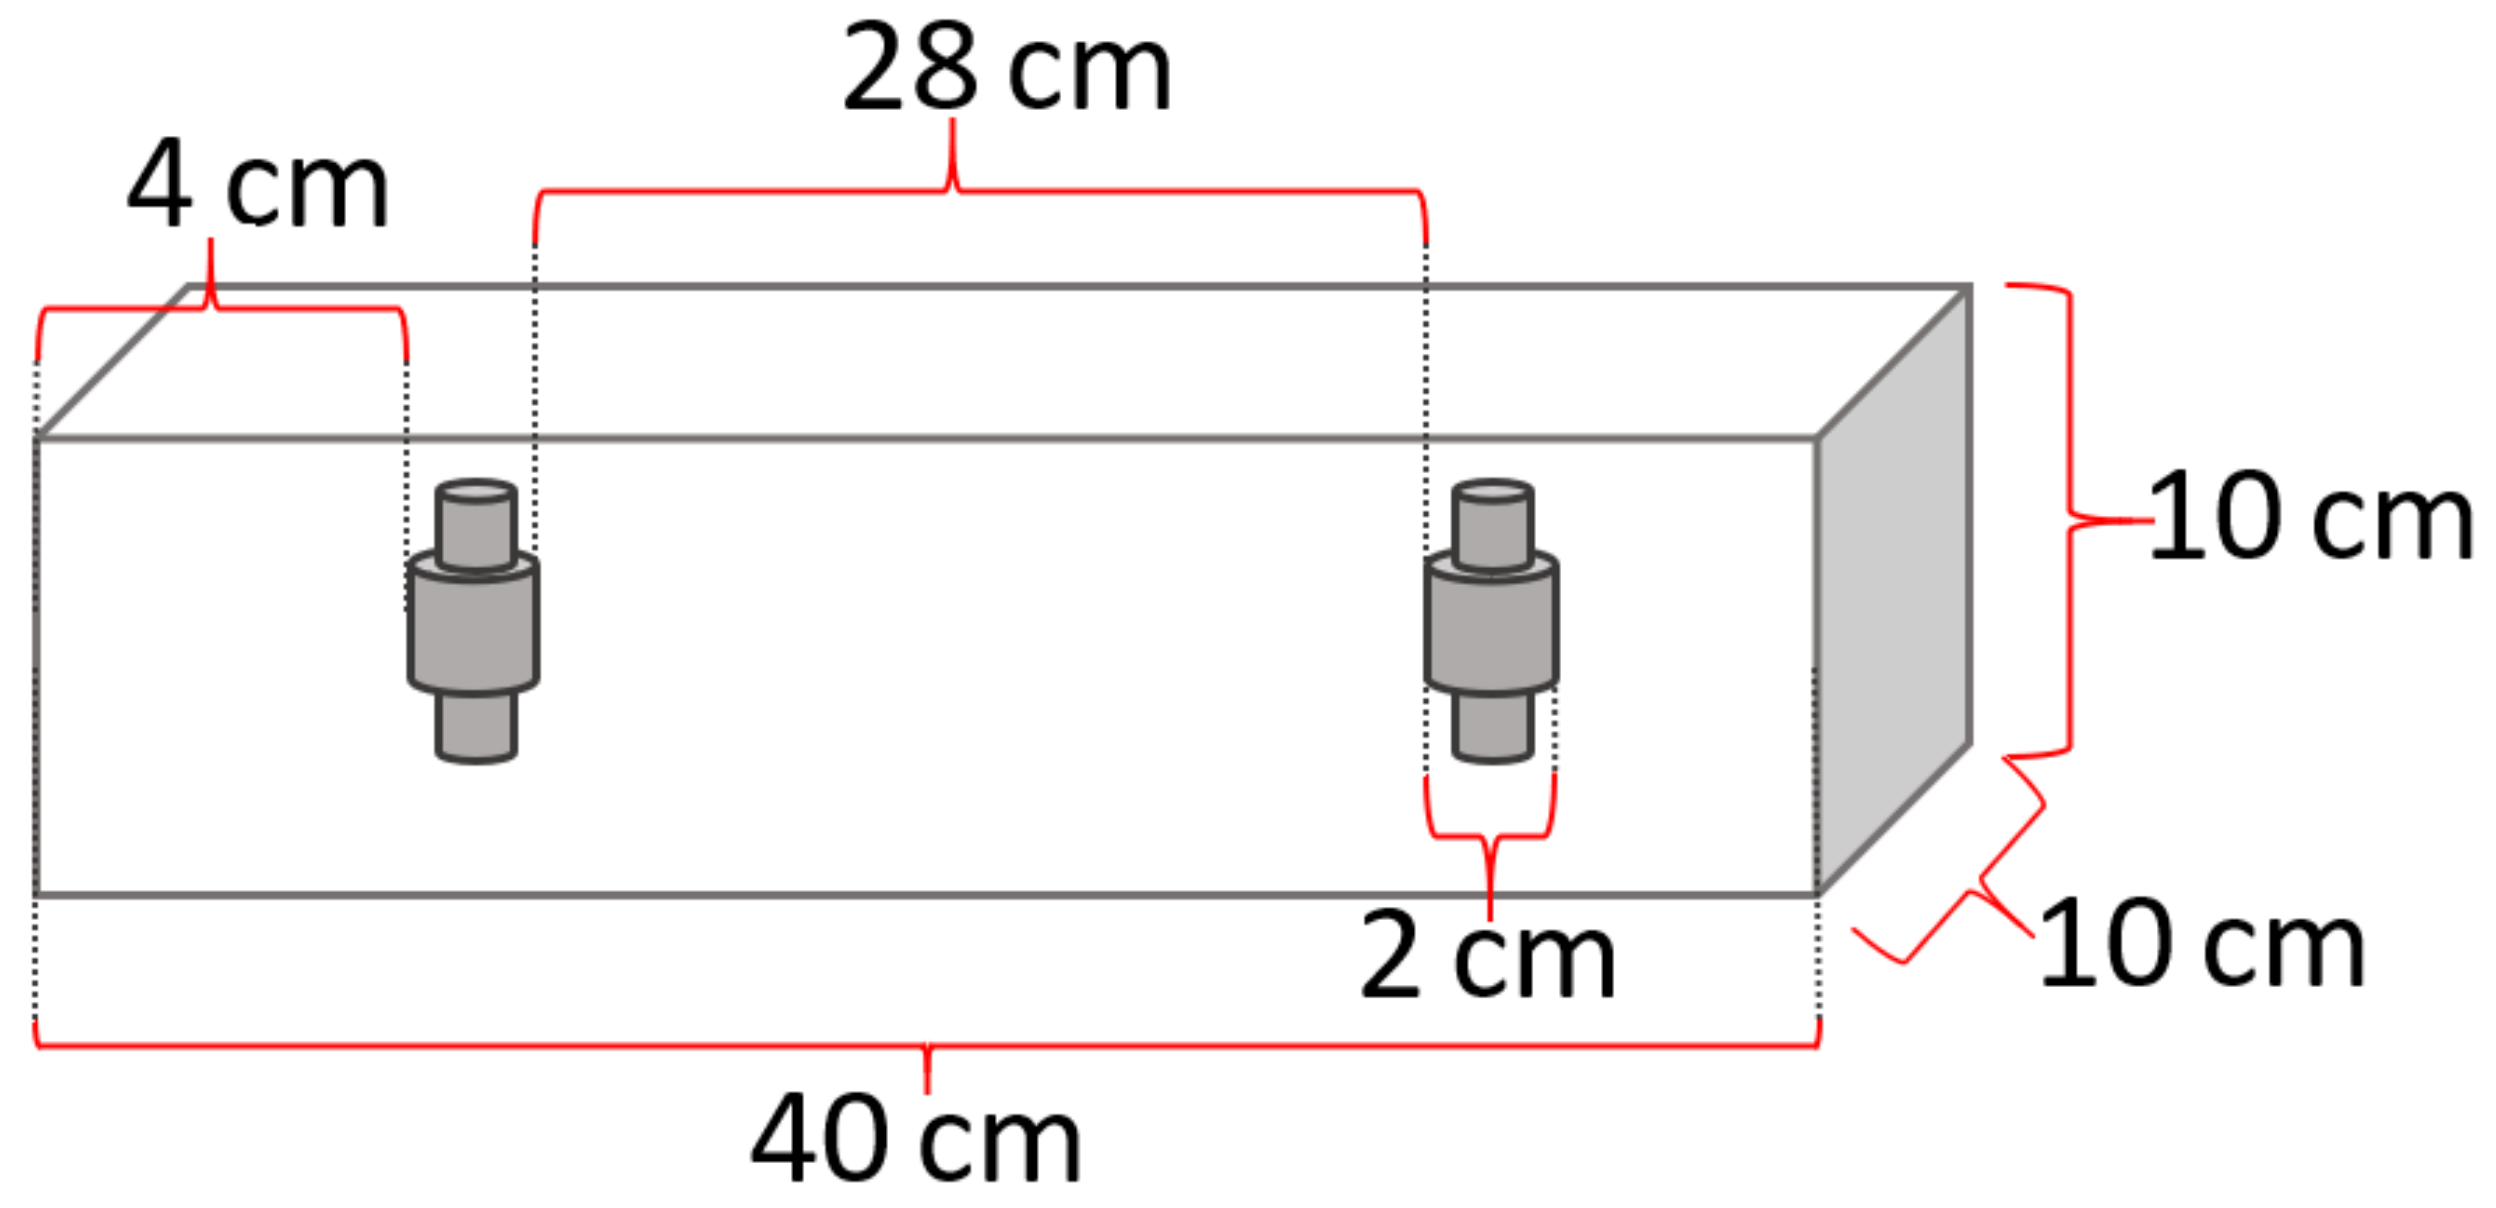
Schematic drawing of the beam of Figure 14. In the center of the image are the two embedded ultrasonic sensors. Both sensors are aligned in the same depth and lateral distances.
Figure 15.
Schematic drawing of the beam of Figure 14. In the center of the image are the two embedded ultrasonic sensors. Both sensors are aligned in the same depth and lateral distances.

Figure 16.
BAM Classic ultrasound measurement system setup. 1: Pulse generator. 2: DAQmx. 3: Keithley Multiplexer. Notebook screen shows the NI LabView control software GUI.
Figure 16.
BAM Classic ultrasound measurement system setup. 1: Pulse generator. 2: DAQmx. 3: Keithley Multiplexer. Notebook screen shows the NI LabView control software GUI.

Figure 17.
The comparison of normalized and preprocessed measurements recorded between the classic system and the W-Box.
Figure 17.
The comparison of normalized and preprocessed measurements recorded between the classic system and the W-Box.

Figure 18.
Noise floor of the W-Box. Fast Fourier Transform (FFT) of the white measurement in the frequency range of 5 kHz to 110 kHz.
Figure 18.
Noise floor of the W-Box. Fast Fourier Transform (FFT) of the white measurement in the frequency range of 5 kHz to 110 kHz.

Figure 19.
Signal to noise ratio vs. distance.


Table 1.
W-Box main project features.
| Ultrasound channels | up to 75 |
| Pulse frequency | from 20 kHz up to 100 kHz |
| Pulse voltage | up to 300 Vpp |
| Analog Filter | low-pass at 150 kHz |
| Amplification | from 1× up to 150× |
| Humidity | 1 channel |
| Temperature | up to 3 channels |
| Remote control | yes |
Publisher’s Note: MDPI stays neutral with regard to jurisdictional claims in published maps and institutional affiliations. |
© 2021 by the authors. Licensee MDPI, Basel, Switzerland. This article is an open access article distributed under the terms and conditions of the Creative Commons Attribution (CC BY) license (https://creativecommons.org/licenses/by/4.0/).
Share and Cite
MDPI and ACS Style
Fontoura Barroso, D.; Epple, N.; Niederleithinger, E. A Portable Low-Cost Ultrasound Measurement Device for Concrete Monitoring. Inventions 2021, 6, 36. https://doi.org/10.3390/inventions6020036
AMA Style
Fontoura Barroso D, Epple N, Niederleithinger E. A Portable Low-Cost Ultrasound Measurement Device for Concrete Monitoring. Inventions. 2021; 6(2):36. https://doi.org/10.3390/inventions6020036
Chicago/Turabian StyleFontoura Barroso, Daniel, Niklas Epple, and Ernst Niederleithinger. 2021. "A Portable Low-Cost Ultrasound Measurement Device for Concrete Monitoring" Inventions 6, no. 2: 36. https://doi.org/10.3390/inventions6020036