
Two-Dimensional Thomson Scattering in Laser-Produced Plasmas

 , , , , , , , , and
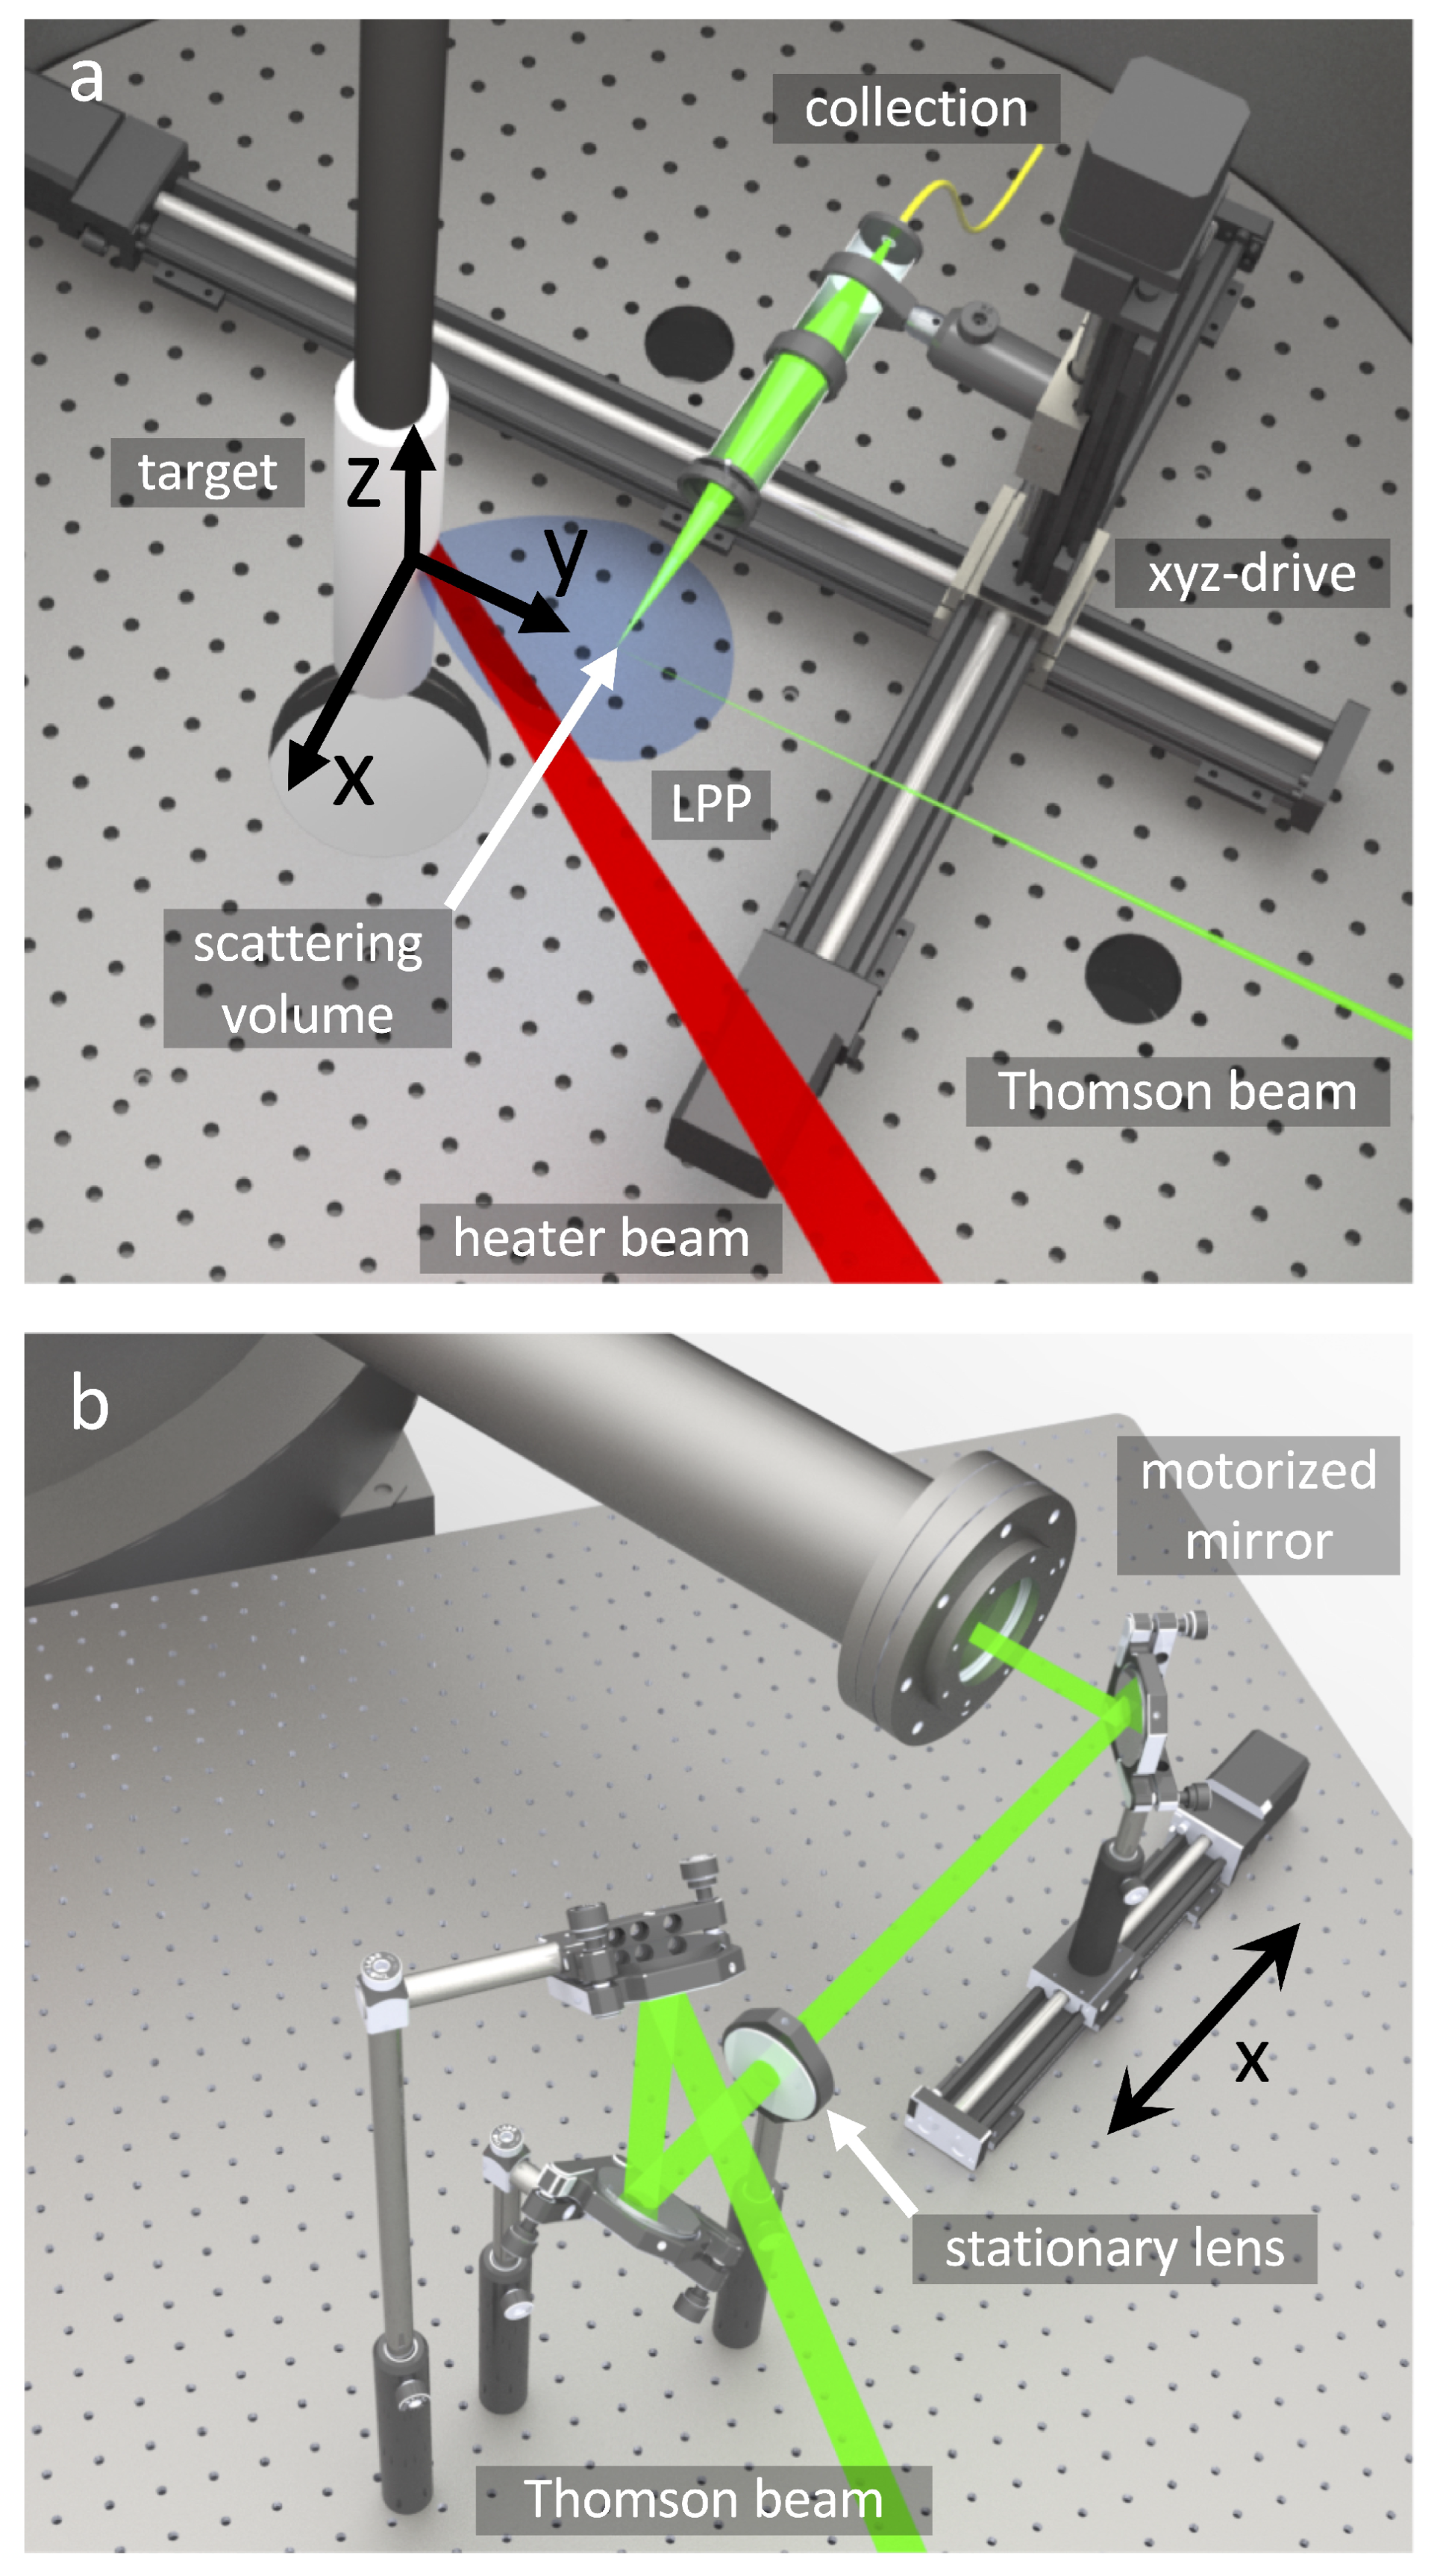
Abstract
:1. Introduction
2. Experimental Setup
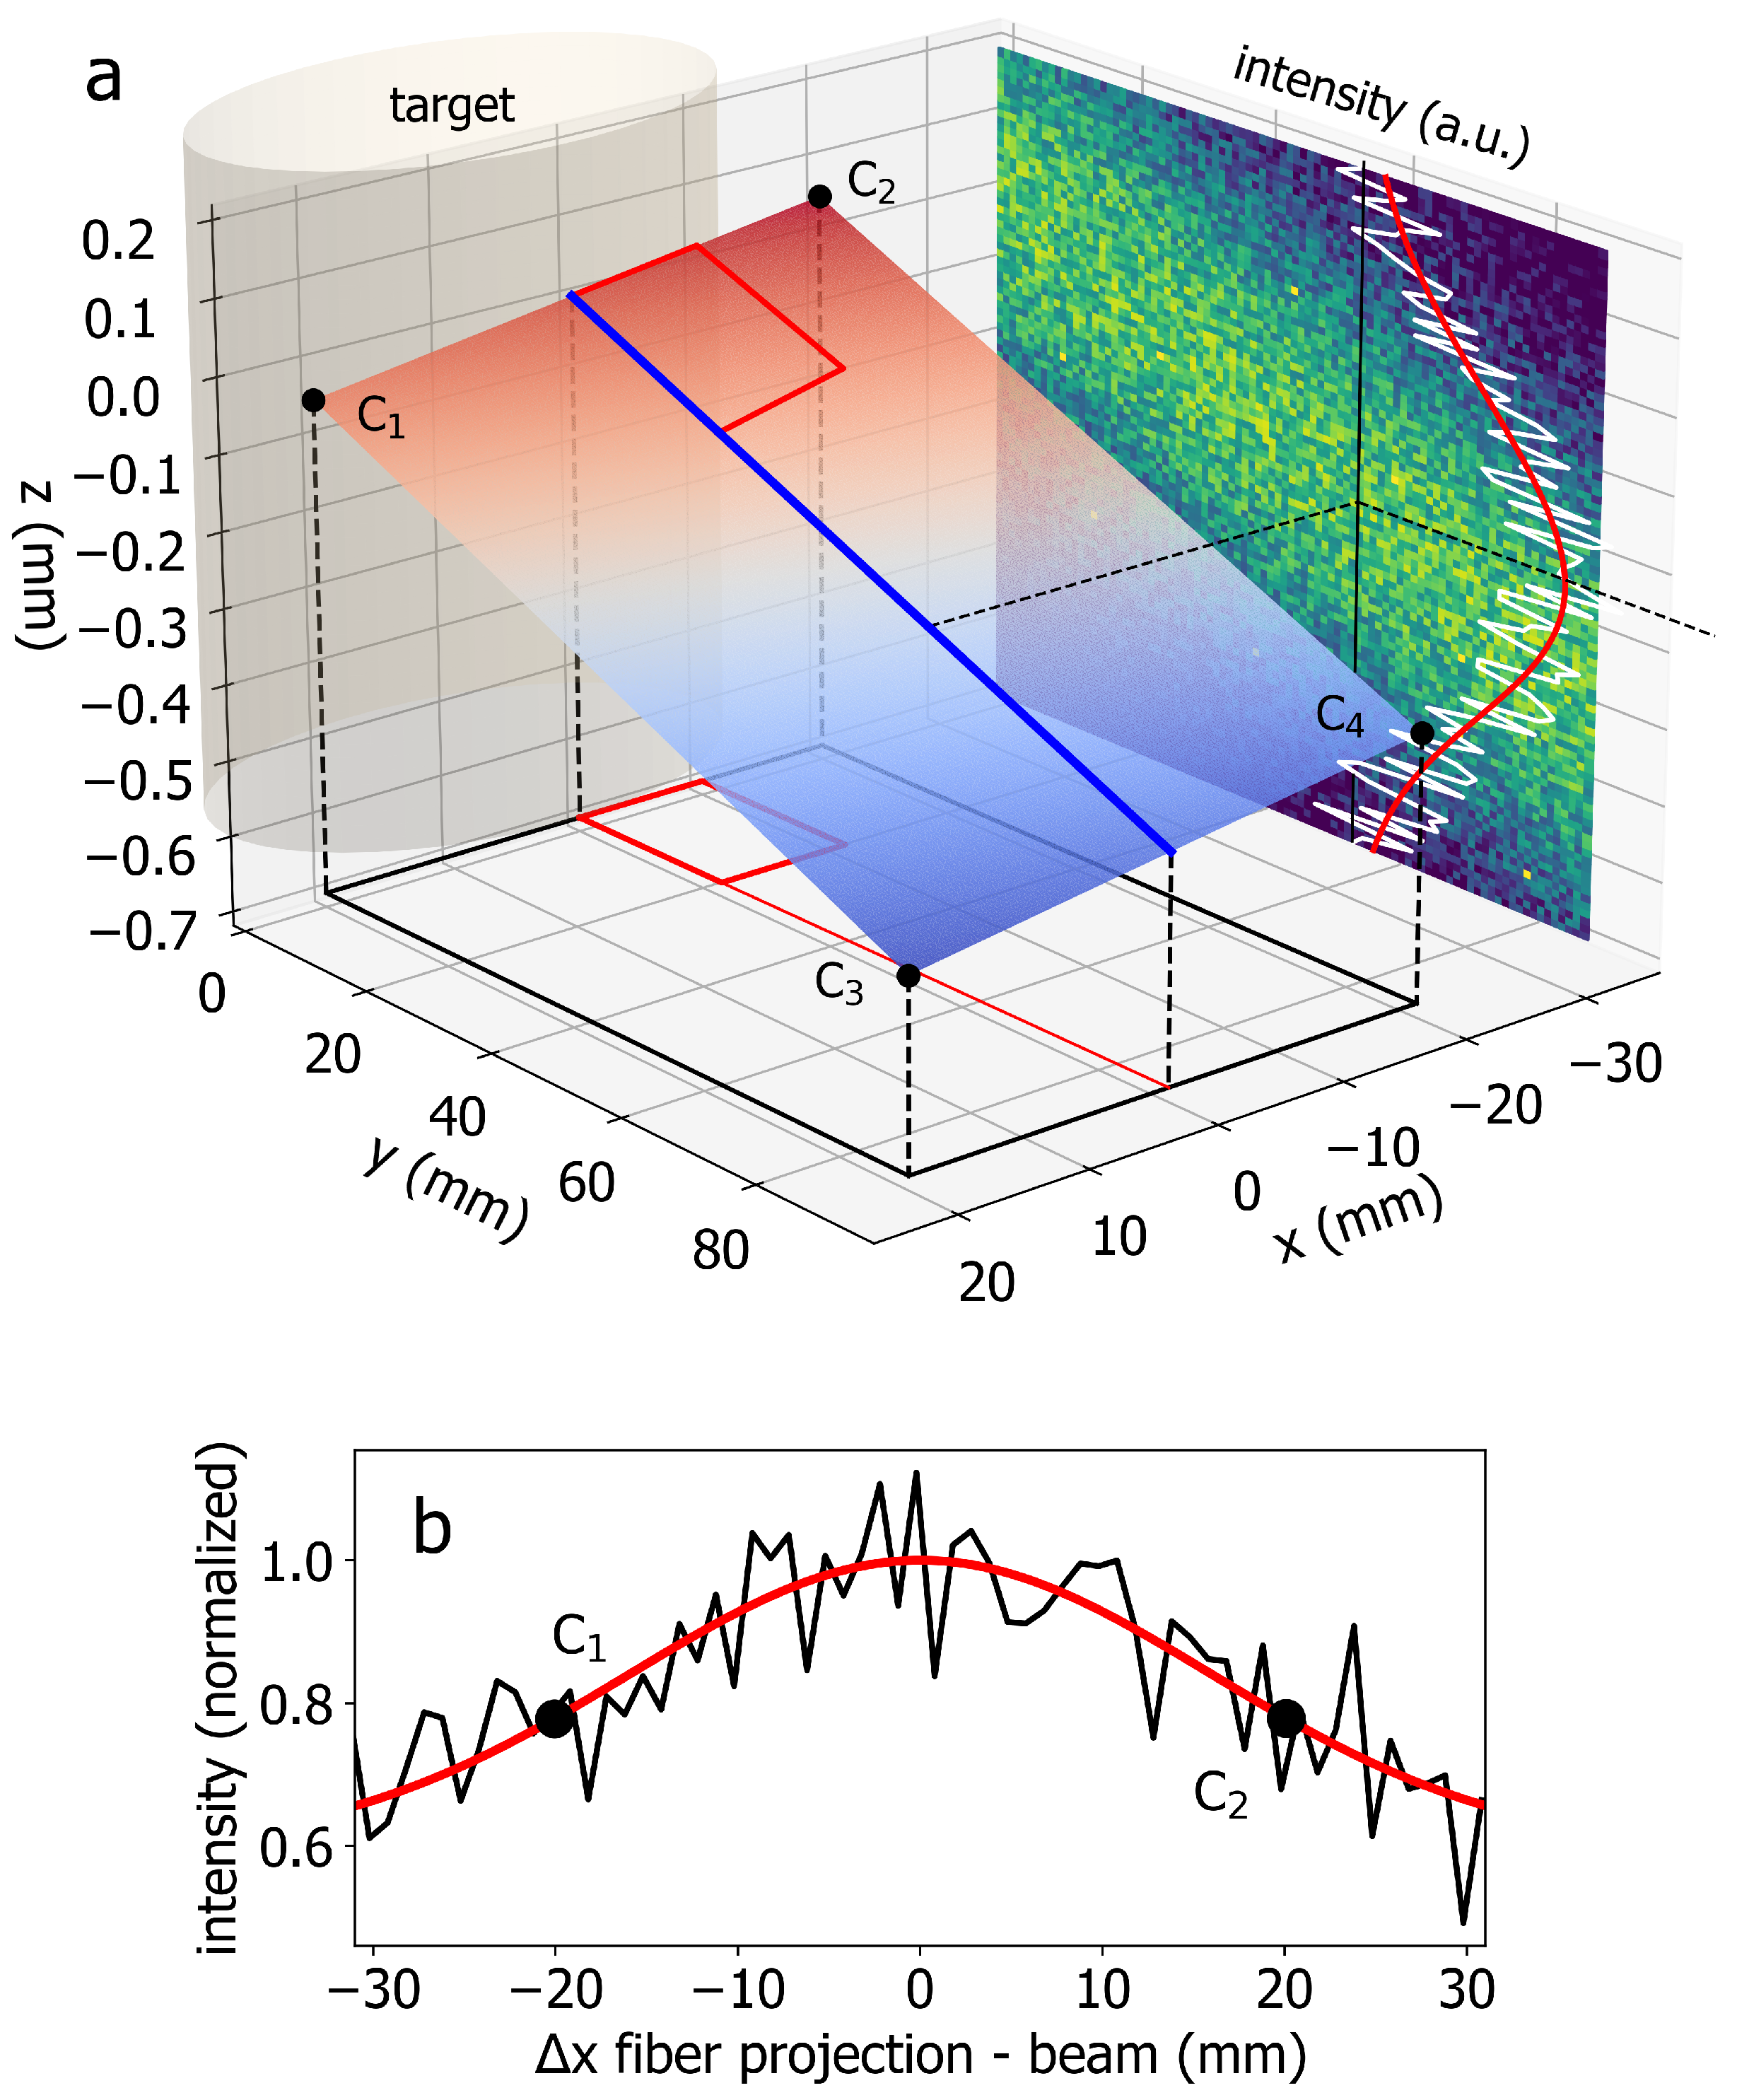
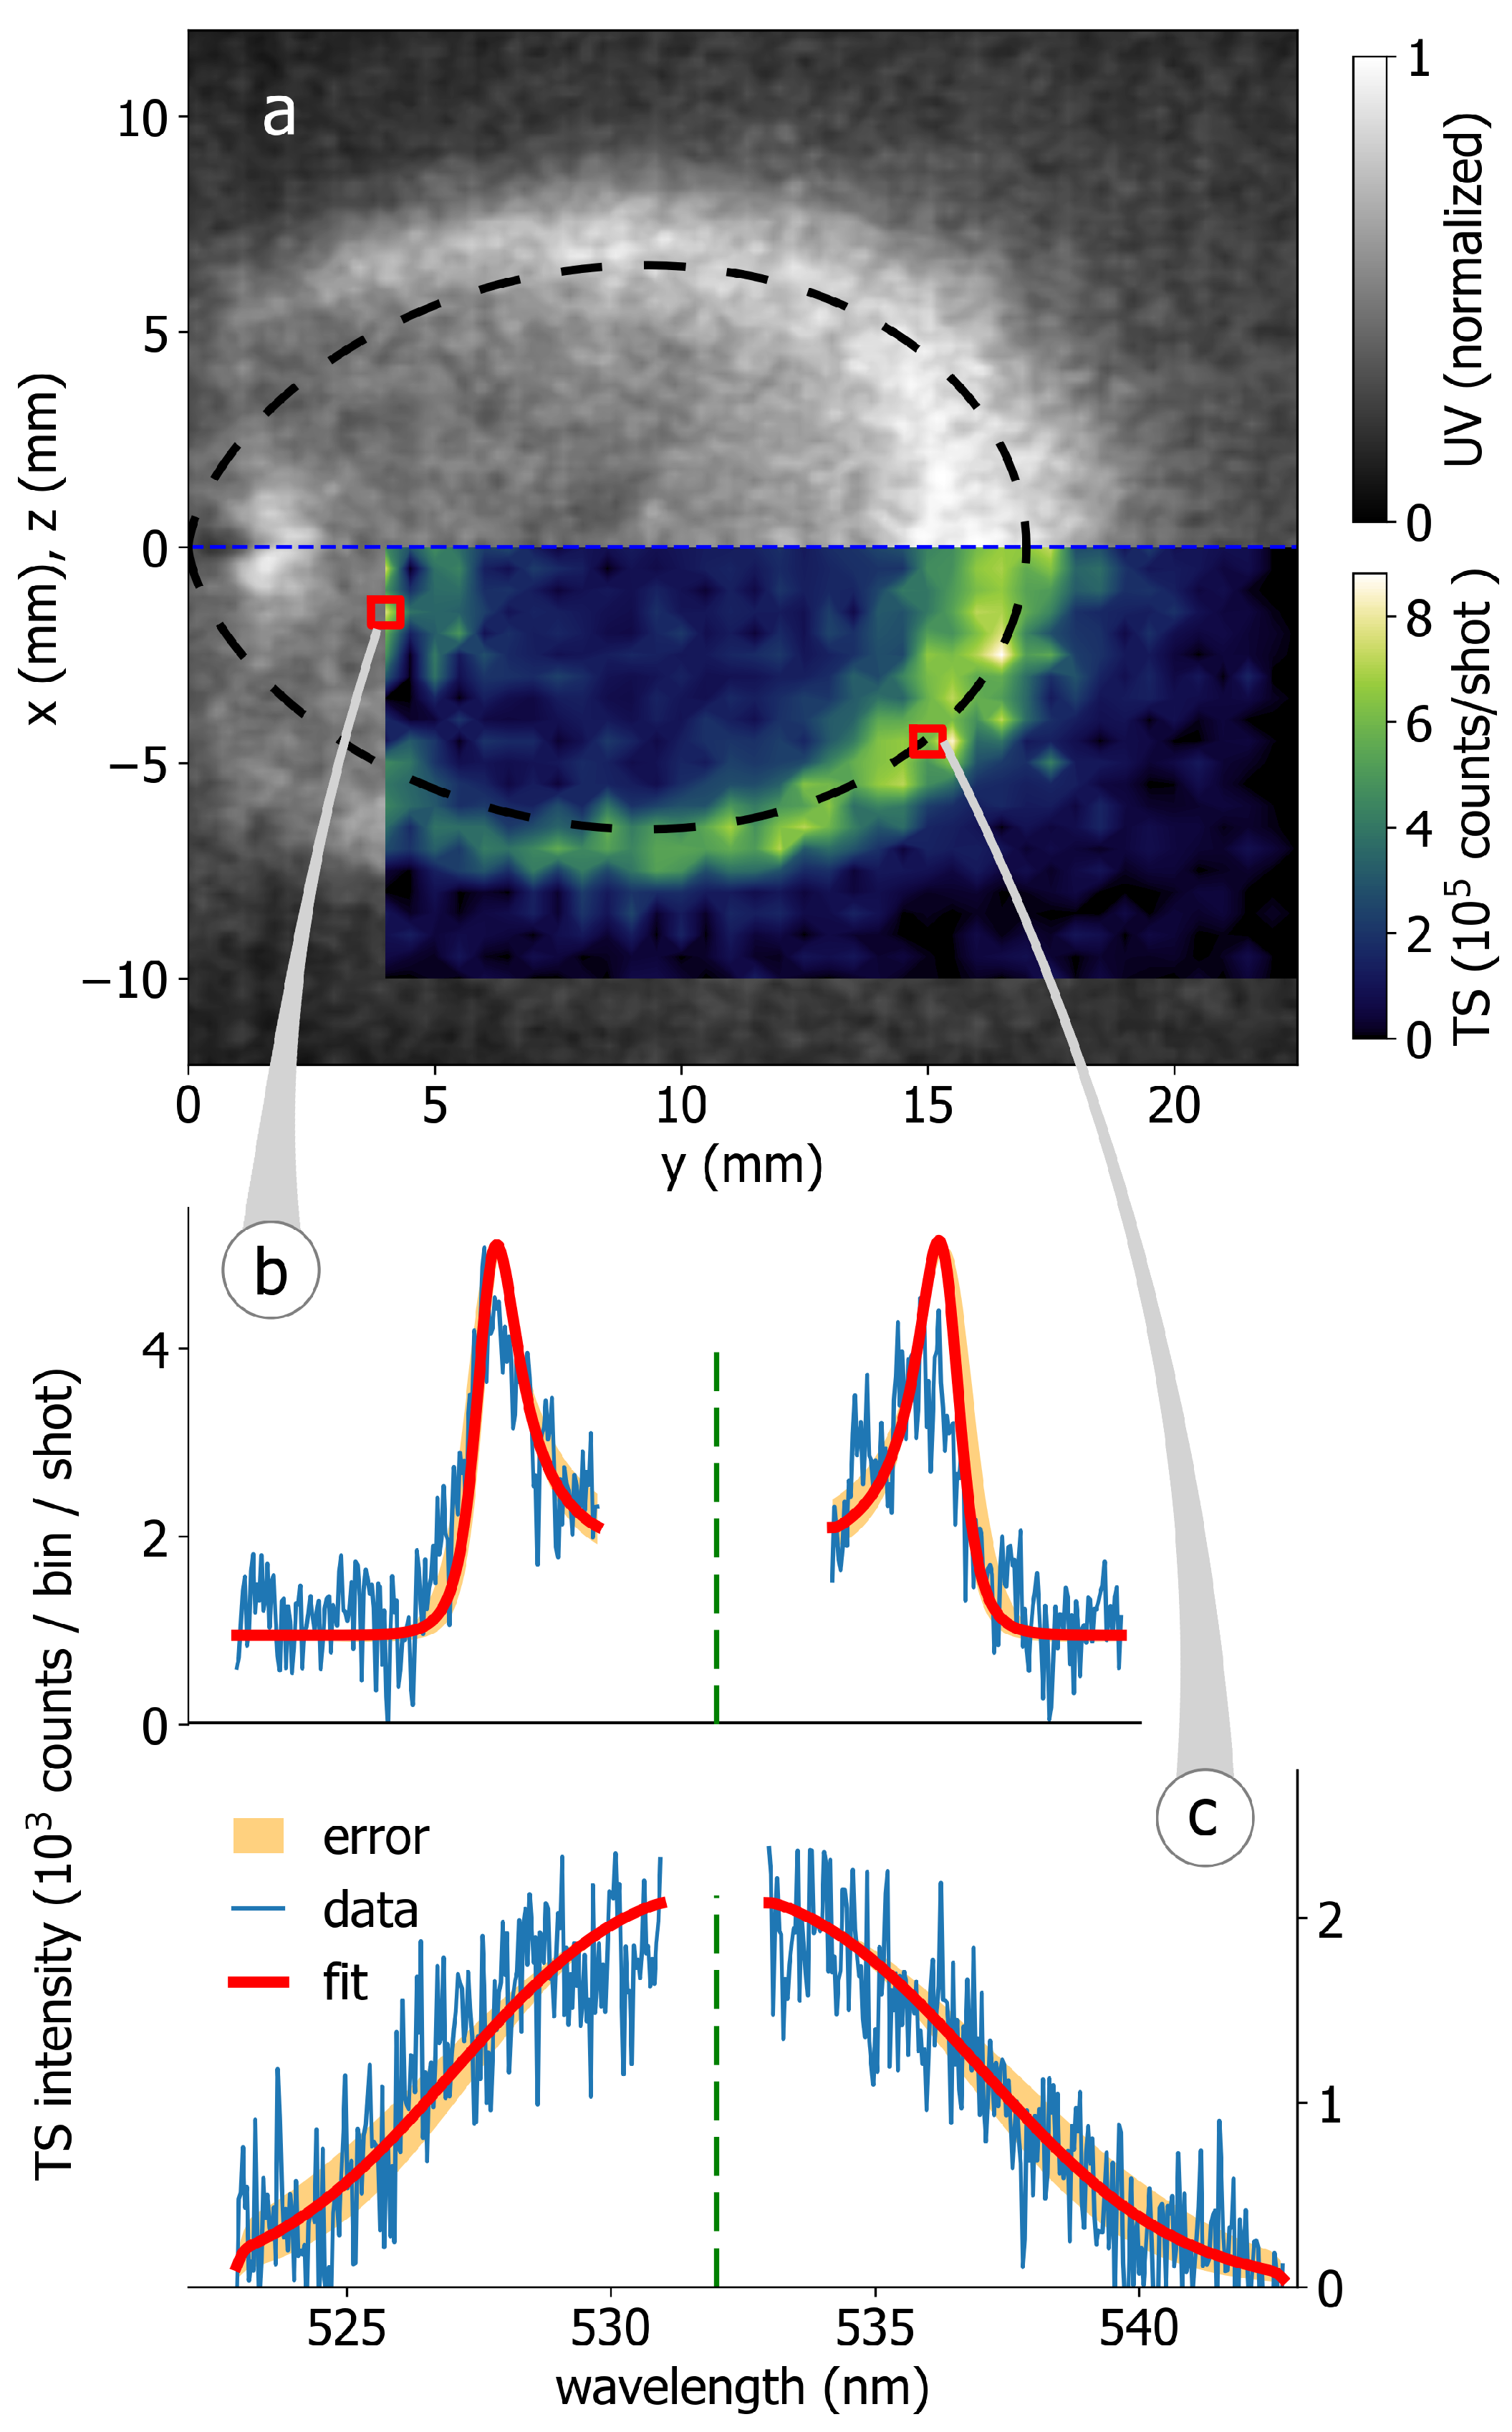
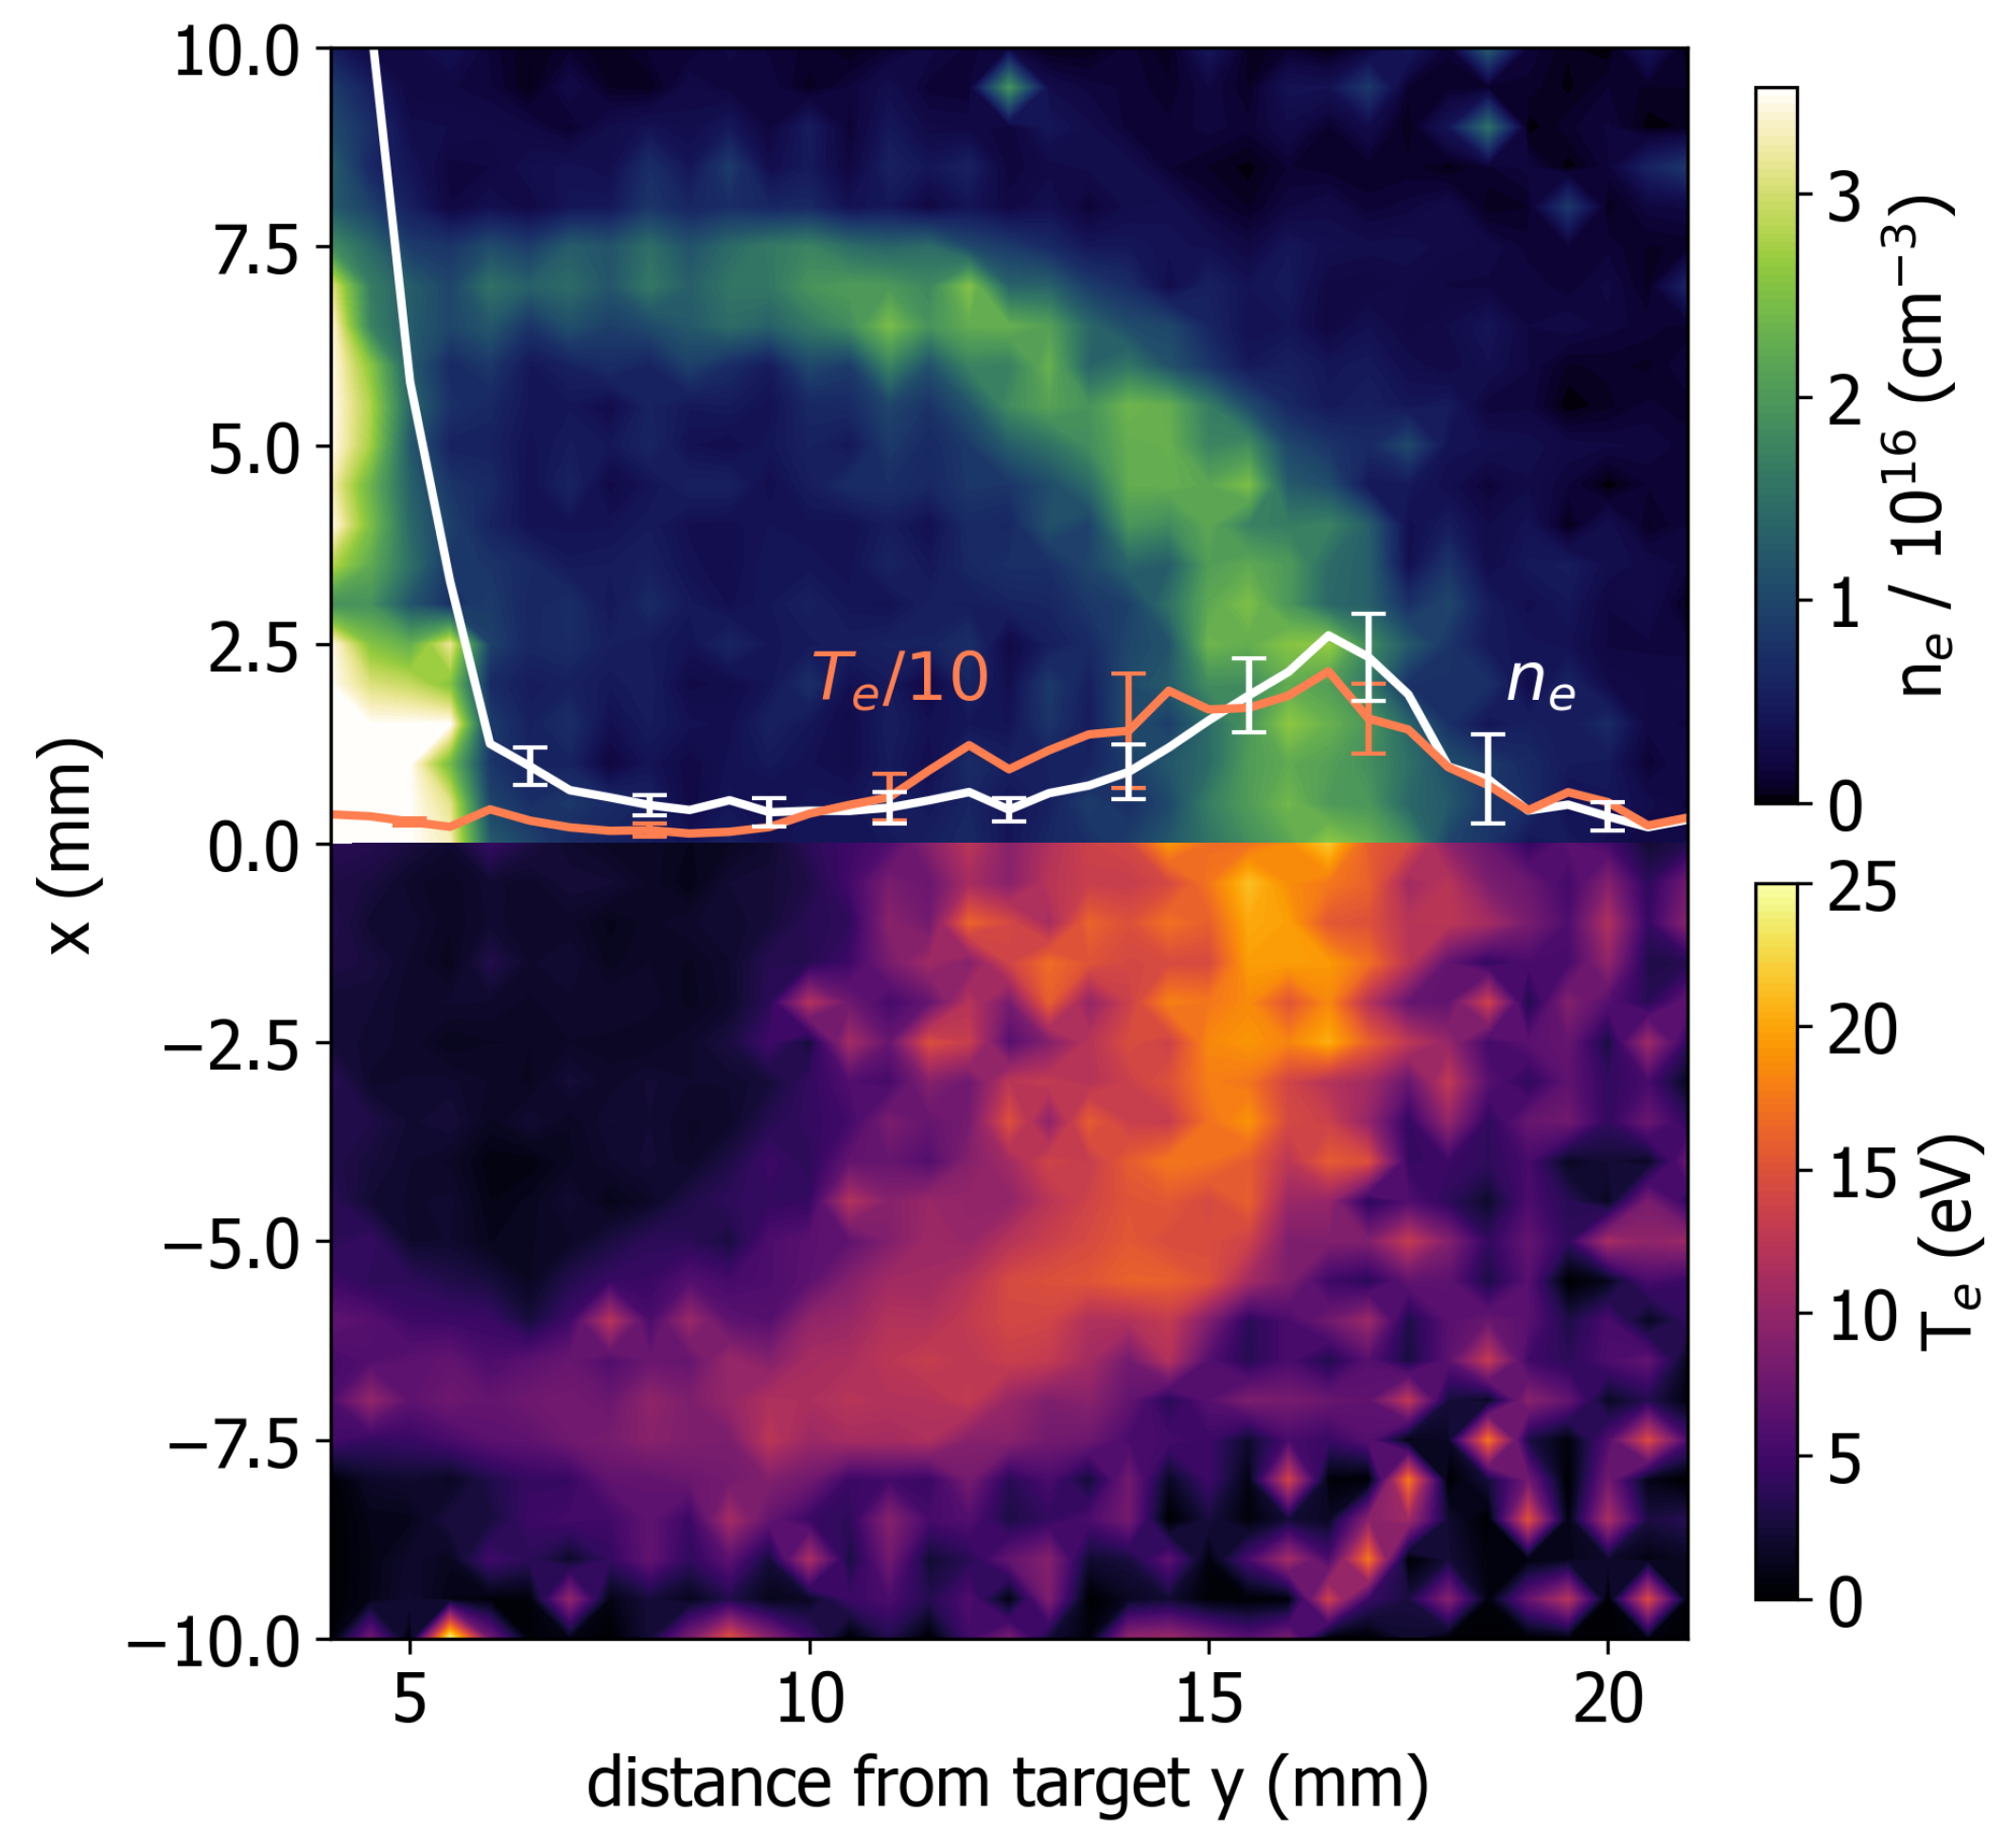
3. Results and Discussion


4. Conclusions
Author Contributions
Funding
Data Availability Statement
Acknowledgments
Conflicts of Interest
References
- Evans, D.; Katzenstein, J. Laser light scattering in laboratory plasmas. Rep. Prog. Phys. 1969, 32, 207–271. [Google Scholar] [CrossRef]
- Gregori, G.; Glenzer, S.H.; Knight, J.; Niemann, C.; Price, D.; Froula, D.H.; Edwards, M.J.; Town, R.P.J.; Brantov, A.; Rozmus, W.; et al. Effect of Nonlocal Transport on Heat-Wave Propagation. Phys. Rev. Lett. 2004, 92, 205006. [Google Scholar] [CrossRef]
- Casey, J.A.; Watterson, R.; Tambini, F.; Rollins, E.; Chin, B. Construction of a scanning two-dimensional Thomson scattering system for Alcator C-Mod. Rev. Sci. Instrum. 1992, 63, 4950–4952. [Google Scholar] [CrossRef]
- Kurzan, B.; Murmann, H.D. Edge and core Thomson scattering systems and their calibration on the ASDEX Upgrade tokamak. Rev. Sci. Instrum. 2011, 82, 103501. [Google Scholar] [CrossRef] [PubMed]
- Belostotskiy, S.; Khandelwal, R.; Wang, Q.; Donnelly, V.; Economou, D.; Sadeghi, N. Measurement of electron temperature and density in an argon microdischarge by laser Thomson scattering. Appl. Phys. Lett. 2008, 92, 221507. [Google Scholar] [CrossRef]
- Hassaballa, S.; Yakushiji, M.; Kim, Y.K.; Tomita, K.; Uchino, K.; Muraoka, K. Two-dimensional structure of PDP micro-discharge plasmas obtained using laser Thomson scattering. IEEE Trans. Plasma Sci. 2004, 32, 127–134. [Google Scholar] [CrossRef]
- Tomita, K.; Bolouki, N.; Shirozono, H.; Yamagata, Y.; Uchino, K.; Takaki, K. Two-dimensional Thomson scattering diagnostics of pulsed discharges produced at atmospheric pressure. J. Instrum. 2012, 7, C02057. [Google Scholar] [CrossRef]
- Niemann, C.; Gekelman, W.; Constantin, C.; Everson, E.; Schaeffer, D.; Bondarenko, A.; Clark, S.; Winske, D.; Vincena, S.V.; Compernolle, B.; et al. Observation of collisionless shocks in a large current-free laboratory plasma. Geophys. Res. Lett. 2014, 41, 7413–7418. [Google Scholar] [CrossRef]
- Schaeffer, D.B.; Everson, E.T.; Bondarenko, A.S.; Clark, S.E.; Constantin, C.G.; Vincena, S.; Van Compernolle, B.; Tripathi, S.K.P.; Winske, D.; Gekelman, W.; et al. Laser-driven, magnetized quasi-perpendicular collisionless shocks on the Large Plasma Device. Phys. Plasmas 2014, 21, 056312. [Google Scholar] [CrossRef]
- Weidl, M.S.; Winske, D.; Jenko, F.; Niemann, C. Hybrid simulations of a parallel collisionless shock in the large plasma device. Phys. Plasmas 2016, 23, 122102. [Google Scholar] [CrossRef]
- Heuer, P.V.; Weidl, M.S.; Dorst, R.S.; Schaeffer, D.B.; Tripathi, S.K.P.; Vincena, S.; Constantin, C.G.; Niemann, C.; Winske, D. Laser-produced plasmas as drivers of laboratory collisionless quasi-parallel shocks. Phys. Plasmas 2020, 27, 042103. [Google Scholar] [CrossRef]
- Schaeffer, D.B.; Winske, D.; Larson, D.J.; Cowee, M.M.; Constantin, C.G.; Bondarenko, A.S.; Clark, S.E.; Niemann, C. On the generation of magnetized collisionless shocks in the Large Plasma Device. Phys. Plasmas 2017, 24, 041405. [Google Scholar] [CrossRef]
- Schaeffer, D.B.; Fox, W.; Follett, R.K.; Fiksel, G.; Li, C.K.; Matteucci, J.; Bhattacharjee, A.; Germaschewski, K. Direct Observations of Particle Dynamics in Magnetized Collisionless Shock Precursors in Laser-Produced Plasmas. Phys. Rev. Lett. 2019, 122, 245001. [Google Scholar] [CrossRef] [PubMed]
- Heuer, P.V.; Weidl, M.S.; Dorst, R.S.; Schaeffer, D.B.; Bondarenko, A.S.; Tripathi, S.K.P.; Van Compernolle, B.; Vincena, S.; Constantin, C.G.; Niemann, C.; et al. Observations of a field-aligned ion/ion-beam instability in a magnetized laboratory plasma. Phys. Plasmas 2018, 25, 032104. [Google Scholar] [CrossRef]
- Winske, D.; Huba, J.; Niemann, C.; Le, A. Recalling and Updating Research on Diamagnetic Cavities: Experiments, Theory, Simulations. Front. Astron. Space Sci. 2019, 5, 51. [Google Scholar] [CrossRef]
- Gekelman, W.; Vincena, S.; Collette, A. Visualizing Three-Dimensional Reconnection in a Colliding Laser Plasma Experiment. IEEE Trans. Plasma Sci. 2008, 36, 1122–1123. [Google Scholar] [CrossRef]
- Bondarenko, A.; Schaeffer, D.; Everson, E.; Clark, S.; Lee, B.; Constantin, C.; Vincena, S.; Compernolle, B.V.; Tripathi, S.; Winske, D.; et al. Collisionless momentum transfer in space and astrophysical explosions. Nat. Phys. 2017, 13, 573–577. [Google Scholar] [CrossRef]
- Dorst, R.S.; Schaeffer, D.B.; Le, A.; Pilgram, J.J.; Constantin, C.G.; Vincena, S.; Tripathi, S.K.P.; Winske, D.; Larson, D.; Cowee, M.; et al. High repetition rate mapping of the interaction between a laser plasma and magnetized background plasma via laser induced fluorescence. Phys. Plasmas 2022, 29, 082113. [Google Scholar] [CrossRef]
- Schaeffer, D.B.; Cruz, F.D.; Dorst, R.S.; Cruz, F.; Heuer, P.V.; Constantin, C.G.; Pribyl, P.; Niemann, C.; Silva, L.O.; Bhattacharjee, A. Laser-driven, ion-scale magnetospheres in laboratory plasmas. I. Experimental platform and first results. Phys. Plasmas 2022, 29, 042901. [Google Scholar] [CrossRef]
- Pilgram, J.; Adams, M.B.P.; Constantin, C.G.; Heuer, P.V.; Ghazaryan, S.; Kaloyan, M.; Dorst, R.S.; Schaeffer, D.B.; Tzeferacos, P.; Niemann, C. High Repetition Rate Exploration of the Biermann Battery Effect in Laser Produced Plasmas Over Large Spatial Regions. High Power Laser Sci. Eng. 2022, 10, e13. [Google Scholar] [CrossRef]
- Adams, M. Elucidation of Magnetic Field Generation Via Laser-Target Illumination in the Magnetohydrodynamic Framework. Ph.D. Thesis, University of Rocheste, Rochester, NJ, USA, 2022. [Google Scholar]
- Kaloyan, M.; Ghazaryan, S.; Constantin, C.G.; Dorst, R.S.; Heuer, P.V.; Pilgram, J.J.; Schaeffer, D.B.; Niemann, C. Raster Thomson scattering in large-scale laser plasmas produced at high repetition rate. Rev. Sci. Instrum. 2021, 92, 093102. [Google Scholar] [CrossRef] [PubMed]
- Kaloyan, M.; Ghazaryan, S.; Tripathi, S.; Gekelman, W.; Valle, M.; Seo, B.; Niemann, C. First results from the Thomson scattering Diagnostic on the Large Plasma Device. Instruments 2022, 6, 17. [Google Scholar] [CrossRef]
- Ghazaryan, S.; Kaloyan, M.; Gekelman, W.; Lucky, Z.; Vincena, S.; Tripathi, S.K.P.; Pribyl, P.; Niemann, C. Thomson scattering on the Large Plasma Device. Rev. Sci. Instrum. 2022, 93, 083514. [Google Scholar] [CrossRef] [PubMed]
- Schaeffer, D.; Hofer, L.; Knall, E.; Heuer, P.; Constantin, C.; Niemann, C. A platform for high-repetition-rate laser experiments on the Large Plasma Device. High Power Laser Sci. Eng. 2018, 6, e17. [Google Scholar] [CrossRef]
- PlasmaPy Community. PlasmaPy, Version 2023.1.0, Zenodo. 2023. Available online: https://zenodo.org/record/7529964 (accessed on 29 July 2023).
- Chambaret, J.; Georges, P.; Chériaux, G.; Rey, G.; Blanc, C.L.; Audebert, P.; Douillet, D.; Paillard, J.; Cavillac, P.; Fournet, D.; et al. The Extreme Light Infrastructure Project ELI and Its Prototype APOLLON/ ILE: “The Associated Laser Bottlenecks”. Available online: https://doi.org/10.1364/FIO.2009.FMI2 (accessed on 29 July 2023). [CrossRef]
- Brocklesby, W.; Nilsson, J.; Schreiber, T.; Limpert, J.; Brignon, A.; Bourderionnet, J.; Lombard, L.; Michau, V.; Hanna, M.; Zaouter, Y.; et al. ICAN as a new laser paradigm for high energy, high average power femtosecond pulses. Eur. Phys. J. Spec. Top. 2014, 223, 1189–1195. [Google Scholar] [CrossRef]
- Haefner, C.L.; Bayramian, A.; Betts, S.; Bopp, R.; Buck, S.; Cupal, J.; Drouin, M.; Erlandson, A.; Horáček, J.; Horner, J.; et al. High average power, diode pumped petawatt laser systems: A new generation of lasers enabling precision science and commercial applications. In Research Using Extreme Light: Entering New Frontiers with Petawatt-Class Lasers III; Korn, G., Silva, L.O., Eds.; International Society for Optics and Photonics, SPIE: Bellingham, WA, USA, 2017; Volume 10241, p. 1024102. [Google Scholar] [CrossRef]
- Nees, J.; Maksimchuk, A.; Kalinchenko, G.; Hou, B.; Ma, Y.; Campbell, P.; McKelvey, A.; Willingale, L.; Jovanovic, I.; Kuranz, C.; et al. ZEUS: A National Science Foundation mid-scale facility for laser-driven science in the QED regime. In Proceedings of the Conference on Lasers and Electro-Optics, San Jose, CA, USA, 10–15 May 2020; Optical Society of America; p. JW2B.9. [Google Scholar]
- Meuren, S.; Reis, D.; Blandford, R.; Bucksbaum, P.; Fisch, N.; Fiuza, F.; Gerstmayr, E.; Glenzer, S.; Hogan, M.; Pellegrini, C.; et al. Research Opportunities Enabled by Co-locating Multi-Petawatt Lasers with Dense Ultra-Relativistic Electron Beams. arXiv 2021, arXiv:2105.11607. [Google Scholar]
- Ma, T.; Mariscal, D.; Anirudh, R.; Bremer, T.; Djordjevic, B.; Galvin, T.; Grace, E.; Herriot, S.; Jacobs, S.; Kailkhura, B.; et al. Accelerating the rate of discovery: Toward high-repetition-rate HED science. Plasma Phys. Control. Fusion 2021, 63, 104003. [Google Scholar] [CrossRef]
- Niemann, C.; Constantin, C.; Schaeffer, D.; Tauschwitz, A.; Weiland, T.; Lucky, Z.; Gekelman, W.; Everson, E.; Winske, D. High-energy Nd:glass laser facility for collisionless laboratory astrophysics. J. Instrum. 2012, 7, P03010. [Google Scholar] [CrossRef]
- Dane, C.; Zapata, L.; Neuman, W.; Norton, M.; Hackel, L. Design and Operation of a 150 W Near Diffraction-Limited Laser Amplifier with SBS Wavefront Correction. IEEE J. Quantum Electron. 1995, 31, 148–163. [Google Scholar] [CrossRef]
- Ghazaryan, S.; Kaloyan, M.; Niemann, C. Silica Raman scattering probe for absolute calibration of Thomson scattering spectrometers. J. Instrum. 2021, 16, P08045. [Google Scholar] [CrossRef]
- Grun, J.; Stamper, J.; Manka, C.; Resnick, J.; Burris, R.; Crawford, J.; Ripin, B.H. Instability of Taylor-Sedov blast waves propagating through a uniform gas. Phys. Rev. Lett. 1991, 66, 2738–2741. [Google Scholar] [CrossRef]
- Edens, A.D.; Adams, R.G.; Rambo, P.; Ruggles, L.; Smith, I.C.; Porter, J.L.; Ditmire, T. Study of high Mach number laser driven blast waves in gases. Phys. Plasmas 2010, 17, 112104. [Google Scholar] [CrossRef]
- McKee, C.; Draine, B. Interstellar Shock Waves. Science 1991, 252, 397–403. [Google Scholar] [CrossRef] [PubMed]
- Vernstrom, T.; West, J.; Vazza, F.; Wittor, D.; Riseley, C.; Heald, G. Polarized accretion shocks from the cosmic web. Sci. Adv. 2023, 9, eade7233. [Google Scholar] [CrossRef]
- Gregori, G.; Ravasio, A.; Murphy, C.D.; Schaar, K.; Baird, A.; Bell, A.R.; Benuzzi-Mounaix, A.; Bingham, R.; Constantin, C.; Drake, R.P.; et al. Generation of scaled protogalactic seed magnetic fields in laser-produced shock waves. Nature 2012, 481, 480–483. [Google Scholar] [CrossRef] [PubMed]
- Heuer, P.; Schaeffer, D.; Knall, E.; Constantin, C.; Hofer, L.; Vincena, S.; Tripathi, S.; Niemann, C. Fast gated imaging of the collisionless interaction of a laser-produced and magnetized ambient plasma. High Energy Density Phys. 2017, 22, 17–20. [Google Scholar] [CrossRef]
- Froula, D.; Glenzer, S.; Luhmann, N.L., Jr.; Sheffield, J.; Donné, T.D.H. Plasma Scattering of Electromagnetic Radiation: Theory and Measurement Techniques. Fusion Sci. Technol. 2012, 61, 104–105. [Google Scholar] [CrossRef]
- Schaeffer, D.B.; Constantin, C.G.; Bondarenko, A.S.; Everson, E.T.; Niemann, C. Spatially resolved Thomson scattering measurements of the transition from the collective to the non-collective regime in a laser-produced plasma. Rev. Sci. Instrum. 2016, 87, 11E701. [Google Scholar] [CrossRef]
- Schaeffer, D.B.; Bondarenko, A.S.; Everson, E.T.; Clark, S.E.; Constantin, C.G.; Niemann, C. Characterization of laser-produced carbon plasmas relevant to laboratory astrophysics. J. Appl. Phys. 2016, 120, 043301. [Google Scholar] [CrossRef]
- Newville, M.; Stensitzki, T.; Allen, D.B.; Rawlik, M.; Ingargiola, A.; Nelson, A. Lmfit: Non-Linear Least-Square Minimization and Curve-Fitting for Python. Available online: https://zenodo.org/record/11813 (accessed on 29 July 2023).
- Glenzer, S.H.; Alley, W.E.; Estabrook, K.G.; De Groot, J.S.; Haines, M.G.; Hammer, J.H.; Jadaud, J.P.; MacGowan, B.J.; Moody, J.D.; Rozmus, W.; et al. Thomson scattering from laser plasmas. Phys. Plasmas 1999, 6, 2117–2128. [Google Scholar] [CrossRef]


Disclaimer/Publisher’s Note: The statements, opinions and data contained in all publications are solely those of the individual author(s) and contributor(s) and not of MDPI and/or the editor(s). MDPI and/or the editor(s) disclaim responsibility for any injury to people or property resulting from any ideas, methods, instructions or products referred to in the content. |
© 2023 by the authors. Licensee MDPI, Basel, Switzerland. This article is an open access article distributed under the terms and conditions of the Creative Commons Attribution (CC BY) license (https://creativecommons.org/licenses/by/4.0/).
Share and Cite
Zhang, H.; Pilgram, J.J.; Constantin, C.G.; Rovige, L.; Heuer, P.V.; Ghazaryan, S.; Kaloyan, M.; Dorst, R.S.; Schaeffer, D.B.; Niemann, C. Two-Dimensional Thomson Scattering in Laser-Produced Plasmas. Instruments 2023, 7, 25. https://doi.org/10.3390/instruments7030025
Zhang H, Pilgram JJ, Constantin CG, Rovige L, Heuer PV, Ghazaryan S, Kaloyan M, Dorst RS, Schaeffer DB, Niemann C. Two-Dimensional Thomson Scattering in Laser-Produced Plasmas. Instruments. 2023; 7(3):25. https://doi.org/10.3390/instruments7030025
Chicago/Turabian StyleZhang, Haiping, Jessica J. Pilgram, Carmen G. Constantin, Lucas Rovige, Peter V. Heuer, Sofiya Ghazaryan, Marietta Kaloyan, Robert S. Dorst, Derek B. Schaeffer, and Christoph Niemann. 2023. "Two-Dimensional Thomson Scattering in Laser-Produced Plasmas" Instruments 7, no. 3: 25. https://doi.org/10.3390/instruments7030025