
Combination of Multiple Operando and In-Situ Characterization Techniques in a Single Cluster System for Atomic Layer Deposition: Unraveling the Early Stages of Growth of Ultrathin Al2O3 Films on Metallic Ti Substrates
 , , and
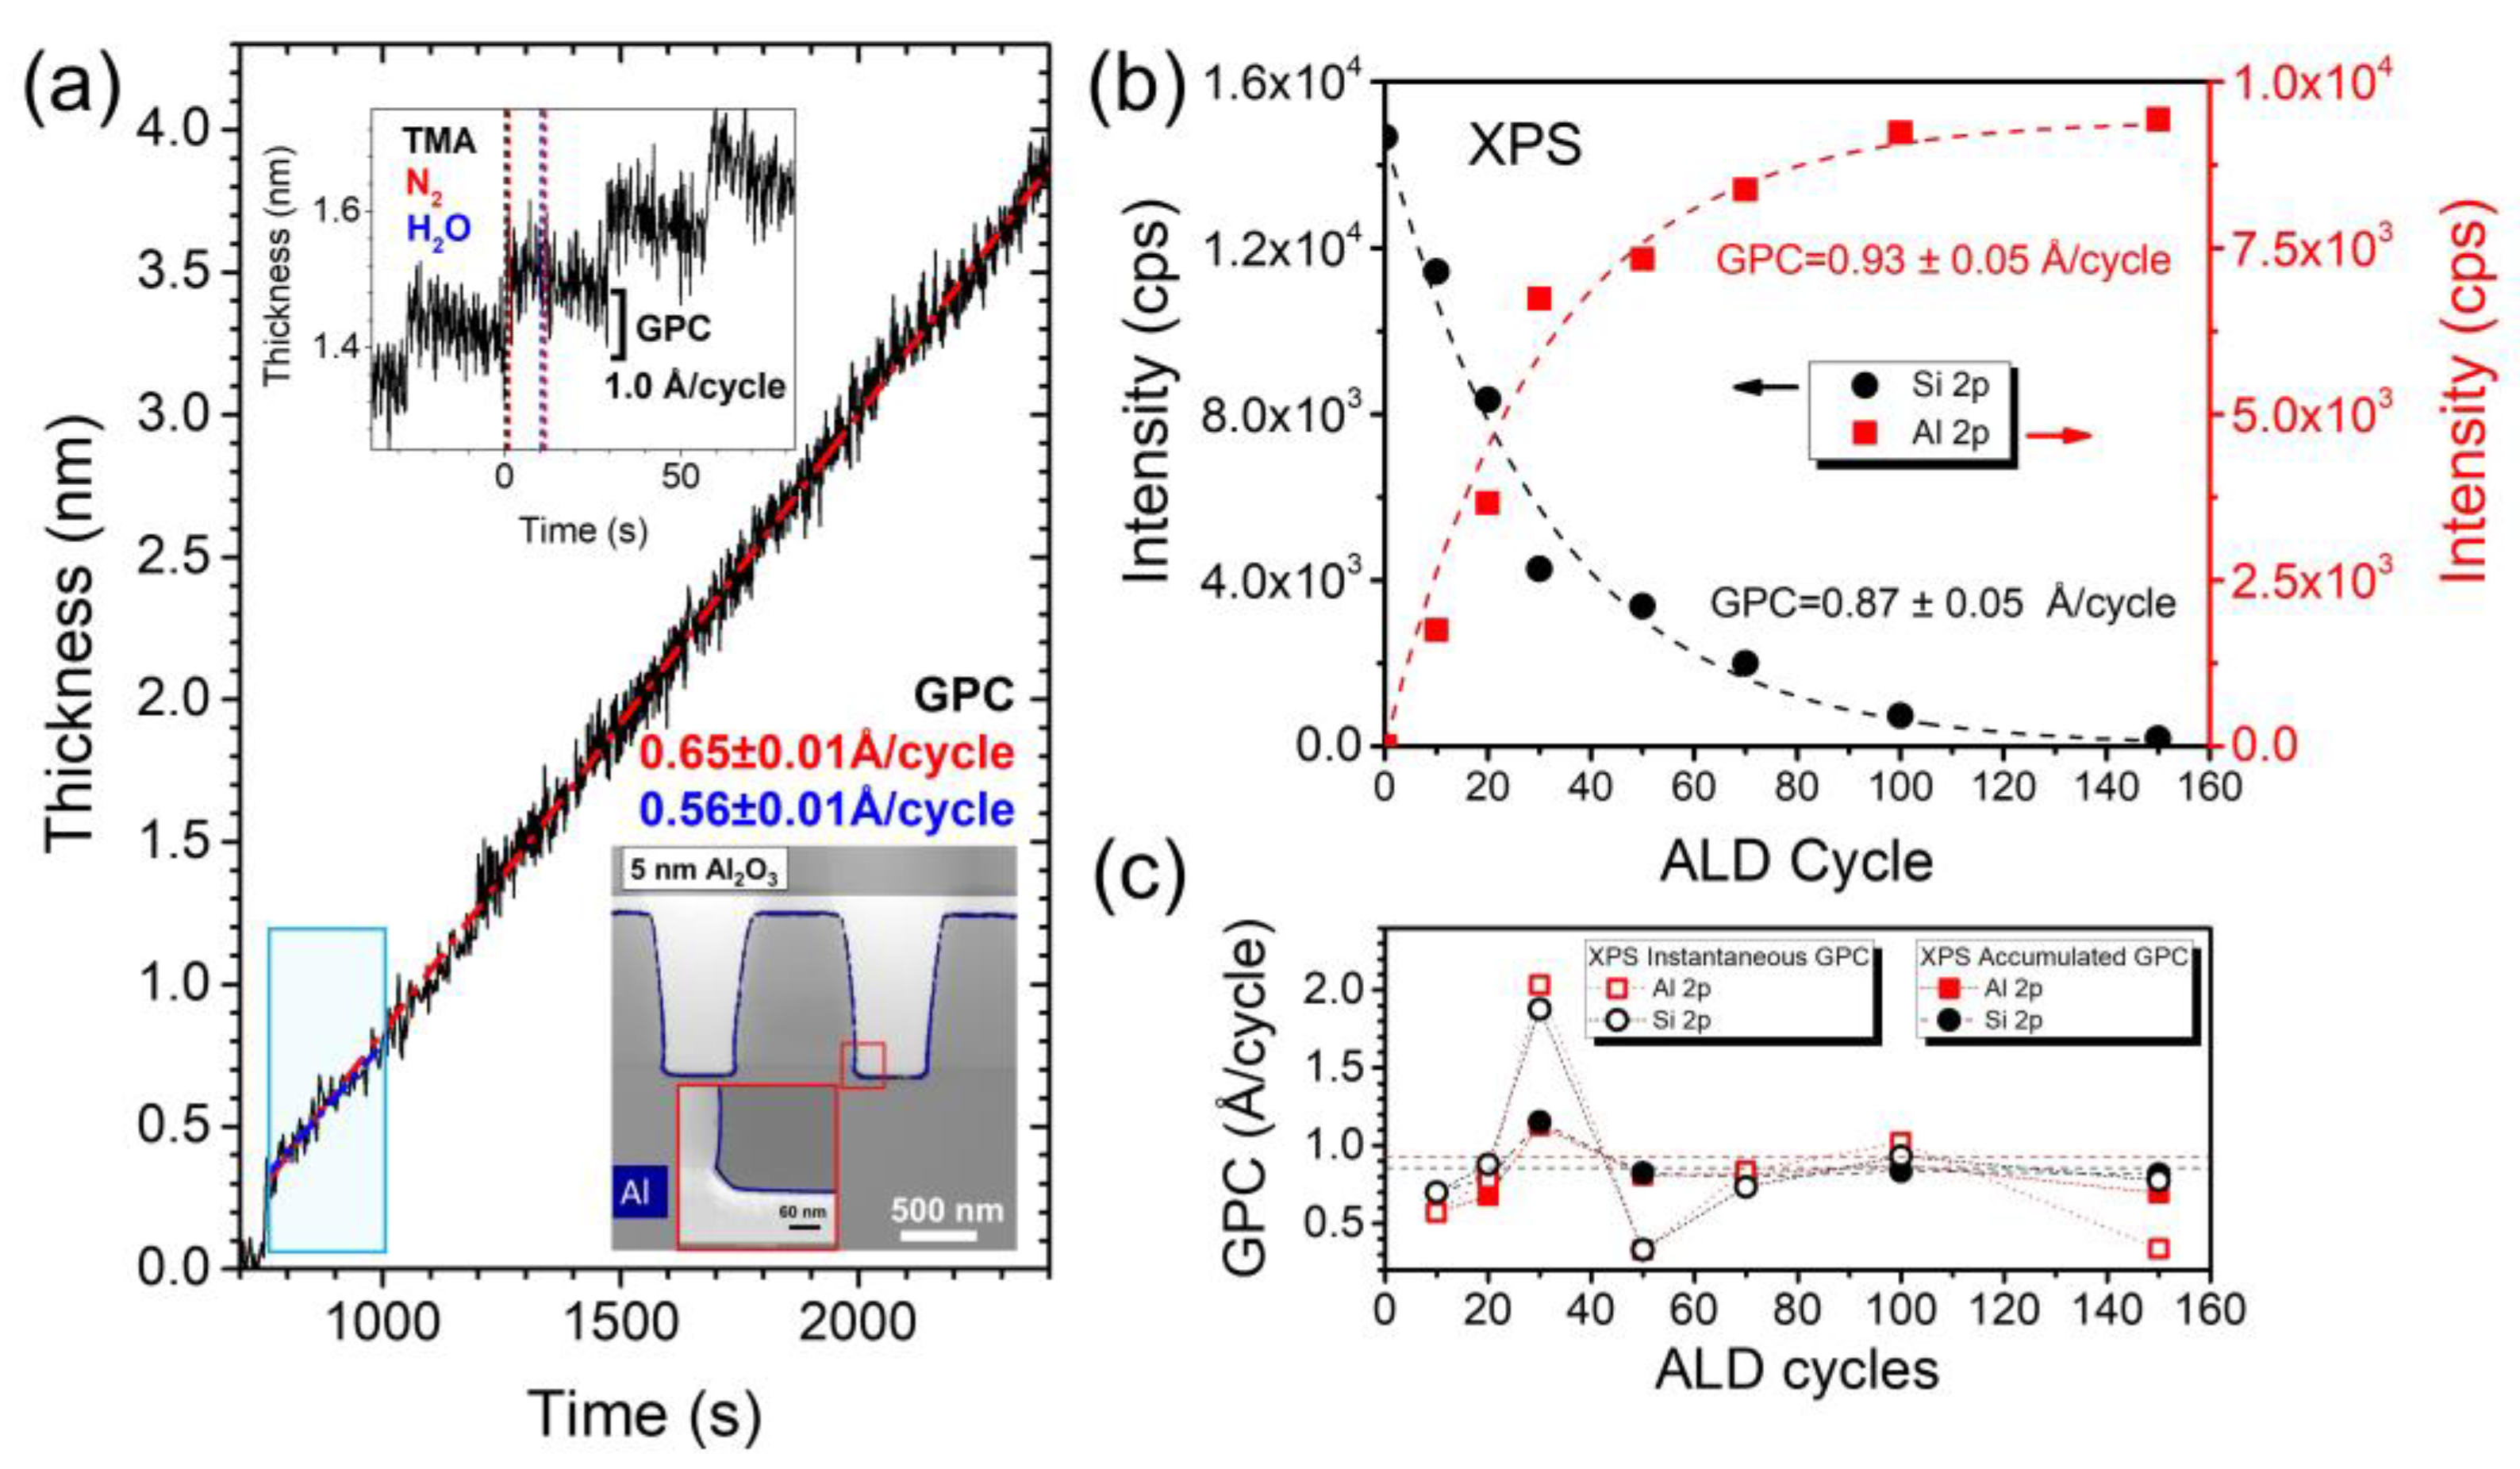
Abstract
:1. Introduction
2. Results
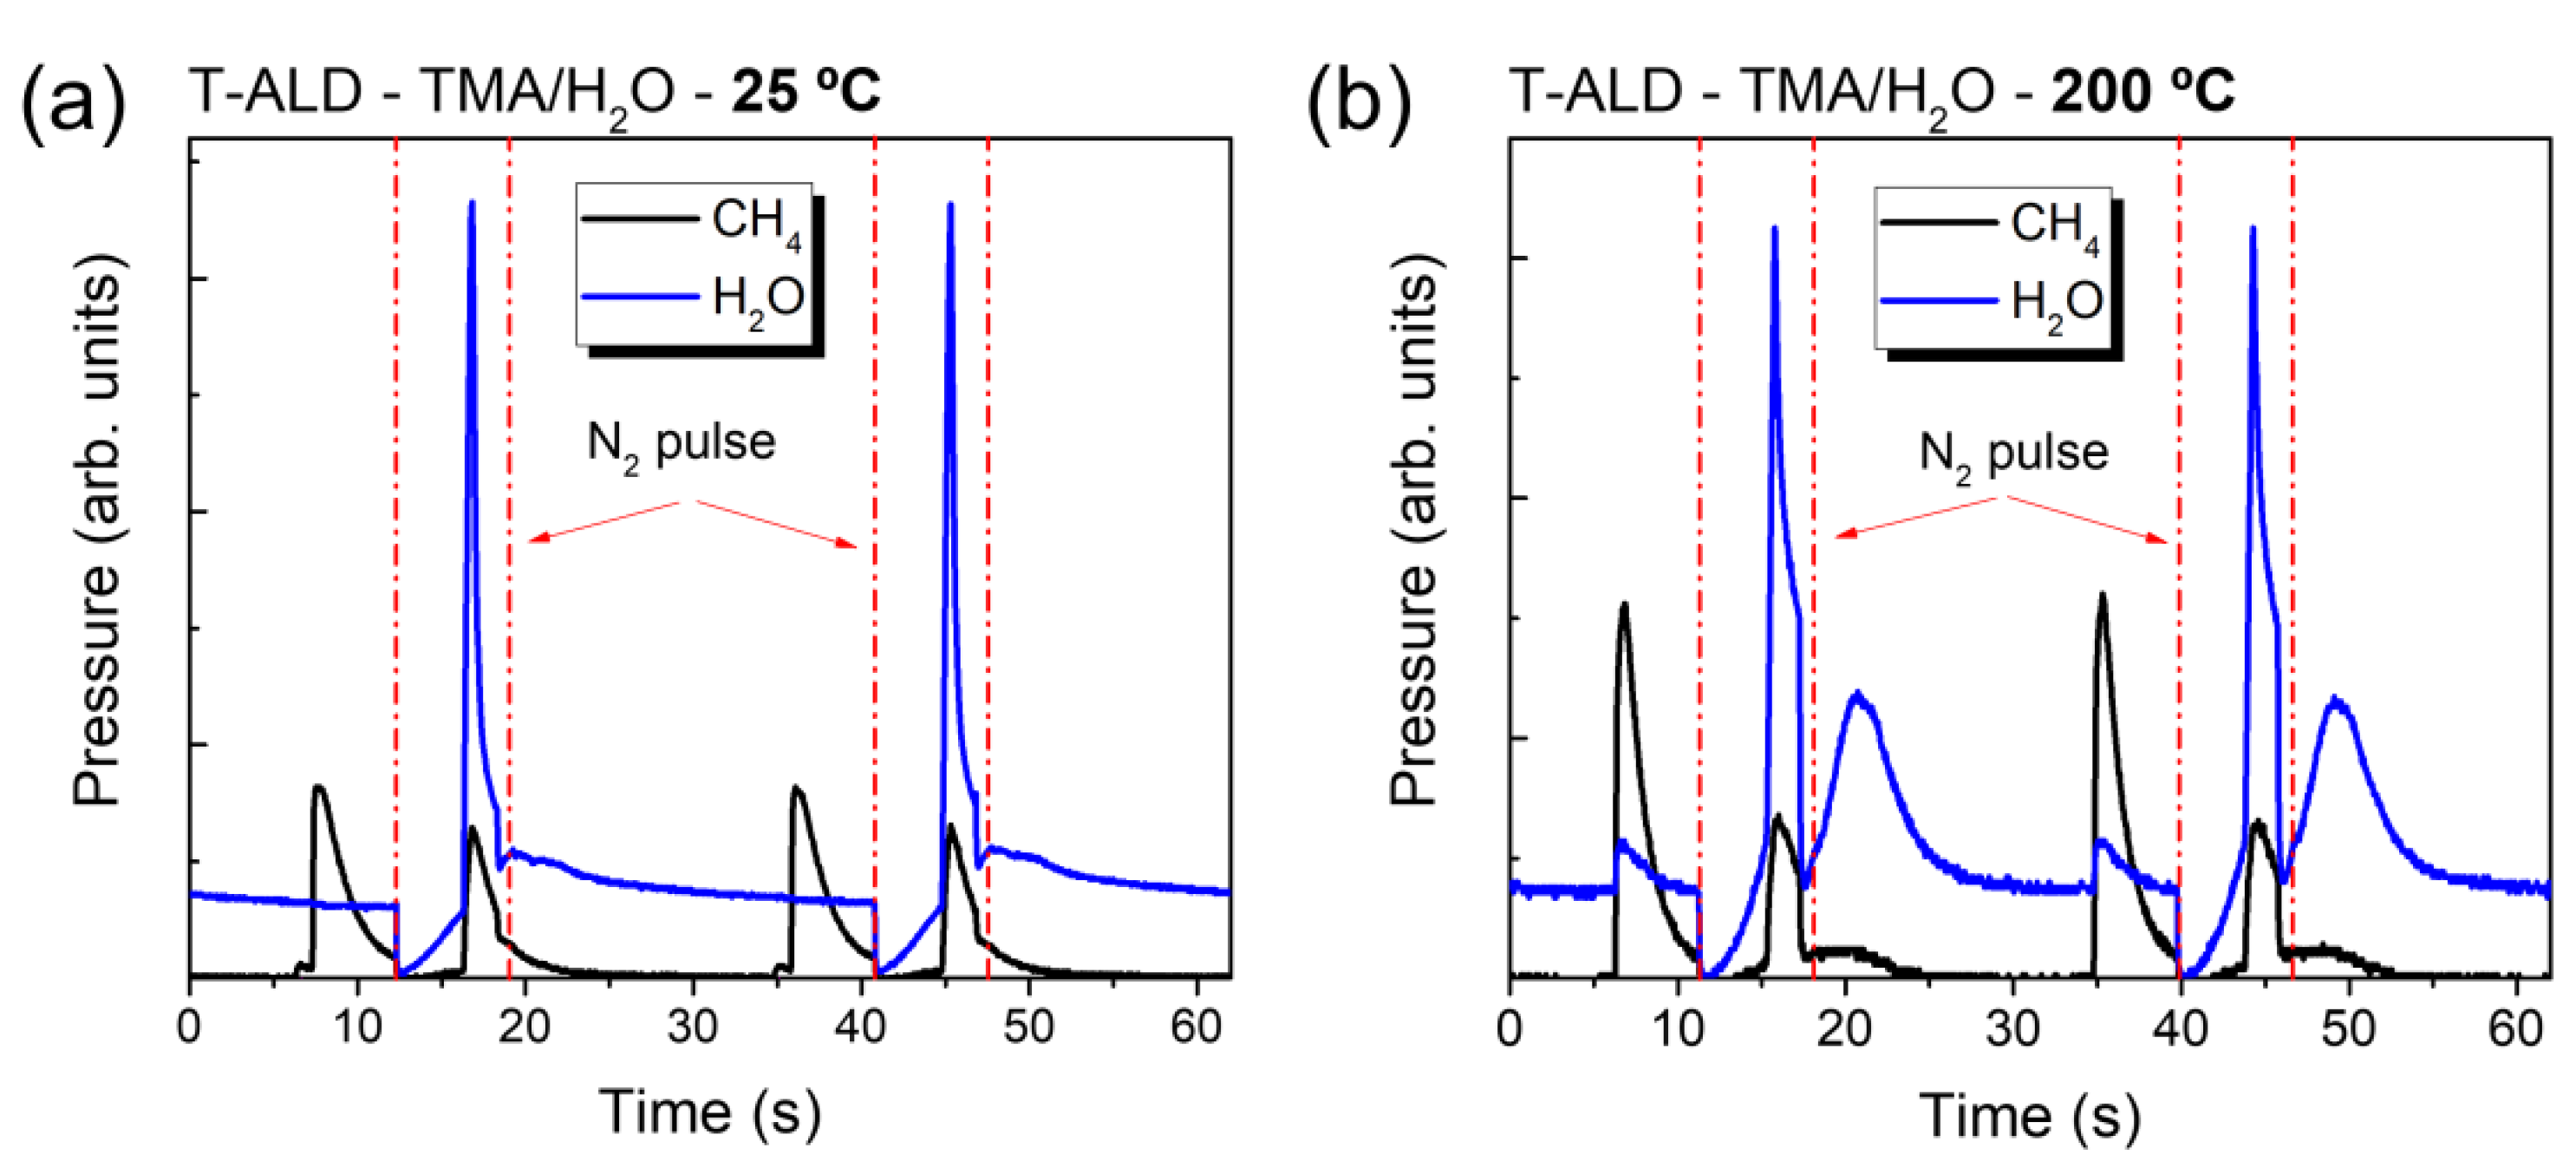
2.1. Operando Characterization
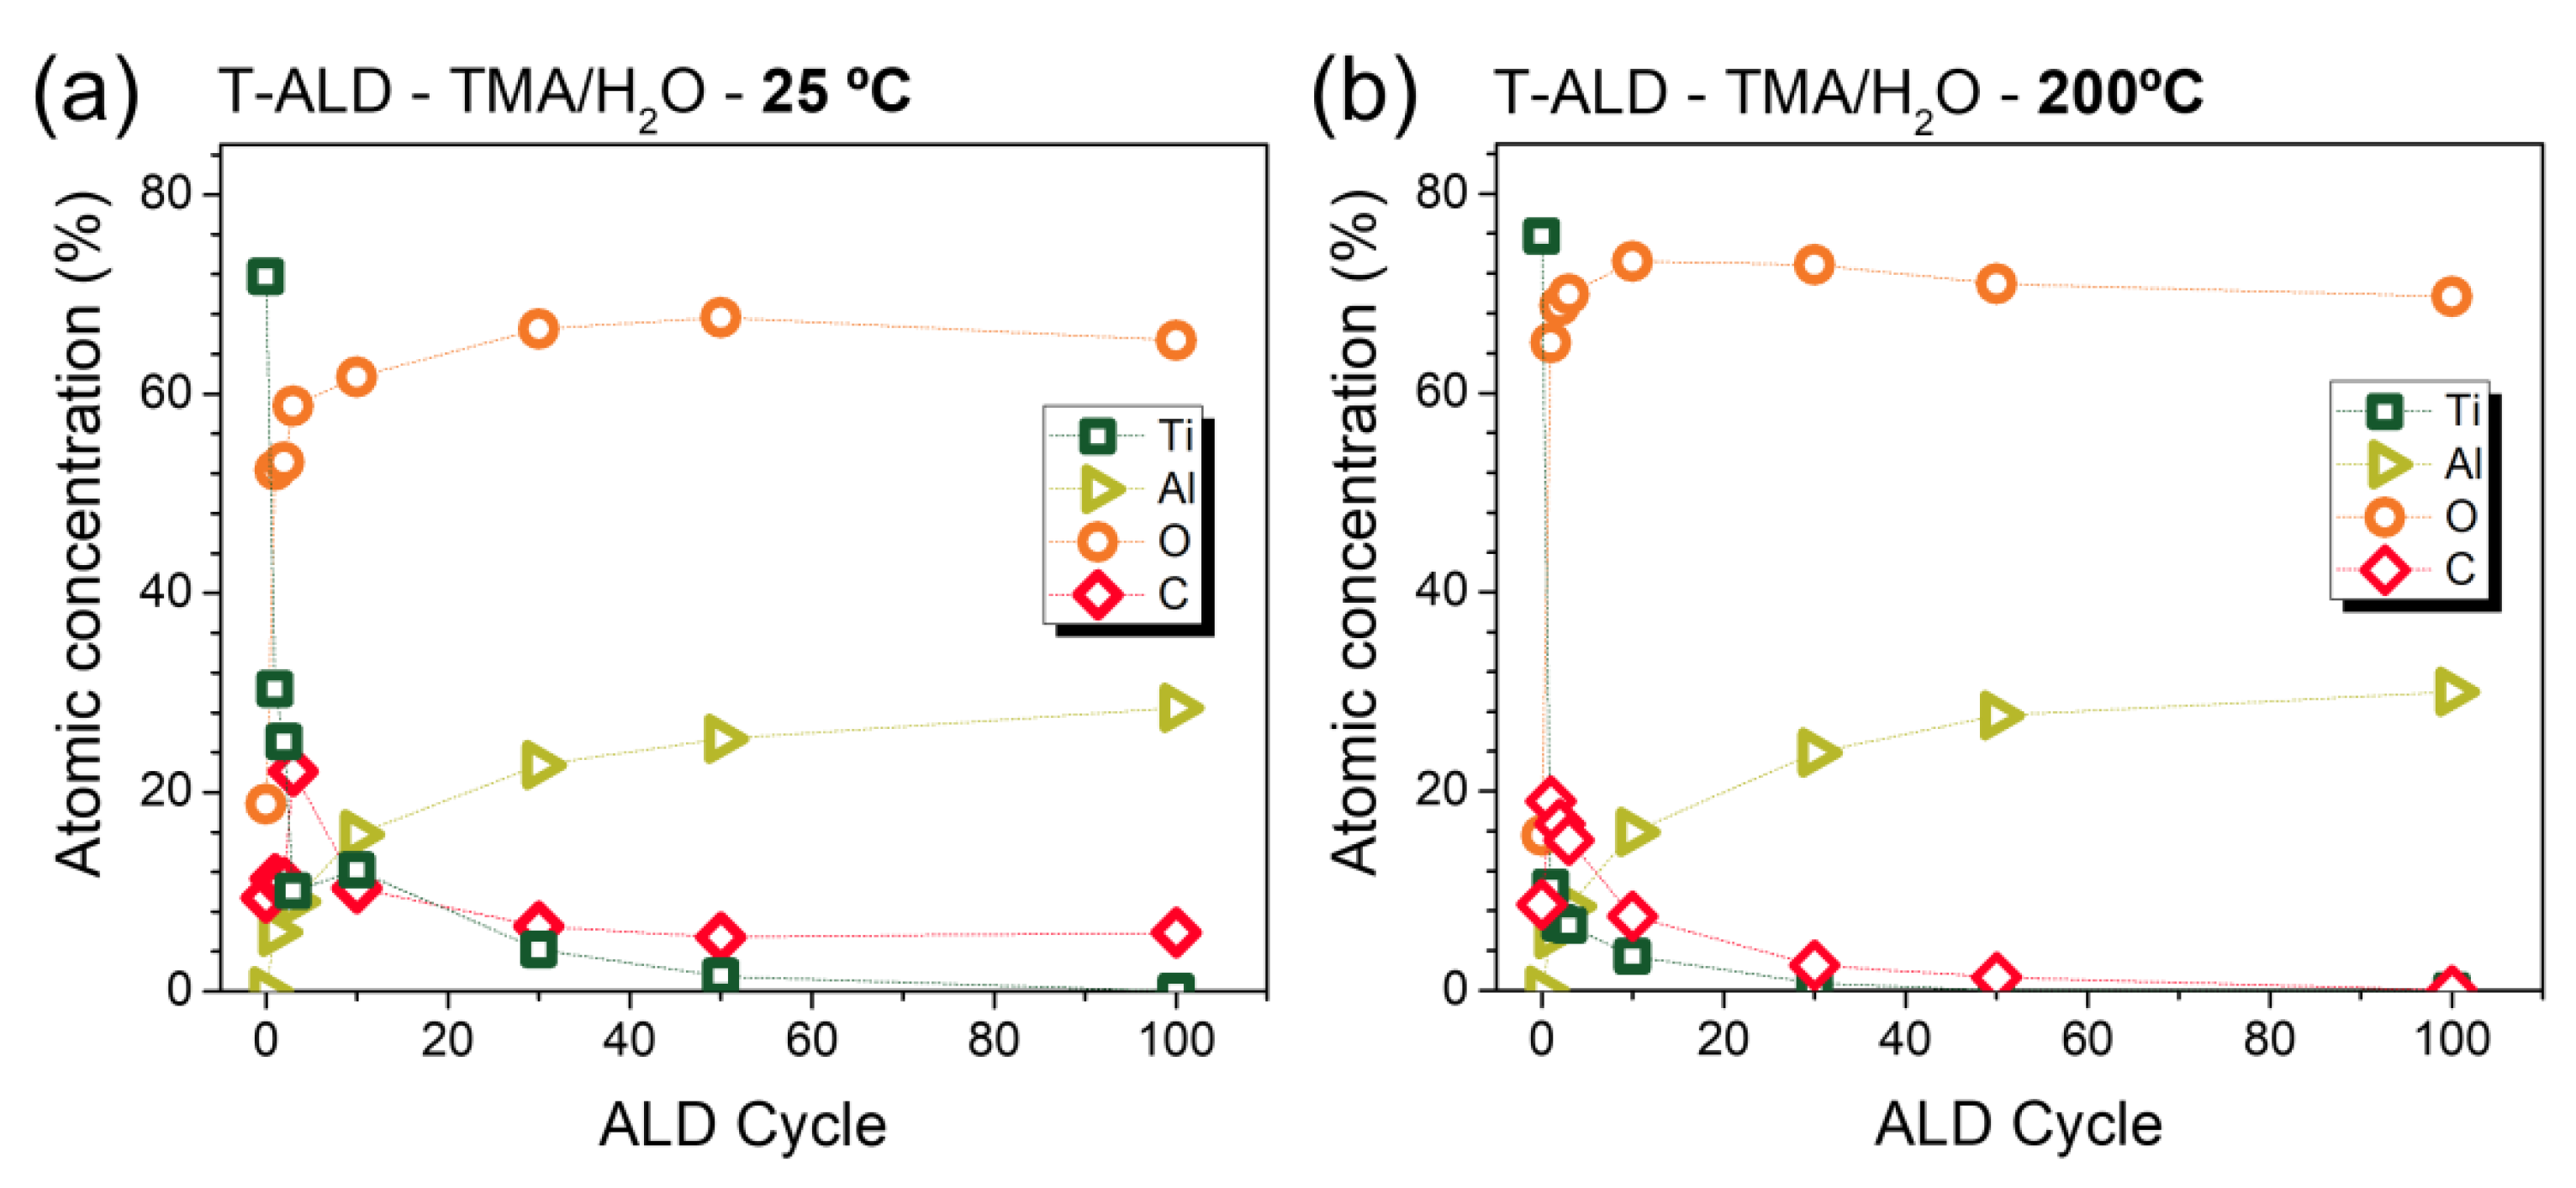
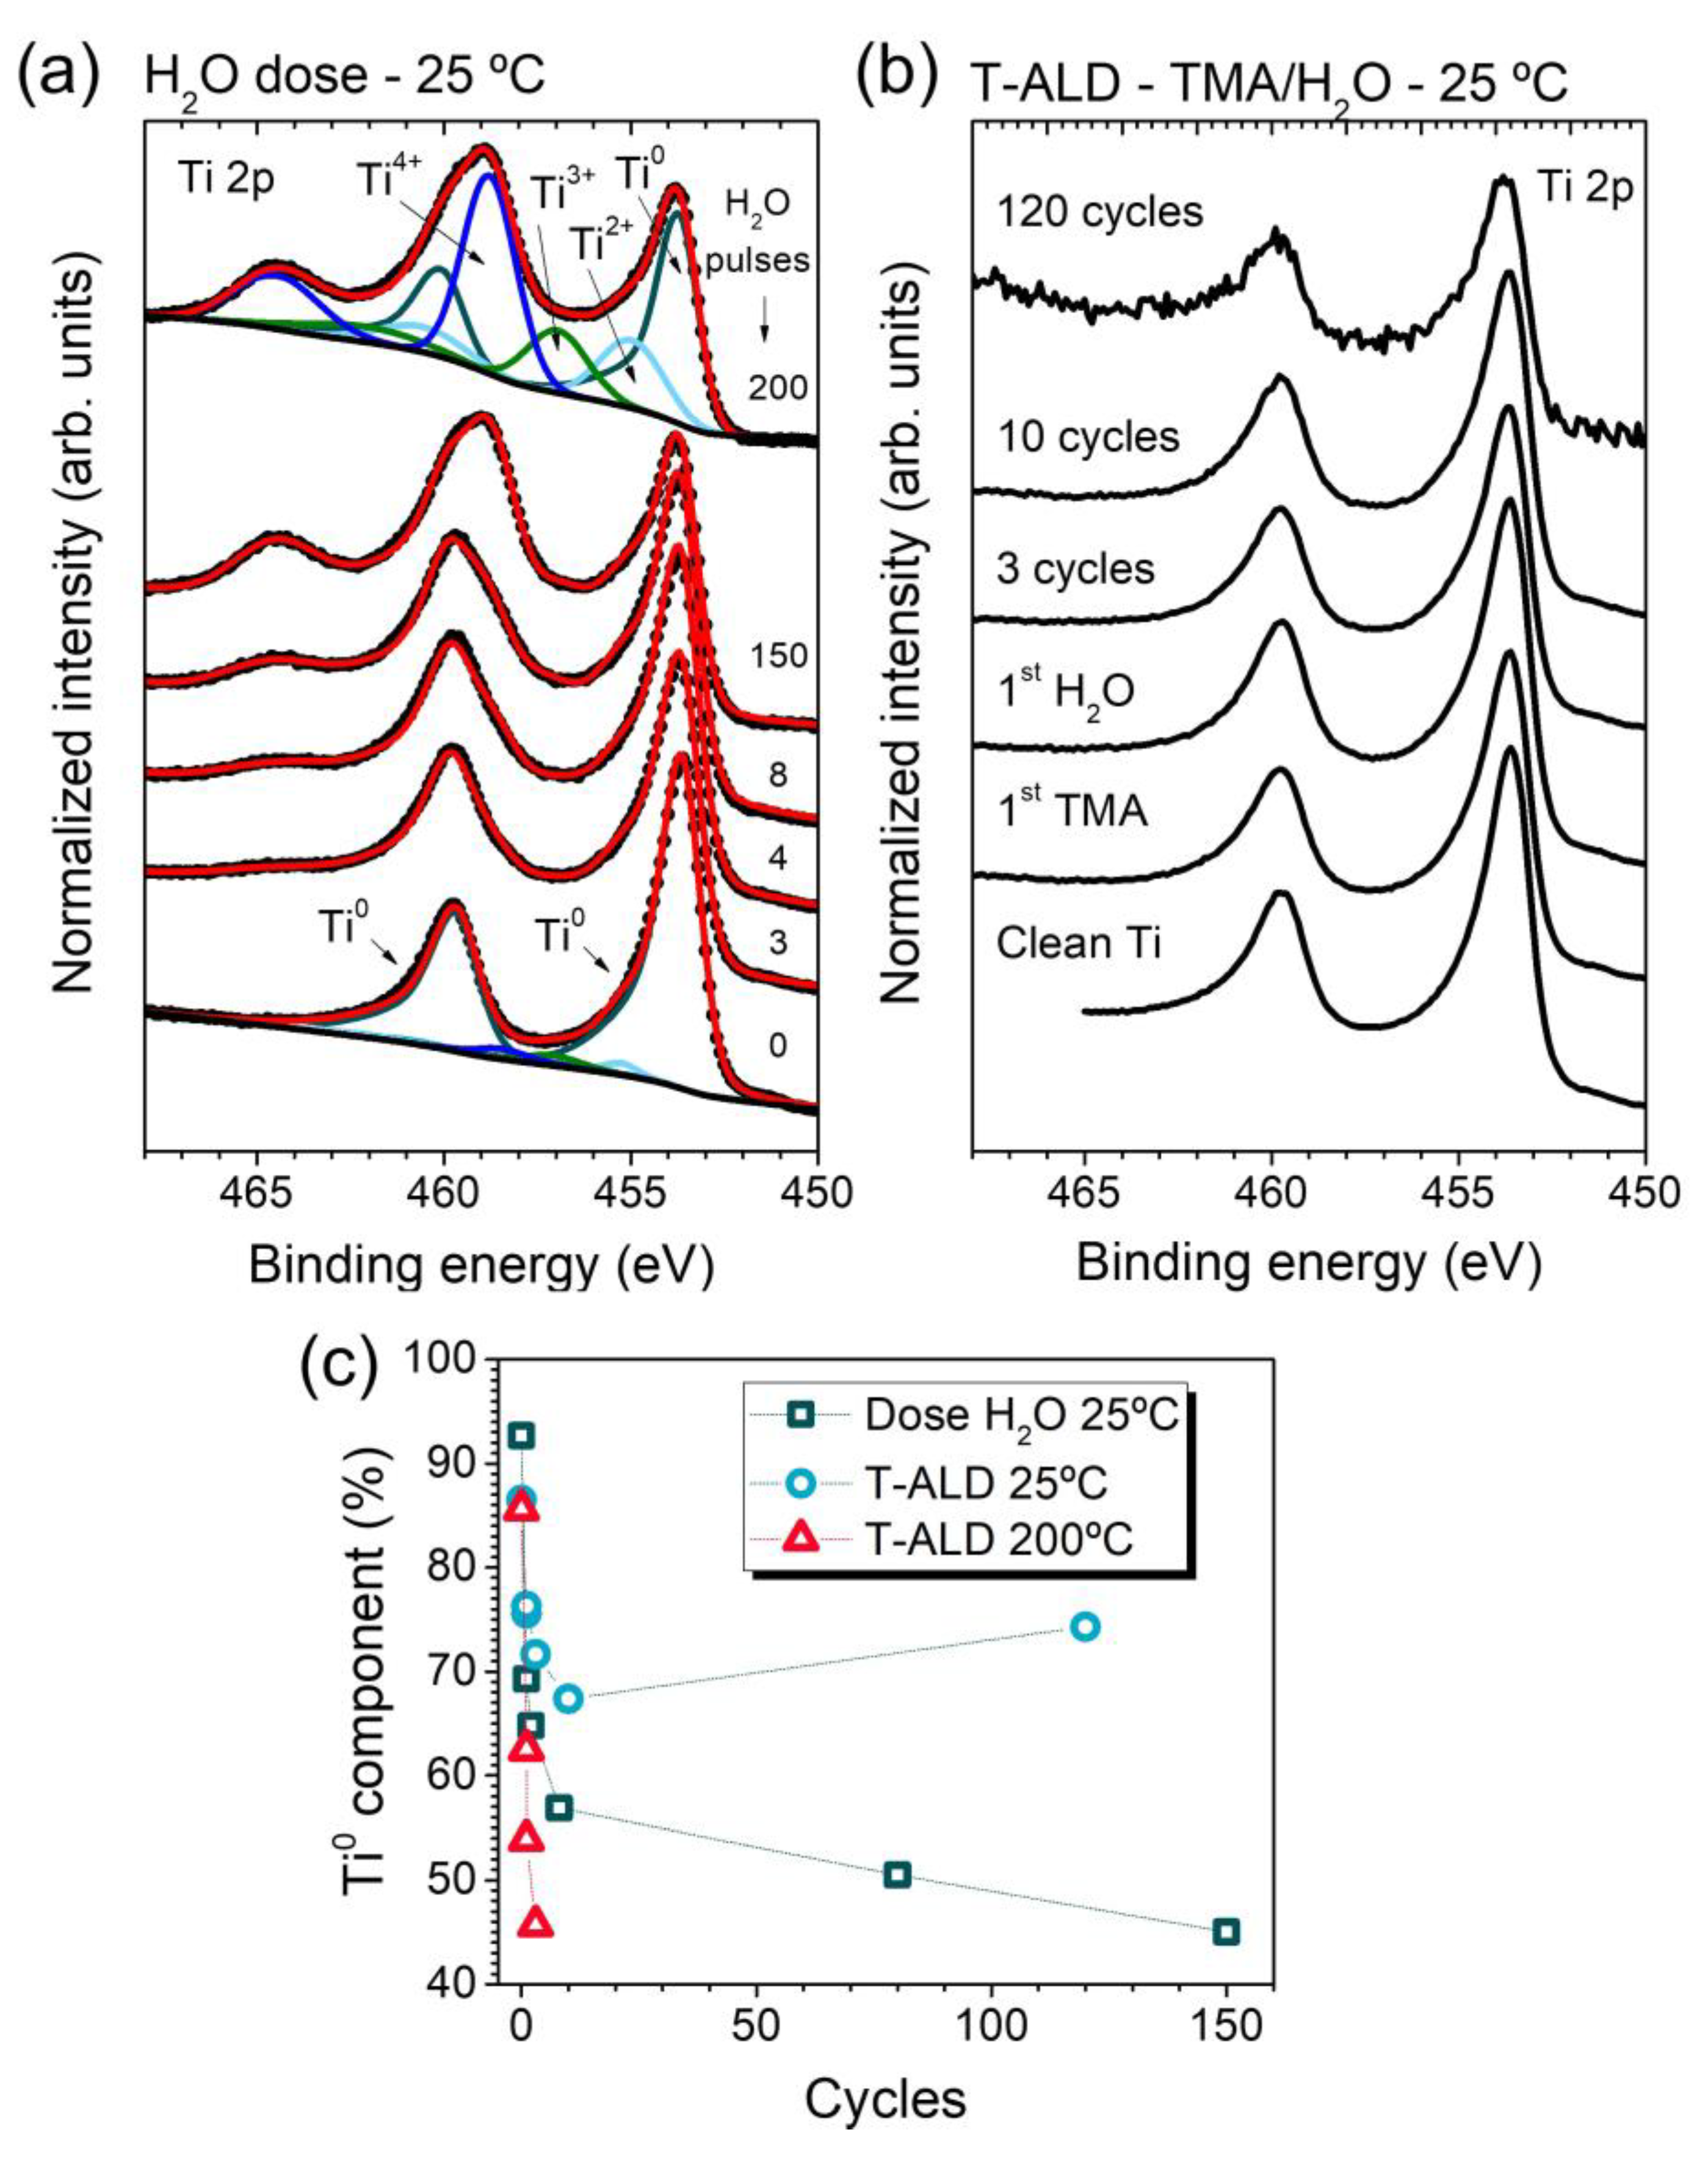
2.2. In Situ Characterization
3. Discussion
4. Materials and Methods
4.1. ALD-XPS Cluster
4.2. Thermal ALD Process
4.3. ALD Film Characterization
5. Conclusions
Author Contributions
Funding
Data Availability Statement
Acknowledgments
Conflicts of Interest
References
- Coll, M.; Napari, M. Atomic Layer Deposition of Functional Multicomponent Oxides. APL Mater. 2019, 7, 110901. [Google Scholar] [CrossRef]
- Cremers, V.; Puurunen, R.L.; Dendooven, J. Conformality in Atomic Layer Deposition: Current Status Overview of Analysis and Modelling. Appl. Phys. Rev. 2019, 6, 021302. [Google Scholar] [CrossRef]
- Oviroh, P.O.; Akbarzadeh, R.; Pan, D.; Coetzee, R.A.M.; Jen, T.-C. New Development of Atomic Layer Deposition: Processes, Methods and Applications. Sci. Technol. Adv. Mater. 2019, 20, 465–496. [Google Scholar] [CrossRef] [PubMed]
- Vasiliev, V.Y. Composition, Structure, and Functional Properties of Thin Silicon Nitride Films Grown by Atomic Layer Deposition for Microelectronic Applications (Review of 25 Years of Research). J. Struct. Chem. 2022, 63, 1019–1050. [Google Scholar] [CrossRef]
- Alvaro, E.; Yanguas-Gil, A. Characterizing the Field of Atomic Layer Deposition: Authors, Topics, and Collaborations. PLoS ONE 2018, 13, e0189137. [Google Scholar] [CrossRef] [PubMed]
- Xing, Z.; Xiao, J.; Hu, T.; Meng, X.; Li, D.; Hu, X.; Chen, Y. Atomic Layer Deposition of Metal Oxides in Perovskite Solar Cells: Present and Future. Small Methods 2020, 4, 2000588. [Google Scholar] [CrossRef]
- Ghosh, S.; Yadav, R. Future of Photovoltaic Technologies: A Comprehensive Review. Sustain. Energy Technol. Assess. 2021, 47, 101410. [Google Scholar] [CrossRef]
- Marichy, C.; Pinna, N. Atomic Layer Deposition to Materials for Gas Sensing Applications. Adv. Mater. Interfaces 2016, 3, 1600335. [Google Scholar] [CrossRef]
- Xu, H.; Akbari, M.K.; Kumar, S.; Verpoort, F.; Zhuiykov, S. Atomic Layer Deposition—State-of-the-Art Approach to Nanoscale Hetero-Interfacial Engineering of Chemical Sensors Electrodes: A Review. Sens. Actuators B Chem. 2021, 331, 129403. [Google Scholar] [CrossRef]
- Cao, K.; Cai, J.; Liu, X.; Chen, R. Review Article: Catalysts Design and Synthesis via Selective Atomic Layer Deposition. J. Vac. Sci. Technol. A Vac. Surf. Films 2018, 36, 010801. [Google Scholar] [CrossRef]
- Xu, D.; Yin, J.; Gao, Y.; Zhu, D.; Wang, S. Atomic-Scale Designing of Zeolite Based Catalysts by Atomic Layer Deposition. ChemPhysChem 2021, 22, 1287–1301. [Google Scholar] [CrossRef]
- Zhao, Z.; Kong, Y.; Zhang, Z.; Huang, G.; Mei, Y. Atomic Layer–Deposited Nanostructures and Their Applications in Energy Storage and Sensing. J. Mater. Res. 2020, 35, 701–719. [Google Scholar] [CrossRef]
- Zhao, Y.; Zhang, L.; Liu, J.; Adair, K.; Zhao, F.; Sun, Y.; Wu, T.; Bi, X.; Amine, K.; Lu, J.; et al. Atomic/Molecular Layer Deposition for Energy Storage and Conversion. Chem. Soc. Rev. 2021, 50, 3889–3956. [Google Scholar] [CrossRef]
- Richey, N.E.; de Paula, C.; Bent, S.F. Understanding Chemical and Physical Mechanisms in Atomic Layer Deposition. J. Chem. Phys. 2020, 152, 040902. [Google Scholar] [CrossRef]
- Chen, R.; Kim, H.; McIntyre, P.C.; Porter, D.W.; Bent, S.F. Achieving Area-Selective Atomic Layer Deposition on Patterned Substrates by Selective Surface Modification. Appl. Phys. Lett. 2005, 86, 191910. [Google Scholar] [CrossRef]
- Elliott, S.D. Atomic-Scale Simulation of ALD Chemistry. Semicond. Sci. Technol. 2012, 27, 074008. [Google Scholar] [CrossRef]
- Mackus, A.J.; Merkx, M.J.; Kessels, W.M. From the Bottom-up: Toward Area-Selective Atomic Layer Deposition with High Selectivity. Chem. Mater. 2018, 31, 2–12. [Google Scholar] [CrossRef]
- Devi, A. ‘Old Chemistries’ for New Applications: Perspectives for Development of Precursors for MOCVD and ALD Applications. Coord. Chem. Rev. 2013, 257, 3332–3384. [Google Scholar] [CrossRef]
- Hatanpää, T.; Ritala, M.; Leskelä, M. Precursors as Enablers of ALD Technology: Contributions from University of Helsinki. Coord. Chem. Rev. 2013, 257, 3297–3322. [Google Scholar] [CrossRef]
- Shahmohammadi, M.; Mukherjee, R.; Takoudis, C.G.; Diwekar, U.M. Optimal Design of Novel Precursor Materials for the Atomic Layer Deposition Using Computer-Aided Molecular Design. Chem. Eng. Sci. 2021, 234, 116416. [Google Scholar] [CrossRef]
- Oh, I.-K.; Sandoval, T.E.; Liu, T.-L.; Richey, N.E.; Bent, S.F. Role of Precursor Choice on Area-Selective Atomic Layer Deposition. Chem. Mater. 2021, 33, 3926–3935. [Google Scholar] [CrossRef]
- Sønsteby, H.H.; Yanguas-Gil, A.; Elam, J.W. Consistency and Reproducibility in Atomic Layer Deposition. J. Vac. Sci. Technol. A Vac. Surf. Films 2020, 38, 020804. [Google Scholar] [CrossRef]
- Elam, J.W.; Schuisky, M.; Ferguson, J.D.; George, S.M. Surface Chemistry and Film Growth during TiN Atomic Layer Deposition Using TDMAT and NH3. Thin Solid. Films 2003, 436, 145–156. [Google Scholar] [CrossRef]
- Meng, X.; Cao, Y.; Libera, J.A.; Elam, J.W. Atomic Layer Deposition of Aluminum Sulfide: Growth Mechanism and Electrochemical Evaluation in Lithium-Ion Batteries. Chem. Mater. 2017, 29, 9043–9052. [Google Scholar] [CrossRef]
- Nieminen, H.-E.; Chundak, M.; Heikkilä, M.J.; Kärkkäinen, P.R.; Vehkamäki, M.; Putkonen, M.; Ritala, M. In Vacuo Cluster Tool for Studying Reaction Mechanisms in Atomic Layer Deposition and Atomic Layer Etching Processes. J. Vac. Sci. Technol. A 2023, 41, 022401. [Google Scholar] [CrossRef]
- Schmidt, D.; Strehle, S.; Albert, M.; Hentsch, W.; Bartha, J.W. Top Injection Reactor Tool with in Situ Spectroscopic Ellipsometry for Growth and Characterization of ALD Thin Films. Microelectron. Eng. 2008, 85, 527–533. [Google Scholar] [CrossRef]
- Naumann, F.; Reck, J.; Gargouri, H.; Gruska, B.; Blümich, A.; Mahmoodinezhad, A.; Janowitz, C.; Henkel, K.; Flege, J.I. In Situ Real-Time and Ex Situ Spectroscopic Analysis of Al2O3 Films Prepared by Plasma Enhanced Atomic Layer Deposition. J. Vac. Sci. Technol. B 2020, 38, 014014. [Google Scholar] [CrossRef]
- Sønsteby, H.H.; Bratvold, J.E.; Weibye, K.; Fjellvåg, H.; Nilsen, O. Phase Control in Thin Films of Layered Cuprates. Chem. Mater. 2018, 30, 1095–1101. [Google Scholar] [CrossRef]
- Juppo, M.; Rahtu, A.; Ritala, M.; Leskelä, M. In Situ Mass Spectrometry Study on Surface Reactions in Atomic Layer Deposition of Al2O3 Thin Films from Trimethylaluminum and Water. Langmuir 2000, 16, 4034–4039. [Google Scholar] [CrossRef]
- Matero, R.; Rahtu, A.; Ritala, M. In Situ Quadrupole Mass Spectrometry and Quartz Crystal Microbalance Studies on the Atomic Layer Deposition of Titanium Dioxide from Titanium Tetrachloride and Water. Chem. Mater. 2001, 13, 4506–4511. [Google Scholar] [CrossRef]
- Goldstein, D.N.; McCormick, J.A.; George, S.M. Al2O3 Atomic Layer Deposition with Trimethylaluminum and Ozone Studied by in Situ Transmission FTIR Spectroscopy and Quadrupole Mass Spectrometry. J. Phys. Chem. C 2008, 112, 19530–19539. [Google Scholar] [CrossRef]
- Cabrera, W.; Halls, M.D.; Povey, I.M.; Chabal, Y.J. Surface Oxide Characterization and Interface Evolution in Atomic Layer Deposition of Al2O3 on InP(100) Studied by in Situ Infrared Spectroscopy. J. Phys. Chem. C 2014, 118, 5862–5871. [Google Scholar] [CrossRef]
- Kokkonen, E.; Kaipio, M.; Nieminen, H.-E.; Rehman, F.; Miikkulainen, V.; Putkonen, M.; Ritala, M.; Huotari, S.; Schnadt, J.; Urpelainen, S. Ambient Pressure X-ray Photoelectron Spectroscopy Setup for Synchrotron-Based In Situ and Operando Atomic Layer Deposition Research. Rev. Sci. Instrum. 2022, 93, 013905. [Google Scholar] [CrossRef] [PubMed]
- Shavorskiy, A.; Kokkonen, E.; Redekop, E.; D’Acunto, G.; Schnadt, J.; Knudsen, J. Time-Resolved APXPS with Chemical Potential Perturbations: Recent Developments at the MAX IV Laboratory. Synchrotron Radiat. News 2022, 35, 4–10. [Google Scholar] [CrossRef]
- D’Acunto, G.; Shayesteh, P.; Kokkonen, E.; Boix De La Cruz, V.; Rehman, F.; Mosahebfard, Z.; Lind, E.; Schnadt, J.; Timm, R. Time Evolution of Surface Species during the ALD of High-k Oxide on InAs. Surf. Interfaces 2023, 39, 102927. [Google Scholar] [CrossRef]
- Head, A.R.; Chaudhary, S.; Olivieri, G.; Bournel, F.; Andersen, J.N.; Rochet, F.; Gallet, J.-J.; Schnadt, J. Near Ambient Pressure X-ray Photoelectron Spectroscopy Study of the Atomic Layer Deposition of TiO2 on RuO2 (110). J. Phys. Chem. C 2016, 120, 243–251. [Google Scholar] [CrossRef]
- Temperton, R.H.; Gibson, A.; O’Shea, J.N. In Situ XPS Analysis of the Atomic Layer Deposition of Aluminium Oxide on Titanium Dioxide. Phys. Chem. Chem. Phys. 2019, 21, 1393–1398. [Google Scholar] [CrossRef]
- Strehle, S.; Schumacher, H.; Schmidt, D.; Knaut, M.; Albert, M.; Bartha, J.W. Effect of Wet Chemical Substrate Pretreatment on the Growth Behavior of Ta(N) Films Deposited by Thermal ALD. Microelectron. Eng. 2008, 85, 2064–2067. [Google Scholar] [CrossRef]
- Fukumizu, H.; Sekine, M.; Hori, M.; McIntyre, P.C. Initial Growth Analysis of ALD Al2O3 Film on Hydrogen-Terminated Si Substrate via in Situ XPS. Jpn. J. Appl. Phys. 2020, 59, 016504. [Google Scholar] [CrossRef]
- Tallarida, M.; Karavaev, K.; Schmeisser, D. The Initial Atomic Layer Deposition of HfO2/Si(001) as Followed In Situ by Synchrotron Radiation Photoelectron Spectroscopy. J. Appl. Phys. 2008, 104, 064116. [Google Scholar] [CrossRef]
- Kolanek, K.; Tallarida, M.; Michling, M.; Schmeisser, D. In Situ Study of the Atomic Layer Deposition of HfO2 on Si. J. Vac. Sci. Technol. A Vac. Surf. Films 2012, 30, 01A143. [Google Scholar] [CrossRef]
- Tallarida, M.; Schmeisser, D. In Situ ALD Experiments with Synchrotron Radiation Photoelectron Spectroscopy. Semicond. Sci. Technol. 2012, 27, 074010. [Google Scholar] [CrossRef]
- Devloo-Casier, K.; Ludwig, K.F.; Detavernier, C.; Dendooven, J. In Situ Synchrotron Based X-ray Techniques as Monitoring Tools for Atomic Layer Deposition. J. Vac. Sci. Technol. A Vac. Surf. Films 2014, 32, 010801. [Google Scholar] [CrossRef]
- Dingemans, G.; Kessels, W.M.M. Status and Prospects of Al2O3-Based Surface Passivation Schemes for Silicon Solar Cells. J. Vac. Sci. Technol. A Vac. Surf. Films 2012, 30, 040802. [Google Scholar] [CrossRef]
- Zardetto, V.; Williams, B.L.; Perrotta, A.; Di Giacomo, F.; Verheijen, M.A.; Andriessen, R.; Kessels, W.M.M.; Creatore, M. Atomic Layer Deposition for Perovskite Solar Cells: Research Status, Opportunities and Challenges. Sustain. Energy Fuels 2017, 1, 30–55. [Google Scholar] [CrossRef]
- Banerjee, S.; Das, M.K. A Review of Al2O3 as Surface Passivation Material with Relevant Process Technologies on C-Si Solar Cell. Opt. Quant. Electron. 2021, 53, 60. [Google Scholar] [CrossRef]
- Ghosh, S.; Pariari, D.; Behera, T.; Boix, P.P.; Ganesh, N.; Basak, S.; Vidhan, A.; Sarda, N.; Mora-Seró, I.; Chowdhury, A.; et al. Buried Interface Passivation of Perovskite Solar Cells by Atomic Layer Deposition of Al2O3. ACS Energy Lett. 2023, 8, 2058–2065. [Google Scholar] [CrossRef]
- Mahmoodinezhad, A.; Janowitz, C.; Naumann, F.; Plate, P.; Gargouri, H.; Henkel, K.; Schmeißer, D.; Flege, J.I. Low-Temperature Growth of Gallium Oxide Thin Films by Plasma-Enhanced Atomic Layer Deposition. J. Vac. Sci. Technol. A Vac. Surf. Films 2020, 38, 022404. [Google Scholar] [CrossRef]
- Briggs, D.; Seah, M.P. (Eds.) Practical Surface Analysis, 2nd ed.; Chapter 5; Wiley: New York, NY, USA, 1990; Volume 1, ISBN 978-0-471-92081-6. [Google Scholar]
- Vandalon, V.; Kessels, W.M.M. What Is Limiting Low-Temperature Atomic Layer Deposition of Al2O3? A Vibrational Sum-Frequency Generation Study. Appl. Phys. Lett. 2016, 108, 011607. [Google Scholar] [CrossRef]
- Sperling, B.A.; Kalanyan, B.; Maslar, J.E. Atomic Layer Deposition of Al2O3 Using Trimethylaluminum and H2O: The Kinetics of the H2O Half-Cycle. J. Phys. Chem. C 2020, 124, 3410–3420. [Google Scholar] [CrossRef]
- Gu, B.; Le Trinh, N.; Nguyen, C.T.; Yasmeen, S.; Gaiji, H.; Kang, Y.; Lee, H.-B.-R. Computational Modeling of Physical Surface Reactions of Precursors in Atomic Layer Deposition by Monte Carlo Simulations on a Home Desktop Computer. Chem. Mater. 2022, 34, 7635–7649. [Google Scholar] [CrossRef]
- Puurunen, R.L. Surface Chemistry of Atomic Layer Deposition: A Case Study for the Trimethylaluminum/Water Process. J. Appl. Phys. 2005, 97, 121301. [Google Scholar] [CrossRef]
- Renault, O.; Gosset, L.G.; Rouchon, D.; Ermolieff, A. Angle-Resolved X-ray Photoelectron Spectroscopy of Ultrathin Al2O3 Films Grown by Atomic Layer Deposition. J. Vac. Sci. Technol. A Vac. Surf. Films 2002, 20, 1867–1876. [Google Scholar] [CrossRef]
- Zhang, L.; Jiang, H.C.; Liu, C.; Dong, J.W.; Chow, P. Annealing of Al2O3 Thin Films Prepared by Atomic Layer Deposition. J. Phys. D Appl. Phys. 2007, 40, 3707–3713. [Google Scholar] [CrossRef]
- Kääriäinen, T.O.; Cameron, D.C. Plasma-Assisted Atomic Layer Deposition of Al2O3 at Room Temperature. Plasma Process. Polym. 2009, 6, S237–S241. [Google Scholar] [CrossRef]
- Biesinger, M.C.; Lau, L.W.M.; Gerson, A.R.; Smart, R.S.C. Resolving Surface Chemical States in XPS Analysis of First Row Transition Metals, Oxides and Hydroxides: Sc, Ti, V, Cu and Zn. Appl. Surf. Sci. 2010, 257, 887–898. [Google Scholar] [CrossRef]
- Richter, A.; Benick, J.; Hermle, M.; Glunz, S.W. Excellent Silicon Surface Passivation with 5 Å Thin ALD Al2O3 Layers: Influence of Different Thermal Post-Deposition Treatments: Excellent Silicon Surface Passivation with 5 Å Thin ALD Al2O3 Layers: Influence of Different Thermal Post-Deposition Treatments. Phys. Status Solidi RRL 2011, 5, 202–204. [Google Scholar] [CrossRef]
- Pain, S.L.; Khorani, E.; Niewelt, T.; Wratten, A.; Paez Fajardo, G.J.; Winfield, B.P.; Bonilla, R.S.; Walker, M.; Piper, L.F.J.; Grant, N.E.; et al. Electronic Characteristics of Ultra-Thin Passivation Layers for Silicon Photovoltaics. Adv. Mater. Inter. 2022, 9, 2201339. [Google Scholar] [CrossRef]
- Kot, M.; Das, C.; Wang, Z.; Henkel, K.; Rouissi, Z.; Wojciechowski, K.; Snaith, H.J.; Schmeisser, D. Room-Temperature Atomic Layer Deposition of Al2O3: Impact on Efficiency, Stability and Surface Properties in Perovskite Solar Cells. ChemSusChem 2016, 9, 3401–3406. [Google Scholar] [CrossRef]
- Ramos, F.J.; Maindron, T.; Béchu, S.; Rebai, A.; Frégnaux, M.; Bouttemy, M.; Rousset, J.; Schulz, P.; Schneider, N. Versatile Perovskite Solar Cell Encapsulation by Low-Temperature ALD-Al2O3 with Long-Term Stability Improvement. Sustain. Energy Fuels 2018, 2, 2468–2479. [Google Scholar] [CrossRef]
- Kruszyńska, J.; Ostapko, J.; Ozkaya, V.; Surucu, B.; Szawcow, O.; Nikiforow, K.; Hołdyński, M.; Tavakoli, M.M.; Yadav, P.; Kot, M.; et al. Atomic Layer Engineering of Aluminum-Doped Zinc Oxide Films for Efficient and Stable Perovskite Solar Cells. Adv. Mater. Inter. 2022, 9, 2200575. [Google Scholar] [CrossRef]
- Schier, V.; Michel, H.-J.; Halbritter, J. ARXPS-Analysis of Sputtered TiC, SiC and Ti0.5Si0.5C Layers. Fresenius J. Anal. Chem. 1993, 346, 227–232. [Google Scholar] [CrossRef]
- Rousseau, B.; Estrade-Szwarckopf, H.; Thomann, A.-L.; Brault, P. Stable C-Atom Displacements on HOPG Surface under Plasma Low-Energy Argon-Ion Bombardment. Appl. Phys. A 2003, 77, 591–597. [Google Scholar] [CrossRef]
- Morales, C.; Díaz-Fernández, D.; Mossanek, R.J.O.; Abbate, M.; Méndez, J.; Pérez-Dieste, V.; Escudero, C.; Rubio-Zuazo, J.; Prieto, P.; Soriano, L. Controlled Ultra-Thin Oxidation of Graphite Promoted by Cobalt Oxides: Influence of the Initial 2D CoO Wetting Layer. Appl. Surf. Sci. 2020, 509, 145118. [Google Scholar] [CrossRef]
- Luthin, J.; Plank, H.; Roth, J.; Linsmeier, C. Ion Beam-Induced Carbide Formation at the the Titanium–Carbon Interface. Nucl. Instrum. Methods Phys. Res. Sect. B Beam Interact. Mater. At. 2001, 182, 218–226. [Google Scholar] [CrossRef]
- Luthin, J.; Linsmeier, C. Characterization of Electron Beam Evaporated Carbon Films and Compound Formation on Titanium and Silicon. Phys. Scr. 2001, T91, 134. [Google Scholar] [CrossRef]
- Lewin, E.; Persson, P.O.Å.; Lattemann, M.; Stüber, M.; Gorgoi, M.; Sandell, A.; Ziebert, C.; Schäfers, F.; Braun, W.; Halbritter, J.; et al. On the Origin of a Third Spectral Component of C1s XPS-Spectra for Nc-TiC/a-C Nanocomposite Thin Films. Surf. Coat. Technol. 2008, 202, 3563–3570. [Google Scholar] [CrossRef]
- Yang, D.; Velamakanni, A.; Bozoklu, G.; Park, S.; Stoller, M.; Piner, R.D.; Stankovich, S.; Jung, I.; Field, D.A.; Ventrice, C.A.; et al. Chemical Analysis of Graphene Oxide Films after Heat and Chemical Treatments by X-ray Photoelectron and Micro-Raman Spectroscopy. Carbon 2009, 47, 145–152. [Google Scholar] [CrossRef]
- Lubben, D.; Motooka, T.; Greene, J.E.; Wendelken, J.F.; Sundgren, J.-E.; Salaneck, W.R. Xps, Ups, and Hreels Studies of Excimer-Laser-Induced Dissociation of Al2 (Ch3) Adsorbed on Si(100) Surfaces. MRS Proc. 1987, 101, 151. [Google Scholar] [CrossRef]
- Strongin, D.R.; Moore, J.F.; Ruckman, M.W. Synchrotron Radiation Assisted Deposition of Aluminum Oxide from Condensed Layers of Trimethylaluminum and Water at 78 K. Appl. Phys. Lett. 1992, 61, 729–731. [Google Scholar] [CrossRef]
- Gougousi, T.; Barua, D.; Young, E.D.; Parsons, G.N. Metal Oxide Thin Films Deposited from Metal Organic Precursors in Supercritical CO2 Solutions. Chem. Mater. 2005, 17, 5093–5100. [Google Scholar] [CrossRef]
- Lu, Y.-H.; Morales, C.; Zhao, X.; Van Spronsen, M.A.; Baskin, A.; Prendergast, D.; Yang, P.; Bechtel, H.A.; Barnard, E.S.; Ogletree, D.F.; et al. Ultrathin Free-Standing Oxide Membranes for Electron and Photon Spectroscopy Studies of Solid–Gas and Solid–Liquid Interfaces. Nano Lett. 2020, 20, 6364–6371. [Google Scholar] [CrossRef] [PubMed]
- Gosset, L.G.; Damlencourt, J.-F.; Renault, O.; Rouchon, D.; Holliger, P.; Ermolieff, A.; Trimaille, I.; Ganem, J.-J.; Martin, F.; Séméria, M.-N. Interface and Material Characterization of Thin Al2O3 Layers Deposited by ALD Using TMA/H2O. J. Non-Cryst. Solids 2002, 303, 17–23. [Google Scholar] [CrossRef]
- Haeberle, J.; Henkel, K.; Gargouri, H.; Naumann, F.; Gruska, B.; Arens, M.; Tallarida, M.; Schmeißer, D. Ellipsometry and XPS Comparative Studies of Thermal and Plasma Enhanced Atomic Layer Deposited Al2O3-Films. Beilstein J. Nanotechnol. 2013, 4, 732–742. [Google Scholar] [CrossRef] [PubMed]
- Gharachorlou, A.; Detwiler, M.D.; Gu, X.-K.; Mayr, L.; Klötzer, B.; Greeley, J.; Reifenberger, R.G.; Delgass, W.N.; Ribeiro, F.H.; Zemlyanov, D.Y. Trimethylaluminum and Oxygen Atomic Layer Deposition on Hydroxyl-Free Cu(111). ACS Appl. Mater. Interfaces 2015, 7, 16428–16439. [Google Scholar] [CrossRef]
- Paul, R.; Reifenberger, R.G.; Fisher, T.S.; Zemlyanov, D.Y. Atomic Layer Deposition of FeO on Pt(111) by Ferrocene Adsorption and Oxidation. Chem. Mater. 2015, 27, 5915–5924. [Google Scholar] [CrossRef]
- Cao, K.; Shi, L.; Gong, M.; Cai, J.; Liu, X.; Chu, S.; Lang, Y.; Shan, B.; Chen, R. Nanofence Stabilized Platinum Nanoparticles Catalyst via Facet-Selective Atomic Layer Deposition. Small 2017, 13, 1700648. [Google Scholar] [CrossRef]
- Li, H.; Yu, P.; Lei, R.; Yang, F.; Wen, P.; Ma, X.; Zeng, G.; Guo, J.; Toma, F.M.; Qiu, Y.; et al. Facet-Selective Deposition of Ultrathin Al2O3 on Copper Nanocrystals for Highly Stable CO2 Electroreduction to Ethylene. Angew. Chem. Int. Ed. 2021, 60, 24838–24843. [Google Scholar] [CrossRef]
- Hong, H.-K.; Jo, J.; Hwang, D.; Lee, J.; Kim, N.Y.; Son, S.; Kim, J.H.; Jin, M.-J.; Jun, Y.C.; Erni, R.; et al. Atomic Scale Study on Growth and Heteroepitaxy of ZnO Monolayer on Graphene. Nano Lett. 2017, 17, 120–127. [Google Scholar] [CrossRef]
- Tanuma, S.; Powell, C.J.; Penn, D.R. Calculations of Electron Inelastic Mean Free Paths. V. Data for 14 Organic Compounds over the 50–2000 eV Range. Surf. Interface Anal. 1994, 21, 165–176. [Google Scholar] [CrossRef]


Disclaimer/Publisher’s Note: The statements, opinions and data contained in all publications are solely those of the individual author(s) and contributor(s) and not of MDPI and/or the editor(s). MDPI and/or the editor(s) disclaim responsibility for any injury to people or property resulting from any ideas, methods, instructions or products referred to in the content. |
© 2023 by the authors. Licensee MDPI, Basel, Switzerland. This article is an open access article distributed under the terms and conditions of the Creative Commons Attribution (CC BY) license (https://creativecommons.org/licenses/by/4.0/).
Share and Cite
Morales, C.; Mahmoodinezhad, A.; Tschammer, R.; Kosto, J.; Alvarado Chavarin, C.; Schubert, M.A.; Wenger, C.; Henkel, K.; Flege, J.I. Combination of Multiple Operando and In-Situ Characterization Techniques in a Single Cluster System for Atomic Layer Deposition: Unraveling the Early Stages of Growth of Ultrathin Al2O3 Films on Metallic Ti Substrates. Inorganics 2023, 11, 477. https://doi.org/10.3390/inorganics11120477
Morales C, Mahmoodinezhad A, Tschammer R, Kosto J, Alvarado Chavarin C, Schubert MA, Wenger C, Henkel K, Flege JI. Combination of Multiple Operando and In-Situ Characterization Techniques in a Single Cluster System for Atomic Layer Deposition: Unraveling the Early Stages of Growth of Ultrathin Al2O3 Films on Metallic Ti Substrates. Inorganics. 2023; 11(12):477. https://doi.org/10.3390/inorganics11120477
Chicago/Turabian StyleMorales, Carlos, Ali Mahmoodinezhad, Rudi Tschammer, Julia Kosto, Carlos Alvarado Chavarin, Markus Andreas Schubert, Christian Wenger, Karsten Henkel, and Jan Ingo Flege. 2023. "Combination of Multiple Operando and In-Situ Characterization Techniques in a Single Cluster System for Atomic Layer Deposition: Unraveling the Early Stages of Growth of Ultrathin Al2O3 Films on Metallic Ti Substrates" Inorganics 11, no. 12: 477. https://doi.org/10.3390/inorganics11120477