Article

Comparative Study of Lithium Halide-Based Electrolytes for Application in Lithium-Sulfur Batteries

by
Eleonora Venezia
1,2,*,†,
Pejman Salimi
1,2,†,
Shanshan Liang
1,2,
Silvio Fugattini
1,
Lorenzo Carbone
1 and
Remo Proietti Zaccaria
1,3,*
1
Istituto Italiano di Tecnologia, Via Morego 30, 16163 Genova, Italy
2
Department of Chemistry and Industrial Chemistry, University of Genova, Via Dodecaneso 31, 16146 Genova, Italy
3
Department of Physics, Shaoxing University, Shaoxing 312000, China
*
Authors to whom correspondence should be addressed.
These authors contributed equally to this work.
Inorganics 2023, 11(2), 86; https://doi.org/10.3390/inorganics11020086
Submission received: 21 December 2022 / Revised: 1 February 2023 / Accepted: 16 February 2023 / Published: 19 February 2023

Abstract

:
Among the next-generation energy storage technologies, lithium-sulfur batteries are considered one of the most appealing solutions owing to their remarkable theoretical capacity. However, to become commercially competitive, there is a strong need to address some issues still characterizing this technology. One of the explored strategies is the optimization of the electrolyte formulation. To this aim, we compared 1,3-dioxolane/1,2-dimethoxyethane-based electrolytes containing two lithium halides, i.e., lithium bromide (LiBr) and lithium iodide (LiI), with lithium bis (trifluoromethane)sulfonylimide (LiTFSI) as a reference electrolyte. The obtained results show how the donicity of the lithium-salt anions might affect the solid electrolyte interphase stability and the lithium sulfide deposition morphology, therefore influencing the electrochemical performance of the cells. Among the tested electrolytes, the sulfur cell containing LiBr salt exhibited the best electrochemical performance maintaining a specific capacity of 900 mAh g−1 at C/4 and a stable trend along cycling at 1C with a specific capacity of about 770 mAh g−1 for 200 cycles.

1. Introduction

Lithium-sulfur battery (LSBs) technology is considered one of the most promising candidates to satisfy the growing demand for electric energy storage systems [1]. Indeed, the conversion redox reaction between lithium and sulfur results in higher theoretical specific capacity (1675 mAh g−1) and energy density (~2600 Wh kg−1 considering a mean voltage of 2.2 V) [2,3,4] than the corresponding values associated with the intercalation reaction occurring within the insertion-type electrodes commonly exploited in Li-ion batteries [5]. Moreover, elemental sulfur is environmentally friendly, inexpensive, and abundant in nature [6,7], as well as a dominant side product of petroleum purification [8]. However, the LSBs market uptake is still hindered by technological issues such as rapid capacity fading, low sulfur utilization, and a short cycle life [9]. These drawbacks are mainly associated with the production of insulating lithium sulfide (Li2S) as the final discharge product [10] and with the dissolution of lithium polysulfides (LiPSs) within the electrolyte [11]. In detail, during the discharge process, the electrodeposition of Li2S occurs on the entire cathode surface as a solid insulating film, hence preventing the complete reaction of the sulfur active material and leading to an increase in the cell polarization, especially at high current rates [12]. At the same time, the intrinsic nature of the lithium-sulfur redox reaction evolves through two solids phases (S8 to Li2S) and undergoes a liquid phase conversion [13,14], where polysulfide species (Li2Sx, x = 2–8) are formed, also involving radical reaction steps [15]. These reaction intermediates, which are soluble in the common lithium battery solvents (such as ethers and carbonates), can migrate through the electrolyte during the charge reactions reaching the anode, resulting in an electrochemical short-circuit known as the shuttle effect [16]. The dissolution of these moieties within the electrolyte causes active material loss thus leading to fast capacity decay and poor cell cyclability. Designing new electrolyte compositions could be a valid approach to overcome the aforementioned issues [17] as solvents, salts, and additives have together strong effects on the electrochemical performance of lithium-sulfur cells [18,19]. In this regard, the tuning of the lithium-salt anion donicity could positively affect the Li2S passivation film morphology, preventing the insulation of the electrode surface and, thus, enhancing the sulfur utilization within the active material [20,21,22,23]. Additionally, more electro-donating anions have been shown to yield the production of a stable electrolyte interphase layer on both anode and cathode surfaces, which could reduce the shuttle effect phenomenon [24,25]. For instance, Chu et al. investigated three salts (i.e., LiTFSI, LiTf, and LiBr) in a DOL:DME (1:1 in volume) solvent with 0.2 M LiNO3 as an electrolyte additive to find the role of the electron-donating property of electrolyte salt anions in the lithium sulfide growth. They found that anions with higher donor numbers (LiTf and LiBr) allow 3D Li2S growth by dissociation of S2− in the electrolyte. This phenomenon resulted in an extension of the lower voltage plateau and in an increase in the discharge capacity of the cells containing LiTf and LiBr, especially when compared to the cell employing the LiTFSI salt. In addition, the electrolytes with salt anions with high donor numbers provided better compatibility with the lithium electrode, which led to improved stability of the LSBs [20]. Finally, the stabilization of the S3●− radical involved in the sulfur reduction pathway is favored by the increased electron-donating properties of the electrolyte [26], hence promoting several reaction routes with the consequent improvement of the active material utilization [27].
The present work reports a comparative study of 1,3-dioxolane (DOL)/1,2-dimethoxyethane (DME)-based electrolytes containing lithium salts bearing different electron-donating anions, namely lithium bromide (LiBr), lithium iodide (LiI), and lithium bis (trifluoromethane)sulfonimide (LiTFSI). In detail, the Br and I anions’ donicity properties are compared with the low donicity anion bis (trifluoromethane)sulfonimide (TFSI), typically employed in Li-S battery electrolytes. The following sequence shows the trend of the electron-donating properties of the investigated anions [20,28]:
TFSI < I < Br
The electrolyte comparison is defined in terms of thermal properties, conductivity, lithium interface stability, lithium-ion transport number, lithium stripping/deposition, linear sweep voltammetry, and cyclic voltammetry. Furthermore, the electrolytes are tested in lithium-sulfur half-cells by galvanostatic cycling tests and rate-capability measurements employing a sulfur–carbon composite cathode. A post mortem characterization of the cycled electrode is carried out by scanning electron microscopy (SEM). The results show that the cells containing lithium halide salts exhibit electrochemical performance superior to or comparable to the LiTFSI-based cell.

2. Results and Discussion

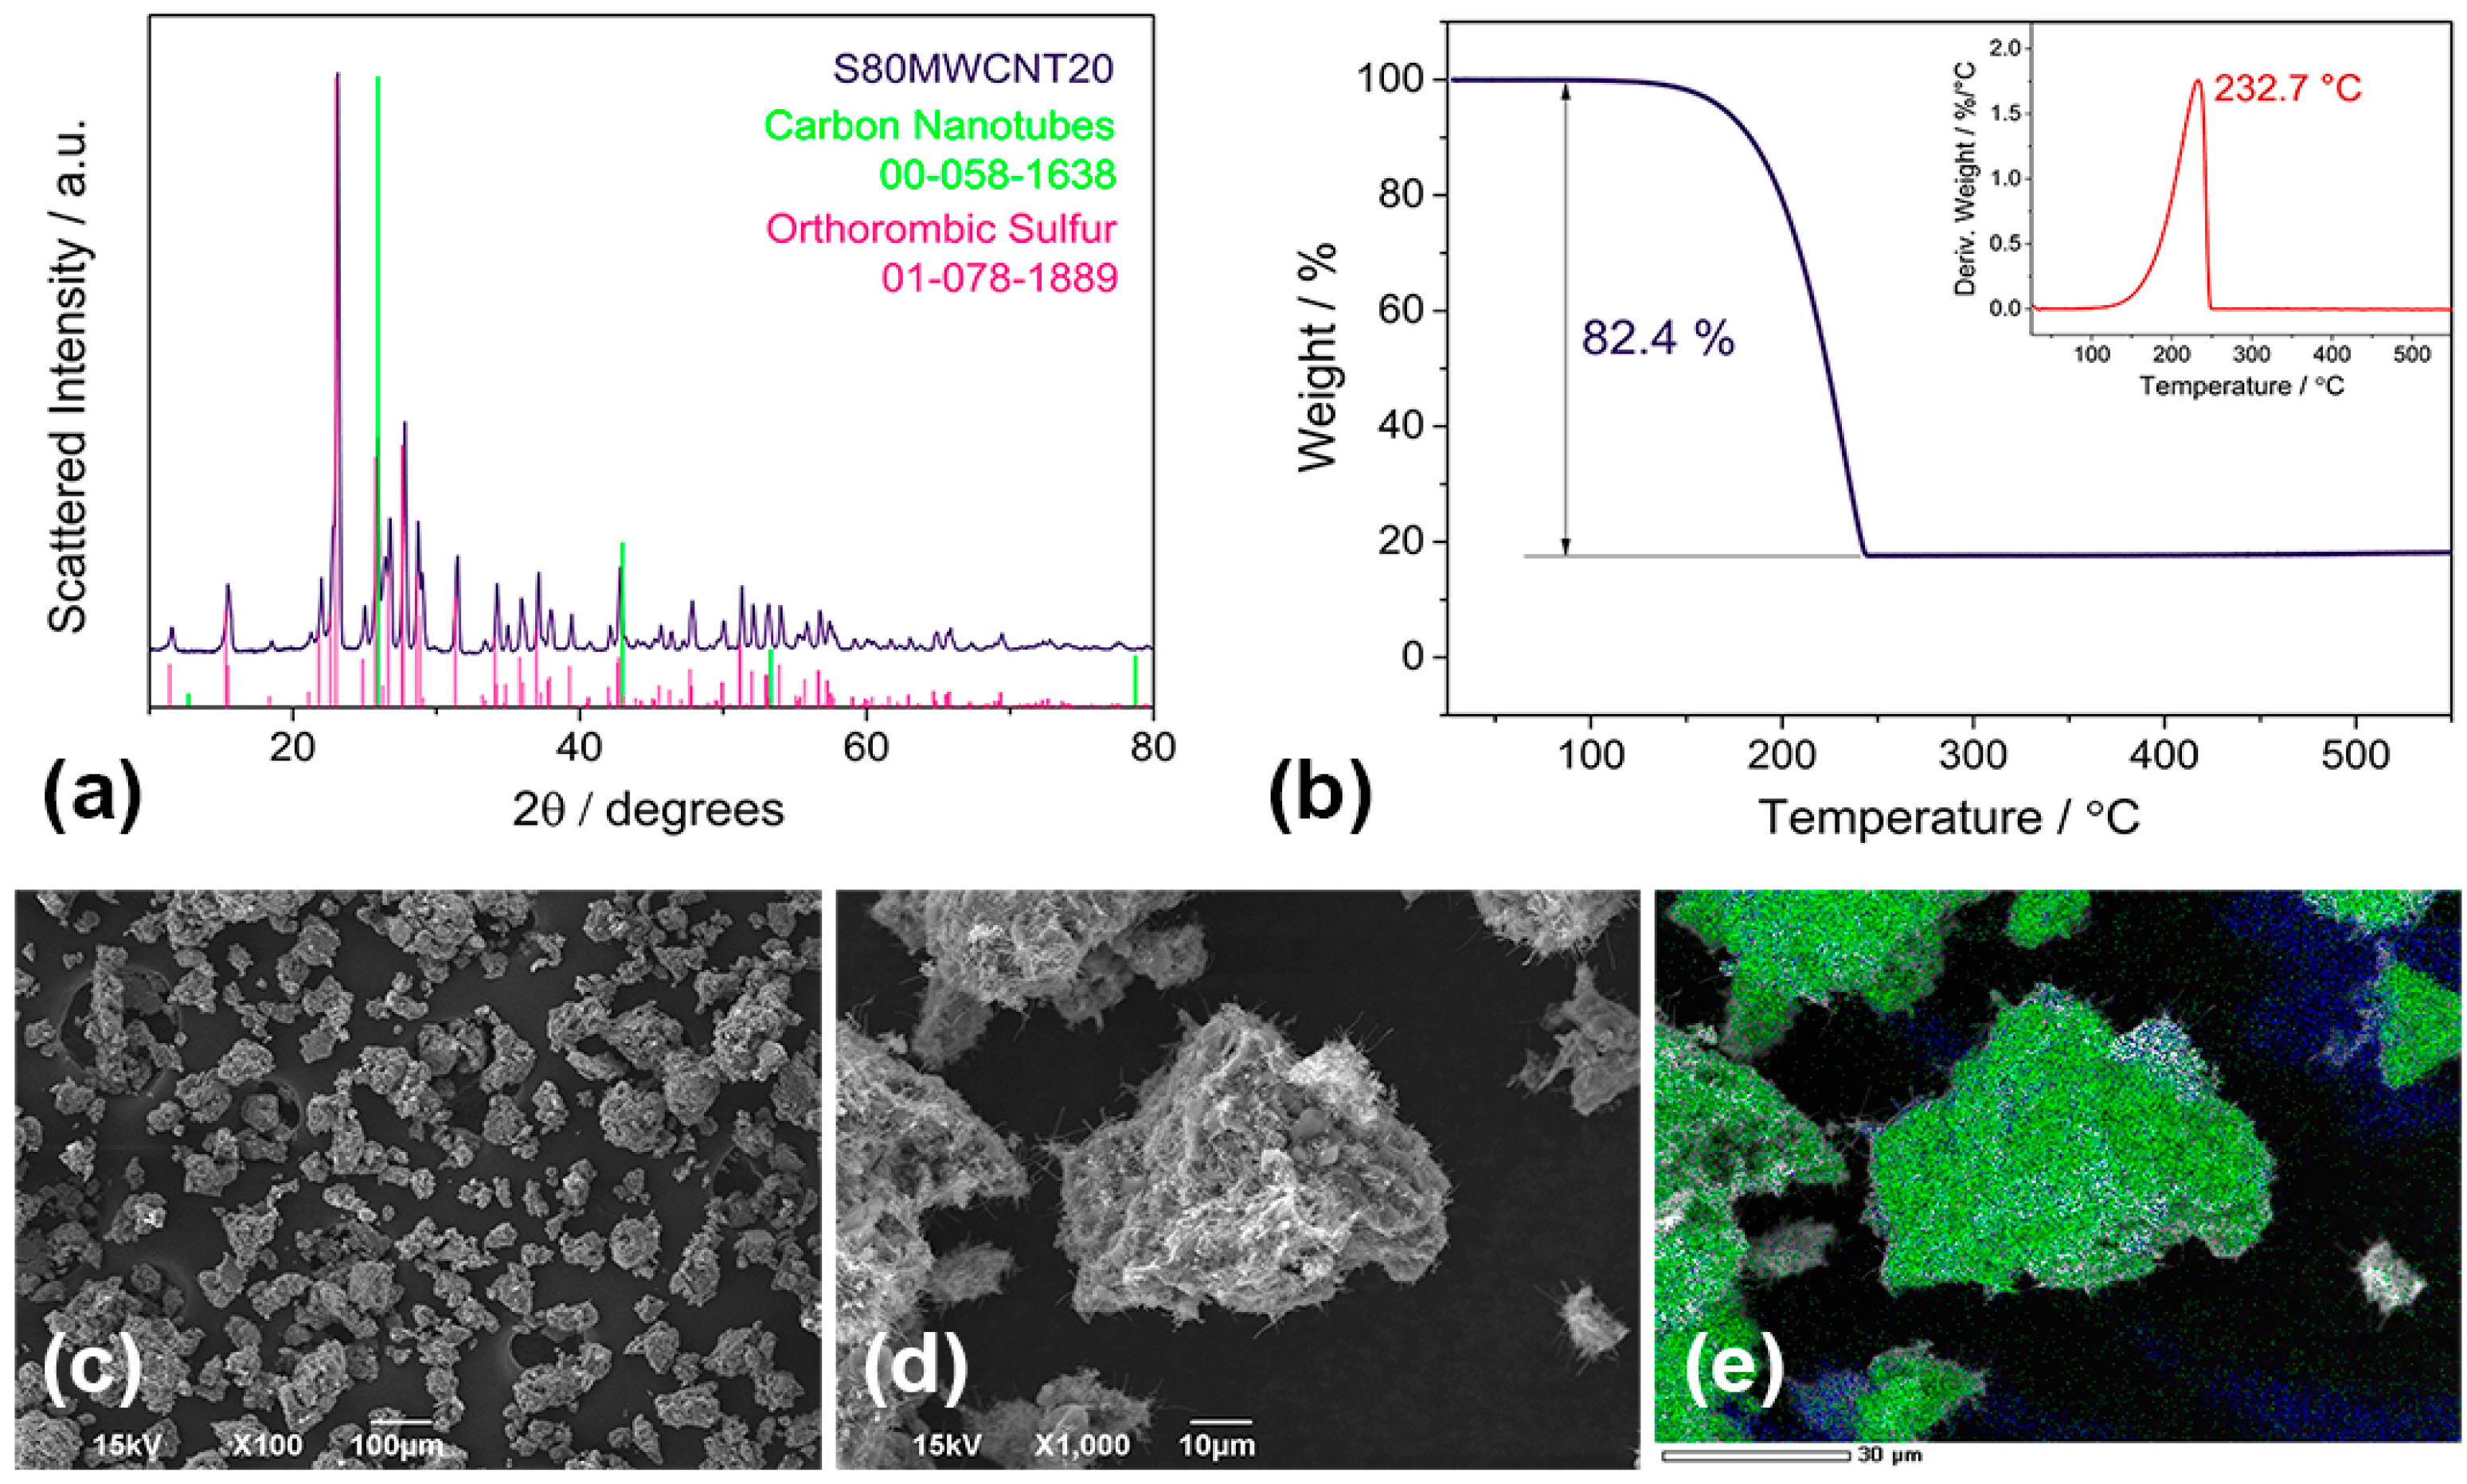
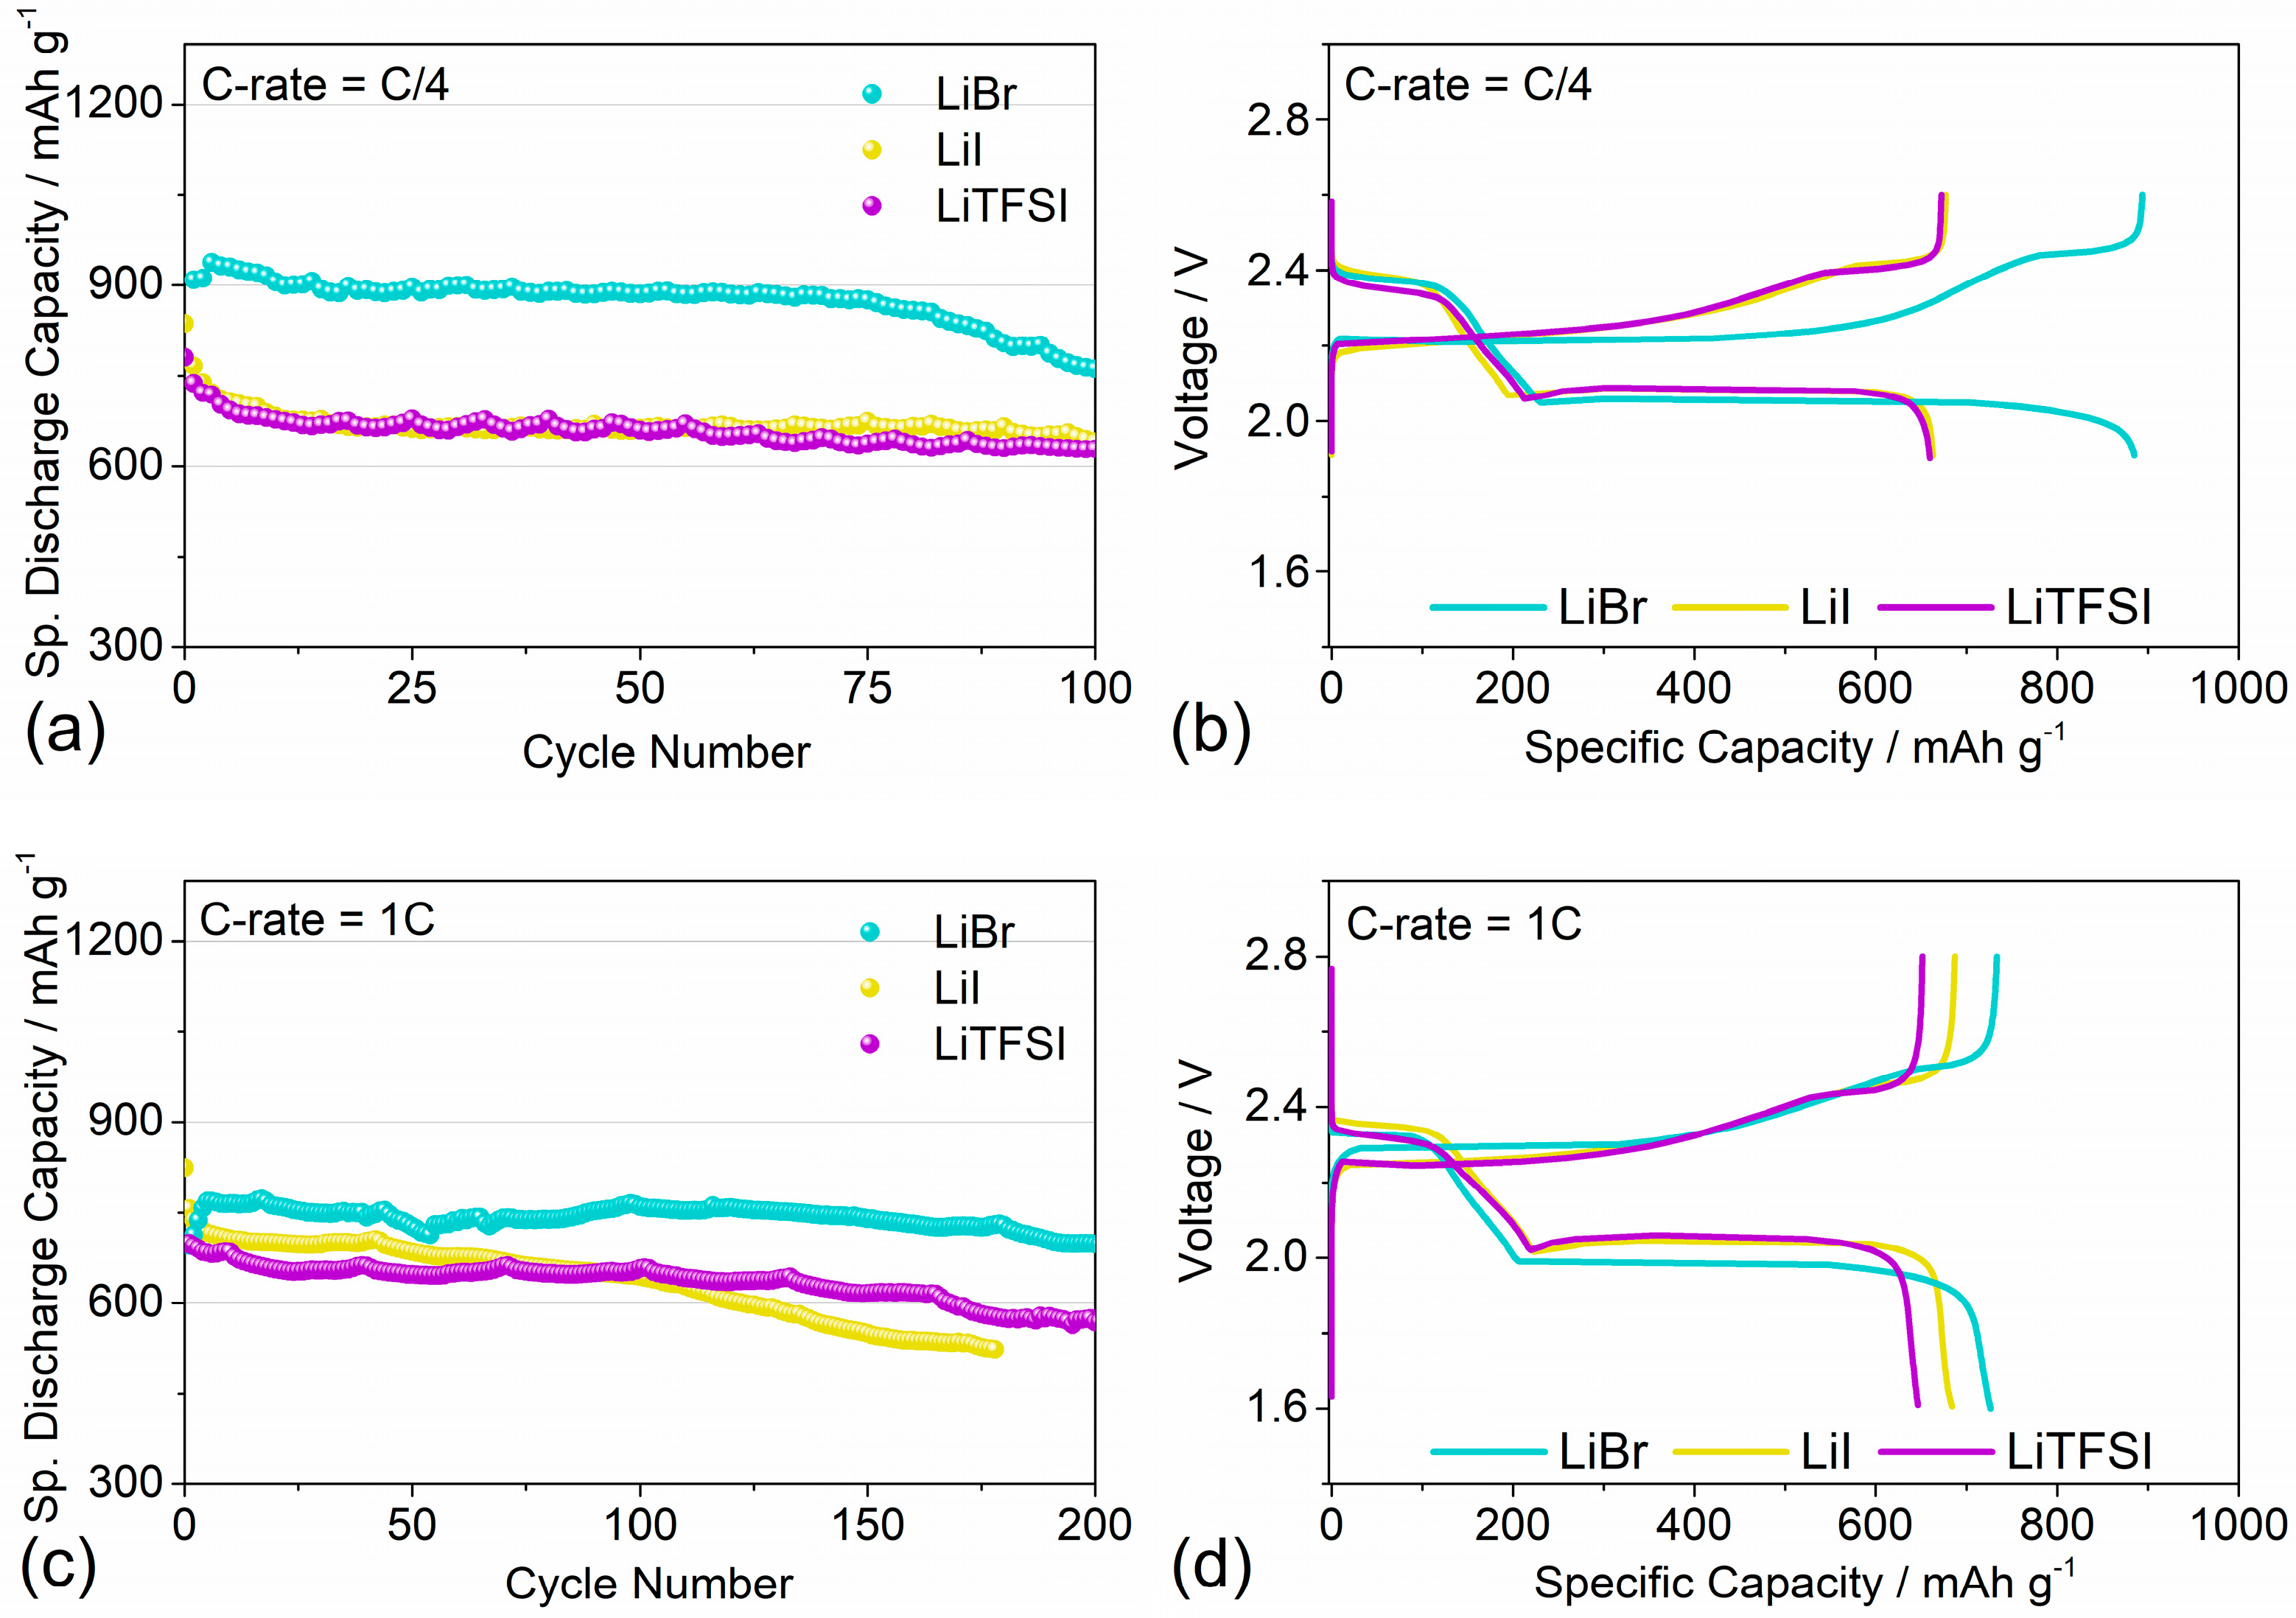
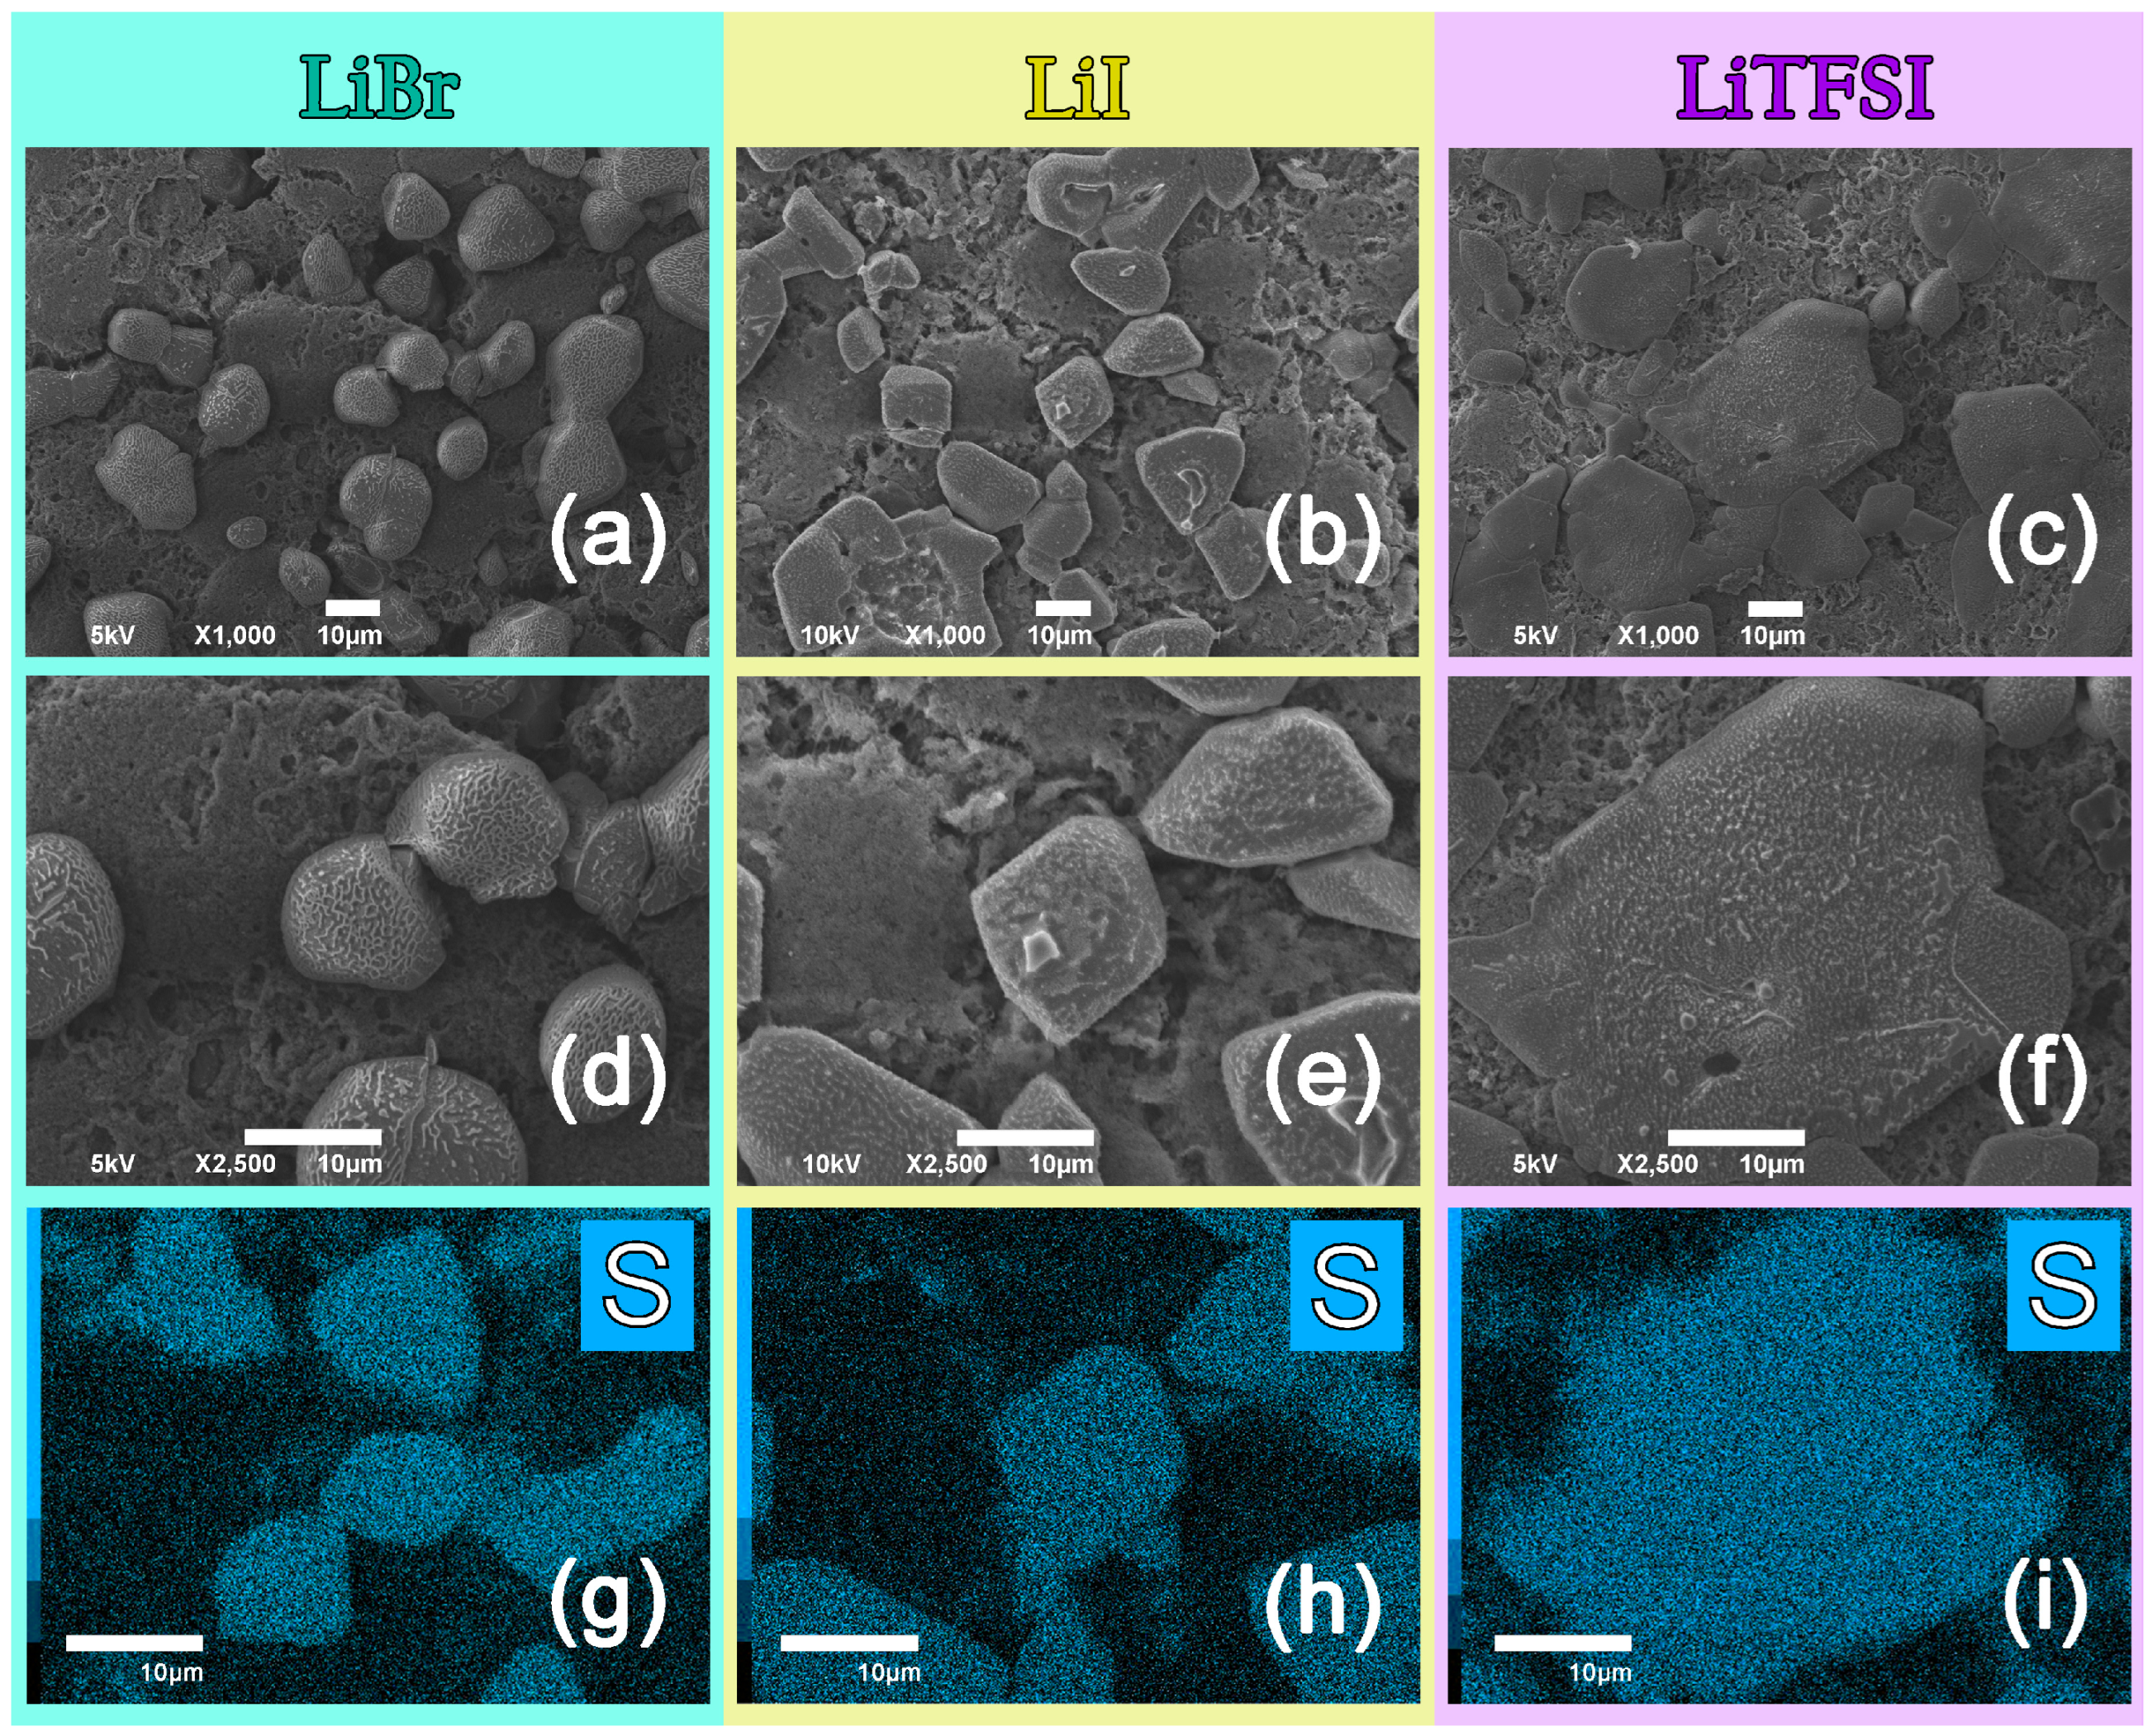
2.1. Electrode Active Material Characterization

The active material employed in this work (named S80MWCNT20) to test the selected electrolytes is formed by sulfur and multi-walled carbon nanotubes. The choice of the MWCNTs is motivated by their superior electrical conductivity, an especially important requirement when combined with the low conductivity of sulfur. The S80MWCNT20 composite was first investigated by X-ray diffraction (XRD) analysis in order to verify its composition. The analysis, reported in Figure 1a, confirms the presence of both orthorhombic sulfur (ICDD 01-078-1889) and carbon nanotubes (ICDD 00-058-1638). This result suggests that the synthesis method herein adopted does not affect the crystalline nature of the pristine materials (see Figure S1 of Supplementary Materials). Furthermore, the sulfur content in the S80MWCNT20 composite was determined through thermogravimetric analysis (TGA), as shown in Figure 1b. The TGA trace indicates a weight loss starting from approximately 150 °C and ending at about 250 °C. The related derivative curve in the figure inset suggests a sulfur evaporation temperature of about 233 °C. The sulfur amount within the active material is 82.4%, the value that was used for the lithium-metal half-cell capacity calculation. The long plateau between 250 °C and 600 °C is ascribed to the presence of carbon nanotubes, which are stable in the whole temperature range.
The morphology of active material was evaluated via scanning electron microscopy (SEM). The low magnification SEM picture reveals the presence of isolated sulfur particles, characterized by a homogeneous isotropic growth in the three space directions and having a size of 30 µm, together with sulfur–carbon aggregates with dimensions of about 150 µm (Figure 1c). At higher magnification, it is possible to appreciate that the sulfur particles forming the aggregates are covered by carbon nanotubes, which appear to be intimately connected to the sulfur core (Figure 1d). Indeed, the EDS mapping reported in Figure 1e confirms the presence of a central nucleus made of sulfur (green color) covered by carbon nanotubes (blue color). Furthermore, after the casting procedure, the electrodes were analyzed by SEM in order to verify their homogeneity in terms of sulfur dispersion and thickness (Figure S2 of Supplementary Materials).

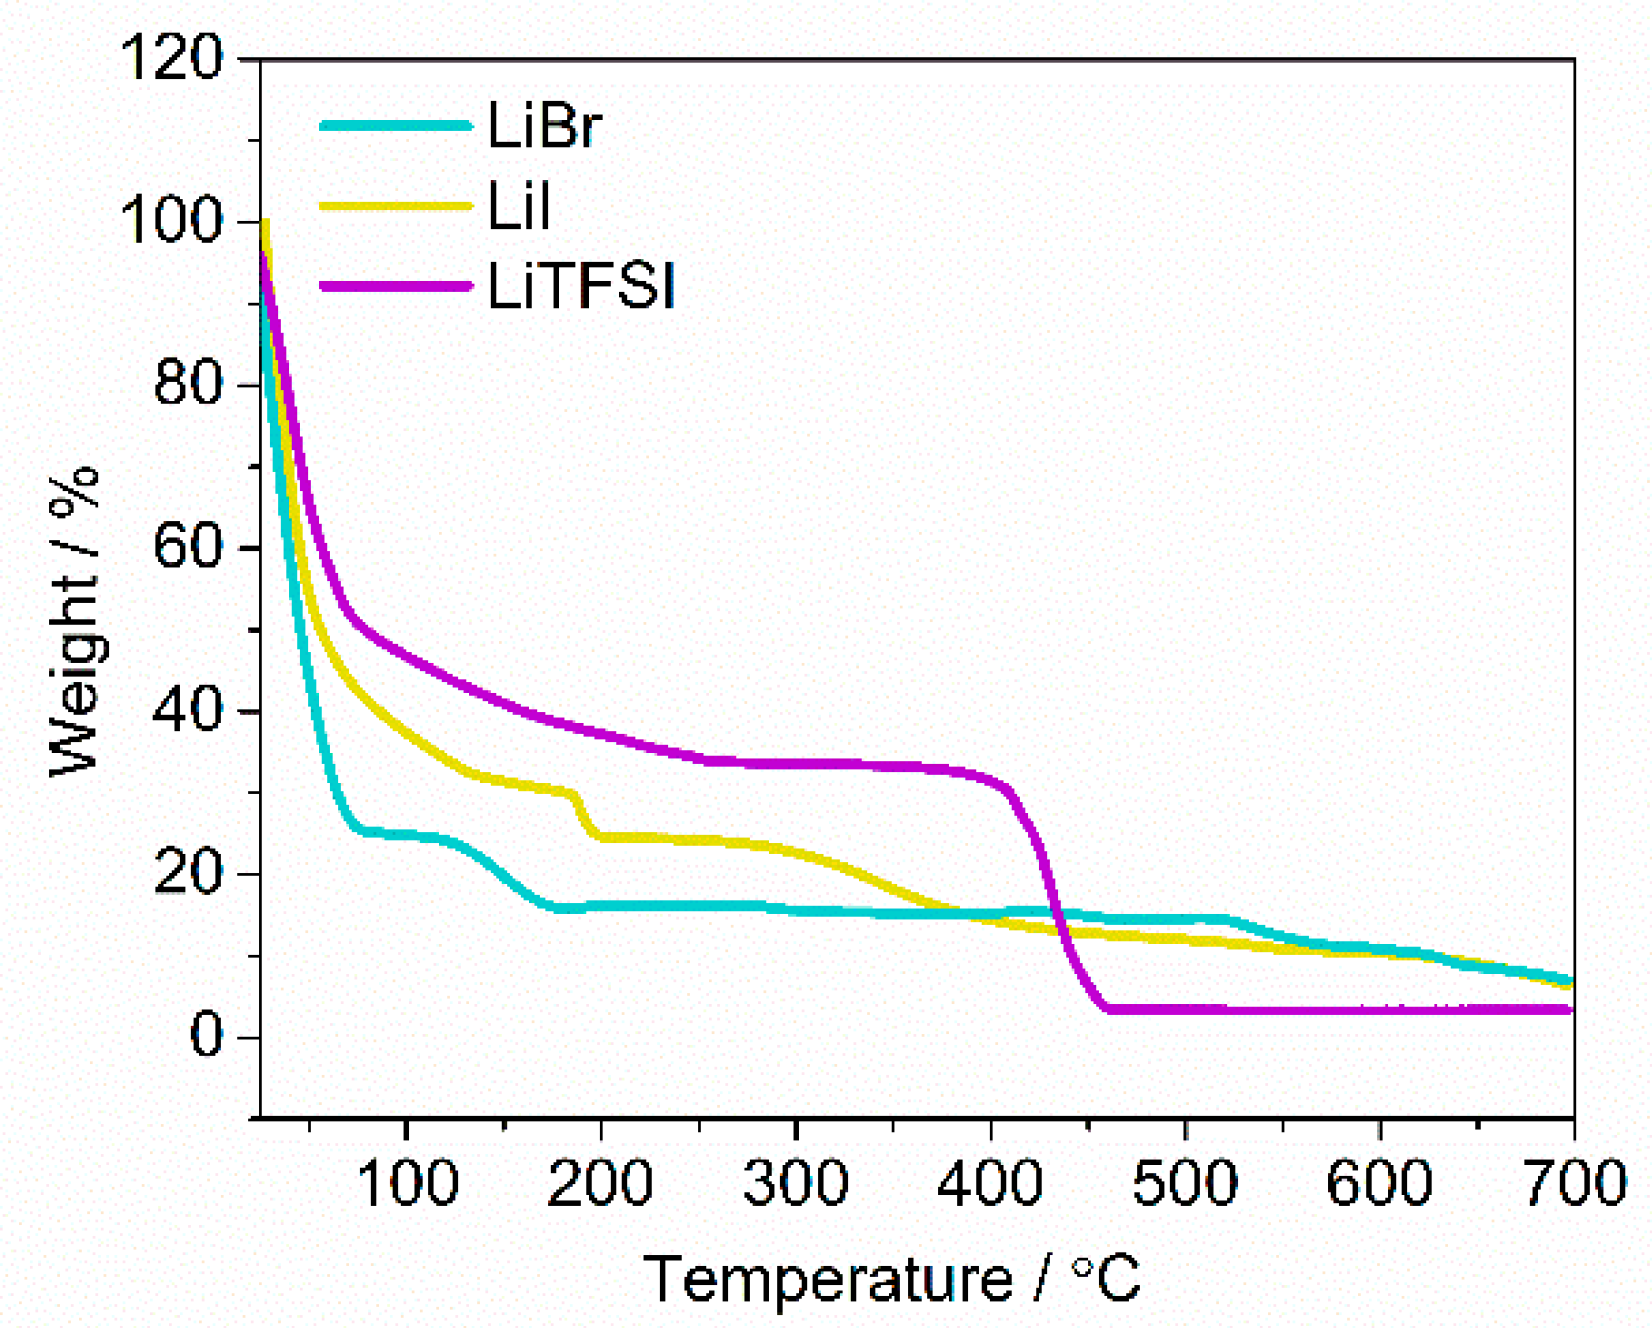
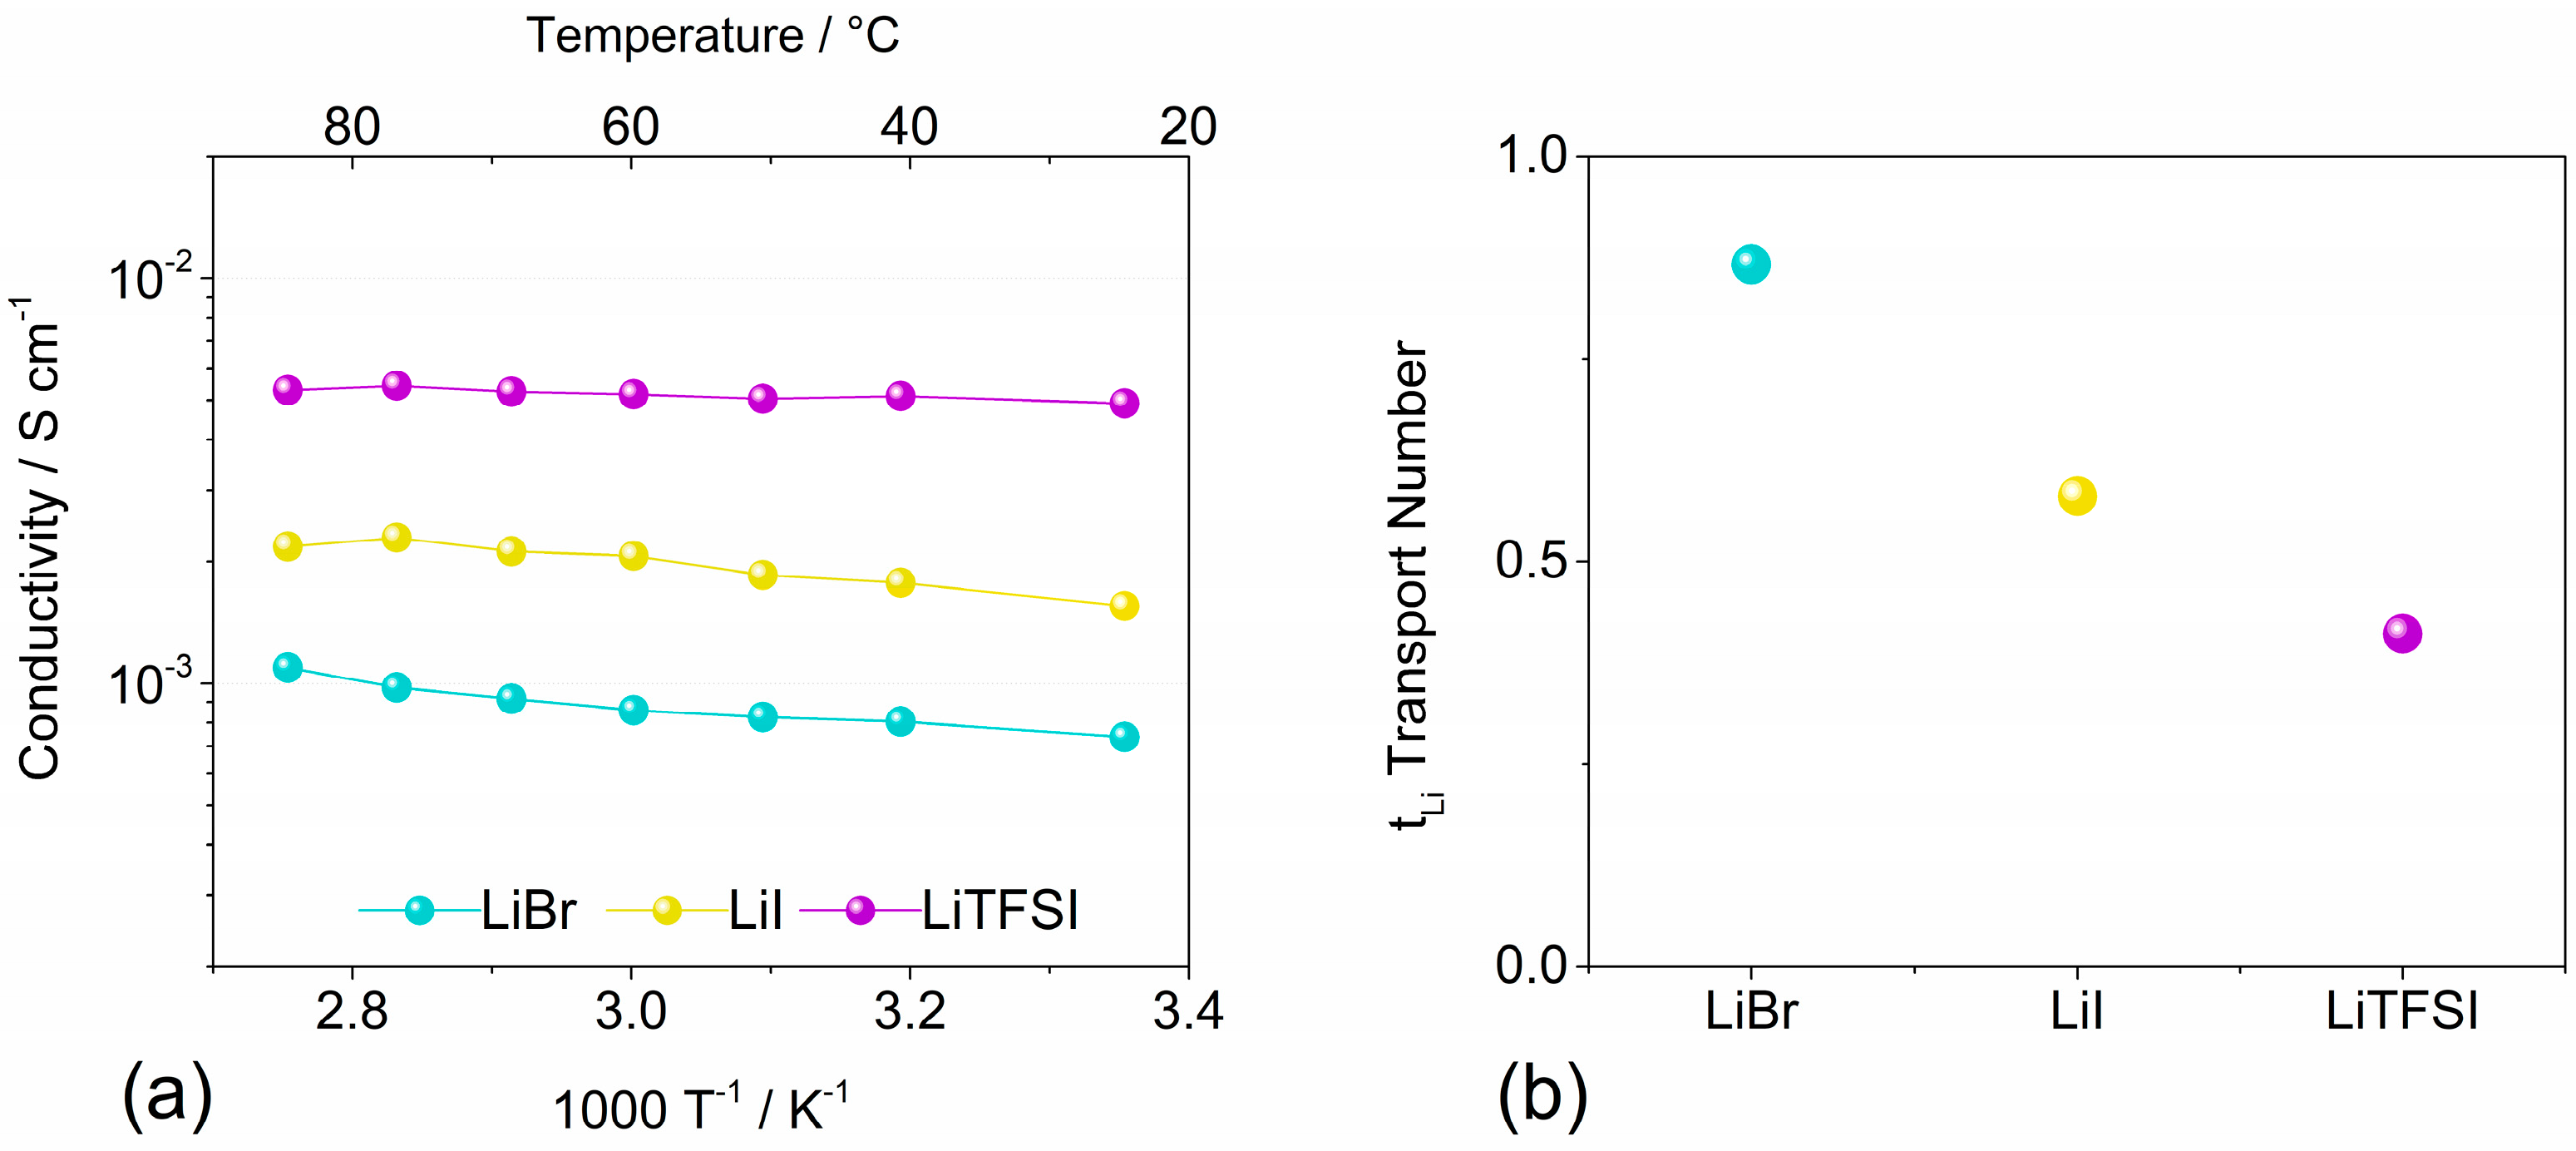
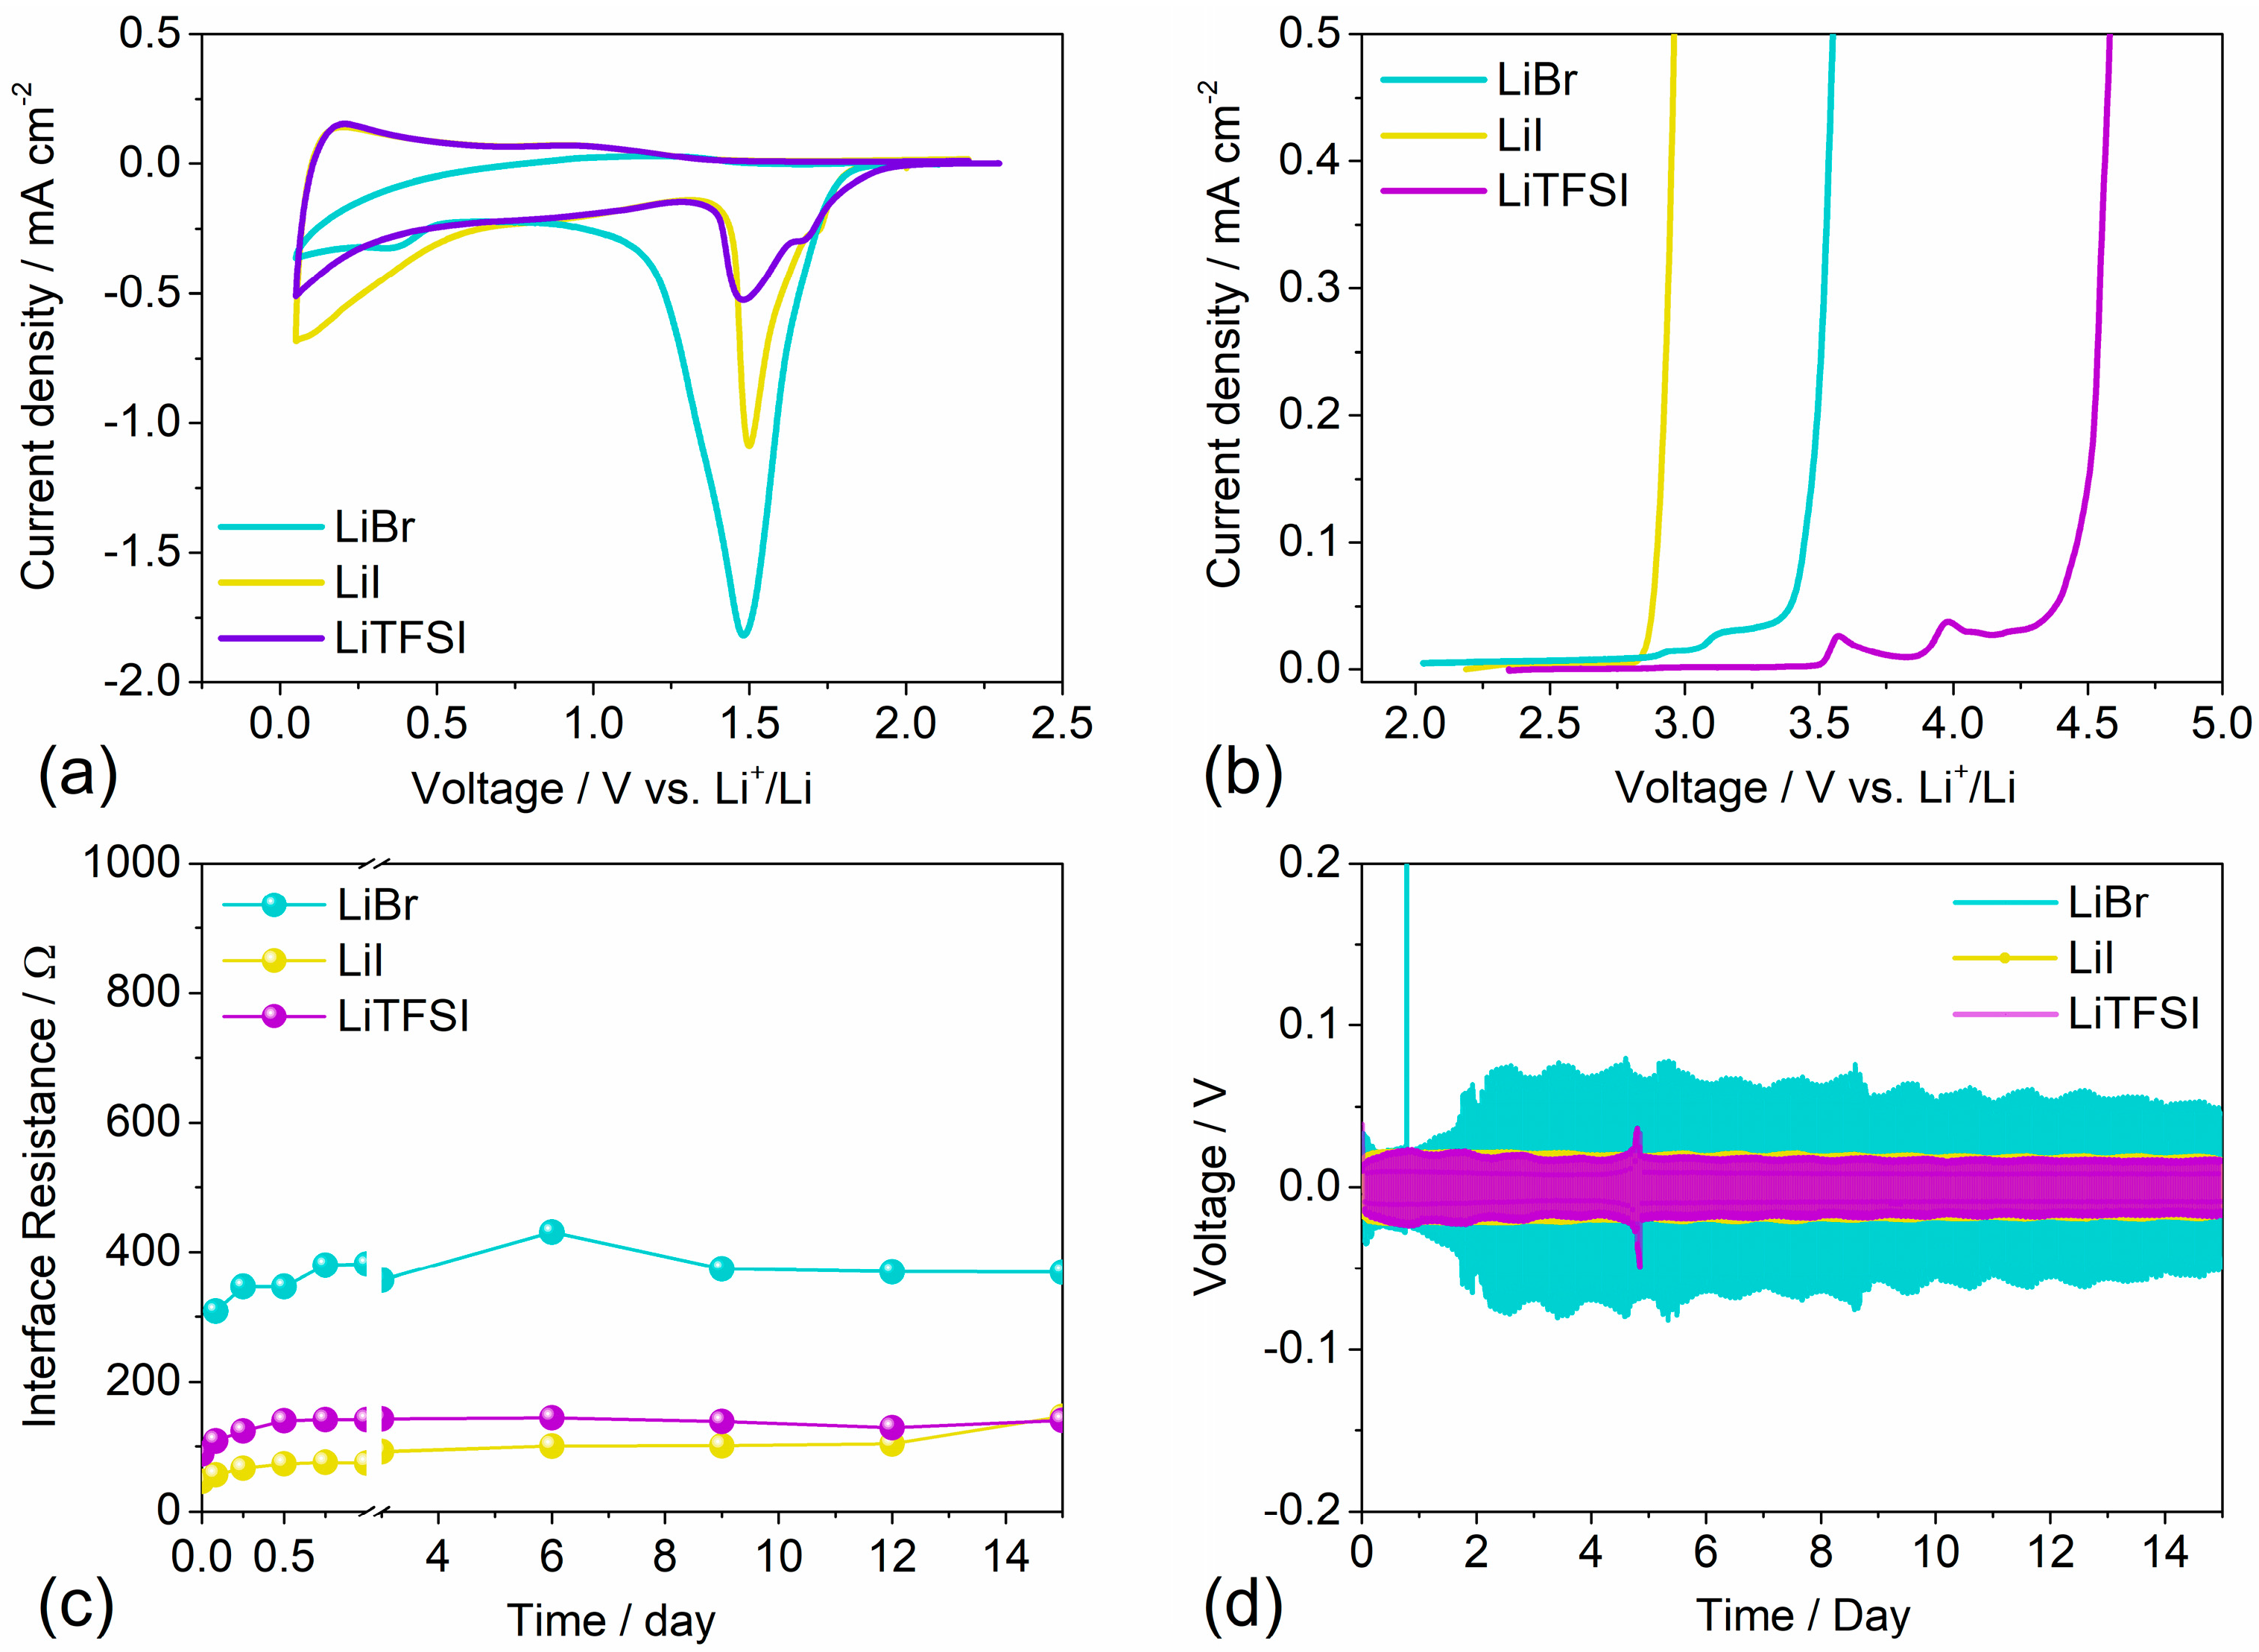
2.2. Electrolyte Characterization

Three electrolyte solutions containing 1 mol kg−1 of lithium salt bearing different electro-donating properties (LiBr, LiI, and LiTFSI) and 0.5 mol kg−1 of lithium nitrate as an additive in a dioxolane/dimethoxyethane (DOL/DME) 1:1 mixture [29,30,31,32], are herein characterized by the point of view of their thermal, physical and electrochemical behaviors, in order to verify their practical use for lithium-sulfur batteries. The thermal stability and decomposition temperature of the prepared electrolytes were assessed via TGA performed under nitrogen flow from room temperature up to 700 °C, as shown in Figure 2. All samples exhibit an initial mass loss starting from ~50 °C, which is attributed to the DOL/DME solvent mixture evaporation, in line with other studies [30]. The curve trend reflects the salt content within each sample, thus following the salts’ molecular weight. Indeed, the salt with the highest molecular weight, i.e., LiTFSI, shows a plateau at about 33%, while LiI and LiBr show a similar plateau but at lower weights, specifically ~23 and 16%, respectively.
A crucial parameter determining the performance of an electrolyte is its ionic conductivity. Figure 3a shows the conductivity Arrhenius plots of the electrolytes obtained through electrochemical impedance spectroscopy (EIS) measurements (Figures S3 and S4 of Supplementary Materials for the measurement upon cooling) by increasing the temperature from 25 °C to 90 °C.
All the electrolyte solutions exhibit a stable conductivity trend within the selected temperature range with values suitable for lithium-sulfur battery applications [33]. In detail, at room temperature LiTFSI presents a conductivity of 4.9∙10−3 S cm−1, a value that decreases to 1.5∙10−3 S cm−1 for LiI and 7.3∙10−4 S cm−1 for LiBr [34]. The systematic decrease in conductivity which follows the increase in the electrolyte donicity could be ascribed to the limited movement of the anions (the more electronegative, the stronger the movement limitations) due to the solvent–ion interactions, as further suggested by the lithium transport number values reported in Figure 3b (see Figure S5 of Supplementary Materials for EIS and chronoamperometry measurements) [35]. Indeed, tLi, which represents the fraction of the ionic conductivity owed to lithium ions, is proportional to the anion donicity. LiTFSI shows a lithium transport number of 0.41, LiI of 0.58, and LiBr reaches a value of 0.86. This trend could be associated with the bulky solvation shell surrounding the higher donicity anions, thus increasing their effective radii [36,37] and reducing the overall ionic conductivity.
Figure 4a,b, respectively, show the cyclic voltammetry (CV) and the linear sweep voltammetry (LSV) tests, which were performed to investigate the electrochemical stability window of the electrolytes. The CV profile of the first cycle for each sample (see Figure S6 of Supplementary Materials for the complete characterization) highlights the presence of a first main cathodic peak at 1.5 V for LiBr, LiI, and LiTFSI (Figure 4a), while a peak at about 0.1 V and common to all the electrolytes is detected. Furthermore, LiI and LiTFSI shows a small secondary peak at about 1.6 V which could be ascribed to lithium nitrate reaction, while for the LiBr sample, the broad peaks likely cover this latter peak.
The main cathodic peaks reveal an irreversible reaction, probably due to the reduction of the salt, which is responsible for the SEI film formation on the lithium surface [38], while the peak at 0.1 V could be ascribed to the intercalation of Li ions into the carbonaceous material [39,40,41]. In particular, LiBr-based electrolyte shows a peak current with the highest intensity during the cathodic scan. Since all the electrodes (Super P on copper) used for the CV have the same mass loading, the high intensity and narrow width of the LiBr peak could be ascribed to a favorable SEI formation which could reduce the polysulfide shuttle effect [42,43]. In the subsequent CV cycles, namely the second, third, and fourth cycles, reported in Figure S6, the intense cathodic peaks disappear in all the samples. These findings suggest that for all samples a stable protective layer is formed on the surface of the electrode, hence demonstrating the stability of the electrolytes in the investigated voltage range.
In order to define the upper limit of the voltage stability window, an LSV of the electrolytes was carried out and the resulting curves are shown in Figure 4b. LiI shows the narrowest electrochemical stability window as it starts to decompose at about 2.8 V, while LiBr starts at 2.9 V. These results suggest that the considered electrolytes can be eligible to be employed in sulfur-cell chemistry, since lithium-sulfur electrochemical reactions take place below 2.8 V (namely in the 1.5–2.8 V voltage range) [44].
With the aim of analyzing the lithium–electrolyte interface stability, the evolution of the lithium interface resistance as a function of time was measured by EIS at room temperature, through symmetrical Li/Li cells containing the three electrolytes (Figure 4c). The resistance values were obtained from Nyquist impedance plots (Figure S7 of Supplementary Materials) by using Boukamp software. The initial resistance of LiI, LiTFSI, and LiBr are 38, 63, and 280 Ω, respectively. Subsequently, the plots show a slight resistance increment along the first day, which could be related to the production of a solid electrolyte interphase. Afterward, all the cells exhibit stable resistance values (up to 15 days) of ~101 Ω in LiI, 138 Ω in LiTFSI, and 374 Ω in LiBr, suggesting that the formed lithium–electrolyte interphase is stable. LiTFSI and LiI samples, which are also the salts bearing the lowest donicity, exhibit the lowest interface resistance. On the other hand, LiBr demonstrated the highest interface resistance as resulting from their electronegativity properties. This finding could be ascribed to the formation of a stable protective film on the metallic lithium [30,36]. In order to corroborate such a hypothesis, stripping/deposition tests were performed and the results are reported in Figure 4d. The experiments were carried out using symmetrical Li/Li coin cells in order to determine and compare the stability behavior in dynamic conditions of the electrolytes. LiBr exhibits the highest overvoltage value (up to 60 mV), probably associated with the charge transfer resistance increment at the lithium interface, as indicated by the interface resistance measurement shown in Figure 4c. Negligible overvoltage changes are finally observed in LiI and LiTFSI electrolytes, which are characterized by values of about 17 mV and 18 mV, respectively. These results suggest a stable behavior upon lithium stripping and deposition test. These findings are in line with the interface resistance values previously discussed, thus supporting the consolidation of a stable solid electrolyte interphase.
Eventually, in order to uncover the possible application of the prepared electrolyte solutions within lithium-sulfur battery systems, lithium-metal half-cells containing the three electrolytes were assembled. The coin cells employed in this study contain a sulfur–carbon composite as the positive electrode with 64 wt% sulfur content and metallic lithium as the negative electrode. The cells were tested at C/4 and 1C (1C = 1675 mA g−1) current rates (Figure 5). As shown in Figure 5a,b, at C/4, the cells containing the LiBr electrolyte with anions that have the highest donicity show reveal a higher specific discharge capacity than the cells employing electrolytes comprising anions bearing a lower donicity (LiI and LiTFSI). The tested samples, with the exception of LiBr cells, exhibit a fast capacity fading during the initial cycles, most likely ascribable to the partial LiPSs dissolution in the electrolytes [45,46].
Vice versa, the LiBr cell seems to take advantage of the thick and stable protective passivation layer formed on the electrode, as emerged from the lithium interface stability measurements shown in Figure 4c, as no initial capacity fading is observed. The following cycles reveal that the LiBr cell delivers an initial discharge capacity of about 940 mAh g−1, while LiI and LiTFSI cells display a similar behavior with a capacity of 780 mAh g−1. Furthermore, LiI and LiTFSI samples are characterized by a capacity decay down to 675 mAh g−1 during the first 10 cycles followed by a stable trend upon cycling. After the same number of cycles, LiBr exhibits a stable trend maintaining a capacity of 875 mAh g−1 (93% capacity retention) followed by a fast capacity decrease. This capacity drop can be related to a partial polysulfide dissolution within the electrolyte and to the formation of dead sulfur, consisting of sulfur species that cannot take part in the redox reaction due to the absence of electric contact. The voltage profiles of Figure 5b, related to the 50th cycle, depict the typical voltage behavior ascribed to the lithium-sulfur redox reactions [47]. Indeed, during the discharge processes, the plateau at 2.4 V can be related to the reduction of S8 to Li2S8 and Li2S6, while the long plateau at about 2.1 V is attributed to the production of low-order LiPSs, i.e., Li2S4, Li2S2, and Li2S [14,48]. In particular, the increased length of the second discharge plateau of LiBr could be related to the formation of Li2S discharge product with a morphology preventing the complete positive electrode passivation [19]. This effect could hence allow for the complete sulfur moieties reaction and, therefore, lead to a high specific capacity. On the other hand, the first discharge plateau presents almost the same length for all the tested samples, probably due to the limited Li2S6 solubility within the DOL:DME solvent mixture [15]. Differently, the charge profile is characterized by the presence of a long plateau at approximately 2.2 V related to the oxidation of low-order to high-order LiPSs, and a short plateau at 2.45 V ascribed to the further oxidation of the high-order polysulfides to pristine sulfur. Interestingly, a low polarization is detected in the cells employing an anion with a higher donicity. This effect could be ascribed to the enhanced charge transfer kinetics associated with the high-donicity anion [11,49] and the presence of a stable SEI on the lithium surface, as suggested by the lithium stripping/deposition measurement (Figure 4d). The low charge polarization of these samples suggests that an increase in the anion donicity could lead to a higher reaction reversibility of the lithium-sulfur processes [18]. It is noteworthy that the LiNO3 addition in all the electrolytes helped to reduce the shuttle effect thus obtaining a Coulombic efficiency approaching the 100% [50] (Supplementary Materials Figure S8). The specific capacity vs. cycle number trend at 1C is reported in Figure 5c,d. The LiBr cell presents an initial activation process leading to an increment of the specific capacity over the first 10 cycles reaching a discharge capacity of 768 mAh g−1. This behavior may be ascribed to the electrode wettability processes [51,52,53]. Each sample herein characterized shows a slight capacity fading during cycling with LiTFSI decreasing to 575 mAh g−1 after 180 cycles, and LiI demonstrates the fastest capacity, fading to a specific capacity of 523 mAh g−1 at 180 cycles. The LiBr-based cell shows instead a good stabil ity over cycling with a capacity retention of 730 mAh g−1 after 180 cycles. However, at 1C the effect of the different electron donicity properties is less obvious.
In order to better understand this phenomenon, stripping/deposition tests were carried out on LiTFSI as reference and LiBr as the best sample at the same current densities adopted for the cycling measurements, namely C/4 and 1C. The results are reported in Figure S9 of the Supplementary Materials. At C/4 current density (Figure S9a), both LiTFSI and LiBr show high overpotential values, which start decreasing after 2 days for LiBr and after 4 days for LiTFSI, with a quick stabilization at 35 mV and 18 mV for LiBr and LiTFSI, respectively. The comparison with the tests at 1C (Figure S9b) reveals how at low current rates the polarization for both the samples is greatly enhanced with respect to the polarization at high current rates (12 mV in the case of LiBr and 5 mV with LiTFSI) even though their ratio remains constant. Therefore, the reason for the aforementioned discrepancy could be ascribed to the differences in the electrolyte ionic conductivity, which seems to have an important effect on the cell performance, especially at a high C-rate, reducing the advantages of using a high-donicity element. On the other side, at low current rates, the differences in the SEI composition and morphology seem to be the dominating factor. Overall, this result suggests a limited contribution of the overpotential on the cell’s performance, in fact, more influenced by different factors such as the SEI uniformity, stability, ionic conductivity, and the element’s donicity. Figure 5d reports the voltage curves of the cells at 1C related to the 50th cycle and highlights the slightly lower discrepancy in the polarization values, confirming the aforementioned hypothesis. Rate-capability tests were performed and are reported in Figure S10 of Supplementary Materials showing the electrochemical cells’ performance by varying the current rates. The results show a stronger capacity fading when increasing the current in the lithium-sulfur half-cells containing electrolytes with higher electron-donating properties. This effect could be due to a possible SEI morphology rearrangement. Indeed, the LiBr response shown in Figure 5a,c shows, both at low (C/4) and high (1C) current rates, initial activation cycles which can be attributed to a morphological rearrangement of the SEI. When modifying the current rate, the LiBr cell may require a stabilization period due to the possible morphological reorganization of the SEI layer due to the new current density. Moreover, at a high current rate, the ions’ movement may be hindered by a stable and uniform SEI layer, thus increasing the cell polarization and lowering the delivered capacity. The synergic effect of the aforementioned phenomena may result in a leveling of the cells’ performance.
In order to analyze and confirm the formation of 3D Li2S particles when higher donating anions are present in the electrolyte, a post-mortem analysis on the cycled electrodes was performed. To this aim, the cells containing LiBr, LiI, and LiTFSI were discharged at C/4 and the electrodes were washed with the electrolyte solvents before the analyses. The results are reported in Figure 6.
Figure 6a,d,g refer to the cell employing LiBr as an electrolyte. At low magnification (Figure 6a), the Li2S particles assume spherical-like and 3D shapes, uniformly dispersed on the whole electrode surface. Furthermore, Figure 6d shows particle diameters ranging from 10 to 30 µm, with the relative EDX map (Figure 6g confirms the presence of sulfur, which was considered for the determination of the sulfide phase). The formation of such Li2S deposition morphology, which is due to the presence of the high-donicity LiBr, could be the reason for the superior capacity demonstrated by the cell containing this salt, as shown in Figure 5a. Indeed, this specific 3D-like particle morphology enables the further conversion of sulfur within the electrode thus increasing its utilization. Similarly, Figure 6b,e show the SEM images of the electrode cycled in presence of LiI as electrolyte salt at different magnifications. The use of LiI as a salt electrolyte leads to the formation of 3D-shaped Li2S with a more irregular configuration. These particles, differently from the LiBr electrolyte, appear to be slightly flattened (Figure 6e), with sizes from 10 to 50 µm. The EDX map of Figure 6h confirms the presence of sulfur within the analyzed particles. Finally, Figure 6c,f,i show the SEM images of the LiTFSI sample and the relative EDX map, respectively. As expected, the Li2S deposition when using LiTFSI as electrolytes occurs preferably through the formation of a solid layer in the form of large flattened particles rather than a 3D morphology. This effect causes the progressive coverage of the electrode surface with insulating material, significantly reducing the sulfur utilization and thus its capacity. The EDX map of Figure 6i shows a high concentration of sulfur in correspondence with the studied layer.
From these results, it is possible to conclude that LiBr, the salt-bearing anion with the highest donicity properties, showed the best electrochemical performance both at C/4 and 1C. The main reasons behind the better electrochemical performance of the LiBr-based cells are: (i) the formation of a thicker SEI layer on the lithium metal in the presence of high-donicity salt (LiBr)—as shown by the sharp peak at around 1.5 V in the CV plot (Figure 4a)—along with large interfacial resistance values of the Li/Li cell (Figure 4d), can protect the lithium surface from corrosion products; (ii) stabilization of the S3•− radicals in the presence of LiBr electrolyte facilitates the chemical redox reaction with other sulfur anions such as S2−, leading to an extension of the discharge process; (iii) the 3D growth of Li2S in the high-donicity environment can slow down the passivation of the sulfur electrode, hence increasing the sulfur utilization, as corroborated by SEM analyses. The key factor for 3D nucleation and growth of Li2S is the strong solvation of the lithium ions with PSs in a high-donicity environment. This scenario leads to S2- dissociation in the electrolyte and to the formation of Li2S particles on the sulfur electrode instead of forming a film-like Li2S during the discharge process.

3. Materials and Methods

3.1. Electrode Preparation and Characterization

The sulfur–carbon composite material was prepared by melting method, mixing sulfur and multi-walled carbon nanotubes in an 80:20 weight ratio (named S80MWCNT20) at 150 °C for 12 h. The as-prepared active material was mixed in a mortar with polyacrylonitrile (PAN) as a binder in an 80:20 mass ratio using dimethylformamide (DMF) as the solvent. All the used chemicals are Sigma Aldrich St. Louis, MO, USA products. The obtained slurry was stirred for 1h and cast by doctor blade on AvCarb current collector (FuelCellStore Bryan, TX, USA) [54] and dried at 60 °C for 3 h. The electrode foil was punched into 14 mm diameter disks and dried under vacuum overnight at 60 °C. The sulfur loading of the electrodes was ~2 mg cm−2. The thermogravimetric analysis (TGA) of the active material was performed by a Q500 thermogravimetric analyzer from TA Instruments. The sample was heated under nitrogen flow from 30 to 600 °C at a 10 °C min−1 heating rate. X-ray diffraction (XRD) patterns were acquired in the 2θ/θ scanning mode using a Malvern PANalytical Empyrean instrument equipped with a Cu Kα source. Scanning electron microscope (SEM) and energy dispersive spectroscopy (EDS) analyses were obtained by a JEOL JSM-6490LA SEM—Analytical operating at an acceleration voltage of 15 kV with a W filament thermionic source. The cycling tests were performed in lithium-metal half-cells assembled using CR2032 coin cells with a 2400 Celgard separator soaked with 40 µL of electrolyte (=20 µL/mgS). Galvanostatic cycling tests were carried out at a current rate of 1C (1675 mA g−1 based on sulfur mass) and C/4 (418 mA g−1) in a voltage range of 1.6 V–2.8 V and 1.9 V–2.6 V, respectively. Rate-capability tests were performed by increasing the current rate from C/10 = 167.5 mA g−1 to 1C = 1675 mA g−1 through C/8 = 210 mA g−1, C/6 = 280 mA g−1, C/4 = 418 mA g−1, C/2 = 837 mA g−1, 1C = 1675 mA g−1, and finally back to C/10. The cycling tests were performed by using a BCS-805 multichannel battery unit by BioLogic, Seyssinet-Pariset, France.

3.2. Electrode Preparation and Characterization

Three electrolyte solutions containing different lithium salts were prepared by dissolving 1.0 mol kg−1 of the following salts: lithium bromide (LiBr), lithium iodide (LiI), and bis (trifluoromethane)sulfonimide lithium salt (LiTFSI) with the addition of 0.5 mol kg−1 of lithium nitrate (LiNO3) to each sample. It is worth noting that, since lithium chloride and lithium fluoride salts are not completely soluble in the DOL:DME mixed solvent, their physical and electrochemical properties were not investigated in the current study. The solutions were prepared by using a mixture of 1:1 w/w of 1,3-dioxolane (DOL) and 1,2-dimethoxyethane (DME) in an MBraun argon-filled glovebox (with oxygen and moisture levels lower than 0.1 ppm) and stirred for 24 h before cells assembling. The electrolyte solvents were dried for several days under molecular sieves before mixing. All the above-mentioned chemicals are Sigma Aldrich, St. Louis, MO, USA products. The electrolyte samples will be following named based on the main lithium salts dissolved within the solutions:
LiBr = DOL:DME 1:1 w/w − 0.5 mol kg−1 LiNO3−1.0 mol kg−1 LiB
LiI = DOL:DME 1:1 w/w − 0.5 mol kg−1 LiNO3− 1.0 mol kg−1 LiI
LiTFSI = DOL:DME 1:1 w/w − 0.5 mol kg−1 LiNO3− 1.0 mol kg−1 LiTFSI
The thermal characterization of the electrolyte solutions was performed through thermogravimetric analysis (TGA) by a Q500 thermogravimetric analyzer from TA Instruments. The samples were heated up under nitrogen flow from room temperature to 700 °C at a 10 °C min−1 heating rate. Conductivity tests at different temperatures were carried out in 2032 coin cells employing a Teflon ring separator with a known diameter and thickness in between two stainless steel disks as electrodes. The electrochemical impedance spectroscopy (EIS) measurements were carried out within a 1 MHz–10 kHz frequency range and with 10 mV signal amplitude varying the temperature from room temperature to 90 °C by 10 °C steps. Boukamp Equivalent Circuit software (Version 4.55) was used to analyze the EIS plots. The fitting reliability was evaluated taking into account the chi-squared (χ2) parameter and only the results with a χ2 value lower than 10−5 were considered. Cyclic and linear sweep voltammetry tests were carried out in order to study the electrochemical stability window of the electrolytes. Cyclic voltammetry (CV) analysis was performed over a 0.01 V-OCV vs. Li/Li+ range at a 0.1 mV s−1 scan rate. The coin cells were assembled by using lithium metal as the counter electrode and copper foil coated with carbon (i.e., super P) as the working electrode. The linear sweep voltammetry (LSV) test was carried out at a 0.1 mV s−1 scan rate within OCV-5 V vs. Li/Li+ range by using super P on aluminum as the working electrode. Lithium interface resistance values were calculated by fitting the Nyquist plot obtained by EIS measurements applying a 10 mV signal amplitude in a frequency range between 1 MHz–100 mHz over 30 days. The nonlinear least-squares fit (NLLSQ) was carried out by means of Boukamp software, using an equivalent circuit R (RQ), where R is a resistance and Q represents a capacitance. Lithium stripping/deposition galvanostatic analysis was carried out in symmetrical lithium/lithium 2032 coin cells applying a constant current density of 0.1, 0.84, and 3.35 mA cm−2 within 1 h steps. The lithium transport number (tLi) was obtained by using the Bruce–Vincent technique in Swagelok-type Li/Li symmetrical cells with a DC signal amplitude of 30 mV for 90 min until stabilization, with the Bruce–Vincent equation given as:
t L i = I s s   (   V   I 0 R 0 ) I 0   ( V I s s R S S )
where Iss and I0 are the steady-state current and the initial current values, respectively, V is the applied potential, R0 is the initial resistance, and Rss is the resistance at the steady state. The electrochemical impedance spectroscopy was performed with a 30 mV signal amplitude in the 1 MHz–100 mHz frequency range. The electrolyte characterizations were carried out using a BioLogic, Seyssinet-Pariset, France VMP-3 potentiostat. In order to analyze the morphology of the SEI layer, flattened pieces of metallic lithium were immersed in the three electrolyte solutions for 3 days. SEM pictures and EDX maps were acquired with the same instrument as mentioned before.

4. Conclusions

Electrolyte solutions containing lithium salts bearing different electron-donating properties (LiBr, LiI, and LiTFSI) were herein investigated as suitable mixtures for lithium-sulfur cells. Ionic conductivity properties at different temperatures and the lithium transport number of the electrolytes were studied in order to compare the mobility of the different species, remarkably affected by the electron-donating properties of the studied anions. The electrochemical window stability as well as the lithium interface resistance and lithium stripping/deposition properties were considered. The galvanostatic cycling performance of the cell employing a higher donicity electrolyte (containing Br) revealed a higher sulfur utilization with respect to lower donor electrolytes, thus resulting in increased specific discharge capacities, especially at a low current rate. These results could be mainly attributed to the suitable passivation layer growth on the cathode surface, as suggested by the SEM images of the Li2S particles, and to the formation of a stable SEI layer as suggested by the interface resistance values. At a high C-rate, the tested electrolytes present a similar cycling trend, confirming the ionic conductivity, which has higher values in lower donicity electrolytes (LiI and LITFSI), as a critical parameter in the cell performance. Finally, the LiBr electrolyte demonstrated the best performance in terms of specific capacity both at C/4 and 1C, delivering 900 and 750 mAh g−1, respectively, thus revealing its applicability in lithium-sulfur cells.

Supplementary Materials

The following supporting information can be downloaded at: https://www.mdpi.com/article/10.3390/inorganics11020086/s1, Figure S1: XRD pattern of pristine sulfur pre-treatment; Figure S2: SEM images of the sulfur electrode surface and cross-section; Figure S3: Electrochemical impedance spectroscopy measurements of the electrolytes for ionic conductivity determination; Figure S4: Comparison of electrolytes’ conductivity values upon cooling; Figure S5: Chronoamperometry measurements of LiBr, LiI, and LiTFSI electrolytes and EIS; Figure S6: Cyclic voltammetry tests of LiBr, LiI, and LiTFSI electrolytes; Figure S7: Nyquist plots relative to the electrochemical impedance spectroscopy; Figure S8: Coulombic efficiency of the galvanostatic cycling performed at C/4 and 1C; Figure S9: Stripping/deposition test at C/4 and 1C on LiTFSI and LiBr electrolyte samples; Figure S10: Rate-capability test of LiBr, LiI, and LiTFSI electrolytes.

Author Contributions

Conceptualization, E.V. and L.C.; formal analysis, E.V. and P.S.; investigation, E.V., P.S. and S.F.; resources, R.P.Z.; data curation, E.V.; writing—original draft preparation, E.V.; writing—review and editing, R.P.Z., E.V. and S.L.; supervision, R.P.Z.; project administration, L.C. and E.V.; funding acquisition, R.P.Z. All authors have read and agreed to the published version of the manuscript.

Funding

R.P.Z. wishes to recognize support from the Natural Science Foundation of China, grant no. 32071317.

Data Availability Statement

Not applicable.

Acknowledgments

R.P.Z. wishes to recognize support from the Natural Science Foundation of China.

Conflicts of Interest

The authors declare no conflict of interest.

References

  1. Pozio, A.; Di Carli, M.; Aurora, A.; Falconieri, M.; Della Seta, L.; Prosini, P.P. Hard carbons for use as electrodes in Li-S and Li-ion batteries. Nanomaterials 2022, 12, 1349. [Google Scholar] [CrossRef] [PubMed]
  2. Chen, S.; Dai, F.; Gordin, M.L.; Wang, D. Exceptional electrochemical performance of rechargeable Li-S batteries with a polysulfide-containing electrolyte. RSC Adv. 2013, 3, 3540–3543. [Google Scholar] [CrossRef]
  3. Carbone, L.; Greenbaum, S.; Devany, M.; Hassoun, J.; Coneglian, T.; Munoz, S.; Gobet, M. A simple approach for making a viable, safe, and high-performances lithium-sulfur battery. J. Power Sources 2017, 377, 26–35. [Google Scholar] [CrossRef]
  4. Kang, H.J.; Bari, G.A.K.M.R.; Lee, T.G.; Khan, T.T.; Park, J.W.; Hwang, H.J.; Cho, S.Y.; Jun, Y.S. Microporous carbon nanoparticles for lithium-sulfur batteries. Nanomaterials 2020, 10, 2012. [Google Scholar] [CrossRef] [PubMed]
  5. Salama, M.; Rosy; Attias, R.; Yemini, R.; Gofer, Y.; Aurbach, D.; Noked, M. Metal-sulfur batteries: Overview and research methods. ACS Energy Lett. 2019, 4, 436–446. [Google Scholar] [CrossRef]
  6. Vizintin, A.; Patel, M.U.M.; Genorio, B.; Dominko, R. Effective separation of lithium anode and sulfur cathode in lithium-sulfur batteries. ChemElectroChem 2014, 1, 1040–1045. [Google Scholar] [CrossRef]
  7. Li, T.; Bai, X.; Gulzar, U.; Bai, Y.J.; Capiglia, C.; Deng, W.; Zhou, X.; Liu, Z.; Feng, Z.; Proietti Zaccaria, R. A comprehensive understanding of lithium–sulfur battery technology. Adv. Funct. Mater. 2019, 29, 1901730. [Google Scholar] [CrossRef]
  8. Rauchfuss, T. Under sulfur’s spell. Nat. Chem. 2011, 3, 648. [Google Scholar] [CrossRef]
  9. Fan, X.; Sun, W.; Meng, F.; Xing, A.; Liu, J. Advanced chemical strategies for lithium–sulfur batteries: A review. Green Energy Environ. 2018, 3, 2–19. [Google Scholar] [CrossRef]
  10. Danner, T.; Latz, A. On the influence of nucleation and growth of S8 and Li2S in lithium-sulfur batteries. Electrochim. Acta 2019, 322, 134719. [Google Scholar] [CrossRef]
  11. Yang, B.; Jiang, H.; Zhou, Y.; Liang, Z.; Zhao, T.; Lu, Y.C. Critical role of anion donicity in Li2S deposition and sulfur utilization in Li-S batteries. ACS Appl. Mater. Interfaces 2019, 11, 25940–25948. [Google Scholar] [CrossRef] [PubMed]
  12. Wu, F.; Lee, J.T.; Nitta, N.; Kim, H.; Borodin, O.; Yushin, G. Lithium iodide as a promising electrolyte additive for lithium-sulfur batteries: Mechanisms of performance enhancement. Adv. Mater. 2015, 27, 101–108. [Google Scholar] [CrossRef] [PubMed]
  13. Hwa, Y.; Cairns, E.J. Nanostructured sulfur and sulfides for advanced lithium/sulfur cells. ChemElectroChem 2020, 7, 3927–3942. [Google Scholar] [CrossRef]
  14. Gulzar, U.; Li, T.; Bai, X.; Goriparti, S.; Brescia, R.; Capiglia, C.; Zaccaria, R.P. Nitrogen-doped single walled carbon nanohorns enabling effective utilization of Ge nanocrystals for next generation lithium ion batteries. Electrochim. Acta 2019, 298, 89–96. [Google Scholar] [CrossRef]
  15. Gorlin, Y.; Patel, M.U.M.; Freiberg, A.; He, Q.; Piana, M.; Tromp, M.; Gasteiger, H.A. Understanding the charging mechanism of lithium-sulfur batteries using spatially resolved operando X-ray absorption spectroscopy. J. Electrochem. Soc. 2016, 163, A930–A939. [Google Scholar] [CrossRef] [Green Version]
  16. He, Y.; Qiao, Y.; Chang, Z.; Cao, X.; Jia, M.; He, P.; Zhou, H. Developing a “polysulfide-phobic” strategy to restrain shuttle effect in lithium–sulfur batteries. Angew. Chemie—Int. Ed. 2019, 58, 11774–11778. [Google Scholar] [CrossRef] [PubMed]
  17. Gupta, A.; Bhargav, A.; Manthiram, A. Highly solvating electrolytes for lithium–sulfur batteries. Adv. Energy Mater. 2019, 9, 1803096. [Google Scholar] [CrossRef] [PubMed]
  18. Chu, H.; Jung, J.; Noh, H.; Yuk, S.; Lee, J.; Lee, J.H.; Baek, J.; Roh, Y.; Kwon, H.; Choi, D.W.; et al. Unraveling the dual functionality of high-donor-number anion in lean-electrolyte lithium-sulfur batteries. Adv. Energy Mater. 2020, 10, 2000493. [Google Scholar] [CrossRef]
  19. Lacey, M.J. Influence of the electrolyte on the internal resistance of lithium−sulfur batteries studied with an intermittent current interruption method. ChemElectroChem 2017, 4, 1997–2004. [Google Scholar] [CrossRef]
  20. Chu, H.; Noh, H.; Kim, Y.J.; Yuk, S.; Lee, J.H.; Lee, J.; Kwack, H.; Kim, Y.K.; Yang, D.K.; Kim, H.T. Achieving three-dimensional lithium sulfide growth in lithium-sulfur batteries using high-donor-number anions. Nat. Commun. 2019, 10, 188. [Google Scholar] [CrossRef] [Green Version]
  21. Gerber, L.C.H.; Frischmann, P.D.; Fan, F.Y.; Doris, S.E.; Qu, X.; Scheuermann, A.M.; Persson, K.; Chiang, Y.M.; Helms, B.A. Three-dimensional growth of Li2S in lithium-sulfur batteries promoted by a redox mediator. Nano Lett. 2016, 16, 549–554. [Google Scholar] [CrossRef] [PubMed]
  22. Burke, C.M.; Pande, V.; Khetan, A.; Viswanathan, V.; McCloskey, B.D. Enhancing electrochemical intermediate solvation through electrolyte anion selection to increase nonaqueous Li-O2 battery capacity. Proc. Natl. Acad. Sci. USA 2015, 112, 9293–9298. [Google Scholar] [CrossRef] [PubMed] [Green Version]
  23. Kottam, P.K.R.; Dongmo, S.; Wohlfahrt-Mehrens, M.; Marinaro, M. Effect of salt concentration, solvent donor number and Coordination structure on the variation of the Li/Li+ potential in aprotic electrolytes. Energies 2020, 13, 1470. [Google Scholar] [CrossRef] [Green Version]
  24. Cao, R.; Chen, J.; Han, K.S.; Xu, W.; Mei, D.; Bhattacharya, P.; Engelhard, M.H.; Mueller, K.T.; Liu, J.; Zhang, J.G. Effect of the anion activity on the stability of Li metal anodes in lithium-sulfur batteries. Adv. Funct. Mater. 2016, 26, 3059–3066. [Google Scholar] [CrossRef]
  25. Xiao, Y.; Han, B.; Zeng, Y.; Chi, S.S.; Zeng, X.; Zheng, Z.; Xu, K.; Deng, Y. New lithium salt forms interphases suppressing both Li dendrite and polysulfide shuttling. Adv. Energy Mater. 2020, 10, 1903937. [Google Scholar] [CrossRef]
  26. Shin, H.; Baek, M.; Gupta, A.; Char, K.; Manthiram, A.; Choi, J.W. Recent progress in high donor electrolytes for lithium–sulfur batteries. Adv. Energy Mater. 2020, 10, 2001456. [Google Scholar] [CrossRef]
  27. Zou, Q.; Lu, Y.C. Solvent-dictated lithium sulfur redox reactions: An operando UV-vis spectroscopic study. J. Phys. Chem. Lett. 2016, 7, 1518–1525. [Google Scholar] [CrossRef]
  28. Linert, W.; Jameson, R.F.; Taha, A. Donor numbers of anions in solution: The use of solvatochromic Lewis acid-base indicators. J. Chem. Soc. Dalt. Trans. 1993, 3181–3186. [Google Scholar] [CrossRef]
  29. Adams, B.D.; Carino, E.V.; Connell, J.G.; Han, K.S.; Cao, R.; Chen, J.; Zheng, J.; Li, Q.; Mueller, K.T.; Henderson, W.A.; et al. Long term stability of Li-S batteries using high concentration lithium nitrate electrolytes. Nano Energy 2017, 40, 607–617. [Google Scholar] [CrossRef]
  30. Li, W.; Yao, H.; Yan, K.; Zheng, G.; Liang, Z.; Chiang, Y.M.; Cui, Y. The synergetic effect of lithium polysulfide and lithium nitrate to prevent lithium dendrite growth. Nat. Commun. 2015, 6, 7436. [Google Scholar] [CrossRef] [Green Version]
  31. Barghamadi, M.; Best, A.S.; Bhatt, A.I.; Hollenkamp, A.F.; Musameh, M.; Rees, R.J.; Rüther, T. Lithium-sulfur batteries—The solution is in the electrolyte, but is the electrolyte a solution? Energy Environ. Sci. 2014, 7, 3902–3920. [Google Scholar] [CrossRef]
  32. Rodriguez, R.; Edison, R.A.; Stephens, R.M.; Sun, H.H.; Heller, A.; Mullins, C.B. Separator-free and concentrated LiNO3 electrolyte cells enable uniform lithium electrodeposition. J. Mater. Chem. A 2020, 8, 3999–4006. [Google Scholar] [CrossRef]
  33. Carbone, L.; Gobet, M.; Peng, J.; Devany, M.; Scrosati, B.; Greenbaum, S.; Hassoun, J. Comparative study of ether-based electrolytes for application in lithium-sulfur battery. ACS Appl. Mater. Interfaces 2015, 7, 13859–13865. [Google Scholar] [CrossRef] [PubMed]
  34. Johansson, P. Electronic structure calculations on lithium battery electrolyte salts. Phys. Chem. Chem. Phys. 2007, 9, 1493–1498. [Google Scholar] [CrossRef]
  35. Diederichsen, K.M.; McShane, E.J.; McCloskey, B.D. Promising routes to a high Li+ transference number electrolyte for lithium ion batteries. ACS Energy Lett. 2017, 2, 2563–2575. [Google Scholar] [CrossRef]
  36. Fong, K.D.; Self, J.; Diederichsen, K.M.; Wood, B.M.; McCloskey, B.D.; Persson, K.A. Ion transport and the true transference number in nonaqueous polyelectrolyte solutions for lithium ion batteries. ACS Cent. Sci. 2019, 5, 1250–1260. [Google Scholar] [CrossRef] [PubMed] [Green Version]
  37. France-Lanord, A.; Grossman, J.C. Correlations from ion pairing and the Nernst-Einstein equation. Phys. Rev. Lett. 2019, 122, 136001. [Google Scholar] [CrossRef] [Green Version]
  38. Zhang, S.S. Role of LiNO3 in rechargeable lithium/sulfur battery. Electrochim. Acta 2012, 70, 344–348. [Google Scholar] [CrossRef]
  39. Devany, M.; Peng, J.; Gobet, M.; Greenbaum, S.; Hassoun, J.; Carbone, L.; Scrosati, B. Polyethylene glycol dimethyl ether (PEGDME)-based electrolyte for lithium metal battery. J. Power Sources 2015, 299, 460–464. [Google Scholar] [CrossRef] [Green Version]
  40. He, Y.; Zhang, Y.; Yu, P.; Ding, F.; Li, X.; Wang, Z.; Lv, Z.; Wang, X.; Liu, Z.; Huang, X. Ion association tailoring SEI composition for Li metal anode protection. J. Energy Chem. 2020, 45, 1–6. [Google Scholar] [CrossRef] [Green Version]
  41. Li, T.; Bai, X.; Gulzar, U.; Capiglia, C.; Bai, Y.J.; Proietti Zaccaria, R. Facile synthesis of highly graphitized carbon via reaction of CaC2 with sulfur and its application for lithium/sodium-ion batteries. ACS Omega 2019, 4, 8312–8317. [Google Scholar] [CrossRef] [PubMed] [Green Version]
  42. Wu, F.; Thieme, S.; Ramanujapuram, A.; Zhao, E.; Weller, C.; Althues, H.; Kaskel, S.; Borodin, O.; Yushin, G. Toward in-situ protected sulfur cathodes by using lithium bromide and pre-charge. Nano Energy 2017, 40, 170–179. [Google Scholar] [CrossRef]
  43. Elgrishi, N.; Rountree, K.J.; McCarthy, B.D.; Rountree, E.S.; Eisenhart, T.T.; Dempsey, J.L. A practical beginner’s guide to cyclic voltammetry. J. Chem. Educ. 2018, 95, 197–206. [Google Scholar] [CrossRef]
  44. Lang, S.; Feng, X.; Seok, J.; Yang, Y.; Krumov, M.R.; Molina Villarino, A.; Lowe, M.A.; Yu, S.H.; Abruña, H.D. Lithium–sulfur redox: Challenges and opportunities. Curr. Opin. Electrochem. 2021, 25, 100652. [Google Scholar] [CrossRef]
  45. Zhang, S.S. Improved cyclability of liquid electrolyte lithium/sulfur batteries by optimizing electrolyte/sulfur ratio. Energies 2012, 5, 5190–5197. [Google Scholar] [CrossRef] [Green Version]
  46. Liu, J.; Chen, H.; Chen, W.; Zhang, Y.; Zheng, Y. New insight into the “shuttle mechanism” of rechargeable lithium-sulfur batteries. ChemElectroChem 2019, 6, 2782–2787. [Google Scholar] [CrossRef]
  47. Ying, K.; Tian, R.; Zhou, J.; Li, H.; Dugnani, R.; Lu, Y.; Duan, H.; Guo, Y.; Liu, H. A three dimensional sulfur/reduced graphene oxide with embedded carbon nanotubes composite as a binder-free, free-standing cathode for lithium-sulfur batteries. RSC Adv. 2017, 7, 43483–43490. [Google Scholar] [CrossRef] [Green Version]
  48. Waluś, S.; Barchasz, C.; Bouchet, R.; Leprêtre, J.C.; Colin, J.F.; Martin, J.F.; Elkaïm, E.; Baehtz, C.; Alloin, F. Lithium/sulfur batteries upon cycling: Structural modifications and species quantification by in situ and operando X-ray diffraction spectroscopy. Adv. Energy Mater. 2015, 5, 1500165. [Google Scholar] [CrossRef]
  49. Yoon, G.; Moon, S.; Ceder, G.; Kang, K. Deposition and stripping behavior of lithium metal in electrochemical system: Continuum mechanics study. Chem. Mater. 2018, 30, 6769–6776. [Google Scholar] [CrossRef]
  50. Zhang, S.S. A new finding on the role of LiNO3 in lithium-sulfur battery. J. Power Sources 2016, 322, 99–105. [Google Scholar] [CrossRef]
  51. Carbone, L.; Peng, J.; Agostini, M.; Gobet, M.; Devany, M.; Scrosati, B.; Greenbaum, S.; Hassoun, J. Carbon composites for a high-energy lithium–sulfur battey with a glyme-based electrolyte. ChemElectroChem 2017, 4, 209–215. [Google Scholar] [CrossRef]
  52. Xiao, L.; Cao, Y.; Xiao, J.; Schwenzer, B.; Engelhard, M.H.; Saraf, L.V.; Nie, Z.; Exarhos, G.J.; Liu, J. A soft approach to encapsulate sulfur: Polyaniline nanotubes for lithium-sulfur batteries with long cycle life. Adv. Mater. 2012, 24, 1176–1181. [Google Scholar] [CrossRef] [PubMed]
  53. Zhang, S.; Li, N.; Lu, H.; Zheng, J.; Zang, R.; Cao, J. Improving lithium-sulfur battery performance via a carbon-coating layer derived from the hydrothermal carbonization of glucose. RSC Adv. 2015, 5, 50983–50988. [Google Scholar] [CrossRef]
  54. Wang, C.C.; Lin, Y.C.; Chiu, K.F.; Leu, H.J.; Ko, T.H. Advanced carbon cloth as current collector for enhanced electrochemical performance of lithium-rich layered oxide cathodes. ChemistrySelect 2017, 2, 4419–4427. [Google Scholar] [CrossRef]
Figure 1. (a) X-ray diffraction pattern of the S80MWCNT20 composite (purple curve), reference patterns of bulk orthorhombic sulfur (pink bars, ICDD: 01-078-1889), and carbon nanotubes (green bars, ICDD: 00-058-1638). (b) Thermogravimetric analysis of the composite performed under a nitrogen atmosphere by increasing the temperature from room temperature to 600 °C at 10 °C min−1. (c,d) SEM images at different magnifications and (e) EDX mapping of the composite (green color for sulfur, blue color for carbon).
Inorganics 11 00086 g001
Figure 2. Thermogravimetric analysis (TGA) curves of LiBr, LiI, and LiTFSI electrolytes performed from room temperature up to 700 °C at a heating rate of 10 °C min−1.
Inorganics 11 00086 g002
Figure 3. (a) Comparison of conductivity Arrhenius plots upon heating obtained by EIS measurements and (b) lithium transport number of LiBr, LiI, and LiTFSI electrolytes obtained by the Bruce–Vincent method in a symmetrical Li/Li T−cell at room temperature.
Inorganics 11 00086 g003
Figure 4. (a) Cyclic voltammetry tests—first cycle—for LiBr, LiI, and LiTFSI electrolytes performed in lithium−metal half−cells (2032 coin cells) using a copper foil coated with carbon (by employing Super P as active material) as the working electrode, recorded at a scan rate of 0.1 mV s−1 in the 0.01 V−2.2 V voltage range. (b) Linear sweep voltammetry of LiBr, LiI, and LiTFSI electrolytes performed in lithium-metal half-cells (2032 coin cells) using Super P on aluminum as the working electrode, recorded at a scan rate of 0.1 mV s−1 in the OCV-5 V voltage range. (c) Li–electrolyte interface resistance evolution in time performed in symmetrical Li/Li cells obtained through electrochemical impedance spectroscopy applying a signal amplitude of 10 mV within 1 MHz-100 mHz frequency range at room temperature. (d) Voltage vs. time profiles of lithium stripping/deposition galvanostatic analysis of LiBr, LiI, and LiTFSI electrolytes, obtained by applying 0.1 mA cm−2 current density in a symmetrical Li/Li cell at room temperature.
Inorganics 11 00086 g004
Figure 5. (a,c) Galvanostatic cycling performance and (b,d) the relative voltage profiles of LSBs realized with LiBr, LiI, and LiTFSI electrolytes performed in a 1.6–2.8 V voltage range carried out at (a,b) C/4 = 419 mA g−1 and (c,d) 1C = 1675 mA g−1. The voltage profiles were plotted considering the 50th cycle.
Inorganics 11 00086 g005
Figure 6. SEM images at different magnifications of the Li2S morphology on the post-mortem sulfur electrodes using (a,d,g) LiBr, (b,e,h) LiI, and (c,f,i) LiTFSI electrolytes, respectively. The relative EDX maps are reported in figure (g,h,i).
Inorganics 11 00086 g006
Disclaimer/Publisher’s Note: The statements, opinions and data contained in all publications are solely those of the individual author(s) and contributor(s) and not of MDPI and/or the editor(s). MDPI and/or the editor(s) disclaim responsibility for any injury to people or property resulting from any ideas, methods, instructions or products referred to in the content.

