Article

An Integrated GIS-Based Reinforcement Learning Approach for Efficient Prediction of Disease Transmission in Aquaculture

1
Department of Computer Engineering and Informatics, University of Patras, 26504 Patras, Greece
2
Department of Fisheries and Aquaculture, University of Patras, 30200 Mesolongi, Greece
3
Department of History and Archaeology, University of Patras, 26504 Patras, Greece
*
Author to whom correspondence should be addressed.
Information 2023, 14(11), 583; https://doi.org/10.3390/info14110583
Submission received: 12 September 2023 / Revised: 12 October 2023 / Accepted: 19 October 2023 / Published: 24 October 2023
(This article belongs to the Special Issue Second Edition of Predictive Analytics and Data Science)

Abstract

:
This study explores the design and capabilities of a Geographic Information System (GIS) incorporated with an expert knowledge system, tailored for tracking and monitoring the spread of dangerous diseases across a collection of fish farms. Specifically targeting the aquacultural regions of Greece, the system captures geographical and climatic data pertinent to these farms. A feature of this system is its ability to calculate disease transmission intervals between individual cages and broader fish farm entities, providing crucial insights into the spread dynamics. These data then act as an entry point to our expert system. To enhance the predictive precision, we employed various machine learning strategies, ultimately focusing on a reinforcement learning (RL) environment. This RL framework, enhanced by the Multi-Armed Bandit (MAB) technique, stands out as a powerful mechanism for effectively managing the flow of virus transmissions within farms. Empirical tests highlight the efficiency of the MAB approach, which, in direct comparisons, consistently outperformed other algorithmic options, achieving an impressive accuracy rate of 96%. Looking ahead to future work, we plan to integrate buffer techniques and delve deeper into advanced RL models to enhance our current system. The results set the stage for future research in predictive modeling within aquaculture health management, and we aim to extend our research even further.

1. Introduction

A plethora of works exist in the literature dealing with applications of machine learning in intelligent fish aquaculture. In [1], a review and analysis of the developments of machine learning in fish-intelligent aquaculture was conducted; the work emphasized the application and use of deep learning and neural network that has expanded the scope for intelligent application in fish aquaculture and improved the efficiency and benefit of breeding. The applications included fish biomass detection, identification, and classification of fish, behavior analysis, and water quality parameter prediction, while the machine learning models were mainly CNN models and then SVM, BPNN, BM, KNN, RF, AdaBoost, YOLOv3, RNN, and XGBoost. In [2], the authors reviewed the application of deep learning in aquaculture and categorize research by aquatic products (i.e., fish, shrimp, scallops, coral, jellyfish, aquatic macroinvertebrates, phytoplankton, and water quality), presenting examples of current research such as (among others) fish behavior monitoring, fish fillets defect detection, shrimp disease research, activity monitoring of cold water coral polyps, classification, phytoplankton classification, trend prediction of red tide biomass, dissolved oxygen content prediction, temperature prediction, and marine floating raft aquaculture monitoring. Of particular interest in the specific paper is the reference to works for water quality prediction, with various of its applications: Dissolved Oxygen prediction, Chlorophyll-a Content Prediction, Temperature Prediction.
In [3], algorithms for determining the mean transmission distances (and variability around the mean) of the pathogen cohorts were developed. The authors compared a computational modeling procedure, which is a computer program that simulates the spread of disease, and an analytical expression model, which is a mathematical equation that can be used to calculate the transmission of pathogens. The authors employed a mathematical model (discrete-time Susceptible-Exposed-Infectious-Recovered (SEIR)) to avoid the risk of infection that takes into account the transmission, expression, recovery, and decay of pathogens, as well as the movement of water between farms. The specific model also simplifies the hydrodynamics of water movement to account for residual advection, tidal advection, and turbulent diffusion. The model was compared to a more complex numerical model and was found to be comparable.
In [4], the project VECA was developed with the goal to improve the surveillance aquaculture system in the Spanish aquaculture sector. The proposed approach aimed at the creation of an interactive and participatory disease surveillance system for aquaculture in Spain and it can identify and characterize diseases laying the groundwork for preventing future diseases that could cause significant economic losses. The proposed system can generate qualitative environmental variables, quantitative environmental variables, husbandry management, and health management at the farm, production unit, and batch of animals; technical tools include relative frequencies for qualitative variables, and mean, standard deviation, minimum, and maximum for quantitative variables.
In [5], modifications to a proposed “risk of flooding” project were proposed based on whether the farm has experienced flooding before. The initial categorization of flood farms (“null” risk and “low” risk) was revised to take into account the flooding hazard maps of each Swiss canton. These maps classify geographic areas into no or negligible hazard, residual hazard, minor hazard, medium hazard, and considerable hazard. There were no significant fluctuations in the risk categorization due to natural and seasonal factors during the project period, hence the proposed model can be considered to be stable over short time periods.
In [6], a spatiotemporal stochastic model for the spread of pancreas disease (PD) in marine fish farms producing salmonids, i.e., Atlantic salmon (Salmo salar) and rainbow trout (Oncorhynchus mykiss), was proposed in Norway.
The model is mainly mechanistic, taking into account potential transmission pathways between farms, as well as factors affecting susceptibility or infectiousness, such as the number of farm animals. The within-farm infection was modeled using an internal SIR model, and the model was formulated using a Bayesian framework. Finally, the estimation of the model parameters took place from available data using Markov Chain Monte Carlo (MCMC) techniques.
Research papers have highlighted the potential of integrating GIS-based reinforcement learning with existing disease transmission prediction models to enhance decision-making in disease control. Wan et al. proposed a multi-objective model-based reinforcement learning framework aimed at minimizing the overall long-term cost of implementing infectious disease control measures [7]. Haddad et al. introduced a GIS-based spatial-temporal simulation approach and software that aids public health decision-making in the context of communicable diseases in urban areas [8]. Raissi et al. emphasized the significance of determining model parameters for disease transmission prediction through optimization, deep learning, and statistical inference methods [9]. Additionally, Firestone et al. conducted a comparative analysis of nine transmission network models based on foot-and-mouth disease outbreaks simulated in a previously free country, coupled with corresponding simulated phylogenies and genomic samples from animals on infected premises [10]. These research findings collectively suggest the promising potential of GIS-based reinforcement learning in advancing disease transmission prediction models, providing valuable support for decision-making in disease control strategies.
The remainder of this article is structured as follows: Section 2 presents the background and existing works in the field of aquaculture, GIS systems, and disease transmission, as well as some case studies. In Section 3, we present our proposed method, which is comprised of subsections such as Section 3.1, which presents a concise overview of materials and methods utilized and their applicability in aquaculture. Section 3.2 describes Reinforcement Learning and its application to aquaculture while highlighting its structure and fundamentals in our case study. Section 4 conducts experiments to illustrate the efficacy of the proposed method for predicting disease transmission in fish ecosystems. In Section 5, a discussion takes place in which the methods and their results are explained more thoroughly. Finally, Section 6 concludes the paper, discussing potential future research and the significance of our proposed method in the field of epidemic modeling in aquaculture and fishery farms.

2. Background and Related Work

Section 2 provides a structured overview of essential concepts and methodologies relevant to this study. Within Section 2.1, the dynamics of disease transmission in aquaculture are discussed. This discussion is followed by Section 2.2, which details the role of Geographic Information Systems (GIS) in disease transmission analysis. The application of Reinforcement Learning in disease control is presented in Section 2.3. Following that, Section 2.4 highlights the potential integration of GIS and Reinforcement Learning. Practical instances from the industry are elaborated upon in Section 2.5, showcasing relevant case studies and applications. Finally, Section 2.6 points out existing research gaps and establishes the motivation for this study.

2.1. Introduction to Disease Transmission in Aquaculture

Navigating disease transmission in aquaculture is challenging, given the multifactorial nature of fish diseases and their sensitivity to environmental conditions. The aquaculture industry, responsible for cultivating entities such as fish, shellfish, and aquatic plants, is integral to the global food system. However, the inherent conditions of aquaculture, characterized by close confinement and high densities, accentuate the potential for expedited disease spread. Consequently, a thorough understanding and precise prediction of disease trajectories are imperative to mitigate the associated economic and ecological impact.
The importance of forecasting disease transmission in aquaculture is emphasized by its pivotal role in ensuring the industry’s economic sustainability. Disease outbreaks can lead to substantial losses for aquaculture farmers, resulting in decreased production, elevated mortality rates, and financial instability. Swift and accurate prediction models enable the timely implementation of intervention strategies, including quarantine protocols, vaccination initiatives, and enhanced biosecurity measures. These proactive measures can considerably reduce the risk and severity of disease outbreaks, thereby safeguarding the livelihoods of aquaculture producers and fostering sustainable industry growth.
Furthermore, accurate disease transmission prediction holds broader implications for food security and public health. As aquaculture continues to play a pivotal role in global seafood supply, ensuring the health and well-being of farmed aquatic organisms is paramount. Diseases affecting aquaculture species not only impact the availability and affordability of seafood but may also pose risks to human health if zoonotic diseases are transmitted through the consumption of infected fish. Consequently, precise disease transmission models contribute to the production of safe and wholesome seafood, addressing worldwide food security concerns and minimizing public health hazards.
Addressing these challenges in disease transmission prediction requires interdisciplinary efforts and innovative approaches. Notable research studies contribute valuable insights. Dunstan et al. proposed utilizing trophic ecology to underpin ecosystem approaches for disease transmission prediction, emphasizing the importance of understanding species interactions [11]. Peeler and Taylor discussed risk-based approaches for aquatic animal health management and their application to disease transmission prediction [12]. Murray and Peeler provided a framework for understanding emerging diseases in aquaculture, emphasizing the need for proactive surveillance [13]. Moreover, Georgiadis et al. highlighted the role of epidemiology in disease control in wild and cultured fish populations [14].
On the other hand, Baud et al. demonstrated that disease transmission prediction is crucial in aquaculture to mitigate the impact of outbreaks, and discussed that accurate estimation of mortality rates is essential for effective management strategies [15]. Murray et al. highlighted that disease burden is a significant global issue, and accurate prediction and management of diseases is crucial for reducing mortality and disability rates across different industries, including aquaculture [16]. Bondad-Reantaso et al. addressed disease and health management in Asian aquaculture, and examined that the implementation of effective disease prediction and control measures is necessary to ensure sustainable and profitable aquaculture production [17]. Peeler et al. investigated the role of non-native aquatic animal introductions in driving disease emergence in Europe, and demonstrated that controls are essential to prevent further spread and protect aquaculture systems [18].
In addition, recent research by Alaliyat et al. introduced an agent-based model for predicting pathogen transmission patterns in Norwegian fjords [19]. Liao et al. developed a mechanistic population dynamics model to predict the effect of heavy-metal stresses on susceptibility to pollution-associated infectious diseases [20]. Stärk et al. emphasized the role of molecular and genomic data for disease surveillance [21]. Pérez-Sánchez et al. discussed biological approaches for bacterial disease prevention and control [22].
Recent studies emphasize on the complex challenges inherent in predicting disease transmission within aquaculture contexts. Mugimba et al. highlighted the rising complexities associated with emerging viral diseases, wild reservoirs, and diagnostic limitations [23]. Sabo-Attwood et al. examined the nuances of managing aquatic disease agents, exploring nanotechnology’s potential to enhance disinfection and early warning systems [24]. Ahmed et al. introduced a promising machine-learning technique for timely fish disease identification [25]. Romero et al. contributed a simulation framework for modeling waterborne pathogen spread in marine aquaculture, a tool valuable for assessing control strategies [26].
Ultimately, these studies collectively underscore the necessity of a multifaceted approach in predicting disease transmission within aquaculture. This demands cohesive strategies, including biosecurity policies, rigorous implementation of measures, vaccine advancements, strategic medication and probiotic use, selective breeding, advanced diagnostics, vigilant surveillance, and prudent husbandry. Such a holistic strategy fortifies aquaculture’s resilience against disease complexities, securing its future sustainability. As disease transmission intricacies persist, accurate prediction models are imperative. Addressing challenges and enhancing predictive capabilities are pivotal to sustaining the aquaculture industry’s profitability, ensuring food security, and safeguarding public health.

2.2. The Role of Geographic Information Systems (GIS) in Disease Transmission Analysis in Aquaculture

Aquaculture, a critical domain in sustainable food production, is increasingly relying on Geographic Information Systems (GIS) for disease transmission analysis. GIS, an advanced digital mapping and analytical tool, not only helps visualize the geographical spread of diseases but also discerns patterns and offers predictive insights. By integrating a variety of datasets, from environmental to biological, GIS enables comprehensive analysis of disease risk zones, facilitating preemptive measures and efficient resource allocation. As the literature suggests, this technology’s value in aquaculture disease management is significant, evolving, and is indispensable for ensuring a healthy and sustainable future in this sector. Studies have used GIS for site selection of aquaculture, mapping groundwater quality, predicting marine fish production [27,28], and spatial analysis [29,30].
The literature underscores the efficacy of Geographic Information Systems (GIS) in the sector of aquaculture, particularly concerning the analysis of disease dissemination. Evidently, works by McLeod et al. [31], Ross et al. [32], Falconer et al. [33], and Nath et al. [34] all combine the promising capabilities of GIS as a mechanism for detailed aquaculture planning and robust decision-making support. Such systems facilitate the pinpointing of areas optimal for aquaculture activities while equipping practitioners with tools to tackle multifaceted spatial management dilemmas. Significantly, Nath et al. [34] offered an immersive user-centric approach to GIS applications, underscoring the essential importance of harmonizing the perspectives of end users, domain experts, and analysts throughout the project lifecycle.
Norstrøm posits that the utilization of GIS facilitates an enhanced spatial representation of farms and their associated infrastructures, thereby optimizing responses to disease outbreaks and establishing preventive strategies against infectious pathogens [35]. In a parallel investigation, Simms underscores the role of GIS in monitoring soft-shell clam habitats, with an emphasis on its capability to rigorously evaluate water quality and sustainability metrics of the resource [36]. Expanding on this discussion, Kapetsky’s research et al. in [37,38] provided a comprehensive assessment of the extent to which GIS has been embedded within the developmental and managerial landscapes of aquaculture. Kapetsky et al. highlighted the numerous potential benefits of this integration, particularly in tackling pressing sustainability challenges.
An overview of the prominent aspects, their descriptions, and corresponding references are summarized in Table 1.
Concluding from the examination of research studies, GIS is recognized not merely as a tool but as an integral component in the academic discourse of disease analysis within aquaculture. Its ability to offer a detailed spatial database combined with its capacity for virtual modeling underlines its importance. Collectively, these capabilities enable more precise assessments and interventions concerning disease outbreak patterns in aquaculture.

2.3. Reinforcement Learning in Disease Control

Reinforcement learning, a specified domain within machine learning, engages agents in decision-making processes governed by received rewards or penalties from environmental interactions. Its applicability spans diverse fields, notably aquaculture and healthcare. Within aquaculture, research proposed in [54] underscores the efficacy of reinforcement learning in monitoring fish growth trajectories and optimizing feeding control mechanisms. Sources have advocated for the use of model-based reinforcement learning (MBRL) in infectious disease control to help reduce the overall cost of interventions.
Additionally, RL emerges as a powerful tool in optimizing disease control strategies in aquaculture, as illuminated by the collective findings of several academic papers. Notably, Chahid et al. showcased the development and implementation of Q-learning algorithms tailored for optimizing feeding control policies, both in caged fish growth rate environments and tank-based fish growth rate settings with optimal temperature profiles. The simulation outcomes affirm the algorithms’ ability to achieve precise trajectory tracking while conserving feed. Similarly, Kuroki et al. presented the conception of an automatic feeding system for Sillago japonica using reinforcement learning, underscoring the growing influence of this technology [55]. Palaiokostas furthers this narrative by revealing the efficacy of machine learning models in anticipating disease resistance among aquaculture species [56].
While the prowess of reinforcement learning is evident, a broader scope of research accentuates the value of varied approaches in disease control. Chinabut et al. comprehensively detailed multiple strategies, spanning from antibiotics and probiotics to biocontrol, bioremediation, and vaccination [57]. Villena introduced the potential of in vitro methods in pioneering safe therapeutants and enhancing disease control methodologies [58]. Park gave an overview of Korean aquaculture practices, emphasizing chemotherapeutics, herbal immunostimulants, and vaccination [59]. In the same scope, Assefa et al. offered a comprehensive review of epidemiological methods, spotlighting vaccination and biosecurity measures as key components in combating infectious diseases [60].
Furthermore, Schryver et al. emphasized the importance of integrating ecological theory into disease management, proposing microbial management strategies for disease prevention in larviculture [61]. Pérez-Sánchez et al. presented a balanced overview of the triumphs and hurdles associated with biological methods for bacterial disease prevention in aquaculture. Xiong et al. delved into the utility of probiotics in shaping desired gut microbiota compositions in shrimp, identifying the larval stage as an opportune period for introducing specific probiotics into the rearing water [62]. In closing, Subasinghe accentuated the critical role vaccination plays in ensuring aquatic animal health in aquaculture settings [63].
The research studies generally demonstrate a multi-pronged approach to disease control in aquaculture, which combines cutting-edge technologies, ecological understanding, and biological interventions.

2.4. Integration of GIS and Reinforcement Learning

The integration of Geographic Information Systems (GIS) and Reinforcement Learning (RL) represents a promising avenue in the realm of disease transmission prediction and strategy formulation. GIS, fundamentally an assembly of tools designed to collate, analyze, and illustrate spatial or geographical data, provides a comprehensive landscape of disease spread patterns and affected regions. Meanwhile, RL, nested within the broader domain of machine learning, operates on a framework where agents are trained to make informed decisions by processing the consequences in terms of rewards or penalties. When the fields of GIS and RL converge, they create a robust and sophisticated mechanism that can be used to understand current disease spread, anticipate future transmission trajectories, and empower stakeholders to make proactive and informed interventions
Several notable benefits arise from this integration:
  • Precision Enhancement: The integration of GIS’s spatial data with RL’s decision-making abilities has the potential to improve disease spread predictions by providing a more complex understanding of the factors that influence disease transmission.
  • Optimal Resource Deployment: RL is adept at optimizing the distribution of resources based on the data at hand. For instance, by analyzing spatial data, agents can determine the best locations for establishing vaccination centers.
  • Agile Decision Processes: One of the strengths of reinforcement learning (RL) is its ability to make adaptive decisions. This means that RL agents can learn and improve their strategies over time, even as situations change. For example, if there is a sudden spike in cases in a particular region, an RL agent could recalibrate its strategy to focus more on that region.
  • Cost-Efficiency: The combination of GIS’s spatial intelligence and RL’s optimization abilities can lead to more cost-effective strategies for health infrastructure planning. For example, by determining the most strategic locations for hospitals and clinics, we can save money on transportation, staffing, and other costs.
Several studies in the academic area underscore the potential of GIS and RL in disease control. For example, Palaniyandi [64] and Bouwmeester et al. [65] showed that GIS can be used to monitor and predict the spread of diseases, and to identify critical intervention areas for disease control. Li et al. proposed an evolutionary ensemble model based on a Genetic Algorithm (GA) to predict the transmission trend of infectious diseases, which utilizes the strong global optimization capability of GA for tuning the ensemble structure [66]. Sadilek et al. proposed a probabilistic model that uses social networks to predict disease spread [67]. Chae et al. used deep learning algorithms and big data to predict infectious diseases, which can help eliminate reporting delays in existing surveillance systems [68]. Peng et al. described the design and development of an AIDS Transmission Management and Spatial Decision Support System based on GIS, which allows for the prediction of future trends of the AIDS epidemic [69].
More specifically, in the context of aquaculture, a plethora of studies have shown the potential of using GIS and related technologies to improve aquaculture practices. For example, Navas et al. showed that combining GIS with neuro-fuzzy modeling can be used to classify areas particularly vulnerable to pollutants, which can inform policy decisions for aquaculture site selection [70]. Martínez demonstrated that GIS-based models can be effective for helping the decision-making process of site selection in aquaculture planning and management [71]. Kriaridou et al. suggested that genomic selection can improve disease resistance in aquaculture breeding programs, and that this can be achieved at lower SNP densities and at lower cost [72]. Villanueva et al. showed that genome-wide evaluation of breeding values offers new opportunities for using variation within families when dealing with dichotomous traits such as resistance to disease, and that the threshold liability model used fits very well with the BayesB model of GWE [73].
The use of GIS and machine learning techniques to study disease transmission in aquaculture has been well-documented. However, the application of reinforcement learning (RL) and GIS to this field is still in its early stages. Khiem et al. used GIS and machine learning to predict the occurrence of three serious diseases of shrimp in Vietnam, and found that the neural network model outperformed other methods in predicting infection [74]. Greed developed a stochastic metapopulation model of infectious disease in aquaculture, and found that concentration of production into separate areas successfully slows the spread of simulated disease [75]. Silva et al. used GIS to predict fish yield in Sri Lankan reservoirs, and found that highly significant relationships existed between fish yield and different land-use patterns [76]. Finally, Zambrano et al. studied the use of machine learning techniques to model the dynamics of water quality variables in fish farming, and found that random forests can be used to forecast dissolved oxygen, pond temperature, pH, ammonia, and ammonium when the water pond variables are measured only twice per day [77].
The collaborative potential between GIS and RL stands out prominently in current research trends, offering promising avenues for enhancing predictive modeling and devising nuanced disease control strategies. However, within the research community, there is a noticeable lack of substantial studies or applications that integrate reinforcement learning with GIS, particularly within aquaculture. Moreover, the research landscape remains rather limited in terms of publications applying Q-learning and multi-armed bandit techniques to aquaculture. Such limitations extend to predicting disease spread in animals and, more broadly, to applications in agriculture and livestock farming.

2.5. Case Studies and Applications in Aquaculture

The intersection of Geographic Information Systems (GIS) and reinforcement learning (RL) offers a promising avenue for enhancing disease control strategies in aquaculture. The application of such integrative methodologies, however, remains in nascent stages, with only a few studies delving deep into this interdisciplinary approach.
In this study [78], the researchers explore the use of GIS-based AHP and data-driven intelligent machine learning algorithms for irrigation water quality prediction in an agricultural-mine district within the Lower Benue Trough, Nigeria. The study identified the most influential water quality parameters and reclassified the six water quality criteria into four major hazard groups. The results of the irrigation water quality suitability assessment for the Okurumutet-Iyamitet agricultural-mine district showed that the water quality was generally unsuitable for irrigation due to high levels of salinity, sodium adsorption ratio, and residual sodium carbonate. The study highlights the importance of resilient and sustainable water management in agriculture and provides insights into effective water quality prediction and management strategies.
In the study by [79], a combination of machine learning, remote sensing, and GIS data was applied to enhance the mapping of landslide susceptibility in the Abbottabad district of Pakistan. This area is particularly vulnerable to landslides due to factors such as heavy monsoon rainfall, varied terrain, earthquake events, and human activities. The incorporation of machine learning models increased the accuracy of the susceptibility maps, offering essential data for disaster management teams, researchers, and government officials. These maps can guide land use planning efforts, aiming to minimize potential human and economic losses. The research stands out by addressing a specific need for improved landslide mapping in the Abbottabad region and underscores the benefits of using modern technological methods in predicting and managing landslide risks.
In the study by [80], a novel framework is introduced which seamlessly merges IoT, ML, and GIS with geospatial methodologies to ensure the sustainable management of aquaculture resources. This approach prominently features the utilization of intelligent sensors for meticulous data gathering, coupled with cloud-supported analysis, paving the way for informed decision-making regarding feeding and monitoring fish health. Such integration with geospatial methods notably enhances the precision in pinpointing ideal fish habitats, culminating in a comprehensive database tailored for aquaculture resource management. Furthermore, the research elaborates on the synergy of GIS and GPS in sculpting a web-based platform for the fisheries domain. The outcomes of this research underscore the framework’s prowess in discerning potential fishing areas and resource management, thereby shedding light on the transformative power of technological and geospatial advancements in bolstering the fishing sector while championing environmental sustainability.

2.6. Research Gap and Motivation

The prediction of disease propagation within aquaculture systems stands as a central issue that directly affects the industry’s economic and ecological viability. Historically, conventional models provided overarching insights into long-term disease patterns but operated under limited data scopes [81]. Alternatively, while machine learning techniques excel in generating detailed short-term forecasts, they require a comprehensive historical data set and often present challenges in model interpretability [82].
Innovative academic approaches underscore the promise of integrating Geographic Information Systems (GIS) with reinforcement learning as a means to navigate these challenges [83]. Specifically, this amalgamation aims to utilize GIS’s capacity for spatial data analysis alongside the adaptive decision-making faculties of reinforcement learning. As a result, this integrative model is anticipated not only to capture a macroscopic view of disease trajectories but also to discern nuanced, region-specific variations [84].
The dynamic complexities of aquaculture, shaped by factors ranging from water quality fluctuations to interspecies dynamics and human interventions, warrant predictive models that are both comprehensive and adaptive. By fusing the spatial intelligence of GIS with the feedback-driven mechanisms of reinforcement learning, the integrated approach offers the potential for a refined, holistic strategy to address disease transmission intricacies in aquaculture [85].
The aquaculture sector, pivotal in meeting global seafood needs, faces significant challenges from disease outbreaks. The evolving nature of disease patterns in aquaculture demands a more responsive and adaptive prediction mechanism. GIS emerges as a solution, offering insights into spatial patterns of diseases, influenced by factors such as water currents and temperature variations. However, while GIS offers an advanced understanding of spatial dynamics, real-time decision-making in disease management requires a more dynamic approach.
Integrating reinforcement learning (RL) with GIS offers notable advantages. RL, a machine learning subset, optimizes decisions using feedback from new data. By combining GIS’s spatial capabilities with RL’s decision-making mechanisms, we aim to enhance our predictive accuracy and response efficiency in managing aquaculture diseases.

2.7. State-of-the-Art Techniques for Prediction of Disease Transmission in Aquaculture

Effective management of disease in aquaculture involves both acting on current issues and planning ahead to prevent future problems, highlighting the importance of using advanced technologies and methods. The presented table (Table 2) represents various innovative techniques that are essential in today’s aquaculture disease detection and control. For instance, diagnostic technologies are pivotal, providing crucial information by precisely identifying bacterial strains in fish, while also ensuring that the specifics of the bacterial strain are thoroughly understood, as seen in reference [86]. Techniques like remote consultation systems and real-time PCR have also shown their worth by improving how we share vital information and rapidly and accurately detecting aquatic diseases, respectively [87,88]. The continued use and advancement of these technologies and diagnostic approaches will be crucial to maintaining the health, sustainability, and productivity of species within aquaculture, underlining the necessity of intertwining technology and practical approaches to safeguard our aquatic environments and organisms.
In the multifaceted arena of aquaculture, ensuring the health and vitality of aquatic species is paramount, thereby accentuating the significance of proficient disease management and control. A nuanced approach to this endeavor involves leveraging technological innovations, particularly embedding machine learning (ML) methodologies, to detect, predict, and ultimately mitigate disease transmission and proliferation within aquaculture environments. ML, characterized by its various techniques, including image-based learning, support vector machines, and intricate deep learning models, serves as a formidable tool, facilitating meticulous monitoring and the management of aquatic health and environmental parameters. This technological amalgamation into aquaculture not only enhances the capability to identify potential outbreaks but also institutes a proactive stance toward disease containment and prevention.
A discerning exploration into specific applications of ML in aquaculture presents its impactful utility and transformative potential in this sector. For instance, machine learning, with its predictive capabilities, has been utilized to forecast disease outbreaks within rainbow trout farms, an application that intricately associates pathogenic bacterial profiles with corresponding water quality parameters [90]. This methodology not only enables a proactive approach towards disease management but also embeds a systemic resilience within the operational framework of aquaculture enterprises. Furthermore, image-based ML has been adeptly employed to identify and discern infected fish, providing an avenue for early intervention and thereby constraining potential disease spread within aquaculture populations.
Moreover, ML’s applicability extends to the vital domain of water quality prediction within aquaculture, a critical determinant of the overall health and productivity of aquatic species [91,92]. Ensuring the optimization of water quality parameters intrinsically mitigates stress and reduces susceptibility to diseases among aquaculture species, thereby exemplifying ML’s crucial role in enhancing and safeguarding aquatic environments and organisms. As research and development in ML applications within aquaculture continue to evolve, it is imperative that these technological advancements are cohesively integrated with biological understanding, paving the way toward sustainable, productive, and resilient aquaculture ecosystems.
The table presented in Table 3 offers a comprehensive comparison of diverse methods employed in aquatic analysis and disease transmission prediction. These methods, spanning from clustering approaches to advanced machine learning classifiers, have been tailored and fine-tuned to cater to specific applications in the aquatic realm. For instance, the clustering method, such as the improved K-means, has been utilized for water quality analysis and has been reported to exhibit high accuracy and stability. On the other hand, the Gabor filter K-means approach is more aligned with discerning fish patterns. The threshold methods, based on contour techniques, and carp classifications, each cater to specific problem domains within the broader aquatic context. Each of these methodologies comes with its own set of advantages and limitations. For instance, while the SVM for carp classification exhibits high precision on smaller datasets, it is susceptible to overfitting in the presence of noise.
One standout observation from the table is the performance and applicability of various algorithms on specific aquatic datasets. Deep learning frameworks, especially Convolutional Neural Networks (CNN), have been harnessed for underwater fish classification, boasting advanced feature extraction capabilities. However, they are computationally intensive. Another pivotal point is the introduction of our approach, leveraging the Reinforcement Learning (RL) Multi-Armed Bandit algorithm for understanding ecosystem dynamics. Notably, our method has recorded an impressive 96.81% in terms of accuracy, underlining its effectiveness. This approach is especially tailored for dynamic, non-stationary environments, albeit requiring a delicate balance between exploration and exploitation. The broad spectrum of methods and their nuances depicted in the table showcases the depth and breadth of computational techniques in the field of aquatic analysis and predictions.

3. Methology

The Methodology Section 3 details our research approach, focusing on the integration of GIS with reinforcement learning to predict disease transmission in aquaculture. The Materials and Methods Section 3.1 outlines the primary resources and processes used in our study. In the Reinforcement Learning Section 3.2, we discuss key strategies such as Markov Decision Processes Section 3.2.1, Q-Learning Section 3.2.2, and Multi-Armed Bandit Section 3.2.3. The Description of Tools Section 3.3 introduces the GIS and other software tools we utilized. Finally, the Implementation Description Section 3.6 explains the practical steps taken to merge GIS with reinforcement learning, aiming for an effective solution for disease spread prediction in aquaculture.

3.1. Materials and Methods

As presented in the introduction, pathogen transmission is directly linked to the rearing environment. The visualization of epidemiological and of environmental data selected and embedded into the Expert System contributes to the upgrade of the intelligent system making decision-making a friend regarding the spread and management of diseases both at the unit level as well as at the level of regions (POA), but also of wider geographical units.
In particular, the aim of the present paper is to develop a GIS in which weather forecasting will help predict the speeds of water currents in a network of fish farming units. These units are represented as subgraphs (disjoint each other) with nodes substations with specific spatial coordinates and edges with specific water currents whose direction is always constant, just changing their speed. This rate would be very important in order to predict virus transmissions affecting fish within these substations. That is, the VIRUS is transferred through these EDGES but each time at a different speed. The developed Geographical Information System is adapted to the needs of Greek fish farming [102] in which spatiotemporal dispersion is taken into account for diseases. The basic infrastructure of our system is shown in Figure 1.
In the proposed approach, in order for diffusion in fishery data to be handled, we should create clusters that contain fishery bots of subgroups. The whole area is partitioned into a set of clusters and each cluster contains more than three fishery farms. In order to find correlations among clusters, we embed extract information in each cluster. The clustered regions contain their region (e.g., KEF for Kefalonia, etc.). Finally, we aim to predict the effect of diffusion and based on the regions we created lines that represent the diffusion phenomenon.
In order to proceed with the system we need workable solutions. We proceeded according to three solutions:
  • Solution 1 (Additive barrier): We can use a barrier that will control the diffusion phenomenon of the form:
    ( average cost value in the neighboring cells ) × ( distance between cell centers )
    This type of barrier is the simplest one.
  • Solution 2 (Cumulative barrier): We can use another type of barrier that is of the form:
    ( difference between cost values in the neighboring cells ) + ( distance between cell centers )
    This type of barrier will create a more realistic scheme.
  • Solution 3 (Flow barrier):
    Indicator × ( cost values in the to neighboring cell cost values in the from neighboring cell ) + ( distance between cell centers )
    This type of barrier will also show the direction of the phenomenon.
In the prototype built, we plan to follow the above solutions and built upon them our final solution.
  • Solution 1: Will work as it should but in case there is land between or there are regions that overlap (KEF and ECH) this solution might fail.
  • Solution 2: This will be a distance-based solution counting the distance of the cluster centers.
  • Solution 3: It appears to be the more realistic as per diffusion properties and the direction of the wind/water, etc. The predictive scheme will inform more accurately the nearby fishery spots of potential dangers.
It would be beneficial to implement three specific scenarios, with a focused examination of a distinct region, such as KEF or ECH. The aim is to simulate a case of disease spread, initiating from a region with a high concentration of fish farming. This exercise is undertaken to understand whether and how such a scenario would influence other regions.
As a part of this study, the speed of disease transmission is to be considered. Is it constant, or does it diminish relative to the distance from the source? This aspect is crucial to the comprehensive understanding of disease propagation dynamics. In our approach, we utilize solution 3 in order to make a real-world use case which takes into account various factors and not only distance.
Moreover, the spread of disease is of major importance in aquaculture regions for various reasons:
  • Economic Impacts: The spread of diseases can cause significant losses in fish production, as it affects the growth, health, and survival of fish. This could lead to lower income for aquaculturists and increase production costs.
  • Veterinary Impacts: The spread of diseases in aquaculture requires the intervention of veterinarians and the use of drugs for the treatment and control of diseases, increasing costs and risks to public health due to antibiotic resistance.
  • Environmental Impacts: Diseased fish can affect the quality of water and the ecosystem around aquacultures, as they excrete pathogens and other waste that can affect the environment and other marine life. This could cause water pollution, loss of biodiversity, and changes in the structure of ecosystems.
  • Social Impacts: The spread of diseases in aquaculture can lead to job losses and affect the local economy, as fish farmers are significant producers and employers in many coastal communities.
In our study, we concentrated on understanding how diseases propagate from specific clusters, gauging their subsequent influence on neighboring regions. Through simulations facilitated by the ArcGIS platform, our objective was to discern whether the disease dissemination was consistent or if external factors, such as distance between clusters, played a role. After meticulously integrating pertinent data points, clusters, regions, and directional pathways, we transitioned this framework to a cloud-based platform. This strategic move not only enhanced system functionality but also facilitated data input by registered users.
In the subsequent stages of our research, we diversified our focus to encompass additional fish species that are cultivated in Greece, aiming to provide a multifaceted tool for disease management across a broader spectrum of species. Additionally, to refine our system’s forecasting capabilities, we contemplated the integration of analytical models that would consider variables like prevailing climatic conditions and water current patterns.

3.2. Reinforcement Learning

Reinforcement learning (RL) is an optimization framework. A problem can be considered a reinforcement learning problem if it can be framed in the following way: Given an environment in which an agent can take actions, receiving a reward for each action, and a policy that maximizes the expected cumulative reward that the agent will obtain by acting in the environment. The preceding framework is illustrated in Figure 2.
The most fundamental mathematical structure to represent a reinforcement learning environment is to model the problem using Markov Decision Processes.

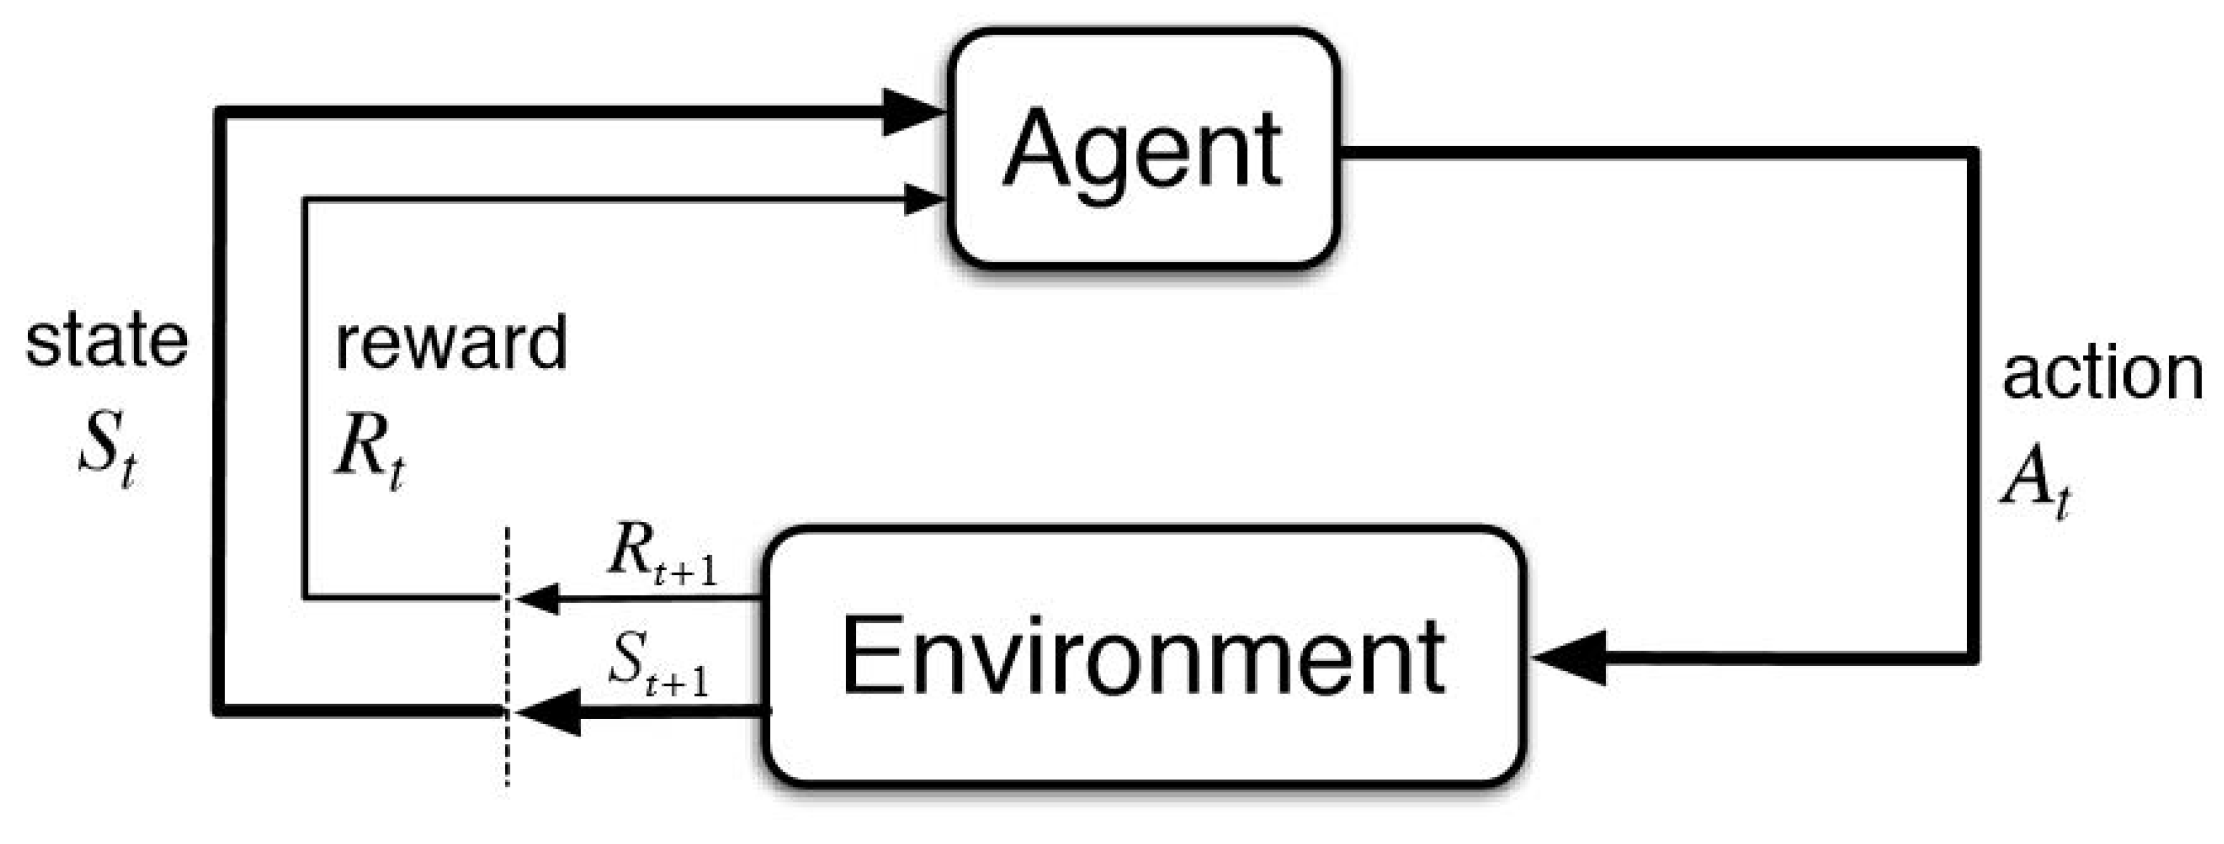
3.2.1. Markov Decision Processes

In [103], the authors introduced the concept of a Markov Decision Process (MDP) as an extension of the famous mathematical construct of Markov Chains.
Markov Decision Processes are a widely-used model for sequential decision-making and control problems. In particular, an MDP is defined by a 5-tuple in the form of ( S , A , P ( · · , · ) , R ( · , · · · ) , γ ) where:
  • S is the set of states s S of the underlying Markov chain, where s t S represents the state of the environment at time t.
  • A is the set of actions a A which are the transition labels between states of the underlying Markov chain. A t A is the subset of available actions in state s t at time t. If a state s t has no available actions, it is said to be a terminal state. Terminal states are equivalent to absorbing states in the Markov Chain literature.
  • P s t + 1 s t , a t [ 0 , 1 ] , where s t , s t + 1 S , a t A . P is the transition probability function (The function P is also known in the literature as the transition probability kernel, the transition kernel, or the dynamics of the environment in model-based contexts. The word kernel is a heavily overloaded mathematical term that refers to a function that maps a series of inputs to value in R ). It expresses a distribution over states. It defines the probability of transitioning to state s t + 1 from state s t after performing action a t . Thus, P : S × A × S [ 0 , 1 ] . Given a state s t and an action a t at time t, we can find the next state s t + 1 by sampling from the distribution s t + 1 P s t , a t . The environment is said to be deterministic if P s t , a t is deterministic.
  • Reward Function: R ( s t , a t , s t + 1 ) R , where s t , s t + 1 S and a t A . The reward function R represents the immediate reward the agent obtains after performing action a t in state s t and transitioning to state s t + 1 . The real-valued reward, denoted as r t , is typically in the range [ 1 , 1 ] . The reward function R : S × A × S R . If the environment is deterministic, the reward function can be expressed as R ( s t , a t ) .
  • γ [ 0 , 1 ] is the discount factor, which represents the rate of importance between immediate and future rewards. If γ = 0 the agent cares only about the immediate reward, if γ = 1 all rewards r t are taken into account. γ is often used as a variance reduction method, and aids proofs in infinitely running environments [104].
There are also two optional parameters to an MDP which are sometimes omitted in the literature. These are the initial state distribution ρ 0 and the time horizon T:
  • ρ 0 s 0 [ 0 , 1 ] , where s 0 S , is the initial state distribution, representing the probability of starting an episode on a given state s 0 . It is from this distribution that the initial state is sampled from s 0 ρ 0 .
  • T N , represents the finite time horizon, the number of steps over which the agent will try to maximize its cumulative reward. It serves a similar purpose to the more common discount factor γ in that they are both used as a variance-bias trade-off and are needed for proofs of convergence over infinitely long-running tasks.

3.2.2. Q-Learning

Q-learning, a model-free reinforcement learning algorithm, is invaluable in the context of disease transmission prediction. By leveraging the Q-function, we quantify the expected cumulative reward for each state-action pair, providing a means to capture the dynamics of disease spread. The Q-function is defined as:
Q ( s t , a t ) = R ( s t , a t ) + γ max a A Q ( s t + 1 , a )
The Q-learning algorithm, adapted to predict disease transmission, can be outlined as follows:
  • Initialize the Q-table with zeros for all state-action pairs.
  • For each episode in the environment:
    • Begin from an initial state.
    • Until a terminal state is reached:
      Choose an action based on an epsilon-greedy policy from the current Q-table.
      Execute the action and observe the reward and new state.
      Update the Q-value using the equation:
      Q ( s t , a t ) ( 1 α ) Q ( s t , a t ) + α R ( s t , a t ) + γ max a A Q ( s t + 1 , a )
      where α denotes the learning rate.
Given the spatial nature of disease transmission in aquaculture and specific attributes of fishery spots, we introduce F as a set of influential factors. These could encompass water quality, density of fishes, and proximity to other potentially infected regions. By integrating these factors into the Q-function, we achieve a more nuanced understanding of the disease transmission pathways:
Q ( s t , a t ) = R ( s t , a t ) + γ max a A Q ( s t + 1 , a ) + f F ω f · f ( s t )
where:
  • ω f denotes the weight associated with factor f, representing its influence on the Q-function.
  • f ( s t ) symbolizes the value of factor f within state s t .

3.2.3. Multi-Armed Bandit

The Multi-Armed Bandit (MAB) approach, a simplified form of reinforcement learning, requires an agent to select among various strategies (the bandit’s arms) to optimize a reward over time. Each arm, in the context of disease spread in fisheries and aquaculture, could represent a distinct preventive strategy.
The goal is to determine the arm (strategy) that minimizes disease transmission, striking a balance between the exploration of new strategies and the exploitation of known effective ones. The action-value function for MAB is:
Q t ( a ) = sum of rewards when arm a was chosen up to time t number of times arm a was chosen up to time t
The MAB problem for disease transmission prediction can be tackled using the Upper Confidence Bound (UCB) algorithm:
  • Initialize each action’s value to zero.
  • For every time t = 1 , 2 , 3 , , n :
    • Choose an action a t that maximizes:
      Q t ( a ) + c ln t n t ( a )
      where n t ( a ) represents the number of times action a was chosen up to time t, and c determines the exploration extent.
    • Obtain the reward for the selected action, subsequently updating the action–value estimate.
In the MAB approach, each arm could potentially signify a preventive strategy catered to specific fishery spot parameters. Here, the reward is influenced by the spatial effectiveness of a chosen strategy, given the unique conditions of the aquaculture environment.
To capture this, we introduce a spatial influence function, I:
R ( a , s ) = r ( a , s ) × I ( s )
where:
  • R ( a , s ) is the modified reward for choosing action a at spot s.
  • r ( a , s ) is the basic reward of action a at spot s.
  • I ( s ) embodies the spatial influence at spot s.
Subsequently, the action–value function for the MAB is:
Q t ( a , s ) = sum of rewards R ( a , s ) when arm a was chosen up to time t at spot s number of times arm a was chosen up to time t at spot s
For choosing the most optimal action at a particular fishery spot using the UCB algorithm:
a t = argmax a A Q t ( a , s ) + c ln t n t ( a , s )
where:
  • n t ( a , s ) stands for the number of times action a was chosen up to time t at fishery spot s.
In this context, the reward could inversely correlate with disease occurrences, meaning strategies that effectively prevent disease obtain higher rewards. Such a method ensures dynamic adaptation to evolving environmental conditions and disease dynamics.

3.3. Description of Tools

The code constitutes a simulation program for the spread of a disease across farms, utilizing the geographic fields in ArcGIS. The simulation commences from the user, who must specify the initial disease appearance points at several farms. The program utilizes farm coordinates to compute distances between them and determine which farms have been infected by the disease. Libraries such as arcpy and numpy are employed to carry out the simulation [105].
More specifically, the arcpy library provides the necessary tools for interacting with geographic data within ArcGIS [106,107,108,109,110,111]. The primary functions provided by the library include reading and writing data, executing spatial analyses, creating maps, and representing data. On the other hand, the numpy library is employed for the execution of scientific computational analyses.
Typically, computational environments such as Jupyter Notebook, Spyder, or other Integrated Development Environments (IDEs) like PyCharm are used for conducting scientific computational analyses. The libraries used depend on the purpose of the scientific analysis, but generally include NumPy and Pandas for data processing, Matplotlib and Seaborn for data visualization, Scikit-learn for data analysis, and Keras and TensorFlow for training neural networks.
In the code under analysis, some additional Python libraries are also employed.
  • The operation begins with the employment of the arcpy library from Esri. This comprehensive library, packed with a multitude of functions and tools tailored for geographical data processing within the ArcGIS setting, serves as the indispensable groundwork for the intricate spatial data handling needed in the study.
  • For addressing certain computational hurdles, such as measuring distances between farms, the study leans on the haversine library. The use of this library is pivotal in conducting spatial processing and analysis. In addition, the random library is utilized for the creation of random values, an essential factor in simulating the inherent randomness found in natural phenomena.
  • For a variety of mathematical computations, such as extracting square roots or calculating logarithms, the Python math library is used. This fundamental library enhances the project’s efficiency by providing pre-built functions for common mathematical operations.
  • The study incorporates the use of the matplotlib library for graphically presenting data. Due to its comprehensive nature and capacity to generate a broad selection of premium visuals and charts, it significantly enhances the effective conveyance of research findings.
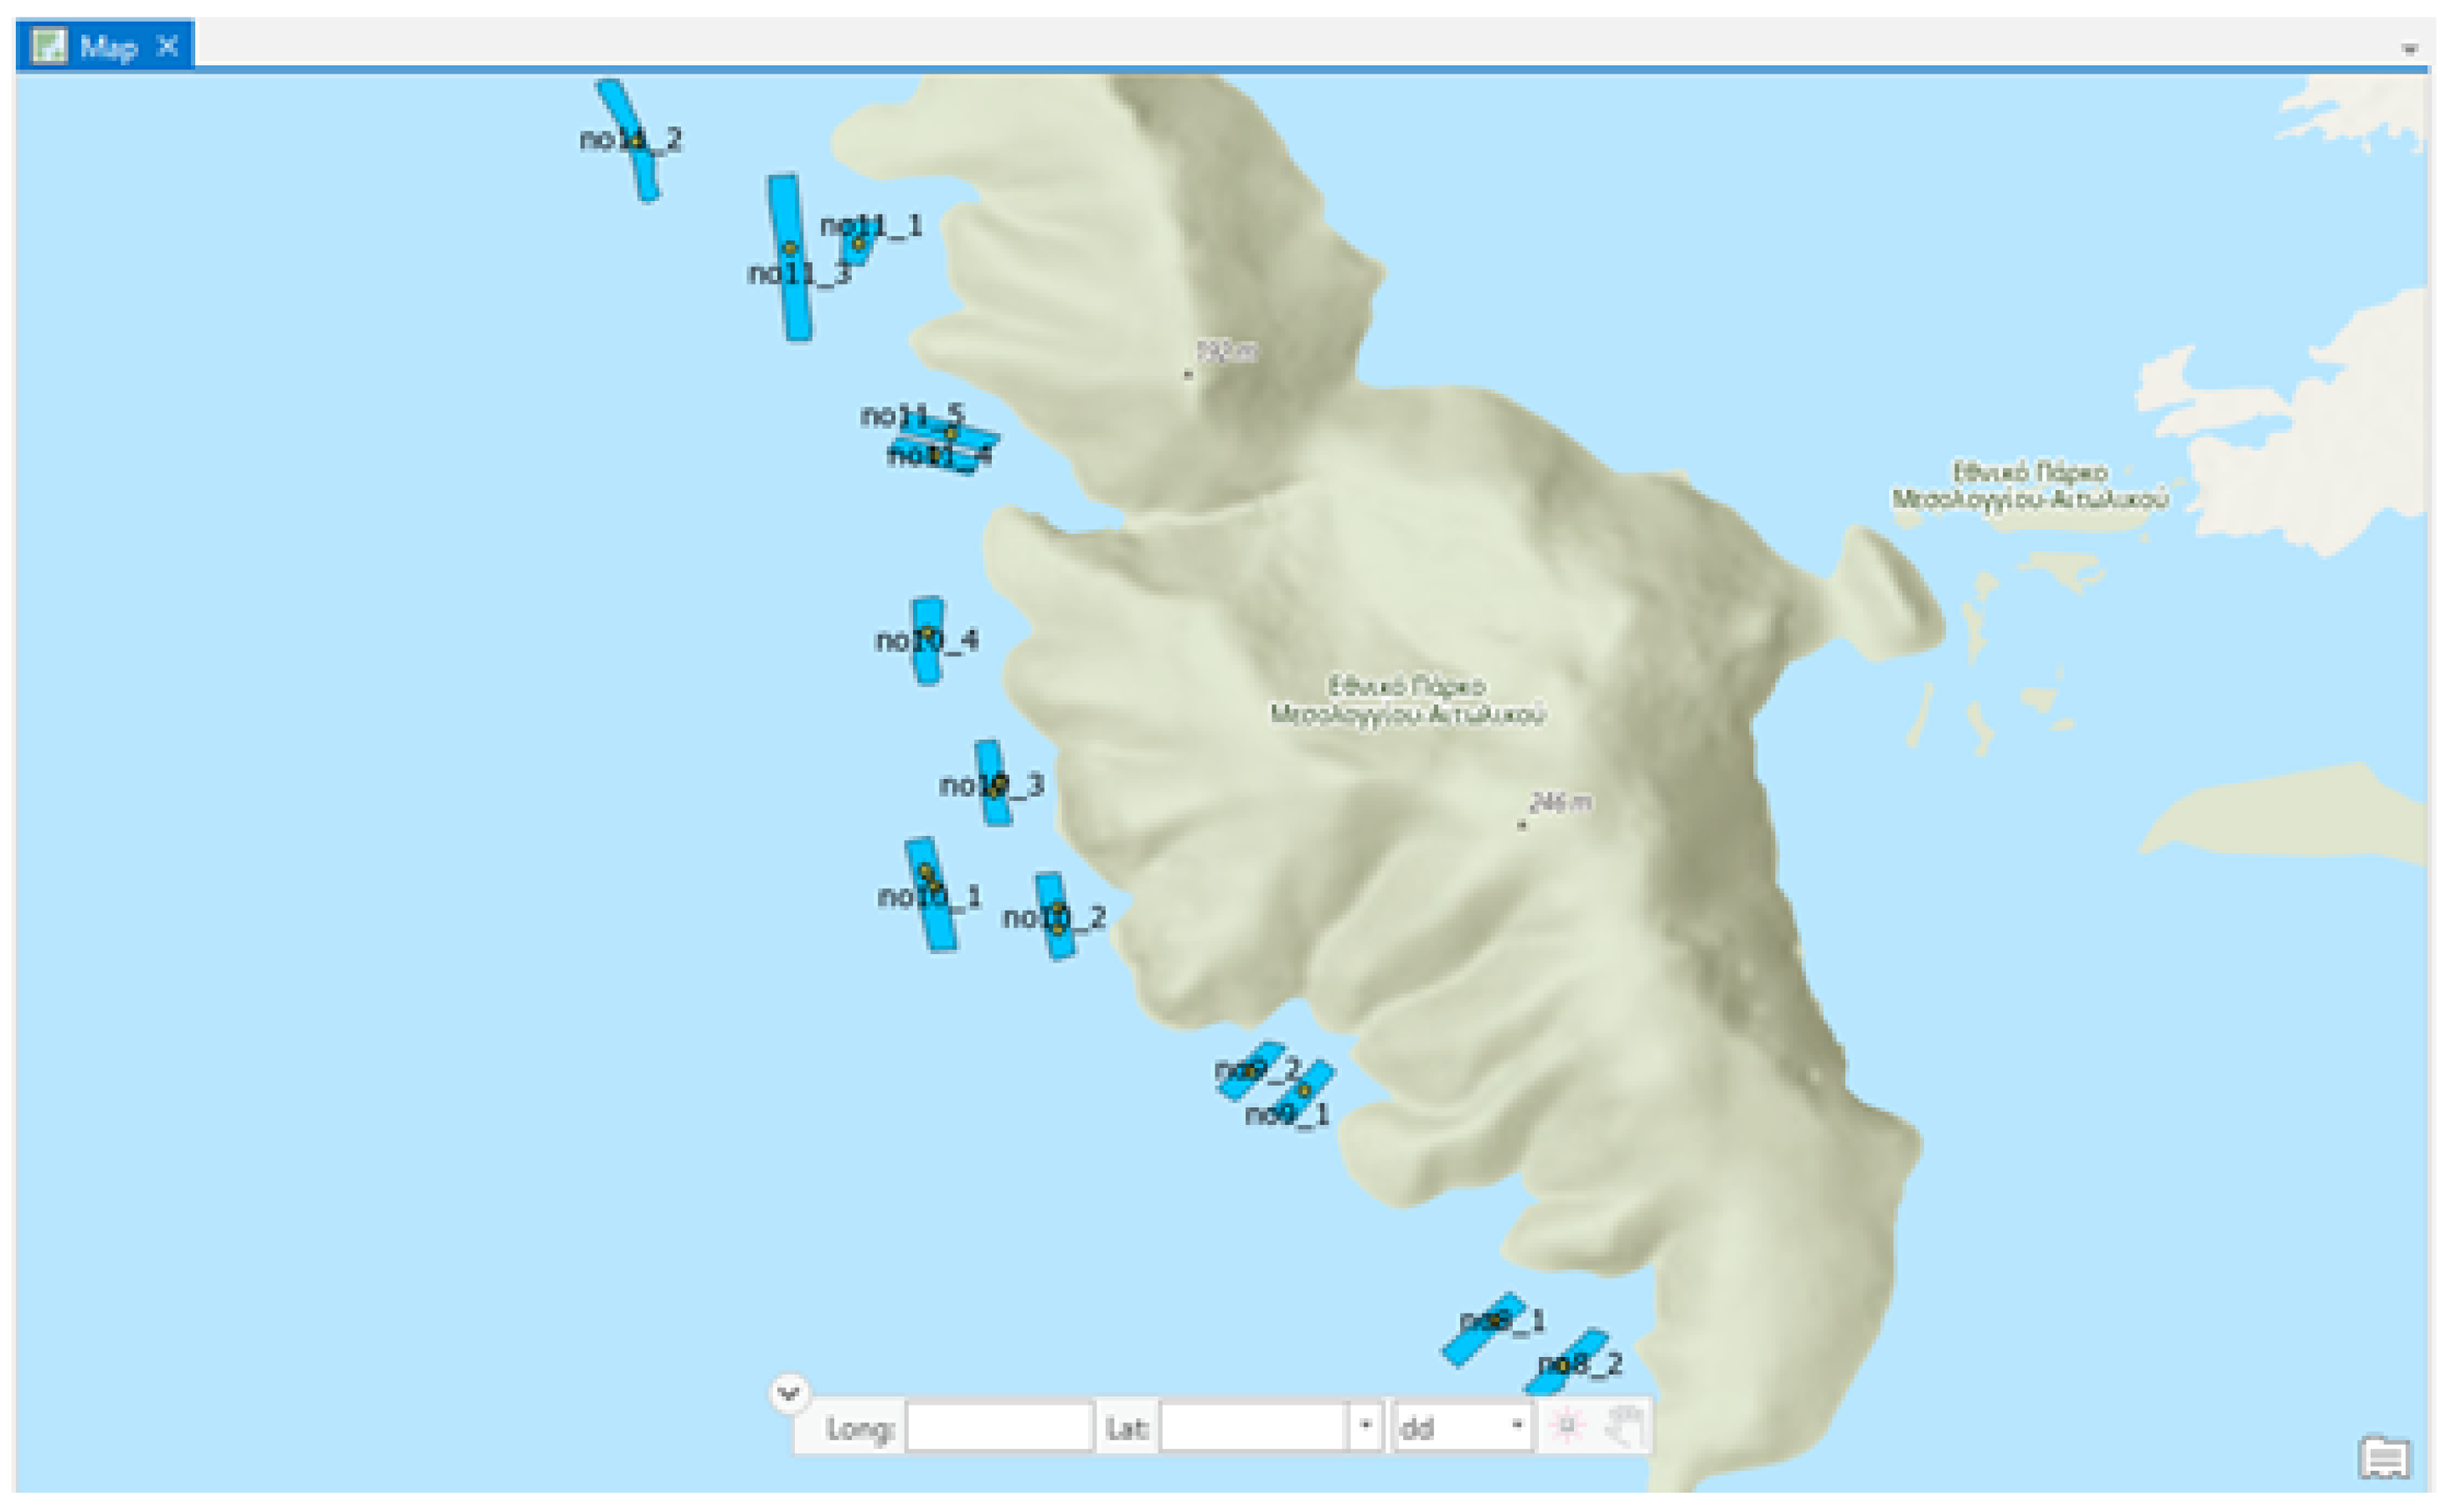
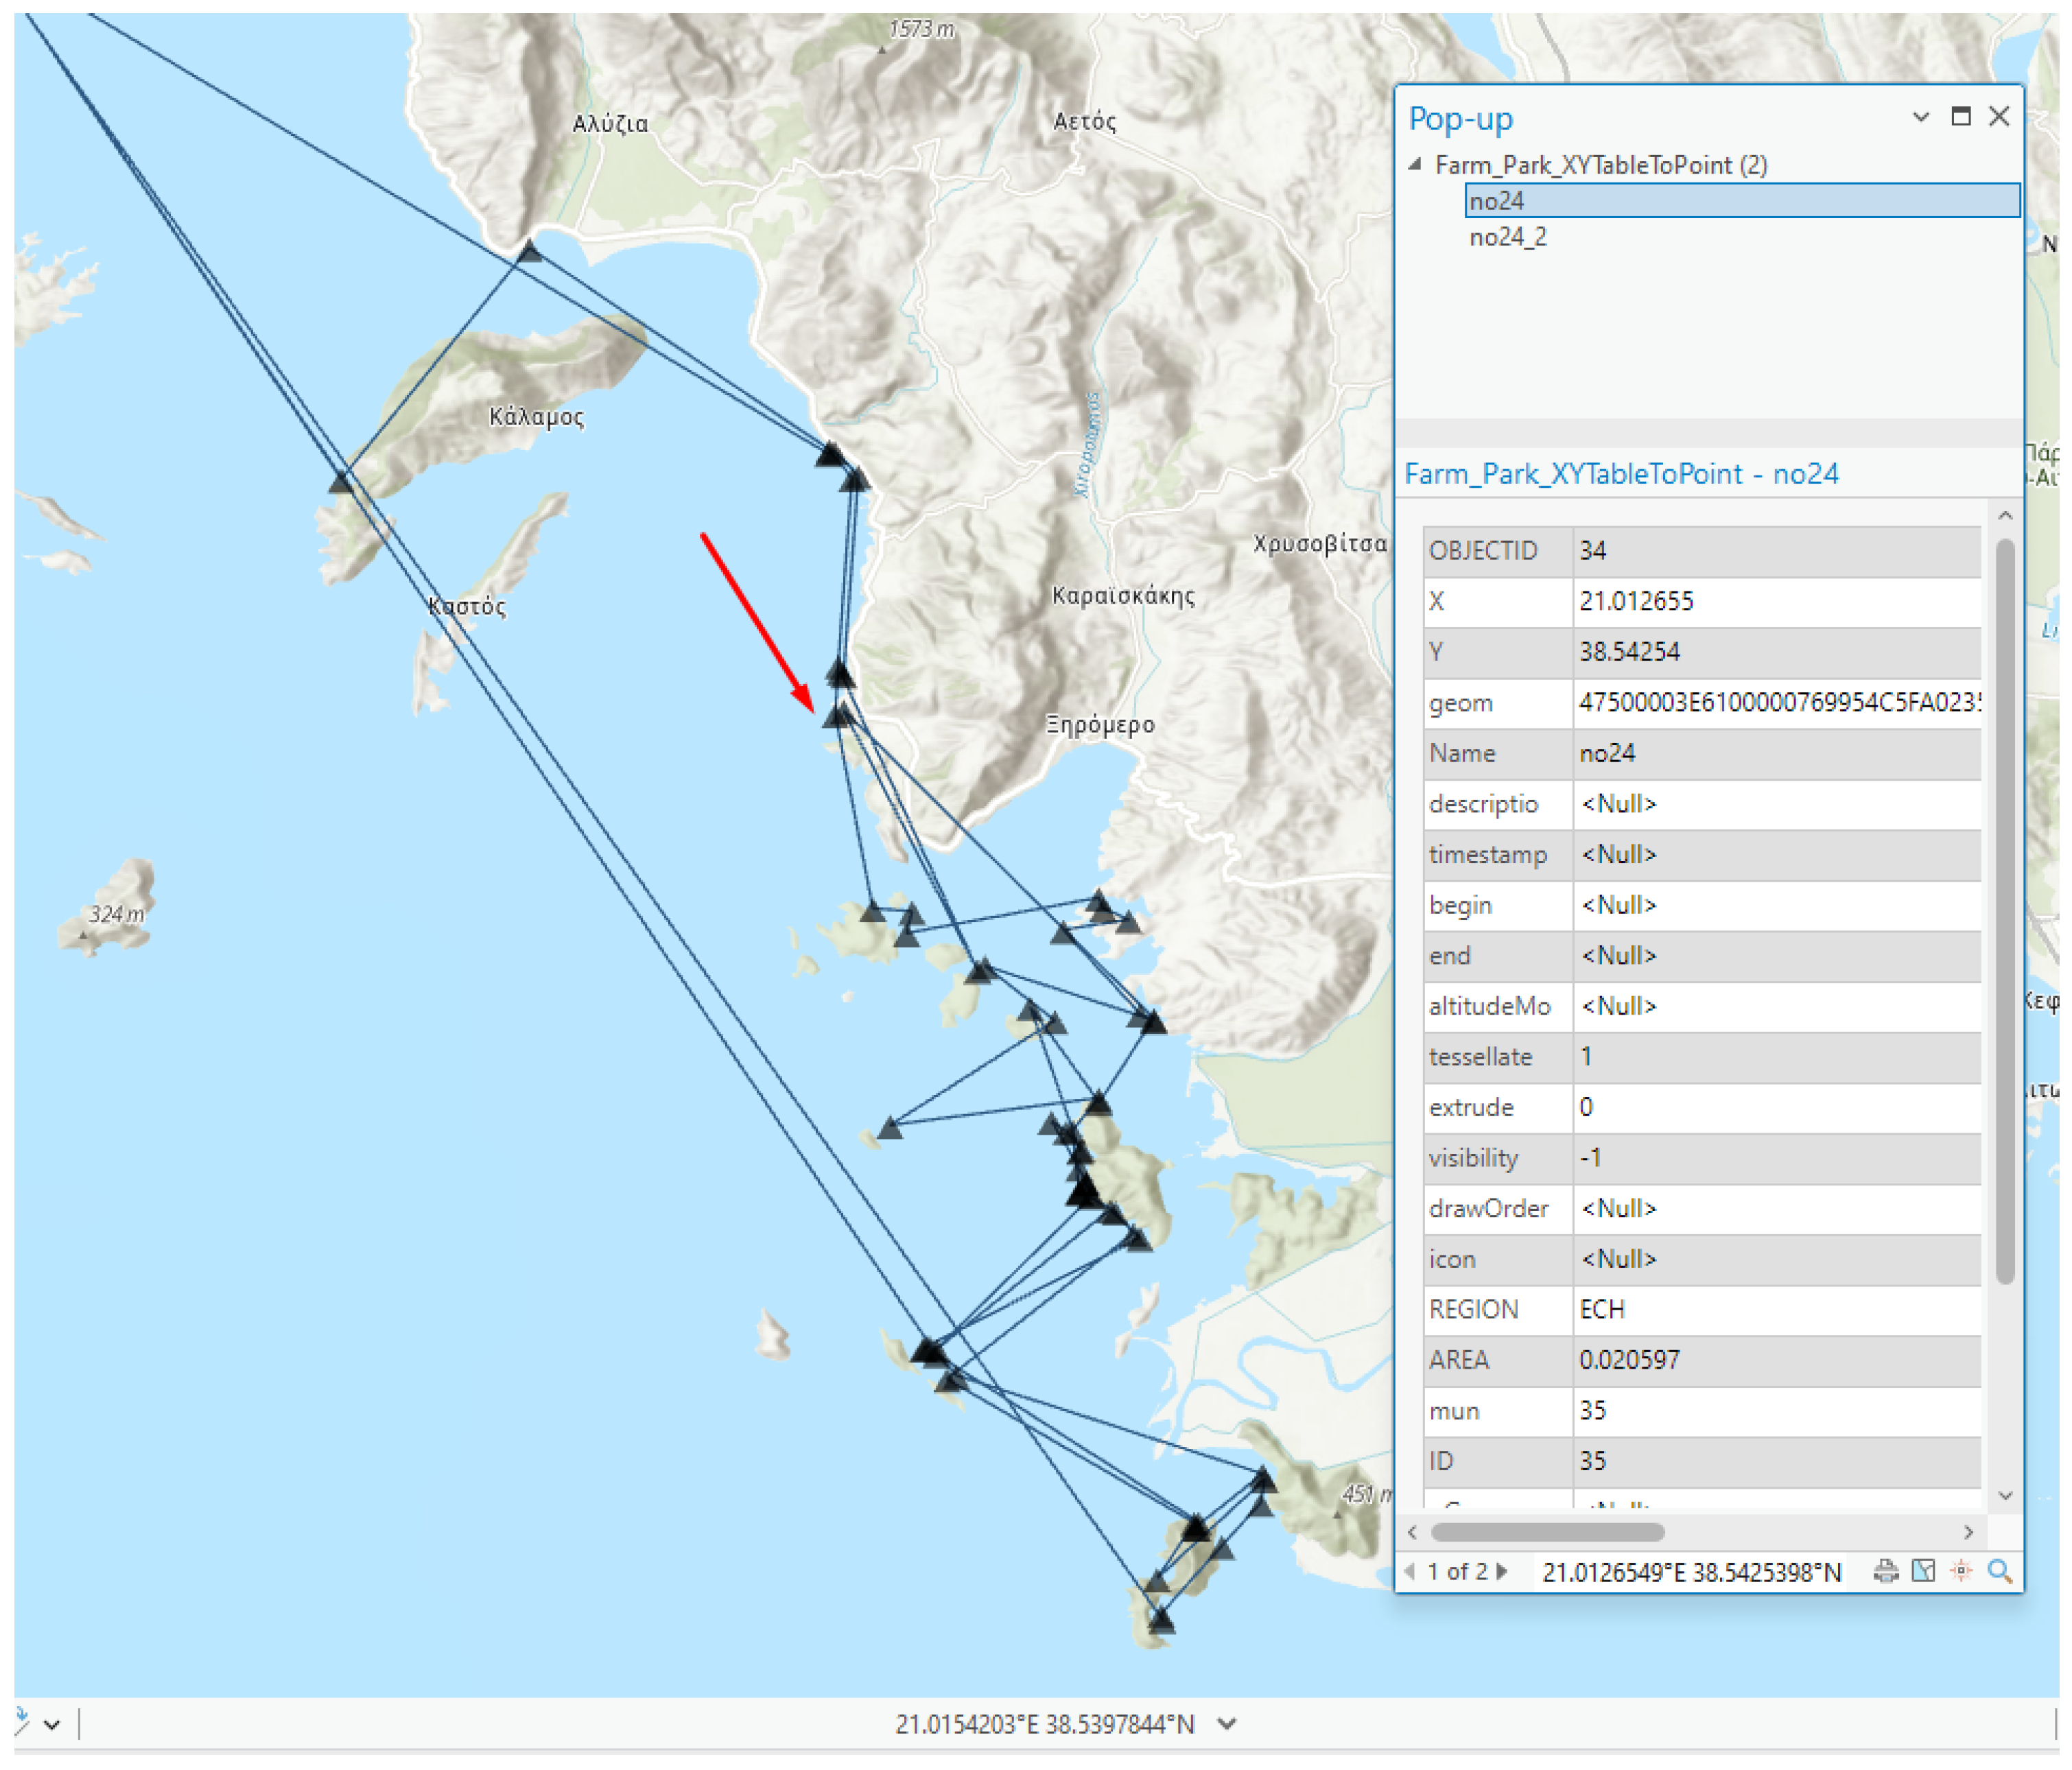
  • Additionally, the study’s utilization of ArcGIS extends beyond the arcpy library. Different feature classes within ArcGIS, including those that symbolize farms, infected farms, and certain geographical coordinates, are each leveraged to fulfill distinct roles within the research. For instance, the feature class representing farms is crucial for calculating inter-farm distances, the infected farm feature class is important for maintaining key information about the location of diseased farms, and the coordinate feature class plays a pivotal role in creating accurate and informative maps.
  • Lastly, the Pandas library is heavily relied upon for the generation, modification, and scrutiny of data. This dynamic and flexible library offers a multitude of functionalities for dealing with Python datasets. To augment the analytical capabilities of Pandas, the study again utilizes Matplotlib, this time to produce informative graphs from the analyzed data.
  • In addition, other Python libraries such as NumPy and DateTime are utilized for their respective capabilities. NumPy offers advanced mathematical operations on large, multi-dimensional arrays and matrices, while DateTime is used to manipulate dates, an essential aspect of data in a temporal context.
  • Extending the arcpy library’s capabilities, geoprocessing tasks such as creating and manipulating feature classes and rasters are efficiently carried out. These capabilities allow for a more nuanced and sophisticated exploration of the geographic data involved.
Furthermore, ArcGIS Pro capabilities, including the management and analysis of sensor data, offer unprecedented opportunities for researchers to explore and analyze rich, real-time data from a variety of sensors. These sensors, which provide invaluable data on the environment and climate conditions, enable researchers to deepen their understanding of the complex interactions between the environment, human activity, and disease transmission. This, in turn, allows for more informed and effective decision-making processes in response to virological outbreaks.

3.4. Incorporating Clustering with Reinforcement Learning

Incorporating the concepts of additive barrier, cumulative barrier, and flow barrier into a Multi-Armed Bandit (MAB) scenario, especially within the context of spatial disease transmission in aquaculture, offers a strategy for optimizing decision-making under uncertainty. The additive barrier can be construed as a critical threshold that restricts or penalizes the actions of the agent in the MAB, which might increase the risk of disease transmission.
For example, in the exploration–exploitation dilemma, the agent may consider the additive barrier as a determining factor for selecting arms (strategies) that mitigate immediate risks, perhaps by minimizing movement between different aquatic regions. On the other hand, the cumulative barrier can be implemented as a long-term constraint within the MAB to manage the cumulative risk or impact of selected actions over numerous iterations, ensuring that the overall strategies adopted do not amass unsafe levels of exposure or vulnerability to the fish populations in the given spots.
The flow barrier could be particularly pivotal in a spatially-considered MAB scenario, influencing the decision-making process by dictating the pathways of possible disease spread through water currents or fish migrations. Thus, an arm of the MAB that represents a strategy involving altering the fish movement or managing artificial current flows might dynamically adjust to minimize the risk of widespread disease transmission.
In essence, by judiciously integrating these barriers within the MAB framework, we developed a sophisticated, adaptive, and preventative disease management strategy in aquaculture that is capable of dynamically responding to spatial and temporal variations in risk, thereby safeguarding both the aquatic life and the associated economic activities from the detrimental impacts of widespread disease outbreaks. This method ensures that decision-making not only considers the immediate rewards but also navigates through the spatial constraints and barriers that impact the longer-term consequences of those actions in the defined space.

3.5. Model Parameters, Training, and Testing

The exploration and optimization of a model’s parameters represent a critical element in its predictive capabilities and overall performance. In this research, the scrutiny extended towards understanding and calibrating model parameters goes beyond mere numerical adjustments. It permeates into discerning how each parameter potentially interacts with the dynamics of spatial disease transmission in aquaculture and fishery spots, thereby determining the trajectory and magnitude of disease spread within the system.
The model parameters, such as learning rate, action–value function estimates, and exploration–exploitation trade-off in the context of reinforcement learning, are meticulously tuned. They are adapted not merely based on generalized presumptions or previous literature but are empirically derived through iterative simulations and evaluations, ensuring they are aptly suited to the unique and specific dynamics of our focused environment.
The establishment of a reliable and valid model inherently relies on a rigorous approach to the division of data into training and testing sets, often referred to as the train/test split. The training data serve as the foundation upon which the model learns the intrinsic dynamics of spatial disease transmission in aquaculture by identifying patterns and establishing predictive pathways within the data.
For the training phase, we used a substantial portion of the data (70%) allocated to the training phase. Testing, conversely, utilizes the remaining 20% of the data, acting as a previously unseen dataset against which to validate the model’s learned behaviours and predictions. This bifurcation ensures the model’s ability to generalize learned behaviours to new, unexperienced scenarios, and safeguards against overfitting.
In order to affirm the model’s predictive proficiency and reliability across diverse circumstances, a 10-fold cross-validation technique was employed. This method entailed partitioning the data into ten unique subsets, systematically training the model on nine and validating on the one left out, cycling through all folds to meticulously gauge model performance across various training and testing sets. This rigorous approach to validation does more than substantiate the model’s predictive efficacy; it bolsters its real-world applicability and robustness by ensuring its predictive capabilities remain consistent and reliable across different scenarios. Consequently, the model not only emerges as theoretically robust but also demonstrates practical viability in tangible, operational contexts, bridging the gap between theoretical soundness and pragmatic utility.

3.6. Implementation Description

The Python code implemented serves as a simulation of the spread and transmission of a virus among farms and GIS points. This simulation is grounded on an algorithm that monitors the status of farms daily and calculates the number of infected farms.
The steps of the code implementation are as follows:
  • The first step involves defining the variables required for the simulation. These include specifying the workspace, the project file, the feature class of the farms, the virus transmission rate, the search radius for infected neighbors, and the number of initially infected farms, as well as the variables that will be employed in the simulation.
  • Next, the farm information is retrieved. In this step, the necessary details for each farm are defined, such as its name, coordinates, and whether it is infected or not.
  • The initially infected farm is determined. In this step, the user is asked to input the name of the initially infected farm. Upon the entry of this name, the code checks if it exists in the farm list and assigns the appropriate value to the “chosen_farm” tag, which represents the initially infected farm. If the corresponding farm is not found, the program prints an error message and terminates the execution.
  • The program then sets the initially infected farm as infected, with an infection day equal to 1, and enters the corresponding values into the “chosen_farm” tag. Additionally, the program identifies the initially infected farm with the number that has been set in the “initial_infected_farm_index” variable.
  • Subsequently, the program initiates a virus spread simulation for 14 days. Each day, it checks the state of each farm and calculates the number of its infected neighbors. It then calculates the probability of the virus transmission to an uninfected farm based on the number of its infected neighbors. This probability is calculated as 1 − (1 − transmission_rate) înfected_neighbors, where transmission_rate is the probability of the virus transmission from an infected to an uninfected farm, and infected_neighbors is the number of a farm’s infected neighbors.
    • If this calculated probability is greater than a random number between 0 and 1, the farm is considered infected, and the “infected” variable of the farm is set to True.
    • If a given farm is deemed infected, its “days_infected” variable is set to the current day, and the “infected_day” variable is set to the day that the farm became infected.
    • Depending on the number of newly infected farms each day, the infected farms are stored in a list named “infected_farms_per_day”. Subsequently, a new feature class named “InfectedFarms” is created to store the infected farms per day.
  • To add the infected points to the new feature class, the InsertCursor is utilized. The feature class is opened for the insertion of new records, and the field values for each infected point are added to the appropriate column. For each day, each infected point is examined, and the coordinates, name, and day of infection of the point are added to the feature class.
  • In the final stages, the novel feature class is incorporated into the project, positioning it at the pinnacle of the project’s layer list before saving the project in its entirety.
  • In summary, the code constructs a feature class that comprises infected farms along with their corresponding infection day for every day of the simulation. The simulation employs the distance between farms to compute the likelihood of a farm succumbing to infection via its contaminated neighbors. It then computes the daily count of fresh infections and the total number of infected farms for each simulation day.
  • In essence, the code also constructs a new feature class within the geodatabase file, representing the daily tally of infected farms. It proceeds to input the geographical elements of the infected farms into this feature class. Finally, this new feature class is incorporated into the ArcGIS project document which is then preserved by saving.
These steps contribute to a detailed tracking system that incorporates geographical information, infection status, and time data, thereby providing a comprehensive view of the simulation’s progress and results.

3.7. Computational Complexity

In our implementation of the Multi-Armed Bandit (MAB) model, we had to consider its inherent computational complexity. We designed our MAB algorithm to balance exploration and exploitation, cycling through potential actions to ascertain the most rewarding outcomes. For every iteration, we had to evaluate each arm, leading to a foundational complexity of O ( t × k ) for t time-steps and k arms. Nevertheless, we adopted optimization strategies to minimize the number of arms assessed at every stage. While the base computational overhead is linear with respect to the number of arms and iterations, real-world complexity in our model can vary based on factors such as the type of reward distributions, the set convergence criteria, and the specific MAB variant we have incorporated. Ultimately, we ensured that our MAB model remains computationally efficient for a range of scenarios, but we also recognize the need to continuously adapt its structure in response to the evolving scale of problems and available computational power.

4. Results

For the empirical evaluation of the model, the simulation is run by selecting a random point (for example, cage No. 24), and the infected areas are printed in three scenarios. Specifically, the following scenarios are examined:
  • The best-case scenario, which includes low transmission rates, a short timeframe for spread, and a small radius of transmission.
  • The average scenario, encompasses moderate transmission rates, an average timeframe for spread, and an average radius of transmission.
  • The worst-case scenario, entailing maximum transmission rates, the longest timeframe for spread, and the largest radius of transmission.
The goal of this methodology is to measure the array of potential outcomes and grasp how different factors guide the disease’s spread. The evaluation metrics employed for assessing the model’s performance are listed below:
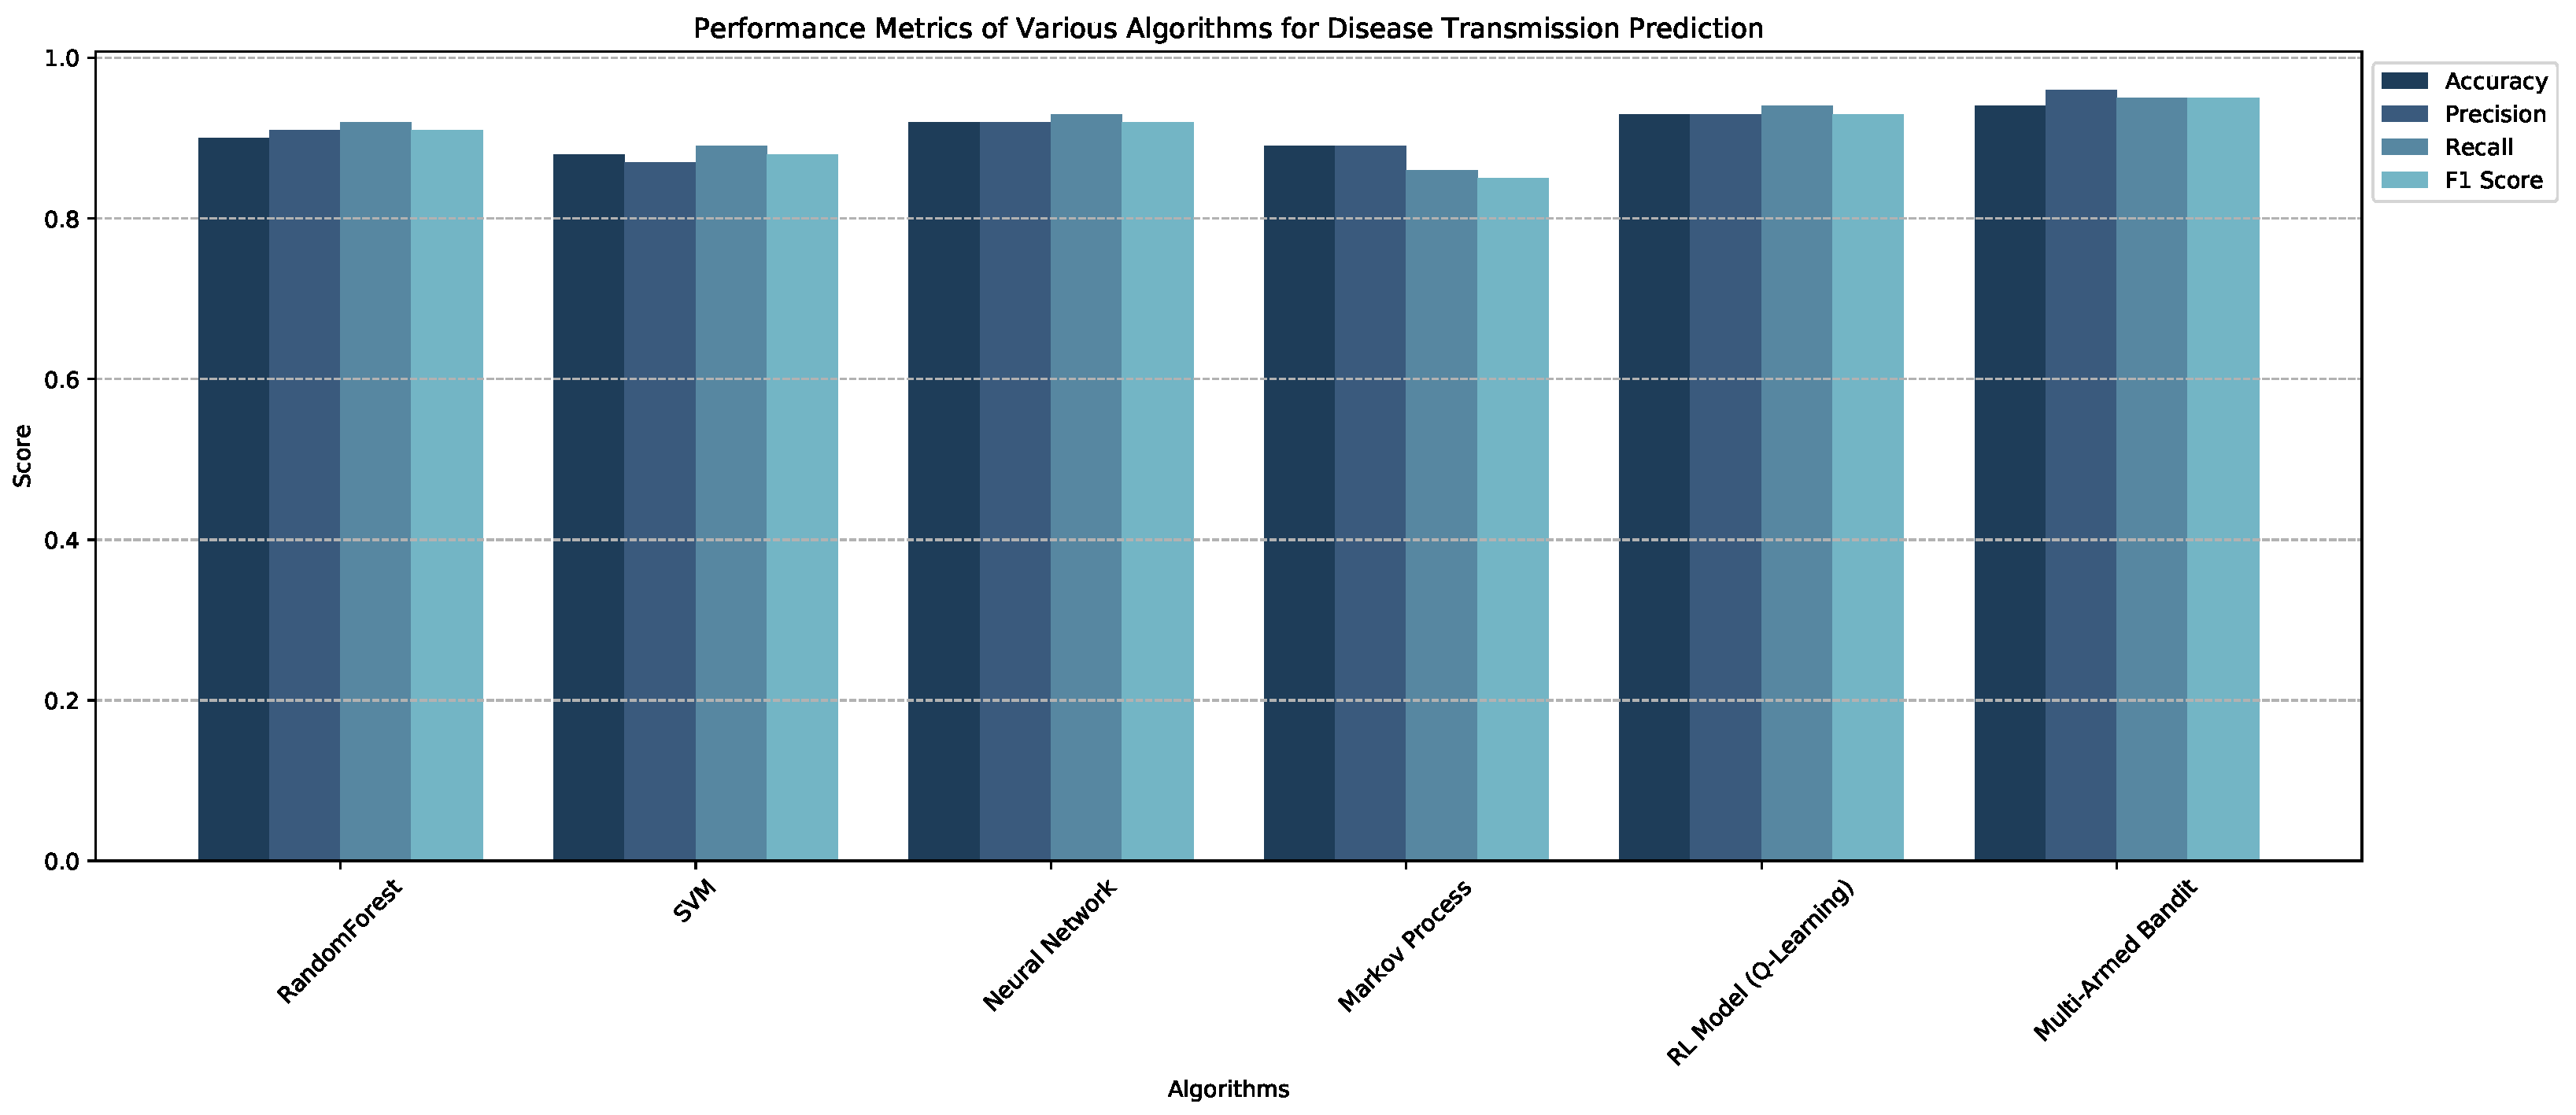
  • Accuracy: Measures the proportion of predictions that the model correctly identified.
    Accuracy = Number of correct predictions Total number of predictions
  • Precision: Quantifies the number of true positive predictions in the set of all predicted positives. It is indicative of the reliability of a model when it predicts an instance to be positive.
    Precision = True Positives True Positives + False Positives
  • Recall: Often termed Sensitivity or True Positive Rate, Recall determines the number of true positive predictions in the set of all actual positives. It provides insight into the model’s capability to detect all potential positive instances.
    Recall = True Positives True Positives + False Negatives
  • F1-score: The F1-score is the harmonic mean of Precision and Recall. It offers a balance between Precision and Recall and is particularly valuable when the class distribution is imbalanced.
    F 1 = 2 × Precision × Recall Precision + Recall
However, for the most comprehensive assessment of our model performance, especially in the context of imbalanced datasets, it is paramount to consider all these metrics collectively. Relying exclusively on accuracy can sometimes result in a skewed perception of the efficacy of the model.
As part of our evaluation, we present the results of the proposed RL algorithmic model in Table 4. This table showcases the performance metrics for each model, specifically, their accuracy, precision, recall, and F1-score. We assessed various methods for this evaluation, including Random Forest, Support Vector Machines (SVMs), Neural Networks, the Markov Process, a basic RL model (Q Learning), and our proposed Multi-Armed Bandit approach.
The results are also illustrated in Figure 3, where all methods are accessed and their evaluation metrics are presented.
Under the best-case scenario, the disease is relatively controlled due to the low transmission rate and narrow transmission radius, resulting in a smaller impact area. In the average scenario, the disease extends to a wider region, affecting more locations because of a higher transmission rate and a more extended period. The radius of transmission is a key factor here, allowing for a larger area of potential spread. In the most severe scenario, the disease spreads rapidly and widely due to the high transmission rate, longer duration, and large transmission radius. This situation represents a significant outbreak where the infection rapidly reaches many locations over a wide area.
This analysis is crucial for assessing the model’s stability, understanding the spread patterns of the infection, and planning necessary actions for each scenario.
In Figure 4, the initial point of disease spread is depicted. The point indicated by the red arrow signifies the selected cage of transmission.
Following that, in Figure 5, the best-case scenario is depicted and modeled. As illustrated in the figure, only the neighboring cages of this area are affected, while cages in other zones (such as those in Kefalonia, for example) remain unaffected.
In Figure 6, the average-case scenario is depicted. In this case, as seen, cages in other zones have been influenced as the spread in this scenario is greater and the radius of transmission is also larger.
Figure 7 illustrates the worst-case scenario. As seen in the figure, in this scenario zones that are quite distant are affected, specifically cages in the wider area of Patras as well as the Corinthian Gulf.
Table 5 represents a scenario of the program execution. As seen in the execution, the program calculates the best, average, and worst-case scenarios, and also prints the optimal action (whether neighboring areas should be informed or the fish should be moved higher up).
As we can observe in the best-case scenario, the total number of infected farms is 160, where the optimal action is to notify the neighboring farms that there is an outbreak. In the second scenario, the number increases to 205 and the optimal action is the same with a neutral reward. Lastly, in the worst-case scenario, the outbreak is greater with 689 farms infected, and the optimal action is to pick up fish as there is too much outbreak and will affect all neighboring fishery spots.

5. Discussion

The empirical assessment of our model provides a comprehensive understanding of disease transmission under varying circumstances, as delineated by the best-case, average, and worst-case scenarios. The intrinsic characteristics of these scenarios, ranging from transmission rates to transmission radius, serve as vital factors in determining the extent and magnitude of the disease’s spread. The consequences of these factors are manifest in the contrasting spatial patterns depicted in the figures corresponding to each scenario.
A fundamental observation from the best-case scenario, as portrayed in Figure 5, is the limited spatial spread of the disease. This confinement is attributed to the low transmission rates combined with a shorter timeframe and a smaller transmission radius. Such scenarios are indicative of the potential controlled spread under stringent interventions or in the presence of effective preventive measures. On the other hand, the average scenario (Figure 6) offers insights into a situation that might be seen in a real-world context without any interventions. The escalation in the transmission rate and a wider radius presents a more challenging scenario, with the disease affecting a broader geographical area. Such an understanding is essential for policymakers and health authorities to anticipate and prepare for average disease outbreaks. The worst-case scenario, however, represents a pressing concern. As seen in Figure 7, the rapid and widespread dissemination of the disease is accentuated by the maximum transmission rates, the longest duration for the spread, and the extensive transmission radius. Such situations necessitate immediate and robust response mechanisms, particularly in regions exhibiting similar environmental and contextual factors as the model’s setting.
Turning our attention to the algorithmic assessment, our results (Table 4) suggest that the RL Model, specifically Q-Learning, outperforms other tested algorithms across all metrics, including accuracy, precision, recall, and F1-score. As per the best performance, it appears on our proposed Multi-Armed Bandit approach with 95% accuracy and superior performance across all metrics. Such results reinforce the efficacy of reinforcement learning in modelling and predicting complex processes like disease transmission in aquaculture. Particularly, its adaptive nature and the capability to make decisions based on iterative feedback possibly contribute to its superior performance. However, it is noteworthy that while accuracy was high across all models, relying solely on accuracy, especially in disease modelling, can be misleading. The consequences of false negatives in this context—erroneously predicting an area as disease-free—could be critical. Thus, precision, recall, and F1-score, which provide a more rounded view of performance, should be taken into account. For instance, the high recall value for the RL model suggests its capability to detect most of the positive cases, a crucial aspect in epidemic modelling.
Furthermore, the optimal action printed during program execution implies a crucial actionable insight. Determining whether neighbouring areas should be informed or if preventive measures such as moving the fish higher up are required are immediate actions that can be extracted from the model. Such outputs not only enhance the utility of the model for real-world application but also underscore its role in decision-making processes during outbreaks.

6. Conclusions

Through our research, we have developed an advanced predictive system that models the spread of diseases within aquaculture facilities. The flexibility of our model enables users to simulate various disease spread scenarios from a given origin point, highlighting its practicality. The user-driven input for the outbreak’s starting location and the system’s adeptness at forecasting subsequent points of vulnerability underscore the model’s robustness. With the capacity to process scenarios of simultaneous outbreaks and the variable timeframes for projection, our tool offers a holistic perspective into potential pathways for disease transmission. This predictive prowess facilitates early interventions, thereby safeguarding the aquaculture’s health and vitality.
An explicit achievement of our study is the evident efficacy of the Multi-Armed Bandit (MAB) technique. Although the data indicates its superior performance metrics compared to other methodologies, it is crucial to acknowledge that each algorithm has its own strengths and weaknesses and that the superiority of MAB was context-specific. While our primary focus was aquaculture, the underlying principles of our tool possess potential applicability to other sectors. This adaptability might lead to innovative predictive models that can transform risk management strategies across different industries.

Future Work

Building on the findings and insights from our current study, several avenues of exploration present themselves for the future. A pressing consideration is the integration of buffer techniques, poised to refine our model’s accuracy, especially during high data influxes. Although the MAB technique emerged as a strong contender in our current configuration, the vast expanse of reinforcement learning holds potential alternatives and enhancements. We are keen to explore other advanced RL techniques, such as Proximal Policy Optimization (PPO) or Twin Delayed Deep Deterministic Policy Gradient (TD3), to ascertain if they offer further advantages. Incorporating finer variables influencing disease spread, like farm quality indices, geographical nuances, and proximity factors, will lend more depth to our projections. Our system’s evolution must factor in preventive measures, using simulations to forecast the ripple effects of interventions like vaccinations or quarantines. Recognizing the intricate dance between climatic factors and disease dynamics, weaving in meteorological data will be a pivotal next step. Expanding the data spectrum from historical disease patterns to viral genetic nuances can push our model’s predictive acumen to newer heights.
As the global narrative shifts towards climate change and its interplay with disease patterns, our research could be at the cusp of significant breakthroughs. With the challenges posed by changing environmental patterns, the adaptability and refinement of our model becomes paramount. As we venture into uncharted territories, incorporating buffer techniques, leveraging advanced RL algorithms, and assimilating diverse datasets, our path ahead is both challenging and exhilarating.

Author Contributions

A.K., C.K., S.S., C.M., G.K., I.H., J.A.T. and D.T. conceived of the idea, designed and performed the experiments, analysed the results, drafted the initial manuscript and revised the final manuscript. All authors have read and agreed to the published version of the manuscript.

Funding

This research received no external funding.

Data Availability Statement

The data presented in this study are available on request from the corresponding author.

Acknowledgments

This work is supported by the action “Improving Competitiveness of the Greek Fish Farming through Development of Intelligent Systems for Disease Diagnosis & Treatment Proposal and Relevant Risk Management Supporting Actions (MIS 5067321). EU-Greece Operational Program of Fisheries EPAL 2014-2020”.

Conflicts of Interest

The authors declare no conflict of interest.

References

  1. Zhao, S.; Zhang, S.; Liu, J.; Wang, H.; Zhu, J.; Li, D.; Zhao, R. Application of machine learning in intelligent fish aquaculture: A review. Aquaculture 2021, 540, 736724. [Google Scholar] [CrossRef]
  2. Sun, M.; Yang, X.; Xie, Y. Deep Learning in Aquaculture: A Review. J. Comput. 2020, 31, 294–319. [Google Scholar]
  3. Salama, N.K.; Murray, A.G. A comparison of modelling approaches to assess the transmission of pathogens between Scottish fish farms: The role of hydrodynamics and site biomass. Prev. Vet. Med. 2013, 108, 285–293. [Google Scholar] [CrossRef] [PubMed]
  4. Muniesa, A.; Ruiz-Zarzuela, I.; de Blas, I. Design and implementation of a collaborative epidemiological surveillance system for aquaculture (VECA). Rev. Aquac. 2018, 20, 370–375. [Google Scholar] [CrossRef]
  5. Diserens, N.; Falzon, L.C.; von Siebenthal, B.; Schüpbach-Regula, G.; Wahli, T. Validation of a model for ranking aquaculture facilities for risk-based disease surveillance. Prev. Vet. Med. 2017, 145, 32–40. [Google Scholar] [CrossRef] [PubMed]
  6. Aldrin, M.; Huseby, R.B.; Jansen, P.A. Space-time modelling of the spread of pancreas disease (PD) within and between Norwegian marine salmonid farms. Prev. Vet. Med. 2015, 121, 132–141. [Google Scholar] [CrossRef] [PubMed]
  7. Wan, R.; Zhang, X.; Song, R. Multi-objective model-based reinforcement learning for infectious disease control. In Proceedings of the 27th ACM SIGKDD Conference on Knowledge Discovery & Data Mining, Singapore, 14–18 August 2021; pp. 1634–1644. [Google Scholar]
  8. Haddad, H.; Moulin, B.; Thériault, M. A fully GIS-integrated simulation approach for analyzing the spread of epidemics in urban areas. Sigspatial Spec. 2016, 8, 34–41. [Google Scholar] [CrossRef]
  9. Raissi, M.; Ramezani, N.; Seshaiyer, P. On parameter estimation approaches for predicting disease transmission through optimization, deep learning and statistical inference methods. Lett. Biomath. 2019, 6, 1–26. [Google Scholar] [CrossRef]
  10. Firestone, S.M.; Hayama, Y.; Bradhurst, R.; Yamamoto, T.; Tsutsui, T.; Stevenson, M.A. Reconstructing foot-and-mouth disease outbreaks: A methods comparison of transmission network models. Sci. Rep. 2019, 9, 4809. [Google Scholar] [CrossRef]
  11. Dunstan, P.K.; Bax, N.J.; Dambacher, J.M.; Hayes, K.R.; Hedge, P.T.; Smith, D.C.; Smith, A.D. Using ecologically or biologically significant marine areas (EBSAs) to implement marine spatial planning. Ocean. Coast. Manag. 2016, 121, 116–127. [Google Scholar] [CrossRef]
  12. Peeler, E.J.; Taylor, N.G. The application of epidemiology in aquatic animal health-opportunities and challenges. Vet. Res. 2011, 42, 94. [Google Scholar] [CrossRef]
  13. Murray, A.G.; Peeler, E.J. A framework for understanding the potential for emerging diseases in aquaculture. Prev. Vet. Med. 2005, 67, 223–235. [Google Scholar] [CrossRef] [PubMed]
  14. Georgiadis, M.P.; Gardner, I.A.; Hedrick, R.P. The role of epidemiology in the prevention, diagnosis, and control of infectious diseases of fish. Prev. Vet. Med. 2001, 48, 287–302. [Google Scholar] [CrossRef] [PubMed]
  15. Baud, D.; Qi, X.; Nielsen-Saines, K.; Musso, D.; Pomar, L.; Favre, G. Real estimates of mortality following COVID-19 infection. Lancet Infect. Dis. 2020, 20, 773. [Google Scholar] [CrossRef] [PubMed]
  16. Murray, C.J.; Lopez, A.D. The Global Burden of Disease: A Comprehensive Assessment of Mortality and Disability from Diseases, Injuries, and risk Factors in 1990 and Projected to 2020: Summary; World Health Organization: Geneva, Switzerland, 1996. [Google Scholar]
  17. Bondad-Reantaso, M.G.; Subasinghe, R.P.; Arthur, J.R.; Ogawa, K.; Chinabut, S.; Adlard, R.; Tan, Z.; Shariff, M. Disease and health management in Asian aquaculture. Vet. Parasitol. 2005, 132, 249–272. [Google Scholar] [CrossRef] [PubMed]
  18. Peeler, E.J.; Oidtmann, B.C.; Midtlyng, P.J.; Miossec, L.; Gozlan, R.E. Non-native aquatic animals introductions have driven disease emergence in Europe. Biol. Invasions 2011, 13, 1291–1303. [Google Scholar] [CrossRef]
  19. Alaliyat, S.; Yndestad, H.; Davidsen, P.I. An agent-based approach for predicting patterns of pathogen transmission between aquaculture sites in the Norwegian fjords. Aquaculture 2019, 505, 98–111. [Google Scholar] [CrossRef]
  20. Liao, C.M.; Chang, C.F.; Yeh, C.H.; Chen, S.C.; Chiang, K.C.; Chio, C.P.; Chou, B.Y.H.; Jou, L.J.; Lien, G.W.; Lin, C.M.; et al. Metal stresses affect the population dynamics of disease transmission in aquaculture species. Aquaculture 2006, 257, 321–332. [Google Scholar] [CrossRef]
  21. Stärk, K.D.; Pękala, A.; Muellner, P. Use of molecular and genomic data for disease surveillance in aquaculture: Towards improved evidence for decision making. Prev. Vet. Med. 2019, 167, 190–195. [Google Scholar] [CrossRef]
  22. Pérez-Sánchez, T.; Mora-Sánchez, B.; Balcázar, J.L. Biological approaches for disease control in aquaculture: Advantages, limitations and challenges. Trends Microbiol. 2018, 26, 896–903. [Google Scholar] [CrossRef]
  23. Mugimba, K.K.; Byarugaba, D.K.; Mutoloki, S.; Evensen, Ø.; Munang’andu, H.M. Challenges and solutions to viral diseases of finfish in marine aquaculture. Pathogens 2021, 10, 673. [Google Scholar] [CrossRef] [PubMed]
  24. Sabo-Attwood, T.; Apul, O.G.; Bisesi, J.H., Jr.; Kane, A.S.; Saleh, N.B. Nano-scale applications in aquaculture: Opportunities for improved production and disease control. J. Fish Dis. 2021, 44, 359–370. [Google Scholar] [CrossRef] [PubMed]
  25. Ahmed, M.S.; Aurpa, T.T.; Azad, M.A.K. Fish disease detection using image based machine learning technique in aquaculture. J. King Saud Univ.-Comput. Inf. Sci. 2022, 34, 5170–5182. [Google Scholar] [CrossRef]
  26. Romero, J.F.; Gardner, I.; Price, D.; Halasa, T.; Thakur, K. DTU-DADS-Aqua: A simulation framework for modelling waterborne spread of highly infectious pathogens in marine aquaculture. Transbound. Emerg. Dis. 2022, 69, 2029–2044. [Google Scholar] [CrossRef] [PubMed]
  27. Kumgumpol, H.; Liu, Y.; Pokavanich, T.; Alabia, I.D.; Yin, Z.; Saitoh, S.I.; Tian, Y. Environmental habitat mapping of green mussel: A gis-based approach for sustainable aquaculture in the inner gulf of Thailand. Sustainability 2020, 12, 10643. [Google Scholar] [CrossRef]
  28. Falconer, L.; Middelboe, A.L.; Kaas, H.; Ross, L.G.; Telfer, T.C. Use of geographic information systems for aquaculture and recommendations for development of spatial tools. Rev. Aquac. 2020, 12, 664–677. [Google Scholar] [CrossRef]
  29. Amiri, A.M.; Nadimi, N.; Khalifeh, V.; Shams, M. GIS-based crash hotspot identification: A comparison among mapping clusters and spatial analysis techniques. Int. J. Inj. Control Saf. Promot. 2021, 28, 325–338. [Google Scholar] [CrossRef]
  30. Taetzsch, S.J.; Bertke, A.S.; Gruszynski, K.R. Zoonotic disease transmission associated with feral cats in a metropolitan area: A geospatial analysis. Zoonoses Public Health 2018, 65, 412–419. [Google Scholar] [CrossRef]
  31. McLeod, I.; Pantus, F.; Preston, N. The use of a geographical information system for land-based aquaculture planning. Aquac. Res. 2002, 33, 241–250. [Google Scholar] [CrossRef]
  32. Ross, L.G.; Handisyde, N.; Nimmo, D.C. Spatial decision support in aquaculture: The role of geographical information systems and remote sensing. In New Technologies in Aquaculture; Woodhead Publishing: Sawston, UK, 2009; pp. 707–749. [Google Scholar]
  33. Falconer, L.; Telfer, T.; Pham, K.L.; Ross, L. GIS Technologies for Sustainable Aquaculture. 2018. Available online: https://dspace.stir.ac.uk/handle/1893/25366 (accessed on 12 September 2023).
  34. Nath, S.S.; Bolte, J.P.; Ross, L.G.; Aguilar-Manjarrez, J. Applications of geographical information systems (GIS) for spatial decision support in aquaculture. Aquac. Eng. 2000, 23, 233–278. [Google Scholar] [CrossRef]
  35. Norstrøm, M. Geographical Information System (GIS) as a tool in surveillance and monitoring of animal diseases. Acta Vet. Scand. 2001, 42, S79. [Google Scholar] [CrossRef] [PubMed]
  36. Simms, A. GIS and aquaculture: Assessment of soft-shell clam sites. J. Coast. Conserv. 2002, 8, 35–48. [Google Scholar] [CrossRef]
  37. Kapetsky, J.M.; Aguilar-Manjarrez, J. Geographical Information Systems in aquaculture development and management from 1985 to 2002: An assessment. SIG/Spat. Anal. Fish. Aquat. Sci. 2004, 2, 393–404. [Google Scholar]
  38. Kapetsky, J.M.; Aguilar-Manjarrez, J. Geographic Information Systems, Remote Sensing and Mapping for the Development and Management of Marine Aquaculture (No. 458); Food and Agriculture Organization: Rome, Italy, 2007. [Google Scholar]
  39. Leung, T.L.; Bates, A.E. More rapid and severe disease outbreaks for aquaculture at the tropics: Implications for food security. J. Appl. Ecol. 2013, 50, 215–222. [Google Scholar] [CrossRef]
  40. Saran, S.; Singh, P.; Kumar, V.; Chauhan, P. Review of geospatial technology for infectious disease surveillance: Use case on COVID-19. J. Indian Soc. Remote Sens. 2020, 48, 1121–1138. [Google Scholar] [CrossRef]
  41. Franch-Pardo, I.; Napoletano, B.M.; Rosete-Verges, F.; Billa, L. Spatial analysis and GIS in the study of COVID-19. A review. Sci. Total Environ. 2020, 739, 140033. [Google Scholar] [CrossRef] [PubMed]
  42. Alam, M.M.; Torgo, L.; Bifet, A. A survey on spatio-temporal data analytics systems. ACM Comput. Surv. 2022, 54, 1–38. [Google Scholar] [CrossRef]
  43. Fischer, M.M. (Ed.) Spatial Analytical Perspectives on GIS; Routledge: London, UK, 2019. [Google Scholar]
  44. Song, H.M.; Xu, L.Y. A method of urban ecological risk assessment: Combining the multimedia fugacity model and GIS. Stoch. Environ. Res. Risk Assess. 2011, 25, 713–719. [Google Scholar] [CrossRef]
  45. Khashoggi, B.F.; Murad, A. Issues of healthcare planning and GIS: A review. ISPRS Int. J. Geo-Inf. 2020, 9, 352. [Google Scholar] [CrossRef]
  46. Kanga, S.; Meraj, G.; Sudhanshu Farooq, M.; Nathawat, M.S.; Singh, S.K. Analyzing the risk to COVID-19 infection using remote sensing and GIS. Risk Anal. 2021, 41, 801–813. [Google Scholar] [CrossRef]
  47. Bui, Q.T.; Nguyen, Q.H.; Pham, V.M.; Pham, M.H.; Tran, A.T. Understanding spatial variations of malaria in Vietnam using remotely sensed data integrated into GIS and machine learning classifiers. Geocarto Int. 2019, 34, 1300–1314. [Google Scholar] [CrossRef]
  48. John, S.A. Data integration in a GIS—The question of data quality. In Aslib Proceedings; MCB University Press Ltd.: Bingley, UK, 1993; Volume 45, pp. 109–119. [Google Scholar]
  49. Isaac, N.J.; Jarzyna, M.A.; Keil, P.; Dambly, L.I.; Boersch-Supan, P.H.; Browning, E.; Freeman, S.N.; Golding, N.; Guillera-Arroita, G.; Henrys, P.A.; et al. Data integration for large-scale models of species distributions. Trends Ecol. Evol. 2020, 35, 56–67. [Google Scholar] [CrossRef]
  50. Heberling, J.M.; Miller, J.T.; Noesgaard, D.; Weingart, S.B.; Schigel, D. Data integration enables global biodiversity synthesis. Proc. Natl. Acad. Sci. USA 2021, 118, e2018093118. [Google Scholar] [CrossRef] [PubMed]
  51. Vergara-Solana, F.; Araneda, M.E.; Ponce-Díaz, G. Opportunities for strengthening aquaculture industry through multicriteria decision-making. Rev. Aquac. 2019, 11, 105–118. [Google Scholar] [CrossRef]
  52. Masoudi, M.; Centeri, C.; Jakab, G.; Nel, L.; Mojtahedi, M. GIS-based multi-criteria and multi-objective evaluation for sustainable land-use planning (case study: Qaleh Ganj County, Iran) “landuse planning using mce and mola”. Int. J. Environ. Res. 2021, 15, 457–474. [Google Scholar] [CrossRef]
  53. Villacreses, G.; Martinez-Gomez, J.; Jijon, D.; Cordovez, M. Geolocation of photovoltaic farms using Geographic Information Systems (GIS) with Multiple-criteria decision-making (MCDM) methods: Case of the Ecuadorian energy regulation. Energy Rep. 2022, 8, 3526–3548. [Google Scholar] [CrossRef]
  54. Chahid, A.; N’Doye, I.; Majoris, J.E.; Berumen, M.L.; Laleg-Kirati, T.M. Fish Growth Trajectory Tracking via Reinforcement Learning in Precision Aquaculture. arXiv 2021, arXiv:2103.07251. [Google Scholar]
  55. Kuroki, H.; Ikeoka, H.; Isawa, K. Development of simulator for efficient aquaculture of Sillago japonica using reinforcement learning. In Proceedings of the 2020 International Conference on Image Processing and Robotics (ICIP), Negombo, Sri Lanka, 6–8 March 2020; pp. 1–4. [Google Scholar]
  56. Palaiokostas, C. Predicting for disease resistance in aquaculture species using machine learning models. Aquac. Rep. 2021, 20, 100660. [Google Scholar] [CrossRef]
  57. Chinabut, S.; Puttinaowarat, S. The choice of disease control strategies to secure international market access for aquaculture products. Dev. Biol. 2005, 121, 255–261. [Google Scholar]
  58. Villena, A.J. Applications and needs of fish and shellfish cell culture for disease control in aquaculture. Rev. Fish Biol. Fish. 2003, 13, 111–140. [Google Scholar] [CrossRef]
  59. Park, S.I. Disease control in Korean aquaculture. Fish Pathol. 2009, 44, 19–23. [Google Scholar] [CrossRef]
  60. Assefa, A.; Abunna, F. Maintenance of fish health in aquaculture: Review of epidemiological approaches for prevention and control of infectious disease of fish. Vet. Med. Int. 2018, 2018, 5432497. [Google Scholar] [CrossRef] [PubMed]
  61. De Schryver, P.; Vadstein, O. Ecological theory as a foundation to control pathogenic invasion in aquaculture. ISME J. 2014, 8, 2360–2368. [Google Scholar] [CrossRef] [PubMed]
  62. Xiong, J.; Dai, W.; Li, C. Advances, challenges, and directions in shrimp disease control: The guidelines from an ecological perspective. Appl. Microbiol. Biotechnol. 2016, 100, 6947–6954. [Google Scholar] [CrossRef] [PubMed]
  63. Subasinghe, R. Disease control in aquaculture and the responsible use of veterinary drugs and vaccines: The issues, prospects and challenges. Opt. Méditerr. 2009, 86, 5–11. [Google Scholar]
  64. Palaniyandi, M. The role of remote sensing and GIS for spatial prediction of vector-borne diseases transmission: A systematic review. J. Vector Borne Dis. 2012, 49, 197. [Google Scholar] [PubMed]
  65. Manyong, V.M.; Legg, C.; Mwangi, M.; Nakato, V.; Coyne, D.; Sonder, K.; Bouwmeester, H.; Abele, S. The potential benefits of GIS techniques in disease and pest control: An example based on a regional project in Central Africa. In Proceedings of the IV International Symposium on Banana: International Conference on Banana and Plantain in Africa: Harnessing International Partnerships to Increase Research Impact, Mombasa, Kenya, 5–9 October 2008; pp. 333–340. [Google Scholar]
  66. Li, X.; Yu, Q.; Yang, Y.; Tang, C.; Wang, J. An evolutionary ensemble model based on GA for epidemic transmission prediction. J. Intell. Fuzzy Syst. 2023, 44, 7469–7481. [Google Scholar] [CrossRef]
  67. Sadilek, A.; Kautz, H.; Silenzio, V. Predicting disease transmission from geo-tagged micro-blog data. AAAI Conf. Artif. Intell. 2012, 26, 136–142. [Google Scholar] [CrossRef]
  68. Chae, S.; Kwon, S.; Lee, D. Predicting infectious disease using deep learning and big data. Int. J. Environ. Res. Public Health 2018, 15, 1596. [Google Scholar] [CrossRef]
  69. Peng, S.; Yang, K. Designing and Developing an AIDS Transmission Management and Spatial Decision Support System Based on GIS. J. Softw. 2014, 9, 1969–1975. [Google Scholar] [CrossRef]
  70. Navas, J.M.; Telfer, T.C.; Ross, L.G. Spatial modeling of environmental vulnerability of marine finfish aquaculture using GIS-based neuro-fuzzy techniques. Mar. Pollut. Bull. 2011, 62, 1786–1799. [Google Scholar] [CrossRef] [PubMed]
  71. Perez Martinez, O. GIS Based Models for Optimisation of Marine Cage Aquaculture in Tenerife, Canary Islands. Doctoral Dissertation, University of Stirling, Stirling, UK, 2002. [Google Scholar]
  72. Kriaridou, C.; Tsairidou, S.; Houston, R.D.; Robledo, D. Genomic prediction using low density marker panels in aquaculture: Performance across species, traits, and genotyping platforms. Front. Genet. 2020, 11, 124. [Google Scholar] [CrossRef] [PubMed]
  73. Villanueva, B.; Fernández, J.; García-Cortés, L.A.; Varona, L.; Daetwyler, H.D.; Toro, M.A. Accuracy of genome-wide evaluation for disease resistance in aquaculture breeding programs. J. Anim. Sci. 2011, 89, 3433–3442. [Google Scholar] [CrossRef] [PubMed]
  74. Khiem, N.M.; Takahashi, Y.; Yasuma, H.; Oanh, D.T.H.; Hai, T.N.; Ut, V.N.; Kimura, N. Use of GIS and machine learning to predict disease in shrimp farmed on the east coast of the Mekong Delta, Vietnam. Fish. Sci. 2022, 88, 1–13. [Google Scholar] [CrossRef]
  75. Green, D.M. A strategic model for epidemic control in aquaculture. Prev. Vet. Med. 2010, 94, 119–127. [Google Scholar] [CrossRef] [PubMed]
  76. De Silva, S.S.; Amarasinghe, U.S.; Nissanka, C.; Wijesooriya, W.A.D.D.; Fernando, M.J.J. Use of geographical information systems as a tool for predicting fish yield in tropical reservoirs: Case study on Sri Lankan reservoirs. Fish. Manag. Ecol. 2001, 8, 47–60. [Google Scholar] [CrossRef]
  77. Zambrano, A.F.; Giraldo, L.F.; Quimbayo, J.; Medina, B.; Castillo, E. Machine learning for manually-measured water quality prediction in fish farming. PLoS ONE 2021, 16, e0256380. [Google Scholar] [CrossRef] [PubMed]
  78. Omeka, M.E.; Igwe, O.; Onwuka, O.S.; Nwodo, O.M.; Ugar, S.I.; Undiandeye, P.A.; Anyanwu, I.E. Efficacy of GIS-based AHP and data-driven intelligent machine learning algorithms for irrigation water quality prediction in an agricultural-mine district within the Lower Benue Trough, Nigeria. Environ. Sci. Pollut. Res. 2023, 1–30. [Google Scholar] [CrossRef]
  79. Ullah, I.; Aslam, B.; Shah, S.H.I.A.; Tariq, A.; Qin, S.; Majeed, M.; Havenith, H.B. An integrated approach of machine learning, remote sensing, and GIS data for the landslide susceptibility mapping. Land 2022, 11, 1265. [Google Scholar] [CrossRef]
  80. Kimothi, S.; Thapliyal, A.; Singh, R.; Rashid, M.; Gehlot, A.; Akram, S.V.; Javed, A.R. Comprehensive Database Creation for Potential Fish Zones Using IoT and ML with Assimilation of Geospatial Techniques. Sustainability 2023, 15, 1062. [Google Scholar] [CrossRef]
  81. Bobashev, G.; Segovia-Dominguez, I.; Gel, Y.R.; Rineer, J.; Rhea, S.; Sui, H. Geospatial forecasting of COVID-19 spread and risk of reaching hospital capacity. SIGSPATIAL Spec. 2020, 12, 25–32. [Google Scholar] [CrossRef]
  82. Padmanabhan, R.; Meskin, N.; Khattab, T.; Shraim, M.; Al-Hitmi, M. Reinforcement learning-based decision support system for COVID-19. Biomed. Signal Process. Control 2021, 68, 102676. [Google Scholar] [CrossRef] [PubMed]
  83. Davy, F.B.; Soto, D.; Bhat, B.V.; Umesh, N.R.; Yucel-Gier, G.; Hough, C.A.; Yuan, D.; Infante, R.; Ingram, B.; Phoung, N.T.; et al. Investing in knowledge, communications and training/extension for responsible aquaculture. In Farming the Waters for People and Food; FAO: Phuket, Thailand, 2010; pp. 569–625. [Google Scholar]
  84. Al-Rasyid, M.U.H.; Sukaridhoto, S.; Dzulqornain, M.I.; Rifai, A. Integration of IoT and chatbot for aquaculture with natural language processing. TELKOMNIKA Telecommun. Comput. Electron. Control 2020, 18, 640–648. [Google Scholar]
  85. Gimpel, A.; Stelzenmüller, V.; Töpsch, S.; Galparsoro, I.; Gubbins, M.; Miller, D.; Murillas, A.; Murray, A.G.; Pınarbaş, K.; Roca, G.; et al. A GIS-based tool for an integrated assessment of spatial planning trade-offs with aquaculture. Sci. Total Environ. 2018, 627, 1644–1655. [Google Scholar] [CrossRef] [PubMed]
  86. Martins, A. Implementation and analysis of diagnostic techniques for Mycobacterium spp. and Francisella spp. in granulomatous disease of fish in breeding and wild aquaculture of São Paulo/Brazil. Int. J. Environ. Agric. Res. (IJOEAR) 2021, 7, 35–44. [Google Scholar]
  87. Gui-ping, C. Establishment of Aquatic Disease Remote Consultation System and Its Promoter Action for China Aquaculture Industry Development; Fishery Modernization. 2010. Available online: https://www.semanticscholar.org/paper/Establishment-of-aquatic-disease-remote-system-and-Gui-ping/f115131a915c2971bd5ba602247e5e736e40294a (accessed on 9 October 2023).
  88. Kim, K.-H.; Choi, K.-M.; Kang, G.; Woo, W.-S.; Sohn, M.-Y.; Son, H.-J.; Yun, D.; Kim, D.-H.; Park, C.-I. Development and Validation of a Quantitative Polymerase Chain Reaction Assay for the Detection of Red Sea Bream Iridovirus. Fishes 2022, 7, 236. [Google Scholar] [CrossRef]
  89. Haq, M.A.B.; Durgadevi, K.; Banu, M.N.; Ahamad, A.S.; Tiwary, C.; Srinivasan, M. Detection of White Spot Syndrome Virus (WSSV) in the Pacific White Shrimp Litopenaeus vannamei in Southern India Using PCR, SEM and Histological Techniques. Indian J. Biotechnol. 2015, 14, 369–375. [Google Scholar]
  90. Yilmaz, M.; Çakir, M.; Oral, O.; Oral, M.A.; Arslan, T. Using machine learning technique for disease outbreak prediction in rainbow trout ( Oncorhynchus mykiss ) farms. Aquac. Res. 2022, 53, 6721–6732. [Google Scholar] [CrossRef]
  91. Hong Khai, T.; Abdullah, S.N.H.S.; Hasan, M.K.; Tarmizi, A. Underwater Fish Detection and Counting Using Mask Regional Convolutional Neural Network. Water 2022, 14, 222. [Google Scholar] [CrossRef]
  92. Li, T.; Lu, J.; Wu, J.; Zhang, Z.; Chen, L. Predicting Aquaculture Water Quality Using Machine Learning Approaches. Water 2022, 14, 2836. [Google Scholar] [CrossRef]
  93. Yao, H.; Duan, Q.; Li, D.; Wang, J. An improvedK-means clustering algorithm for fish image segmentation. Math. Comput. Model. 2013, 58, 790–798. [Google Scholar] [CrossRef]
  94. Premana, A.; Wijaya, A.P.; Soeleman, M.A. Image segmentation using Gabor filter and K-means clustering method. In Proceedings of the 2017 International Seminar on Application for Technology of Information and Communication (iSemantic), Semarang, Indonesia, 7–8 October 2017. [Google Scholar] [CrossRef]
  95. Sun, L.; Luo, B.; Liu, T.; Liu, Y.; Wei, Y. Algorithm of Adaptive Fast Clustering for Fish Swarm Color Image Segmentation. IEEE Access 2019, 7, 178753–178762. [Google Scholar] [CrossRef]
  96. Reljin, N.; Slavkovic-Ilic, M.; Tapia, C.; Cihoric, N.; Stankovic, S. Multifractal-based nuclei segmentation in fish images. Biomed. Microdevices 2017, 19, 67. [Google Scholar] [CrossRef] [PubMed]
  97. Qiao, X.; Bao, J.; Zeng, L.; Zou, J.; Li, D. An automatic active contour method for sea cucumber segmentation in natural underwater environments. Comput. Electron. Agric. 2017, 135, 134–142. [Google Scholar] [CrossRef]
  98. Wang, G.; Hwang, J.-N.; Wallace, F.; Rose, C. Multi-Scale Fish Segmentation Refinement and Missing Shape Recovery. IEEE Access 2019, 7, 52836–52845. [Google Scholar] [CrossRef]
  99. Kartika, D.S.Y.; Herumurti, D. Koi fish classification based on HSV color space. In Proceedings of the 2016 International Conference on Information & Communication Technology and Systems (ICTS), Surabaya, Indonesia, 12 October 2016; pp. 96–100. [Google Scholar] [CrossRef]
  100. Rachel, J.J.L.; Varalakshmi, P. Classification of Breeding Fish using Deep Learning from the Captured Video. In Proceedings of the 2019 11th International Conference on Advanced Computing (ICoAC), Chennai, India, 18–20 December 2019; pp. 48–55. [Google Scholar] [CrossRef]
  101. Rachmatullah, M.N.; Supriana, I. Low Resolution Image Fish Classification Using Convolutional Neural Network. In Proceedings of the 2018 5th International Conference on Advanced Informatics: Concept Theory and Applications (ICAICTA), Krabi, Thailand, 14–17 August 2018. [Google Scholar] [CrossRef]
  102. Katselis, G.; Tsolakos, K.; Theodorou, J.A. Mapping of Greek Marine Finfish Farms and Their Potential Impact on the Marine Environment. J. Mar. Sci. Eng. 2022, 10, 286. [Google Scholar] [CrossRef]
  103. Bellman, R.E.; Dreyfus, S.E. Applied Dynamic Programming; Princeton University Press: Princeton, NJ, USA, 2015; Volume 2050. [Google Scholar]
  104. Sutton, R.S.; McAllester, D.; Singh, S.; Mansour, Y. Policy gradient methods for reinforcement learning with function approximation. In Proceedings of the Advances in Neural Information Processing Systems 12 (NIPS 1999), Denver, CO, USA, 29 November–4 December 1999; MIT Press: Cambridge, MA, USA, 1999. [Google Scholar]
  105. Prieto Herráez, D.; Asensio Sevilla, M.I.; Ferragut Canals, L.; Cascón Barbero, J.M.; Morillo Rodríguez, A. A GIS-based fire spread simulator integrating a simplified physical wildland fire model and a wind field model. Int. J. Geogr. Inf. Sci. 2017, 31, 2142–2163. [Google Scholar] [CrossRef]
  106. Zhou, W.; Li, Y.; Hou, J.; Fan, W.; Xu, L.; Xiao, W. Automated cartography of Fisheries Oceanographic atlas using ArcPy based on global time series grid data of marine environment. IOP Conf. Ser. Earth Environ. Sci. 2019, 234, 012023. [Google Scholar] [CrossRef]
  107. Xing, Z.; Guo, W. A new urban space analysis method based on space syntax and geographic information system using multisource data. ISPRS Int. J. Geo-Inf. 2022, 11, 297. [Google Scholar] [CrossRef]
  108. Arslan, J.; Benke, K.K. Progression of geographic atrophy: Epistemic uncertainties affecting mathematical models and machine learning. Transl. Vis. Sci. Technol. 2021, 10, 3. [Google Scholar] [CrossRef]
  109. Devkota, J.U. Statistical analysis of active fire remote sensing data: Examples from South Asia. Environ. Monit. Assess. 2021, 193, 608. [Google Scholar] [CrossRef] [PubMed]
  110. Shao, Y.; Wang, Z.; Feng, Z.; Sun, L.; Yang, X.; Zheng, J.; Ma, T. Assessment of China’s forest fire occurrence with deep learning, geographic information and multisource data. J. For. Res. 2023, 34, 963–976. [Google Scholar] [CrossRef]
  111. Haq, M.A. SMOTEDNN: A novel model for air pollution forecasting and AQI classification. Comput. Mater. Contin. 2022, 71, 1403–1425. [Google Scholar]
Figure 1. The basic infrastructure.
Information 14 00583 g001
Figure 2. Reinforcement learning loop.
Information 14 00583 g002
Figure 3. Graphic representation of results for various methods.
Information 14 00583 g003
Figure 4. Initial point of virus spread.
Information 14 00583 g004
Figure 5. Best-case scenario for disease spread.
Information 14 00583 g005
Figure 6. Average scenario for disease spread.
Information 14 00583 g006
Figure 7. Worst scenario for disease spread.
Information 14 00583 g007
Table 1. Key Aspects in the Role of GIS in Disease Transmission Analysis in Aquaculture.
Key AspectDescriptionReference
Disease Detection and ManagementGIS aids in spotting disease patterns, predicting outbreaks, and devising management strategies. It also helps in understanding the environmental factors influencing disease proliferation.[39]
Spatial AnalysisGIS offers a visual representation of disease spread, streamlining outbreak detection, and monitoring spatial-temporal dynamics of disease transmission.[40,41,42,43]
Risk ManagementGIS is pivotal for marking out risk zones, which in turn helps allocate resources efficiently for disease control and offers predictions under various conditions.[44,45,46]
Data IntegrationGIS has the capability to merge varied datasets like disease, environmental, biological, and geographical data for a rounded analysis.[47,48,49,50]
Strategic Decision-makingUsing GIS, stakeholders can make well-informed decisions for disease control and prevention strategies in aquaculture.[51,52,53]
Table 2. Overview of techniques for predicting disease transmission in aquaculture.
Tec.App.Sp.Adv.Lim.FindingsFut. Apps.Ref.
Diag. Tech.Bacteria detection, characterizationFishHigh specificitySpecial. equipmentBacterial IDEnhanced detect[86]
Remote Consult.Distance info., consultationVariousData sharingTech dependenceDisease mgmt. improve.Aquaculture mgmt. exp.[87]
Real-time PCRRSIV detectionRed Sea BreamHigh specificitySensitivity to inhibitorsVaried sample detectionRoutine screening[88]
Hist. Obs. & SEMWSSV detectionShrimpVisual conf.Time-consumingVirus verif.Pathogenicity db[89]
Table 3. Comparison of various methods in aquatic analysis and disease transmission prediction.
ApplicationMethodsSegment./Class.Findings/Acc.AdvantagesDisadvantagesRef.
Clustering MethodImproved K-meansWater QualityHigh accuracy, stabilitySimple; fastSensitive to initial k, outliers[93]
Clustering MethodGabor filter K-meansFish PatternsHigh-quality segmentationImproved clusteringNot always accurate[94]
Threshold MethodK-nearest neighbors, K-means algorithmImage classificationShortens running timeSimple; robust to certain image contrast and brightness changesDifficult real-time use, many calculations, needs optimal threshold[95,96]
Based on ContourActive contour segmentationAquatic PlantsImproved efficiency, accuracyBetter regional characteristics in small/continuous spaceCan cause excessive segmentation[97,98]
Carp ClassificationSVMCarp Type A94%High precision on small datasetsMay overfit on noisy data[99]
Carp ClassificationNaive BayesCarp Type B96.80%Efficient with large datasetsAssumes feature independence[99]
Carp ClassificationCNN deep learning frameworkCarp Type C89%Effective on image dataRequires substantial training data[99]
Carp ClassificationSVMNon-breeding Fish Class.84.78%Can handle non-linear dataNeeds parameter tuning[99]
Carp ClassificationNaive BayesNon-breeding Fish Class.87%Scalable; good with multi-classMight be too simplistic[100]
Carp ClassificationMLPNon-breeding Fish Class.83.7%Capable of complex representationsRisk of overfitting[100]
Carp ClassificationRandom forestRainbow Trout Class.86.95%Handles missing data wellNot interpretable[100]
Carp ClassificationDecision treeRainbow Trout Class.81.52%Easily visualizedProne to overfitting[100]
Carp ClassificationConvolutional neural networkUnderwater Fish Class.96.51%Advanced feature extractionHigh computational needs[101]
Our approachRL Multiarmed BanditEcosystem Dynamics96.81%Applicable to dynamic, non-stationary environmentsRequires balanced exploration-exploitation-
Table 4. Performance metrics of various algorithmic choices for disease transmission.
No.AlgorithmAccuracyPrecisionRecallF1 Score
1RandomForest0.900.910.920.91
2SVM0.880.870.890.88
3Neural Network0.920.920.930.92
4Markov Process0.890.890.860.85
5RL Model (Q-Learning)0.930.930.940.93
6Multi-Armed Bandit0.960.960.950.95
Table 5. Scenario of program execution for a use-case.
ScenarioNew Infections per DayTotal Infected FarmsOptimal ActionOptimal Reward
Best-case [ 1 , 32 , 94 , 31 , 28 ] 160notify neighbors+1
Average-case [ 1 , 171 , 30 , 1 , 0 ] 205notify neighbors0
Worst-case [ 1 , 663 , 23 , 0 ] 689pick up fish−1
Disclaimer/Publisher’s Note: The statements, opinions and data contained in all publications are solely those of the individual author(s) and contributor(s) and not of MDPI and/or the editor(s). MDPI and/or the editor(s) disclaim responsibility for any injury to people or property resulting from any ideas, methods, instructions or products referred to in the content.

