
Graph-Based Extractive Text Summarization Sentence Scoring Scheme for Big Data Applications

 ,
,  , and
, and
Abstract
:1. Introduction
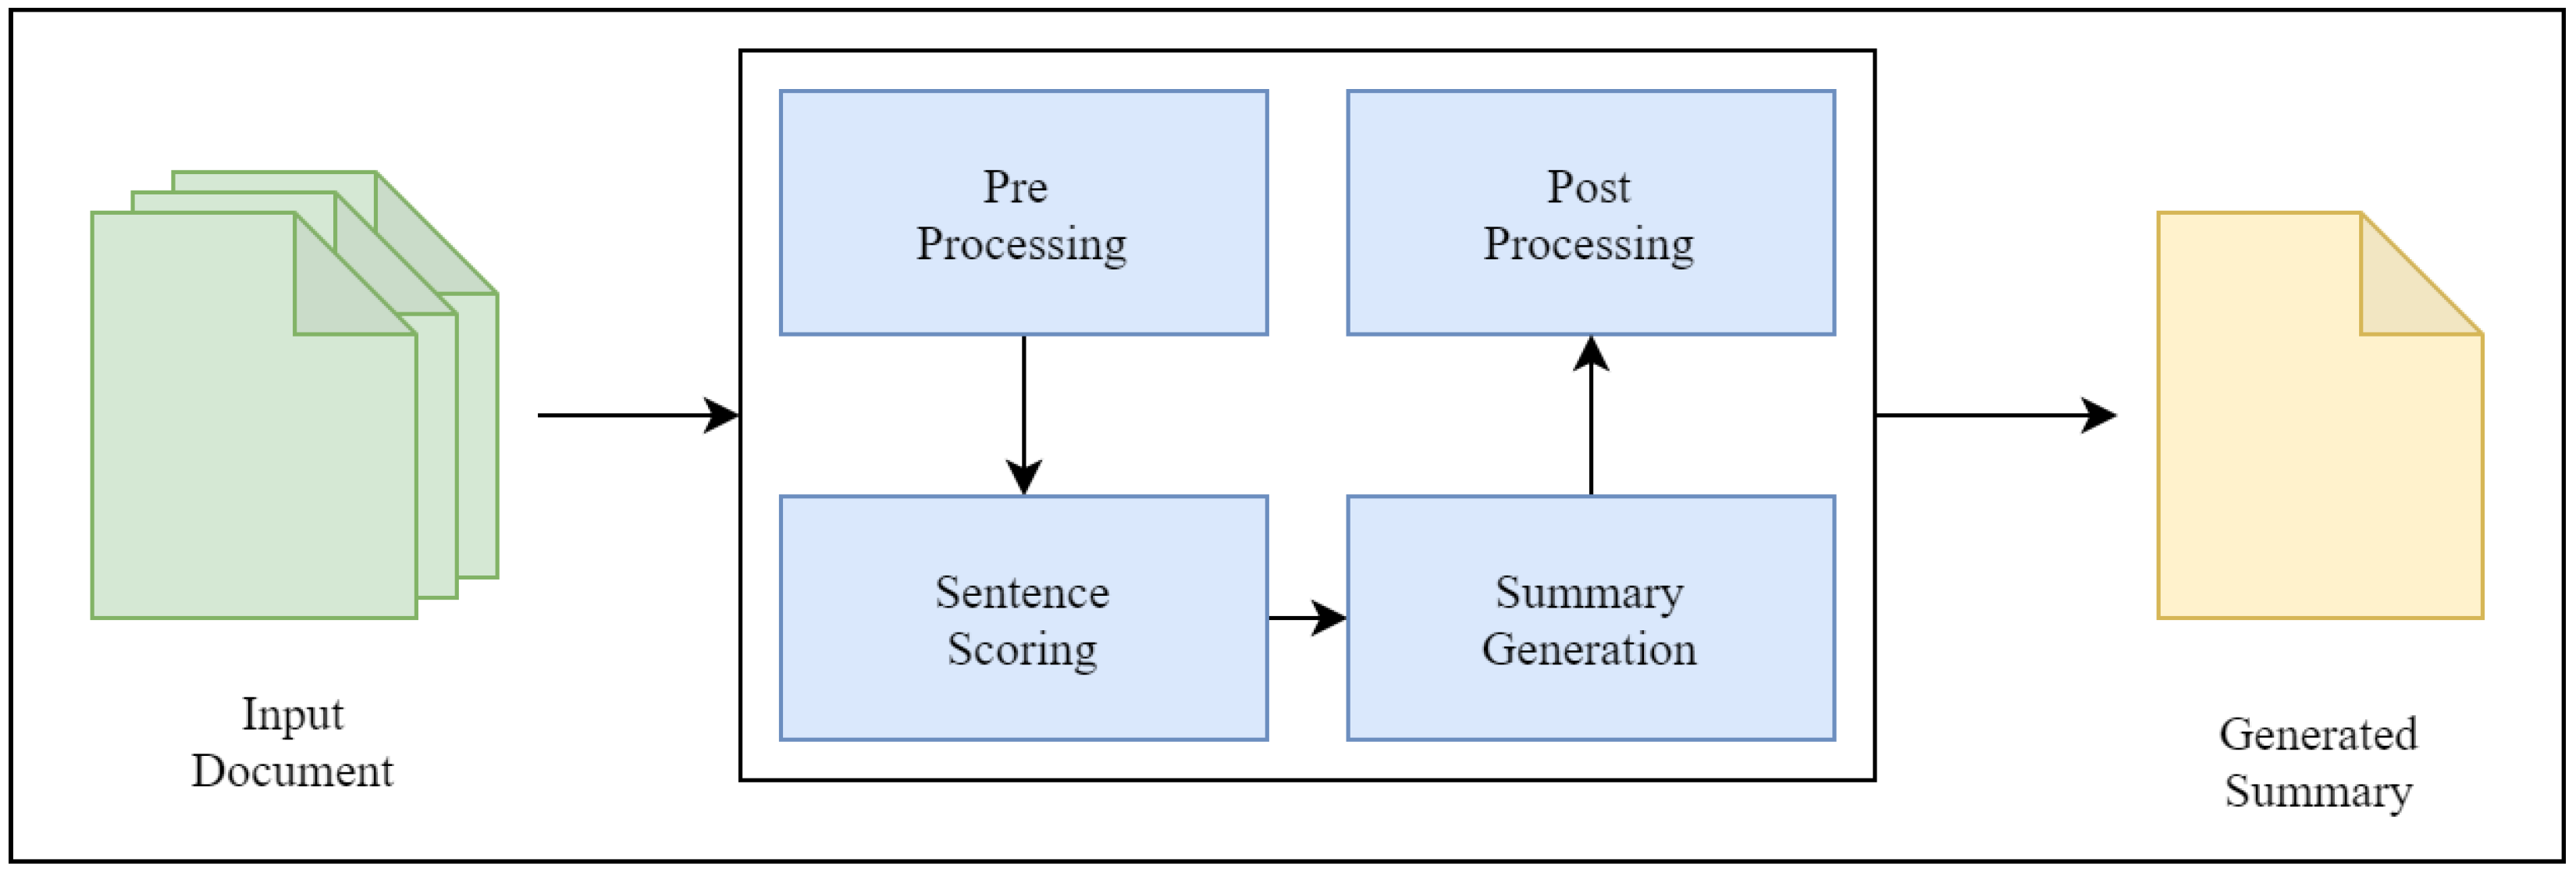
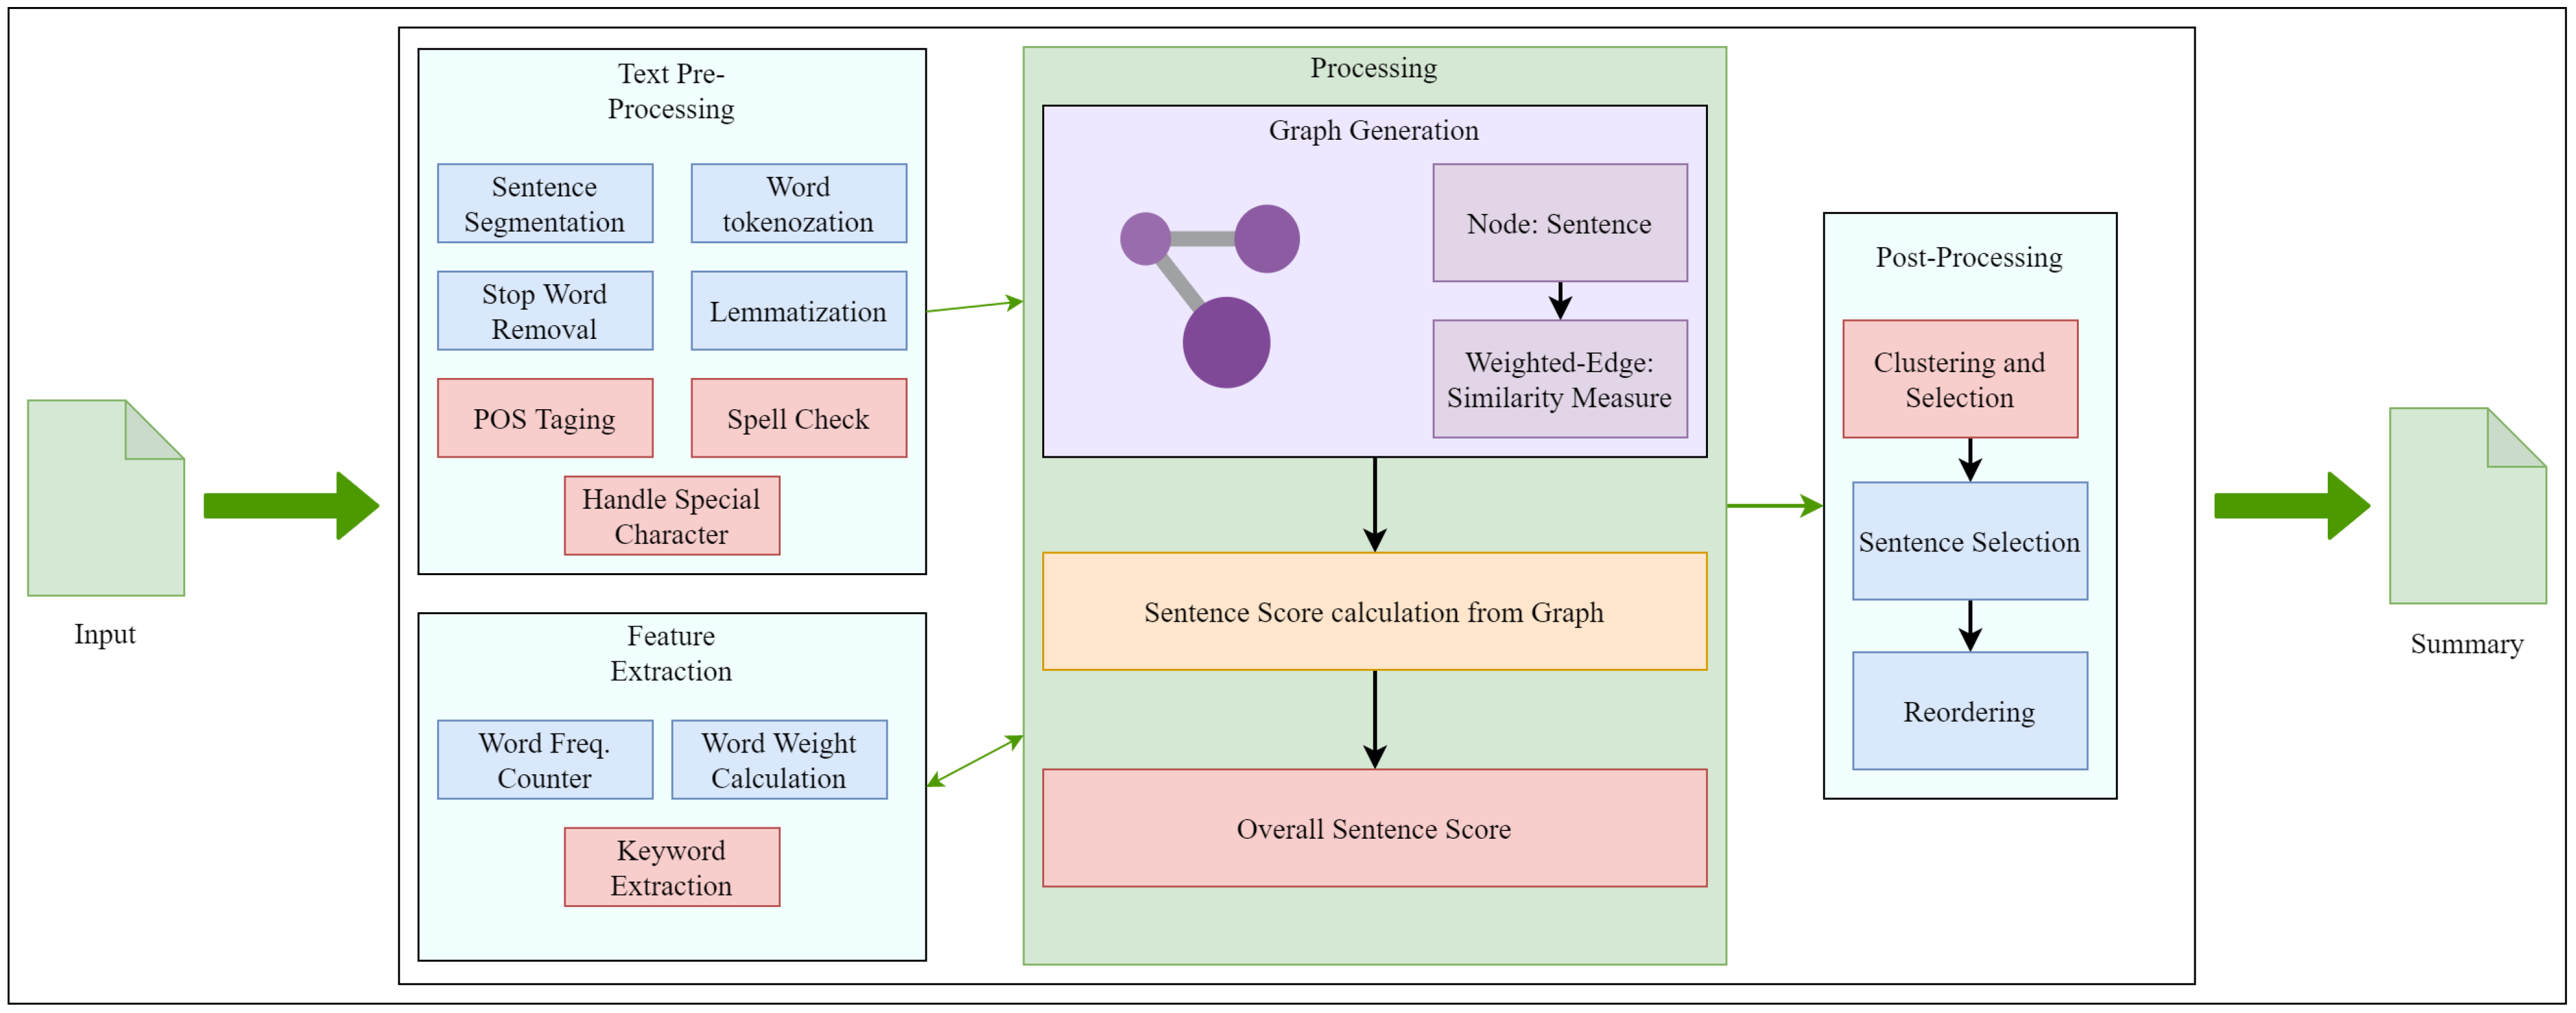
- Pre-processing: Most text mining big data are unstructured and in raw form, and, thus, pre-processing steps are required to handle the text documents, along with natural language processing (NLP) schemes [22]. With NLP, the pre-processing steps include noise removal from text [23]. The noise removal comprises steps like case removal, tokenization, stemming, stop-word removal, parts of speech tagging, and many others. Once data are pre-processed, two types of feature extraction mechanisms are presented based on sentence level and word level. Sentence-level features include sentence length, sentence position, and frequency of word type in a sentence. Word-level features include word-related statics like word type, term frequency inverse document frequency (TF-IDF), and other related schemes.
- Sentence Scoring: In this phase, rank is calculated from the given sentences based on which sentence selection. Different methods of sentence scoring are employed, namely TF-IDF, TextRank, word2vec, and others based on the similarity of the occurrence of nouns and numerical values [24]. However, the method of rank calculation is not universal and differs based on end application requirements. Recently, graph-based schemes have used the ranking algorithm PageRank based on graph traversal. ML models pose summarization as a classification problem [25].
- Summary Generation: This phase generates the initial summary based on the rank calculated in the previous phase. For a graph-based model, it just selects the top required number of sentences based on rank. An ML model then just selects the sentences and classifies them as a true label and generates the summary.
- Post-processing: The initial summary often contains different sentences having the same information, which increases redundancy and decreases the overall quality of a generated summary. So, various redundancy elimination techniques are implemented in this phase. Grouping techniques like clustering and itemset mining are preferred in this phase to group similar types of sentences. Miscellaneous processes like rearranging the sentences in summary based on their occurrence in the original document or inclusion of additional information like tables, figures, equations, and others are conducted.
1.1. An Illustration of Graph-Based ETS with Sentence Scoring Mechanism
- “The cat is on the roof.”
- “The dog is in the garden.”
- “The cat, from the roof, watches the dog.”
- “The dog is unaware of the cat.”
1.2. Novelty
1.3. Research Contributions
- Develop a graph-based sentence selection model to generate summaries for selected datasets. The text conversion to the graph model is conceptualized, and the relationships are presented.
- Analyze the impact of sentence clustering as post-processing with the proposed scheme. Clustering applied at the post-processing level for the selection of the final summary can enhance the attainability of the summary of large documents.
- Evaluate the proposed scheme by comparing it with the bidirectional encoder representations from Transformer (BERT)-based ETS.
- The comparative analysis is presented in terms of ROUGE-1, ROUGE-2, and ROUGE-L for clustered and non-clustered work on the WikiHow dataset. The presented results indicate the scheme viability in real practical application setups.
1.4. Paper Organization
2. Background Schemes
2.1. Graph Analytics Frameworks
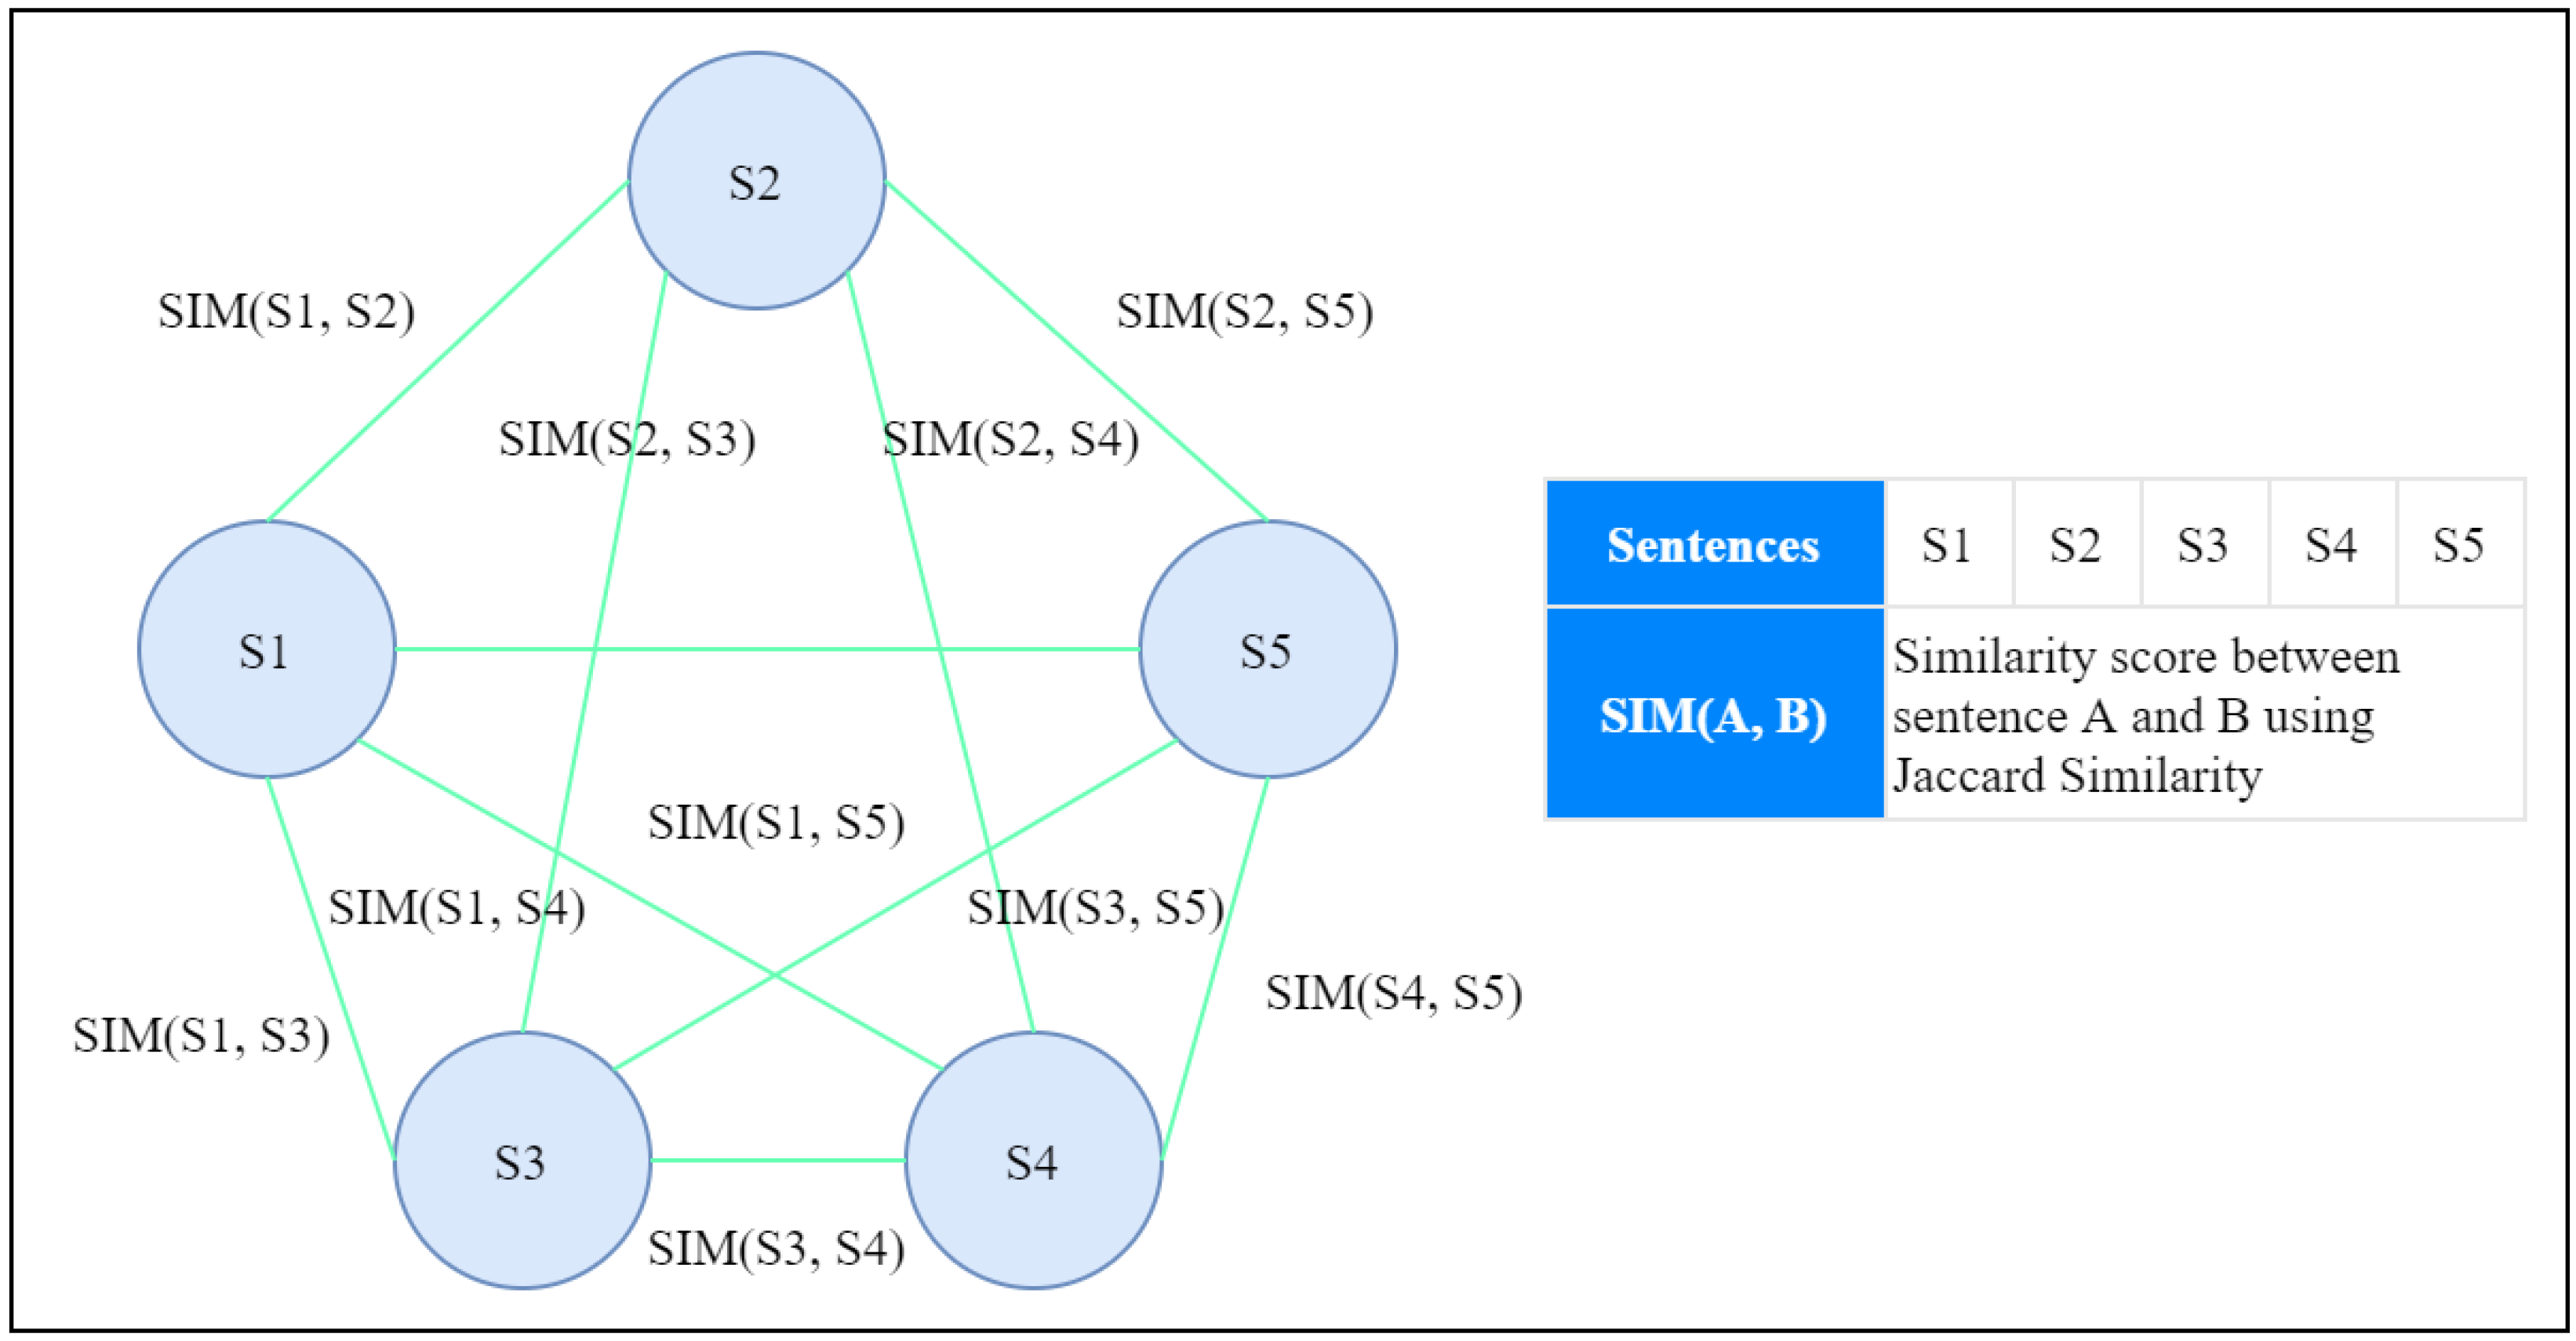
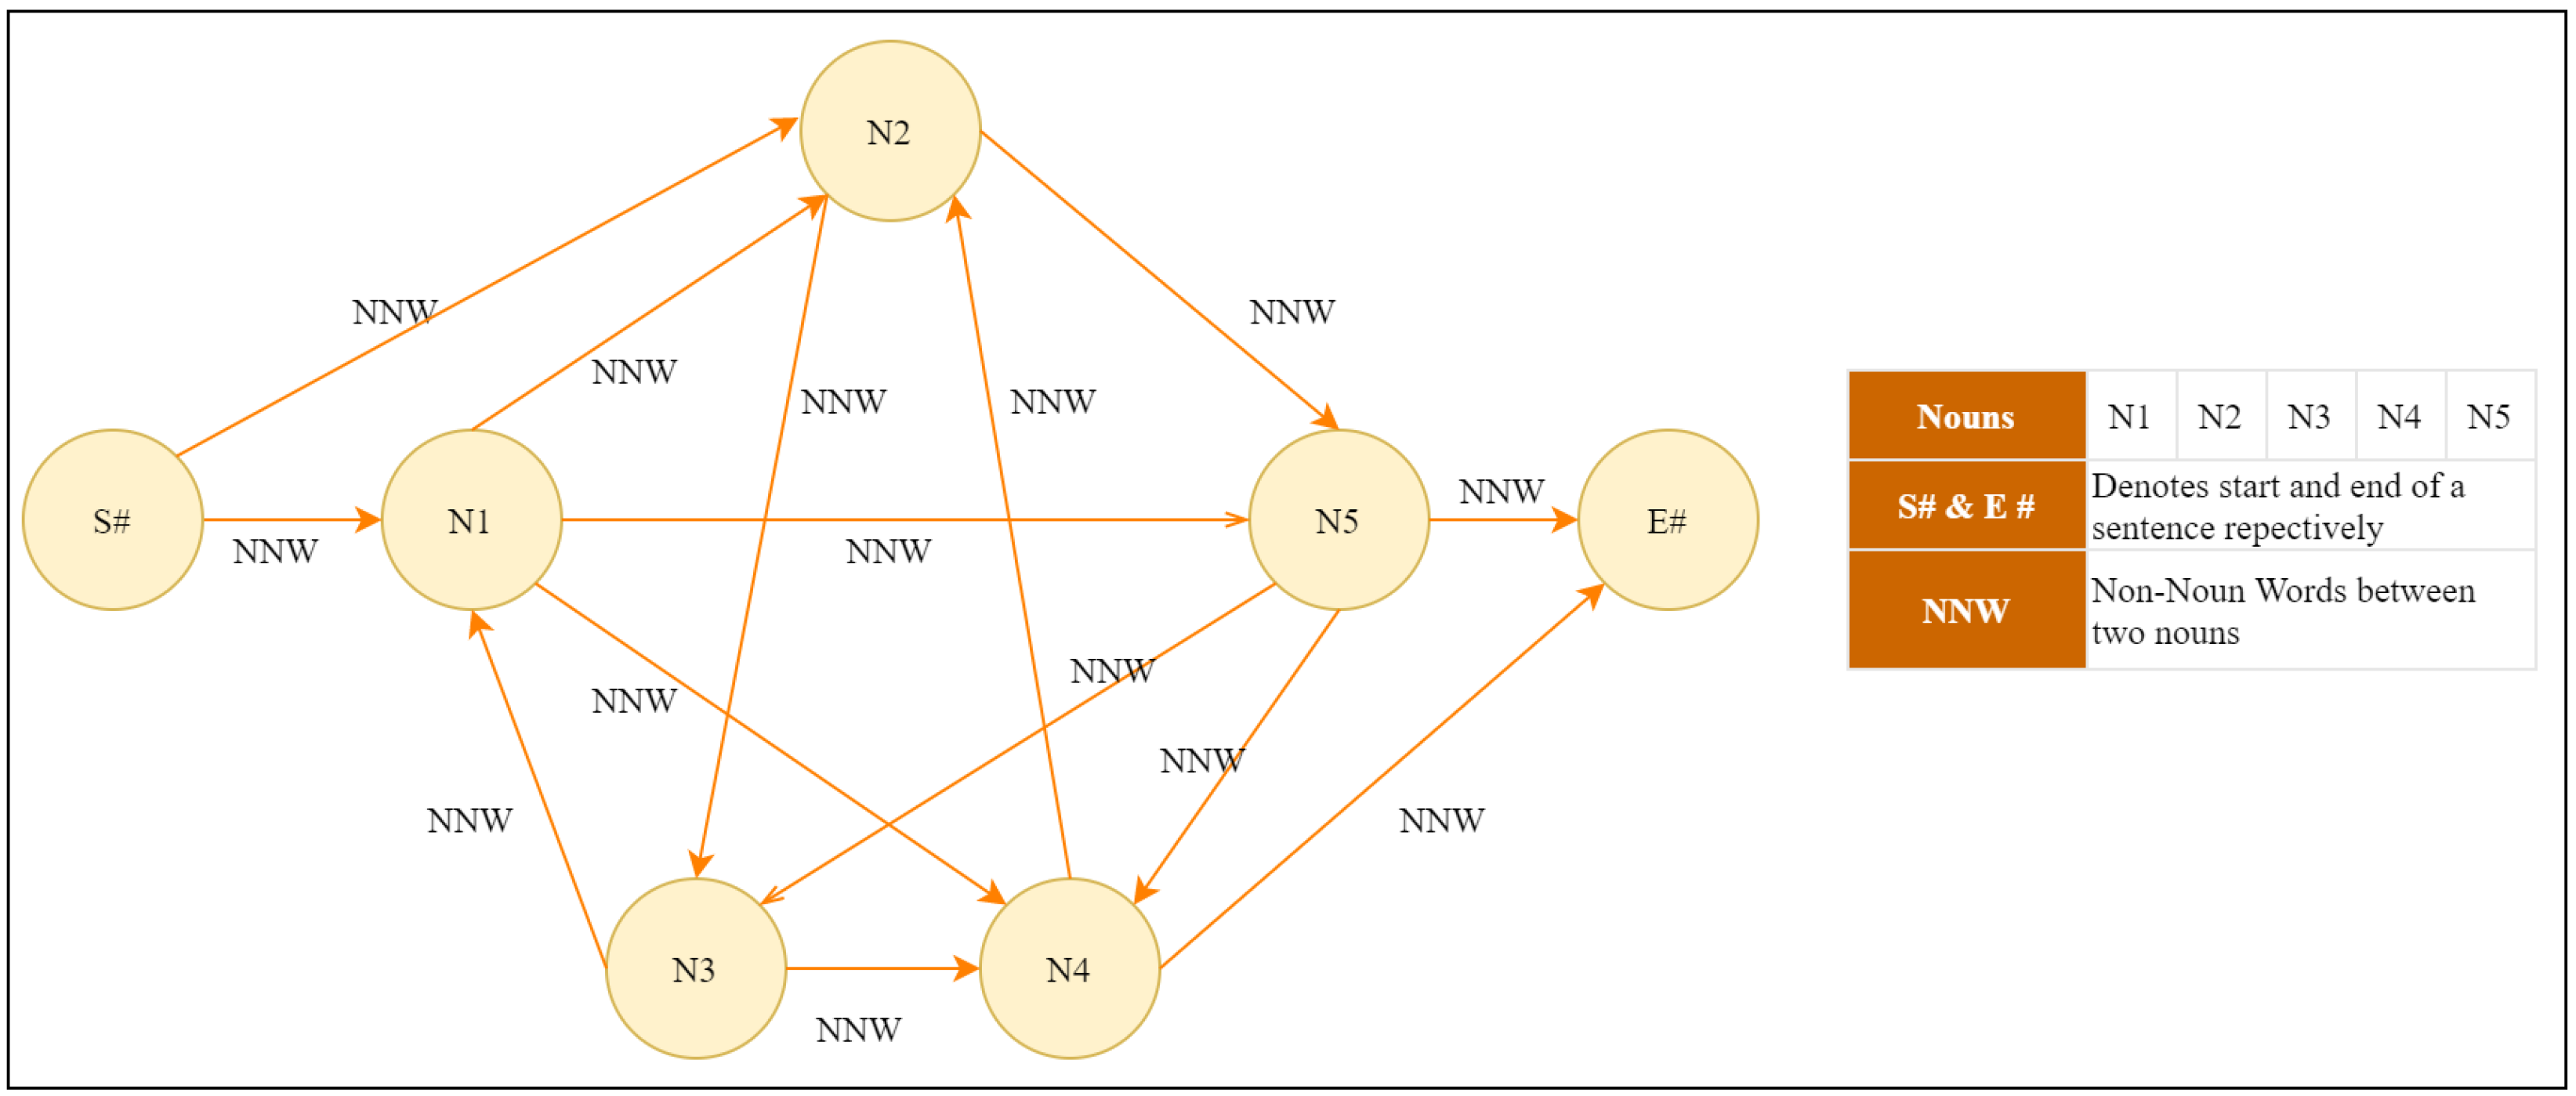
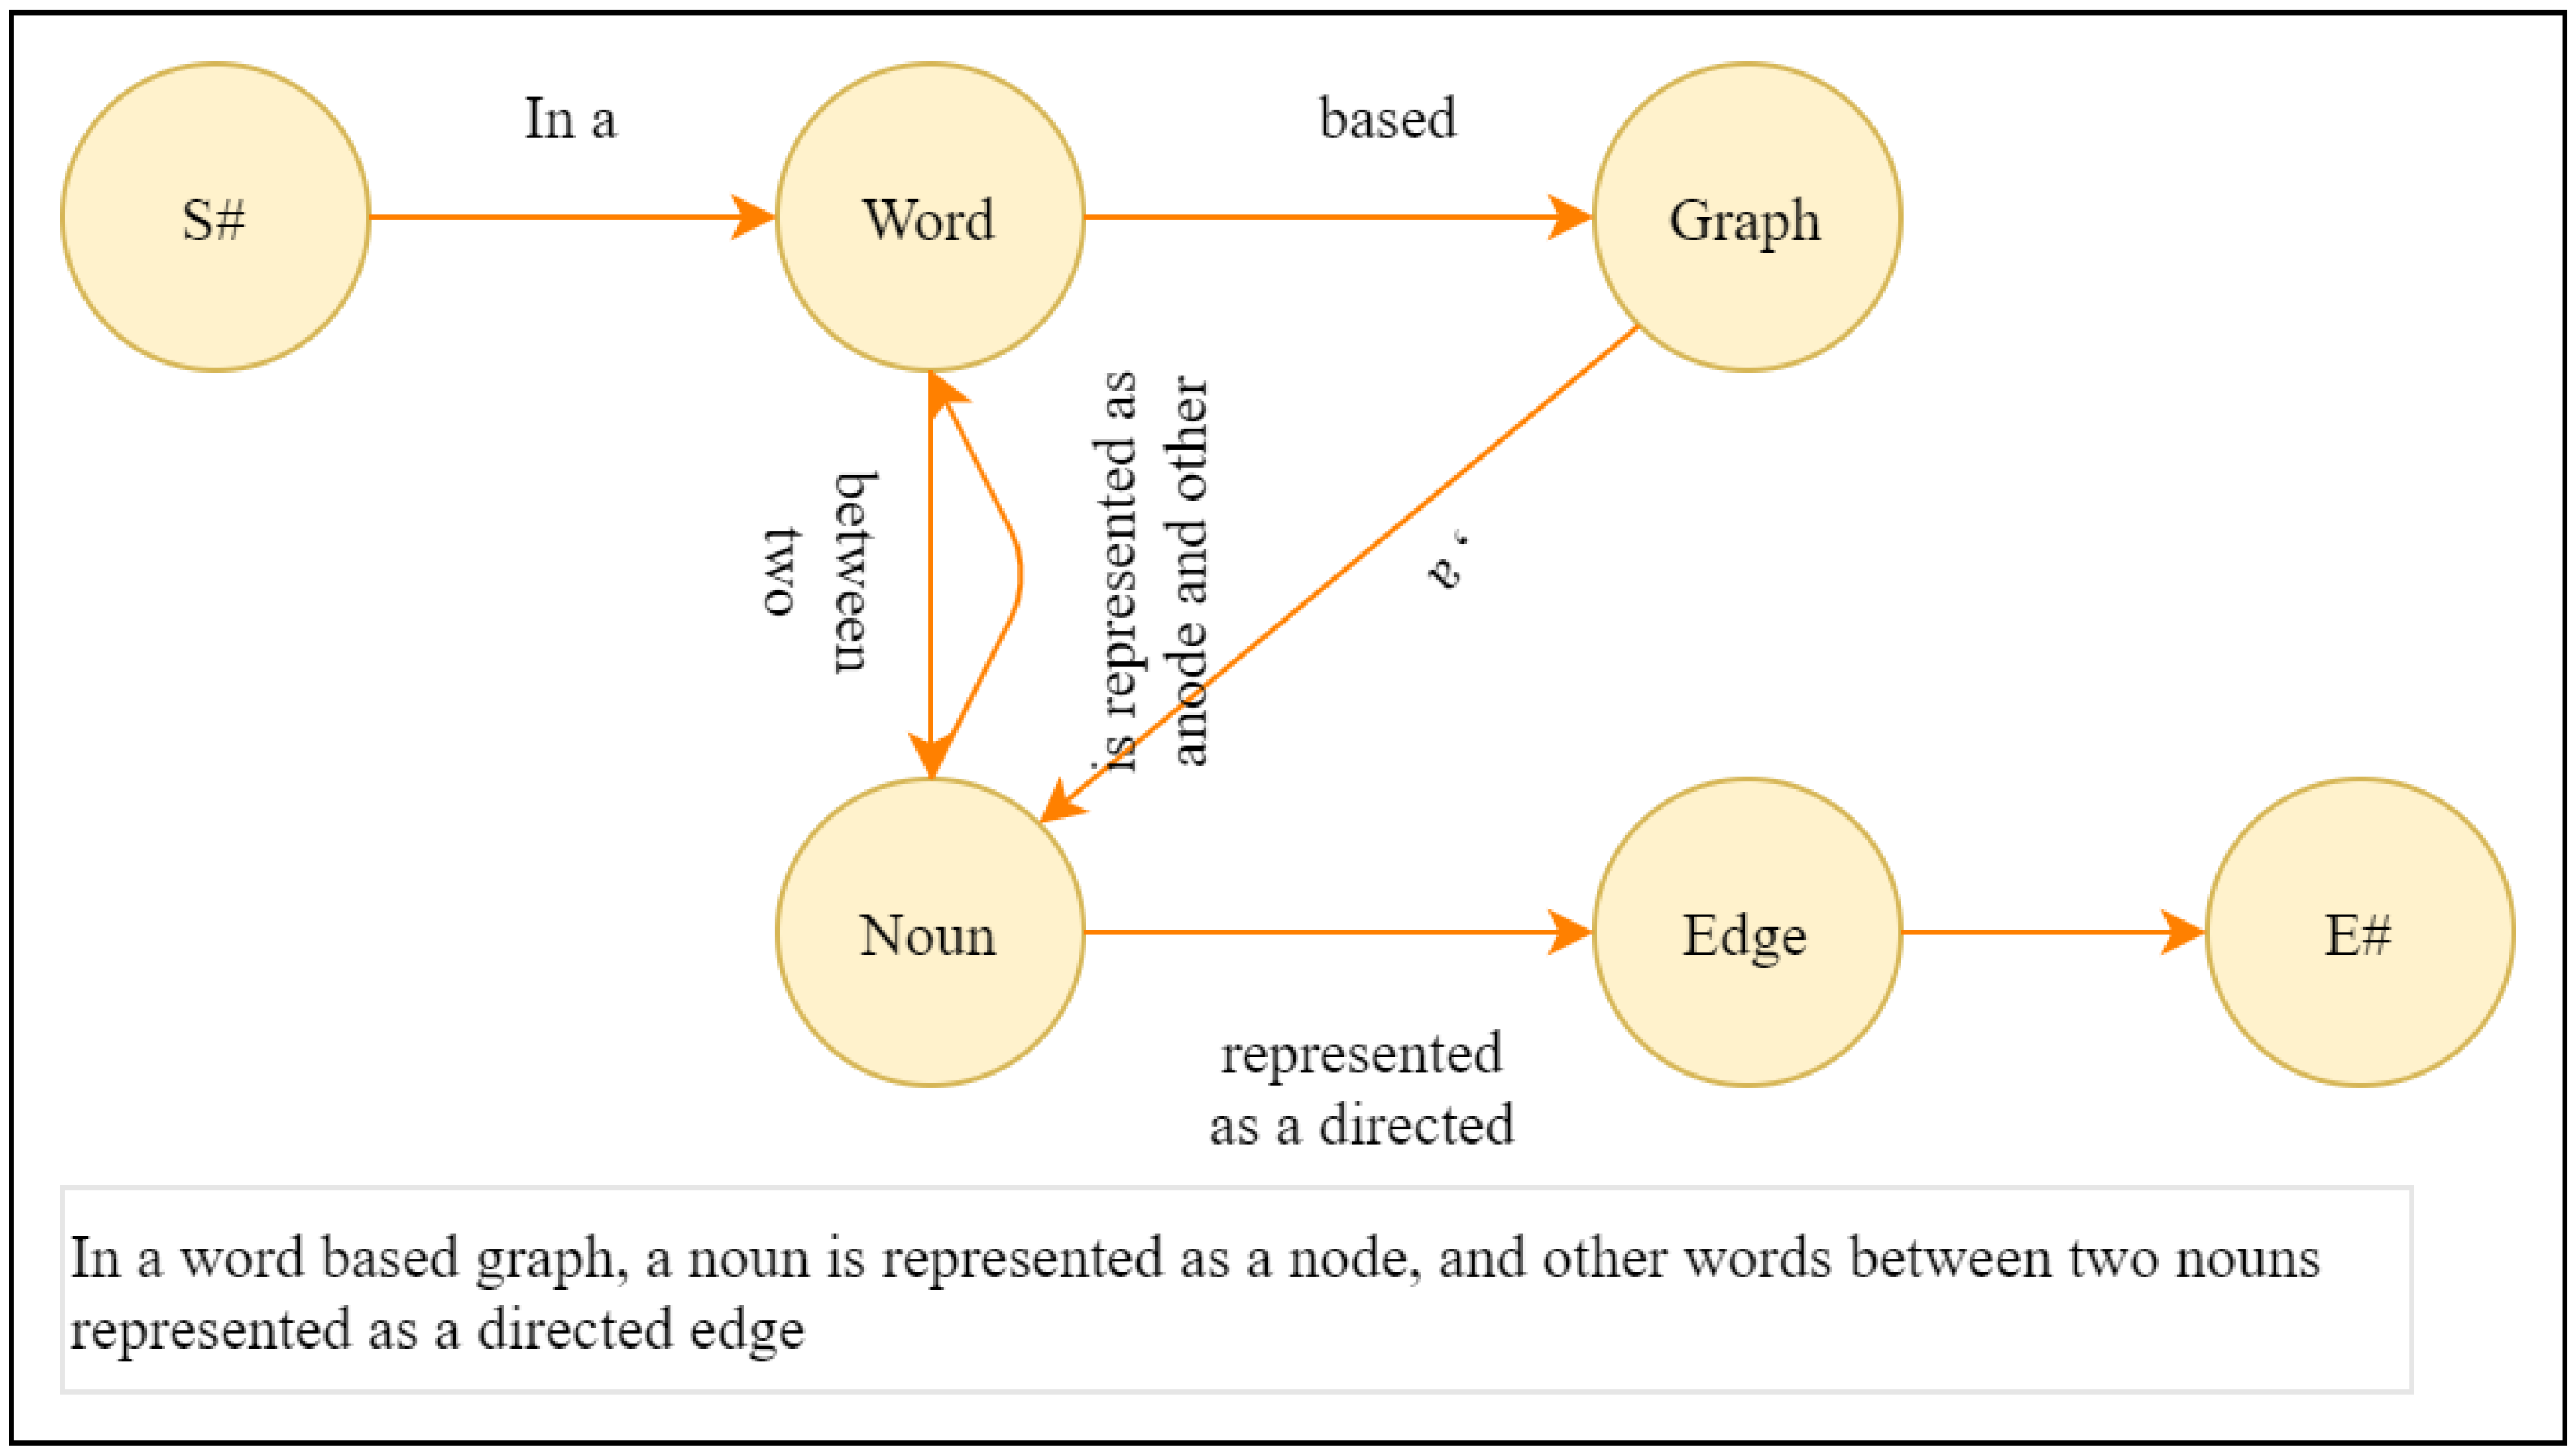
2.2. Graph Model Generation
2.3. Sentence Scoring Algorithms with Graph-Based Analytics
2.3.1. Hyperlinked Induced Topic Search (HITS)
2.3.2. PageRank
2.3.3. TextRank
2.3.4. LexRank
3. Literature Review
4. GETS: The Proposed Scheme
4.1. System Architecture and Flowchart
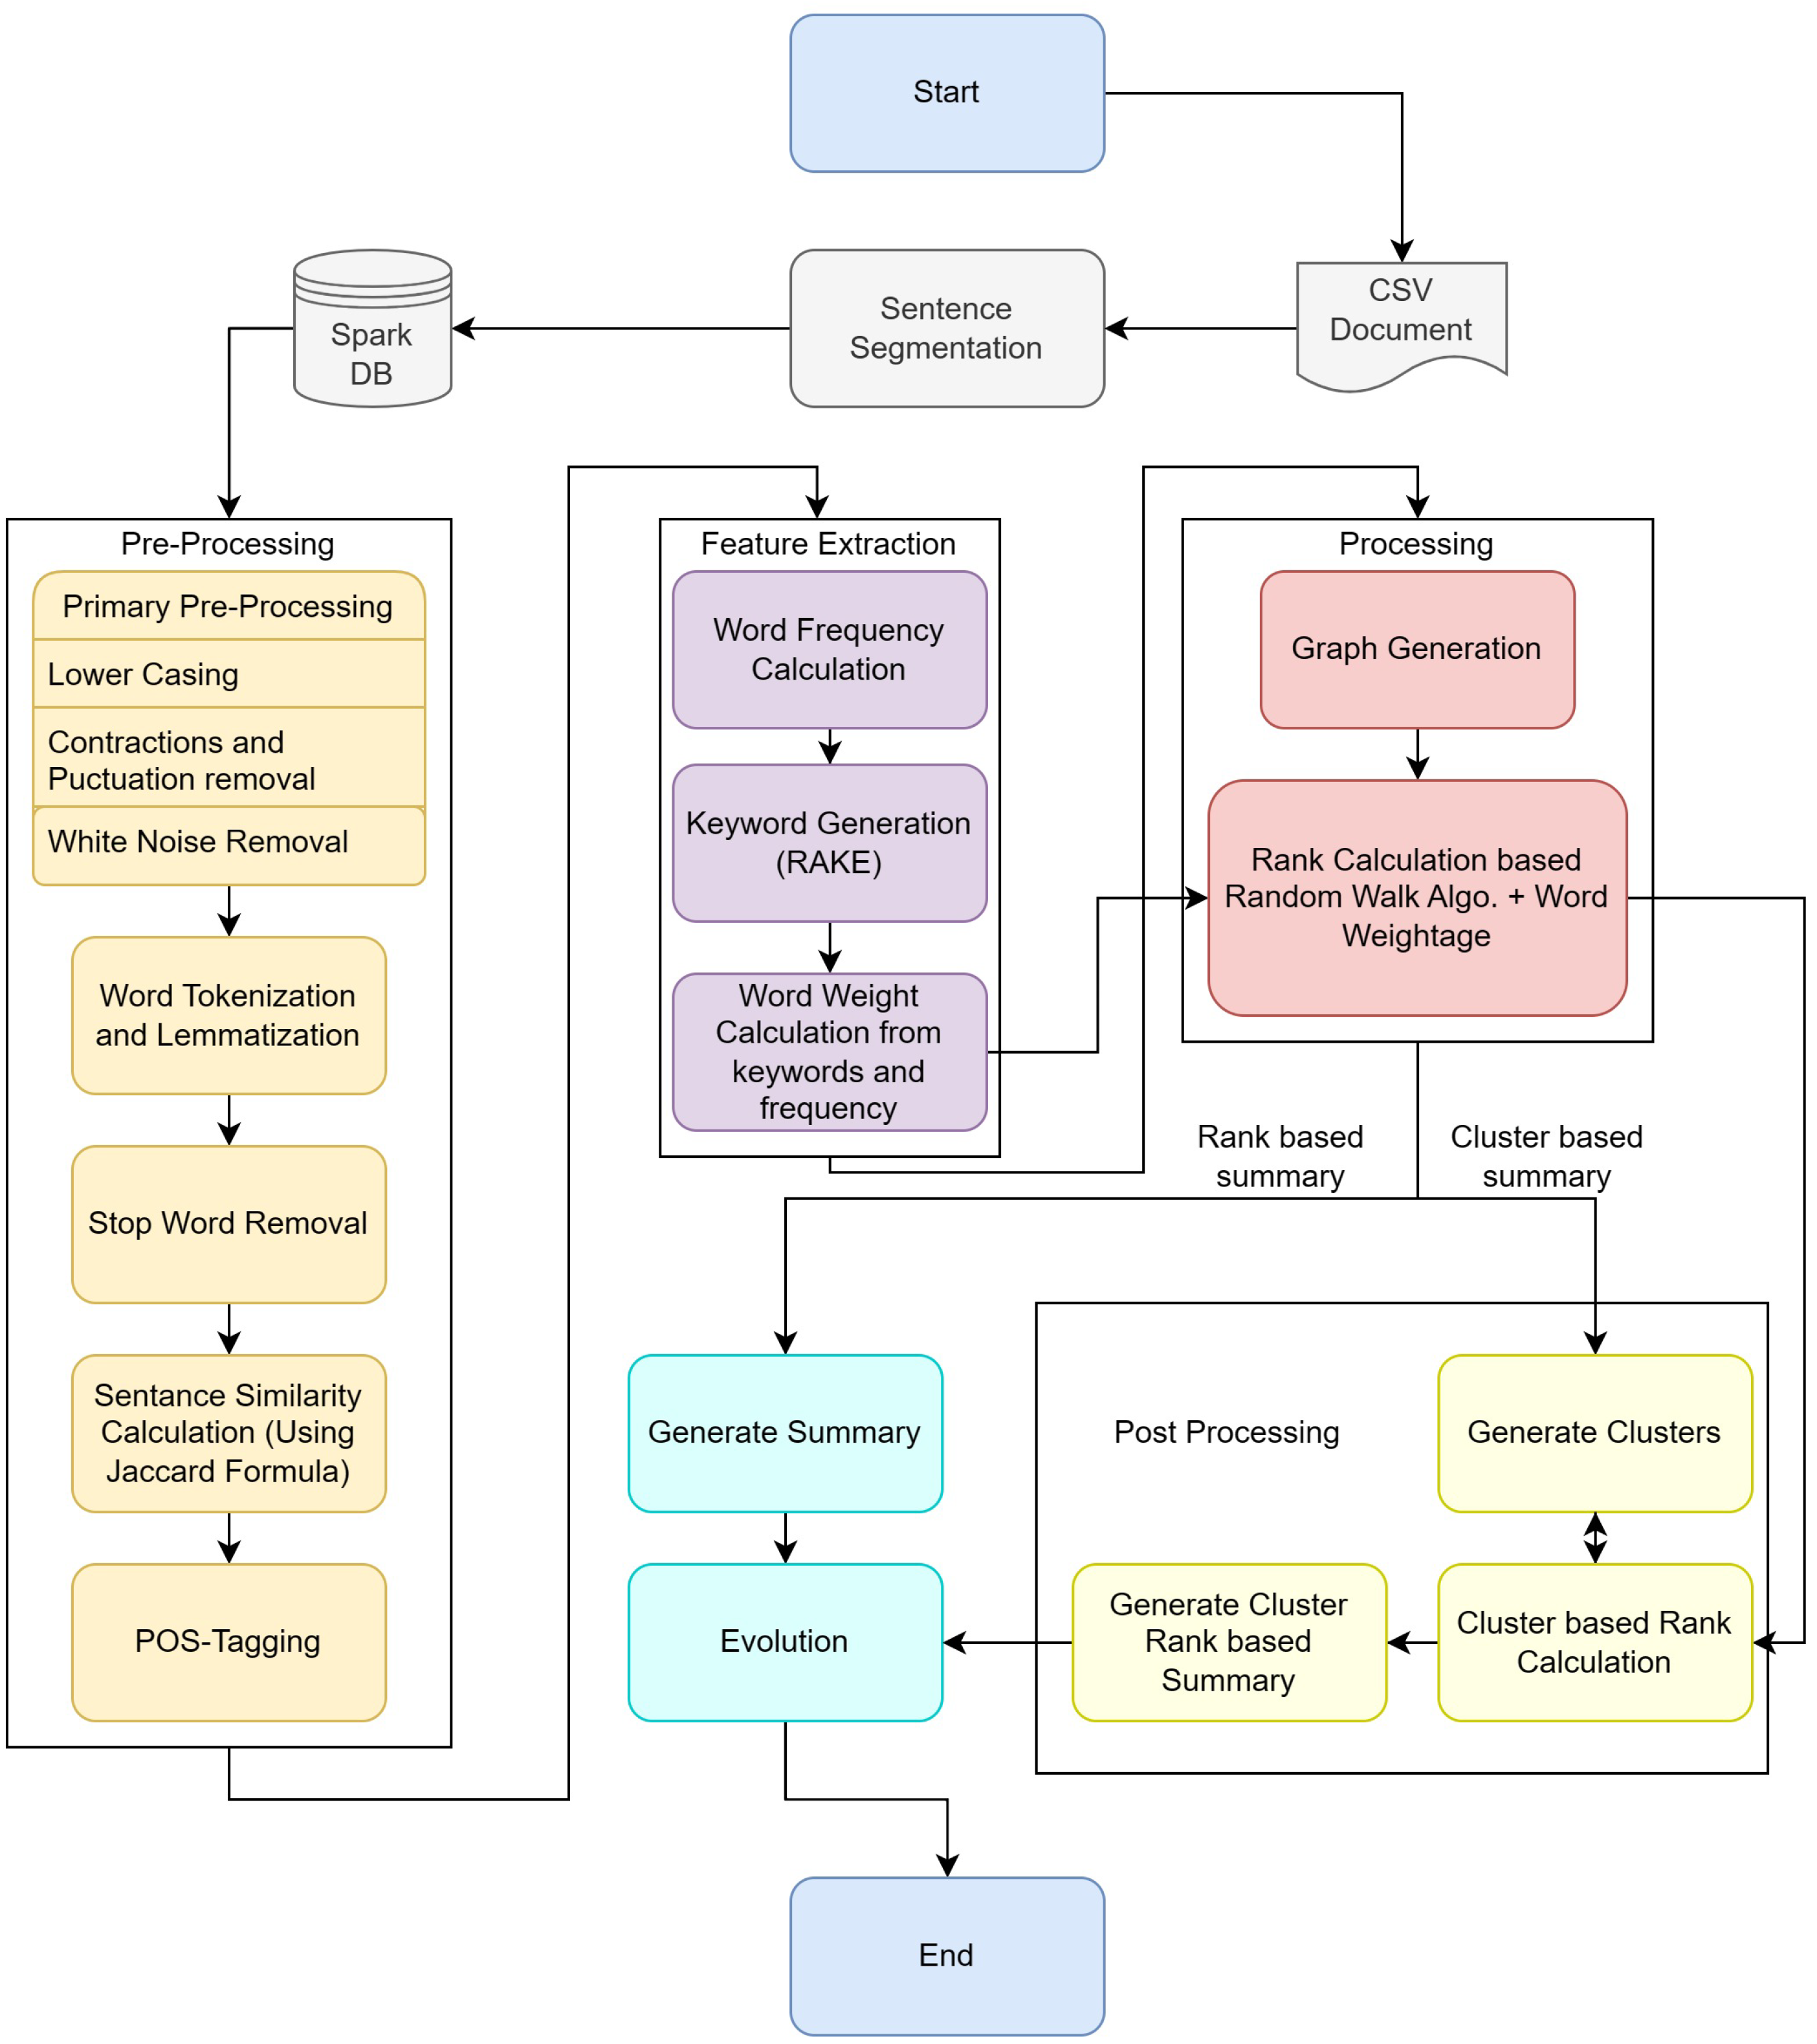
4.1.1. Phase I—Data Pre-Processing Steps
4.1.2. Phase II—Processing with Graph
| Algorithm 1 GETS: Sentence Scoring Algorithm |
| Input: : Sentence list : Sentence Similarity Matrix/Graph : Sentence–word Smoothen Count Matrix calculated using Equation (14) : Parameters : Number of sentences to be selected Output: : a set of sentences Initialize Initialize while Calculate using Equation (6) Calculate using Equation (11) Calculate using Equation (12) Calculate using Equation (13) i ← i + 1 sort-in-score-descending-order () Selection: |
4.1.3. Phase III—Post Processing
- Graph Clustering: Connected components algorithm has been used to identify the clusters within the graph. Initially, the sentence graph generated in the previous stage will be fully connected. To remove the edges, first are edges between sentences that do not have any similarity; secondly, a new threshold is used. So, if the weight of an edge is less than the threshold, is removed.
- Sentence Selection and Reordering: As the sentence is sorted, top sentences are selected from each cluster based on the number of required sentences, then reordered based on their occurrence in the original document.
| Algorithm 2 Sentence selection process using Graph Clustering |
| Input: G: Sentence graph : Parameters : Number of sentences to be selected Output: : a set of sentences For each in G: if : clusters = For each in clusters: For each in cluster(C): Calculate using Equation (15) Calculate using and Equation (13) Selection: |
5. GETS: Performance Analysis
5.1. Dataset Selection
5.2. Evaluation Measures
- Longest Common Subsequence (LCS) [87]: It is the simplest similarity measure, which calculates similarity based on the longest common subsequence between generated summary and referenced summary. Equation (18) provides the basic formula of LCS measure.where X and Y are a sequence of words or lemma form of generated summary and referenced summary, respectively. The is the edit distance between X and Y. Edit distance is the number of operations required to convert X into Y.
- ROUGE [78]: Recall-oriented understudying for gisting evaluation (ROUGE) is a powerful evaluation measure to assess the generated summary [88]. It evaluates the generated summary by comparing it with various human-generated reference summaries. Based on its comparison method, it has various variants, for example, the ROUGE-N comparison of N-gram, the ROUGE-L comparison of the longest subsequence, and ROUGE-S, which uses the skip-gram model. The basic formula of ROUGE-N is presented in Equation (20).where is an N-gram, is the maximum number of N-grams co-occurring in a candidate summary and a set of reference summaries, and is the number of N-grams in the reference summaries.
- Latent Semantic Analysis (LSA) [80]. LSA is a method mainly used to reduce dimensionality within a given text corpus and transforms a document to the term–document matrix, which we denote by A. On the document, we apply the SVD, which is presented in Equation (21).where U and V are orthogonal matrices, and is a diagonal matrix containing singular values. The dimensionality reduction in LSA is mainly attributed to matching the top k largest singular values in and corresponding columns/rows in U and . The resultant matrix is denoted as , where function represents the lower dimensional semantic space. LSA is not a metric in itself; rather, it employs cosine similarity in between document vectors to measure the semantic similarity.
- Pyramid [81]: This method defines a new unit called summary content unit (SCU) to compare information covered in generated summary with the reference summary. SCU is defined by human judges, which is semantically motivated, variable length, and can be of one or more words/lemmas. The best try is that SCU covers most of the information stored in the sentences. So, sentences are given a rank based on the SCUs covered by them. The pyramid is generated based on these SCUs. At the top of the pyramid are those SCUs that appeared in most of the summaries.
5.3. Selection Choice
6. Evaluation Setup
6.1. Discussion and Limitations
6.2. The Way Forward
7. Conclusions and Future Work
Author Contributions
Funding
Data Availability Statement
Acknowledgments
Conflicts of Interest
References
- Essameldin, R.; Ismail, A.A.; Darwish, S.M. An Opinion Mining Approach to Handle Perspectivism and Ambiguity: Moving Toward Neutrosophic Logic. IEEE Access 2022, 10, 63314–63328. [Google Scholar] [CrossRef]
- Elahi, S.; Nika, A.; Tekin, C. Online Context-Aware Task Assignment in Mobile Crowdsourcing via Adaptive Discretization. IEEE Trans. Netw. Sci. Eng. 2023, 10, 305–320. [Google Scholar] [CrossRef]
- Hassani, H.; Beneki, C.; Unger, S.; Mazinani, M.T.; Yeganegi, M.R. Text Mining in Big Data Analytics. Big Data Cogn. Comput. 2020, 4, 1. [Google Scholar] [CrossRef]
- Miah, S.J.; Vu, H.Q.; Alahakoon, D. A social media analytics perspective for human-oriented smart city planning and management. J. Assoc. Inf. Sci. Technol. 2022, 73, 119–135. [Google Scholar] [CrossRef]
- Bhattacharya, P.; Patel, S.B.; Gupta, R.; Tanwar, S.; Rodrigues, J.J.P.C. SaTYa: Trusted Bi-LSTM-Based Fake News Classification Scheme for Smart Community. IEEE Trans. Comput. Soc. Syst. 2022, 9, 1758–1767. [Google Scholar] [CrossRef]
- Devlin, J.; Chang, M.W.; Lee, K.; Toutanova, K. Bert: Pre-training of deep bidirectional transformers for language understanding. arXiv 2018, arXiv:1810.04805. [Google Scholar]
- Schouten, K.; Frasincar, F. Survey on Aspect-Level Sentiment Analysis. IEEE Trans. Knowl. Data Eng. 2015, 28, 813–830. [Google Scholar] [CrossRef]
- Bhattacharya, P.; Trivedi, C.; Obaidat, M.S.; Patel, K.; Tanwar, S.; Hsiao, K.F. BeHAutH: A KNN-Based Classification Scheme for Behavior-Based Authentication in Web 3.0. In Proceedings of the 2022 International Conference on Communications, Computing, Cybersecurity, and Informatics (CCCI), Dalian, China, 17–19 October 2022; pp. 1–5. [Google Scholar] [CrossRef]
- Mansour, S. Social Media Analysis of User’s Responses to Terrorism Using Sentiment Analysis and Text Mining. Procedia Comput. Sci. 2018, 140, 95–103. [Google Scholar] [CrossRef]
- AL-Khassawneh, Y.A.; Hanandeh, E.S. Extractive Arabic Text Summarization-Graph-Based Approach. Electronics 2023, 12, 437. [Google Scholar] [CrossRef]
- Novgorodov, S.; Guy, I.; Elad, G.; Radinsky, K. Descriptions from the Customers: Comparative Analysis of Review-Based Product Description Generation Methods. ACM Trans. Internet Technol. 2020, 20, 44. [Google Scholar] [CrossRef]
- Mackey, A.; Cuevas, I. Automatic text summarization within big data frameworks. J. Comput. Sci. Coll. 2018, 33, 26–32. [Google Scholar]
- Ghodratnama, S.; Beheshti, A.; Zakershahrak, M.; Sobhanmanesh, F. Extractive Document Summarization Based on Dynamic Feature Space Mapping. IEEE Access 2020, 8, 139084–139095. [Google Scholar] [CrossRef]
- El-Kassas, W.S.; Salama, C.R.; Rafea, A.A.; Mohamed, H.K. Automatic text summarization: A comprehensive survey. Expert Syst. Appl. 2020, 165, 113679. [Google Scholar] [CrossRef]
- Chaves, A.; Kesiku, C.; Garcia-Zapirain, B. Automatic Text Summarization of Biomedical Text Data: A Systematic Review. Information 2022, 13, 393. [Google Scholar] [CrossRef]
- Deng, Z.; Ma, F.; Lan, R.; Huang, W.; Lu, X. A Two-stage Chinese text summarization algorithm usingkeyword information and adversarial learning. Neurocomputing 2020, 425, 117–126. [Google Scholar] [CrossRef]
- Giarelis, N.; Mastrokostas, C.; Karacapilidis, N. Abstractive vs. Extractive Summarization: An Experimental Review. Appl. Sci. 2023, 13, 7620. [Google Scholar] [CrossRef]
- Alomari, A.; Idris, N.; Sabri, A.Q.M.; Alsmadi, I. Deep reinforcement and transfer learning for abstractive text summarization: A review. Comput. Speech Lang. 2022, 71, 101276. [Google Scholar] [CrossRef]
- Dave, N.; Mistry, H.; Verma, J.P. Text data analysis: Computer aided automated assessment system. In Proceedings of the 2017 3rd International Conference on Computational Intelligence Communication Technology (CICT), Ghaziabad, India, 9–10 February 2017; pp. 1–4. [Google Scholar] [CrossRef]
- Jigneshkumar Patel, H.; Prakash Verma, J.; Patel, A. Unsupervised Learning-Based Sentiment Analysis with Reviewer’s Emotion. In Proceedings of the Evolving Technologies for Computing, Communication and Smart World, Singapore, 26 November 2020; pp. 69–81. [Google Scholar]
- Zaeem, R.N.; German, R.L.; Barber, K.S. PrivacyCheck: Automatic Summarization of Privacy Policies Using Data Mining. ACM Trans. Internet Technol. 2018, 18, 1–18. [Google Scholar] [CrossRef]
- Cai, M. Natural language processing for urban research: A systematic review. Heliyon 2021, 7, e06322. [Google Scholar] [CrossRef]
- Verma, J.P.; Patel, B.; Patel, A. Web Mining: Opinion and Feedback Analysis for Educational Institutions. Int. J. Comput. Appl. 2013, 84, 17–22. [Google Scholar]
- Priyadarshana, Y.H.P.P.; Ranathunga, L. Verb Sentiment Scoring: A Novel Approach for Sentiment Analysis Based on Adjective-Verb-Adverb Combinations. In Proceedings of the 2017 IEEE/ACM International Conference on Advances in Social Networks Analysis and Mining (ASONAM), Sydney, Australia, 31 July–3 August 2017; pp. 533–540. [Google Scholar]
- Arya, C.; Diwakar, M.; Singh, P.; Singh, V.; Kadry, S.; Kim, J. Multi-Document News Web Page Summarization Using Content Extraction and Lexical Chain Based Key Phrase Extraction. Mathematics 2023, 11, 1762. [Google Scholar] [CrossRef]
- Bichi, A.A.; Keikhosrokiani, P.; Hassan, R.; Almekhlafi, K. Graph-based extractive text summarization models: A systematic review. J. Inf. Technol. Manag. 2022, 14, 184–202. [Google Scholar]
- Srivastava, R.; Singh, P.; Rana, K.; Kumar, V. A topic modeled unsupervised approach to single document extractive text summarization. Knowl.-Based Syst. 2022, 246, 108636. [Google Scholar] [CrossRef]
- Huang, J.; Wu, W.; Li, J.; Wang, S. Text Summarization Method Based on Gated Attention Graph Neural Network. Sensors 2023, 23, 1654. [Google Scholar] [CrossRef]
- Hernandez-Castaneda, A.; García-Hernández, R.A.; Ledeneva, Y.; Millan-Hernández, C.E. Extractive Automatic Text Summarization Based on Lexical-Semantic Keywords. IEEE Access 2020, 8, 49896–49907. [Google Scholar] [CrossRef]
- Jayashree, R.; Vinay, S. A Jaccards Similarity Score Based Methodology for Kannada Text Document Summarization. In Proceedings of the 2020 International Conference on Advances in Computing, Communication & Materials (ICACCM), Dehradun, India, 21–22 August 2020; pp. 8–11. [Google Scholar] [CrossRef]
- Bidoki, M.; Moosavi, M.R.; Fakhrahmad, M. A semantic approach to extractive multi-document summarization: Applying sentence expansion for tuning of conceptual densities. Inf. Process. Manag. 2020, 57, 102341. [Google Scholar] [CrossRef]
- Tkachuk, A. Robustness of rank minimization heuristics for form-finding of tensegrity structures. Comput. Struct. 2022, 266, 106786. [Google Scholar] [CrossRef]
- Fatima, Z.; Zardari, S.; Fahim, M.; Andleeb Siddiqui, M.; Ibrahim, A.A.A.; Nisar, K.; Naz, L.F. A novel approach for semantic extractive text summarization. Appl. Sci. 2022, 12, 4479. [Google Scholar] [CrossRef]
- Yan, D.; Huang, Y.; Liu, M.; Chen, H.; Cheng, J.; Wu, H.; Zhang, C. Graphd: Distributed vertex-centric graph processing beyond the memory limit. IEEE Trans. Parallel Distrib. Syst. 2017, 29, 99–114. [Google Scholar] [CrossRef]
- Stewart, E. (Blog) Facebook’s Fake Accounts Problem Seems Bad. Available online: Vox.com (accessed on 3 December 2020).
- Bhargava, R.; Sharma, G.; Sharma, Y. Deep Text Summarization using Generative Adversarial Networks in Indian Languages. Procedia Comput. Sci. 2020, 167, 147–153. [Google Scholar] [CrossRef]
- Fang, C.; Mu, D.; Deng, Z.; Wu, Z. Word-sentence co-ranking for automatic extractive text summarization. Expert Syst. Appl. 2017, 72, 189–195. [Google Scholar] [CrossRef]
- El-Kassas, W.S.; Salama, C.R.; Rafea, A.A.; Mohamed, H.K. EdgeSumm: Graph-based framework for automatic text summarization. Inf. Process. Manag. 2020, 57, 102264. [Google Scholar] [CrossRef]
- Kleinberg, J.M. Authoritative Sources in a Hyperlinked Environment. J. ACM 1999, 46, 604–632. [Google Scholar] [CrossRef]
- Brin, S.; Page, L. The Anatomy of a Large-Scale Hypertextual Web Search Engine. Comput. Netw. ISDN Syst. 1998, 30, 107–117. [Google Scholar] [CrossRef]
- Mihalcea, R.; Tarau, P. TextRank: Bringing Order into Texts. In Proceedings of the 2004 Conference on Empirical Methods in Natural Language Processing, Barcelona, Spain, 16–25 July 2004; pp. 404–411. [Google Scholar]
- Talpur, B.A.; O’Sullivan, D. Multi-class imbalance in text classification: A feature engineering approach to detect cyberbullying in twitter. Informatics 2020, 7, 52. [Google Scholar] [CrossRef]
- Margaris, D.; Vassilakis, C. Exploiting rating abstention intervals for addressing concept drift in social network recommender systems. Informatics 2018, 5, 21. [Google Scholar] [CrossRef]
- Moradi, M.; Dashti, M.; Samwald, M. Summarization of biomedical articles using domain-specific word embeddings and graph ranking. J. Biomed. Inform. 2020, 107, 103452. [Google Scholar] [CrossRef]
- Alzuhair, A.; Al-Dhelaan, M. An Approach for Combining Multiple Weighting Schemes and Ranking Methods in Graph-Based Multi-Document Summarization. IEEE Access 2019, 7, 120375–120386. [Google Scholar] [CrossRef]
- Yang, K.; Al-Sabahi, K.; Xiang, Y.; Zhang, Z. An Integrated Graph Model for Document Summarization. Information 2018, 9, 232. [Google Scholar] [CrossRef]
- Bhargava, R.; Sharma, Y.; Sharma, G. ATSSI: Abstractive Text Summarization using Sentiment Infusion. Procedia Comput. Sci. 2016, 89, 404–411. [Google Scholar] [CrossRef]
- Mao, X.; Yang, H.; Huang, S.; Liu, Y.; Li, R. Extractive summarization using supervised and unsupervised learning. Expert Syst. Appl. 2019, 133, 173–181. [Google Scholar] [CrossRef]
- Luhn, H.P. The automatic creation of literature abstracts. IBM J. Res. Dev. 1958, 2, 159–165. [Google Scholar] [CrossRef]
- Edmundson, H.P. New methods in automatic extracting. J. ACM 1969, 16, 264–285. [Google Scholar] [CrossRef]
- Aone, C.; Okurowski, M.E.; Gorlinsky, J. Trainable, scalable summarization using robust NLP and machine learning. In Proceedings of the 36th Annual Meeting of the Association for Computational Linguistics and 17th International Conference on Computational Linguistics, Montreal, QC, Canada, 10–14 August 1998; Volume 1, pp. 62–66. [Google Scholar] [CrossRef]
- Etaiwi, W.; Awajan, A. SemG-TS: Abstractive Arabic Text Summarization Using Semantic Graph Embedding. Mathematics 2022, 10, 3225. [Google Scholar] [CrossRef]
- Huang, Y.; Sun, L.; Han, C.; Guo, J. A High-Precision Two-Stage Legal Judgment Summarization. Mathematics 2023, 11, 1320. [Google Scholar] [CrossRef]
- Patel, D.; Shah, S.; Chhinkaniwala, H. Fuzzy logic based multi document summarization with improved sentence scoring and redundancy removal technique. Expert Syst. Appl. 2019, 134, 167–177. [Google Scholar] [CrossRef]
- Van Lierde, H.; Chow, T.W. Query-oriented text summarization based on hypergraph transversals. Inf. Process. Manag. 2019, 56, 1317–1338. [Google Scholar] [CrossRef]
- Jindal, S.G.; Kaur, A. Automatic Keyword and Sentence-Based Text Summarization for Software Bug Reports. IEEE Access 2020, 8, 65352–65370. [Google Scholar] [CrossRef]
- Du, Y.; Huo, H. News Text Summarization Based on Multi-Feature and Fuzzy Logic. IEEE Access 2020, 8, 140261–140272. [Google Scholar] [CrossRef]
- Moradi, M. CIBS: A biomedical text summarizer using topic-based sentence clustering. J. Biomed. Inform. 2018, 88, 53–61. [Google Scholar] [CrossRef]
- Bhargava, R.; Sharma, Y. Deep Extractive Text Summarization. Procedia Comput. Sci. 2020, 167, 138–146. [Google Scholar] [CrossRef]
- Anand, D.; Wagh, R. Effective Deep Learning Approaches for Summarization of Legal Texts. J. King Saud Univ. Comput. Inf. Sci. 2019, 34, 2141–2150. [Google Scholar] [CrossRef]
- Alami, N.; Meknassi, M.; En-nahnahi, N. Enhancing unsupervised neural networks-based text summarization with word embedding and ensemble learning. Expert Syst. Appl. 2019, 123, 195–211. [Google Scholar] [CrossRef]
- Azadani, M.N.; Ghadiri, N.; Davoodijam, E. Graph-based biomedical text summarization: An itemset mining and sentence clustering approach. J. Biomed. Inform. 2018, 84, 42–58. [Google Scholar] [CrossRef]
- Liang, Z.; Du, J.; Li, C. Abstractive Social Media Text Summarization using Selective Reinforced Seq2Seq Attention Model. Neurocomputing 2020, 410, 432–440. [Google Scholar] [CrossRef]
- Adelia, R.; Suyanto, S.; Wisesty, U.N. Indonesian Abstractive Text Summarization Using Bidirectional Gated Recurrent Unit. Procedia Comput. Sci. 2019, 157, 581–588. [Google Scholar] [CrossRef]
- Moirangthem, D.S.; Lee, M. Abstractive summarization of long texts by representing multiple compositionalities with temporal hierarchical pointer generator network. Neural Netw. 2020, 124, 1–11. [Google Scholar] [CrossRef]
- Guo, Q.; Huang, J.; Xiong, N.; Wang, P. MS-Pointer Network: Abstractive Text Summary Based on Multi-Head Self-Attention. IEEE Access 2019, 7, 138603–138613. [Google Scholar] [CrossRef]
- Cagliero, L.; Garza, P.; Baralis, E. ELSA: A Multilingual Document Summarization Algorithm Based on Frequent Item-sets and Latent Semantic Analysis. ACM Trans. Inf. Syst. 2019, 37, 1–33. [Google Scholar] [CrossRef]
- Rouane, O.; Belhadef, H.; Bouakkaz, M. Combine clustering and frequent itemset mining to enhance biomedical text summarization. Expert Syst. Appl. 2019, 135, 362–373. [Google Scholar] [CrossRef]
- Tsai, C.F.; Chen, K.; Hu, Y.H.; Chen, W.K. Improving text summarization of online hotel reviews with review helpfulness and sentiment. Tour. Manag. 2020, 80, 104122. [Google Scholar] [CrossRef]
- Mohd, M.; Jan, R.; Shah, M. Text Document Summarization using Word Embedding. Expert Syst. Appl. 2020, 143, 112958. [Google Scholar] [CrossRef]
- Cao, B.; Wu, J.; Wang, S.; Gao, H.; Fan, J.; Deng, S.; Yin, J.; Liu, X. Unsupervised Derivation of Keyword Summary for Short Texts. ACM Trans. Internet Technol. 2021, 21, 1–23. [Google Scholar] [CrossRef]
- Ameur, M.S.H.; Belkebir, R.; Guessoum, A.A. Robust Arabic Text Categorization by Combining Convolutional and Recurrent Neural Networks. ACM Trans. Asian Low-Resour. Lang. Inf. Process. 2020, 19, 1–16. [Google Scholar] [CrossRef]
- Zhou, Q.; Yang, N.; Wei, F.; Huang, S.; Zhou, M.; Zhao, T. A Joint Sentence Scoring and Selection Framework for Neural Extractive Document Summarization. IEEE/ACM Trans. Audio Speech Lang. Process. 2020, 28, 671–681. [Google Scholar] [CrossRef]
- Abdel-Salam, S.; Rafea, A. Performance study on extractive text summarization using BERT models. Information 2022, 13, 67. [Google Scholar] [CrossRef]
- Koupaee, M.; Wang, W.Y. WikiHow: A Large Scale Text Summarization Dataset. arXiv 2018, arXiv:1810.09305. [Google Scholar]
- Ganesan, K.; Zhai, C.; Han, J. Opinosis: A graph-based approach to abstractive summarization of highly redundant opinions. In Proceedings of the 23rd International Conference on Computational Linguistics, Beijing, China, 23–27 August 2010; pp. 340–348. [Google Scholar]
- Jalil, Z.; Nasir, M.; Alazab, M.; Nasir, J.; Amjad, T.; Alqammaz, A. Grapharizer: A Graph-Based Technique for Extractive Multi-Document Summarization. Electronics 2023, 12, 1895. [Google Scholar] [CrossRef]
- Lin, C.Y. Rouge: A package for automatic evaluation of summaries. In Proceedings of the Workshop on Text Summarization Branches Out, Barcelona, Spain, 25–26 July 2004; pp. 74–81. [Google Scholar]
- Papineni, K.; Roukos, S.; Ward, T.; Zhu, W.J. Bleu: A method for automatic evaluation of machine translation. In Proceedings of the 40th Annual Meeting of the Association for Computational Linguistics, Philadelphia, PA, USA, 7–12 July 2002; pp. 311–318. [Google Scholar]
- Landauer, T.K.; Foltz, P.W.; Laham, D. An introduction to latent semantic analysis. Discourse Process. 1998, 25, 259–284. [Google Scholar] [CrossRef]
- Nenkova, A.; Passonneau, R.J. Evaluating content selection in summarization: The pyramid method. In Proceedings of the Human Language Technology Conference of the North American Chapter of the Association for Computational Linguistics: Hlt-Naacl 2004, Boston, MA, USA, 2–7 May 2004; pp. 145–152. [Google Scholar]
- Steinberger, J.; Jezek, K. Evaluation measures for text summarization. Comput. Inform. 2009, 28, 251–275. [Google Scholar]
- Zhang, T.; Kishore, V.; Wu, F.; Weinberger, K.Q.; Artzi, Y. Bertscore: Evaluating text generation with bert. arXiv 2019, arXiv:1904.09675. [Google Scholar]
- Sellam, T.; Das, D.; Parikh, A.P. BLEURT: Learning robust metrics for text generation. arXiv 2020, arXiv:2004.04696. [Google Scholar]
- Takano, Y.; Iijima, Y.; Kobayashi, K.; Sakuta, H.; Sakaji, H.; Kohana, M.; Kobayashi, A. Improving Document Similarity Calculation Using Cosine-Similarity Graphs. In Advanced Information Networking and Applications; Barolli, L., Takizawa, M., Xhafa, F., Enokido, T., Eds.; Springer: Cham, Switzerland, 2020; pp. 512–522. [Google Scholar]
- Kryściński, W.; Keskar, N.S.; McCann, B.; Xiong, C.; Socher, R. Neural text summarization: A critical evaluation. arXiv 2019, arXiv:1908.08960. [Google Scholar]
- Yavuz, S.; Chiu, C.C.; Nguyen, P.; Wu, Y. CaLcs: Continuously Approximating Longest Common Subsequence for Sequence Level Optimization. In Proceedings of the 2018 Conference on Empirical Methods in Natural Language Processing, Brussels, Belgium, 31 October–4 November 2018; pp. 3708–3718. [Google Scholar] [CrossRef]
- Plaza, L.; Daaz, A.; Gervas, P. A semantic graph-based approach to biomedical summarisation. Artif. Intell. Med. 2011, 53, 1–14. [Google Scholar] [CrossRef]
- Zhong, M.; Liu, P.; Chen, Y.; Wang, D.; Xuanjing Huang, X.Q. Extractive Summarization as Text Matching. In Proceedings of the 58th Annual Meeting of the Association for Computational Linguistics, online, July 2020; pp. 6197–6208. [Google Scholar]
- Zhu, Q.; Luo, J. Generative Pre-Trained Transformer for Design Concept Generation: An Exploration. Proc. Des. Soc. 2022, 2, 1825–1834. [Google Scholar] [CrossRef]
- Vaswani, A.; Shazeer, N.; Parmar, N.; Uszkoreit, J.; Jones, L.; Gomez, A.N.; Kaiser, Ł.; Polosukhin, I. Attention is All you Need. In Advances in Neural Information Processing Systems; Guyon, I., Luxburg, U.V., Bengio, S., Wallach, H., Fergus, R., Vishwanathan, S., Garnett, R., Eds.; Curran Associates, Inc.: Red Hook, NY, USA, 2017; Volume 30. [Google Scholar]
- Zhang, Y.; Xiao, W. Keyphrase Generation Based on Deep Seq2seq Model. IEEE Access 2018, 6, 46047–46057. [Google Scholar] [CrossRef]
- Liu, Y.; Ott, M.; Goyal, N.; Du, J.; Joshi, M.; Chen, D.; Levy, O.; Lewis, M.; Zettlemoyer, L.; Stoyanov, V. RoBERTa: A Robustly Optimized BERT Pretraining Approach. arXiv 2019, arXiv:1907.11692. [Google Scholar]
- Lan, Z.; Chen, M.; Goodman, S.; Gimpel, K.; Sharma, P.; Soricut, R. ALBERT: A Lite BERT for Self-supervised Learning of Language Representations. arXiv 2019, arXiv:1909.11942. [Google Scholar]
- Sanh, V.; Debut, L.; Chaumond, J.; Wolf, T. DistilBERT, a distilled version of BERT: Smaller, faster, cheaper and lighter. arXiv 2020, arXiv:1910.01108. [Google Scholar]
- Radford, A.; Wu, J.; Child, R.; Luan, D.; Amodei, D.; Sutskever, I. Language models are unsupervised multitask learners. OpenAI Blog 2019, 1, 9. [Google Scholar]
- Brown, T.B.; Mann, B.; Ryder, N.; Subbiah, M.; Kaplan, J.; Dhariwal, P.; Neelakantan, A.; Shyam, P.; Sastry, G.; Askell, A.; et al. Language Models are Few-Shot Learners. arXiv 2020, arXiv:2005.14165. [Google Scholar]
- Bubeck, S.; Chandrasekaran, V.; Eldan, R.; Gehrke, J.; Horvitz, E.; Kamar, E.; Lee, P.; Lee, Y.T.; Li, Y.; Lundberg, S.; et al. Sparks of Artificial General Intelligence: Early experiments with GPT-4. arXiv 2023, arXiv:2303.12712. [Google Scholar]


| Abbreviations | Meanings | Abbreviations | Meanings |
|---|---|---|---|
| AI | Artificial Intelligence | LSTM | Long Short-Term Memory |
| ALBERT | A Lite BERT | ML | Machine Learning |
| API | Application Programming Interface | NLP | Natural Language Processing |
| ATS | Abstractive Text Summarization | NNW | Non-Noun Words |
| BERT | Bidirectional Encoder Representations from Transformers | POS | Parts of Speech |
| BLEU | Bilingual Evaluation Understudy | PPF | Positional Power Function |
| DBSCAN | Density-Based Spatial Clustering of Applications with Noise | RAKE | Rapid Automatic Keyword Extraction |
| ETS | Extractive Text Summarization | RDD | Resilient Distributed Datasets |
| GAN | Generative Adversarial Networks | ROBERTa | A Robustly Optimized BERT Pretraining Approach |
| GloVe | Global Vectors for Word Representation | ROUGE | Recall-Oriented Understudying Gisting Evaluation |
| GPT | Generative Pretrained Transformers | SCU | Summary Content Unit |
| GRU | Gated Recurrent Unit | SVD | Singular Value Decomposition |
| HITS | Hyperlink Induced Topic Search | TF-IDF | Term Frequency Inverse Document Frequency |
| IDF | Inverse Document Frequency | TM | Text Mining |
| LCS | Longest Common Subsequence | TS | Text Summarization |
| LSA | Latent Semantic Analysis | UMLS | Unified Medical Language Systems |
| Ref. | Objective | Pros | Cons | Node | 1 | 2 | 3 | 4 | 5 |
|---|---|---|---|---|---|---|---|---|---|
| Moradi et al. [44] | Comparison of effects of different input encoders in graph-based models. | Inclusion of domain-specific word embedding improves the generated summary | Cannot be used for general-purpose summarization as it more relies on the domain of the document. | S | ✓ | X | X | ✓ | X |
| Alzuhair et al. [45] | Implementation the combinations of two similarity measures and two ranking algorithms to find the optimal one. | Can be used for both single and multiple document summarization. | Results comparison can be improved by including more similarity and ranking algorithms. | S | ✓ | X | X | ✓ | X |
| Yang et al. [46] | Use combined weightage of words, bigrams, and trigrams to generate better sentence scores. | An integrated graph can learn and use semantic relatedness from three different dimensions. | It may require a high amount of resources in case of a big number of documents. | S | X | ✓ | X | X | X |
| Bhargava et al. [47] | Improve semantic values in summary by considering word position and overlapping of words. | A simple POS tag can be used to improve semantic value in summary. | A model can be complex for an extractive ATS system. | W | X | X | X | X | ✓ |
| Mao et al. [48] | Optimal balance between machine learning and graph-based sentence selection method. | ML model and graph model combined provide a better summary. | Author has not implemented any redundancy handling technique. | S | X | X | ✓ | X | X |
| Fang et al. [37] | Inclusion of importance of words during sentence score calculation to improve the sentence selection process. | Less complex and easy to implement | The assumption has taken that, initially, all words have the same weightage. | S | ✓ | X | X | X | X |
| El-Kassas et al. [38] | Induce word’s weightage based on its type and position to improve the sentence selection process. | Model can generate great results for domain-specific documents or scientific papers. | Complex to implement; may require a high amount of resources. | W | X | X | X | X | ✓ |
| Author | Methodology | Type | 1 | 2 | 3 | 4 | 5 | I/p Type |
|---|---|---|---|---|---|---|---|---|
| Patel et al. [54] | Combination of word-level and sentence-level features to obtain best results for multiple documents. Word Features: Given fixed weightage to a word based on its specific position (title, keyword), type (noun, numerical), and domain. Sentence Features: Sentence position, length, and cosine similarity. | E | X | X | X | ✓ | X | M |
| Mao et al. [48] | Use of LexRank for calculating scoring of node. Three models: (1) Linear combination. (2) Use graph score as a feature. (3) Use the decision of supervised result in graph scoring. | E | ✓ | X | ✓ | X | X | S |
| Van Lierde et al. [55] | Use DBSCAN for semantic clustering of words to generate a topic-based model with the constructed hypergraph | E | X | X | ✓ | X | ✓ | S |
| Chaves et al. [15] | Calculate cosine similarity between sentence words and keywords as well as with words of other sentences. Obtain averaged similarity of all words in a sentence and assign it as a sentence score. | E | X | ✓ | X | X | X | S |
| Jindal et al. [56] | Apply TF-TDF and rapid automatic keyword extraction (RAKE) for word-level features. Find optimal no. of clusters and apply fuzzy c clustering for sentence-level features. | E | X | X | X | ✓ | ✓ | S |
| Du et al. [57] | Apply genetic algorithm for optimal weights of above features. Uses a fuzzy logic system to calculate sentence scores. | E | X | X | X | ✓ | ✓ | S |
| Moradi et al. [58] | Find topic-wise using itemset mining. Apply hierarchical clustering on support values to group similar types of sentences. | E | X | X | X | ✓ | ✓ | Both |
| Bhargava et al. [59] | Label generation by mapping document and its pre-summary made by human. Convert sentence to vector using embedded layer. Then, pass it through the convolution layer for feature extraction. | E | X | ✓ | X | X | X | S |
| Anand et al. [60] | Generate labeled data by using various similarity measures between legal documents and head notes. Generate embedded vector combined with cosine similarity. | E | X | ✓ | X | X | X | M |
| Alami et al. [61] | Generation of word2vec model. Used three variations of autoencoders: a. auto encoder b. variation AR c. extreme learning machine AE 3. Use the voting method to obtain cumulative ranks of sentences. | E | X | ✓ | X | X | X | S |
| Azadani et al. [62] | Map document to concept using MetaMap developed for Unified Medical Language System (UMLS). Use the itemset mining method to obtain frequent itemsets from documents. Jaccard similarity to obtain similarity measure between two itemsets. | E | X | X | ✓ | X | ✓ | S |
| Liang et al. [63] | Combination of cross-entropy and reinforcement learning to improve performance of seq2seq attention model | A | X | X | X | X | X | S |
| Adelia et al. [64] | Vectorize sentence with word2vec model. | A | X | ✓ | X | X | X | S |
| Moirangthem et al. [65] | Seq2seq attention model and pointer generator network. Improve performance of model and sentiment value of summary for large documents. | A | X | ✓ | X | X | X | S |
| Ghodratnama et al. [13] | Posed as a classification problem. First cluster the sentences and then send information to the classifier for weight updating of features. Linguistic feature: each sentence is a subgraph of three forms: subject, predicate, and object. | E | X | X | X | X | ✓ | M |
| Guo et al. [66] | Improvement in the grammar of summary. Used pointer network for out-of-vocabulary problems. Multi-head self-attention model is used to generate a semantic summary. | A | X | ✓ | X | X | X | S |
| Mackey et al. [12] | Generate an inverted index of training dataset in Hadoop. Use the TF-IDF score to rank sentences. | E | X | X | X | X | X | S |
| Cagliero et al. [67] | Generate word to sentence frequent itemset matrix. Apply Singular Value Decomposition (SVD) on the resulting matrix to identify concepts covered by sentences. Select the sentence with the most covered concepts. | E | X | X | X | X | ✓ | S |
| Fang et al. [37] | Calculate word’s rank using sentence rank. Calculate new sentence rank by using the weight of every word. Use a linear combination of each sentence rank as sentence selection rank | E | X | X | ✓ | X | X | S |
| Giarelis et al. [17] | Presented an in-depth analysis on the TS process, datasets, and outlined the evaluation methods and metric selection principles | Both A and E | ✓ | ✓ | N | N | ✓ | M |
| El-Kassas et al. [38] | Calculate node weightage using parameters like word type, the domain of the word, and the position of the word in the document (e.g., title, subject, keyword, etc.). Generate candidate summary by calculating the average weight nodes of the selected path. Apply K-means clustering in the candidate summary to remove redundancy. | E | X | X | ✓ | X | ✓ | M |
| Alomari et al. [18] | A comprehensive review of the application of deep reinforcement learning and transfer learning techniques in the context of abstractive text summarization. The study delves into the current state-of-the-art works and explores how these methods can be utilized to generate concise and coherent summaries from large textual content. | A | X | ✓ | X | X | ✓ | M |
| Metric | Objective | Merits | Applications |
|---|---|---|---|
| Cosine Similarity | Measures the cosine of the angle between two vectors. | Captures semantic similarity, efficient for high-dimensional vectors. | Information retrieval, text mining. |
| Unit Overlap | Computes the overlap of words in two texts. | Simple to calculate, highly interpretable. | Text similarity, text classification. |
| LCS | Finds the longest subsequence common to two sequences. | Robust to paraphrasing. | Plagiarism detection, genetic sequences analysis. |
| ROUGE | Measures the overlap of N-grams, word sequences, and word pairs. | Captures recall-based metrics with variants (ROUGE-N, ROUGE-L, and others). | Text summarization, machine translation. |
| Pyramid | Evaluates content units in summaries. | Comprehensive assessment of summaries. | Text summarization, particularly multi-document. |
| BLEU | Compares N-grams of machine output with that of a human reference. | Precision-oriented, good for aggregate data. | Machine translation, text summarization. |
| LSA | Unearths the latent semantic relationships within a corpus. | Can capture contextual and conceptual similarity. | Information retrieval, text summarization, topic modeling. |
| Class | Length of Documents |
|---|---|
| C1 | Between 0–50 |
| C2 | Between 50–100 |
| C3 | Between 100–150 |
| C4 | Between 150–200 |
| C5 | Greater Than 200 |
| Parameter | Values | Description |
|---|---|---|
| d | 0.8 | Damping factor to handle node with zero degrees (refer Equation (6)) |
| 0.6 | Where ; to balance the word-infused rank and random walk rank (refer Equation (13)) | |
| A convergence factor for word-based rank calculation (refer Algorithm 1) | ||
| Q3 percentile of all similarity values | To remove the edge with very low similarity relations between sentences in the graph (refer Algorithm 2) |
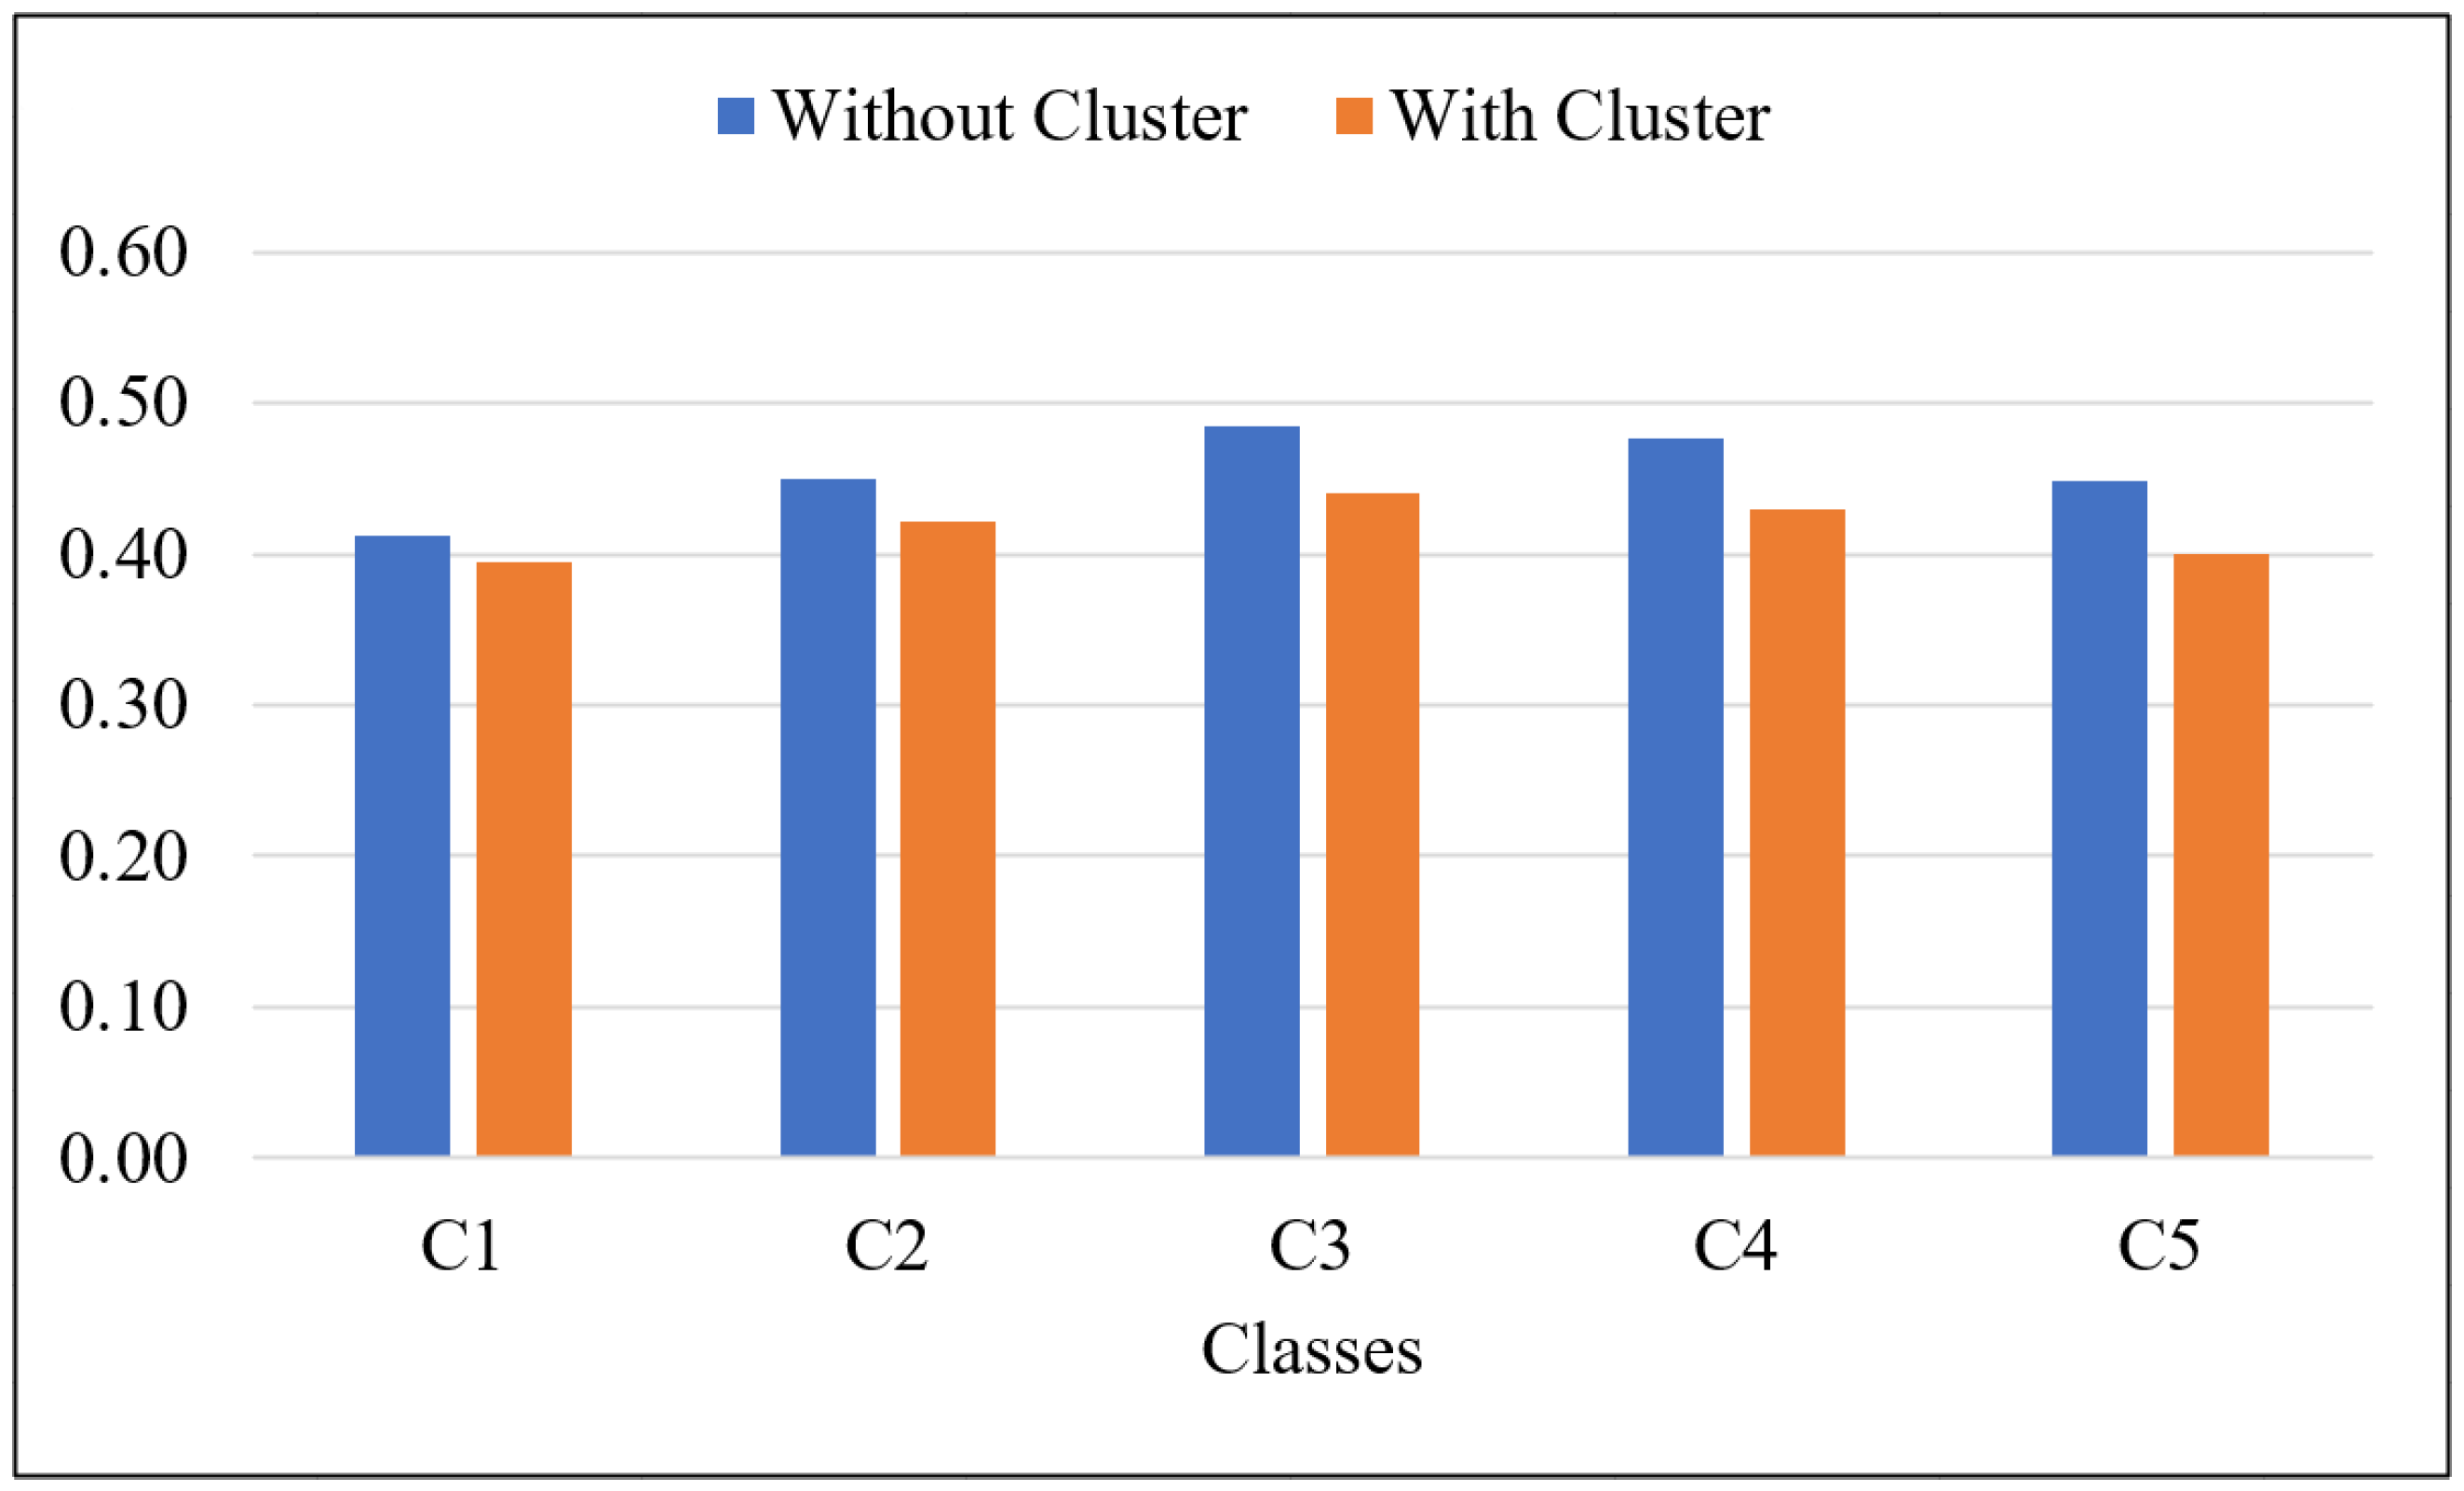
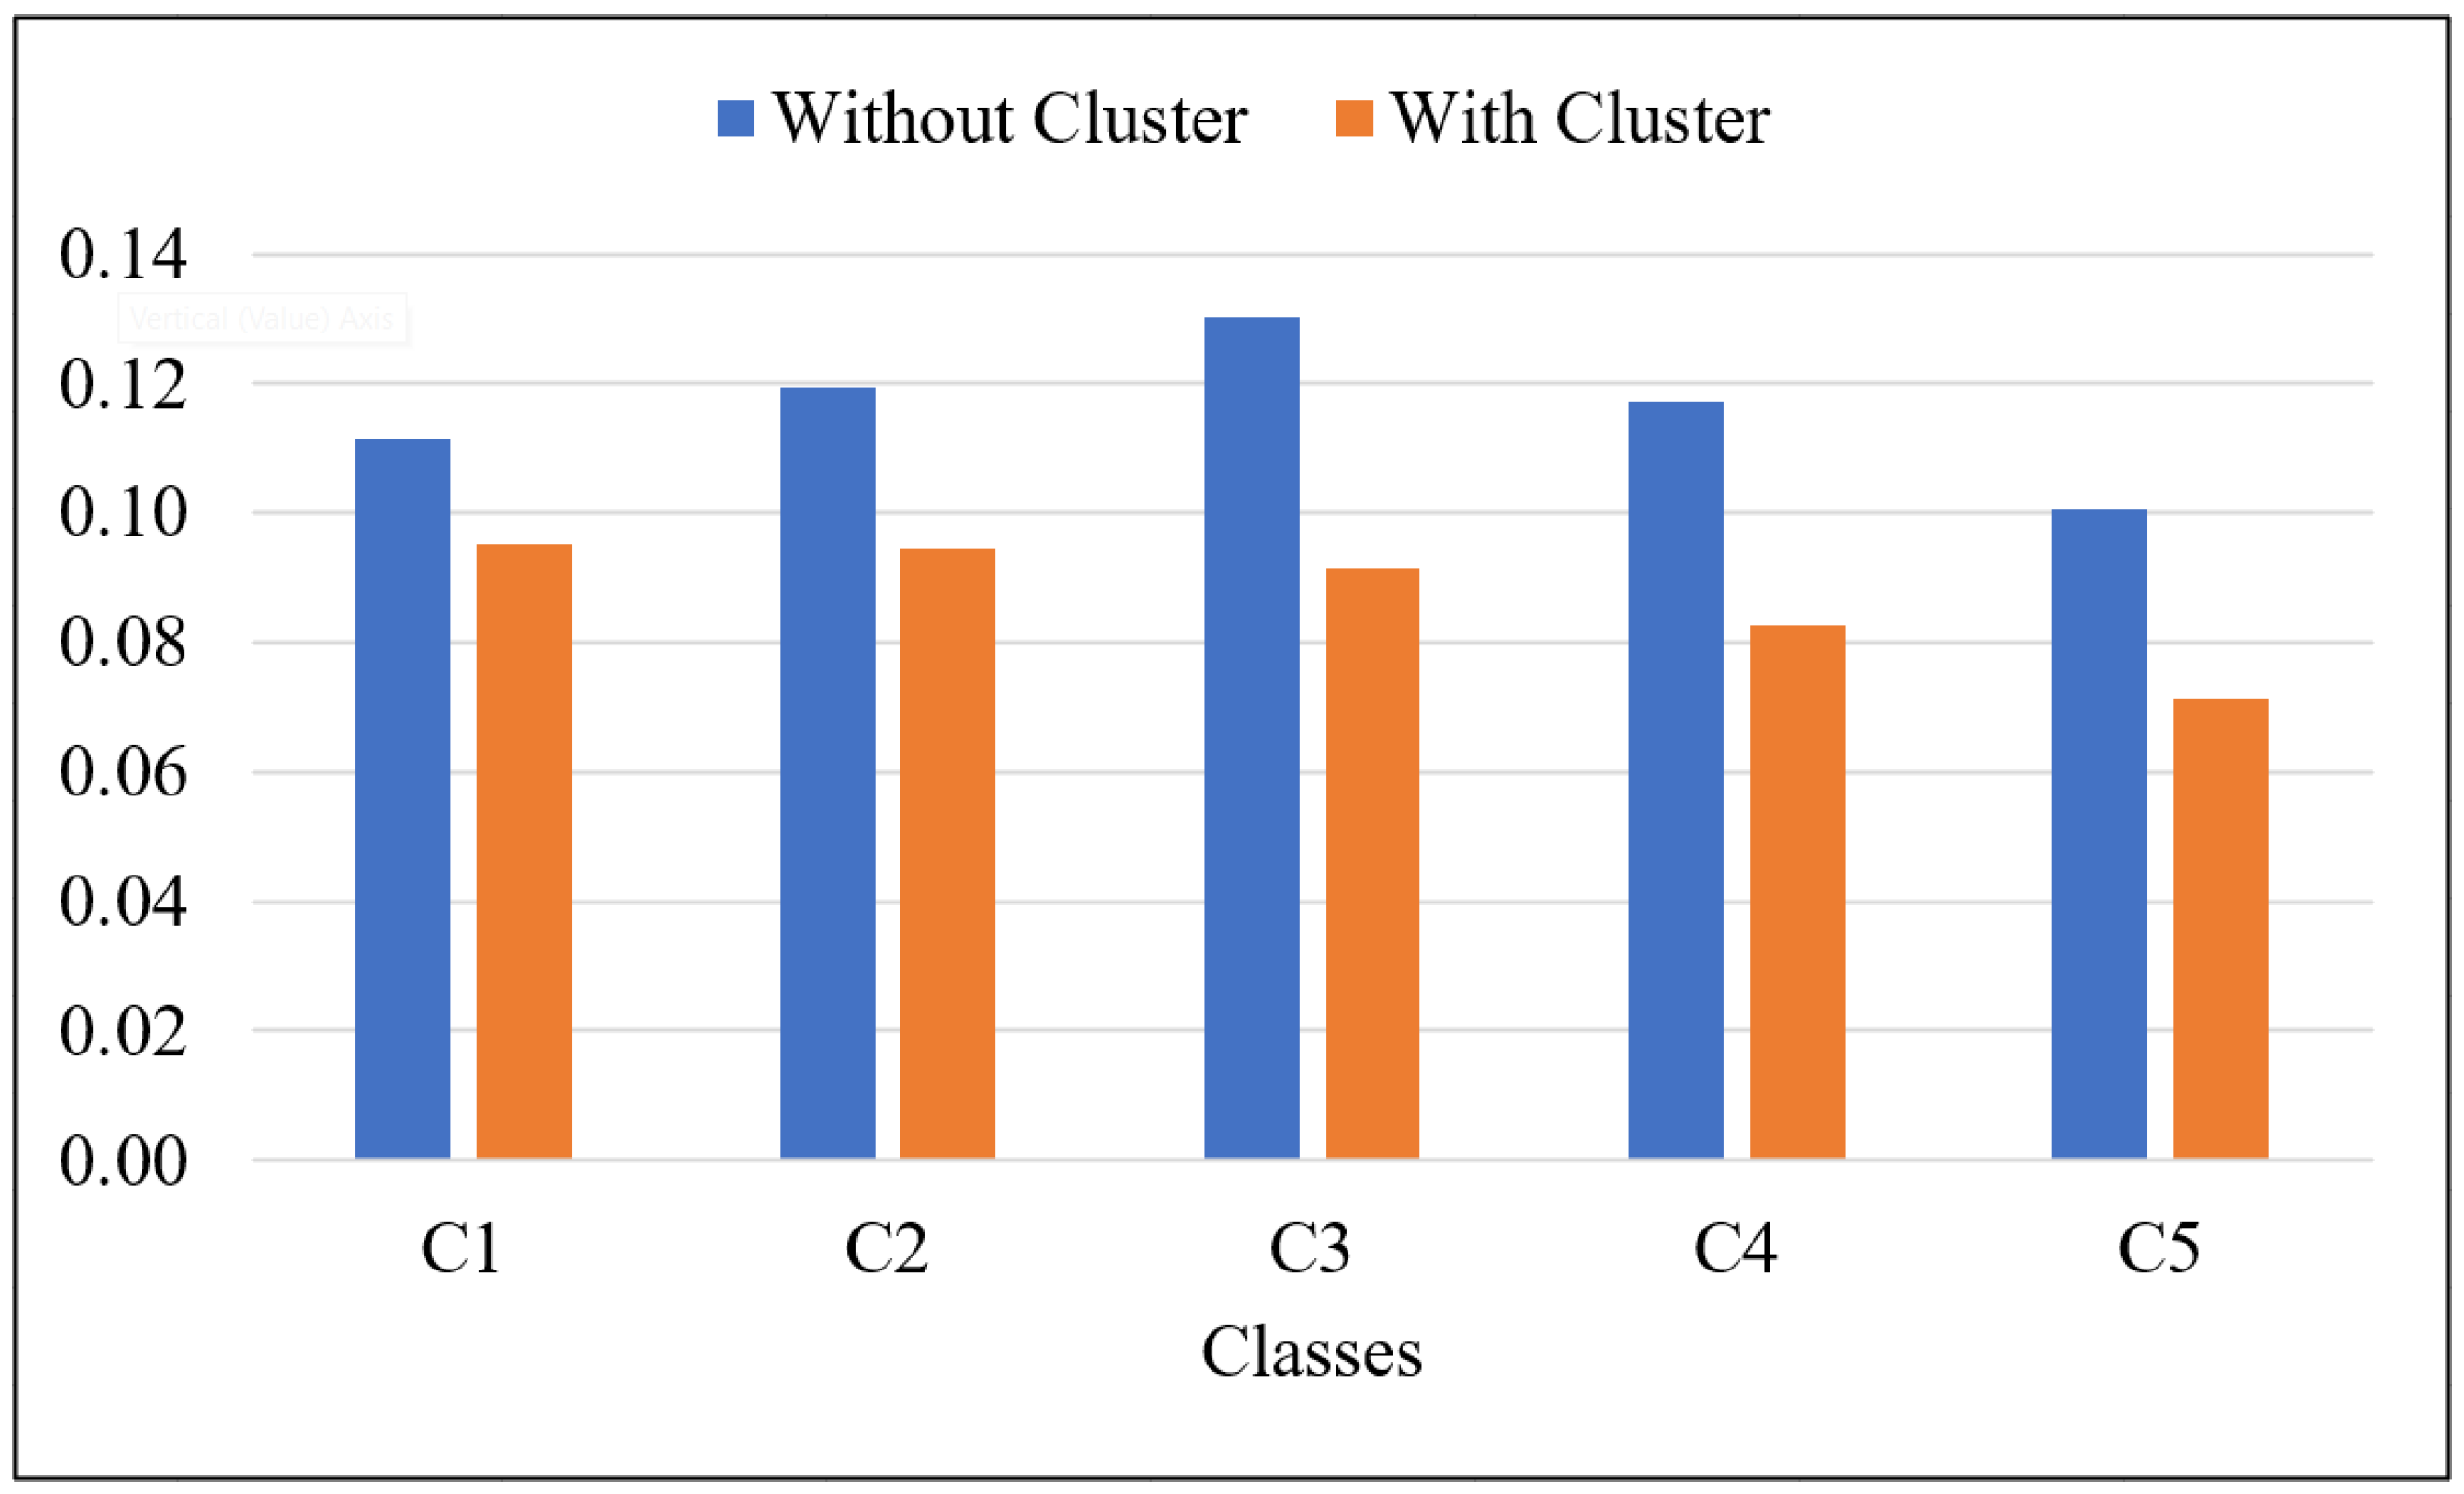
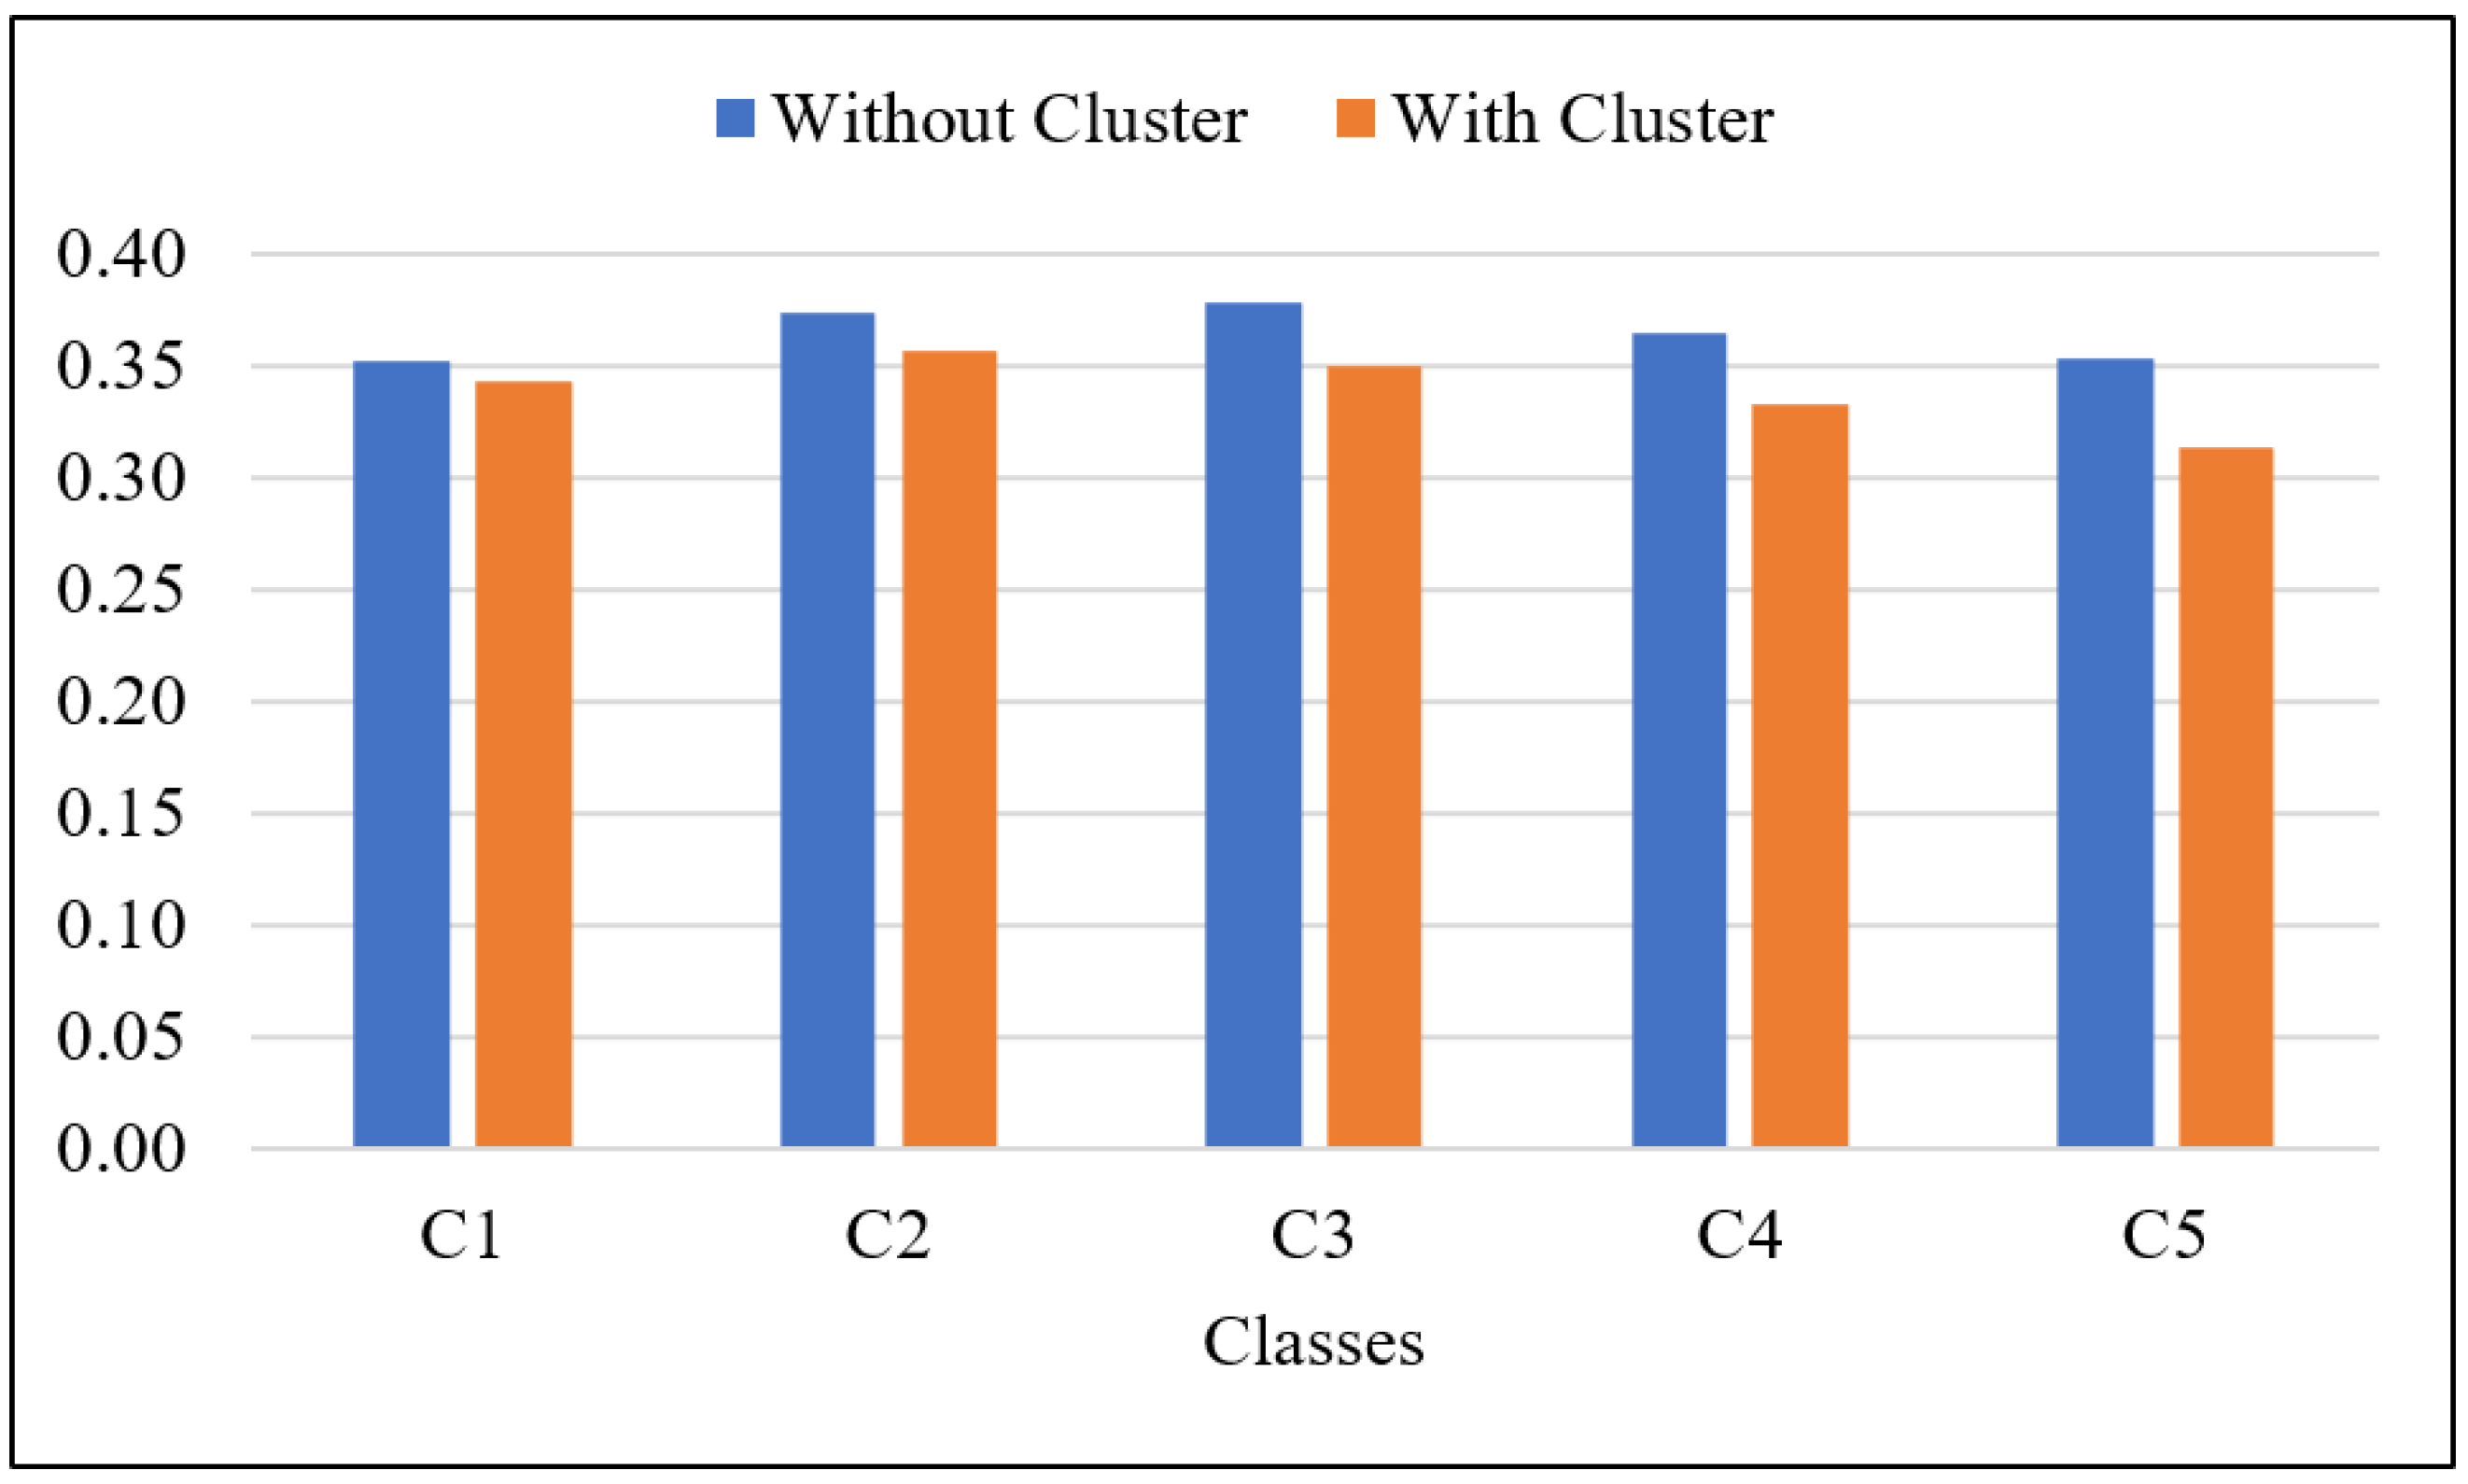
| Without Clustering | With Clustering | |||||
|---|---|---|---|---|---|---|
| ROUGE-1 | ROUGE-2 | ROUGE-L | ROUGE-1 | ROUGE-2 | ROUGE-L | |
| C1 | 0.4121 | 0.1116 | 0.3523 | 0.3942 | 0.0952 | 0.3436 |
| C2 | 0.4492 | 0.1194 | 0.3742 | 0.4219 | 0.0946 | 0.3572 |
| C3 | 0.4850 | 0.1304 | 0.3780 | 0.4397 | 0.0915 | 0.3505 |
| C4 | 0.4761 | 0.1171 | 0.3654 | 0.4296 | 0.0828 | 0.3333 |
| C5 | 0.4487 | 0.1004 | 0.3536 | 0.4007 | 0.0714 | 0.3137 |
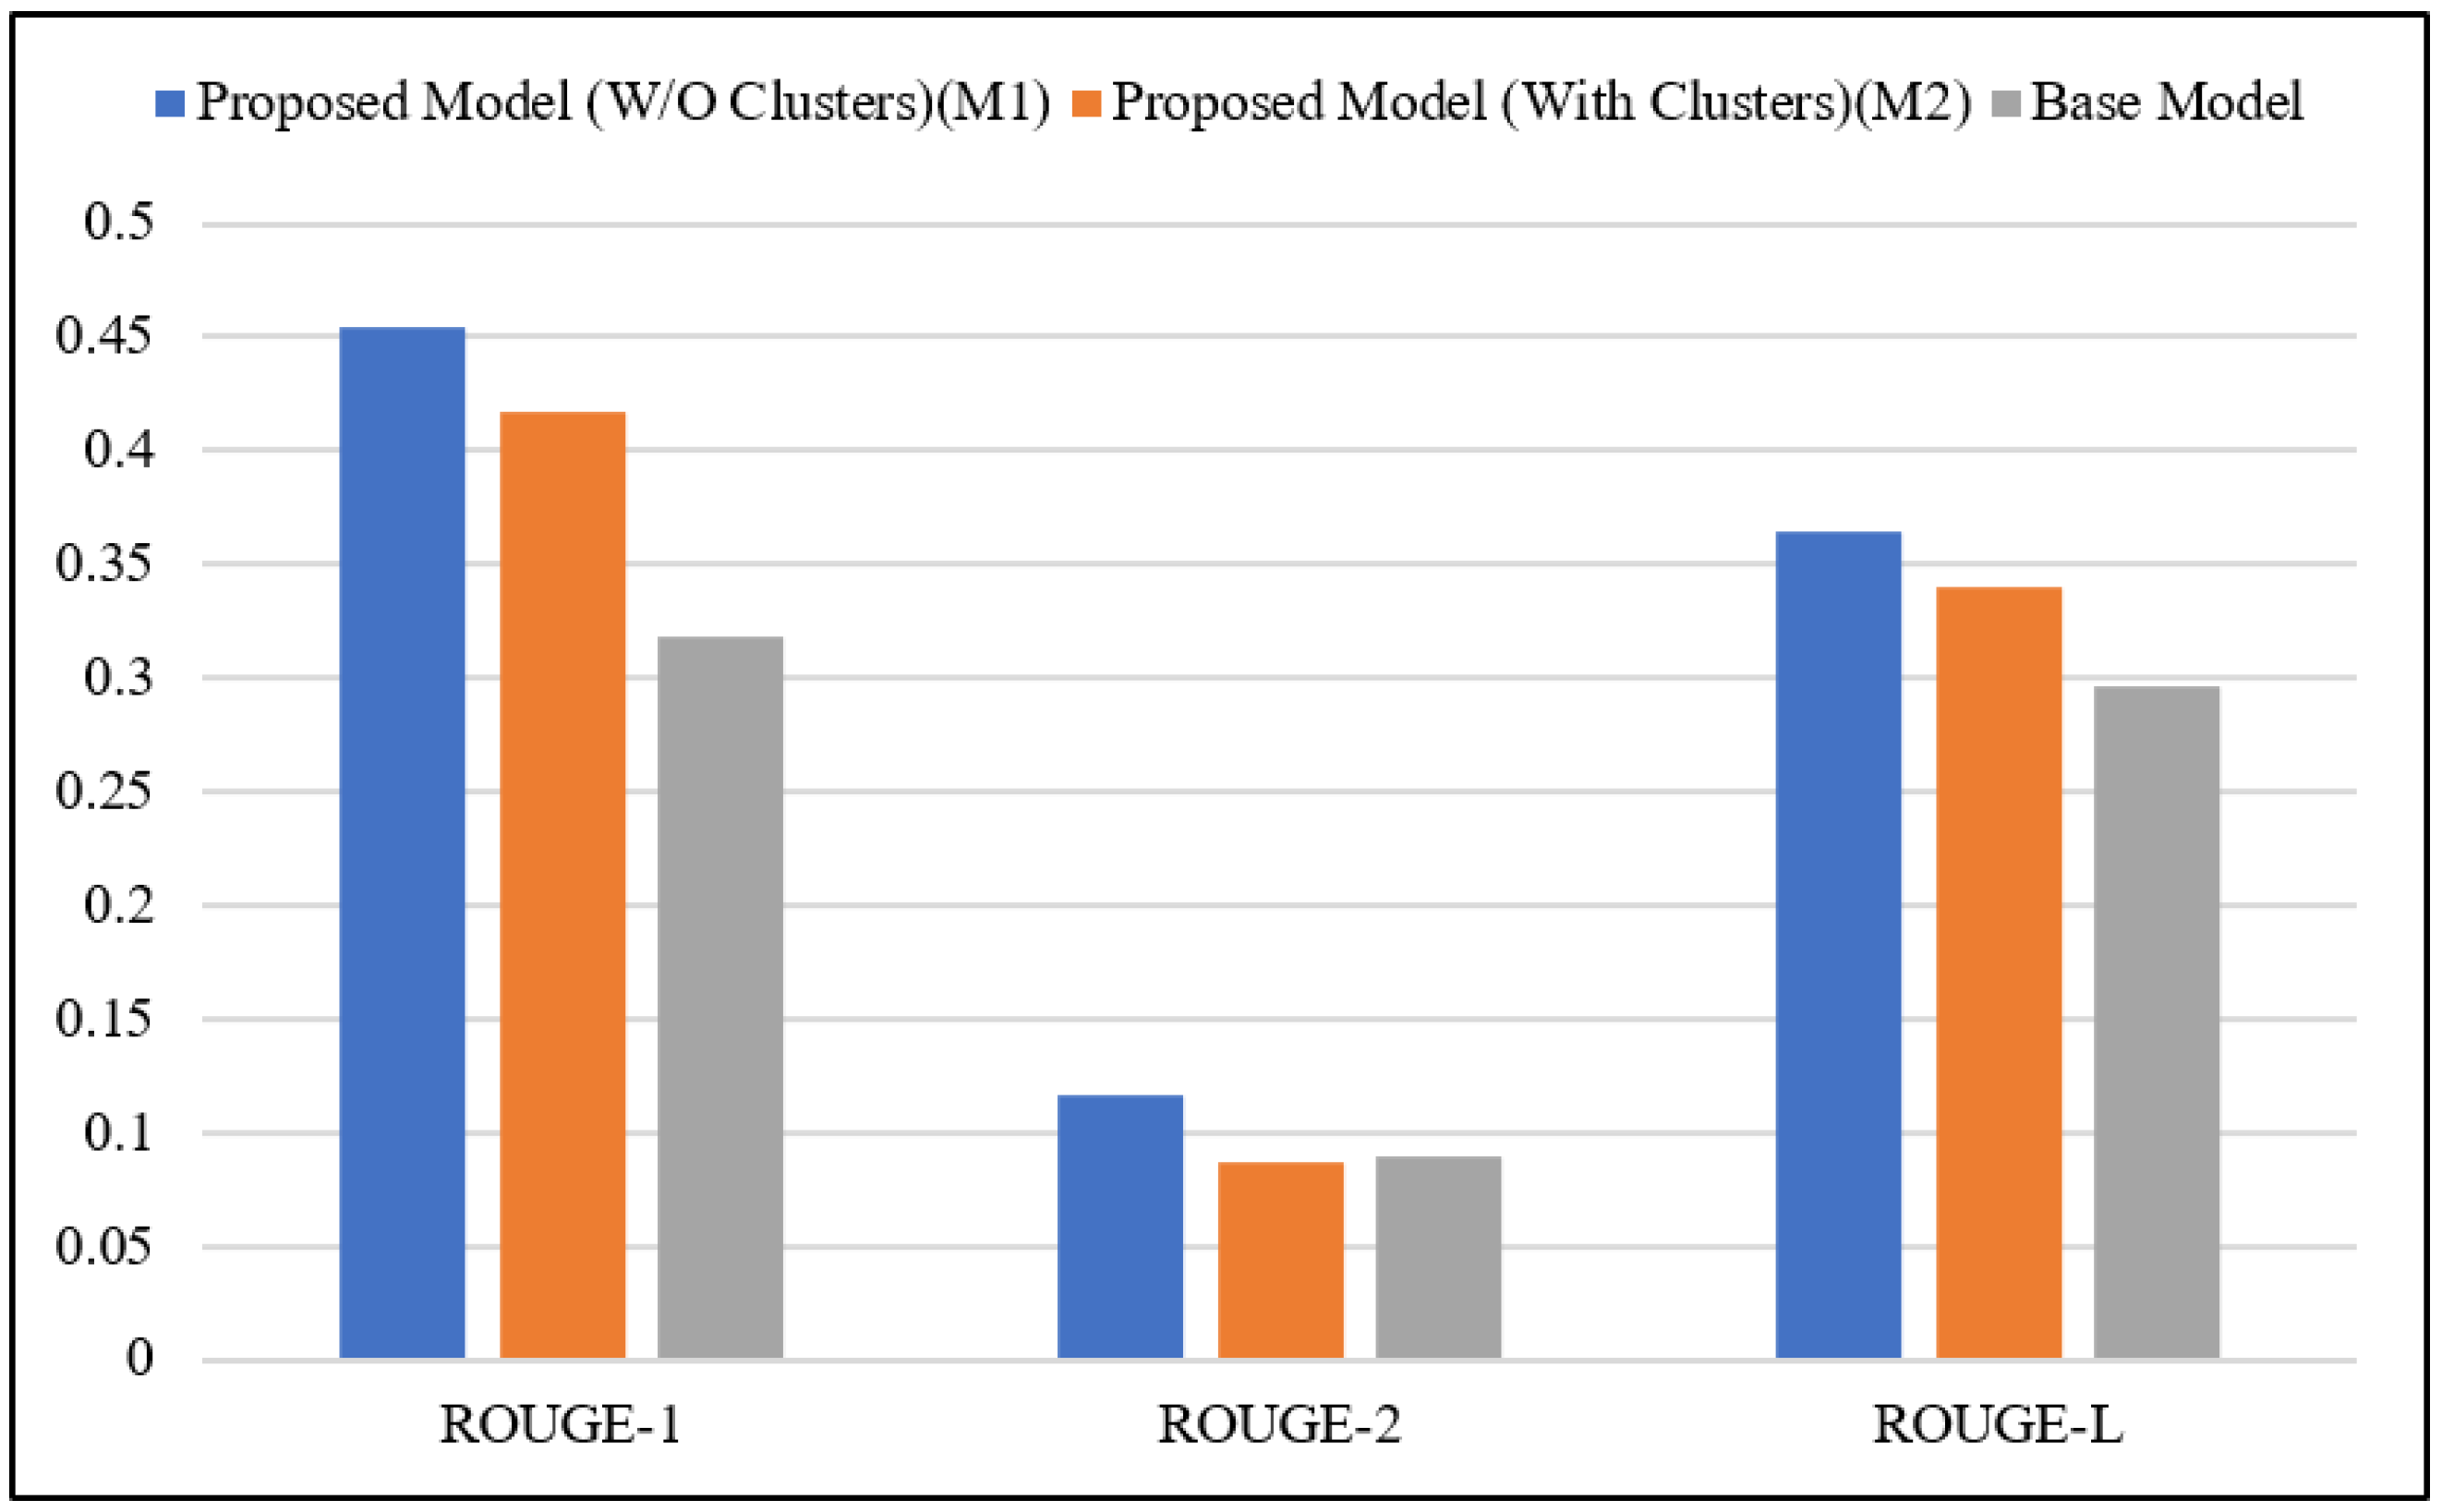
| ROUGE-1 | ROUGE-2 | ROUGE-L | |
|---|---|---|---|
| Without Clustering (M1) | 0.4542 | 0.1158 | 0.3647 |
| With Clustering (M2) | 0.4172 | 0.0871 | 0.3396 |
| BERTEXT [89] | 0.3031 | 0.0871 | 0.2824 |
| BERTEXT + 3gram-Blocking [89] | 0.3037 | 0.0845 | 0. 2828 |
| BERTEXT + 4gram-Blocking [89] | 0.3040 | 0.0867 | 0.2832 |
| MATCHSUM (BERT-base) [89] | 0.3185 | 0.0898 | 0.2958 |
| Without Clustering | With Clustering | Improvement % | |
|---|---|---|---|
| ROUGE-1 | 0.2225 | 0.2622 | 4% |
| ROUGE-2 | 0.0429 | 0.0376 | −1% |
| ROUGE-L | 0.1954 | 0.2216 | 3% |
Disclaimer/Publisher’s Note: The statements, opinions and data contained in all publications are solely those of the individual author(s) and contributor(s) and not of MDPI and/or the editor(s). MDPI and/or the editor(s) disclaim responsibility for any injury to people or property resulting from any ideas, methods, instructions or products referred to in the content. |
© 2023 by the authors. Licensee MDPI, Basel, Switzerland. This article is an open access article distributed under the terms and conditions of the Creative Commons Attribution (CC BY) license (https://creativecommons.org/licenses/by/4.0/).
Share and Cite
Verma, J.P.; Bhargav, S.; Bhavsar, M.; Bhattacharya, P.; Bostani, A.; Chowdhury, S.; Webber, J.; Mehbodniya, A. Graph-Based Extractive Text Summarization Sentence Scoring Scheme for Big Data Applications. Information 2023, 14, 472. https://doi.org/10.3390/info14090472
Verma JP, Bhargav S, Bhavsar M, Bhattacharya P, Bostani A, Chowdhury S, Webber J, Mehbodniya A. Graph-Based Extractive Text Summarization Sentence Scoring Scheme for Big Data Applications. Information. 2023; 14(9):472. https://doi.org/10.3390/info14090472
Chicago/Turabian StyleVerma, Jai Prakash, Shir Bhargav, Madhuri Bhavsar, Pronaya Bhattacharya, Ali Bostani, Subrata Chowdhury, Julian Webber, and Abolfazl Mehbodniya. 2023. "Graph-Based Extractive Text Summarization Sentence Scoring Scheme for Big Data Applications" Information 14, no. 9: 472. https://doi.org/10.3390/info14090472