
Application of Meta-Gaming Concept to the Publishing Platform: Analysis of the Steam Games Platform


1
School of Information Science, Japan Advanced Institute of Science and Technology, Nomi 923-1292, Japan
2
Research Center for Artificial Intelligence and Entertainment Science, Japan Advanced Institute of Science and Technology, Nomi 923-1292, Japan
3
School of Computer Sciences, Universiti Sains Malaysia, Georgetown 11800, Malaysia
*
Author to whom correspondence should be addressed.
†
Current address: School of Information Science, Japan Advanced Institute of Science and Technology, 1-1 Asahidai, Nomi 923-1211, Japan.
Information 2023, 14(2), 110; https://doi.org/10.3390/info14020110
Submission received: 31 October 2022
/
Revised: 11 December 2022
/
Accepted: 6 February 2023
/
Published: 9 February 2023
(This article belongs to the Special Issue Game Informatics)
Abstract
:The digital marketplace has rapidly grown, transitioning the market of video games from physical localized experiences to more networked, expanded, virtual spaces. With a highly competitive business market, platform governance policy allows for the emergence of rapidly growing publishing platforms for digital video games such as the Steam platform. This study demonstrated the importance of the meta-gaming of a platform based on the Steam platform; 18,658 Steam-listed games were acquired and analyzed from the Steam Store, Steam Spy, and Steam achievement databases. A detailed analysis was conducted where key research questions were formulated concerning the game information. This study found that digital badging (i.e., achievements) increases players’ engagement with the publishing platform with good auxiliary data (such as types, rating, releases, and prices). Based on such findings, an opportunity for a new business model is envisioned.
1. Introduction
The video game market has exploded in the digital marketplace as one of the rapidly growing digital industries where it is estimated that 2.3 billion gamers across the globe spent USD 137.9 billion on games in 2018 [1]. Furthermore, as one of the biggest game publishing platforms, Steam had 120 million monthly active users and over 50 thousand games on their catalog as of 2021 (https://backlinko.com/steam-users) (accessed on 1 October 2022). Furthermore, with the transition of the video game market from isolated local experiences to more networked ones, millions more users can access the internet for an expanded universe of gamers’ games and virtual communities. In ever-competitive and expanding business markets, satisfying such a growing consumer base generates massive data. Therefore, data-driven analysis is becoming an essential tool for analyzing consumer behavior, which is helpful for gaming developers, marketers, and streaming platforms [1,2].
As a rapidly growing game publishing platform, Steam’s popularity became well-known for the well-established game studios and independent game developers, typically known as the “indie” developers (or indie studios). The shift of game production using “free” and accessible all-in-one game engines had dominated the market for the development of game products and services [3]; allowing more flexible “open–close” production (The “opened” production game makers are where multiple professional and leisure-based game-making identities were shared and “closed” production was adopted under platform governance policies, proprietary technical requirements, and multisided market strategies [3]) that is being supported by the Steam platform.
Since creating video games is a lengthy and demanding process [4], which could cause management and production problems in the same proportion [5], over-bearing and over-confident developers [5,6], and even requires urgent updates (An urgent update is a software update that fixes problems deemed critical enough not to be left unfixed until a regular cycle update) [7]. As such, a game studio’s financial success often depends on providing exciting experiences and access to a diverse audience, especially in a densely populated platform such as Steam. Such risks were relevant to both small and large development studios, highlighting the importance of knowledge support and understanding the current market situation. Steam’s game review is one of the sources for knowledge wealth on discerning the suitable monetary models to be adopted [8] and everyday needs of players and flaws in existing games [9]. Nevertheless, an epistemological problem has occurred where developers must distinguish between actual contributors to improvements in the game and those that merely express their subjective wishes, especially when community reviews are regarded as a form of user feedback.
Game distribution platforms, such as the Steam platform, are expected to provide continual improvement on the games owned by the players. In such a context, incorporating feedback from players is paramount [9]. However, making sense of the overwhelming volume of data available on such a platform to discern useful or beneficial content is challenging, causing values from insights provided in the feedback to be overlooked by developers and publishers alike [7,9]. As such, helpful attributes on the Steam platform can be a valuable tool to uncover players’ underlying intentions and wishes while identifying beneficial insights into the fast-paced behavior of the digital marketplace.
Considering data analytics in game-playing, the motion-in-mind model has been used to induce subjective association based on the objective matrices in the game-playing process [10]. By adopting the analogy of motions and physical phenomenon, information progression from uncertainty to certainty can be modeled, representing the ratio of difficulty (or challenge) to solve such information [10,11]. Associating such information analysis with the empirical data from the Steam platform may uncover the underlying characteristics of players’ interactions and trends of their game content consumption.
Therefore, this study aims to provide an in-depth empirical analysis of Steam as a publishing platform and game. The data that will be analyzed consists of a combination of public data provided by the Steam Store and a third-party steam statistics gathering service, Steam Spy, which provides valuable metrics, including the total owner’s estimation on Steam. Moreover, one feature of the Steam platform is the Steam Achievements of the games. The developer can set in-game goals for the players to achieve and players are rewarded with an achievement emblem to be showcased on their Steam profile. The achievement can also be extrinsic motivation to motivate players to explore the game’s content [12]. Characterized by Steam games’ achievements and analysis of such achievements from the motion-in-mind perspective, this study attempts to address the following four research questions (RQs):
- Q1:
- What kind of games release and what kind of multiplayer support are available on the Steam platform?
- Q2:
- How are ratings affected by game prices on the Steam platform?
- Q3:
- What kind of developers and publishers are dominant on the Steam platform?
- Q4:
- Do Steam achievements affect game ratings and the types of games?
2. Related Works
In recent years, Steam has become a popular digital game distribution platform that has drawn much attention from academia. First developed by Valve corporation, Steam offered services related to digital distribution, digital rights management (DRM), multiplayer gaming, and social networking [13,14]. It became the world’s largest gaming platform and started with an official release on 12 September 2003. Various game genres were listed on Steam, including first-person shooters (FPS), role-playing, racing, and even independent games for their digital management and distribution (i.e., Indie games). Steam is cross-platform as it supports multiple gaming environments [1]. Steam users interact with it via a local Steam client, available for operating systems such as Windows, Mac, and Linux.
Games can be purchased from the Steam Store or third-party vendors, which are then activated through the Steam platform and playable after logging in on Steam using the Steam client [14]. Payments are available in various currencies and licenses are registered to the user library [13]. Game ownership (or license) and updates will be automatically verified and installed since it is mandatory to play a game through Steam. Users can download and enjoy games from their library with their account information anywhere and at any time with ease.
Several veins of research had been conducted on the Steam platform and database. For example, Windleharth et al. [15] describes a conceptual analysis of all user-generated tags applied on video games in the Steam video game distribution system, where the categories were sorted and compared to the video game metadata schema, where emergent terms beneficial to players were presented and discussed to uncover issues in organization and its implications for the future work. Then, Li and Zhang [16] proposed an alternative approach to understand video game genre classification via preliminary network analysis of the user-generated game tags on the Steam platform using centrality analysis and community detection. Such an approach is intended to lay the ground for and encourage the further investigation of the intertwined connections between genres, inconsistently defined abstraction levels, and different user focuses.
Meanwhile, some researcher focus on the reliability of game reviews and their implications for game development. For instance, Kang et al. [13] identified factors affecting the helpfulness of reviews uploaded by users on the communities by analyzing unrefined game data via data mining techniques, such as classification and regression trees (CART) and a multi-layered perceptron network, to predict the most significant variable in the Steam community’s game reviews. Moreover, Eberhard et al. [17] analyzed a Steam game reviews dataset to discover the aspects of review usefulness from the community point-of-view. They extracted the text bodies from the review, obtained 58 different features from the reviews and separated them into three categories (unhelpful, helpful, and top review) based on the number of votes they received from the community. They found that reviews with more helpfulness votes tend to be longer, use more complex language, and express more negative sentiments as well as being more critical toward the product and going into greater detail about the individual aspect of the game. While these reviews tend to be longer or critical about the product, Eberhard et al. [17] also found that there exists reviews with a large number of helpfulness votes with short or meaningless text where the number of votes are derived from humor or the author being a popular personality. Meanwhile, Lin et al. [14] performed an empirical study on game reviews on the Steam platform to obtain a better understanding of the user-perceived quality in games where the number and the complexity of reviews, the type of information that is provided in the reviews, and the number of playing hours before posting a review were analyzed. It was found that positive and negative reviews provide helpful insights and its association with playing hours was unique between different dimensions of game types while being distinctive compared to the mobile app reviews. Busurkina et al. [18] utilizes Netnography research that adopted a Structural Topic Model (STM) to evaluate game-playing experience based on player reviews on the Steam platform. Seven dimensions were identified, which can be disentangled to generate more knowledge on the evaluation processes and the game itself. The findings extend the comprehension of consumer retention mechanisms and better understand users’ motives and criteria in comparing games.
From another perspective, some work also explored user profiling to determine the players’ specific behavioral characteristics or personalized content delivery. The first comprehensive analysis of hardcore gamer profiling was conducted on a dataset of over 100 million Steam platform users, with over 700,000 hardcore players (users playing more than 20 h per week). It covers over 3300 games using a k-mean clustering algorithm to determine the specific behavioral categories of hardcore players [19]. The results identify six hardcore gamers’ behavioral clusters, where some were related to the sense of motives, consciousness, and openness to experience depending on the game genres played. Meanwhile, Li et al. [12] uncover the underlying structures of the Steam user profiles using exploratory factor analysis to define the player’s preferences and personalized behavior characteristic of the Steam community. Finally, Vihanga et al. [20] conducted a study to explore player population fluctuations within online games to identify weekly seasonality, archetypal weekly population patterns, and relative frequency of these patterns from an extensive Steam player population data of 1963 games. The study identified that 77% of games displayed a recurring weekly pattern clustered into nine diverse weekly player population fluctuation patterns. Out of nine clusters, the two highly similar dominant clusters indicated that most games display a weekly pattern where the player population increase toward the weekend.
Other aspects of the players were also explored in conjunction with the market influences, business model, and decision-support system. Toy et al. [1] discovered patterns among game ownership, genre, and geographical region from a vast Steam database via basic Heat map and clustered Heat map analysis. The result analysis revealed several interesting patterns, trends, and correlations of popular genres in the gaming industry (i.e., action games), shifting of current market practice and strategies (i.e., early access), and potentially leading to improved markets, business models, and a more responsive market in general. Ranti et al. [21] proposed a k-prototypes algorithm that integrates both k-means and k-modes algorithms to cluster mixed numeric and categorical attributes of Steam’s user behavior telemetry data (40% or more of their total accumulative playtime) from the World of Warcraft game, resulting in three groups of a total of 15 clusters. It was found that there is a good correlation between sales data from the sample and actual sales data reported by game development companies. Furthermore, better insights into the play patterns of the games bought and played by steam users, patterns about the user themselves, and the importance of differentiating users (i.e., doubling the player base does not double the revenue). Furthermore, Wang et al. [22] proposed a solution for a new video game recommendation system for the Steam platform called STEAMer, which utilizes the Steam user data and applies additional user data in conjunction with a deep autoencoder learning model to generate potential recommendations. Performance evaluation included comparing STEAMer with a baseline deep neural network-based system. The results showed that adding additional public Steam user data has a noticeable and positive effect on the game recommendations with a noticeable increase in the test metrics over the traditional deep neural network using the same features. Furthermore, Ahmad Kamal et al. [23] implemented a genre-based and topic modeling model in a recommender system to predict the ratings of games using public Steam dataset. Though the results show that the genre-based model outperforms topic modeling model, it does not outperform the model performance from the previous research. Therefore, they concluded that genre is not a suitable parameter for recommending games.
Other related research on the Steam data and platform includes determining the network feasibility of the Steam In-Home streaming services in comparison to the regular network infrastructure [24], discovering security vulnerability to serve as a guideline for computer forensics for Steam game platform [25], and determining the impact of shifts of business model changes [8], based on the analysis of Steam review data. However, limited studies were conducted on the Steam platform, focusing on game-level analysis, which provides valuable knowledge and intuitive insights for the game developer.
Studies on game-level analysis were also conducted on the Steam platform focusing on different perspectives. Some studies explored the Steam platform in conjunction with other distinct platforms (i.e., Twitch.tv that focuses on streaming) and their influences on a specific game experience. For example, Gandolfi [26] visualized the dynamics and trends of game platform analysis mediated by Gephi, a network-oriented software, on the role-playing game Dark Souls 3, along with an exploratory counter-example using the action game The Division. It was found that such a media trend generates two different reactions: a positive one when the game is no longer just a game but a performance to watch and a negative one when the interactive affordances were questioned. Meanwhile, Lin et al. [27] conducted an empirical study on the characteristics of 1182 Early Access Games (EAGs) where the interaction between players and the developers of EAGs, the Steam platform during and after leaving the early access stage, and the tolerance of players of the quality of EAGs were analyzed. The study found that EAGs tend to be “indie” games (adopted by smaller development studios) and lower reviews were written during the early access stage compared to the review after leaving the early access stage, whereas the rating is vice versa. Bailey and Miyata [28] conducted data mining on the Steam “achievement” data of the video games in the Steam platform to discover trends in the game completion rates and correlated it to the factors outside of the game’s length. The study found that the completion rate can indicate the rate of players completing the game content and provide a benchmark for future scoping decisions in individual projects, which influences game development decisions and success rates.
Li et al. [29] analyze and evaluate the playability of video games by mining players’ opinions from their reviews guided by the game-as-system definition, where sentiment analysis, binary classification, multi-label text classification, and topic modeling are sequentially performed. A total of 99,993 player reviews on the Steam platform were evaluated, which focused on the collective opinions relative to the maintenance and evolution of video games and helped game developers to understand it. Ullmann et al. [30] investigated the aspects that describe a high-rated game through 200 video game projects on the Steam Platform. Though genre, graphical perspective, game modes, and platforms do not correlate to the ratings of the games, the study found that games from smaller teams are often linked to higher ratings. Additionally, they analyzed post-mortems discussed by the developers of high-rated games. Furthermore, [31] conducted a study to predict whether a game on Steam is on discount or not using machine learning methods through data collected from the Steam database. The study compared Logistic Regression and Random Forest Classification and concluded that Random Forest reaches the top performance with 79.5% accuracy. This model will benefit players by allowing them to purchase a game at the right time while saving their money and for game publishers to optimize their discount strategies. Meanwhile, Badoni et al. [32] conducted an observation based on a survey from 315 participants regarding which aspect of the game (graphics, gameplay, mechanics, and audio) is the most attractive among various desktop and mobile games. Based on the survey result, gameplay and graphics are mutually beneficial. In summary, the related works and their contribution summary relative to the current study are provided in Table 1.
Relative to the physical motion, the motion-in mind-concepts furthers the concept by adopting a motion formulation to describe the entertainment aspects of games from the objective and subjective standpoints [11], based on the basic assumption of move selection, game progression, and the ratio of winning (m) and challenge (m) being equalized () [10]. The motion-in-mind model had been previously adopted to identify meta-gaming elements from the perspective of game evolution and its influence on culture [33], linking entertainment with the game-tree search processes [34], educational structure [35], process fairness [36], defining game features that cause it to be addictive [37], and bridging physical comfort to comfort in the mind [38]. More recent work adopts the motion-in-mind concept to identify the mechanisms to retain entertainment in long-term arcade games [39] and key entertainment aspects (challenge, anticipation, and unpredictability) between different games in the God of War series [40]. This previous study showed that the motion-in-mind concept provides a versatile metric that is suited for analyzing varying aspects of meta-gaming elements of the Steam publishing platform in addition to other conventional analyses, which serves as the primary motivation of the study.
3. Methodology
3.1. Motion-in-Mind
Considering the zero-sum assumption in game playing (zero-sum assumption can be defined as the gain or loss utility of one player that is precisely equalized by the losses (or gains) utility of its opponent [41]), the essence of uncertainty can be determined [11]. In the schedule of reinforcement of the operant condition originally designed by Skinner [42], a variable-ratio schedule is a reinforcement schedule where the response is reinforced after an unpredictable number of responses, creating a steady, high rate of responding [43]. From a reward-driven standpoint, this condition is a typical example of a reward system based on a variable ratio schedule found in stochastic games (such as gambling and lottery games).
Meanwhile, mind sports games (such as chess and Go) are essentially stochastic games when applying the move selection model [10]. This condition implies that a game is characterized by a reward of a variable-ratio reinforcement schedule. In essence, the game is characterized by the reward function, a variable rate (denoted as ) of the reinforcement schedule. Then, the velocity v (win rate) and mass m (win hardness) of the motion-in-mind model are provided by (1).
Table 2 describes the analogy of the motion-in-mind model from the physics and games context. Note that there is a distinctive computation of the v for the board and scoring games as previously defined by Iida and Khalid [10]. In scoring games, the success rate is defined as , where G and T are the average successful and total scores, respectively. Meanwhile, the success rate in a board game is defined as where B is the average branching factor and D is the average game length.
The notion of energy conservation was proposed by [11], which provided a deeper knowledge of games’ engagement and addictive mechanisms, and was enabled by the objectivity and subjectivity perspectives [11]. The formulation of momentum in the game and potential energy in the mind are provided by (2) and (3), respectively. Then, based on the conservation of energy in the mind, provided by (4), the momentum in mind can be derived, which is associated with the player’s engagement, provided by (5). Applying (5) by assuming the formulation of where the subjective reward is provided by (6).
The relationship between the objective velocity v and subjective velocity can be established. Let be the reward function over various masses for the perfect player, which corresponds to the objectivity provided by (7). Then, is a reward function over various m for a player with ability parameter k, which is provided by (8). The ability parameter k stands for the strength of the players in the competitive game context or error-tolerance in the social or non-competitive context. For example, there is no error tolerance for the perfect player .
The notion of potential energy in mind was initially discussed by [10], provided by (3). Considering the velocity derived from the reinforcement schedule with frequency N and its generalization, the objective reinforcement refers to the potential energy in mind of the perfect player . Otherwise, the subjective reinforcement refers to the potential energy in the minds of other players . A game would produce its potential energy in the field of play (hence, called potential energy of play) by which players would feel engagement or reinforcement.
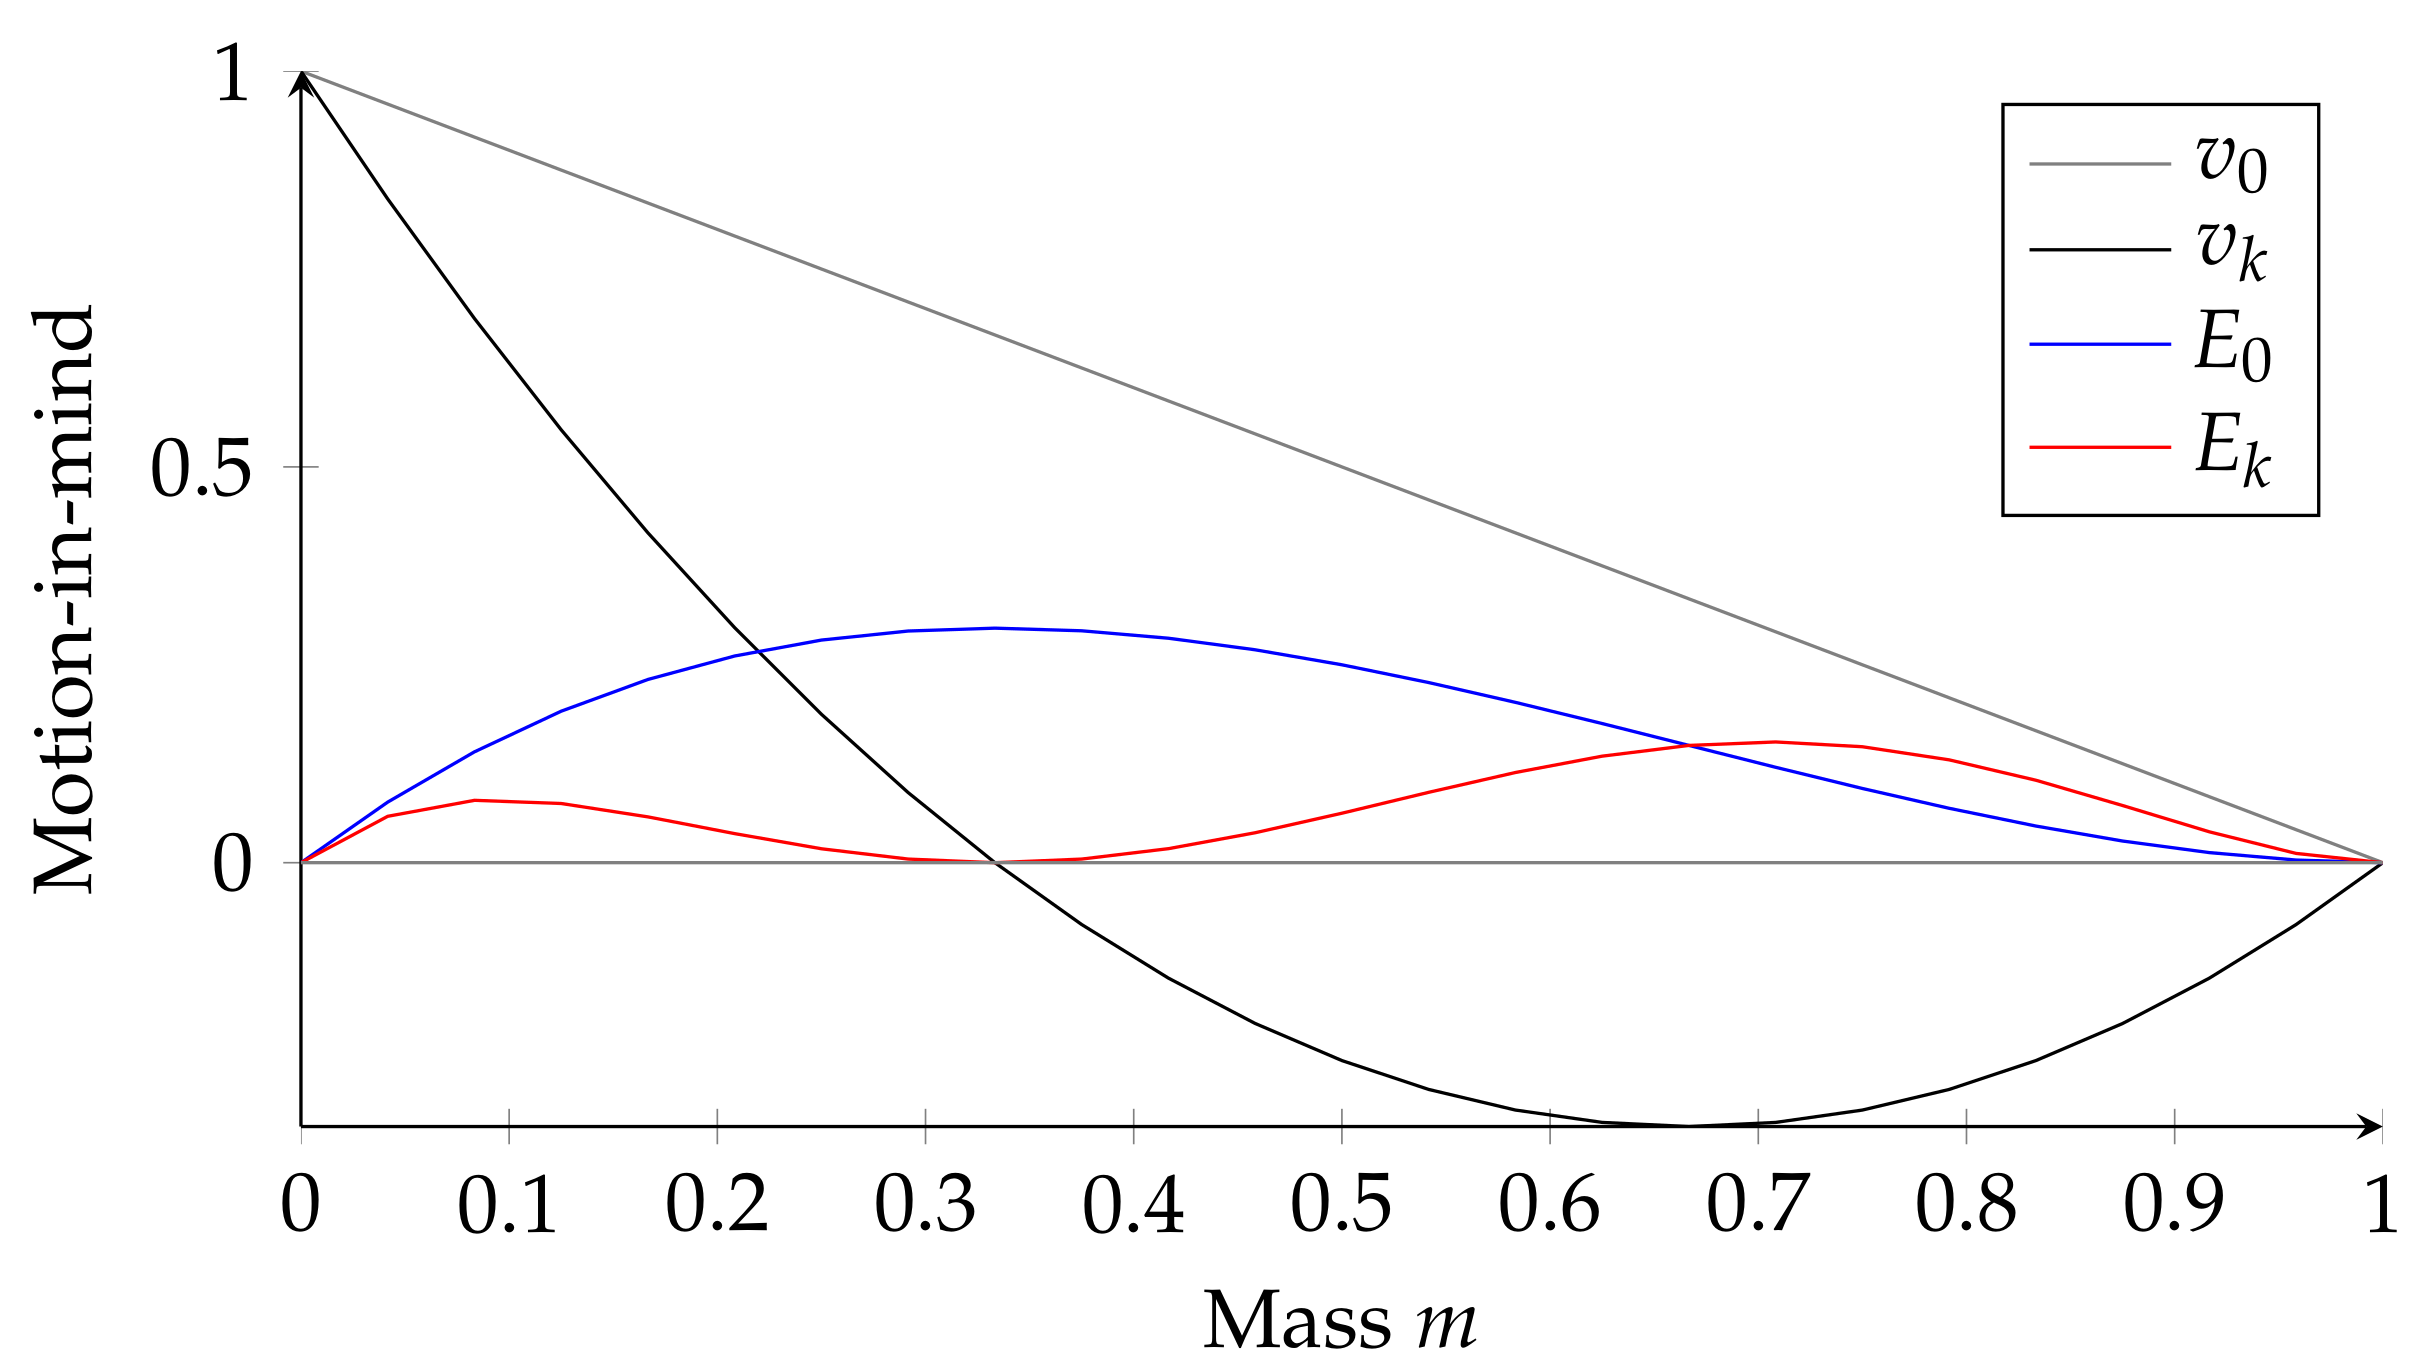
Figure 1 illustrates the objective and subjective reinforcement when . In behavioral psychology, the term “reinforcement” refers to an enhancement of behavior. In this study, such a term was used as positive meaning, where greater reinforcement provides people with a stronger interest to stay in the event under consideration. In addition, reinforcement depends on the player’s ability in the game context. Reward function represents a player’s model or their sense of value. When assuming , holds at where the objective reinforcement is maximized. This condition implies that the most comfort point (peak of ) is not included in the learning context. Therefore, it is highly expected to have . Furthermore, Go () is still not yet solved. Hence, it is expected that holds.
A significant difference between objective reinforcement and subjective reinforcement, for instance, , may characterize the learning process since it represents the process of determining the truth; in some way, it is like solving a given problem (i.e., game-theoretical value in a game solving context). As such, the comfort of learning will be optimized when is maximized at its peak when . Such a situation indicates that the theoretical success rate would be a peak point to feel comfortable in the non-competitive game or learning context. On the other hand, people would feel uncomfortable (e.g., dull/anxiety in the sense of flow theory [44]) when the rate is much lower than this point.
Figure 2 indicates that increases as the mass becomes larger at and decreases as the mass becomes larger at . Subjective reinforcement was maximized at its peak in the non-competitive game context such as in puzzle solving (or solving comfort), implying that puzzle solving will be highly engaged at a success rate of . is maximized at its peak at when where the game under consideration is extremely engaged due to its high competition level (called competitive comfort).
Considering these quantities to provide a metric for measuring the impacts of digital badging (i.e., game achievement) of the games on the Steam platform, it is likely that it was optimized as a meta-gaming system. In such a case, the is maximized where the equivalent measures of the success rate would be . This situation implies that the potential and existing games or creators are highly engaged/reinforced since it provides a suitable condition associated with the comfort of competition and learning. As such, is maximized at its peak when where learning comfort is optimized. Meanwhile, is maximized at its peak when where the game under consideration is extremely engaged due to its high competition level.
Consequently, Johnson et al. [45] argued that understanding rewards, when and how much to be deployed, would drive in-game behavior and act as an indicator for the player’s progress. In the meta-gaming context, such a condition would likely be similar to where a player’s cognition was focused on elements about a game’s external influences instead of the game playing experience [46,47], which was observed in the Steam platform. Previous meta-gaming solutions focus on the adopted meta-gaming approach to automate a reactive game balancing into sophisticated balance targets that were defined beyond a simple equal win requirement [48]. Meanwhile, Reis et al. [49] showed that strategy predictions and exploiting knowledge outside of a game could allow players to gain an advantage and improve the game outcome. This study is interested in discovering the underlying mechanism behind the Steam achievement indicator based on the above-mentioned research questions from the perspective of game analytics and the motion-in-mind model. Such insights would benefit academicians and game developers in their potential future projects and creative ideation in navigating the current highly competitive game market.
3.2. Data Collection and Pre-Processing
The data were collected from three sources: Steam Store, SteamSpy, and Steam IUserStats. A customized data collection script was developed using Python to automatically extract all the games available on Steam Store and SteamSpy on 10 August 2022. Due to the large quantity of data, the process took three days to be completed. The following information is the data sources collected from the three sources:
- Steam Store Data: These data are consist with the information about the games listed on the Steam platform.
- Steam Achievement Data: These data consist of information of the global achievement percentages for apps on Steam.
- SteamSpy Data: These data consist of useful metrics such as estimation for total owners of each game on steam.
The Steam Store and Steam Achievement data were collected using the Steamworks application programming interface (API) provided by the Steam platform, while the SteamSpy data were collected using SteamSpy API. Both APIs are publicly available to access the databases and information available on both servers. Table 3 shows the summary of collected data.
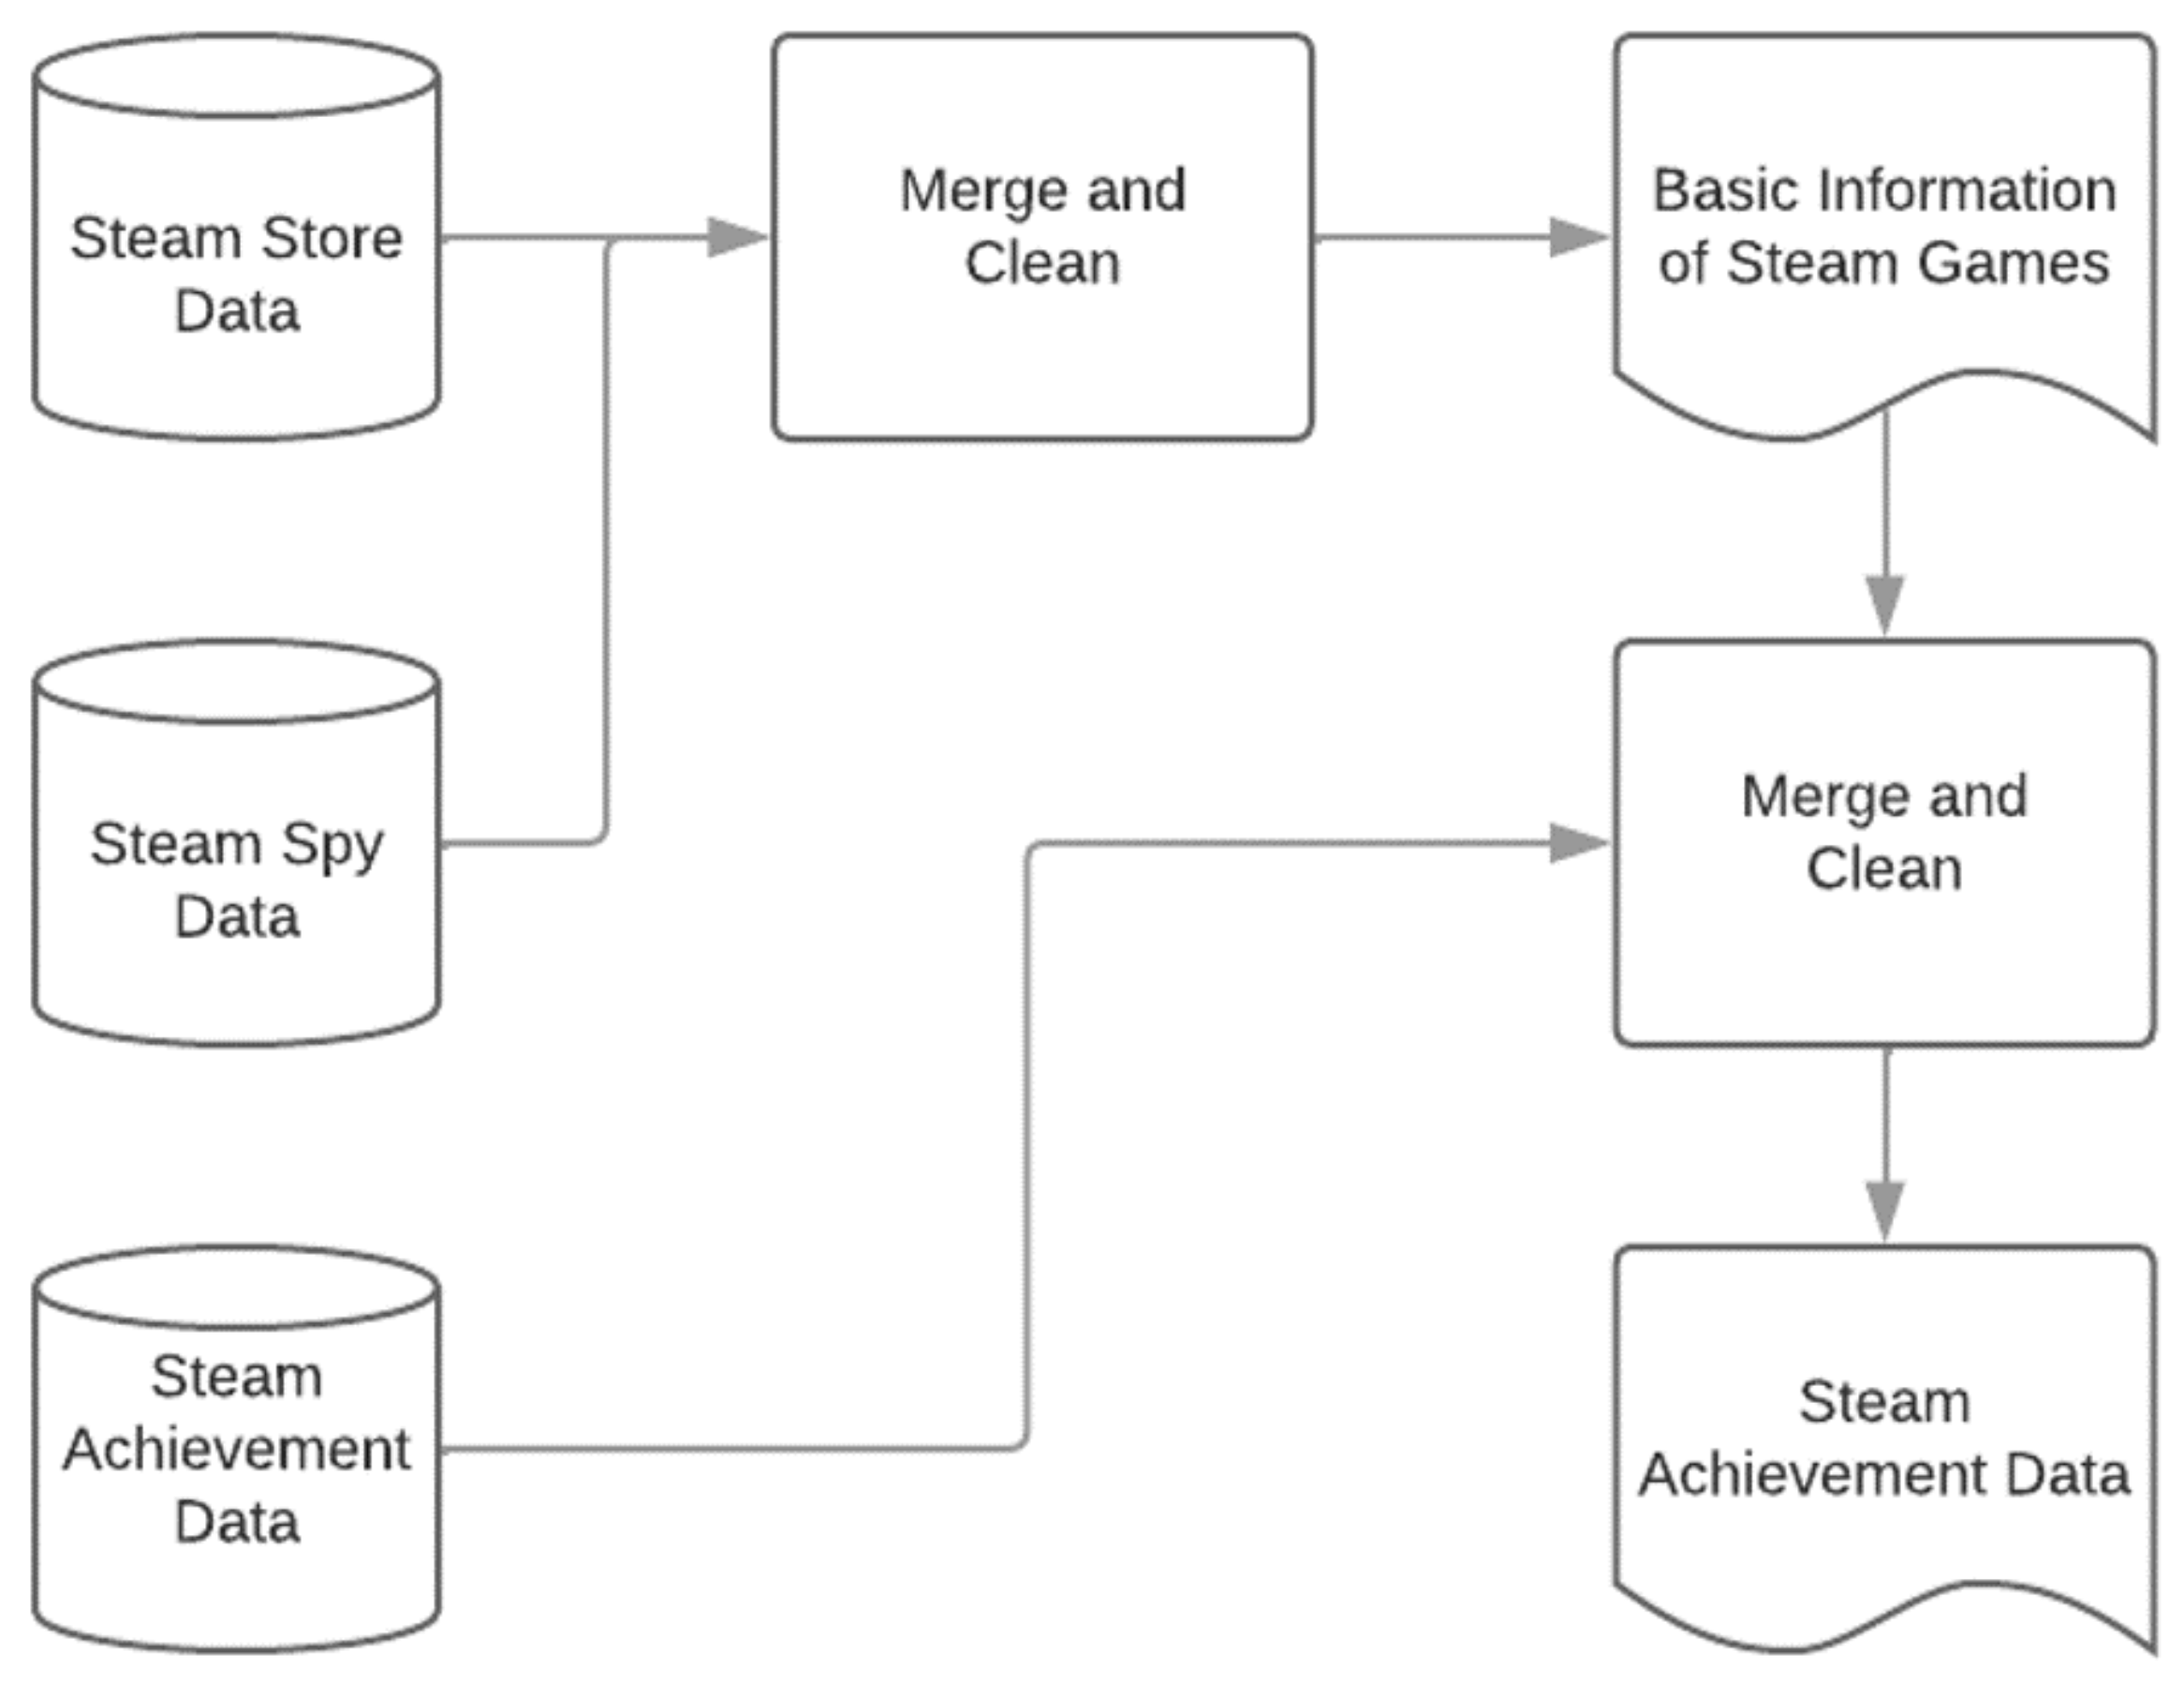
There are 57,155 pieces of Steam games store information and 23,774 Steam global achievement data were extracted, but, since the data still contain incomplete or missing information, data cleaning is necessary. A Python script was utilized in the data processing and merging, depicted in Figure 3. The figure showed the overview of the steps involved in pre-processing the data before in-depth analysis, which is explained as follows:
- Cleaning/Processing: this process includes removing duplicate rows, columns with more than 50% missing values, removing unnecessary columns (such as screenshots, movies, support_info, etc.), and transforming column information (such as price, categories, achievements, etc.).
- Merge Data: this process merged the data based on the appid column. The appid columns are the games’ unique IDs on the Steam store’s listings. Such a column is the bridge between the different data sources.
We processed the data into three datasets that will be analyzed in order to answer our research questions. The following are information of each dataset after merging:
- Basic information of Steam Games: These data consisted of information combined from the Steam Store and SteamSpy data that contain 49,227 rows of Steam Games. These data consisted of the Steam games’ appid, name, developer, publisher, release date, price, owners min–average–max, categories, tags, positive, negative, and rating. These data include games without Steam achievements.
- Steam Achievement Data: These data consisted of 27,586 rows of Steam Games with their achievement data. These data consist of the same information as the above data with the addition of a game’s achievement names and their global percentages. These data exclude games without Steam achievements.
4. Results and Analysis
In order to determine the current state of the Steam platform, we analyze the trends of Steam games and their developers on the Steam platform by studying the number of games released each year and their developers. Then, in-depth analysis relative to the research questions were conducted to the uncover hidden trend of the Steam achievement data.
4.1. What Kind of Game Releases and Multi-Player Support on the Steam Platform?
The first aspect explored the trend of game releases on Steam. Figure 4 shows the number of game releases, indie games ratio, and new game developers on the Steam platform from 2006 to 2022. The number of games released on Steam steadily increased every year except in 2010 and 2019 and had the highest increase in 2014 (1498 games released, 1079 or 350% more games than in 2013) after Steam introduced the Steam Early Access program in March 2013 [50]. The decrease that happened in 2019 possibly happened because of a games’ discoverability issue [51,52], where there were changes in Steam policies [52] and also the arrival of Epic Games Store [51]. Though Steam has released Steam Labs (https://store.steampowered.com/labs) (accessed on 1 October 2022) that tackled the discoverability issues, no results were reported in achieving such an outcome [53]. The number might be unreliable because changes in early access games on Steam can affect the actual release numbers on the year [54]. In 2017, Steam launched Steam Direct [55] to replace Steam Greenlight as a new submission path designed to provide a more streamlined, transparent, and accessible way for game developers to publish their games to Steam, which resulted in 340% more indie games released in 2018 than the previous year. Steam Direct allows game developers to publish their games without persuading fans or Steam users to vote on their game, provided they can afford the USD 100 recoupable fee and meet Steam’s essential criteria of legality and appropriateness.
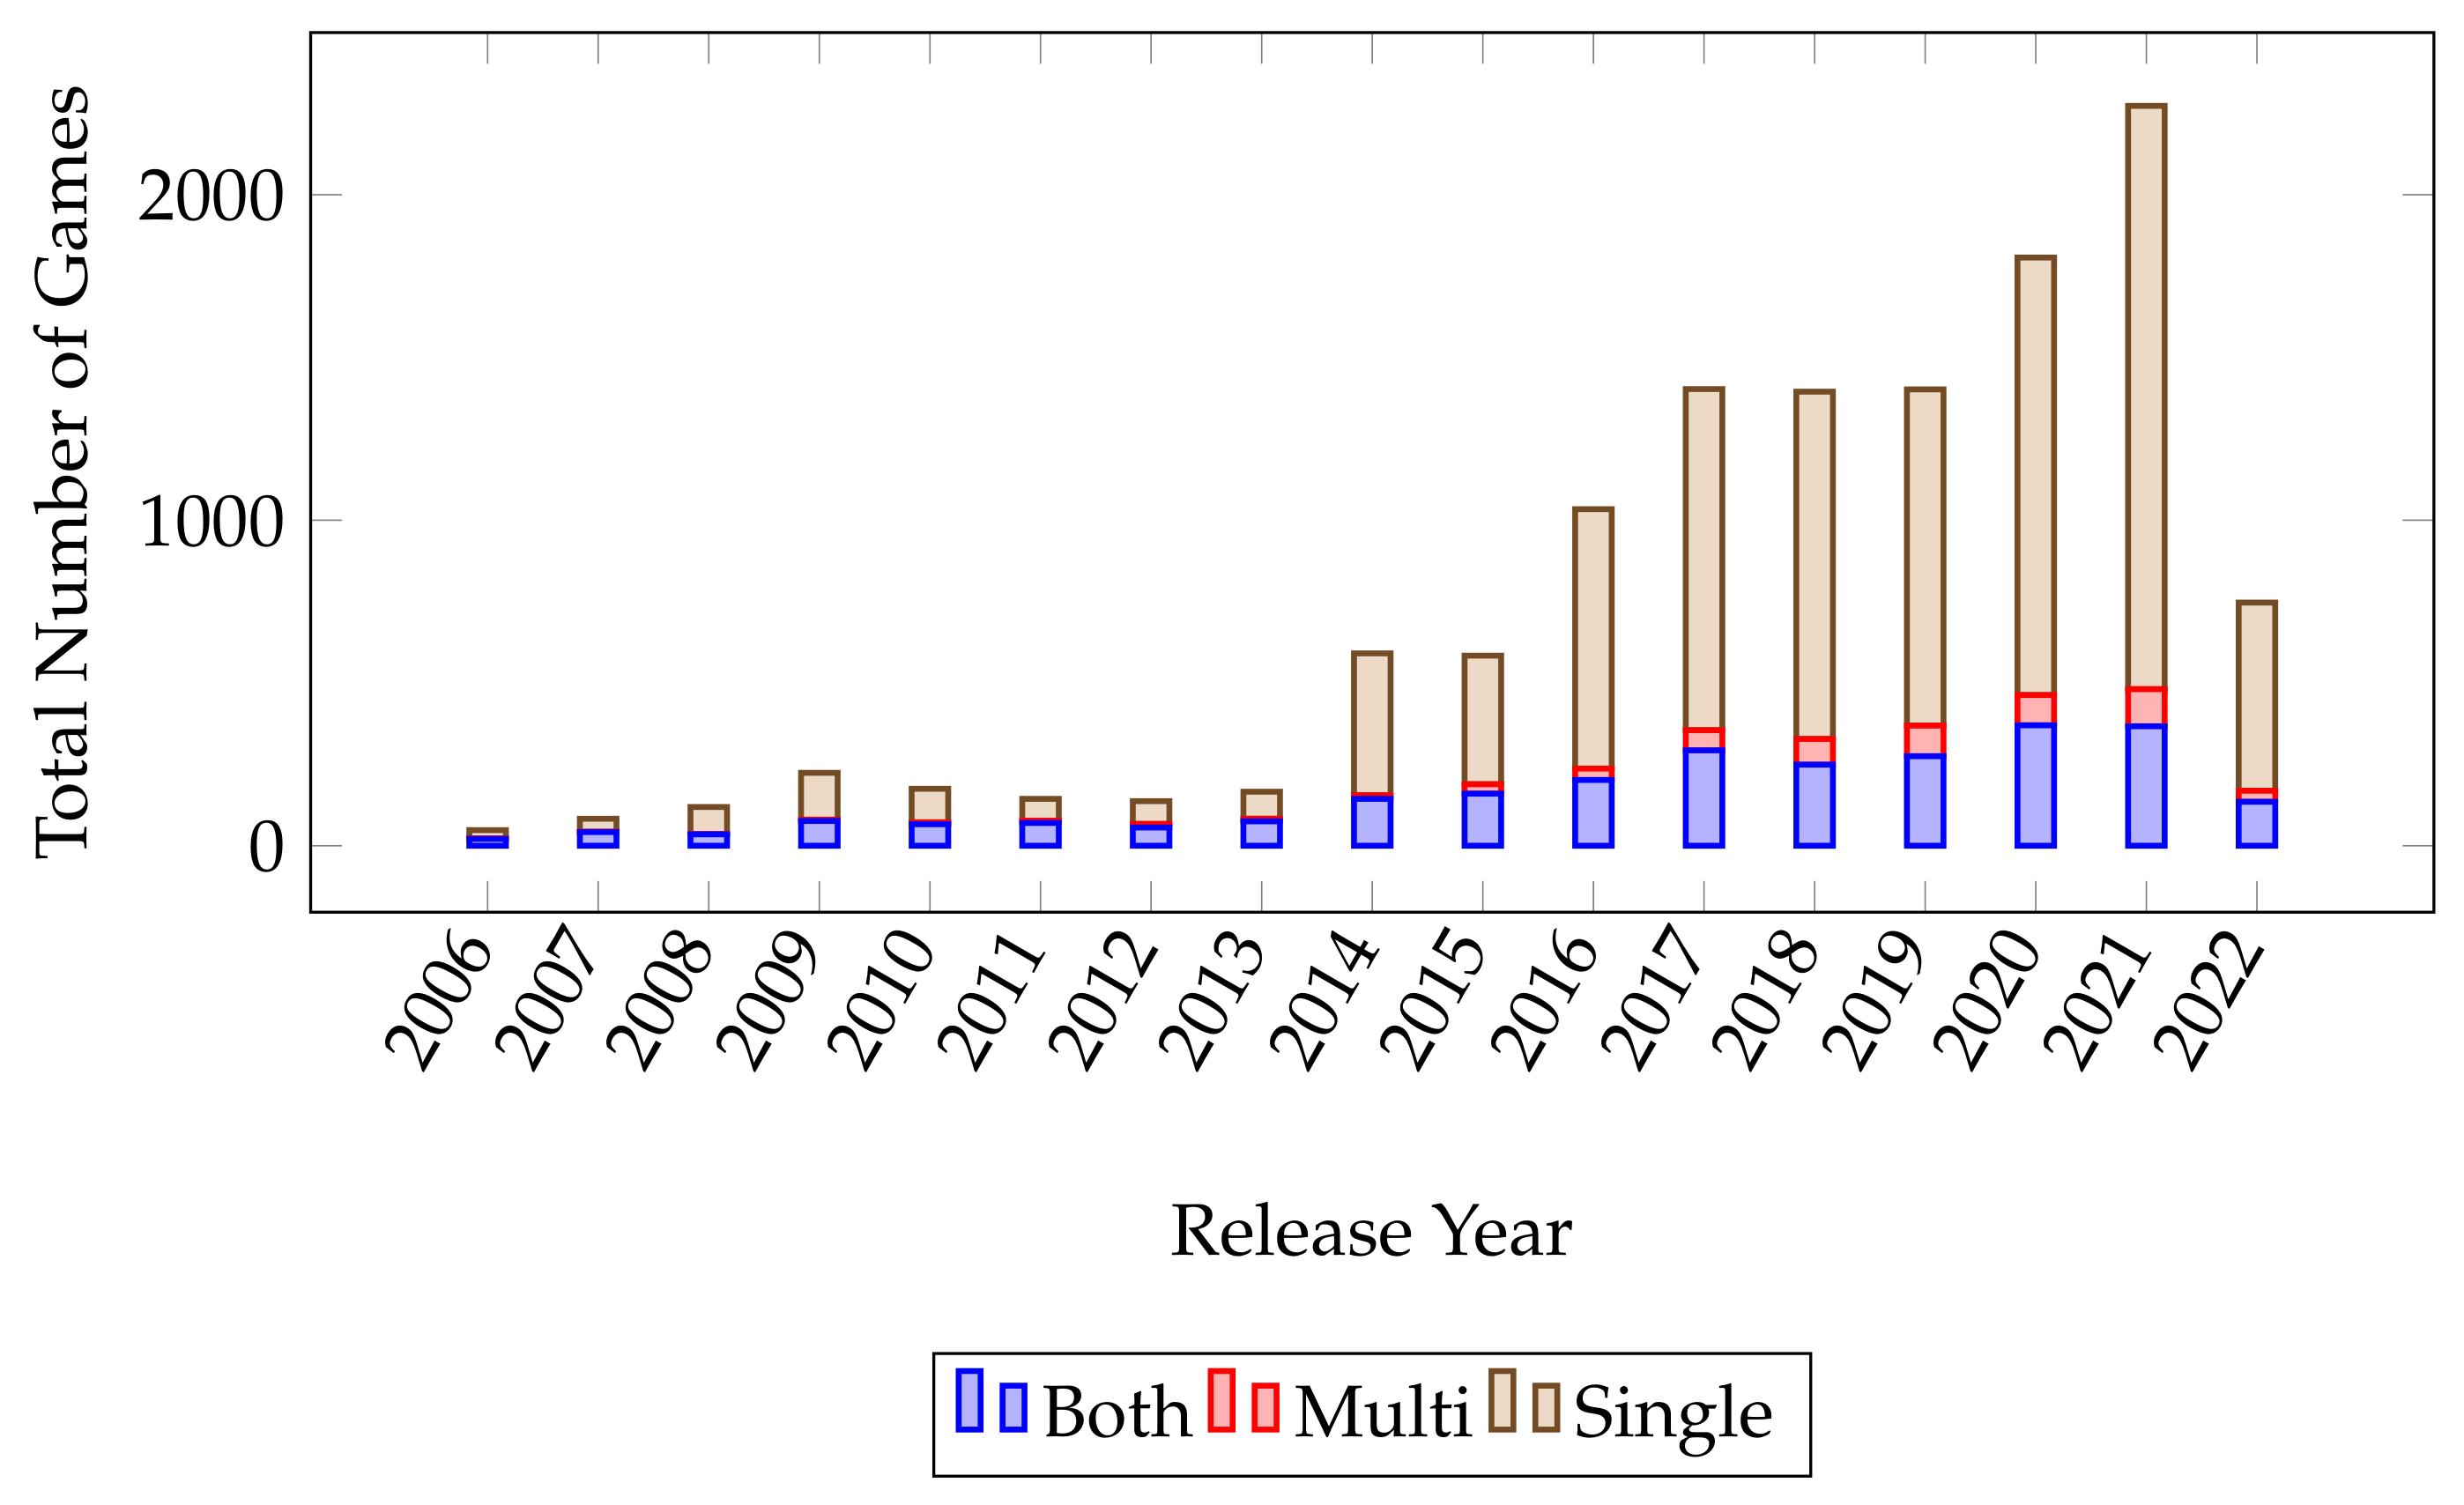
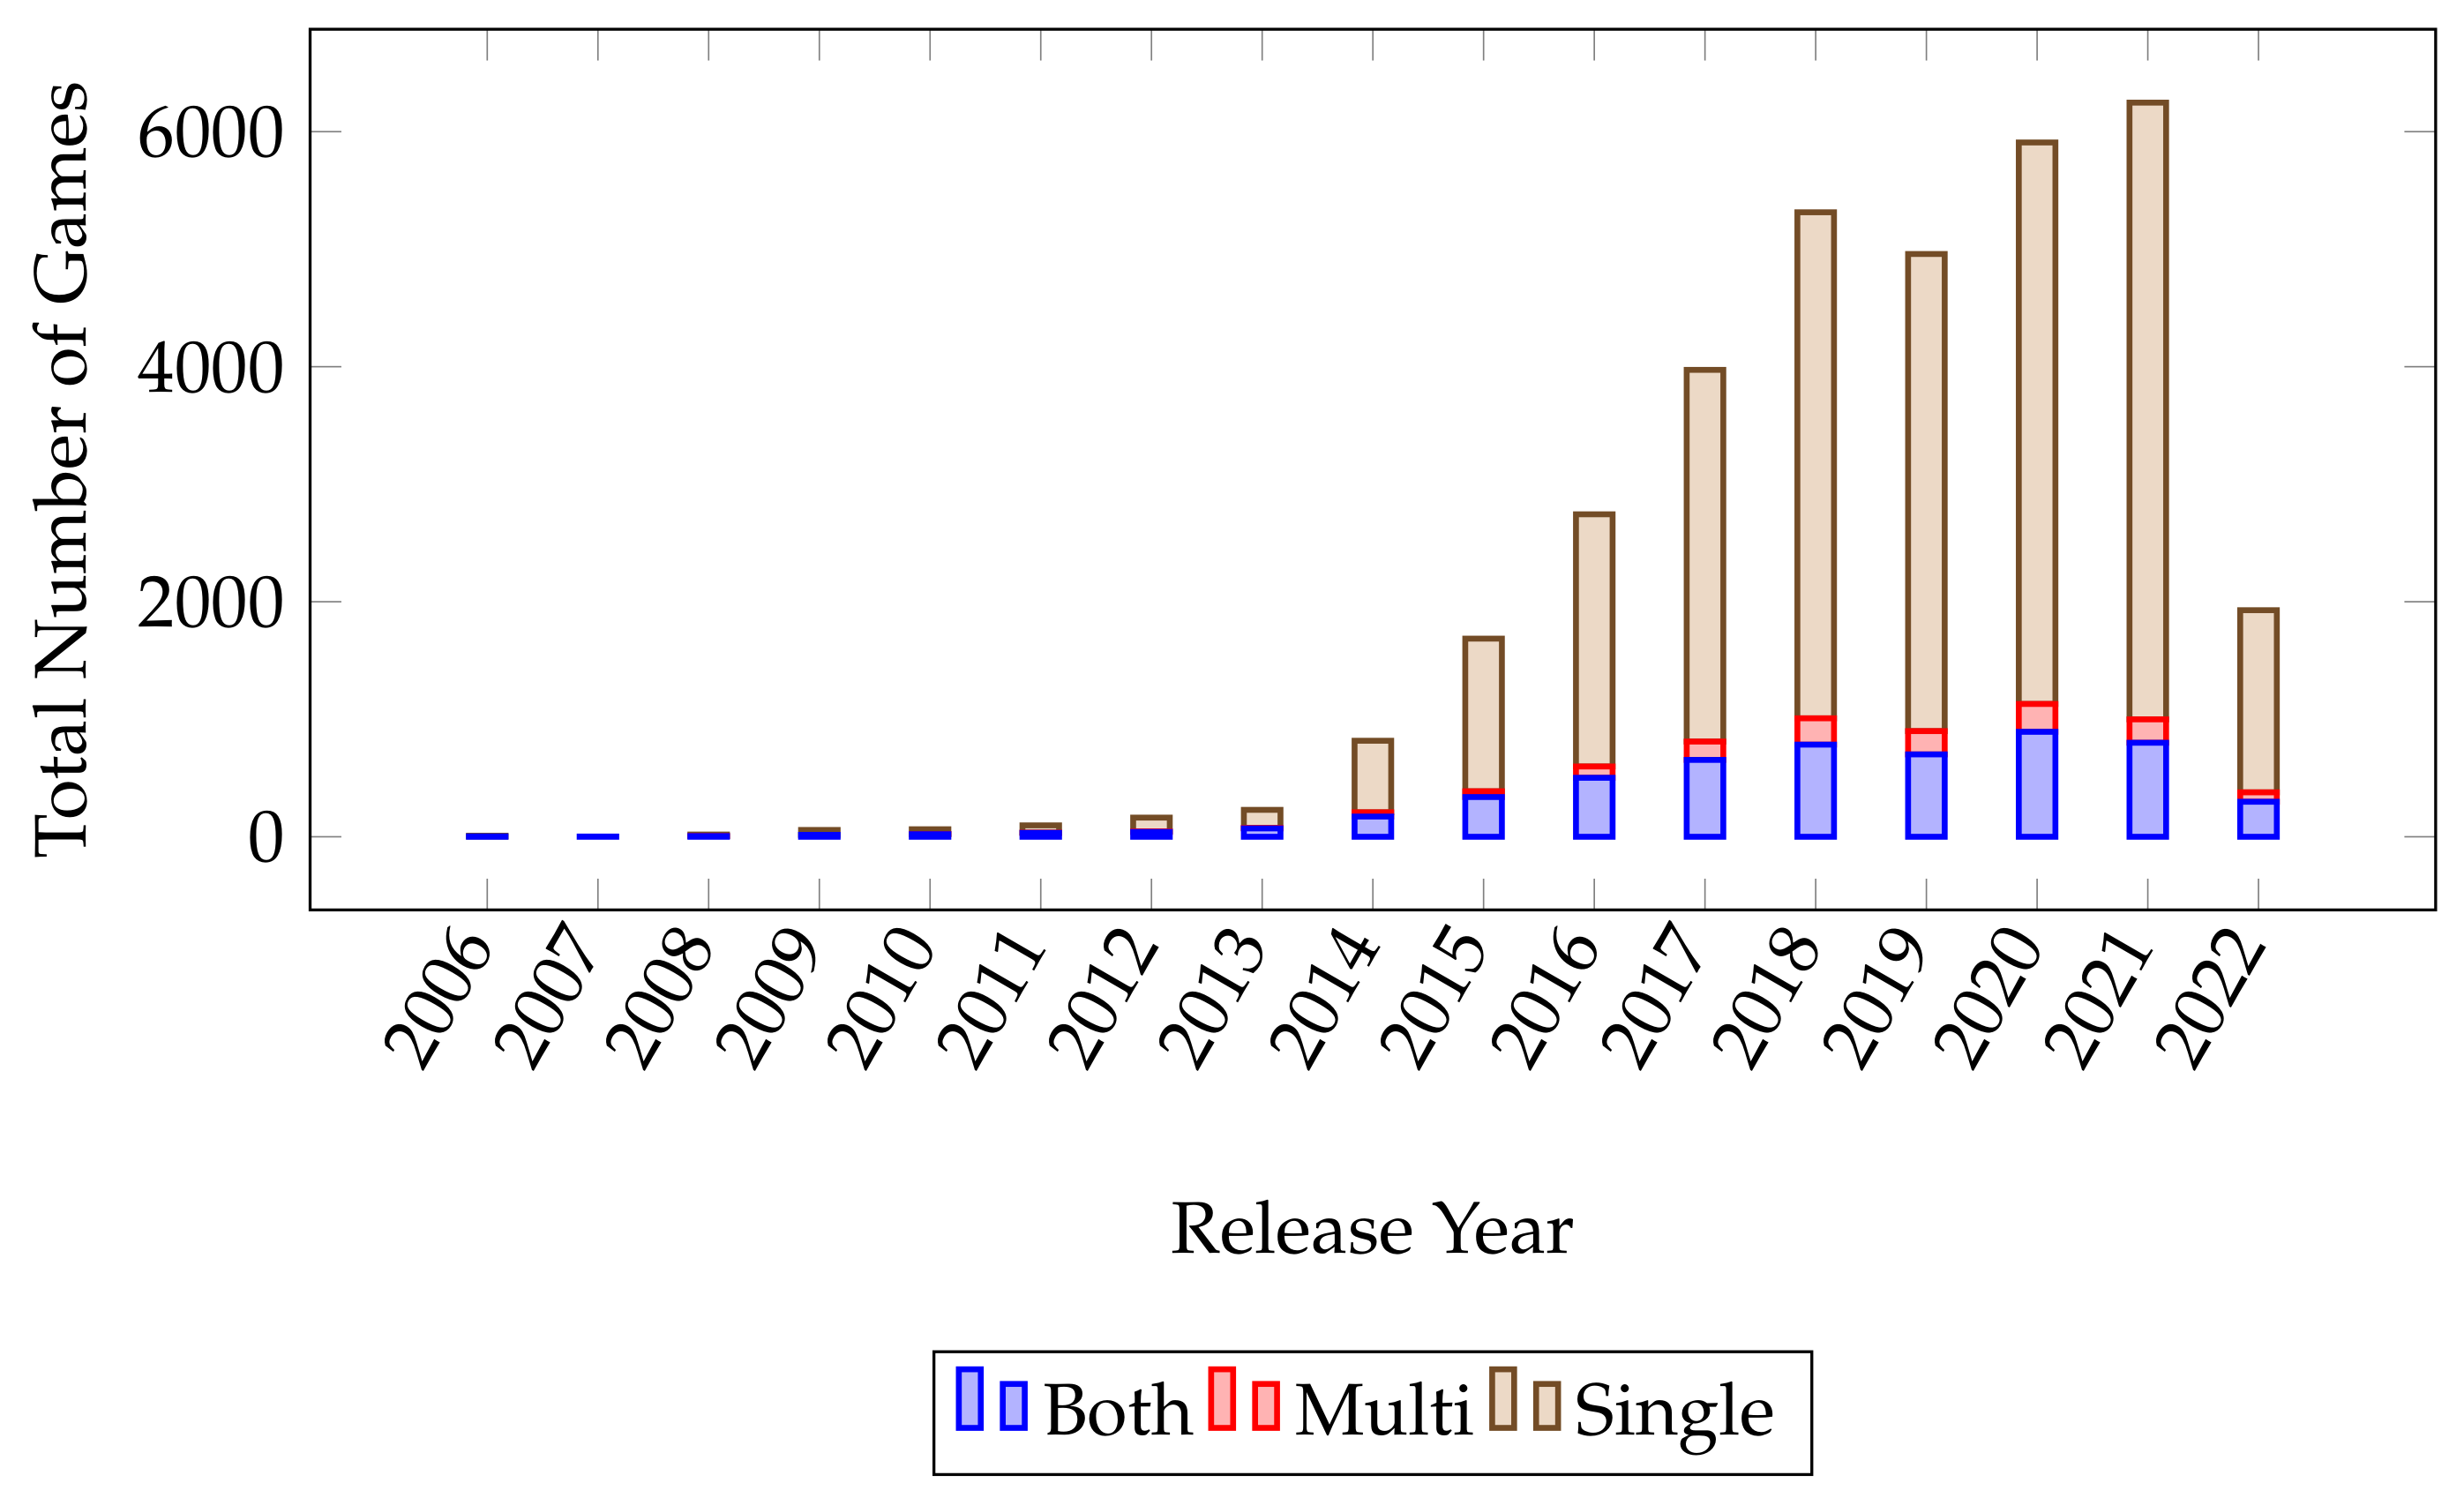
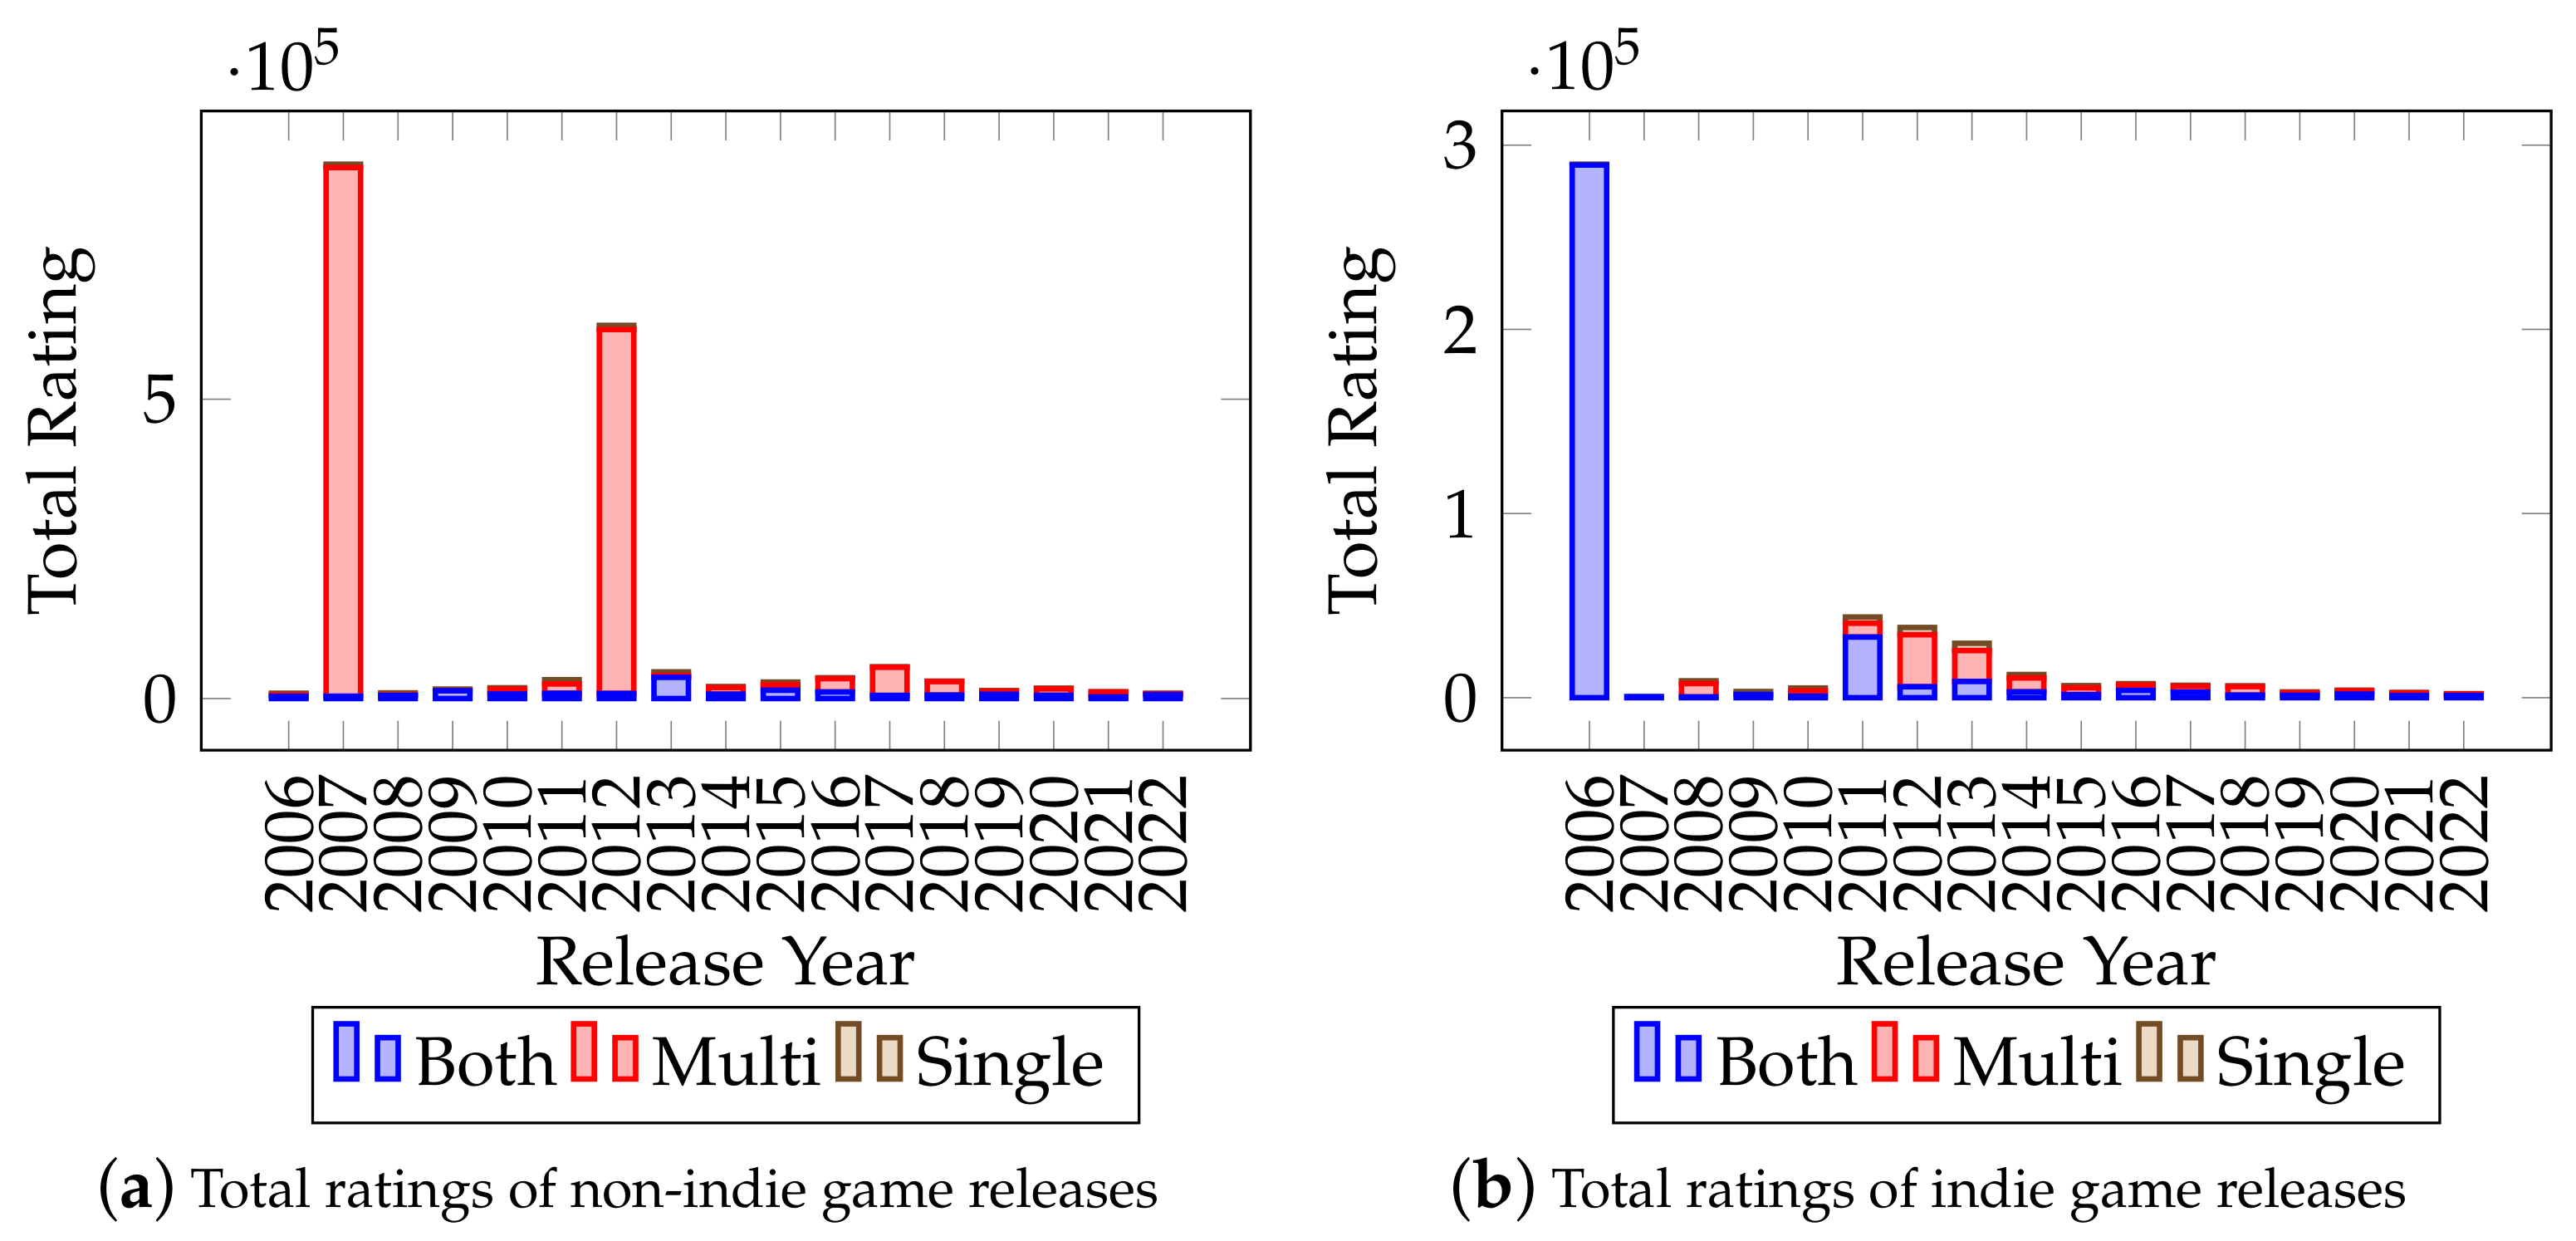
Game development/production costs can be expensive, depending on the tools, licenses, and number of people required to develop the game. Figure 5 and Figure 6 show the number of single-player games (single), multiplayer games (multi), and games that support both single- and multiplayer gameplay (both) released on Steam from 2006 to 2022. Generally, non-indie game developers are expected to have higher financial capability compared to indie game developers, which is shown by the data where non-indie game developers published more multiplayer-supported games (30% of their overall released games) than indie game developers (20% of their overall released games) where the non-indie game developer can better afford the server costs to support their multiplayer games. We also found that 60% of all the games released on Steam are single-player games developed by indie game developers.
4.2. How Does Rating Affected by Game Prices on the Steam Platform?
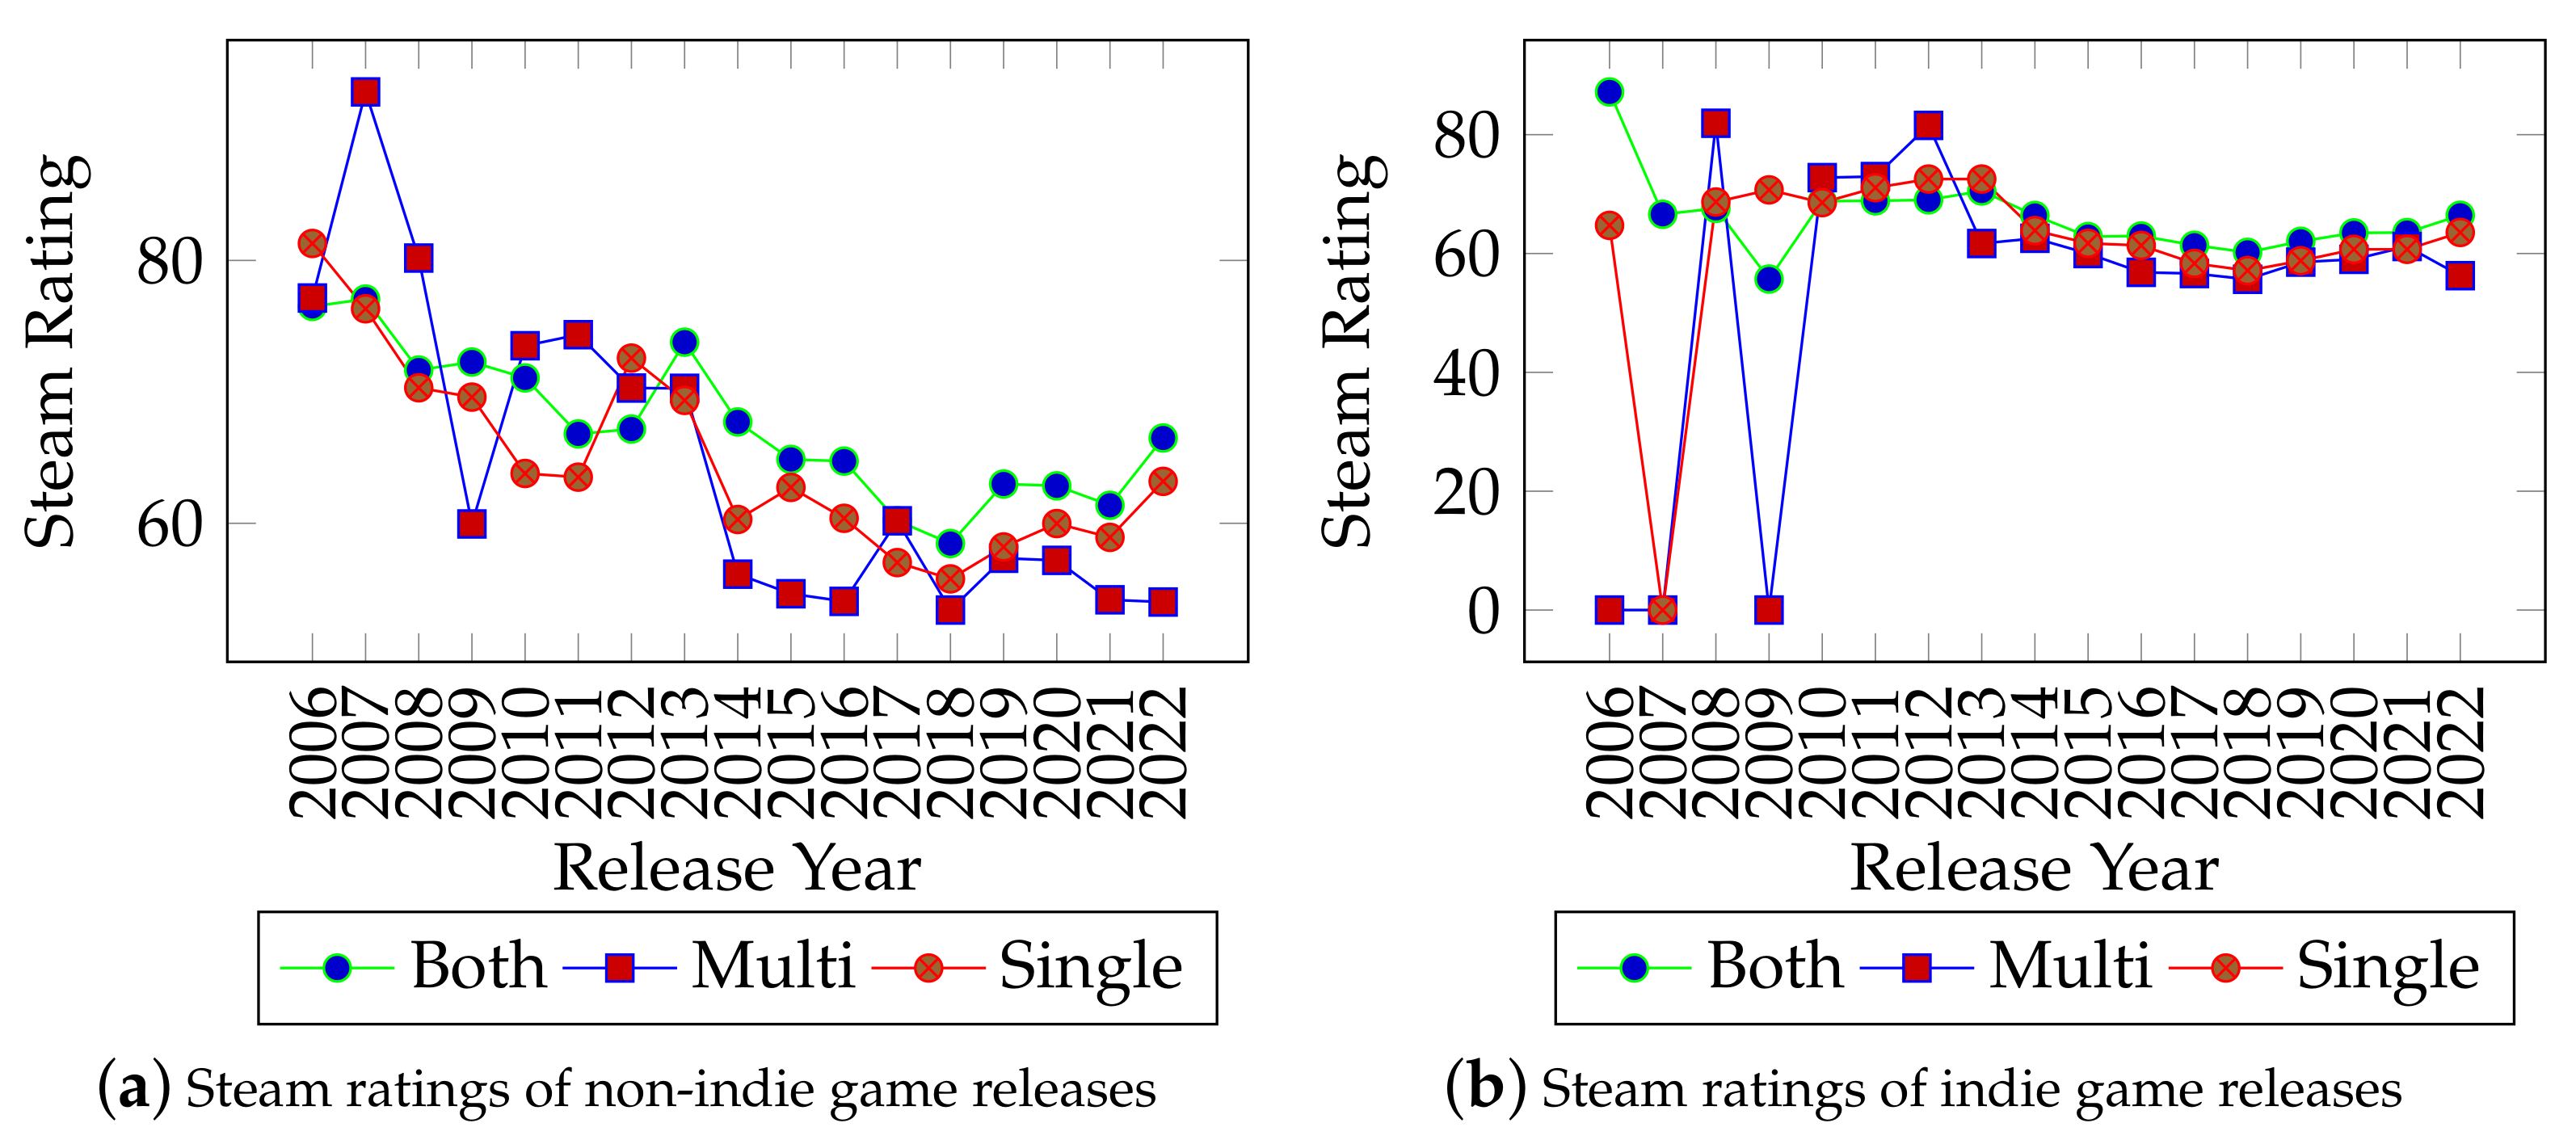
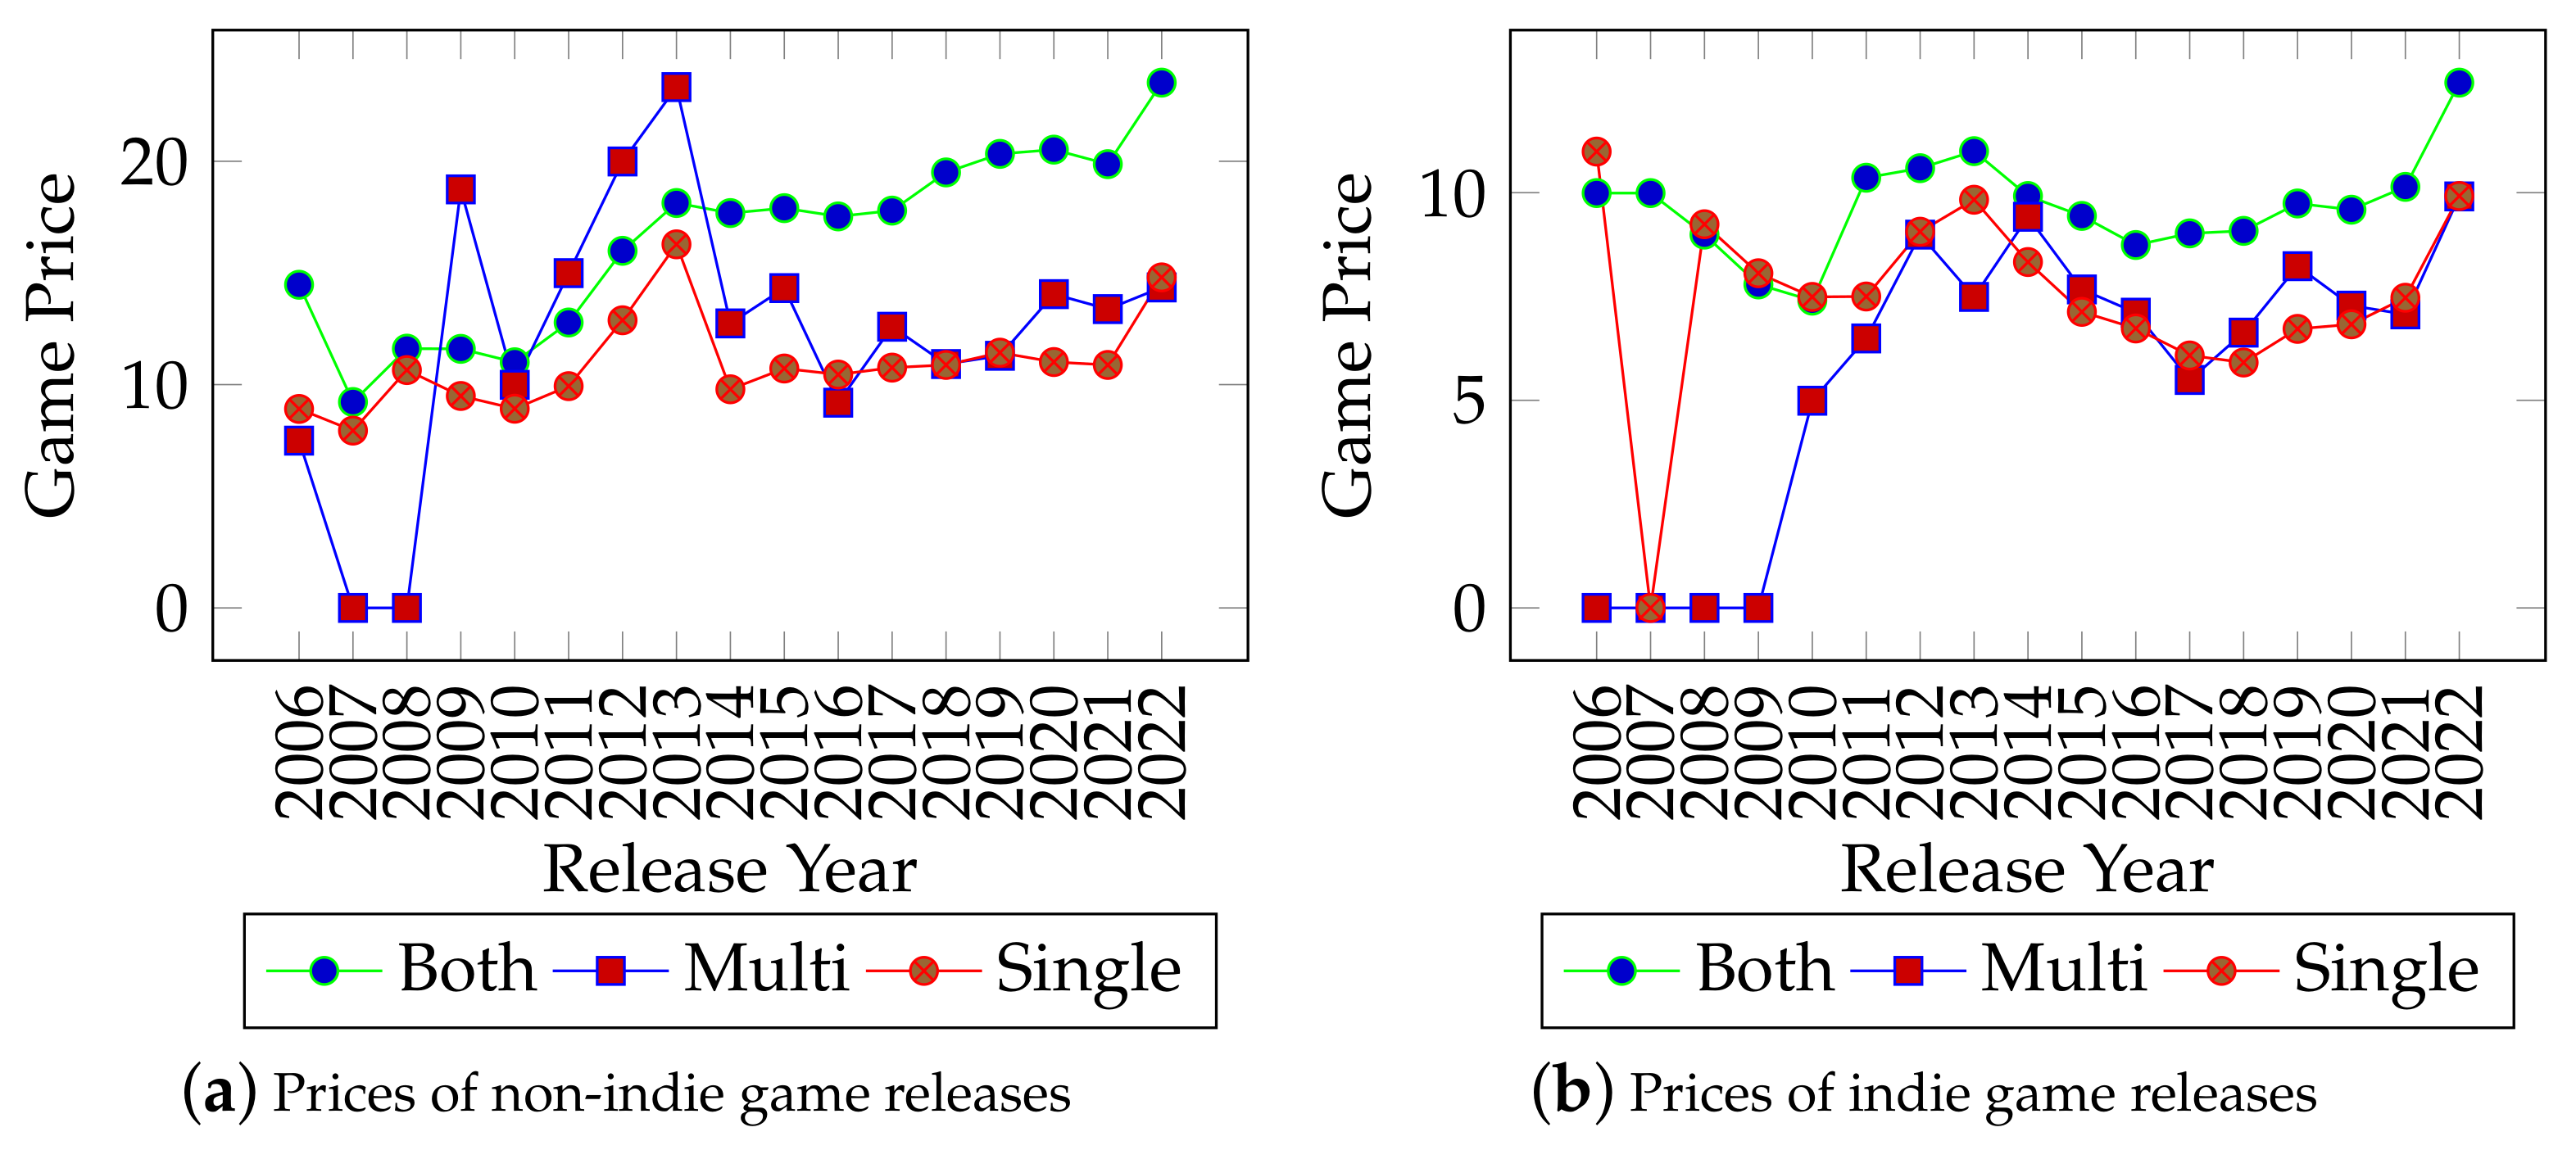
Figure 7, Figure 8 and Figure 9 have shown the average player rating, Steam rating, and game price for non-indie and indie game releases from 2006 to 2022. Due to the confidentiality of the data, the exact number of owners or sales for each game could not be analyzed, so we used the rating_total value instead. The rating_total shows the total number of ratings (both positive and negative ratings) a game received from its players, which we used as a metric to measure player populations. In terms of the total rating average, non-indie games received more ratings than indie games from their users, with PlayerUnknown’s Battleground (rated by 2,056,746 users and 53% of positive ratings) and Terraria (rated by 991,103 users and 98% positive rating), meaning that, though the Steam library is mostly populated by indie games, the players still gravitate toward purchasing more non-indie games than indie games. On average, the prices of non-indie games are higher than those of indie games, as shown in Figure 9a,b. Interestingly, the most expensive non-indie and indie games are VR Games such as Ascent Free-Roaming VR Experience, priced at USD 999 and Aartform Curvy 3D 3.0 priced at USD 299. The production cost, the shallow player base for VR Games, and the high-spec equipment needed to develop and play a VR game might be why VR games are more expensive than non-VR games.
There are multiple factors when it comes to pricing a game, such as development costs, the size of the game’s contents, and other factors. For example, Final Fantasy XV (https://finalfantasyxv.square-enix-games.com/) (accessed on 1 October 2022) was priced at USD 60 with the content worth 60 h of playtime when they first launched. Players may complain if the contents available in the game are too short for the price [56]. To show the relationship between game prices and the total ratings, we performed a correlation analysis as shown in Table 4. The value shows a positive correlation between the prices and total ratings for games that provide single-player and both (single-player and multiplayer) gameplay for indie and non-indie games. This condition implies that the number of ratings a game receives from its players might increase positively as the price of the game increases.
4.3. What Kind of Developers and Publishers Were Dominant on the Steam Platform?
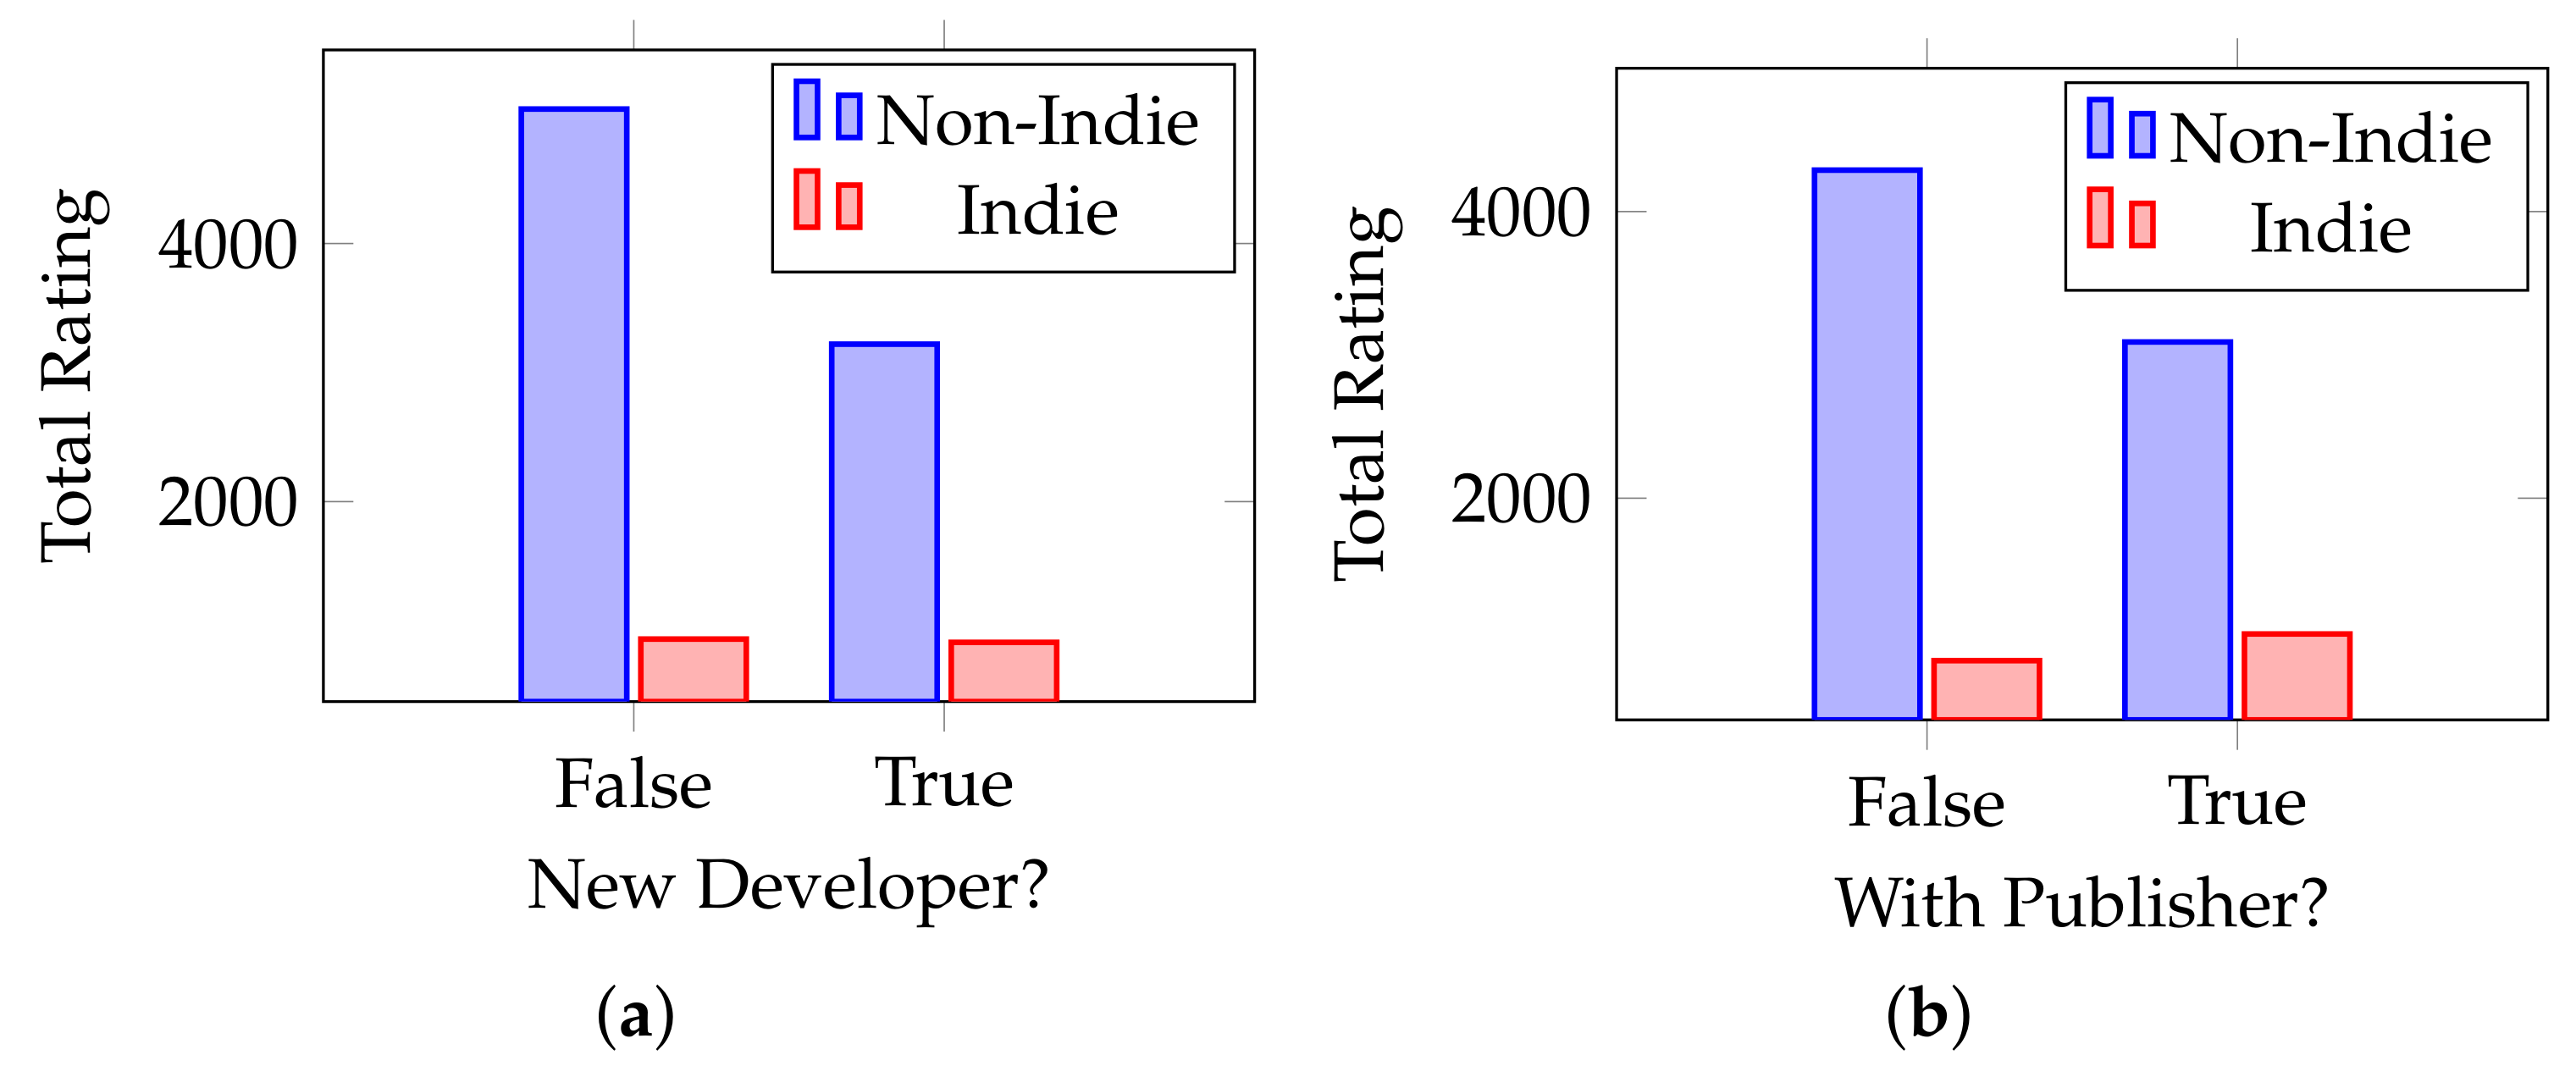
Steam is a huge video game market, which causes it to be natural for it to be very competitive, both for indie and non-indie developers alike. Figure 10a shows the average total ratings of both non-indie and indie games for new developers who just entered the Steam platform market. For indie games, there is not so much difference in the player ratings whether the game developer is a new or a veteran developer (a veteran game developer is the game developer who has already published more than one game on the Steam platform). This condition indicates that Steam users do not mind the indie game developer’s popularity and are more open to trying games from both new and veteran indie game developers. From the point-of-view of game developers, this indicates that both new and veteran game developers have an equal chance to be able to stand out in the Steam market, as is also shown by the correlation result between the new developer indicator and the total ratings (Spearman’s correlation coefficient, and ). In contrast to what have seen in indie games, for non-indie games, Steam users paid more attention to the game developer’s popularity and were pretty hesitant to try out the games from new developers, although, statistically, it has a weak negative correlation (Spearman’s correlation coefficient, and ).
In a competitive environment such as the Steam market, working with a game publisher could improve the reach and enable your games to be noticed by Steam users. Figure 10b shows the average total rating of both non-indie and indie games from game developers who are working and are not working together with a publisher. Figure 10b shows that there is no significant difference in terms of the average total ratings received by self-published games and publisher-published games and, statistically, has a weak correlation (Spearman’s correlation coefficient, ). Although working with a publisher might not boost the total ratings they receive from the players, it can provide many benefits for indie game developers, such as instant validation and hype, effective app store and media distribution, professional advice from the experts onboard, efficient planning. and no upfront financial costs (except royalties) [57]. While it can be beneficial for indie game developers to work with publishers, especially for its financial and expert input, for non-indie game developers, publishing their games on their own will benefit them more since it provides them with more flexibility and freedom on how they sell their games.
4.4. Do Steam Achievements Affect Game Ratings and Types of Games?
To determine the influence of game achievements, we performed a Spearman’s correlation analysis between the number of achievements and game ratings for each game type for indie and non-indie games as shown in Table 5. Table 5 shows a positive correlation between the number of achievements and the number of ratings a game receives. Based on the data, both indie and non-indie games have a positive correlation between the number of achievements and game ratings, which varies depending on the game type; the number of achievements has more of an impact on non-indie games than indie games.
Moreover, k-mean clustering was adopted from Scikit-learn [58] to provide an in-depth analysis of the Steam game achievement data, where the parameter of the k-mean cluster was with the number of achievements, achievement percentage, game type, and user rating as the input. Using silhouette coefficient assessment and the elbow method, it was found that a five-cluster is the most efficient for the analyzed data, as described in Table 6.
Thus, five clusters have been identified from the k-mean clustering results, which clustered the games into five distinct groups. Cluster 1 consists of games that only support single-player gameplay. In contrast, Cluster 2 consists of multiplayer-supported games (multiplayer-only or single-player games with multiplayer gameplay options). In addition, we found that some multiplayer games were initially released as pay-to-play (P2P) games and transitioned to free-to-play (F2P) games, such as Counter-Strike: Global Offensive, Team Fortress 2, and PUBG: Battlegrounds. This business model transition allows the games to attract new players and return players that previously stopped playing the game [8]. Moreover, free-to-play (F2P) games usually adopt microtransactions within their business model to allow revenue from Loot Boxes, Character Skins, or Premium Subscriptions that they provide in their games.
Cluster 3 consists of games with a high global achievement percentage value. Achievements are typically adopted in games to encourage the player to explore the game world or to play the game in different play styles and extend a game’s lifetime of sales [59]. However, based on Table 7, Cluster 3 suggests that the number of achievements available in multiplayer-supported games has a high negative correlation to their global achievement percentage value, while this is not so for single-player games. This situation implies that multiplayer game players are prone to not completing the in-game achievements when the quantity is too many. This condition happens because, generally, the goal in multiplayer games requires the player to compete against other players to achieve the goal of the game, which leaves them limited to no chance or time to explore additional content in the game as well as the poor design of the progression type [59] achievements that require too much effort to achieve (i.e., requires the players to play long hours of grinding to achieve).
Interestingly, we found a group of unique games in Cluster 4 that provide a high number of achievements in their games. These unique games are known as achievement spam games, where players can easily obtain plenty of in-game achievements within a relatively short time. Moreover, those achievements can be displayed on the user’s Steam profile on the Steam platform. Achievement spam games can be seen as a unique business model that serves a niche market because they only focus on the attractiveness of the sheer quantity of achievements, while the game content itself is generally not the main attractive part [60]. However, these achievement spam games are considered fake games that exploit the Steam system. In response to this, Valve introduces Confidence Metrics that put a limit of 100 achievements on games until Steam recognizes them as real games.
In contrast to what we have observed in other clusters, Cluster 5 consists of only one game, Counter-Strike: Global Offensive (CS:GO) [61], which has received more than 6,000,000 ratings from its players. CS:GO was initially released as a pay-to-play (P2P) game in 2012 and it transitioned into a free-to-play (F2P) game in 2018 [8], providing content for single- and multiplayer gameplay for players to flexibly play the game by themselves, with their friends, or with other players online.
5. Discussion
Games’ ratings were analyzed through the motion-in-mind v value, where it was measured using the model, where G is the number of positive ratings and T is the total rating a game received. Table 8 shows the correlation values between the games’ rating (v) to their Steam market stats based on the developer type (indie and non-indie developers). As shown in Table 8, v is positively correlated with the global achievement percentage while they are negatively correlated with the number of days since the game was released. This situation implies that the longer a game is released, the more likely it will have a lower positive response from the player, leading to losing its popularity. In a sense, the v captures a positive response (rewards) from their overall player base (total attempts). Therefore, when a game receives a high v value (), it puts the game in an advantageous position where it can lead to higher popularity and more players being attracted to play the game, including exploring its additional contents (games’ achievement). Meanwhile, when the game is of low v value (), it puts the game in a disadvantageous position, causing it to lose its current players and future players that might be attracted to buying/playing the game. Therefore, the v value of a game fluctuates as the developer updates their games.
Table 4 showed a positive correlation between the game price and the total rating received by a game. This condition implies that the higher the game price (higher price tag), the more ratings the games tend to receive from the players (more people will buy the game). However, Figure 11 shows that there are peak points of game prices for each game type from different developer types. For instance, once a game is listed with a price tag over its peak point, it might not sell as much as other games with a lower price tag because the players feel it is too expensive or overpriced. Another insight that can gain from Figure 11 is that the game developers can strategize how they will price their games to sell them or attract players to buy them efficiently. For example, they can sell their single-player game for USD 20 as their regular price tag and USD 15 as their discounted price tag when they first released their game or during the Steam sales period to attract players. Another strategy that multiplayer games can use is by transitioning to a free-to-play (F2P) business model to attract players, as we saw in Counter-Strike: Global Offensive (CS:GO) in Cluster 5, which significantly increased their player population [8] and can lead to more revenue when players spend in their microtransactions scheme.
Moreover, a regression analysis was conducted through Orange Data Mining (https://orangedatamining.com/) (accessed on 1 October 2022) software using their built-in Random Forest algorithm. First, the analysis was conducted between the independent variable (rating total) and the dependent variables (game price, game type, number of achievements, Steam rating, rating ratio, and an indicator whether the game has achievements, is released through the publisher, is an indie game, is a free-to-play game, and is a game from a new developer) of the collected Steam data. Next, the outlier games were removed from the data using Orange’s built-in outlier detection feature using the Covariance Estimator method; 4655 outlier games were removed from the data. Then, the train-to-test ratio data of 80:20 of the sample data was considered. Based on the result in Table 9, the R2 value indicated that the independent models explain 75% of the variance of the dependent variable. In addition, both the mean absolute error (MAE) and root mean squared error (RMSE) values were relatively low, within 261.983 and 3582.095, respectively, which is lower than the total rating’s average value of 814.45 and standard deviation of 10,106.77.
In terms of game types, the difference between single-player and multiplayer games can be observed where the multiplayer games tend to have lower achievement percentages. One of the possible explanations here is that, in single-player games, players have more space or opportunities to explore the game’s additional objectives to obtain in-game achievements beyond the main objectives. On the other hand, players of multiplayer games are occupied with competing or cooperating with other players to reach the game’s primary objective. Moreover, multiplayer games were preferred by non-indie game developers since they attracted a more extensive player base and, consequently, required less number of releases throughout the years.
Moreover, it can be implied that the Steam platform indirectly played a role in gamifying the game releases and game ratings by providing a meta-game solution to well-known game studios and indie games. Figure 12 showed the boxplot and scatter plot of the positive rating ratio against the total rating of the collected Steam games. By considering the model, where G is the number of positive ratings and T is the total ratings a game received, Figure 12a showed that the majority of games regardless on which cluster they belong to were (except for some outliers). These findings substantiated that the Steam platform is still the biggest and most popular digital game distribution platform compared to other similar platforms for players and developers (such as Epic Games and itch.io). In addition, the outlier games () that were shown in Figure 12b implied that these outlier games are less popular or low rated (low v, which also implies low values).
In diverse situations, the clustering results revealed that a unique solution existed that allowed for a different manipulation of the Steam platform to maintain the sustainability of the game studio. For instance, the achievement spam game takes advantage of the achievement system to attract players to the game regardless of the content [60]. It also acts as an additional objective that a player can achieve outside of the intended content of the games, mainly to retain interests and continuity of the platform. Nevertheless, proper moderation is crucial to balancing and maintaining players’ interests on the platform.
From the developer’s perspective, the ratings and achievements of the Steam platform played other roles as indicators for developers to perform decision-making and risk assessment. The Steam platform helps indie developers to build reputations and user acceptance of their game release brand. On several occasions, there had been indications that the players care less about the type of developers (indie or non-indie) but care more if the developers work with a publisher. Moreover, it can be implied that fast-paced developers under a small studio or publisher would earn more revenue and be better received by Steam platform users by releasing single-player games. In contrast, a large development company backed by well-known publishers would be better off focusing on multiplayer game releases to take advantage of the platform achievement features while maintaining continuity by incorporating downloadable content (or DLC) [62].
From a business point-of-view, the Steam platform, besides being an instrument of monopoly, capitalism, commodification, and ecosystem of digital products (for instance, games) [63], it provides not only a channel that connects developers and players via a gamified platform but also maintains dynamic interactions between developers and players via constant engagement and structural processes. As such, the purpose of a platform becomes a meta-game for developers and publishers to bridge the needed experience of the players. In addition, the Steam platform also provides a gaming experience beyond the game itself, a notion known as ”extraludic” [46,47] while laying out the opportunity for learning and value-added social interactions by acting as both mechanical and social metagaming solutions [64].
Finally, related to the analysis of Steam achievements, it can be implied that its proper implementation relative to the in-game and out-game contents regulates and drives a new form of “game economics” (cf. [65]); thus, the developers and publishers may take advantage over it as a form of gameplay activities or game experience to generate revenue. Although there were some concerns regarding addiction and betting on the Steam platform [63,65], it does provide a unique opportunity to introduce a novel business model that emphasizes player experiences rather than exploiting the Games as a Service (GaaS) model just for revenue generation [62]. Furthermore, prices and ratings ultimately make or break certain games, as found in the Steam platform analysis, highlighting the importance of cost transparency and cross-linkage to maintain existing players and attract new ones (cf. [62,66]).
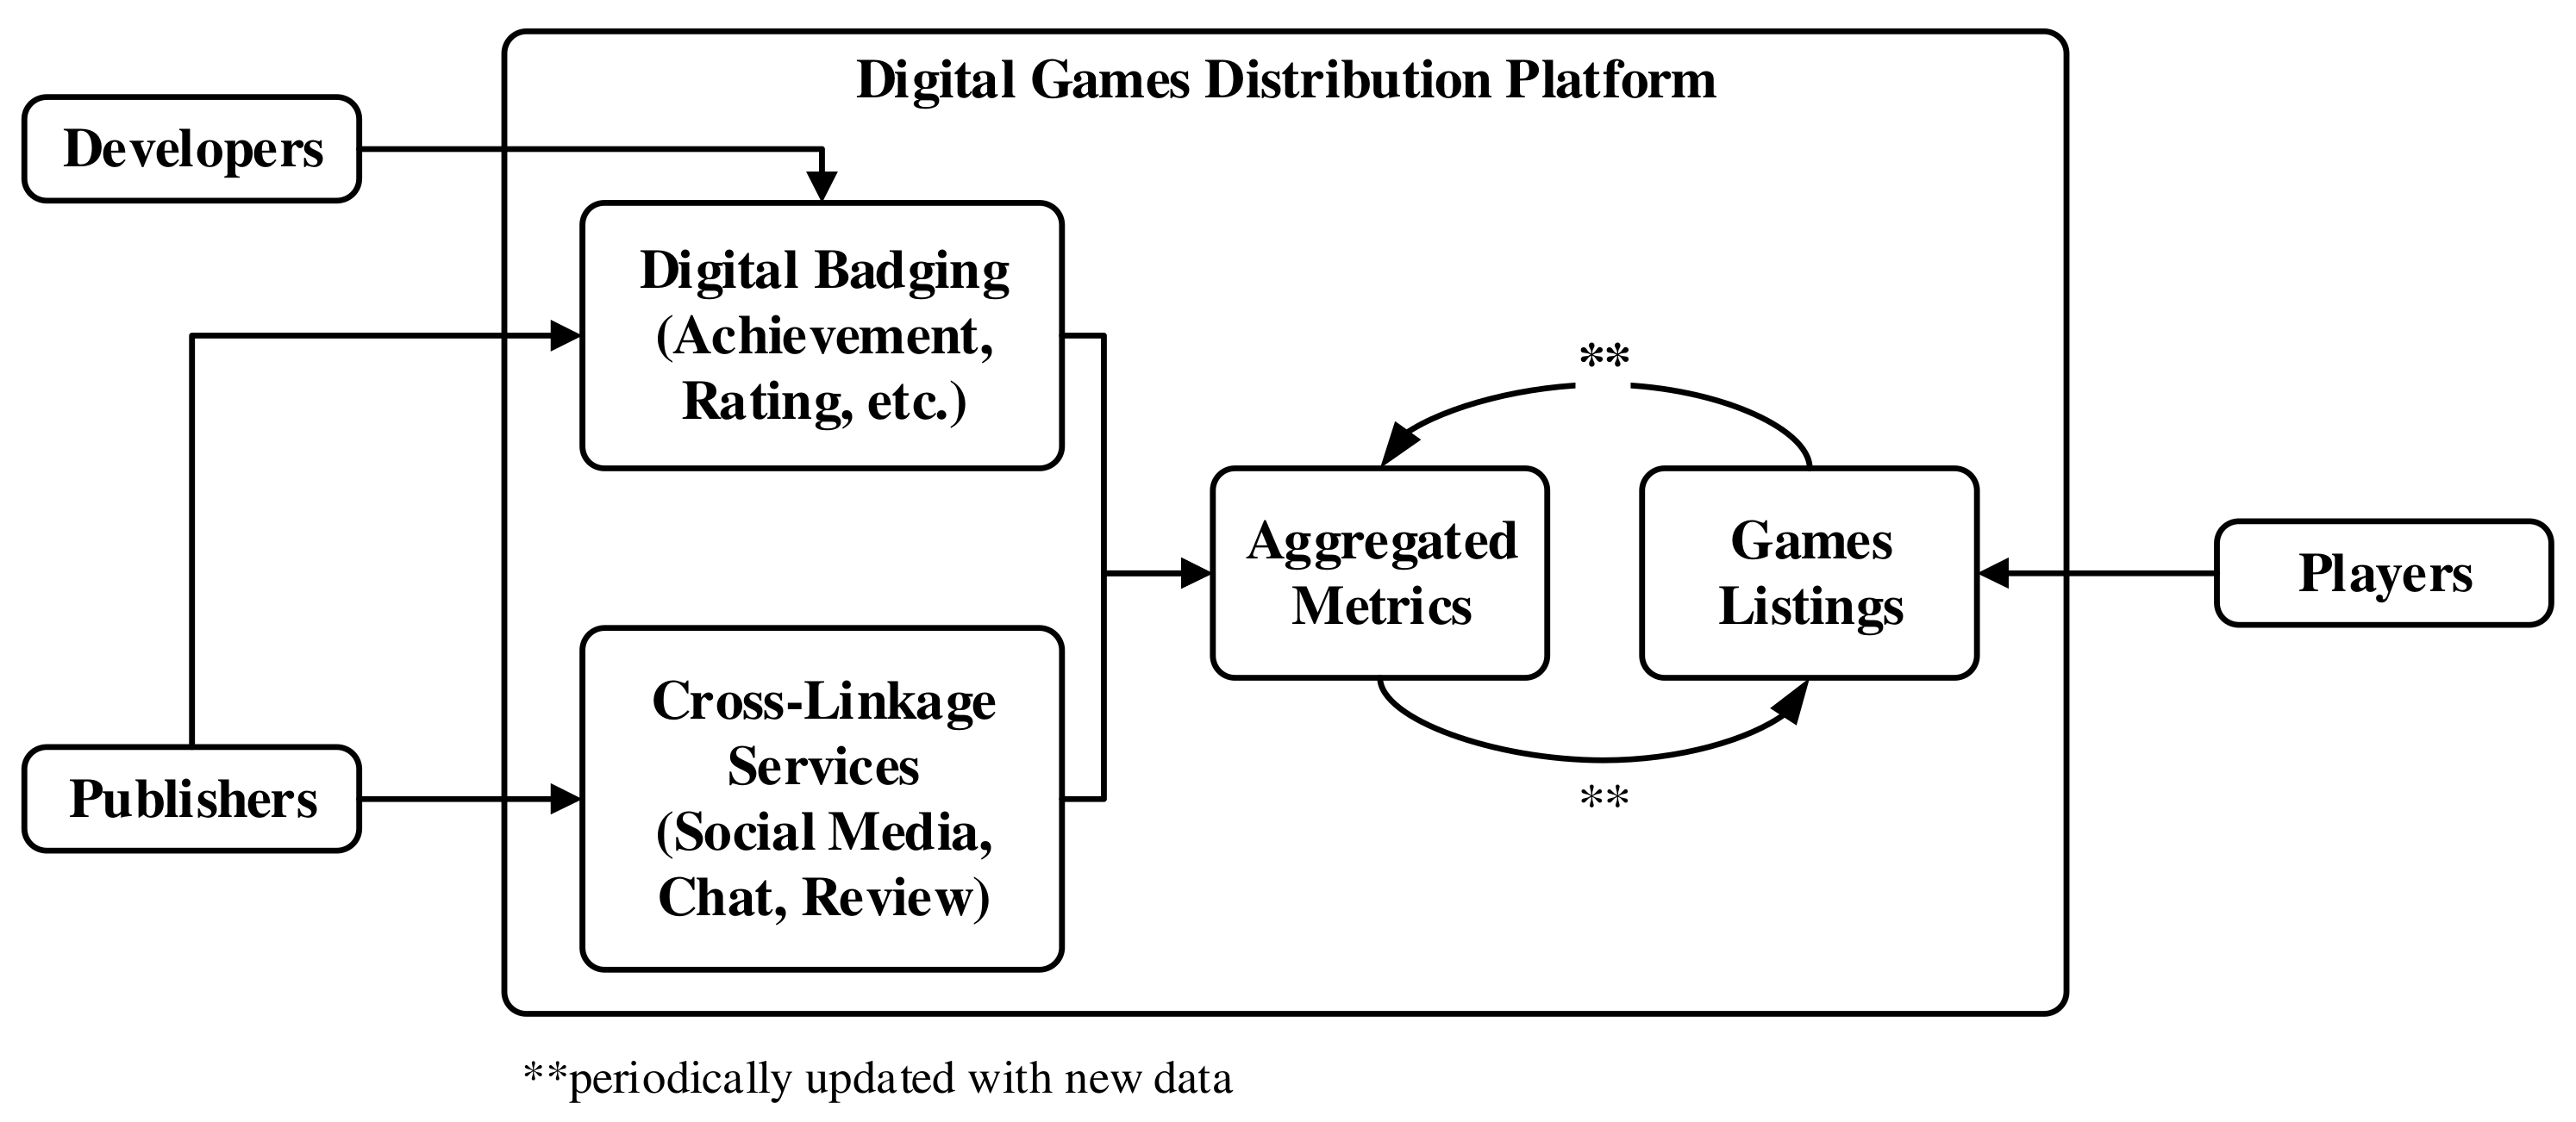
In light of these research findings, the need for a harmonic balance between the play experience (of players) and the revenue generation (of developers and publishers) could be achieved via an experience-driven business model implemented in the context of the digital games distribution platform (Figure 13). By having the appropriation of digital badging (such as Steam game achievements and ratings) with cross-linkage services (such as chat rooms, social media interfaces, and reviews) to dynamically compute aggregated scores (such as the motion-in-mind model) to rank the ”expected experience” players can perceive from the game listing. However, such a business model requires some investment (cost and time) from the developers and publishers. Instead of directly releasing the game, they have to undergo a moderation process (by the platform provider) to incorporate the appropriate digital badges and cross-linkage services. Finally, the aggregated metrics will be updated periodically when new data from the digital badges and cross-linkage services are acquired. The envisioned business model will enable game developers to improve the visibility of their games and direct them to their targeted users, enable Steam to recommend more personalized game recommendations to Steam users depending on the types of games that they are interested in (i.e., based on the game’s ratings, reviews, achievements, etc.) and, finally, this may improve user satisfaction itself where they can discover games that they will enjoy.
6. Limitation
The limitations to this research include focusing on games that have in-game achievements released between 2006 and 2022 on Valve Corporation’s Steam platform. This situation excludes games without in-game achievements. The primary focus was on the correlation of the data collected over causality. Furthermore, the data collected were mainly focused on game prices, categories, achievements, rating, releases, developer, publishers, and other essential auxiliary labels (such as game tags, appids, names, dates, etc.). Due to the nature of game data confidentiality, the exact numbers of owners of each game were not accessible. In this research, the total ratings were used to assume the number of players who own the game. Since only users who own the games in their library can review the game in the [67] platform, the actual game owners number can be higher because not every player writes reviews of the game they purchased (or played).
In addition, the measure of v, based on the rating ratio of the Steam game received, indicated the competitive comfort that the Steam platform presented to the game players and game developers. However, such a method was based on the assumption that the level of user’s ability was based on the objective and subjective analysis of popular board games. Therefore, game designers and developers should have taken these findings with a grain of salt.
This research analyzed the global achievement percentages of the achievements that exist in the games. Therefore, we do not differentiate the difficulty of each achievement in the games. However, there is always the possibility that completion rates could differ for games that force players to choose higher difficulty modes for obtaining achievements. Without an achievement to signify completion at the easier difficulty, there is no way to count the ratio of players who finish the game in the more accessible mode.
In particular, all the games on Steam are digital downloads, so completion rates could differ from games purchased on a physical medium. Furthermore, the research focused on both games that require money to purchase and “free-to-play” games. Therefore, content usage will still be an issue for those games. However, the business model involved is different enough to warrant a separate investigation, particularly concerning mobile games, such as ones released on Apple’s iStore or Google’s Play platforms.
Since the Steam platform provides digitally downloaded games, the nature of the games and its player may be different compared to other existing or competing platforms, such as Sony’s PlayStation, Microsoft’s Xbox, Nintendo’s Wii, Switch hardware, and so on. Finally, the present research is empirical by nature and causation between factors cannot precisely be determined where some other independent factors may be the primary focus. Therefore, this research focuses on the insights obtained from examining the three data repositories (Steam store, SteamSpy, and Steam IUserStats) via the publicly available Steamworks and SteamSpy application programming interfaces (APIs).
7. Conclusions
This study demonstrated the importance of the meta-gaming of a platform based on a Steam platform, where 18,658 Steam-listed games were acquired and analyzed from the Steam Store, Steam Spy, and Steam achievement databases. The study has provided a detailed analysis surrounding four key research questions relative to the game types, game achievements, game releases, game ratings, game pricing, and their developers and publishers. First, the study found that achievements or any form of digital badging [47] can increase player’s engagement in the form of ”extraludic” or play beyond the game itself while potentially inducing its own ”game economics” [65]. In this direction, the managerial implications include the need for an experience-driven business model that could provide the harmonic balance between the play experience demanded by the players on one side and the revenue generation of the developers and publishers on the other side without the need for an additional intermediary.
Future works could include acquiring information such as purchasing patterns, content usage, historical price changes, and patterns of individual games; at the moment, unfortunately, the information could not be publicly obtained. The impact of physical media and comparison between other platforms could be invaluable to both players and developers (or publishers). In addition, a comparison analysis between multiple game publishing platforms can be beneficial for game developers to understand the different strategies they can use and users’ consumption behavior.
Author Contributions
Conceptualization, M.N.R., M.N.A.K. and H.I.; Data curation, M.N.R.; Formal analysis, M.N.R., M.N.A.K. and H.I.; Funding acquisition, H.I.; Investigation, M.N.R.; Methodology, M.N.R., M.N.A.K. and H.I.; Project administration, H.I.; Resources, H.I.; Software, M.N.R.; Supervision, H.I.; Validation, M.N.R., M.N.A.K. and H.I.; Visualization, M.N.R., M.N.A.K. and H.I.; Writing—original draft, M.N.R., M.N.A.K. and H.I.; Writing—review & editing, M.N.R., M.N.A.K. and H.I. All authors have read and agreed to the published version of the manuscript.
Funding
This research is funded by a grant from the Japan Society for the Promotion of Science, in the framework of the Grant-in-Aid for Challenging Exploratory Research (Grant Number: 19K22893).
Institutional Review Board Statement
Not applicable.
Informed Consent Statement
Not applicable.
Data Availability Statement
Publicly available datasets were analyzed in this study.
Conflicts of Interest
The authors declare no conflict of interest.
References
- Toy, E.J.; Kummaragunta, J.V.; Yoo, J.S. Large-Scale Cross-Country Analysis of Steam Popularity. In Proceedings of the 2018 International Conference on Computational Science and Computational Intelligence (CSCI), Las Vegas, NV, USA, 12–14 December 2018; pp. 1054–1058. [Google Scholar]
- Drachen, A.; El-Nasr, M.S.; Canossa, A. Game Analytics: Maximizing the Value of Player Data; Springer: Berlin/Heidelberg, Germany, 2013. [Google Scholar]
- Young, C. 7. Unity Production: Capturing the Everyday Game Maker Market. In Game Production Studies; Amsterdam University Press: Amsterdam, The Netherlands, 2021; pp. 141–158. [Google Scholar]
- Mirza-Babaei, P.; Moosajee, N.; Drenikow, B. Playtesting for indie studios. In Proceedings of the 20th International Academic Mindtrek Conference, Tampere, Finland, 17–18 October 2016; pp. 366–374. [Google Scholar]
- Politowski, C.; Petrillo, F.; Ullmann, G.C.; Guéhéneuc, Y.G. Game industry problems: An extensive analysis of the gray literature. Inf. Softw. Technol. 2021, 134, 106538. [Google Scholar] [CrossRef]
- Edholm, H.; Lidström, M.; Steghöfer, J.P.; Burden, H. Crunch time: The reasons and effects of unpaid overtime in the games industry. In Proceedings of the 2017 IEEE/ACM 39th International Conference on Software Engineering: Software Engineering in Practice Track (ICSE-SEIP), Buenos Aires, Argentina, 20–28 May 2017; pp. 43–52. [Google Scholar]
- Lin, D.; Bezemer, C.P.; Hassan, A.E. Studying the urgent updates of popular games on the Steam platform. Empir. Softw. Eng. 2017, 22, 2095–2126. [Google Scholar] [CrossRef]
- Rizani, M.N.; Khalid, M.N.A.; Iida, H.; Malik, R.F. Analysis of Business Model Transition Based on Active User and Review Value. In Proceedings of the 15th International Conference on the Foundations of Digital Games, Bugibba, Malta, 15–18 September 2020; pp. 1–4. [Google Scholar]
- Tong, X. Positioning game review as a crucial element of game user feedback in the ongoing development of independent video games. Comput. Hum. Behav. Rep. 2021, 3, 100077. [Google Scholar] [CrossRef]
- Iida, H.; Khalid, M.N.A. Using Games to Study Law of Motions in Mind. IEEE Access 2020, 8, 138701–138709. [Google Scholar] [CrossRef]
- Khalid, M.N.A.; Iida, H. Objectivity and Subjectivity in Games: Understanding Engagement and Addiction Mechanism. IEEE Access 2021, 9, 65187–65205. [Google Scholar] [CrossRef]
- Li, X.; Lu, C.; Peltonen, J.; Zhang, Z. A statistical analysis of Steam user profiles towards personalized gamification. In Proceedings of the 3rd International GamiFIN Conference, GamiFIN 2019, Levi, Finland, 8–10 April 2019. [Google Scholar]
- Kang, H.N.; Yong, H.R.; Hwang, H.S. A Study of Analyzing on Online Game Reviews Using a Data Mining Approach: STEAM Community Data. Int. J. Innov. Manag. Technol. 2017, 8, 90. [Google Scholar] [CrossRef]
- Lin, D.; Bezemer, C.P.; Zou, Y.; Hassan, A.E. An empirical study of game reviews on the Steam platform. Empir. Softw. Eng. 2019, 24, 170–207. [Google Scholar] [CrossRef]
- Windleharth, T.W.; Jett, J.; Schmalz, M.; Lee, J.H. Full steam ahead: A conceptual analysis of user-supplied tags on Steam. Cat. Classif. Q. 2016, 54, 418–441. [Google Scholar] [CrossRef]
- Li, X.; Zhang, B. A preliminary network analysis on steam game tags: Another way of understanding game genres. In Proceedings of the 23rd International Conference on Academic Mindtrek, Tampere, Finland, 29–30 January 2020; pp. 65–73. [Google Scholar]
- Eberhard, L.; Kasper, P.; Koncar, P.; Gütl, C. Investigating Helpfulness of Video Game Reviews on the Steam Platform. In Proceedings of the 2018 Fifth International Conference on Social Networks Analysis, Management and Security (SNAMS), Valencia, Spain, 15–18 October 2018; pp. 43–50. [Google Scholar] [CrossRef]
- Busurkina, I.; Karpenko, V.; Tulubenskaya, E.; Bulygin, D. Game Experience Evaluation. A Study of Game Reviews on the Steam Platform. In Digital Transformation and Global Society. DTGS 2020. Communications in Computer and Information Science; Springer: Cham, Switzerland, 2020; pp. 117–127. [Google Scholar]
- Baumann, F.; Emmert, D.; Baumgartl, H.; Buettner, R. Hardcore Gamer Profiling: Results from an unsupervised learning approach to playing behavior on the Steam platform. Procedia Comput. Sci. 2018, 126, 1289–1297. [Google Scholar] [CrossRef]
- Vihanga, D.; Barlow, M.; Lakshika, E.; Kasmarik, K. Weekly Seasonal Player Population Patterns in Online Games: A Time Series Clustering Approach. In Proceedings of the 2019 IEEE Conference on Games (CoG), London, UK, 20–23 August 2019; pp. 1–8. [Google Scholar] [CrossRef]
- Ranti, K.S.; Salim, K.; Girsang, A.S. Clustering steam user behavior data using K-Prototypes algorithm. J. Phys. Conf. Ser. 2020, 725, 012018. [Google Scholar] [CrossRef]
- Wang, D.; Moh, M.; Moh, T.S. Using Deep Learning and Steam User Data for Better Video Game Recommendations. In Proceedings of the 2020 ACM Southeast Conference, Tampa, FL, USA, 2–4 April 2020; pp. 154–159. [Google Scholar]
- Ahmad Kamal, A.S.b.; Saaidin, S.; Kassim, M. Recommender System: Rating predictions of Steam Games Based on Genre and Topic Modelling. In Proceedings of the 2020 IEEE International Conference on Automatic Control and Intelligent Systems (I2CACIS), Shah Alam, Malaysia, 20 June 2020; pp. 212–218. [Google Scholar] [CrossRef]
- Bujari, A.; Quadrio, G.; Palazzi, C.E.; Ronzani, D.; Maggiorini, D.; Ripamonti, L.A. Network traffic analysis of the steam game system. In Proceedings of the 2017 14th IEEE Annual Consumer Communications & Networking Conference (CCNC), Las Vegas, NV, USA, 8–11 January 2017; pp. 716–719. [Google Scholar]
- Tabuyo-Benito, R.; Bahsi, H.; Peris-Lopez, P. Forensics Analysis of an On-line Game over Steam Platform. In Digital Forensics and Cyber Crime. ICDF2C 2018; Lecture Notes of the Institute for Computer Sciences, Social Informatics and Telecommunications Engineering; Springer: Cham, Switzerland, 2018; pp. 106–127. [Google Scholar]
- Gandolfi, E. Enjoying death among gamers, viewers, and users: A network visualization of Dark Souls 3’s trends on Twitch. tv and Steam platforms. Inf. Vis. 2018, 17, 218–238. [Google Scholar] [CrossRef]
- Lin, D.; Bezemer, C.P.; Hassan, A.E. An empirical study of early access games on the Steam platform. Empir. Softw. Eng. 2018, 23, 771–799. [Google Scholar] [CrossRef]
- Bailey, E.; Miyata, K. Improving video game project scope decisions with data: An analysis of achievements and game completion rates. Entertain. Comput. 2019, 31, 100299. [Google Scholar] [CrossRef]
- Li, X.; Zhang, Z.; Stefanidis, K. A data-driven approach for video game playability analysis based on players’ reviews. Information 2021, 12, 129. [Google Scholar] [CrossRef]
- Ullmann, G.C.; Politowski, C.; Guéhéneuc, Y.G.; Petrillo, F. What Makes a Game High-rated? Towards Factors of Video Game Success. In Proceedings of the 2022 IEEE/ACM 6th International Workshop on Games and Software Engineering (GAS), Pittsburgh, PA, USA, 20 May 2022; pp. 16–23. [Google Scholar] [CrossRef]
- Du, L. Steam Game Discount Prediction Using Machine Learning Methods. In Proceedings of the 2021 3rd International Conference on Machine Learning, Big Data and Business Intelligence (MLBDBI), Taiyuan, China, 3–5 December 2021; pp. 149–152. [Google Scholar] [CrossRef]
- Badoni, P.; Katal, A.; Reddy, M.S.; Bhargava, M. Graphics vs. Gameplay: A Comparative Analysis in Gaming. In Proceedings of the 2022 2nd International Conference on Intelligent Technologies (CONIT), Hubli, India, 24–26 June 2022; pp. 1–8. [Google Scholar] [CrossRef]
- Xiaohan, K.; Khalid, M.N.A.; Iida, H. Player satisfaction model and its implication to cultural change. IEEE Access 2020, 8, 184375–184382. [Google Scholar] [CrossRef]
- Primanita, A.; Khalid, M.N.A.; Iida, H. Computing games: Bridging the gap between search and entertainment. IEEE Access 2021, 9, 72087–72102. [Google Scholar] [CrossRef]
- Anunpattana, P.; Khalid, M.N.A.; Iida, H.; Inchamnan, W. Capturing potential impact of challenge-based gamification on gamified quizzing in the classroom. Heliyon 2021, 7, e08637. [Google Scholar] [CrossRef]
- Aung, H.P.P.; Khalid, M.N.A.; Iida, H. What Constitutes Fairness in Games? A Case Study with Scrabble. Information 2021, 12, 352. [Google Scholar] [CrossRef]
- Kang, X.; Ri, H.; Khalid, M.N.A.; Iida, H. Addictive Games: Case Study on Multi-Armed Bandit Game. Information 2021, 12, 521. [Google Scholar] [CrossRef]
- Zhang, Z.; Xiaohan, K.; Khalid, M.N.A.; Iida, H. Bridging Ride and Play Comfort. Information 2021, 12, 119. [Google Scholar] [CrossRef]
- Gao, Y.; Liu, C.; Gao, N.; Khalid, M.N.A.; Iida, H. Nature of arcade games. Entertain. Comput. 2022, 41, 100469. [Google Scholar] [CrossRef]
- Zhang, Z.; Gao, N.; Li, S.; Khalid, M.N.A.; Iida, H. Action Games Evolution Analysis: A Case Study Using the God of War Series. IEEE Access 2022, 10, 123697–123710. [Google Scholar] [CrossRef]
- Macrae, N. John von Neumann: The Scientific Genius Who Pioneered the Modern Computer, Game Theory, Nuclear Deterrence, and Much More; Plunkett Lake Press: Lexington, MA, USA, 2019. [Google Scholar]
- Skinner, B.F. ’Superstition’ in the pigeon. J. Exp. Psychol. 1948, 38, 168. [Google Scholar] [CrossRef] [PubMed]
- James, R.J.; O’Malley, C.; Tunney, R.J. Understanding the psychology of mobile gambling: A behavioural synthesis. Br. J. Psychol. 2017, 108, 608–625. [Google Scholar] [CrossRef] [PubMed]
- Csikszentmihalyi, M. Flow: The Psychology of Optimal Experience; Harper & Row: New York, NY, USA, 1990. [Google Scholar]
- Johnson, D.; Klarkowski, M.; Vella, K.; Phillips, C.; McEwan, M.; Watling, C.N. Greater rewards in videogames lead to more presence, enjoyment and effort. Comput. Hum. Behav. 2018, 87, 66–74. [Google Scholar] [CrossRef]
- Anderson, S.L. Extraludic narratives: Online communities and video games. Transform. Work. Cult. 2018, 28. [Google Scholar] [CrossRef]
- Lundblade, K. Crowning Achievements: A historioludic analysis of the achievement metagame in historical simulation games. In Proceedings of the 16th International Conference on the Foundations of Digital Games (FDG) 2021, Montreal, QC, Canada, 3–6 August 2021; pp. 1–11. [Google Scholar]
- Hernandez, D.; Gbadamosi, C.T.T.; Goodman, J.; Walker, J.A. Metagame Autobalancing for Competitive Multiplayer Games. In Proceedings of the 2020 IEEE Conference on Games (CoG), Osaka, Japan, 24–27 August 2020; pp. 275–282. [Google Scholar]
- Reis, S.; Reis, L.P.; Lau, N. VGC AI Competition-A New Model of Meta-Game Balance AI Competition. In Proceedings of the 2021 IEEE Conference on Games (CoG), Copenhagen, Denmar, 17–20 August 2021; pp. 1–8. [Google Scholar]
- Walker, P. Early Access Popularity Growing, but Only 25% Have Released as a Full Game. 2014. Available online: https://www.gamesindustry.biz/articles/2014-11-13-early-access-popularity-growing-but-only-25-percent-have-released-as-a-full-game (accessed on 5 January 2021).
- Taylor, H. Major Slowdown for Number of New Releases on Steam in 2019. 2020. Available online: https://www.gamesindustry.biz/articles/2020-01-07-major-slowdown-for-number-of-new-releases-on-steam-in-2019 (accessed on 28 December 2020).
- Bailey, D. Games Released in 2019. 2020. Available online: https://www.pcgamesn.com/steam/games-released-in-2019 (accessed on 28 December 2020).
- Desatoff, S. Year Over Year Game Release Numbers Slowed for Steam in 2019. 2020. Available online: https://gamedaily.biz/article/1489/year-over-year-game-release-numbers-slowed-for-steam-in-2019 (accessed on 28 December 2020).
- Ahmad, D. Steam Spy Estimation—Daniel Ahmad. 2020. Available online: https://twitter.com/ZhugeEX/status/1215016446025228288 (accessed on 28 December 2020).
- Direct, S. Steam Direct. 2017. Available online: https://partner.steamgames.com/steamdirect (accessed on 28 December 2020).
- How to Set the Right Price for Your Game. Available online: https://xsolla.com/blog/how-to-set-the-right-price-for-your-game (accessed on 25 October 2022).
- Khomych, A. Indie vs. Game Publisher: What Is Better for Your Game? 2022. Available online: https://blog.getsocial.im/indie-vs-game-publisher-whats-better-for-your-game/ (accessed on 22 August 2022).
- Pedregosa, F.; Varoquaux, G.; Gramfort, A.; Michel, V.; Thirion, B.; Grisel, O.; Blondel, M.; Prettenhofer, P.; Weiss, R.; Dubourg, V.; et al. Scikit-learn: Machine Learning in Python. J. Mach. Learn. Res. 2011, 12, 2825–2830. [Google Scholar]
- de Salas, K.; Lewis, I. Identifying types of Achievements. In Proceedings of the CGAMES’2013 USA, Louisville, KY, USA, 30 July–1 August 2013; pp. 23–30. [Google Scholar] [CrossRef]
- Steam. More Changes Addressing Fake Games. 2018. Available online: https://steamcommunity.com/groups/steamworks/announcements/detail/3077529424431732424 (accessed on 28 January 2022).
- Valve. Counter-Strike: Global Offensive. 2012. Available online: https://store.steampowered.com/app/730/CounterStrike_Global_Offensive/ (accessed on 1 August 2021).
- Vaudour, F.; Heinze, A. Software as a service: Lessons from the video game industry. Glob. Bus. Organ. Excell. 2020, 39, 31–40. [Google Scholar] [CrossRef]
- Zanescu, A.; Lajeunesse, M.; French, M. Speculating on steam: Consumption in the gamblified platform ecosystem. J. Consum. Cult. 2021, 21, 34–51. [Google Scholar] [CrossRef]
- Lickteig, S.J. Metagaming: Cognition in Gaming Environments and Systems; Kansas State University: Manhattan, KS, USA, 2020. [Google Scholar]
- Thorhauge, A.M.; Nielsen, R.K. Epic, Steam, and the role of skin-betting in game (platform) economies. J. Consum. Cult. 2021, 21, 52–67. [Google Scholar] [CrossRef]
- Businge, J.; Openja, M.; Kavaler, D.; Bainomugisha, E.; Khomh, F.; Filkov, V. Studying android app popularity by cross-linking github and google play store. In Proceedings of the 2019 IEEE 26th International Conference on Software Analysis, Evolution and Reengineering (SANER), Hangzhou, China, 24–27 February 2019; pp. 287–297. [Google Scholar]
- Steam. Introducing Steam Reviews. Available online: https://store.steampowered.com/reviews/ (accessed on 11 July 2022).
Figure 1.
Objective and subjective reinforcement when .

Figure 2.
Objective and subjective reinforcement difference when .

Figure 3.
An overview of data processing and merging.

Figure 4.
Statistics of game releases based on new developers and indie games.

Figure 5.
Number of game type (multiplayer, single-player, and both) released over the year for non-indie games.
Figure 5.
Number of game type (multiplayer, single-player, and both) released over the year for non-indie games.

Figure 6.
Number of game type (multiplayer, single-player, and both) released over the year for indie games.
Figure 6.
Number of game type (multiplayer, single-player, and both) released over the year for indie games.

Figure 7.
Players’ ratings of game types released over the year for (a) non-indie games and (b) indie games.
Figure 7.
Players’ ratings of game types released over the year for (a) non-indie games and (b) indie games.

Figure 8.
Steam ratings of game types released over the year for (a) non-indie games and (b) indie games.
Figure 8.
Steam ratings of game types released over the year for (a) non-indie games and (b) indie games.

Figure 9.
Prices of game types released over the year for (a) non-indie games and (b) indie games.

Figure 10.
Average total ratings of games based on (a) development experience (Average total ratings of games from new or veteran developers based on non-indie and indie game developers) and (b) publishing options for indie and non-indie game developers (Average total ratings of games from games that are published via publishers based on non-indie and indie game developers).

Figure 11.
Price of game types over the rating total they received for (a) non-indie games and (b) indie games.
Figure 11.
Price of game types over the rating total they received for (a) non-indie games and (b) indie games.

Figure 12.
The positive rating ratio provided by (a) clusters (Boxplot of positive rating ratio grouped by game clusters) and (b) against the total ratings (Scatter plot of positive rating ratio against total rating based on game types).
Figure 12.
The positive rating ratio provided by (a) clusters (Boxplot of positive rating ratio grouped by game clusters) and (b) against the total ratings (Scatter plot of positive rating ratio against total rating based on game types).

Figure 13.
An envisioned “experience-driven” business model.


Table 1.
Literature summary of the previous works conducted on Steam platform.
| Citation | Contribution Summary | Relation to Our Works |
|---|---|---|
| [15] | Conceptual analysis | Data features |
| [13] | Predict significant reviews | Data features |
| [16] | Genre classification | Data features |
| [24] | Networking feasibility | Data features |
| [17] | Useful review features | Data features |
| [25] | Discover security problem | Data features |
| [19] | Behavioral categorization | User profiling |
| [26] | Media influence on platform | Decision support |
| [1] | Market pattern | Business modeling |
| [27] | Early access impact | Business modeling |
| [14] | Perceived quality from review | Data features |
| [12] | Personality and preferences | User profiling |
| [20] | Play pattern | User profiling |
| [28] | Development decision | Decision support |
| [18] | User motivation from review | Data features |
| [21] | Play and purchasing pattern | Business modeling |
| [8] | Impact of business shift | Business modeling |
| [22] | Game recommendation | Decision support |
| [23] | Predict game rating | Decision support |
| [31] | Predict game discounting | Decision support |
| [29] | Playability based on review | Data features |
| [30] | Aspects of highly-rated games | Data features |
| [32] | Attractive aspect | Decision support |
Table 2.
Analogical link between physics and game (adopted from Iida and Khalid [10]).
Table 2.
Analogical link between physics and game (adopted from Iida and Khalid [10]).
| Notation | Motion Context | Game Context |
|---|---|---|
| y | Displacement | Solved uncertainty |
| t | Time | Progress or length |
| v | Velocity | Solving rate |
| M | Mass | Solving hardness, m |
| g | Acceleration (gravity) | Acceleration, a (Thrills) |
| F | Newtonian force | Force in mind |
| Momentum | Momentum (Freedom) | |
| U | Potential energy | Potential energy, |
Table 3.
Data summary of the three Steam data sources.
| Data Name | Rows | Columns |
|---|---|---|
| Steam Store | 57,155 | 39 |
| Steam Achievement | 32,378 | 4 |
| SteamSpy | 55,915 | 20 |
Table 4.
Correlation between game prices and game rating.
| Game Type | Indie Games | Non-Indie Games |
|---|---|---|
| Single-player | (0.33, ) | (0.34, ) |
| Multiplayer | (0.35, ) | (0.36, ) |
| Both | (0.37, ) | (0.44, ) |
Table 5.
Correlation between number of achievements and game ratings.
| Game Type | Indie Games | Non-Indie Games |
|---|---|---|
| Single-player | (0.241, ) | (0.410, ) |
| Multiplayer | (0.394, ) | (0.473, ) |
| Both | (0.335, ) | (0.560, ) |
Table 6.
Clustering results of the game data analysis.
| k | Size | Labels | Characteristics |
|---|---|---|---|
| 1 | 15,200 | Single-player Games | Single-player games only |
| 2 | 5873 | Multiplayer Games | Multiplayer supported games only (including single-player games with multiplayer support) |
| 3 | 6407 | Games with Great Achievements | High average global achievement percentage, mix of single- and multiplayer games |
| 4 | 105 | Achievement Spam Games | Highest average achievement quantity per game, lowest average price, and lowest average rating total |
| 5 | 1 | Highly Rated Games | Counter-Strike: Global Offensive, most rated game on steam |
Table 7.
Correlation between number and percentage of achievements and rating of Cluster 3.
| Game Type | n_acv to Percentage | n_acv to Rating |
|---|---|---|
| Single-player | (−0.098, ) | (0.235, ) |
| Multiplayer | (−0.470, ) | (0.199, ) |
| Both | (−0.639, ) | (0.120, ) |
Table 8.
v correlation to total rating, achievement percentage, number of achievements, and number of days since the game is released.
Table 8.
v correlation to total rating, achievement percentage, number of achievements, and number of days since the game is released.
| Developer Type | v | |||
|---|---|---|---|---|
| Total Rating | Percentage | n_acv | n_days | |
| Indie | (0.01, ) | (0.10, ) | (0.06, ) | (−0.22, ) |
| Non-Indie | (0.02, ) | (0.23, ) | (0.01, ) | (−0.23, ) |
Table 9.
Regression analysis result for games’ total ratings.
| Model | MSE | RMSE | MAE | R2 |
|---|---|---|---|---|
| Random Forest | 12,831,403.471 | 3582.095 | 261.983 | 0.753 |
Disclaimer/Publisher’s Note: The statements, opinions and data contained in all publications are solely those of the individual author(s) and contributor(s) and not of MDPI and/or the editor(s). MDPI and/or the editor(s) disclaim responsibility for any injury to people or property resulting from any ideas, methods, instructions or products referred to in the content. |
© 2023 by the authors. Licensee MDPI, Basel, Switzerland. This article is an open access article distributed under the terms and conditions of the Creative Commons Attribution (CC BY) license (https://creativecommons.org/licenses/by/4.0/).
Share and Cite
MDPI and ACS Style
Rizani, M.N.; Khalid, M.N.A.; Iida, H. Application of Meta-Gaming Concept to the Publishing Platform: Analysis of the Steam Games Platform. Information 2023, 14, 110. https://doi.org/10.3390/info14020110
AMA Style
Rizani MN, Khalid MNA, Iida H. Application of Meta-Gaming Concept to the Publishing Platform: Analysis of the Steam Games Platform. Information. 2023; 14(2):110. https://doi.org/10.3390/info14020110
Chicago/Turabian StyleRizani, Muhammad Nazhif, Mohd Nor Akmal Khalid, and Hiroyuki Iida. 2023. "Application of Meta-Gaming Concept to the Publishing Platform: Analysis of the Steam Games Platform" Information 14, no. 2: 110. https://doi.org/10.3390/info14020110
Note that from the first issue of 2016, this journal uses article numbers instead of page numbers. See further details here.