
A Test Management System to Support Remote Usability Assessment of Web Applications


1
Department of Industrial Engineering and Mathematical Sciences, Università Politecnica delle Marche, Via Brecce Bianche 12, 60131 Ancona, Italy
2
Department of Economics, Università degli Studi di Macerata, Piazza San Vincenzo Maria Strambi 1, 62100 Macerata, Italy
3
Department of Education, Cultural Heritage and Tourism, Università degli Studi di Macerata, P.le Luigi Bertelli 1, 62100 Macerata, Italy
*
Author to whom correspondence should be addressed.
Information 2022, 13(10), 505; https://doi.org/10.3390/info13100505
Submission received: 25 August 2022
/
Revised: 14 October 2022
/
Accepted: 15 October 2022
/
Published: 20 October 2022
Abstract
:Nowadays, web designers are forced to have an even deeper perception of how users approach their products in terms of user experience and usability. Remote Usability Testing (RUT) is the most appropriate tool to assess the usability of web platforms by measuring the level of user attention, satisfaction, and productivity. RUT does not require the physical presence of users and evaluators, but for this very reason makes data collection more difficult. To simplify data collection and analysis and help RUT moderators collect and analyze user’s data in a non-intrusive manner, this research work proposes a low-cost comprehensive framework based on Deep Learning algorithms. The proposed framework, called Miora, employs facial expression recognition, gaze recognition, and analytics algorithms to capture data about other information of interest for in-depth usability analysis, such as interactions with the analyzed software. It uses a comprehensive evaluation methodology to elicit information about usability metrics and presents the results in a series of graphs and statistics so that the moderator can intuitively analyze the different trends related to the KPI used as usability indicators. To demonstrate how the proposed framework could facilitate the collection of large amounts of data and enable moderators to conduct both remote formative and summative tests in a more efficient way than traditional lab-based usability testing, two case studies have been presented: the analysis of an online shop and of a management platform. Obtained results suggest that this framework can be employed in remote usability testing to conduct both formative and summative tests.
1. Introduction
Following the popularisation of the World Wide Web, companies today see the benefits of researching and developing their web platforms with user-oriented methods to make their users proficient at completing their tasks with as little effort as possible on their part. Usability assessment helps achieve that by collecting data about the user’s interaction with the platform, such as their level of satisfaction or attention when performing a task, and transforming that data into KPIs, insight, and eventually designing a better product and providing an overall better experience [1]. Many products that are technically well-designed fail to meet the human or organisational purposes they were designed to serve. Studies have confirmed the problems of new product commercialization, where the main culprit is a faulty understanding of customer needs [2]. Indeed, many new products fail not because of technical shortcomings but because they have no market [3]. In a market where the goal of a product is defined by the user, the overall acceptability of a product is a combination of its social acceptability and its practical acceptability, and it answers the question of whether the product can satisfy the needs and requirements of the users [4]. Thus, determining people’s true, underlying needs is cardinal to delivering products and services that help them.
Usability is defined as the ability of the user to use the product to carry out a specific task successfully with accuracy and speed and is regarded as an essential concept for evaluating system adoption, where satisfaction plays a paramount role. This active area of research in the field of Human–Computer Interaction (HCI) involves understanding the various design principles that come together to create a user’s experience when using a product or service. To understand users’ opinion, usability practitioners conduct tests that measure acceptance of a product with quantitative or qualitative metrics. One such set of metrics is given by the ISO 9241-11:2018 [5] standard of usability. This definition exposes three metrics which should be addressed when measuring the usability of a product: effectiveness, efficiency, and user satisfaction. Effectiveness measures the dichotomous variable of whether users can achieve their goals and complete their tasks, as discussed in [6], whereas efficiency measures the resources it takes the users to achieve these goals, and it is often related in terms of time, effort, costs, and materials needed to complete their tasks. Satisfaction consists of positive attitudes, emotions, and/or comfort resulting from use of the product. These three aspects relate to the cognitive, affective, and psychomotor responses of an individual [7], and it helps usability practitioners understand whether the users are having a positive experience when using or when learning to use the product. Satisfaction can be measured through user feedback such as questionnaires [8,9], or through observational methods such as facial expression analysis for emotion recognition [10,11]. The ISO 9241-11:2018 expanded definition of usability includes other metrics, such as ease of learning, memorability, and error frequency. They measure how quickly new users can learn to use the product, how easily they can remember how to use it, the frequency of errors made in the process of learning and whether the users can recover from them.
To assess users’ satisfaction on a web platform from the three aspects of cognitive, affective, and psychomotor, it is necessary to determine which are the most appropriate methods to measure the above metrics. The authors of [12] classify the experience a user can have on a web platform based on the user’s perception, cognition, and behaviour. They and other researchers [13,14,15] recall that user experience is measured by different constructs related to usability, user perception and human emotional response, and that each method by itself is not able to uncover the true emotional experience. The research conducted by [16] shows that various factors influence the use of one web platform over another, such as navigation, content, accessibility, or appearance. On the other hand, the research conducted by Munin et al. [11] shows that emotions are an indispensable part of the user experience when interacting with a system and that several works in the literature have attempted to build an accurate emotion detection model. Lastly, the integration of accurate and cost-effective eye tracking tools into usability evaluation methodology is possible thanks to the works of [17,18,19]. The challenge is to bring together all these methods for assessing web usability and choosing the appropriate environment, either in the lab or remotely.
Traditionally, usability tests are conducted in dedicated laboratories managed by usability experts who typically had education and training as cognitive scientists, experimental psychologists, or human factor engineers [20], and equipped with one-way mirrors and sophisticated video and audio recording facilities which enable facilitators to interact with and observe the tester, recording their on-screen actions, facial expression, and interaction logs while participants are asked to accomplish specific tasks. Costs associated with this approach include ownership of the laboratory, hiring staff, and recruiting testers. Further costs consist of travel cost of recruited participants, time spent setting up usability tests and conducting them [21]. As such, lab-based usability testing (LBUT) is an expensive, time-consuming, and rigorous process. Therefore, traditional tests are particularly limiting and problematic to organise, while the need to perform more and more remote tests (both synchronous and asynchronous) has been felt more than ever in the last two years, due to the spread of the COVID pandemic forcing many researchers to work remotely from their homes and imposing restrictions on visiting users. Current AI-based techniques and technologies enable usability practitioners to collect and analyse large amounts of data locally during system testing, such as audios and videos, and to record user emotions, shifting the focus to a different set of challenges, namely optimising convolutional networks and classification algorithms to achieve real-time performance [17], or collecting data from different devices, or improving data interpretation through multimodal channels [13,14]. These days, usability testing can be conducted with a laptop and the software that people use every day, allowing facilitators to work remotely.
The situation outlined so far naturally leads to the question of how remote usability testing (RUT) of web platforms can be effectively conducted and what tools are appropriate to gather the necessary data and to evaluate metrics for satisfaction, attention level, and productivity. The goal of this paper is to address these issues and propose a web-based platform for remote usability assessment combining emotion and metrics analysis facilitating the job of the moderators during RUT sessions. The purpose of this platform is to assist the evaluator in data collection while simplifying web application data collection and analysis by automatically providing initial quantitative analysis and a comprehensive toolset that allows moderators to create usability tests, record user interactions with the web platform, and summarise data to gain insights. Our tool requires no special training or set-up of tools to perform remote usability testing and can be easily configured to be used iteratively for evaluation and possibly redesign when usability issues arise using formative testing. We begin by reviewing the challenges a usability professional faces when performing usability testing. Next, we describe a comprehensive evaluation methodology outlined by several articles in the literature upon which we based our remote usability testing tool. We then review existing platforms and toolkits that can support practitioners and discuss design considerations from a software and user interaction perspective. Next, we describe the overall architecture of the platform and its main functionalities. We conclude by discussing the potential and limitations of the proposed tool by means of application case studies related to the usability analysis of two target web platforms via summative testing.
2. Research Background
2.1. Usability Testing
The activity whose objective is measuring the usability of a product is called usability testing and its goal is to identify any usability problem, collect qualitative and quantitative data and determine the user’s satisfaction by testing the product with representative users. In web usability testing, moderators work to locate relevant troubles by trying to understand what visitors do when they are on a website, such as determining if users take part in specific actions developers want them to take. Moderators need tools that allow them to analyse user behaviour, for instance, by indicating the average time on page, bounce rate, or the path visitors most commonly take during a site visit from when they enter until they leave, in order to grasp an individual user’s experience with the website, their perception of the site, or their engagement with it. One of the benefits of usability testing is not just finding out whether usability requirements have been met but to also find out why those requirements have or have not been met [22].
Usability practitioners, as defined in [23], can perform two types of testing depending on when the usability test is conducted and the objective of the study: formative testing and summative testing. Formative testing refers to the testing conducted when the product is still in development. Formative tests will produce a list of findings to analyse and fix, which in turn provide great insights to developers that can be put into action right away. Another small study can be subsequently conducted to see whether the fixes worked, in an iterative design process that can be integrated in an agile workflow. Formative testing is commonly recognized as an effective means to understanding users’ goals, motivations, and engagement with the product, when it incorporates the essential elements of small usability studies described by Barnum [20]. On the other hand, summative testing is conducted when the product is nearly finished or finished, with a goal of establishing a baseline of metrics validating that the product meets requirements. Different types of metrics can be obtained by conducting usability tests, such as average time on task, completion rates, error rates, and optimal navigation path. Thus, summative tests require many experiments to achieve statistical validity, and they incorporate the essential elements of large usability studies [20].
Challenges faced by practitioners include taking participants through relevant tasks, collecting data, and selecting appropriate usability testing methods. The latter depends on the actual goal of the facilitator, whether they want to conduct a small-scale formative test or a large-scale summative test, and whether they want to conduct the tests remotely. In the general software industry, it is increasingly recognized that continued evaluation via small studies, of four or five users, is needed throughout the system development life cycle, from early design to summative testing, to ensure that final products meet expectations of designers, users, and organisations [24]. Furthermore, Ref. [25] found that the maximum cost–benefit ratio, as determined by weighing the cost of testing against the benefits obtained, was achieved with tests involving three to five participants, because “the same things repeat themselves after the fifth user”, and the optimal yield of 85% of the insights to be captured has been reached. Quantitative usability studies require testing more than twenty users to get reasonably tight confidence intervals on the results, and thus are approximately four times as expensive as conducting qualitative ones. Ultimately, the goal of academic practitioners is the dissemination of research findings to the public through a formal publication, whereas the work of industry usability practitioners fundamentally focuses on the role of product owners within organisations as stakeholders and includes justifying the benefits considering the costs [26].
2.2. Methods and Tools for Web Usability Assessment
The variety and the complexity of the experience users could have on the web can be categorised in three sections, user’s perception, i.e., the process of identifying and interpreting the stimuli of the external world through one’s sensory organs, recognition, i.e., the process of determining an action plan to achieve a goal by evaluating the input information, and behaviour, i.e., the process of executing the action plan [12]. They also find that the use of different observation methods is effective in evaluating web usability, and that each experience demands a specific evaluation method, and in their totality for a comprehensive evaluation methodology which integrates self-reported (e.g., Questionnaire for User Interaction Satisfaction (QUIS) [27], Software Usability Measurement Inventory (SUMI) [8], Web Site Analysis and MeasureMent Inventory (WAMMI) [28] specifically developed for web platforms, and System Usability Scale (SUS) [9]), observational, and physiological evaluation methods [13,14,15]. Observational methods consist of non-intrusive means of acquiring behavioural data regarding the performance, the efficiency, and the errors while the users interact with the product. It helps resolve issues regarding self-reported methods when the users are unaware of the observation. Observational methods include video-based facial expression analysis [11], emotion recognition from human voice [13], and tracking user interaction by logging user actions [14]. Facial expression analysis can be used to understand a person’s emotional response by employing an emotion and valence model, where valence is the intrinsic attractiveness (positive) or averseness (negative) of a situation and is associated with the emotion being expressed [29]. Most facial expression recognition systems employ Convolutional Neural Networks (CNN), machine learning models trained with data either collected in controlled environments or in real contexts [30]. The Face Action Coding System (FACS) is the theoretical model most widely used in the analysis of facial expressions to develop algorithms for the recognition of emotions. It detects muscle groups in action and allows for the identification and classification of emotions into seven distinguishable expressions such as happiness, sadness, contempt, disgust, fear, surprise, or neutrality [31]. Emotions can also be recognized in the human voice. Hussain et al. [13] measure human emotions by analysing the human voice collected through a microphone and classifying the incoming audio in the seven expressions previously introduced. The most significant features for audio-based emotion recognition are intensity, duration, pitch, and spectral energy distribution [32]. Although these approaches for automatic recognition of human emotions are widely used in a variety of contexts, they are sometimes criticised for poor accuracy when used in contexts different from their training data and for underlying biases (e.g., representativeness of their training data) [33,34,35]. Lastly, physiological evaluation methods employ biometric sensors and eye tracking tools for collecting physical information (engagement, stress, attention, fatigue) regarding users’ perception as quantifiable data. Biometric sensors such as electroencephalography (EEG), electrocardiogram (ECG) and electromyogram (EMG) can record the physiological signals which are the main sources of emotion in our body and are more accurate because the user cannot control those signals [36]. They can be used to validate or enrich the information obtained via the previously mentioned methods, to extract the actual user perception of the product and detect engagement [37]. All biometric sensors were first developed for medical purposes and attempts have been made at applying them in uncontrolled environments, although biometric sensors mostly remain intrusive methods. However, the authors of [38] succeeded in creating a wearable in-ear EEG device for emotion classification and monitoring with good accuracy in out-of-hospital or home-based caring models. However, eye tracking sensors can also be employed in uncontrolled environments, as shown by the extensive research conducted in [39]. Eye tracking sensors capture the eye movements and detect engagement, arousal, stress, and fatigue during a user’s interaction with the product. They do so by recording metrics, such as fixation duration, gaze direction, and pupil size which are associated with information search, information processing, and cognitive workload [40]. The correlation between eye movements and end user perception and acceptance in modern web-based End-User Development (EUD) was investigated by Tzafilkou and Protogeros [18]. Eye tracking models employ CNNs that are trained to account for and reduce inaccuracies in the measurements due to the rotation of the head. One of the more solid CNNs proposed for gaze tracking is the one by Krafka et al. [17], who aimed at making eye tracking available for everyone by developing software that works on commodity hardware such as mobile phones and tablets. In conclusion, no evaluation method alone can suffice to a complete usability evaluation, and thus the importance of employing a comprehensive evaluation methodology emerges [15]. In this context, our aim is to provide a tool for remote usability testing that is easily accessible and simple to use, leveraging a selection of evaluation methods most appropriate for that goal.
Remote usability testing is the act of conducting user research remotely, rather than in laboratories. Remote studies offer the opportunity to observe the product in development on a variety of several configurations, e.g., a web application running on different operating systems, screen resolutions, and internet connection speeds. There are two approaches to remote usability: remote moderated usability testing, where moderators and observers may use online screen sharing software and webcams to observe the participants actions and their facial expressions in real time, and remote unmoderated usability testing, where observers watch session recording instead and the users are not inhibited by being under observation and, instead, they can act naturally in their familiar environment [41]. In the first approach, the moderators, the participants, and the observers do not share the same physical space. They perform tests using online meeting tools, such as WebEx, Zoom, or Skype, and the participants can share their thoughts using the think-aloud protocol. However, researchers’ opinion is divided over the use of such protocols when conducting large studies because it may affect the accuracy of the metrics being collected [42]. Therefore, the team must decide whether to engage with the participant during a summative test or wait until the participant completes the task. It is generally more economically accessible to conduct large studies via an unmoderated approach [43]. Remote studies have the advantage of being independent of time zones, leading to an increasing pool of potential participants via decentralisation—a technique particularly valuable for international companies—and reducing costs [41]. However, everyone does not necessarily have the required devices (i.e., a computer and a webcam) to join a usability testing session, whereas a slow Internet connection can cause delays in both audio and video, or cause people to talk over each other unintentionally. During a remote usability testing session, it may also be more difficult to infer the meaning of silence, or to identify whether the user is being distracted by an object that cannot be spotted via video or screen share. Remote unmoderated usability testing involves automation to some degree, and, depending on the application being used, several metrics can be collected while conducting the tests. For instance, keystrokes, mouse clicks, taps, and swipes, completion times and all time-related variables can be recorded and analysed later, leaving the moderator the liberty of focusing on watching the session recording and collecting qualitative data [20].
2.3. Related Work
Several commercial tools offered by web companies employ user interaction tracking to infer information regarding efficiency and productivity via analytical trackers. The latter are software systems that trace user interactions and collect quantitative data such as keystrokes, mouse clicks, scroll percentages and timestamps, producing KPIs which, however, do not reflect the users’ intention and emotions. One such system is Google Analytics [44]. It tracks data on a website by first configuring a snippet in JavaScript language. That snippet collects all the information about users’ activity and places a cookie on the user’s device that provides additional anonymous information. Google Analytics provides usability moderators with some of the previously discussed methods to enrich usability data. For instance, it offers “Behaviour reports” to understand what visitors do when they are on a website, such as determining if users take part in specific actions developers want them to take. The purpose of these reports is to analyse user behaviour, indicating the average time on page, bounce rate, or the path visitors most commonly take during a site visit. These reports, however, do not provide information about an individual user’s experience with the website, their perception of the site, or their engagement with it.
Most web-based companies provide this kind of service as well as some kind of automated data collection and analysis. UserZoom [45] is a research platform that offers remote usability testing, recruiting, and data collection services for businesses. They employ a cloud-based platform where they offer a wide variety of testing types such as Click Testing, Card Sorting, and Screen Recording. The testers must first create an account to participate in the various tasks. They recently acquired Validately [46], another user research and testing platform that offers both moderated and unmoderated remote usability tests to its users. These tests use the think-aloud protocol and may also include follow-up questions and questionnaires to provide the owners of the sites with feedback to improve their websites design. UserTesting [47] is yet another platform offering video recordings, quantitative metrics, and analytics where moderators can observe the user’s facial expressions and hear their tone of voice and intonation. On the other hand, Userlytics [48] offers AI powered transcripts of user audio recordings as they complete tests. They also provide moderators with a diverse set of testing methodologies, such as Card Sorting and Tree Testing, and both remote moderated and unmoderated usability testing approaches. However, neither UserTesting nor Userlytics offer a tool to retrieve in an automatic way user’s satisfaction and behavioural data. Lastly, Hotjar [49] offers Heatmaps, session recordings and inbound feedback to help collect data on how people interact with and experience a website. They also offer no tool for the automatic analysis of user behaviour besides clicks or mouse movements. There are several other commercial tools, but they do not provide a comprehensive evaluation methodology like the one we have described in the previous chapter. Although the use of tools such as biometric sensors would enrich the information obtained through the other usability methods mentioned, they are not as widely used in remote usability testing as eye tracking sensors. For instance, Tobii [50], a leader in eye tracking and pioneer in attention computing, integrates eye tracking, facial expression analysis, electrodermal activity and real-time survey data with iMotions software. This allows usability professionals to instantly quantify and annotate behavioural reactions to the website under analysis. They also advocate for the combination of biosensory data streams which provide a more nuanced and detailed understanding of user experiences and interactions, beyond those gained from focus groups, isolated eye tracking heat maps, or retrospective think-aloud. Our goal is to provide a tool as rich and complex as Tobii’s, but with additional KPIs derived also from the analysis of emotions and aimed at a complete evaluation of the usability metrics presented in the first chapter. To this end, we also analysed recently developed academic tools.
Several solutions have been proposed in literature to ease the analysis process. For example, Franco et al. [14] present UXmood, a tool that condenses audio, video, text, and eye-tracking data in a “dashboard of coordinated visualisations”. This tool also collects logs of user interaction and allows for replaying sessions of tests while supporting brushing and details-on-demand interactions which are synchronised with a temporal slider, allowing moderators to see specific moments of the tests freely. Moreover, it infers user sentiment via a multimodal classifier that follows the 7-38-55 rule which states that only 7% of communication is spoken words (text), 38% is timbre, tone, and volume of voice (audio), and 55% is physical expressions (video) to describe the user at any frame. However, such a tool provides moderators with a qualitative analysis of collected data only, and it lacks any quantitative measure of usability, so it cannot be used to conduct summative tests. Analogously, Hussain et al. [13] employ multimodal sentiment analysis to identify the emotional state of users, and their system offers visualisations of user interactions in real time or replay mode. They propose a triangulation method consisting of self-reported, observational, and physiological methods for measuring the overall usability of a product, which is also the basis of the research presented here. They also employ several representation methods for textual classification, such as bag-of-words, part-of-speech tags, and lexicons and dictionaries to analyse the human voice collected through a microphone for sentiment and emotion classification. We further developed their approach by trying to make it accessible for remote usability testing, and then choosing a sub-selection of methods that we considered appropriate for our goal. On the other hand, other articles in the literature have focused primarily on one aspect of usability, practising usability through emotion analysis. Munin et al. [11] conduct in-depth research of the correlation between emotions and usability and develop a web-based usability tool to detect facial expressions and measure user emotions from video recordings. Foo et al. [40] analyse fixation and saccade data generated by a Tobii eye tracker to identify user visual behaviour in ontology visualisation and infer which visualisation methods are more appropriate for information seeking than for information processing. Moro et al. [19] evaluate usability in web environments, using metrics such as the number of fixations and dwell time. On the other hand, Sivaji and Soo [26] gathered the requirements for website usability testing and offer a tool to support and automate remote usability testing via live recordings. However, their tool does not provide either face recording or an eye tracking system, thus no emotion analysis can be conducted.
3. Miora, a Tool for Remote Usability Assessment
This research proposes some architectural and implementation solutions for a web-based tool for remote usability testing of websites/web applications. The requirements for the design of this tool are mainly to allow the evaluators to configure the types of evaluation tasks together with several parameters and, above all, to collect, in the most automatic way possible, a whole set of parameters that allows for performing a quantitative analysis a posteriori and, at the same time, to collect a large amount of data about the user behaviour during each interaction with the analysed software system, at the behavioural level, but also and especially at the emotional level. The proposed platform architecture deepens the one described in [51], which focuses only on capturing data about emotions and gaze, leaving out other information of interest for in-depth usability analysis, such as mouse click coordinates, interactions with the analysed software (e.g., the correlation between the user’s gaze and what the user was actually looking at when the webcam image was captured).
All the functionalities required to perform a remote usability analysis are provided through a test configuration section and the integration of a code snippet into the source code of the analysed software. Specifically, the proposed tool uses a comprehensive evaluation methodology and is based on Deep Learning techniques for the analysis of user characteristics via the acquisition of image frames coming from the user’s webcam and any other data that can be collected, such as the coordinates of mouse clicks and scroll percentages retrieved moment by moment. At the end of the tests, the evaluator has access to a series of graphs and statistics related to the data collected, so that he can intuitively analyse the different trends related to the KPI used as usability indicators.
3.1. The Remote Server
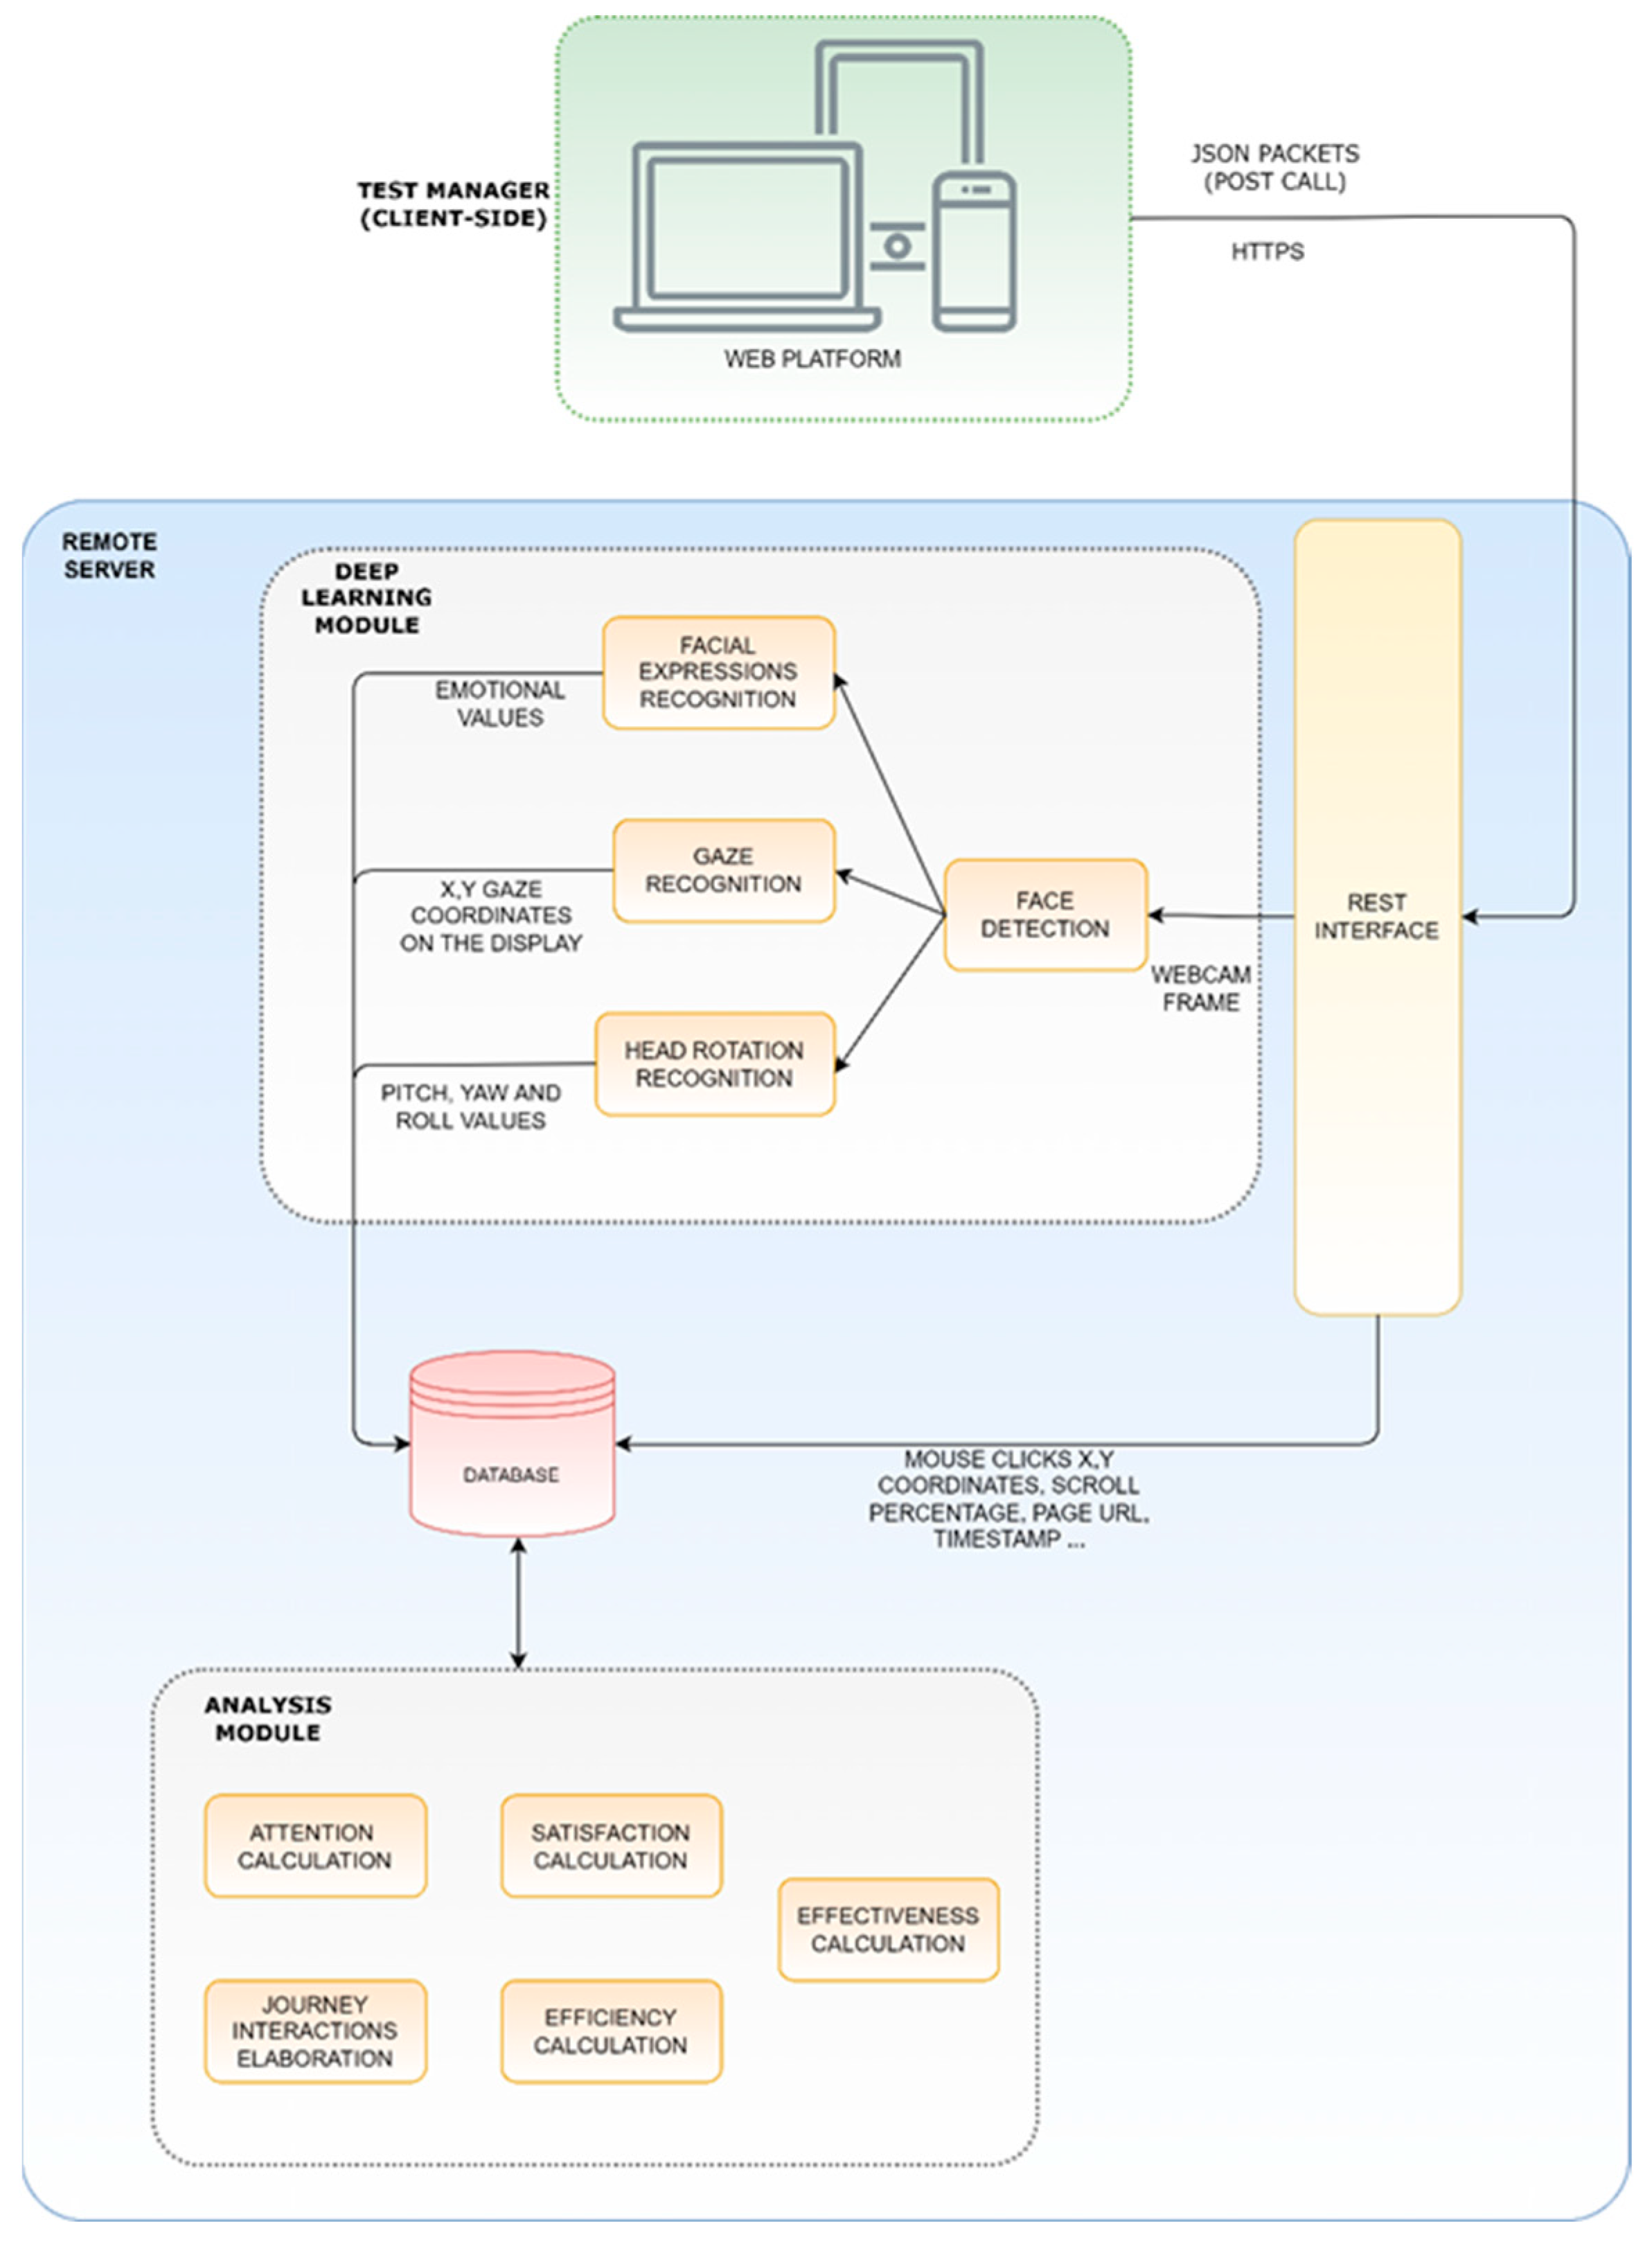
The proposed platform is based on a client–server architecture, shown in Figure 1, which involves four main actors: the client-side Test Manager, the Dashboard, the Deep Learning module, and the Usability analysis module.
3.1.1. Deep Learning Module
The server-side system exposes an interface developed in Python’s Flask framework—a lightweight framework for Web Server Gateway Interface (WSGI) web applications. The server listens for requests sent by clients, and once a request arrives on the server, the request is decoded, parsed to extract all the original data, and then stored in the database. When the server receives a request containing a Base64 encoded image, the image is decoded and processed with the emotion, gaze and head rotation sub-modules hosted in the Deep Learning module. Every image is never stored in the server filesystem but is only temporarily located in RAM to allow scripts to be processed, thus avoiding queuing systems and in this way taking more care of users’ privacy.
Each model in the Deep Learning module has a related sub-module specialised to recognize a particular user characteristic:
- Face detection: the third-party library Dlib [52] is used to detect one or more human faces and provide the coordinates of the main face landmarks.
- Facial Expressions recognition: a VGG Convolutional Neural Network has been trained to take 64 × 64 pixel grayscale facial images from the input layer and return the classification probability of the six Ekman emotions (joy, surprise, anger, disgust, sadness, fear) from the output layer. The training process has been described and validated in [53]. The emotions expressed by the user are summed at each instant and normalised up to the value of 100 as a percentage. Valence can then be computed at each instant following the approach used in [54] to differentiate between Ekman’s positive and negative emotions. Therefore, Valence ranges from −100 to 100 and indicates the total positivity or negativity expressed by the participants. The user’s emotional Engagement is instead computed with the following formula:and averaged over time using a moving average with a step of 1 s.Engagement = 100 − Neutral (%),
- Gaze recognition: a Convolutional Neural Network-based model has been trained to perform gaze tracking, taking in as input the cropped images of the left and right eyes separately, the detected face image cropped from the original frame, and a binary mask (face grid) used to indicate the position and size of the face within the frame, producing the x–y coordinates of the eye fixation respect to the observed monitor. The training process has been described in [51,53].
- Head rotation recognition: head rotation recognition is performed to have an evaluation of the attention level. As for the face detection module, the Dlib library has been used to retrieve a mapping of the user’s facial features. In particular, the distances between six pairs of landmarks were considered to estimate the orientation of the head with respect to the webcam, according to how it is described in [55]. The results will be the calculation of the yaw, pitch, and roll values in relation to the webcam.
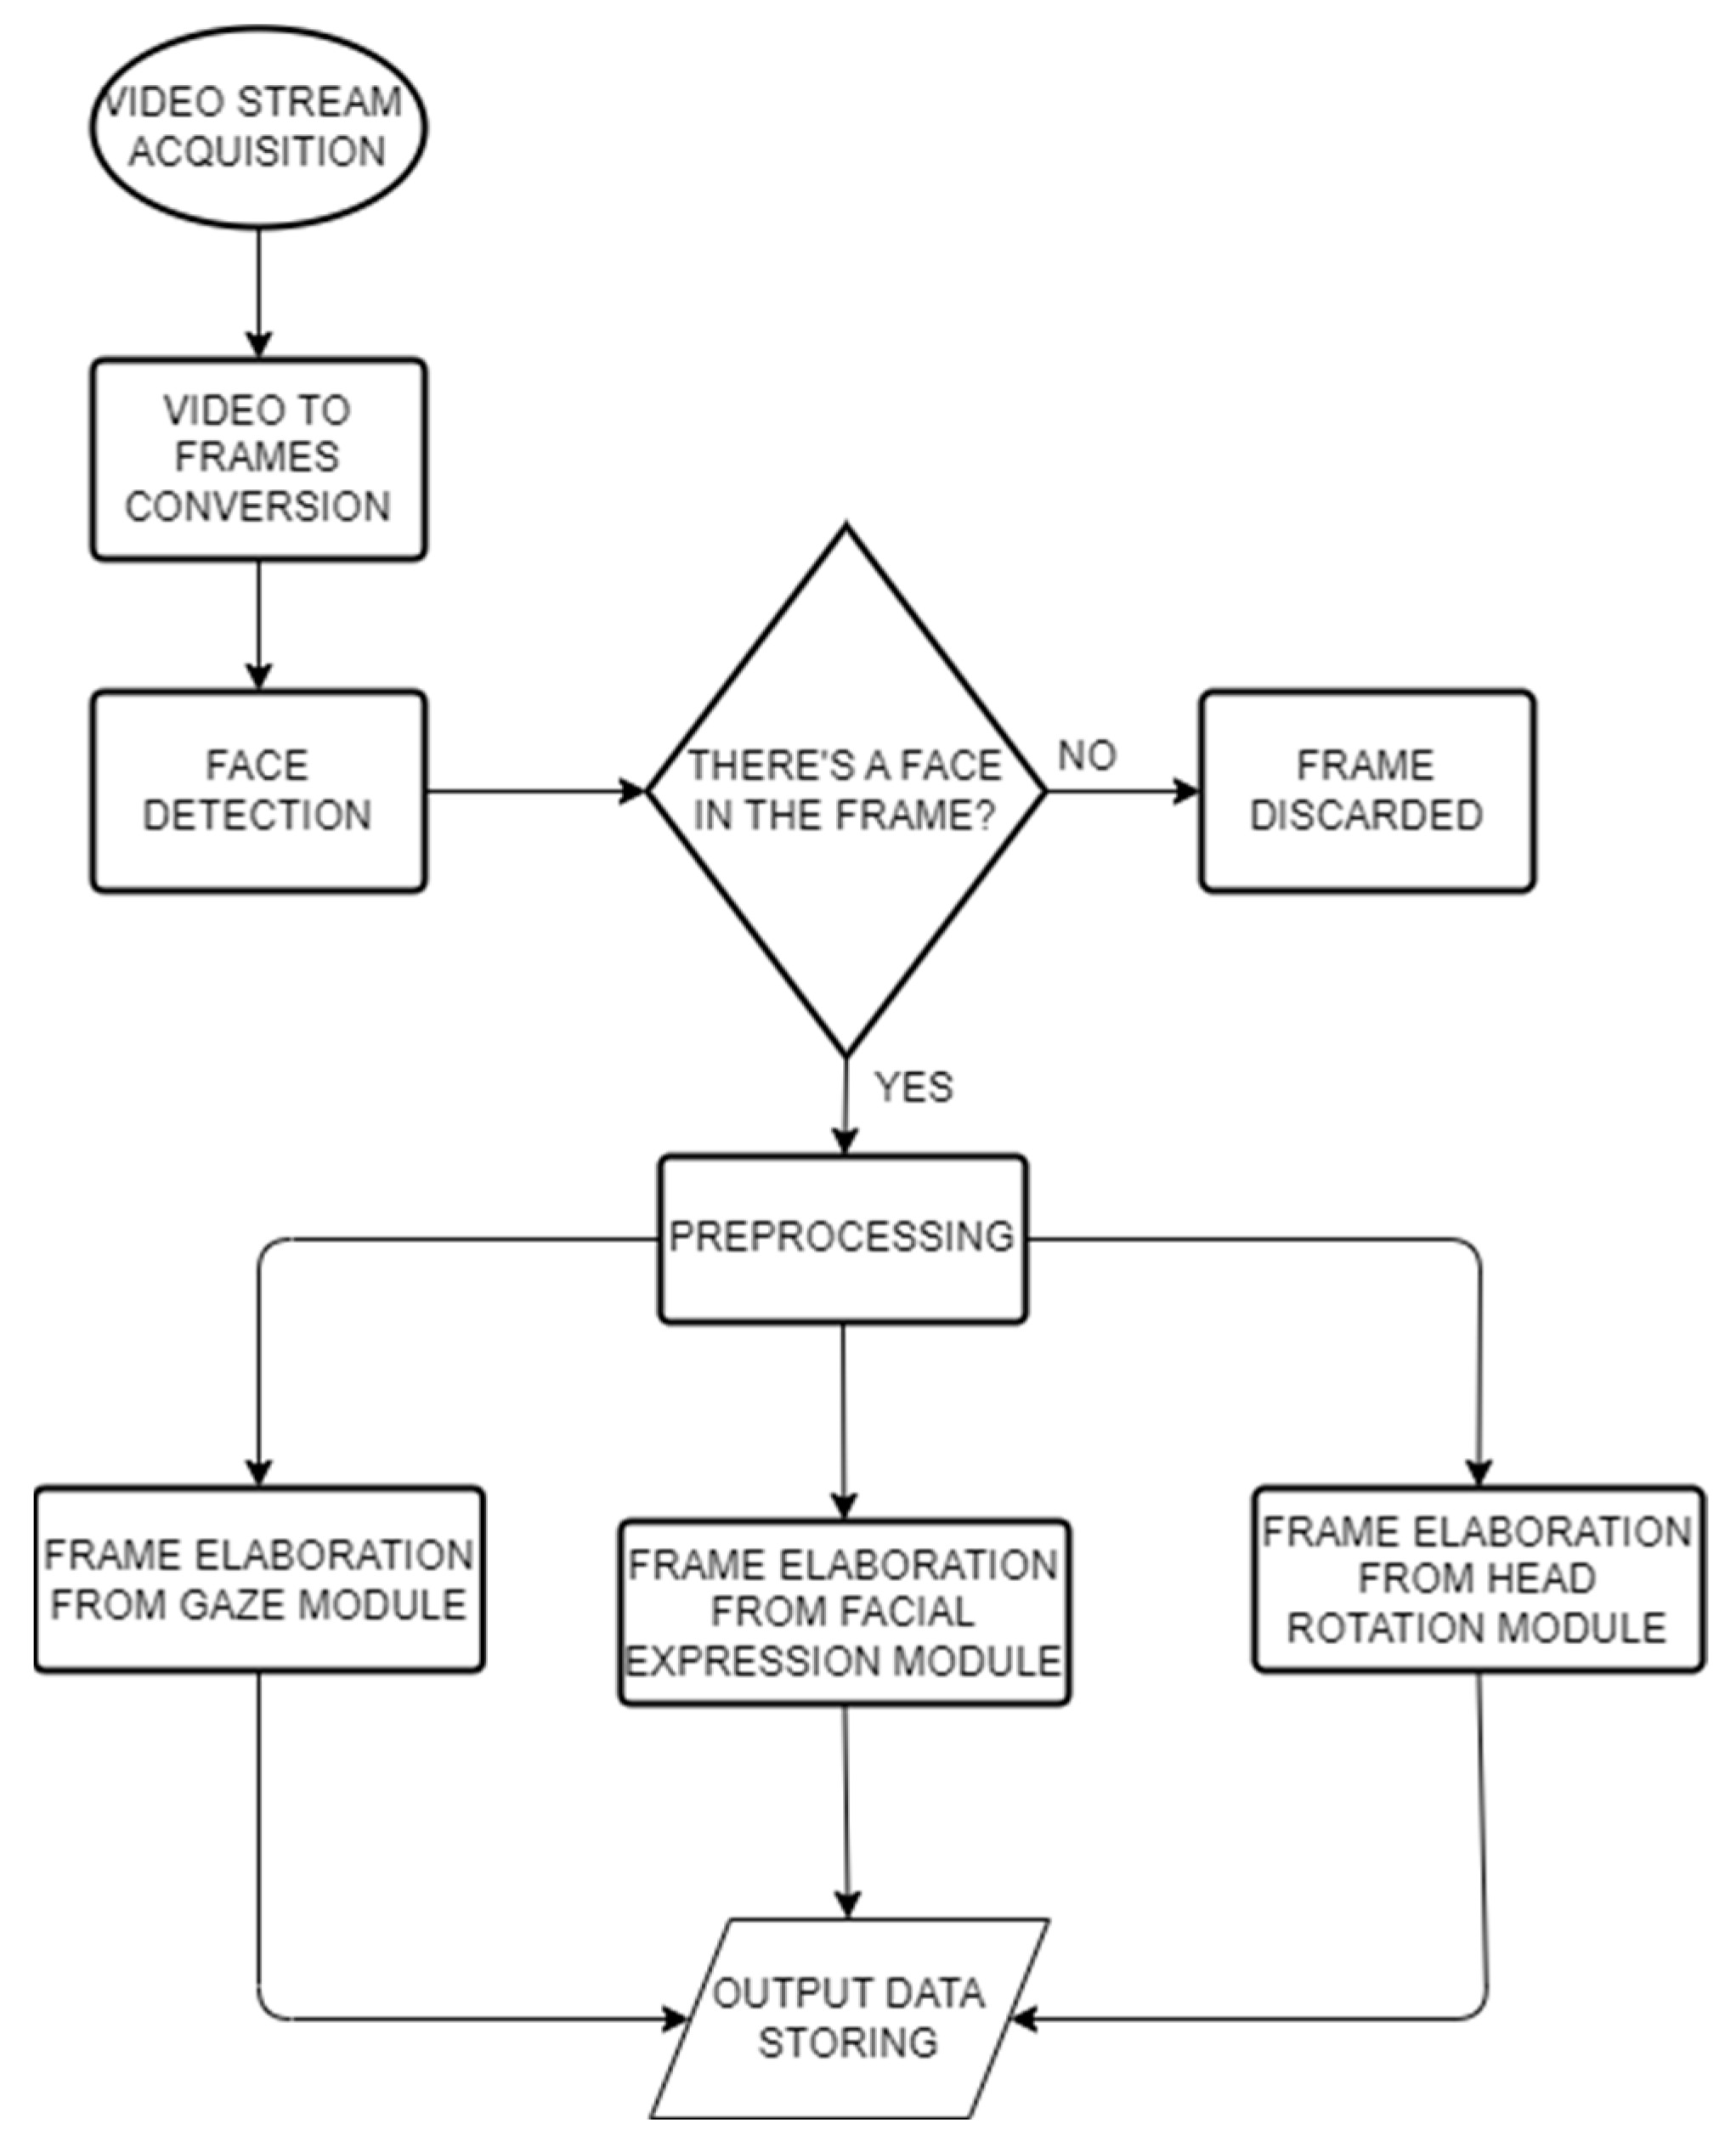
Figure 2 shows a diagram of the data flow involving frame collection and processing.
3.1.2. Database
A data storage is then used to store model predictions and user interaction results, such as event timestamps, current task names, elapsed time to complete a task, and other relevant information. A MySQL relational database is used to store all such data. Some data fields are listed here:
- url: URL of the page that was active while data was being captured;
- timestamp: the timestamp when the event happened;
- xCoordinate and yCoordinate: coordinates of the point in the screen the user was looking at while data was being captured;
- yaw, pitch and roll: head rotation indicators on the 3 spatial axes x, y and z;
- viewportWidth and viewportHeight: size of the viewport used to visit the site;
- scroll: whether the scroll event is triggered or not;
- scroll depth: percentage of page scroll at the time data were being captured;
- timeSpent: time spent by the user completing the task;
- note: notes written during the task.
3.1.3. Analysis Module
The analytics module shall retrieve all data collected and stored in the database and calculate the usability indicators, i.e., efficiency, effectiveness, and satisfaction, as well as other interaction information related to attention and interaction journey.
Attention is calculated as the ratio between the total time spent looking at the screen during a task and the task duration. In this procedure, thresholds are evaluated for each retrieved webcam image based on the pitch, yaw, and roll values of the head rotation and the (x, y) coordinates of the gaze. Each time the computed values for the face in the image fall within the defined thresholds, a Boolean value for attention is assigned for that instant. This parameter is represented as a percentage value indicating the proportion of time the user spends looking at the monitor and concentrating on the task.
Satisfaction is derived from valence and is calculated from the seven Ekman’s emotional categories (neutral included), referring to the positiveness or the negativity of the strongest emotions felt (for example, joy is considered a positive emotion while anger a negative one). Thus, the valence scale has been divided into five ranges. For valence values between −100 and −60, the user is unsatisfied; for values between −60 and −20, the user is less satisfied; for values between −20 and +20, the user is neither satisfied nor dissatisfied; for values between +20 and +60, the user is satisfied, and, for values between +60 and +100, the user is really satisfied. Finally, the category in which the user is classified is returned by averaging his/her satisfaction over the duration of the task. The approach is based on the correlation between facial expressions recognised through Face Coding and Satisfaction, investigated, albeit with different limitations, in [56,57].
The Interaction Structure graph is computed by considering the timestamps and the values—(x, y) coordinates, scroll percentage and website URL—associated with every user interaction, such as click, scroll and especially page changing, with the analysed software.
Efficiency is computed as the ratio between the average execution time a non-expert user took to complete the task and the average execution time an expert user took to do the same. The execution time is calculated as the difference between the server times retrieved when the user clicked on the “finish task” and when he/she clicked the “start task” button.
Effectiveness has been measured by computing the completion rate of each task and by analysing the click paths.
All five of these metrics represented by time series can be computed both individually as just described and collectively by averaging at each instant over all users.
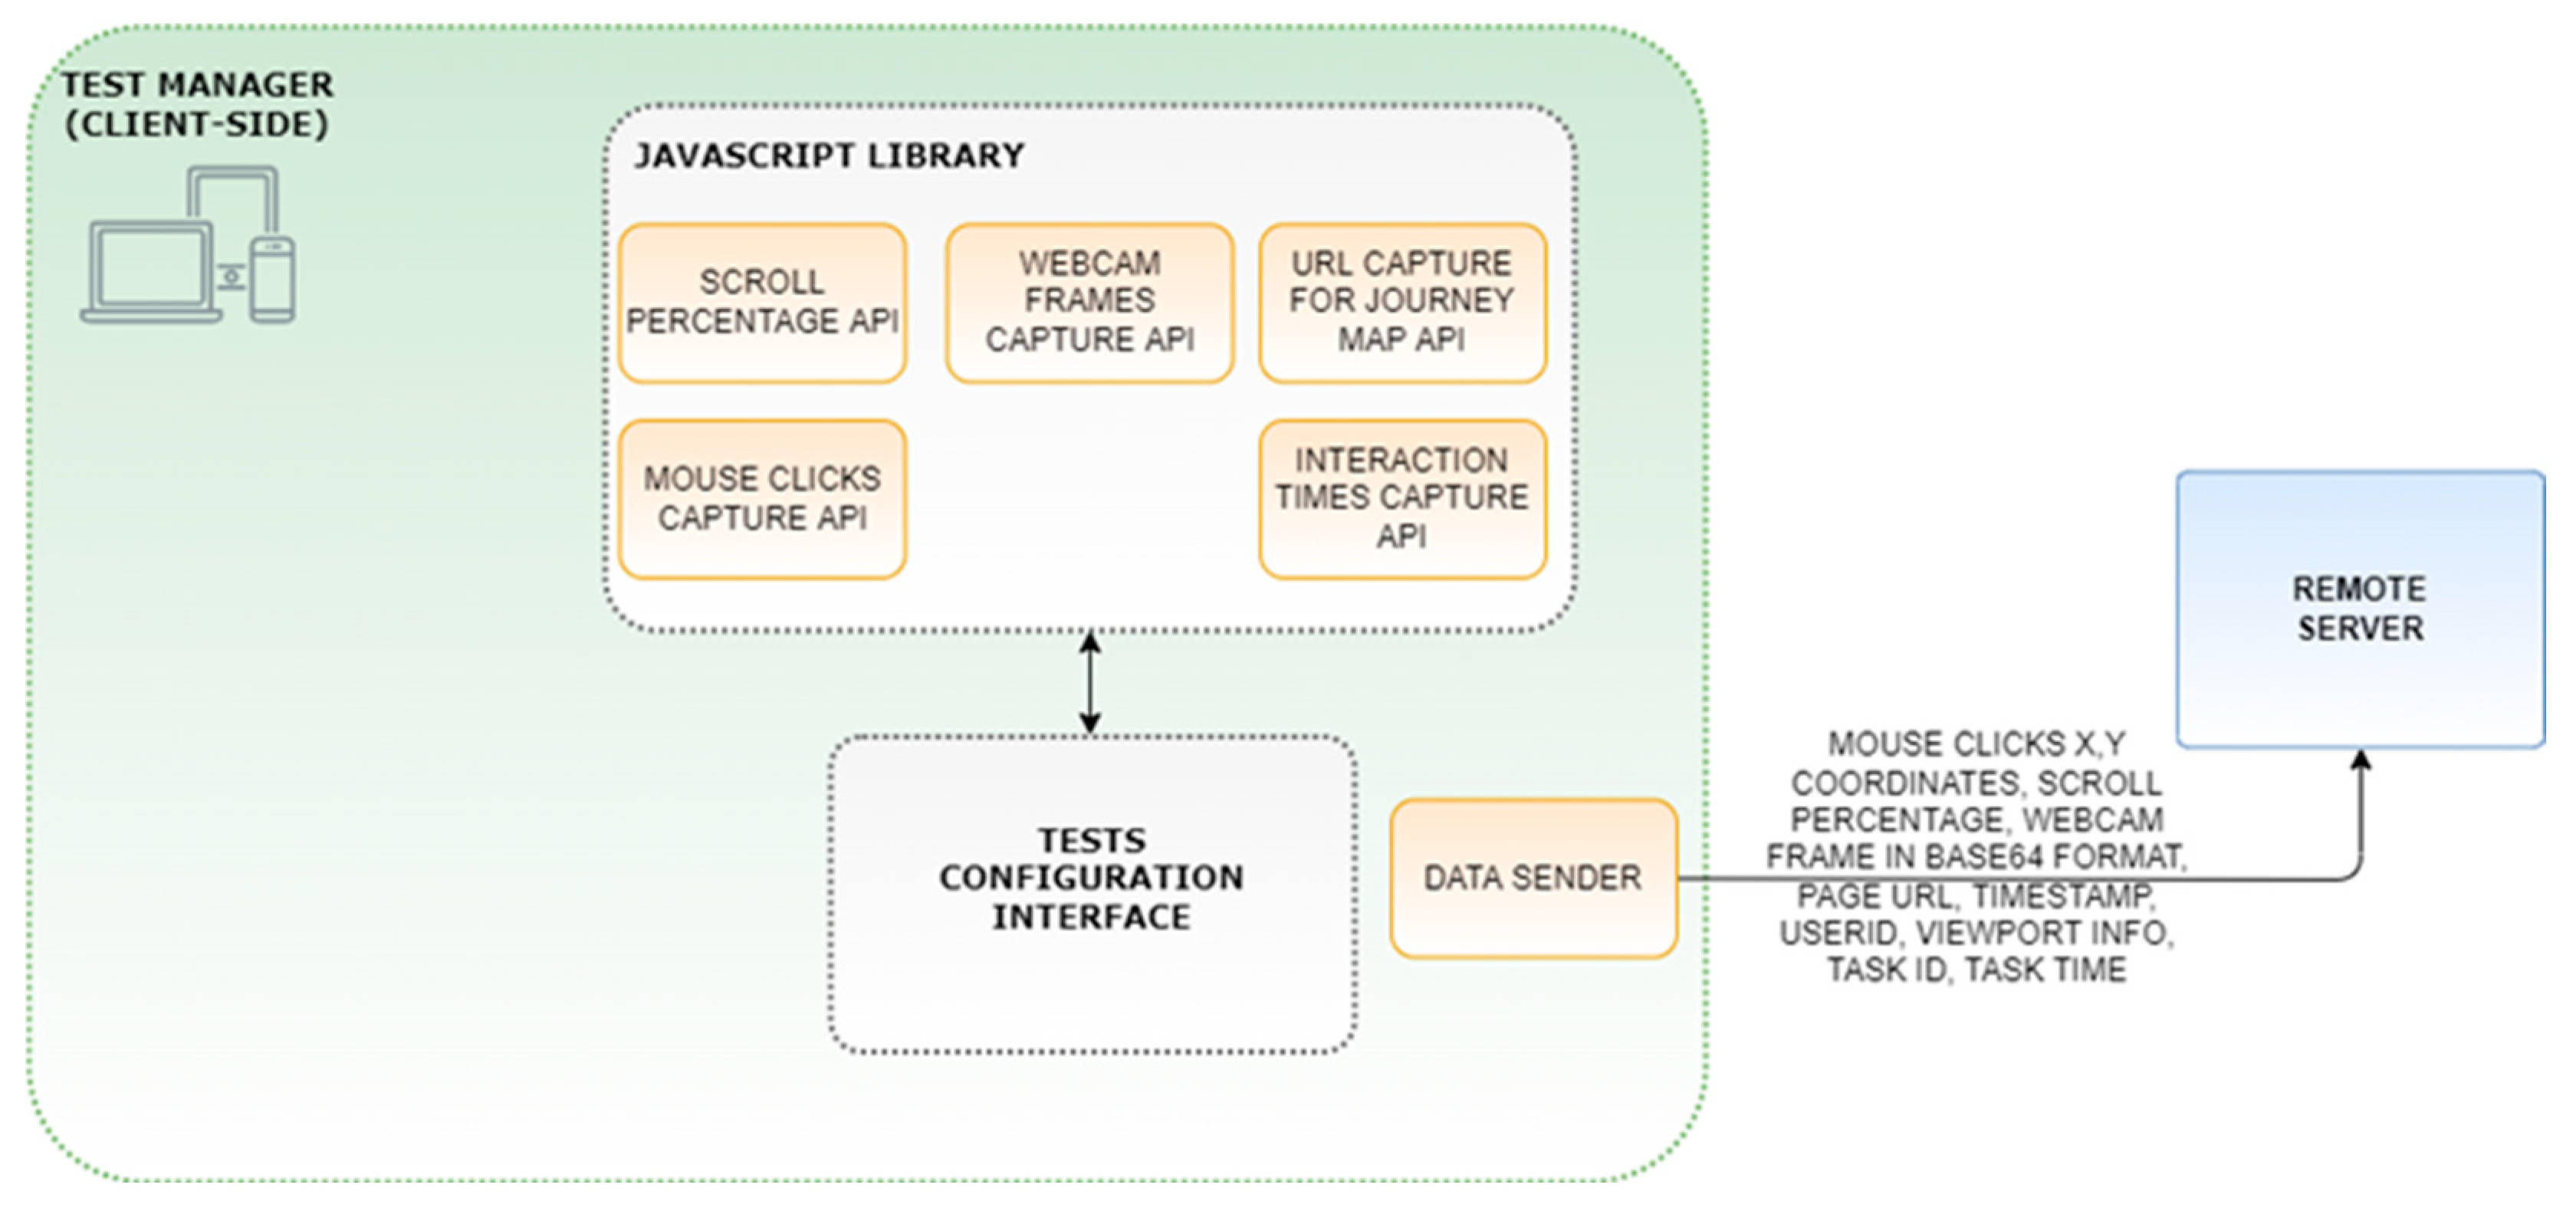
3.2. The Test Manager
The system client side, the Test Manager shown in Figure 3, is a web interface that allows for configuring each usability test and that works in synergy with a Snippet code for the collection of data. Since this snippet must be easily integrated with the most popular technologies for web development, it has been written in JavaScript with just a few code lines. The JavaScript (JS) Snippet will automatically access a remote JavaScript library with the main functionalities, for the user’s interactions acquisition, i.e., interactions timestamp, clicks coordinates, scrolling percentage and above all webcam video frames. This last feature will be highly configurable by the test manager, who will be able to set how and when to activate the webcam, the frame capture frequency (up to 10 fps when not limited by bandwidth), the captured frames resolution, and other parameters. Once captured, the frames are encoded in base64 format and, with all the other data, sent to the remote server via HTTPS protocol. In addition to this, the test manager provides a web user interface for the test evaluators to set up tests and configure them from a set of pre-configured options.
The JS library implements proper APIs we developed to enable the collection of several user’s interactions data related to specific usability metrics, such as:
- Mouse clicks capture API: it retrieves the mouse clicks’ coordinates (or taps on a mobile device) on the entire screen with the related timestamp and computes the relative coordinates on the window currently opened by considering the viewportWidth and viewportHeight variables, whether a scrolling event occurred and with the scroll percentage relative to the open window. For example, each time the user scrolls the current view, the y-offset from the top-left corner of the screen is updated. This allows us to build a real map of all the clicks that have occurred on a web page. Furthermore, the clicks can be connected in a chronological order thanks to the timestamps collected.
- Scroll percentage API: it acquires data about whether a scrolling event was triggered or not and how much a participant scrolled on a specific page is expressed in percentage values. By capturing the scroll events, we can offset the position of the clicks/taps on the page and thus build a map of all the click events.
- Webcam frame capture API: it takes photos with a predefined frequency by accessing the webcam and sending Base64 encoded images to the server. These images are subsequently decoded and processed by the Deep Learning module to infer emotions, and with the gaze and head rotation recognition modules to identify the attention. In particular, the face detection module used is face-api.js [58], built on top of the tensorflow.js core that implements a CNN to detect faces. Participants are asked to grant access to the camera when they start the task so as to periodically capture the participants’ frontal face, resize the captured image to 640 × 480, and convert the image to a Base64 string. The moderator can set the capture frequency up to 10 fps in a lab setting with a good bandwidth, and the resolution of the captured frames to be sent to the server. All the user interaction data are sent to the server with asynchronous HTTPS web requests once the page URL changes.
- URL capture for structure graph journey map API: it retrieves the web pages URL and the timestamps at which those pages were being visited. This allows the tool to build a structured graph of web pages visited by the user, visualise the percentage of users who visited each page in a funnel graph, and make it all available for funnel analysis.
- Interaction times capture API: it retrieves the timestamps for any user interaction. Once collected, interaction times can be correlated with the emotions being expressed at that time for satisfaction analysis, or with the gaze paths to analyse attention, stress, or fatigue.
The web Tests Configuration Interface allows the usability test conductor:
- to configure and set up each usability task;
- to record the navigation of the expert user with automatic recordings of the URLs visited by the expert in the task preparation and the relative times, so that they can be compared with the users’ times;
- to specify a set of parameters from the data collection APIs, such as how and when to activate the camera, the frames acquisition frequency, frames resolution and the other metrics previously described;
- to manage invitations and participant access.
Once the invitation to participate in the test is received, the users can access the system through a personalised link. During this step, the users will also have to accept a privacy policy to be compliant with the G.D.P.R. European privacy laws. During the first access, they must eventually complete (if required) a form with additional personal information. Then, they can start the tasks by selecting them from the list in the relative section, where instructions on how to perform the tasks are also indicated.
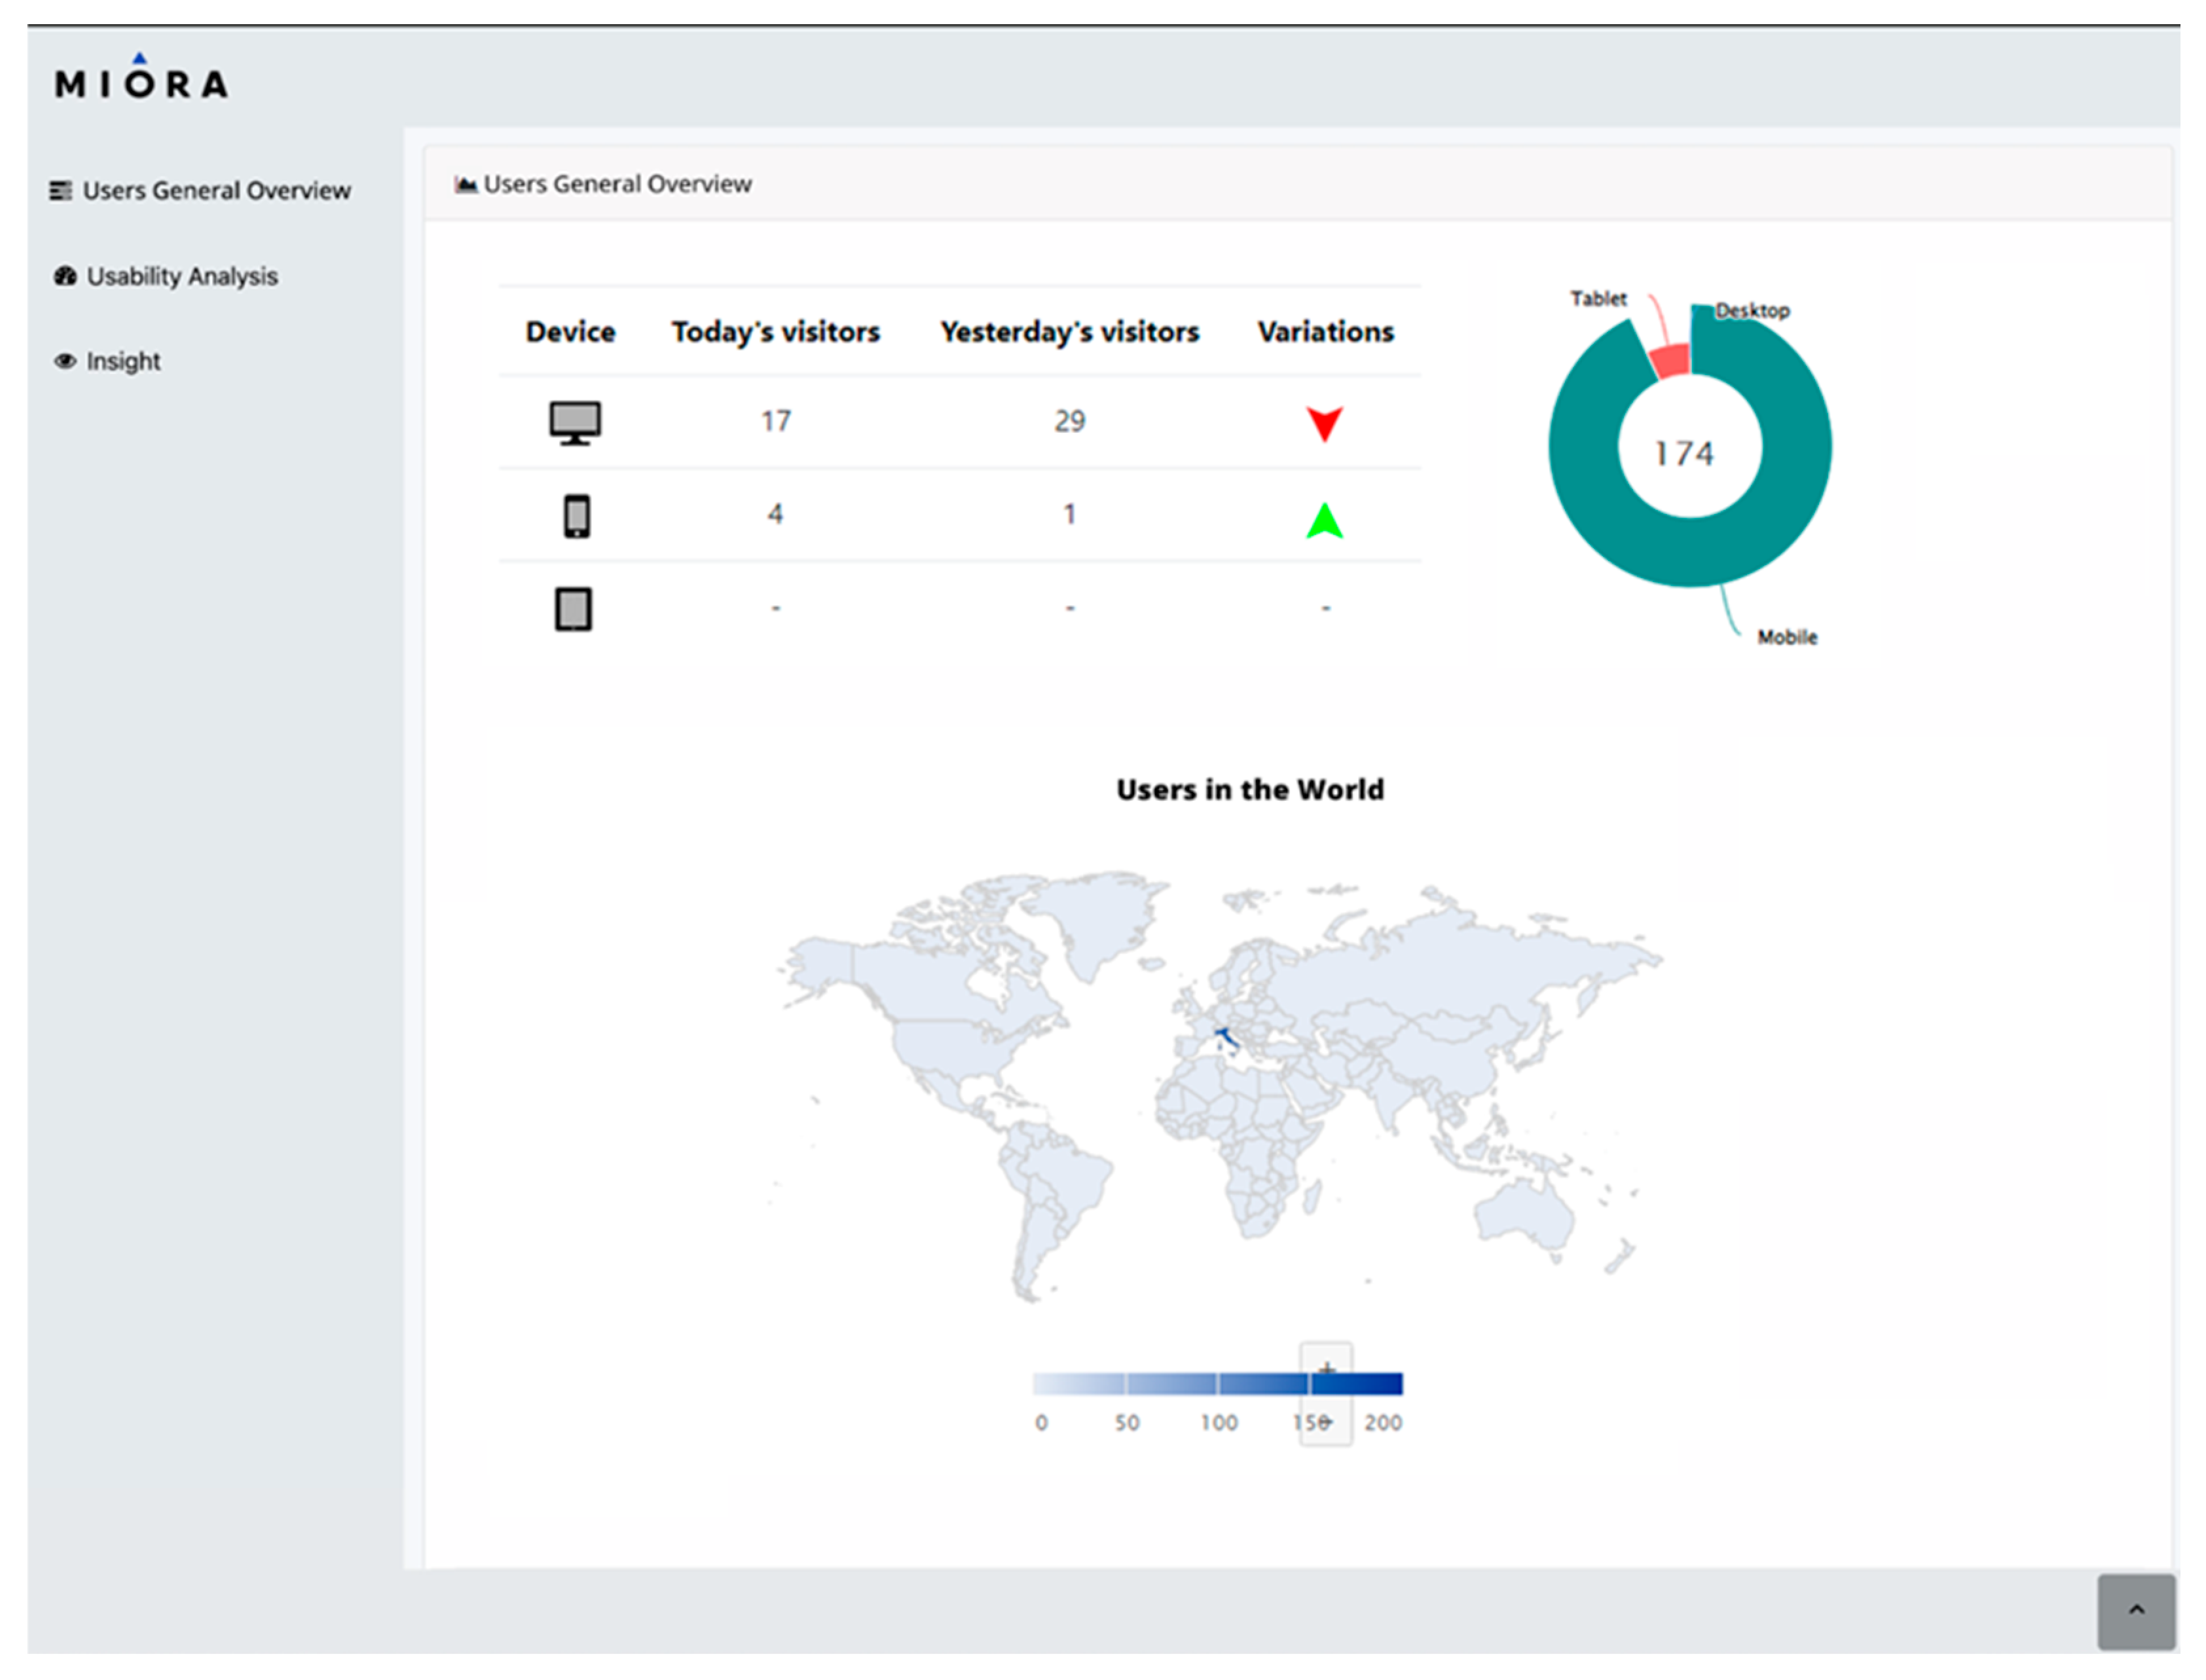
The proposed platform supports collected data analysis, providing a variety of data visualisation tools (e.g., histograms, pie charts, structure graphs). When tasks are over, the Users General Overview section (Figure 4) provides an overview of the collected data related to the general users’ information (i.e., geolocation and device type used for the test). The geographical distribution of participants is displayed in the “Users in the world” graph, by plotting the IP address of the participants’ device used in the usability test, as shown in Figure 4.
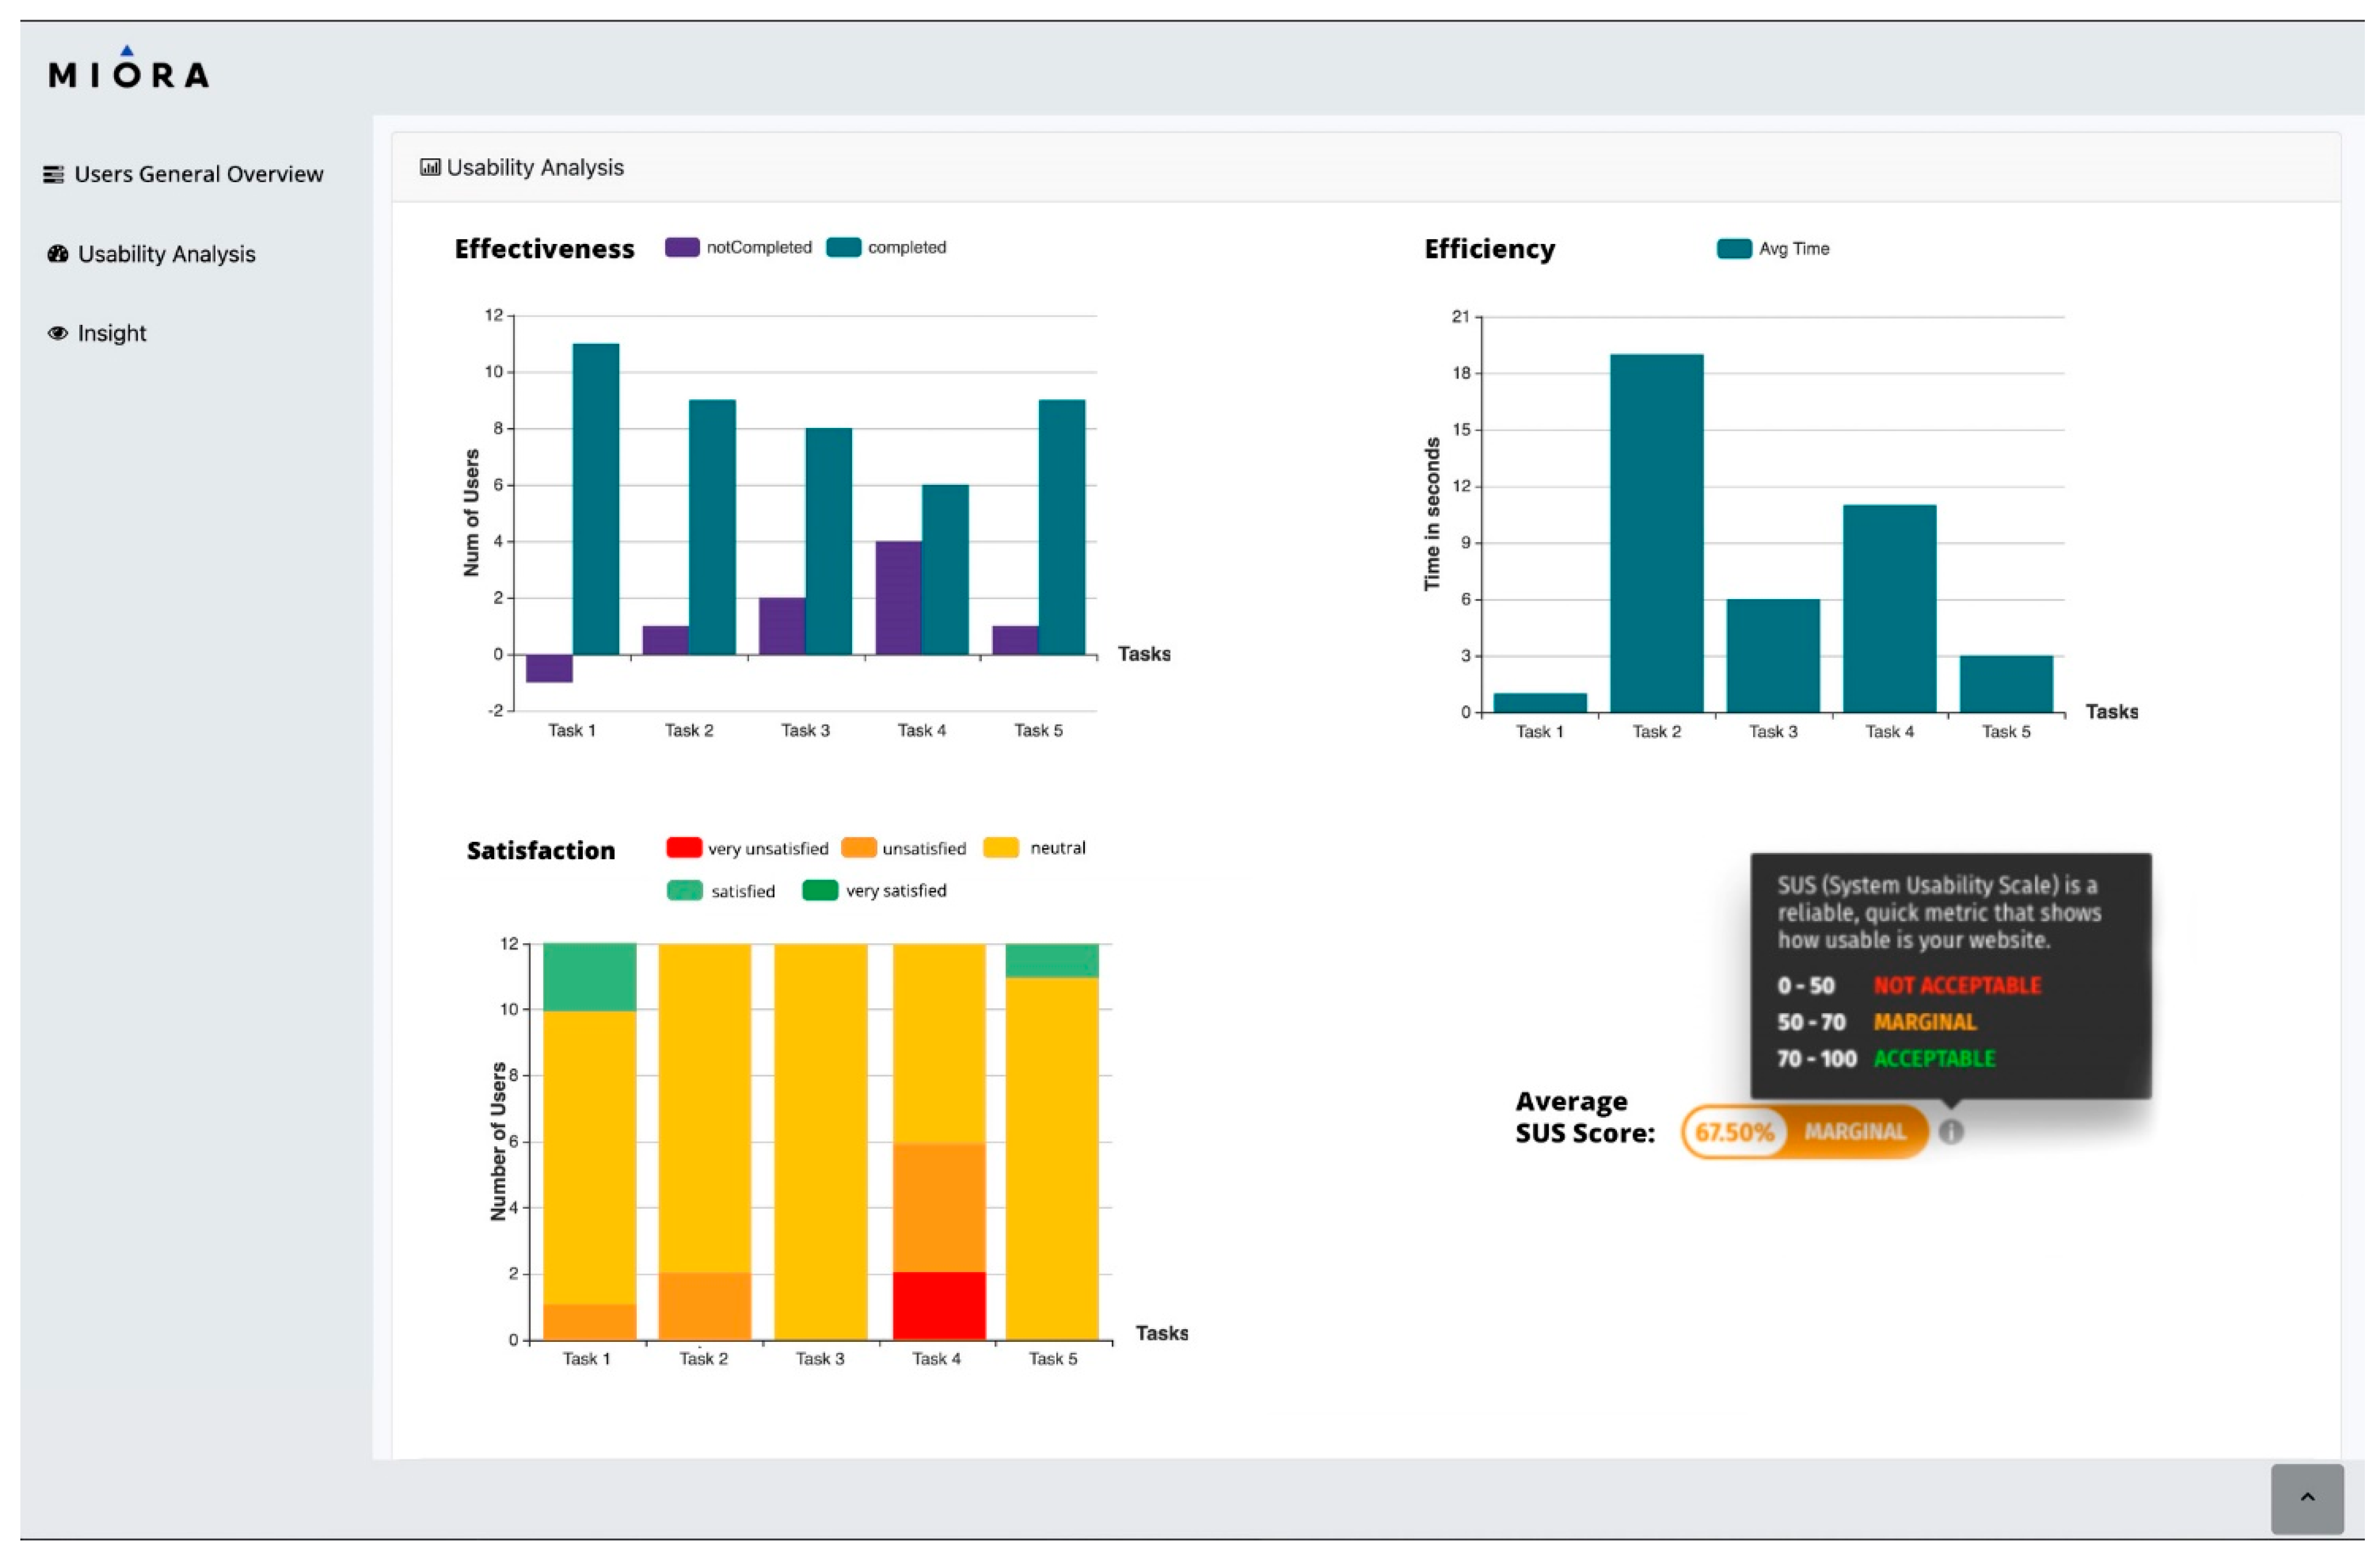
Results of the usability tests are reported in the sections related to usability analysis and insights. In the usability analysis section, it is possible to find several charts with results related to the task effectiveness, efficiency, and satisfaction. For example, the Task completion graph shows how many users have completed every task of the related usability test, while Task efficiency shows the average completion times and Satisfaction, based on the discretization/categorization of the valence continuous values obtained through the facial expression recognition (as reported in paragraph 4.1), shows how many users could be considered generally satisfied or not during the interaction with every task. In Figure 5, we show a mockup session with five tasks: in this case, it can be noticed that each task was successfully completed by all twelve participants; task 2 can be considered the longest/complicated one while task 4 the most “frustrating” one. At the end, these data, retrieved automatically, can be compared with the results obtained with a SUS or other questionnaires, through a dedicated chart.
The Insight section shows all the data collected during user interactions through other widgets, displaying useful indicators that can deepen the understanding of user behaviour during navigation. This section displays the overall results for all the participants. The Click and Gaze subsection shows heatmaps and paths for click and gaze interactions. The colour shifts from green to red as the users’ gazing periods increase, revealing the parts of the screen that contain the most relevant information for the users.
Both click and gaze heatmap graphs are correlated to the timestamps collected to provide important information regarding mistakes participants made while performing the tasks. The click and gaze path graphs display all the clicks performed by the participants and the gaze predicted coordinates of the screen, in the sequence they occur, differentiating each participant with a drop-down menu. In the Emotions sub-section, some charts show the Valence and Engagement analysis and Ekman’s emotions percentage values. All data shown in this section can be filtered individually.
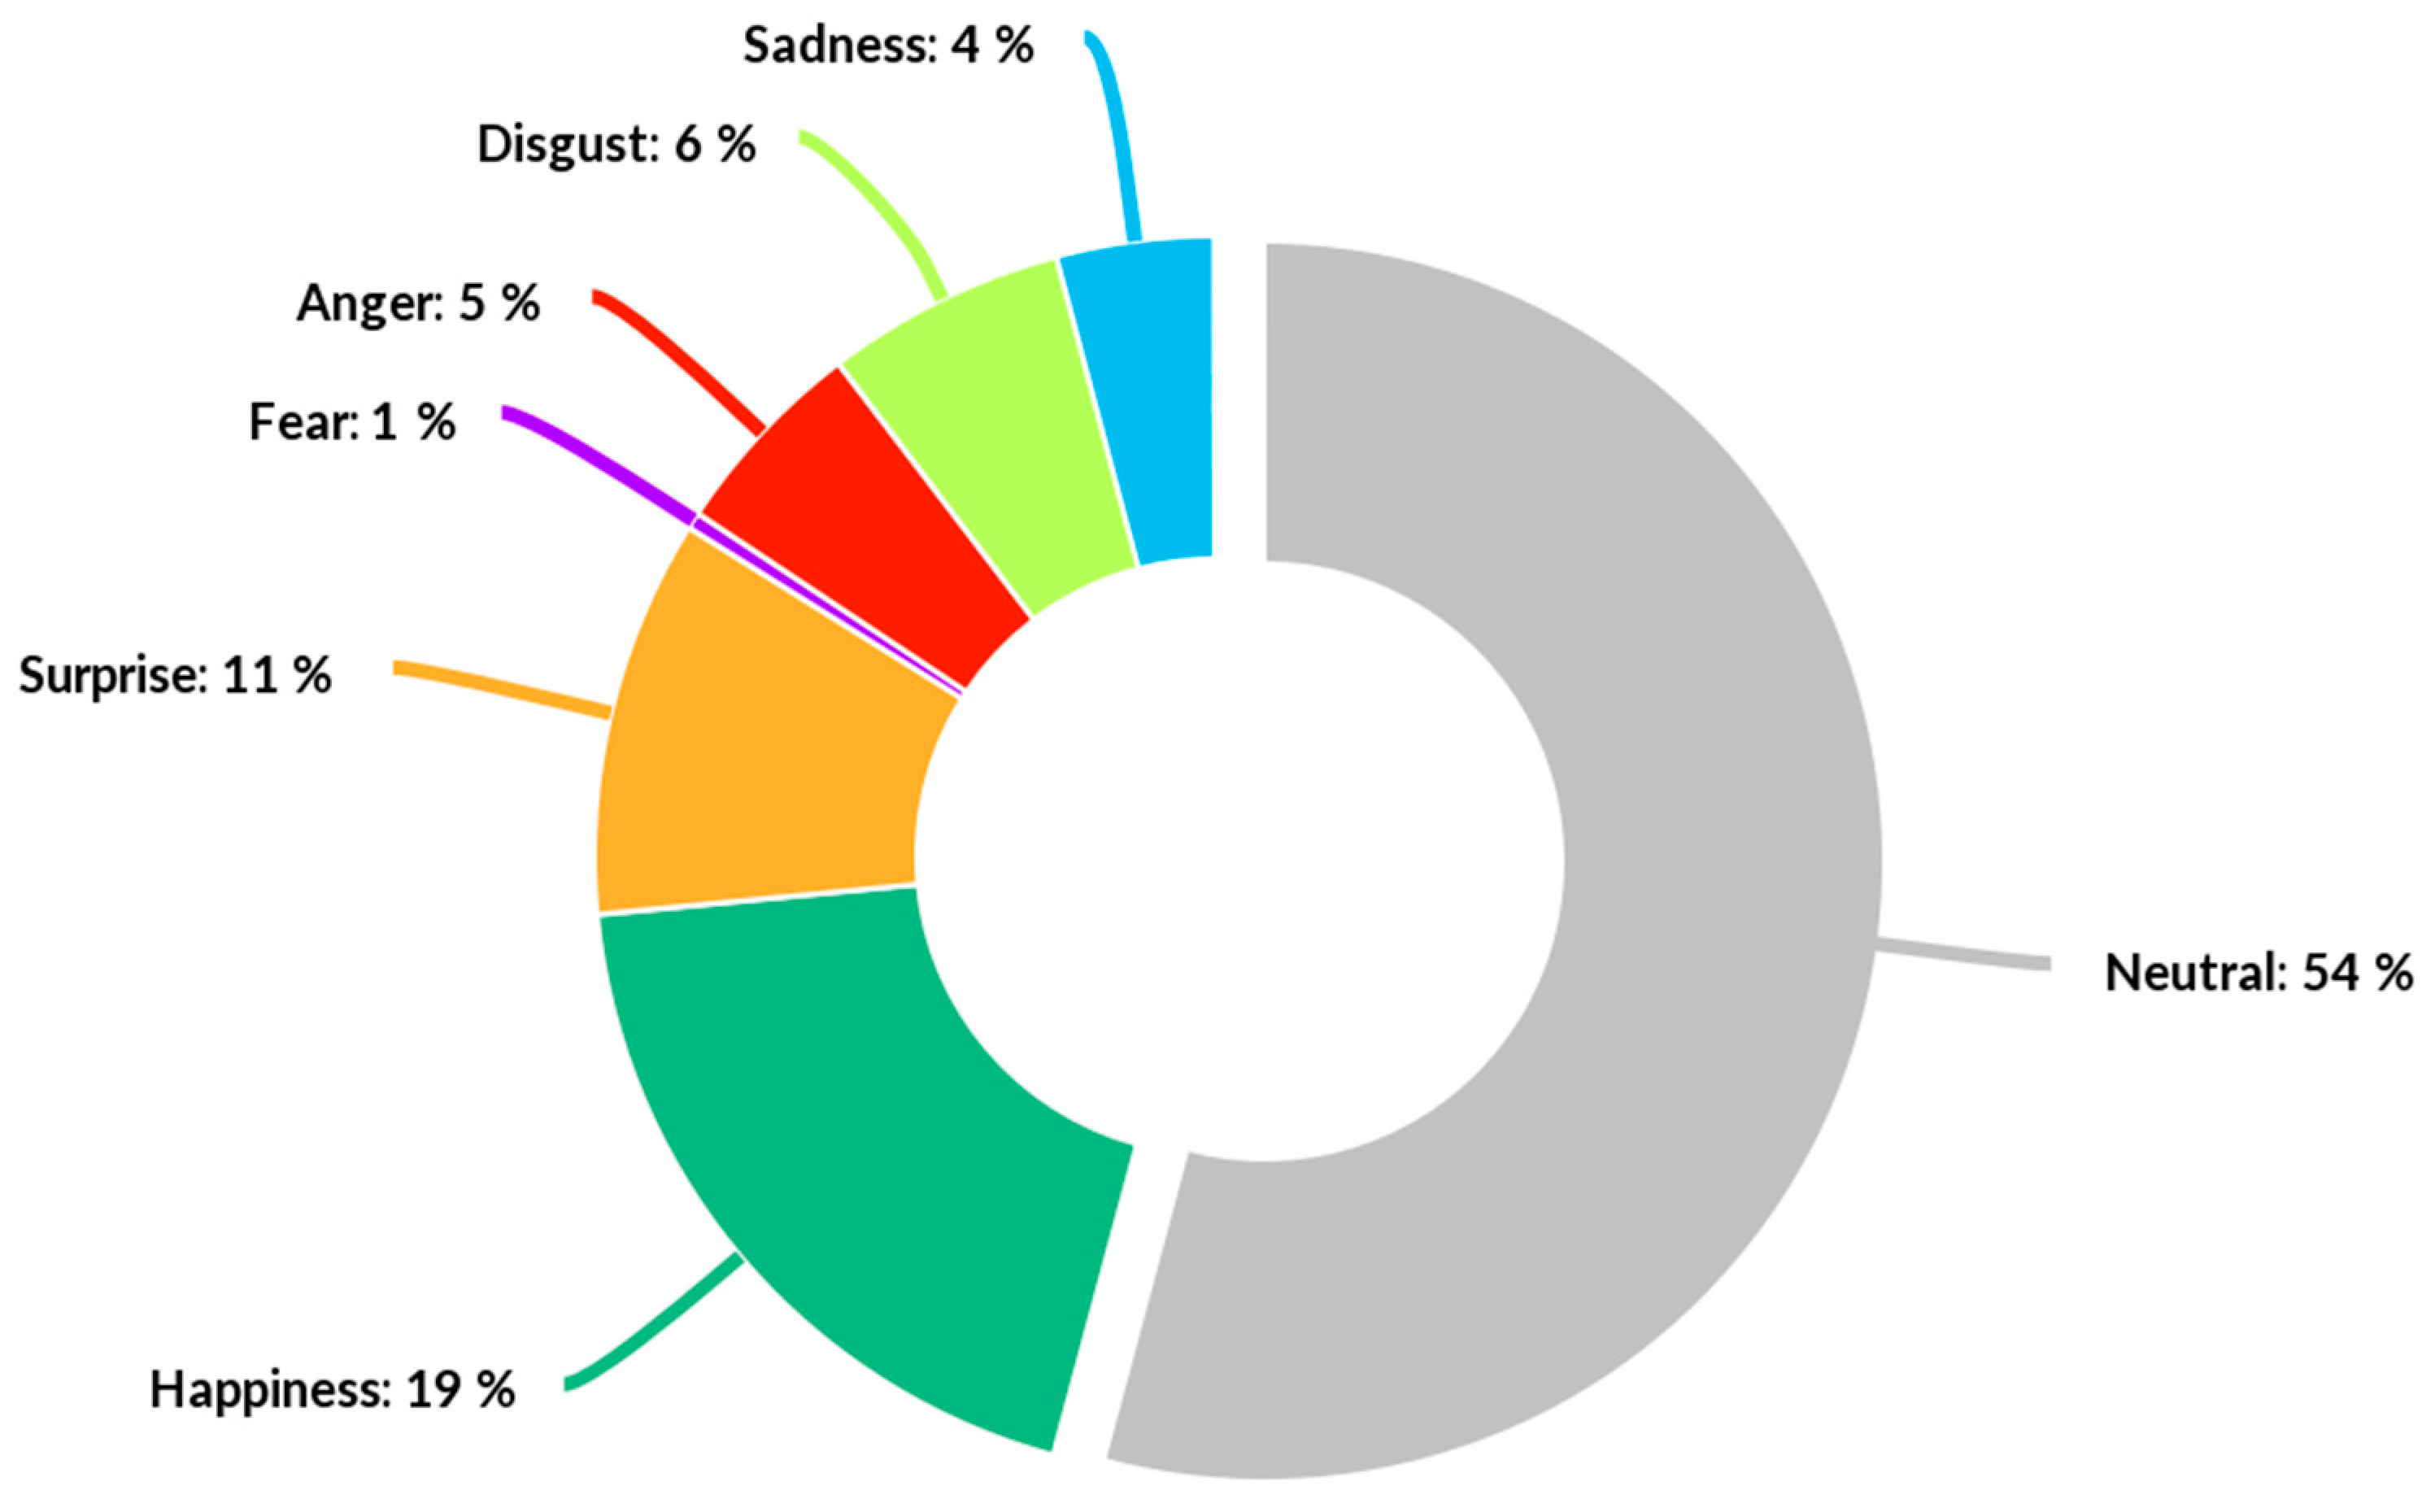
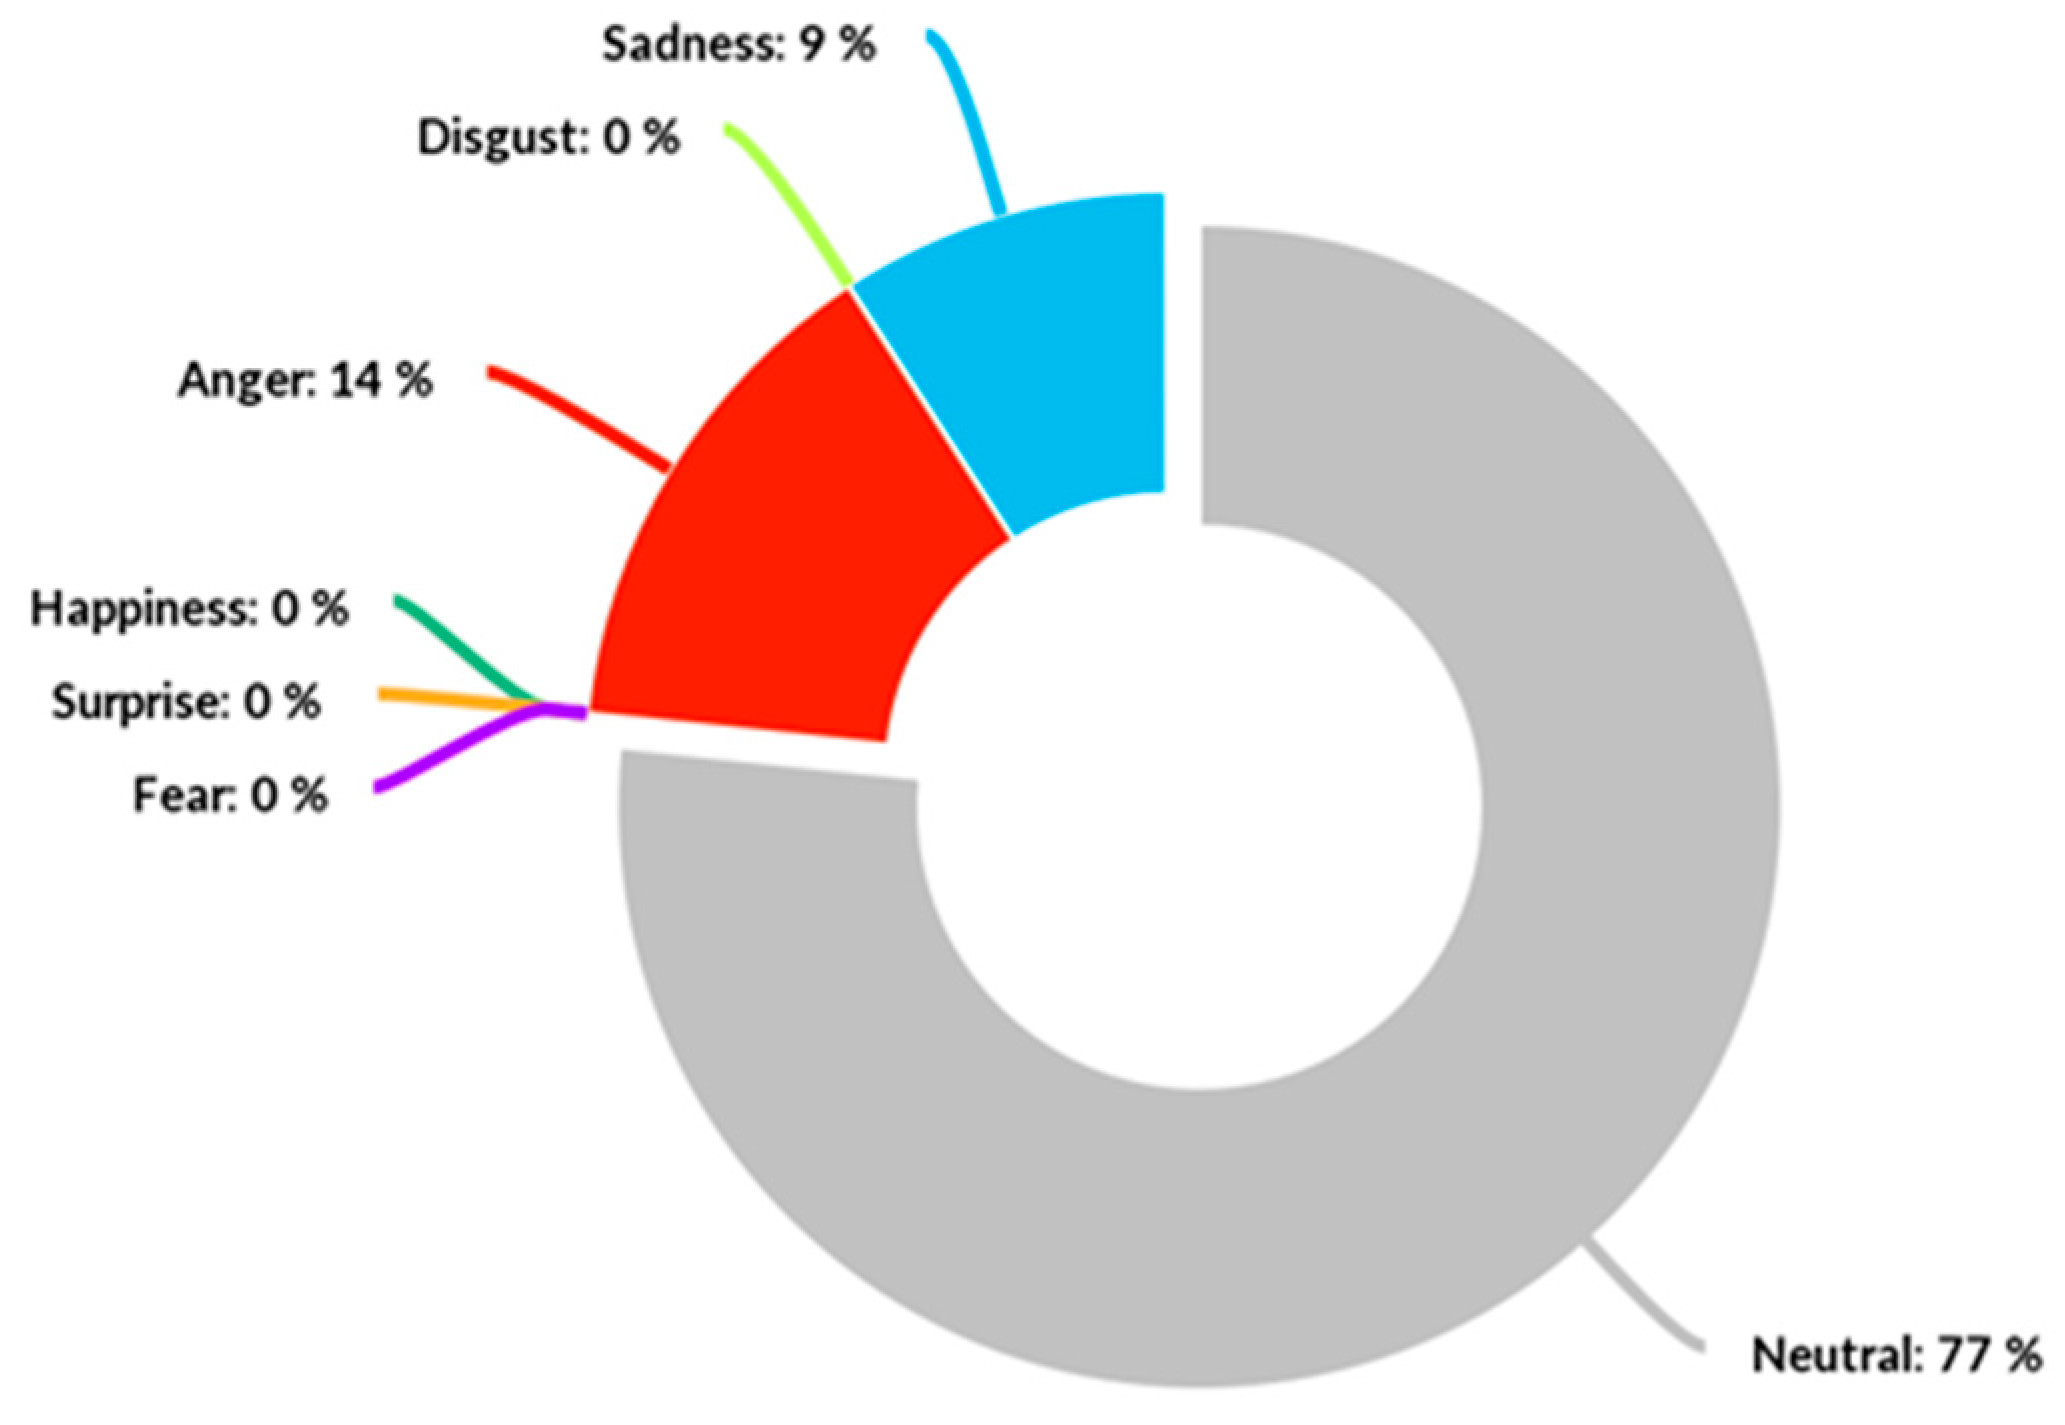
The emotions graph in Figure 6 is a pie chart showing which of Ekman’s emotions were expressed by the participants as a percentage during the duration of the task.
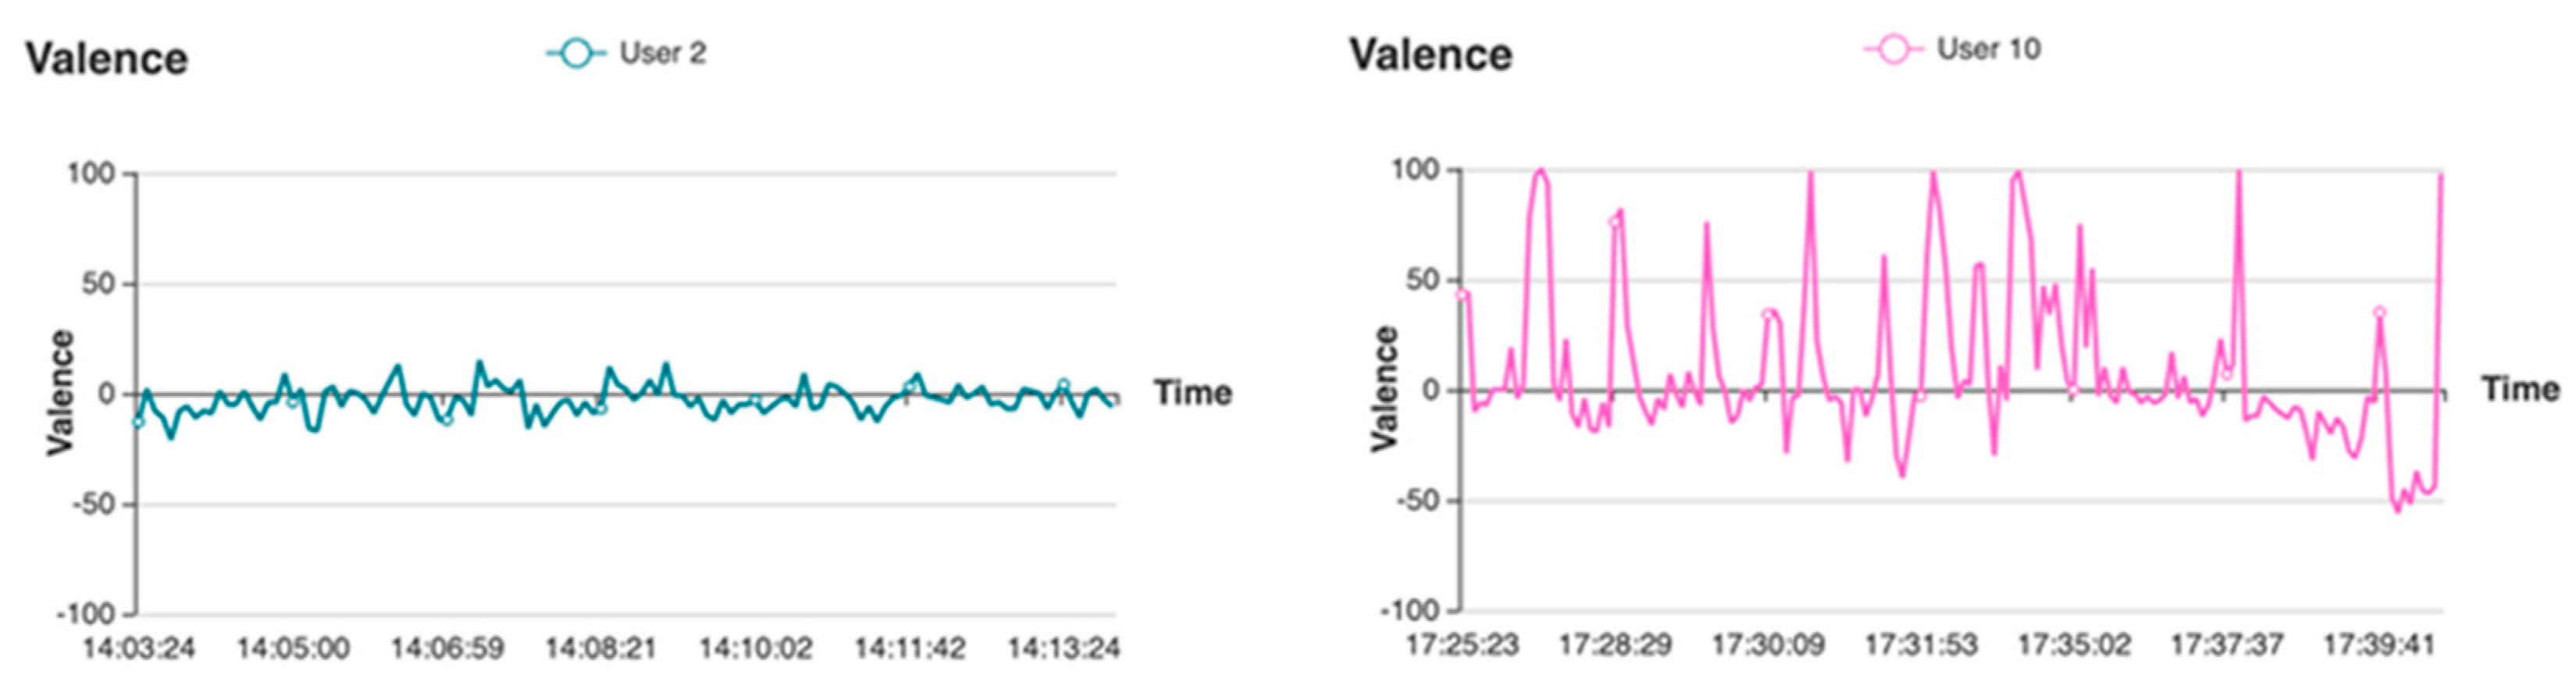
Lastly, the valence over time graph plots the positivity or negativity expressed by every participant while performing the task, as shown in Figure 7.
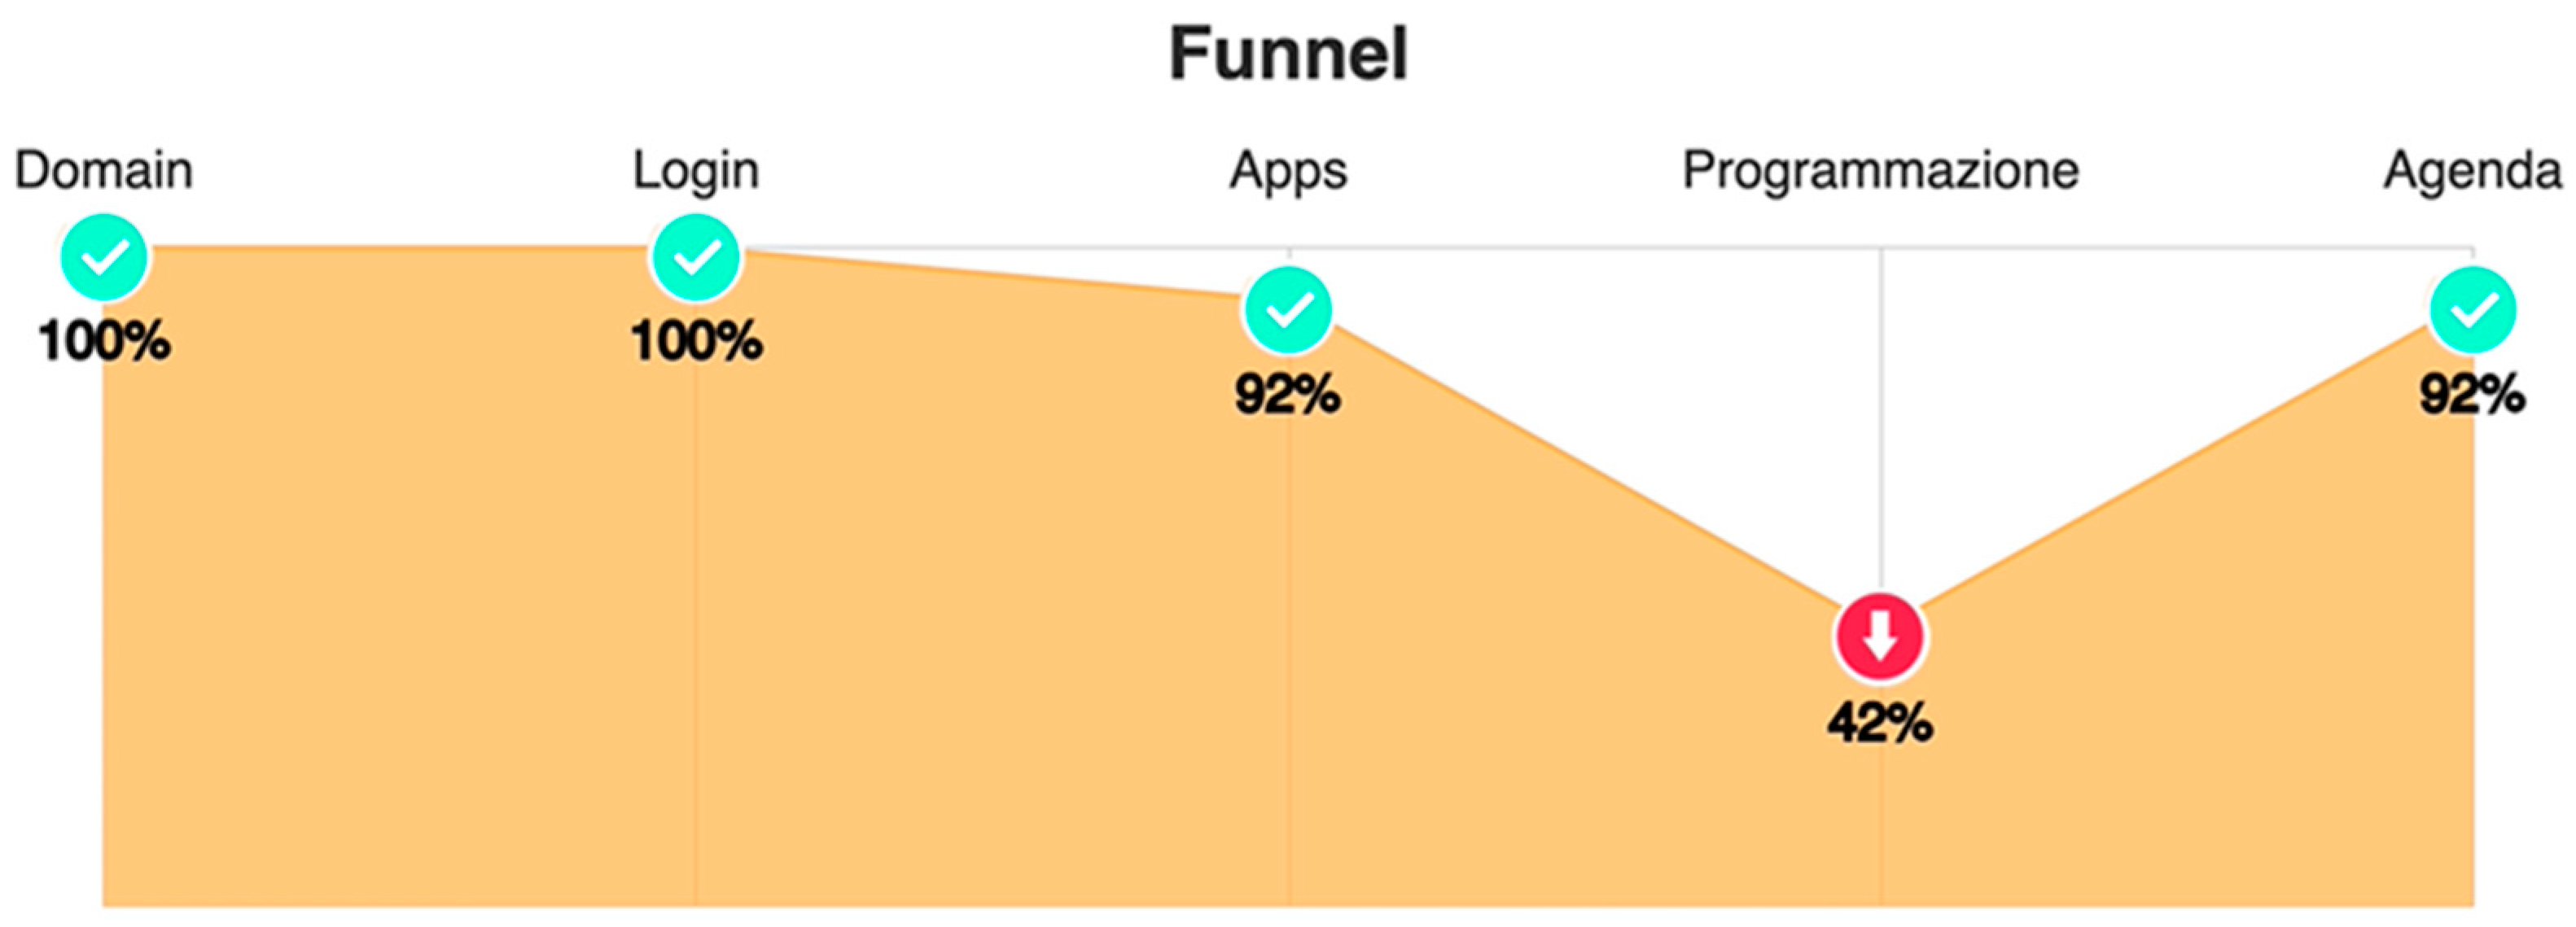
In the Navigation sub-section, it is possible to find other crucial analytics about the target website and the user’s interaction journey. The Structure Graph, a visiting rate Funnel, and Attention rates related to navigation paths are all shown in this subsection. In particular, the structure graph is a representation of the structure of the target website. When a node is selected, a funnel graph like the one shown in Figure 8 is drawn from the home page to the selected page, and all interactions occurring between these two pages are tracked (i.e., visiting rate and attention rate). Each vertical line on the Funnel chart represents a page in the target website, and the percentages indicate how many participants visited the corresponding page.
4. Case Studies and Results
The proposed platform was tested to evaluate the usability of two different web platforms. The first evaluated web platform is an online home electronics e-commerce store. The second case study involved an enterprise relationship management platform. Both studies were conducted remotely in a rigorous manner, by first defining the set of tasks to be completed, then gathering the pool of users, and eventually setting up the experiments. In both studies, the usability testing workflow consists of the following three phases: (1) defining the tasks, (2) conducting the tests, and (3) evaluating the results. Both of the following use cases are Remote Usability Tests (RUT), so some requirements and conditions of the usability testing platform have been explained beforehand to the participants, such as (1) performing the tasks in a relatively illuminated environment, (2) starting and finishing the tasks by pressing the “start” and “finish” buttons below the task description in order to stop the timer that keeps track of task duration, and (3) leaving notes or comments after finishing a task. In addition, all participants were informed that tasks were being recorded on video for further evaluation by the moderators. Users’ behavioural and interaction data collected during the test and results of SUS questionnaire have been elaborated through the Miora tool. Participants were required to remain in front of the camera at a certain distance attempting to keep the entire face within the intended frame in the screen (through a pre-test tutorial).
4.1. Usability Testing of an Online Store: Analyzing the Reliability of the Proposed Framework
The first use case aims to compare the usability level of a responsive user interface of an online home electronics store on two different display devices. The goal is to evaluate how the information provided by the analytics tools of the proposed tool allows for comparing the usability of the cross-platform interface, depending on whether it is viewed on a smartphone or a desktop PC. The study involved a total of 38 people (16 females and 22 males, with an average age of 31.1, standard deviation 8.4) without any physical or neurological impediment who are used to make purchases online and possess basic computer skills. They were randomly divided into two groups: group A (20 subjects) and group B (18 subjects). All participants gave written informed consent. Group A ran the simulation on a desktop computer, while Group B ran it on a smartphone. Both groups were asked to access the e-commerce site to evaluate the purchase of a new washing machine, and to complete the following three tasks:
- Task 1: Search for a washing machine of A+++ class with a price not exceeding €400. This task requires inserting appropriate words in the search bar and/or selecting the necessary filters;
- Task 2: Compare the several washing machine models and perform a choice. This task requires looking for information regarding each model shown in the results page, comparing the data, and performing a choice based on subjective preferences;
- Task 3: Buy the washing machine selected in the previous step. This task involved filling in a form with personal data and a billing address to simulate the transaction.
Users were left free to complete the tasks, without any time limits. In both scenarios, data regarding the users’ interaction with the web platform during the tests, such as the participants’ interaction path, gaze tracks, and emotional response, were collected to verify the reliability of the proposed tool. Furthermore, interaction metrics such as the tasks completion times, mouse click coordinates, scroll percentages, and timestamps were collected, together with pictures of the participants’ faces. Interaction data such as emotional response and eye movements were summarised in an aggregate manner with a moving average over the task duration; then, the corresponding charts were plotted.
The results obtained from each participant were analysed as both individual and collective data to extract insights regarding the usability of the online store’s web platform on desktop computers and mobile devices. However, the results provided through the graphs tracing the structure of the platform are not comparable, as the laptop and mobile interfaces differ in terms of how the subsections are organised, so they are not shown here.
Group A resulted in an average task execution time of 43.7 s with a standard deviation of 11.83 for the first task, 205.7 s with a standard deviation of 19.7 for the second one, and 149.6 s with a standard deviation of 11.1 for the third one, while group B showed higher mean execution times across all the tasks equal to 50.9 s with a standard deviation of 8.3, 258.1 s with a standard deviation of 13.9, and 209.1 s with a standard deviation of 10.9 for the first, second, and third tasks, respectively. We performed unpaired t-tests that resulted in the rejection of the null hypothesis of the means being equal with an alpha value of 0.05 across all three tasks with p (T ≤ t) = 0.035 two-tail for the first task and almost 0 in the other 2.
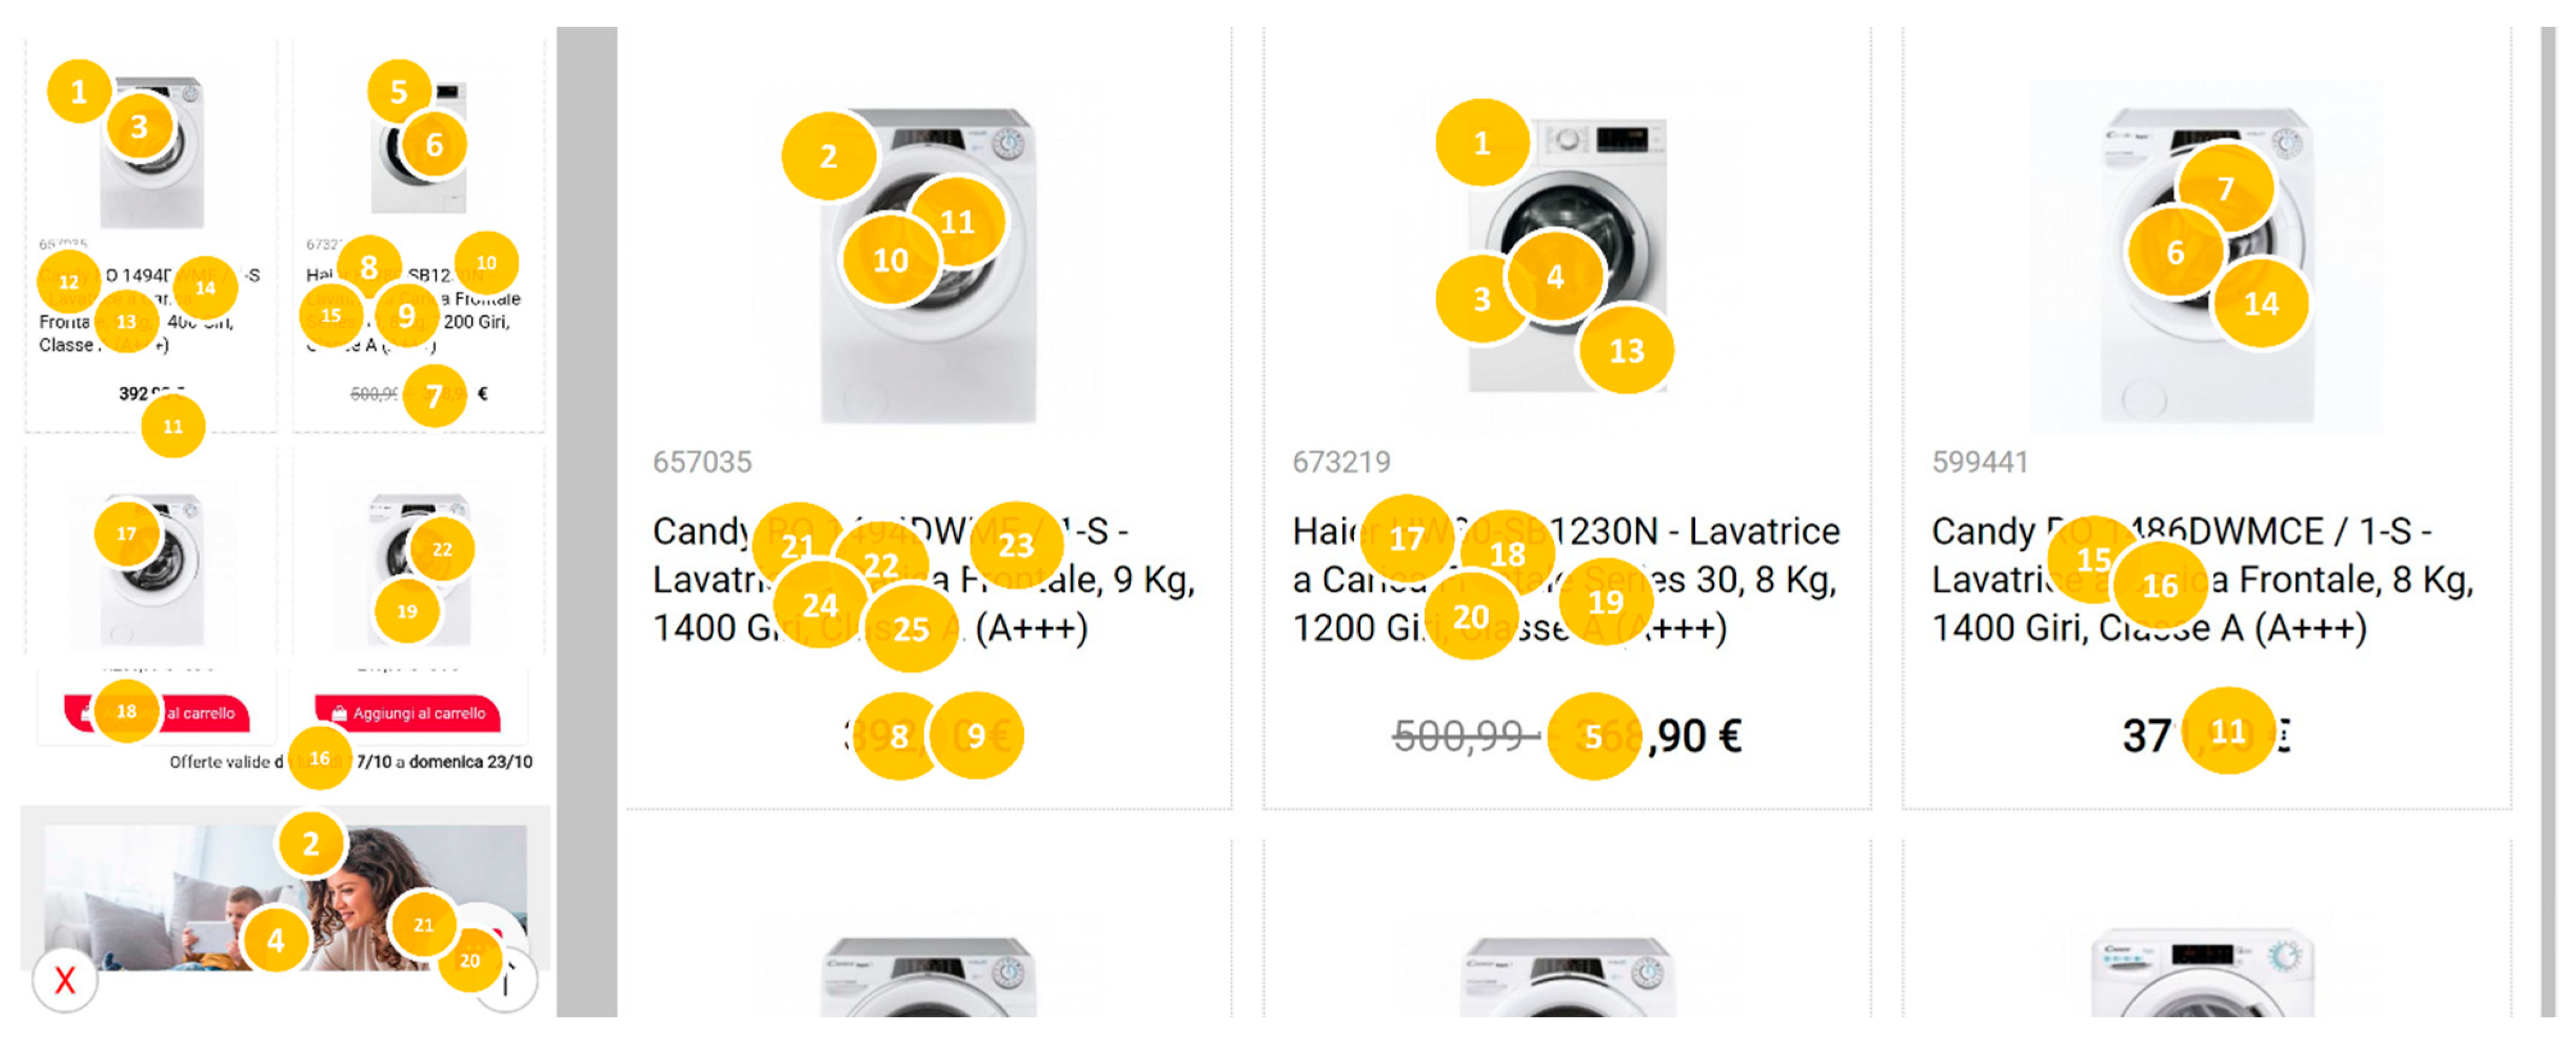
The graphs relating to the valence recorded during the second and third task in the case of group B show relatively negative results compared with those recorded for group A. In fact, in the case of group B, an average valence level of −3 was recorded, while, in the case of group A, the average valence level was 35. This may be due to greater frustration experienced by subjects in group B, particularly during the activities of comparing appliances and filling out the forms required to complete the purchase process. This is also supported by the gaze path analysis. In fact, as can be seen from the comparison of the gaze paths of two typical users (Figure 9), the gaze paths recorded show a more linear observation path and are more spatially circumscribed in the case of the user who completed the task with the desktop interface.
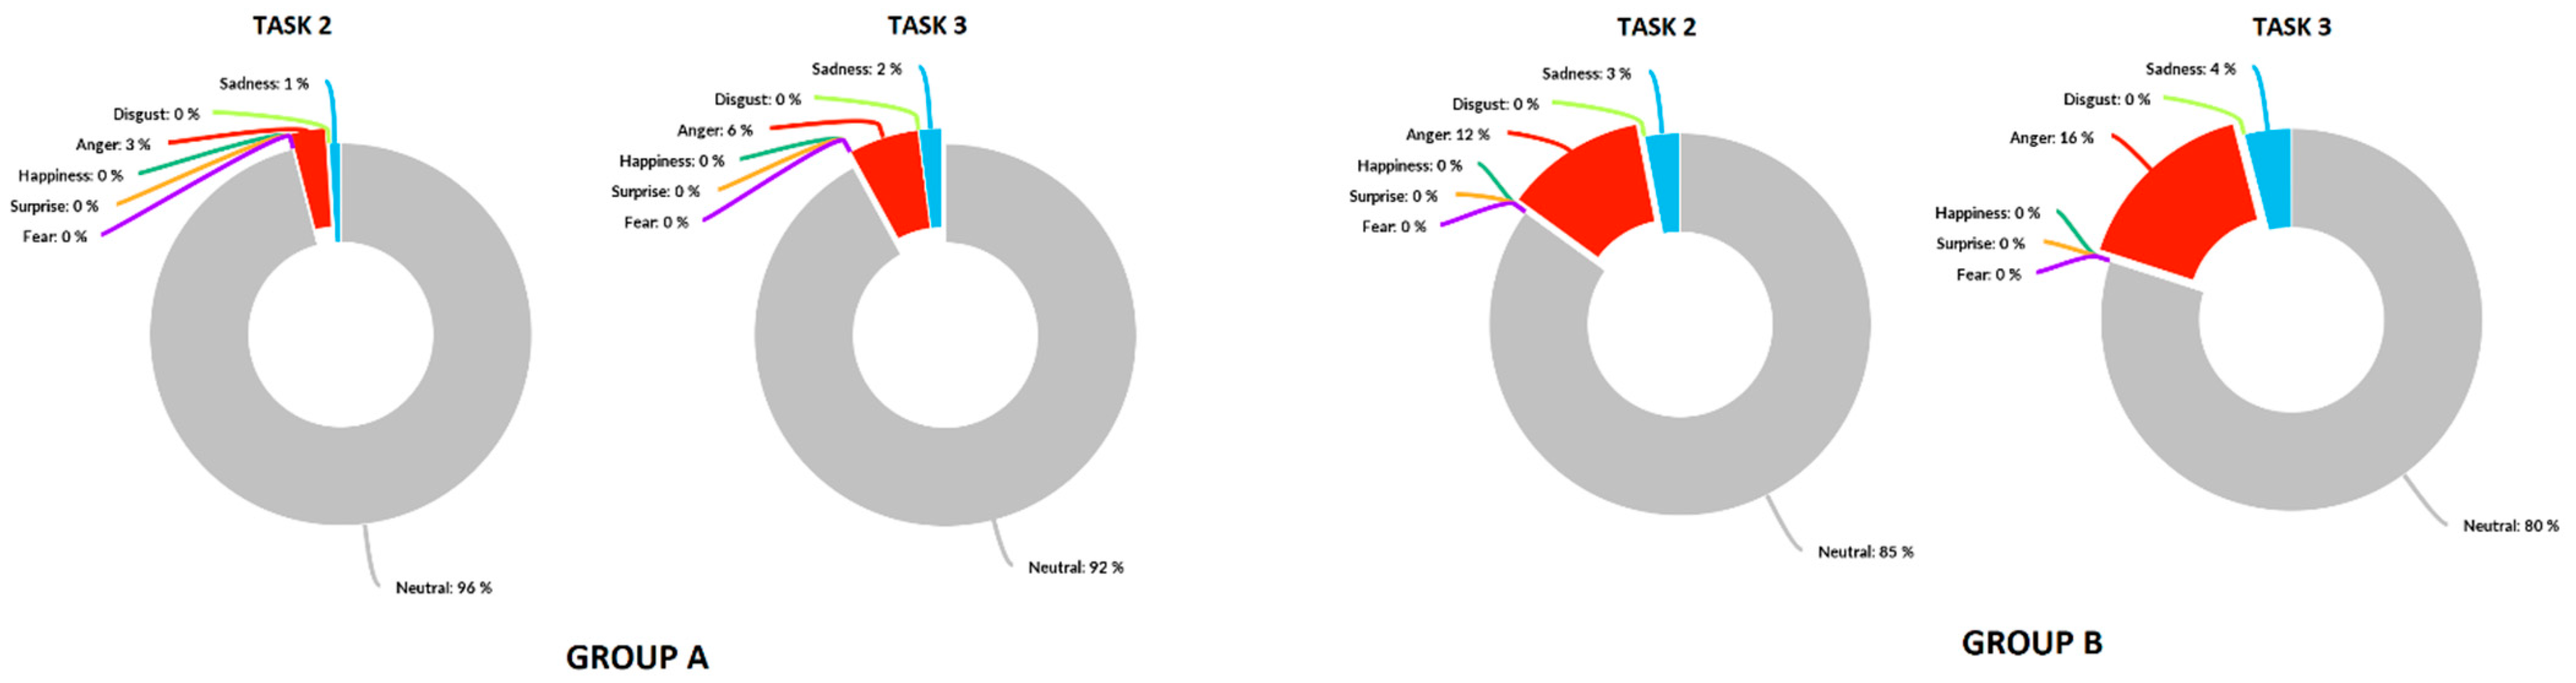
We can infer that this may be due to the fact that the desktop interface, due to the size of the screen, gives the user the ability to simultaneously display the features of multiple washing machine models on the same row for easy comparison, whereas the typical vertical orientation of the mobile device only allowed two models on the same row and therefore requires the user to continuously scroll to compare the features of different products. Similarly, the smartphone interface is less suitable for completing Task 3, as it does not provide a complete overview of the form to be completed, but instead the user must scroll through a long list of fields to complete. This can negatively affect the perception of task complexity, inducing more negative emotions in users. This observation is confirmed by the results shown in the graphs relating to Ekman emotions and valence: as can be seen in Figure 10, the percentage of anger manifested by the users in group B was 12% during task 2 and 16% in task 3, while it remained at lower levels in the case of the users in group A (3% task 2 and 6% task 3).
This led to Satisfaction values (derived from the valence calculation) that were mostly neutral, except for group B in task 3, in which 12 subjects reported values associated with the Unsatisfied category. This analysis shows, therefore, that the system can provide moderators with a set of information that can efficiently support the qualitative analysis of the results of comparative studies, aimed at assessing the usability of different interface options.
4.2. Usability Testing of a Management Web Platform
The second case study aims to analyse an enterprise multi-functional management web platform, focusing in more detail on the interface general design issues. The test involved a total of 12 people (4 females and 8 males with average age 29.3, standard deviation 5.3) without any physical or neurological impediment, who regularly use products in the same category, but who have never used the product under analysis. All participants gave written informed consent. Both groups had to complete the following tasks while browsing the platform, the structure of which is shown in Figure 11:
- Task 1: Log in into the system and add a weather widget of your current city, to the platform desktop. This task involved accessing the system, selecting the appropriate widget, and choosing the current city from a drop-down menu in the weather widget;
- Task 2: Log in into the system and assign a job to a team member. This task required accessing a toolbar menu (the Apps menu) not visible by default. Then, users had to navigate to the appropriate app in the toolbar, select a specific team member from the list, select a timeframe in which a job must be performed, write a brief description of the job, and assign the job to them;
- Task 3: Log in into the system and change the layout of the grid by selecting “up to today”. This involved navigating to the Interventions menu and clicking the button on top of the grid that changes the layout;
- Task 4: Log in into the system and send a message without an attachment to a team member. This involved finding the messaging app in the Apps menu, selecting the recipient by clicking on a specific checkbox, and sending the message by pressing the “Enter” key on the keyboard;
- Task 5: Log in into the system and delete the first report on the list. This last task involved going into the reports grid and clicking on the “Delete” button of the chosen report.
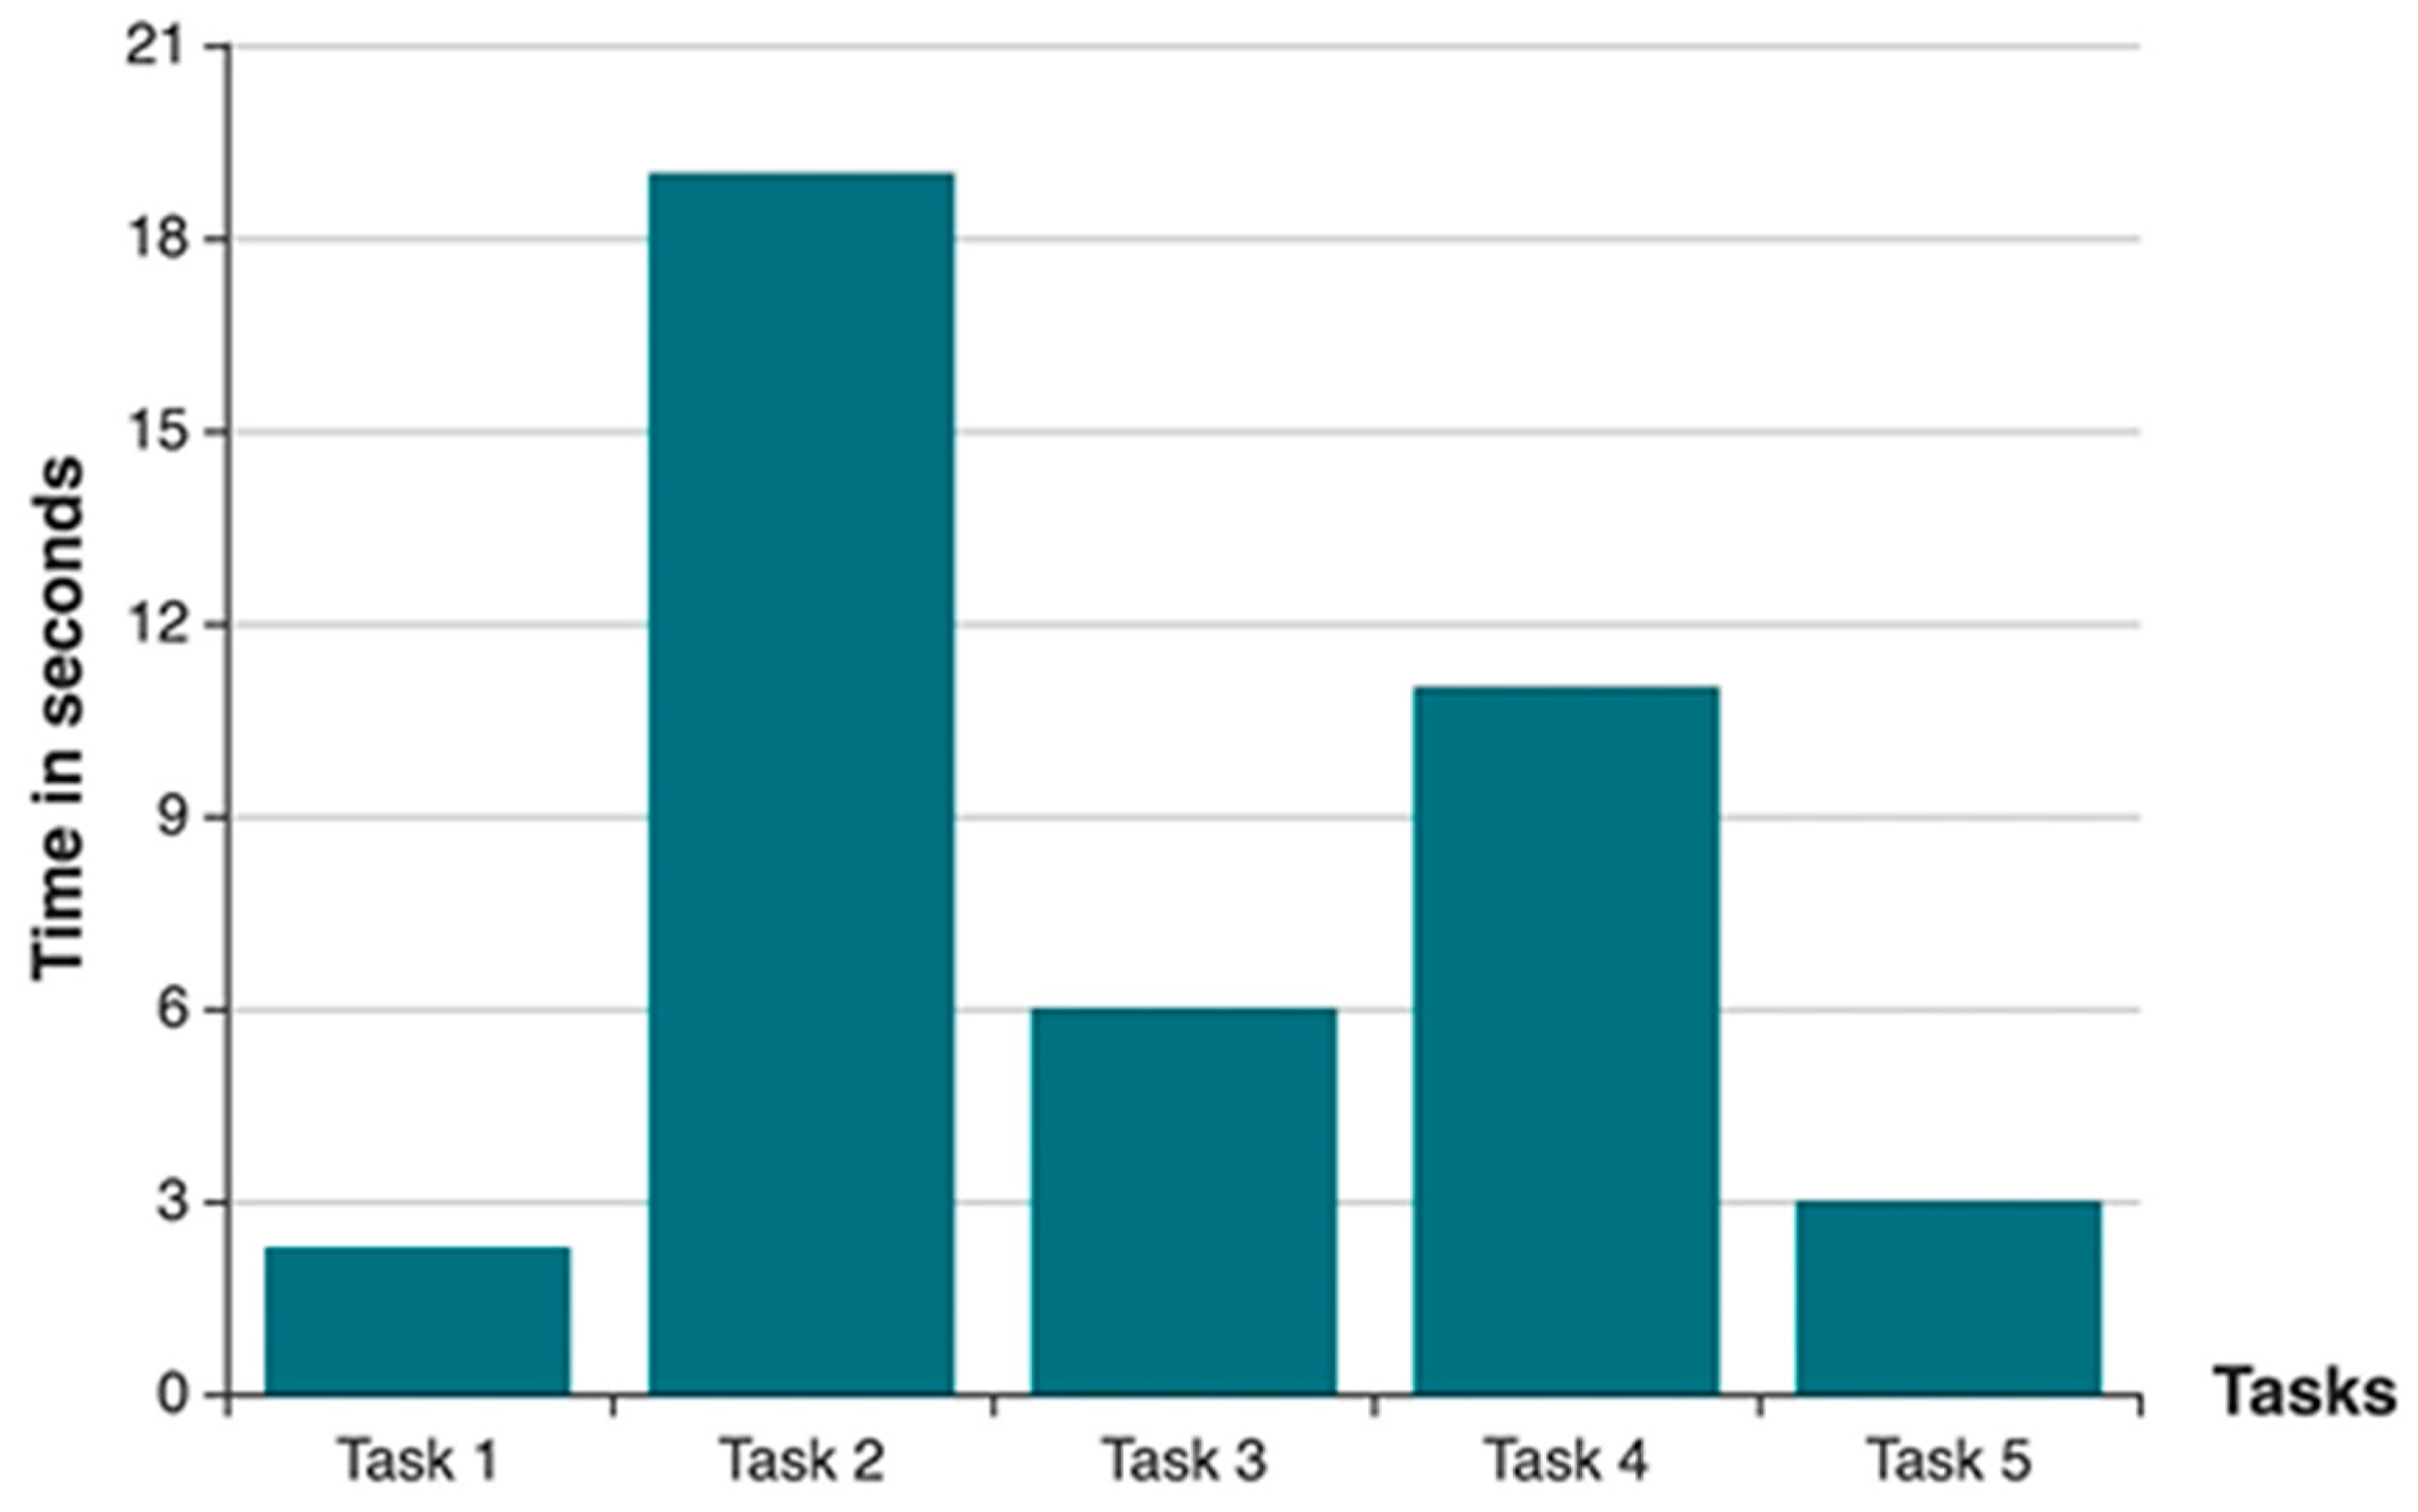
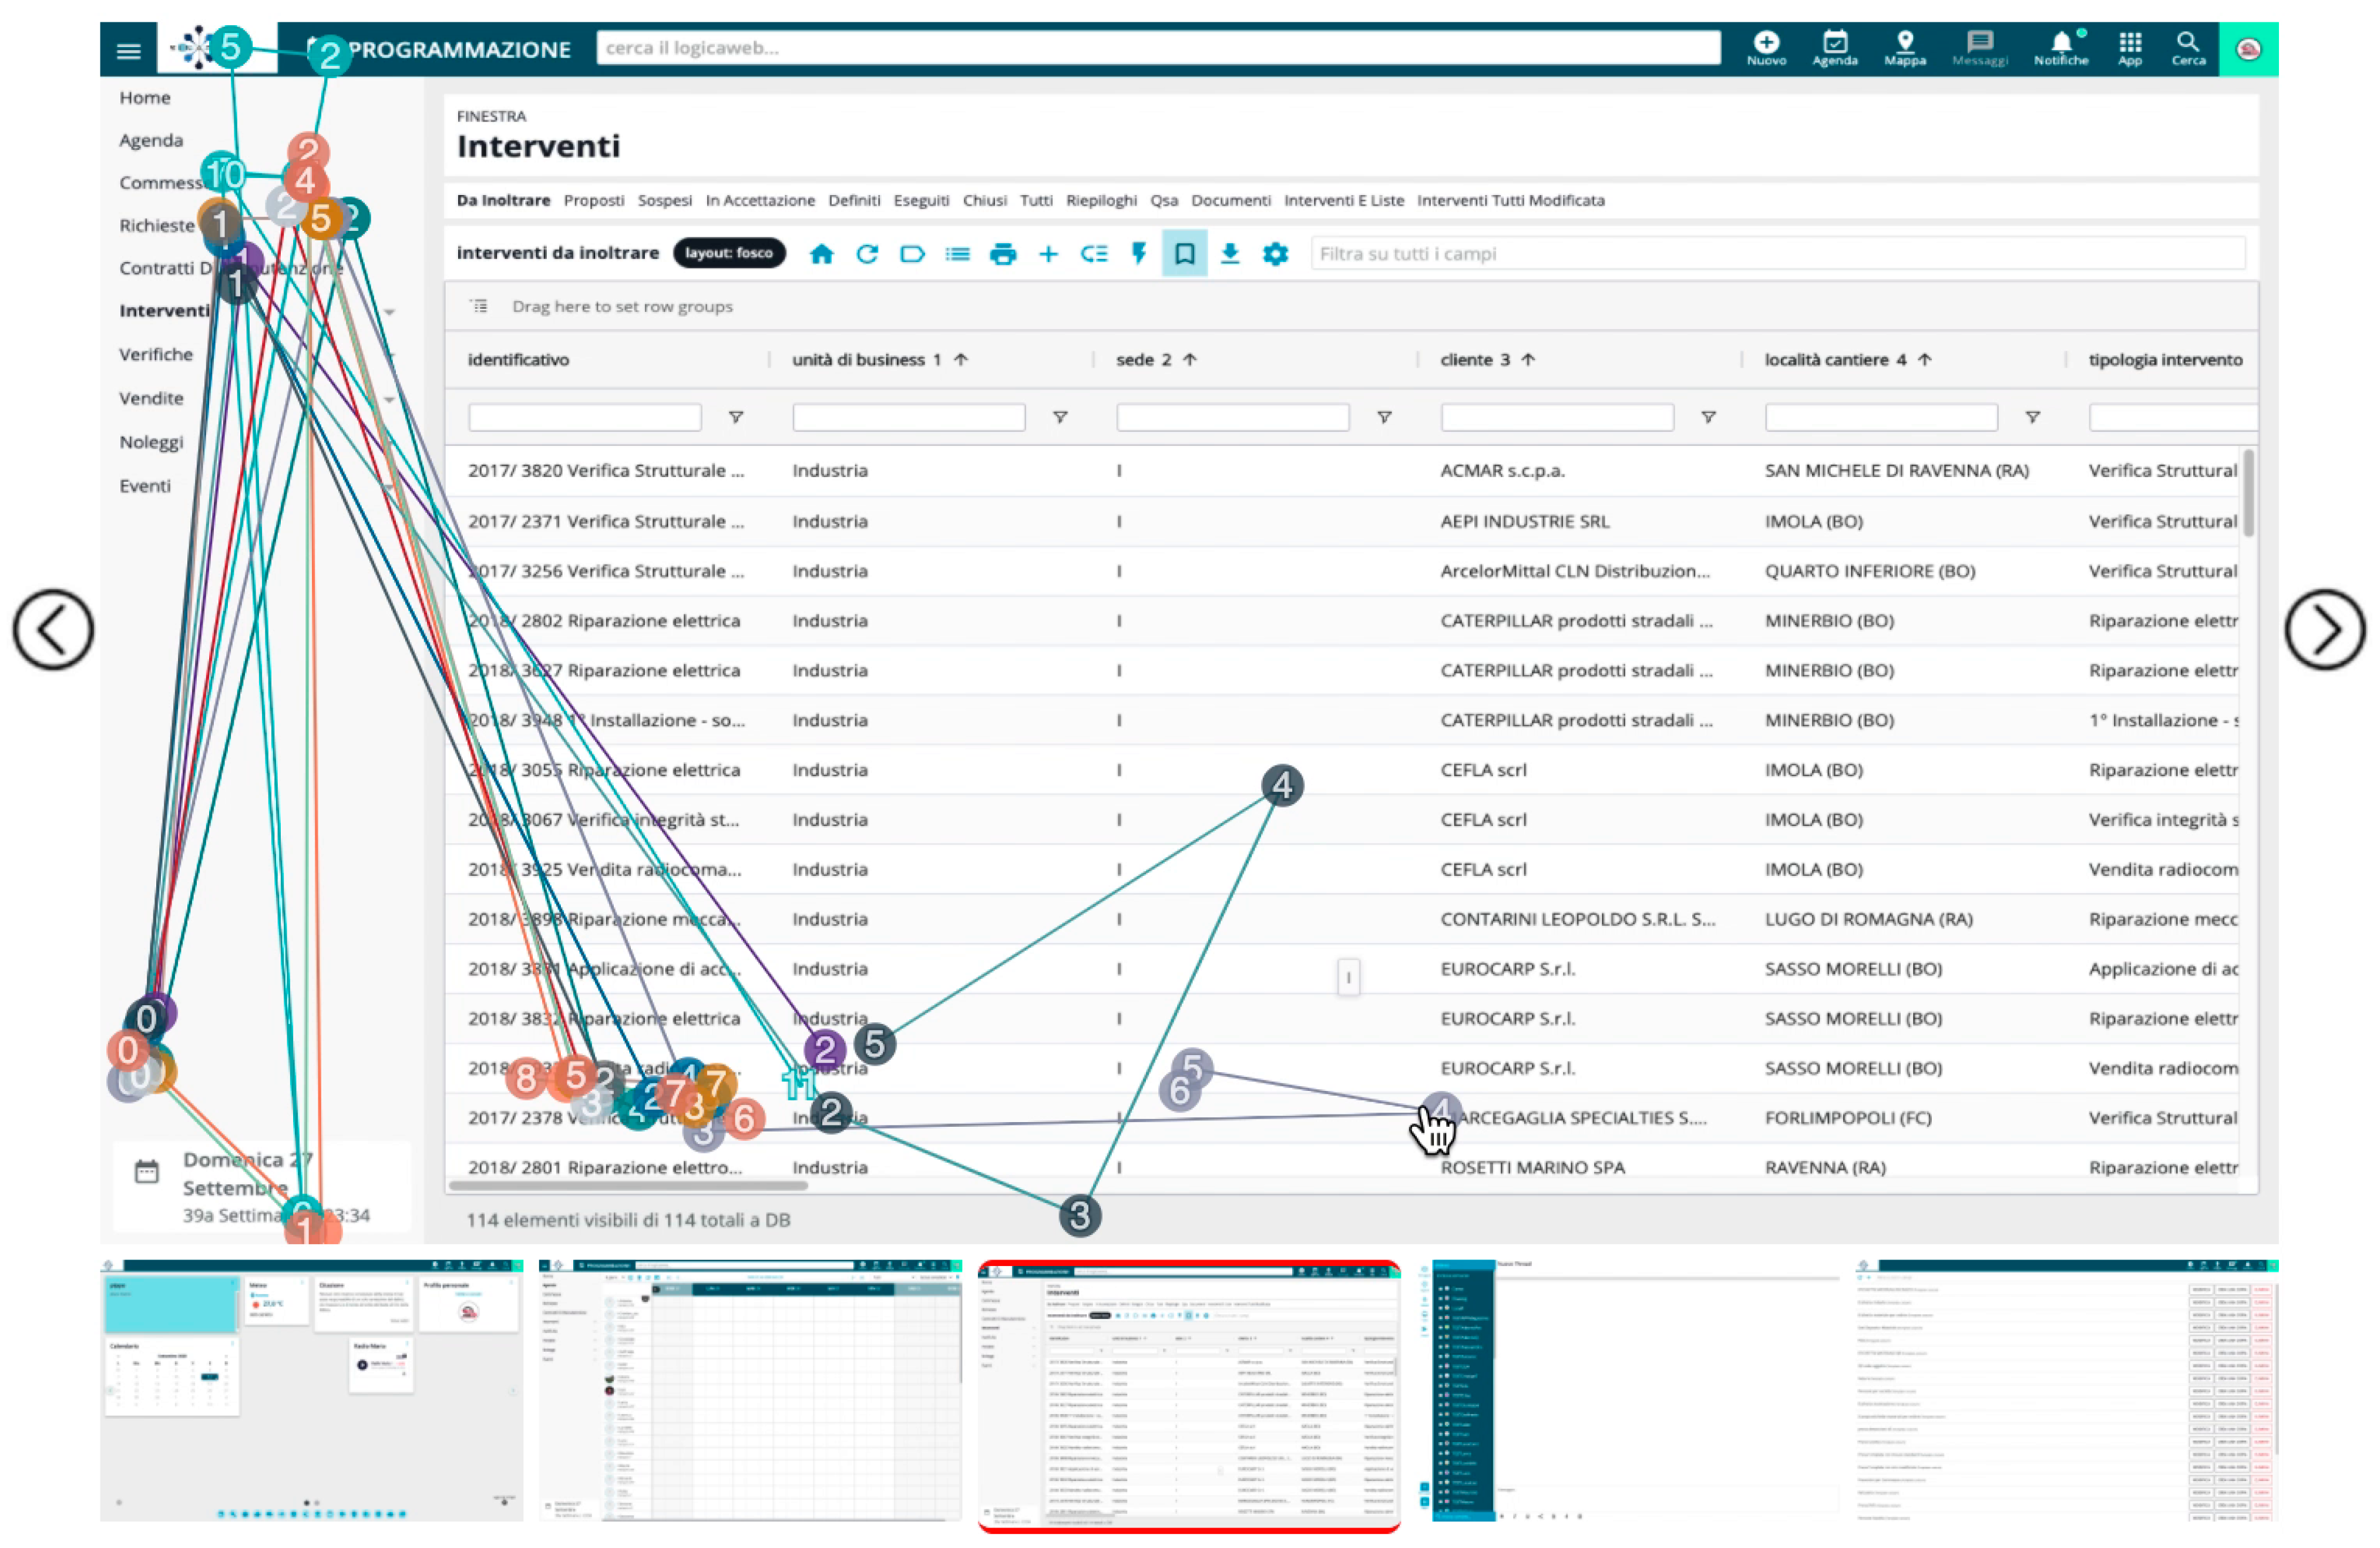
Users were left free to complete the tasks, without any time limits. Also in this case, data regarding the users’ interaction with the web platform during the tests were collected and analysed to have a preliminary assessment of the quality of user interface design in terms of usability. Tasks 1 and 5 were completed by all users, while tasks 2, 3, and 4 were completed by all but one participant. The Efficiency chart in Figure 12 shows that completion time of the second task is significantly higher than the others: this may be due to the difficulty that some participants had in finding the Apps menu.
This consideration is also supported by the percentage of anger and sadness manifested by the users during the execution of task 2, respectively 14% and 9%, as shown in Figure 13.
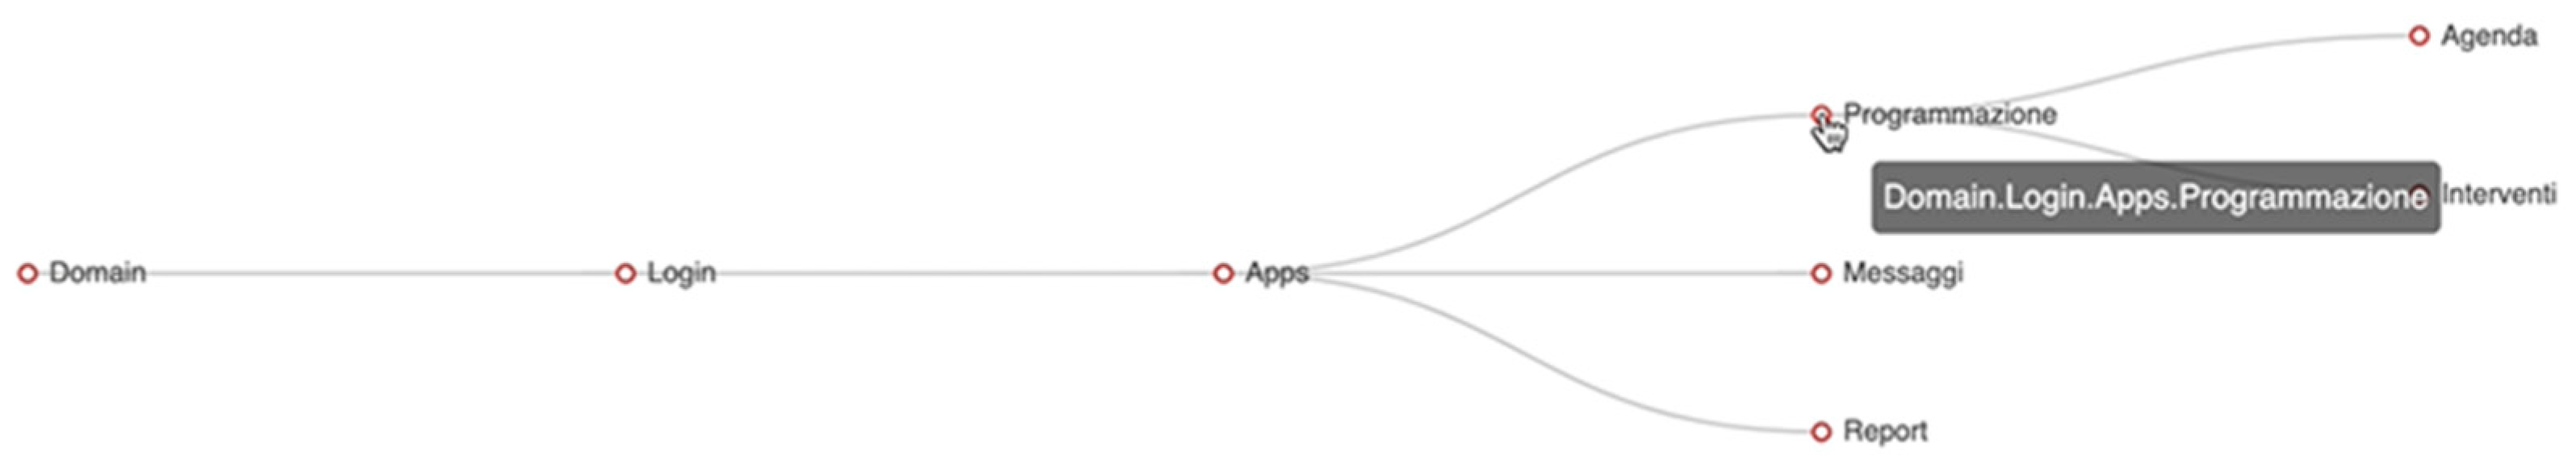
Figure 14 below shows click paths of users while performing task 2 on the Agenda and Messaggi app interface, differentiating each participant with a different colour (in this case also the 13th expert user data are plotted).
This diagram shows how much the variety of click paths varies: in this case, some users seemed undecided and changed their minds several times. By analysing the completion times, the click paths, the completion rates and the notes, most of the problems with the usability of the interfaces of the web platforms can be identified. However, satisfaction also plays a large role in determining whether or not users have a positive experience learning how to use the product and whether or not the platform prerequisites are met. The funnel plots of Tasks 2 and 3 show that not all participants took the same path to the Agenda app or to the Intervention app, and depending on which path they took, it is possible to examine how this affects their satisfaction. Both scenarios resulted in some participants taking longer paths to reach the target interface, which in turn expressed negative emotions and showed lower satisfaction. The results show that the proposed tool can be used in a remote usability test and can assist moderators in data collection and analysis. Specifically, it demonstrated how a moderator can interpret the diagrams to understand which user interface elements caused the most problems and frustrations in terms of efficiency, effectiveness, and satisfaction, and therefore may need to be redesigned.
At the end of both tests, it was found that at least one face frame was sent to the server per second, which allowed an accurate match between the information derived from the webcam images and the information obtained directly from JavaScript (clicks, scrolls, etc.).
5. Conclusions and Future Work
This work presented Miora, a remote usability assessment tool that helps moderators to collect and analyse data to better understand user perception, recognition, and behaviour when using a web platform. The proposed tool exploits the advantages of remote usability testing tools, such as the ability to reach more people regardless of geographic origin and less infrastructure costs. However, this tool is not able to directly support a quantitative analysis, thus providing methods to statistically analyse user interactions’ data. Compared to most of the commercial and academic tools, it provides a holistic platform that facilitates moderators’ work following remote sessions and enables usability analysis using various metrics and approaches. Participants can indeed be involved in usability tests with generic devices such as personal computers, smartphones or tablets supplied with a frontal camera, without any other special equipment. The modular design approach applied during development also makes it very easy to upgrade or replace each module separately if needed. To evaluate whether Miora can support moderators during usability evaluations, a longitudinal analysis of two case studies was conducted. Results suggest that this tool can provide useful insights to support a qualitative analysis aimed at defining useful indicators for designing and refactoring of user interfaces. In particular, the dashboard insights were considered particularly useful for a preliminary evaluation by the moderators involved in the experiment. However, in order to evaluate its effectiveness, it is still necessary to further investigate with more experiments analysing the results from a quantitative point of view.
Employing artificial intelligence in usability testing is an innovative way to improve the usability of a product. As indicated, these technologies have strong limitations, especially about the recognition of human emotions, but, in the hands of an experienced evaluator, they can still bring very useful data, especially considering a large sample of users. Deep learning models are, in addition, developing very rapidly, and researchers frequently publish new approaches that are superior to previous ones; therefore, it is crucial to train new models with more advanced approaches to achieve better results. Other limitations relate to the necessity to embed code in a website, making some platforms that require high security standards, such as banking platforms, unable to take advantage of this tool. Another point to consider also concerns the technical requirements, mainly related to the quality of the user’s Internet connection. In the case of a connection with high upload latency, in fact, metrics based on the subject’s face are basically unattainable. Finally, the use of computer vision and deep learning techniques requires that the face is always recognizable and never partially covered. In this sense, it is also complicated to identify where the software has produced untruthful results due to the poor quality of the processed frames. Possible future development could involve emotion classification from audio processing, and improve the eye tracking module, bringing it on par with gold standard tools like Tobii. There are various technologies available to help enterprises run their usability tests at scale, across devices and user demographics at a faster pace and in a cost-effective manner. However, today this tool provides a more in-depth overview of KPIs directly related to usability, providing a comprehensive evaluation methodology also supported by other evaluation methods, like the SUS questionnaire.
Author Contributions
Conceptualization, A.G.; Investigation, J.Y.V.; Formal Analysis, J.Y.V.; Methodology, S.C.; Project administration, M.M.; Software, A.G. and L.G.; Validation, A.G. and S.C.; Writing—original draft, A.G., J.Y.V. and S.C.; Writing—review and editing, A.G. and S.C.; Funding Acquisition, L.G.; Supervision, M.M.; Resources, M.M. All authors have read and agreed to the published version of the manuscript.
Funding
This research received no external funding.
Institutional Review Board Statement
The study was conducted in accordance with the Declaration of Helsinki.
Informed Consent Statement
Informed consent was obtained from all subjects involved in the study.
Data Availability Statement
Not applicable.
Acknowledgments
The authors would also thank Abudukaiyoumu Talipu for the help and support in the design of the platform.
Conflicts of Interest
The authors declare no conflict of interest.
References
- Zaki, T.; Islam, M.N. Neurological and physiological measures to evaluate the usability and user-experience (UX) of information systems: A systematic literature review. Comput. Sci. Rev. 2021, 40, 100375. [Google Scholar] [CrossRef]
- Cooper, R.G. The drivers of success in new-product development. Ind. Mark. Manag. 2018, 76, 36–47. [Google Scholar] [CrossRef]
- Piller, F.; Susumu, O. Reducing the risks of new product development. MIT Sloan Manag. Rev. 2006, 47, 65–71. [Google Scholar]
- Nielsen, J. Usability Engineering; Morgan Kaufman: San Diego, CA, USA, 1994. [Google Scholar]
- International Organization for Standardization. ISO 9241-11:2018; Ergonomics of Human-System Interaction—Part 11: Usability: Definitions and Concepts (ISO 9241-11:2018). ISO: Geneva, Switzerland, 2018. Available online: https://www.iso.org/standard/63500.html (accessed on 22 April 2022).
- Tullis, T.; Albert, B. Measuring the User Experience: Collecting, Analyzing, and Presenting Usability Metrics, 2nd ed.; Morgan Kaufmann: San Francisco, CA, USA, 2013. [Google Scholar]
- Bevan, N.; Carter, J.; Earthy, J.; Geis, T.; Harker, S. New ISO Standards for Usability, Usability Reports and Usability Measures. In Human-Computer Interaction. Theory, Design, Development and Practice, Proceedings of the 2016 International Conference on Human-Computer Interaction (HCI’2016), Toronto, ON, Canada, 17–22 July 2016; Springer: Cham, Switzerland, 22 July 2016; pp. 268–278. [Google Scholar] [CrossRef]
- Kirakowski, J.; Corbett, M. SUMI: The Software Usability Measurement Inventory. Br. J. Educ. Technol. 1993, 24, 210–212. [Google Scholar] [CrossRef]
- Brooke, J. SUS: A ’Quick and Dirty’ Usability Scale. Usability Eval. Ind. 1996, 189, 4–7. [Google Scholar]
- Altieri, A.; Ceccacci, S.; Mengoni, M. Emotion-Aware Ambient Intelligence: Changing Smart Environment Interaction Paradigms Through Affective Computing. In International Conference on Human-Computer Interaction; Springer: Cham, Switzerland, 2019; pp. 258–270. [Google Scholar] [CrossRef]
- Munim, K.M.; Islam, I.; Khatun, M.; Karim, M.; Islam, M.N. Towards developing a tool for UX evaluation using facial expression. In Proceedings of the 2017 3rd International Conference on Electrical Information and Communication Technology (EICT), Khulna, Bangladesh, 7–9 December 2017; 2017; pp. 1–6. [Google Scholar] [CrossRef]
- Kim, B.; Dong, Y.; Kim, S.; Lee, K.-P. Development of Integrated Analysis System and Tool of Perception, Recognition, and Behavior for Web Usability Test: With Emphasis on Eye-Tracking, Mouse-Tracking, and Retrospective Think Aloud. In International Conference on Usability and Internationalization; Springer: Berlin, Germany, 2007; Volume 4559, pp. 113–121. [Google Scholar] [CrossRef]
- Hussain, J.; Khan, W.A.; Hur, T.; Bilal, H.S.M.; Bang, J.; Hassan, A.U.; Afzal, M.; Lee, S. A Multimodal Deep Log-Based User Experience (UX) Platform for UX Evaluation. Sensors 2018, 18, 1622. [Google Scholar] [CrossRef] [PubMed] [Green Version]
- Franco, R.Y.D.S.; De Freitas, A.A.; Lima, R.S.D.A.D.; Mota, M.P.; dos Santos, C.G.R.; Meiguins, B.S. UXmood—A Tool to Investigate the User Experience (UX) Based on Multimodal Sentiment Analysis and Information Visualization (InfoVis). In Proceedings of the 2019 23rd International Conference Information Visualisation (IV), Paris, France, 2–5 July 2019; pp. 175–180. [Google Scholar] [CrossRef]
- Sivaji, A.; Ahmad, W.F.W. Benefits of Complementing Eye-Tracking Analysis with Think-Aloud Protocol in a Multilingual Country with High Power Distance. In Current Trends in Eye Tracking Research; Springer: Cham, Switzerland, 2014; pp. 267–278. [Google Scholar] [CrossRef]
- Dixit, S.; Padmadas, V. Automated Usability Evaluation of Web Applications. In Proceedings of the International Congress on Information and Communication Technology, Singapore, 26–29 November 2016; pp. 139–149. [Google Scholar] [CrossRef]
- Krafka, K.; Khosla, A.; Kellnhofer, P.; Kannan, H.; Bhandarkar, S.; Matusik, W.; Torralba, A. Eye Tracking for Everyone. In Proceedings of the IEEE Conference on Computer Vision and Pattern Recognition, Las Vegas, NV, USA, 27–30 June 2016. [Google Scholar] [CrossRef]
- Tzafilkou, K.; Protogeros, N. Diagnosing user perception and acceptance using eye tracking in web-based end-user development. Comput. Hum. Behav. 2017, 72, 23–37. [Google Scholar] [CrossRef]
- Moro, R.; Daraz, J.; Bielikova, M. Visualization of Gaze Tracking Data for UX Testing on the Web. In Proceedings of the Late-breaking Results, Doctoral Consortium and Workshop Proceedings of the 25th ACM Hypertext and Social Media Conference, Santiago, Chile, 1–4 September 2014. [Google Scholar]
- Barnum, C.M. Usability Testing Essentials: Ready, Set… Test! 2nd ed.; Morgan Kaufman: Cambridge, MA, USA, 2020. [Google Scholar]
- Gardner, J. Remote Web Site Usability Testing—Benefits Over Traditional Methods. Int. J. Public Inf. Syst. 2007, 3, 63–73. [Google Scholar]
- Peres, S.C.; Pham, T.; Phillips, R. Validation of the System Usability Scale (SUS). Proc. Hum. Factors Ergon. Soc. Annu. Meet. 2013, 57, 192–196. [Google Scholar] [CrossRef]
- Reeves, S. How UX Practitioners Produce Findings in Usability Testing. ACM Trans. Comput. Interact. 2019, 26, 1–38. [Google Scholar] [CrossRef] [Green Version]
- Jabbar, J.; Urooj, I.; JunSheng, W.; Azeem, N. Real-time Sentiment Analysis On E-Commerce Application. In Proceedings of the IEEE 16th International Conference on Networking, Sensing and Control (ICNSC), Banff, AB, Canada, 9–11 May 2019; pp. 391–396. [Google Scholar] [CrossRef]
- Nielsen, J. Why You Only Need to Test with 5 Users. Available online: https://www.nngroup.com/articles/why-you-only-need-to-test-with-5-users/ (accessed on 18 October 2022).
- Sivaji, A.; Tzuaan, S.S. Website user experience (UX) testing tool development using Open Source Software (OSS). In Proceedings of the Southeast Asian Network of Ergonomics Societies Conference (SEANES), Langkawi, Malaysia, 9–12 July 2012; pp. 1–6. [Google Scholar] [CrossRef]
- Chin, J.P.; Diehl, V.A.; Norman, K.L. Development of an instrument measuring user satisfaction of the human-computer interface. In Proceedings of the SIGCHI ‘88, Washington, DC, USA, 15–19 May 1998; pp. 213–218. [Google Scholar] [CrossRef]
- Claridge, N.; Kirakowski, J. WAMMI: Website Analysis and Measurement Inventory Questionnaire. Available online: http://www.wammi.com/index.html (accessed on 27 July 2022).
- Ceccacci, S.; Generosi, A.; Giraldi, L.; Mengoni, M. An Emotion Recognition System for monitoring Shopping Experience. In Proceedings of the 11th Pervasive Technologies Related to Assistive Environments Conference, Corfu, Greece, 26–29 June 2018; pp. 102–103. [Google Scholar] [CrossRef]
- Li, S.; Deng, W. Deep Facial Expression Recognition: A Survey. IEEE Trans. Affect. Comput. 2020, 13, 1195–1215. [Google Scholar] [CrossRef]
- Ekman, P. Basic Emotions. In Handbook of Cognition and Emotions; John Wiley & Sons: Sussex, UK, 1999. [Google Scholar]
- Noroozi, F.; Marjanovic, M.; Njegus, A.; Escalera, S.; Anbarjafari, G. Audio-Visual Emotion Recognition in Video Clips. IEEE Trans. Affect. Comput. 2017, 10, 60–75. [Google Scholar] [CrossRef]
- Barrett, L.F.; Adolphs, R.; Marsella, S.; Martinez, A.M.; Pollak, S.D. Emotional Expressions Reconsidered: Challenges to Inferring Emotion From Human Facial Movements. Psychol. Sci. Public Interes. 2019, 20, 1–68. [Google Scholar] [CrossRef] [PubMed] [Green Version]
- Kaur, H.; McDuff, D.; Williams, A.C.; Teevan, J.; Iqbal, S.T. “I Didn’t Know I Looked Angry”: Characterizing Observed Emotion and Reported Affect at Work. In Proceedings of the 2022 CHI Conference on Human Factors in Computing Systems, New York, NY, USA, 29 April–5 May 2022. [Google Scholar] [CrossRef]
- Noordewier, M.K.; Breugelmans, S.M. On the valence of surprise. Cogn. Emot. 2013, 27, 1326–1334. [Google Scholar] [CrossRef] [Green Version]
- Basu, S.; Bag, A.; Aftabuddin, M.; Mahadevappa, M.; Mukherjee, J.; Guha, R. Effects of emotion on physiological signals. In Proceedings of the 2016 IEEE Annual India Conference (INDICON), Bangalore, India, 16–18 December 2016; pp. 1–6. [Google Scholar] [CrossRef]
- Alhagry, S.; Aly, A.; El-Khoribi, R. Emotion Recognition based on EEG using LSTM Recurrent Neural Network. Int. J. Adv. Comput. Sci. Appl. 2017, 8, 081046. [Google Scholar] [CrossRef] [Green Version]
- Athavipach, C.; Pan-Ngum, S.; Israsena, P. A Wearable In-Ear EEG Device for Emotion Monitoring. Sensors 2019, 19, 4014. [Google Scholar] [CrossRef] [Green Version]
- Zhang, X.; Sugano, Y.; Fritz, M.; Bulling, A. Appearance-Based Gaze Estimation in the Wild. In Proceedings of the IEEE Conference on Computer Vision and Pattern Recognition, Boston, MA, USA, 12 June 2015; pp. 1–10. [Google Scholar]
- Fu, B.; Noy, N.F.; Storey, M.-A. Eye tracking the user experience—An evaluation of ontology visualization techniques. Semant. Web 2016, 8, 23–41. [Google Scholar] [CrossRef] [Green Version]
- De Bleecker, I.; Okoroji, R. Remote Usability Testing: Actionable Insights in User Behavior across Geographies and Time Zones; Packt Publishing: Birmingham, UK, 2018. [Google Scholar]
- Lewis, J.R. Usability: Lessons Learned … and Yet to Be Learned. Int. J. Hum.-Comput. Interact. 2014, 30, 663–684. [Google Scholar] [CrossRef]
- Alhadreti, O. A Comparison of Synchronous and Asynchronous Remote Usability Testing Methods. Int. J. Human-Computer Interact. 2021, 38, 289–297. [Google Scholar] [CrossRef]
- Plaza, B. Google Analytics for measuring website performance. Tour. Manag. 2011, 32, 477–481. [Google Scholar] [CrossRef]
- User Research & UX Testing Solution. Available online: https://www.userzoom.com/ (accessed on 24 February 2022).
- Validately. Available online: https://faq.validately.com/hc/en-us (accessed on 24 February 2022).
- The Human Insight Platform. Available online: https://www.usertesting.com/ (accessed on 24 February 2022).
- Remote User Testing Platform. Available online: https://www.userlytics.com (accessed on 24 February 2022).
- Website Heatmaps & Behavior Analytics Tools. Available online: https://www.hotjar.com (accessed on 24 February 2022).
- Celebrating 20 Years—Global Leader in Eye Tracking. Available online: https://www.tobii.com/ (accessed on 24 February 2022).
- Generosi, A.; Ceccacci, S.; Faggiano, S.; Giraldi, L.; Mengoni, M. A Toolkit for the Automatic Analysis of Human Behavior in HCI Applications in the Wild. Adv. Sci. Technol. Eng. Syst. J. 2020, 5, 185–192. [Google Scholar] [CrossRef]
- King, D.E. Dlib-ml: A Machine Learning Toolkit. J. Mach. Learn. Res. 2009, 10, 1755–1758. [Google Scholar] [CrossRef]
- Talipu, A.; Generosi, A.; Mengoni, M.; Giraldi, L. Evaluation of Deep Convolutional Neural Network architectures for Emotion Recognition in the Wild. In Proceedings of the 2019 IEEE 23rd International Symposium on Consumer Technologies (ISCT), Ancona, Italy, 19–21 June 2019; pp. 25–27. [Google Scholar] [CrossRef]
- Ceccacci, S.; Mengoni, M.; Andrea, G.; Giraldi, L.; Carbonara, G.; Castellano, A.; Montanari, R. A Preliminary Investigation Towards the Application of Facial Expression Analysis to Enable an Emotion-Aware Car Interface. In International Conference on Human-Computer Interaction; Springer: Cham, Switzerland, 2020; pp. 504–517. [Google Scholar] [CrossRef]
- Ceccacci, S.; Generosi, A.; Cimini, G.; Faggiano, S.; Giraldi, L.; Mengoni, M. Facial coding as a mean to enable continuous monitoring of student’s behavior in e-Learning. In Proceedings of the CEUR Workshop Proceedings, Foggia, Italy, 21–22 January 2021. [Google Scholar]
- Koonsanit, K.; Nishiuchi, N. Classification of User Satisfaction Using Facial Expression Recognition and Machine Learning. In Proceedings of the 2020 IEEE REGION 10 CONFERENCE (TENCON), Osaka, Japan, 16–19 November 2020; pp. 561–566. [Google Scholar] [CrossRef]
- Landowska, A.; Miler, J. Limitations of emotion recognition in software user experience evaluation context. In Proceedings of the 2016 Federated Conference on Computer Science and Information Systems (FedCSIS), Gdansk, Poland, 11–14 September 2016. [Google Scholar]
- Available online: https://justadudewhohacks.github.io/face-api.js/docs/index.html (accessed on 22 April 2022).
Figure 1.
The proposed framework architecture.

Figure 2.
Flow chart showing the frame collection and processing.

Figure 3.
The proposed platform: Test Manager architecture.

Figure 4.
Users General Overview section of the Miora tool.

Figure 5.
Usability Analysis section of the Miora tool.

Figure 6.
Collective emotions pie chart.

Figure 7.
Valence graphs by user.

Figure 8.
Funnel graph showcasing the website structure from the homepage to the “Agenda” app.

Figure 9.
Comparison between the gaze heatmaps of two users who performed the test on a mobile device (left) and on a desktop (right). The numbers represent the order in which the coordinates were recorded.
Figure 9.
Comparison between the gaze heatmaps of two users who performed the test on a mobile device (left) and on a desktop (right). The numbers represent the order in which the coordinates were recorded.

Figure 10.
Comparison of the emotions expressed by group A who performed tasks 2 and 3 on a desktop computer, and group B who performed the same tasks on a smartphone.
Figure 10.
Comparison of the emotions expressed by group A who performed tasks 2 and 3 on a desktop computer, and group B who performed the same tasks on a smartphone.

Figure 11.
Structure graph of the website under analysis showing the navigability between the several apps available.
Figure 11.
Structure graph of the website under analysis showing the navigability between the several apps available.

Figure 12.
Efficiency chart of tasks 1 to 5 performed on the management web platform.

Figure 13.
Collective emotions pie chart of users while performing task 2.

Figure 14.
Click paths of users while performing task 2. Each participant is represented with a different colour. The numbers indicate the order in which the clicks were performed.
Figure 14.
Click paths of users while performing task 2. Each participant is represented with a different colour. The numbers indicate the order in which the clicks were performed.

Publisher’s Note: MDPI stays neutral with regard to jurisdictional claims in published maps and institutional affiliations. |
© 2022 by the authors. Licensee MDPI, Basel, Switzerland. This article is an open access article distributed under the terms and conditions of the Creative Commons Attribution (CC BY) license (https://creativecommons.org/licenses/by/4.0/).
Share and Cite
MDPI and ACS Style
Generosi, A.; Villafan, J.Y.; Giraldi, L.; Ceccacci, S.; Mengoni, M. A Test Management System to Support Remote Usability Assessment of Web Applications. Information 2022, 13, 505. https://doi.org/10.3390/info13100505
AMA Style
Generosi A, Villafan JY, Giraldi L, Ceccacci S, Mengoni M. A Test Management System to Support Remote Usability Assessment of Web Applications. Information. 2022; 13(10):505. https://doi.org/10.3390/info13100505
Chicago/Turabian StyleGenerosi, Andrea, José Yuri Villafan, Luca Giraldi, Silvia Ceccacci, and Maura Mengoni. 2022. "A Test Management System to Support Remote Usability Assessment of Web Applications" Information 13, no. 10: 505. https://doi.org/10.3390/info13100505
Note that from the first issue of 2016, this journal uses article numbers instead of page numbers. See further details here.