
UAVs for Medicine Delivery in a Smart City Using Fiducial Markers


Department of Engineering Science, Guglielmo Marconi University, Via Plinio 44, 00198 Rome, Italy
*
Author to whom correspondence should be addressed.
Information 2022, 13(10), 501; https://doi.org/10.3390/info13100501
Submission received: 1 September 2022
/
Revised: 13 October 2022
/
Accepted: 13 October 2022
/
Published: 18 October 2022
(This article belongs to the Special Issue IoT-Based Systems for Safe and Secure Smart Cities)
Abstract
:Drone delivery has gained increasing importance in the past few years. Recent technology advancements have allowed us to think of systems capable of transporting and delivering goods precisely and efficiently. However, in order to switch from a test environment to a real environment, many open issues need to be addressed. In this paper, we focused on drop-off point localization based on fiducial markers, analyzing different systems and the configuration of different aspects. We tested our system in a real-world environment and drew conclusions which lead us to identify the most reliable fiducial system and family for this use case.
1. Introduction
According to most researchers, professionals and industrialists, many factors are fundamental to forming a smart city, including a “smart economy”, “smart governance”, “smart living”, “smart mobility”, “smart people” and “smart environment”. After many years, a common and agreed upon definition of a smart city has not been provided. Some recent studies have investigated the literature on this topic according to the concepts of meta-reviews, meta-analysis or meta-synthesis as in [1,2] to cite a few. In almost all studies, the key points for enabling services in the smart city are: technological advances above all in mobility and health, performing and capillary telecommunication networks and the organic management of collected data [3,4].
Thanks to recent advances in vehicular technology, unmanned aerial vehicles (UAVs) are playing a key role in smart city applications and services such as photogrammetry, air pollution monitoring, security and surveillance and natural disaster management. In the same way, UAV technology can be leveraged effectively to deliver packages in terms of time and cost. Drones can retrieve their precise location from the global navigation satellite system (GNSS) and take advantage from cloud processing made possible by the 5G network, which enables simultaneous real-time communications between thousands of devices.
Beyond consumer products, drones can be used to deliver medical supplies or essential life support equipment directly to patient homes, thus improving the cities’ public health. As an example, disabled, infected, elderly or vulnerable people can benefit from a fully autonomous delivery system without having to go to the pharmacy. In recent years, we also experienced the difficulties caused by the COVID-19 worldwide disease. In order to react to the current and any possible future pandemic, a contact-less “to-the-door” delivery system can also dramatically improve the health care system, overcoming the limitations imposed by social distancing regulations or even lockdowns.
Other solutions rely on mail-delivered medications, including new or refilled prescriptions especially targeting elderly individuals. While a mail-based system could be easier to deploy, it still requires an efficient postal system and suffers from logistic-related problems (e.g., incorrect deliveries, delivery thefts and tracking problems).
In this paper, we investigate a possible solution to solve the medical supply delivery problem in a smart city context. Although the constraints for a production-ready solution are many, we focus on the accuracy requirement of position delivery, which we believe is a key factor to determine the feasibility of the solution. Through the paper, some assumptions are made, and some aspects have not been investigated and therefore could be a subject for future works in this direction (e.g., energy efficiency and drone congestion in the air). On the other hand, we focus on the landing spot localization, and thus the delivery accuracy has been extensively measured both theoretically and on the field with a real test bed. With that said, we present an autonomous delivery solution by leveraging UAVs (namely drones) equipped with precise GNSS sensors, a high-resolution camera, and a winch, which brings the medicine to the patient. The system allows i. locating the approximate position of the house, ii. precisely finding the spot to leave the package, and iii. releasing the winch in order to drop the supply (i.e., the medicine). Concerning the second point, in the next sections, we will evaluate the performances of different localization mechanisms based on fiducial markers [5] to be placed at the drop location. The adoption of specific fiducial codes allows the proposed system to manage the delivery of transportable packages (e.g., medicines in this paper, but of course, this depends on the UAV size and on the environmental conditions, such as building density, wind, etc.), performed through a dynamic code assignment to the patient. The patient can automatically receive the marker by the delivery system, enabling it to manage several simultaneous deliveries in the same area without any possible misdelivery. Moreover, collisions between drones of the same system can be handled in advance by properly scheduling non-overlapping deliveries in the same area or sharing the UAV real-time positions through an internal management system. Regarding the possibility of collisions with other objects (e.g., drones, electrical wires and buildings), the collision avoidance systems integrated within the UAV should be activated. Technologies such as infrared sensors, stereo vision sensors, ultrasonic sensors and GPS must work together to ensure a clear flight path, thus preventing crashes. The integrity of the medicine delivery is also guaranteed, as the doctor carries out the medical consultation and selects the most appropriate medicine for the patient (considering his allergies and other pathologies). This paper is organized as follows. Section 2 illustrates previous related works in the field, particularly in UAV localization and goods delivery systems. In Section 3, the overall system description is presented, diving into details of the various aspects and issues. In this section, we also evaluate different fiducial marker systems and families as a required step to select the most appropriate ones for the considered case. Section 4 describes the system implementation we used to create our testbed. Furthermore, we included details about the dataset creation and evaluation. In Section 5, we report on the performance of the fiducial marker families in static configurations (i.e., not detected by an UAV). In Section 6, we illustrate the metrics and the results obtained by running a real UAV in a test environment. Specifically, we measure the overall outcome by introducing three application specific metrics that allow for measuring the system from different points of view. Conclusions are drawn at the end of the paper.
2. Related Works
The problem of deliveries directly to the home using a UAV is a topic that research is actively pursuing, and real applications are increasing daily. UAV home delivery is being promoted by a growing number of companies. Companies such as Amazon, Google, UPS, DHL, FedEX and others have been testing drone delivery for years, some since 2005, as a possible alternative or complement to traditional delivery [6]. More recently, Amazon [7] has planned to use UAVs for 30-min home deliveries and is conducting an alpha test on a small village in England, with the first delivery to customers via drone becoming a reality. The topic of last-mile logistics is a topic explored by various authors, ranging through the many facets of the segment: from problems in terms of energy consumption and social and environmental impact [8] to models for the optimal routing and scheduling of UAVs and delivery trucks, including in collaboration with each other [9]. More specifically, in recent years, numerous authors have dealt with the problem of last-mile deliveries from the point of view of transport planning. Ha et al. [10] investigated the operating cost minimization, including total transportation costs and costs resulting from logistical inefficiencies, such as waiting times. Tavana et al. [11] discussed the problem of truck scheduling (i.e., the optimal sequence of trucks entering and exiting gates) considering drones instead of trucks. Equally important is the set of research on energy consumption and environmental impact: Dorling et al. [12] derived and experimentally validated an energy consumption model for multirotor drones within a routing optimization problem. More recently, Stolaroff et al. [13] focused on the possible reduction of greenhouse gas emissions and energy consumption by using drones for last-mile coverage. From strictly an application point of view, the research is mainly oriented to methods for delivery in rural areas, the only ones that can make the model sustainable according to the conclusion reached by Joerss et al. [14]. Guerrero et al. [15] proposed an UAV design consisting of a drone having the payload suspended through a cable and a control algorithm that inhibits the effect of oscillation during the trajectory. Gatteschi et al. [16] proposed a complete prototype for medicine delivery, including the definition of a specific mobile application and the design of a related drone for deliveries. The vast majority of solutions share the same aspect: the use of UAVs for last-mile delivery in rural areas with low population density, where it is possible to precisely navigate based on a strong GPS signal and the buildings have adequate outdoor space that allows landing and handover. Brunner et al. [17] proposed a direct delivery solution to the window or balcony using a fiducial marker to be affixed directly to the glass as a reference for the drone, while Walsh and Falesch [18] patented a solution that involves the installation of a device that integrates both the detection and storage of a possible package.
In this work, we employed UAVs for last-mile delivery in urban areas without requiring a specific landing spot or any kind of equipment from the receiver of goods. The rough localization occurs by means of an onboard GPS system, and afterwards, it is fine-tuned using a computer vision system based on fiducial markers. In the following sections, we will dive into details of how the fiducial system is selected and evaluated in order to meet the needs of entire area.
3. System Description
3.1. System Architecture
The proposed system is based on the reference architecture reported in Figure 1. The patient turns to the doctor for a medical consultation. Then, the doctor sends the medical prescription to a medicine center or a pharmacy close to the patient. At the same time, the system sends the fiducial marker assigned to the patient to his printer, which he must then display outside his own window. At this point, the drone goes to the pharmacy indicated by the system and collects the medicine for the patient. Thanks to the coordinates provided by the system, the drone is able to approach the patient’s window at a suitable distance. First, it exploits GPS to get closer to the patient house. When it is closer than a certain distance, the drone will use the fiducial marker to get closer to the patient’s window to deliver the medicine indicated by the doctor.
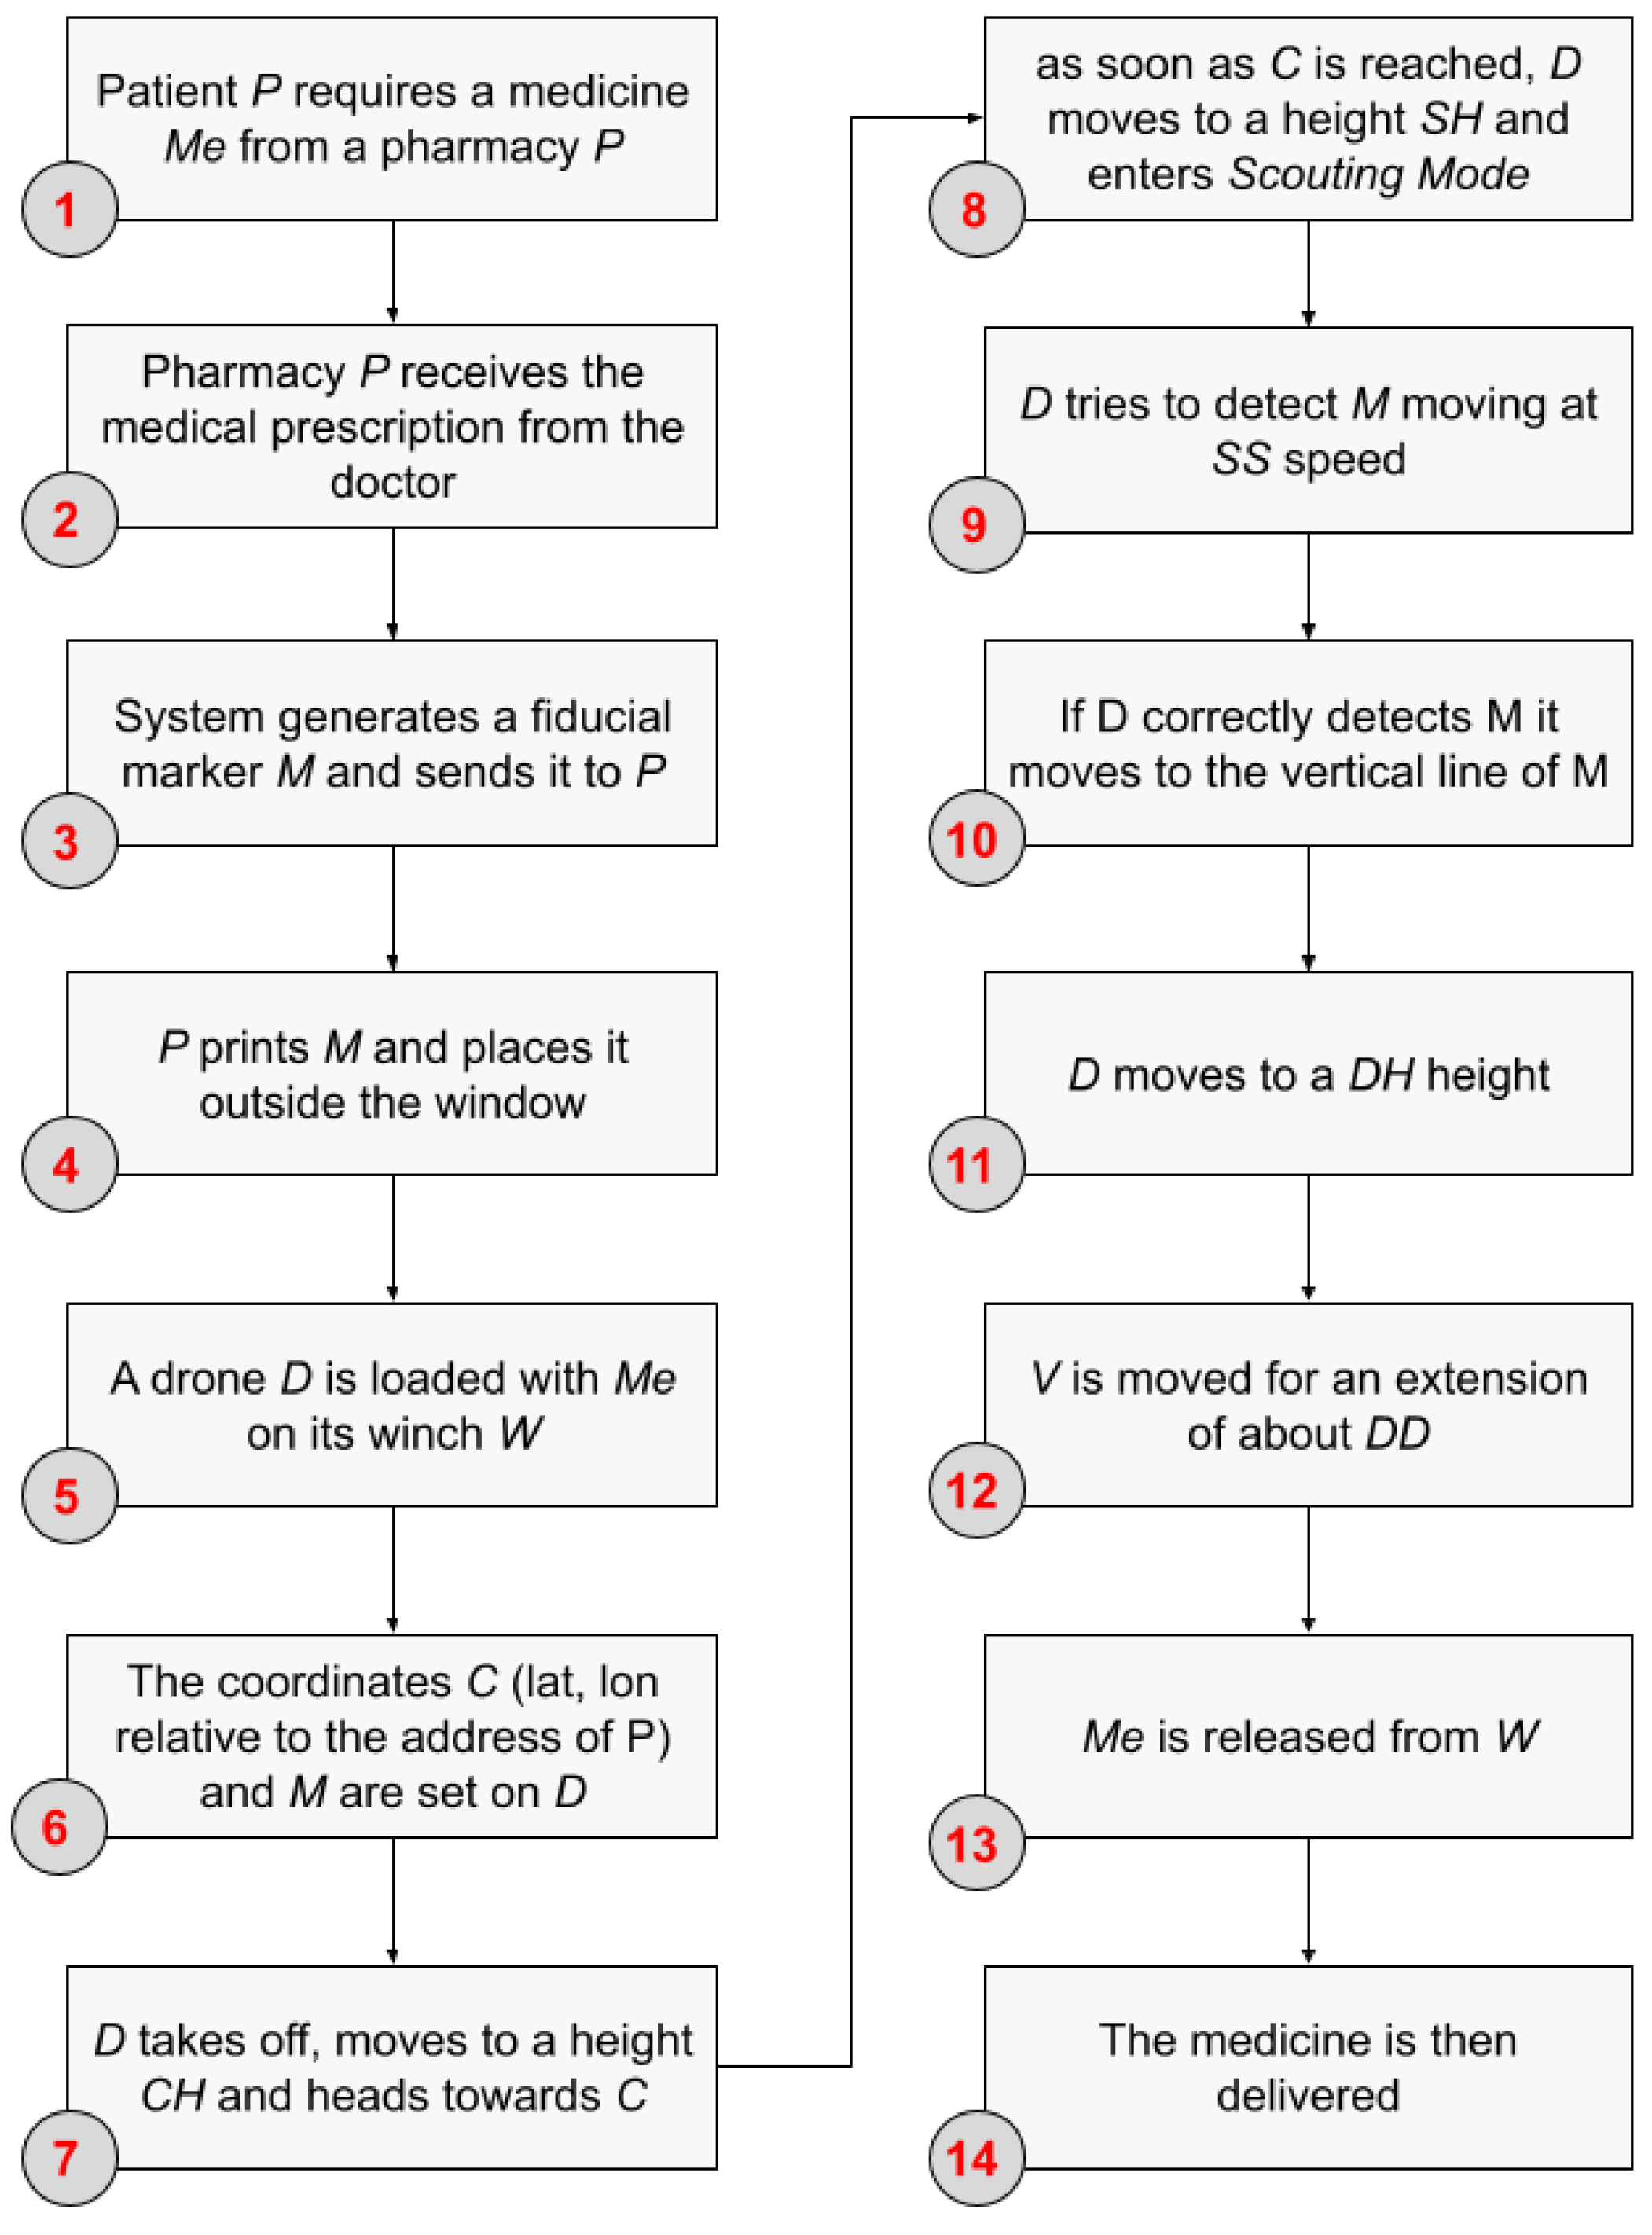
Figure 2 describes the flow of operations required to deliver medicine to a patient using a UAV. (1) After a medical consultation a patient P requires a medicine . P cannot leave the house for several reasons, such as quarantine or disability; (2) The system knows the patient’s personal data, including their address. A geocoding process is applied to the address, generating C coordinates; (3) The system must verify how many and which markers are already present within the drone scouting area and consequently generate a unique fiducial marker M, which ensures the absolute absence of any collisions (which would cause possible misdelivery); (4) The fiducial marker M is then sent by e-mail to user P, who must print and place it outside the window before it expires; (5) As soon as the medicine is ready for shipment, it is loaded by the pharmacy onto a UAV D, fixed to the winch W; (6) The system sends UAV D the information necessary to complete the delivery; in detail, (i.) the destination coordinates C and (ii.) the fiducial marker M; (7) The UAV D takes off from the pharmacy, and through autonomous flight, it heads towards the C coordinates, flying at a cruise height ; (8) When D reaches the point identified by the coordinates C, it moves to a height (scouting height); (9) Once the height has been reached, the UAV D enters scouting mode, which aims to detect marker M using the camera located in the bottom of the UAV. During scouting mode, UAV D moves at a speed (scouting speed), following a particular pattern in order to cover the entire scouting area ; (10) If D correctly detects the marker M, then it uses an accurate visual landing algorithm to position itself exactly on the vertical aspect of it (point ), using, for example, a PID control to minimize the distance between the marker center and the center of the UAV; (11) When the UAV D has reached the point, it moves to a (drop height) such that the UAV to marker distance is exactly (drop distance); (12) Once the height is reached safely, the UAV D can move the winch V by moving the package by a length , calculated as the sum of the estimated distance between drone D and marker M () plus the maximum absolute estimation error (); (13) When the winch is extended to an length, package can be released; (14) UAV D can withdraw the winch and return to the starting position, ready to be reloaded or to make a new delivery.
We must specify that this algorithm is deliberately simplified as it only reports the standard operational flow without going into the details of any security or disaster recovery operations. In case of particular weather conditions (e.g., a windy area), the system may request the patient to expose the fiducial marker from the most sheltered window. It is worth noting that modern UAVs have stabilization systems, which allow them to fly in strong winds. The main factors influencing the UAV’s capabilities are the drone’s weight and the maximum motor thrust. The higher the ratio between the thrust and the weight, the better stabilization one can achieve. Wind speed could be empirically measured by the Beaufort wind force scale [19]. The scale is composed of 12 levels, starting from Level 0, which means calm or almost no wind, and going up to Level 12, which is the wind force of a hurricane (i.e., ≥118 km/h). Wind level 5 (i.e., 29–38 km/h) and above are usually considered too strong for the majority of commercial drones. In such cases, it might be appropriate to use UAVs with higher wind resistance capabilities. Wind force also brings out another issue, which is related to the energy consumption under different wind speed conditions. This issue has been studied in [20].
3.2. Fiducial System Comparison
Table 1 shows a comparison between fiducial systems on the basis of some indicators selected for an objective comparison. In particular, the indicators shown are: (1) Open-source, if the marker detector source code is published online (Y), or otherwise (N); (2) Language, which lists any programming languages available for the implementation of the marker detector; (3) Last release, meaning if the code is published open-source, when the last software update was; (4) Families, representing how many standard family markers fiducial system makes available; (5) Min. bits, or minimum bits, indicating within the standard marker family, how many bits encodes the family having fewer bits. As can be easily understood, the selected metrics mainly consider the implementation aspects compared to theoretical aspects. This is because, in this phase, it is more important to highlight the technologies with a higher degree of maturity and usability. Characteristics such as type of pose estimation algorithm or error detection and correction on a purely theoretical basis are not evaluated in this phase but will themselves be the object of in-depth analysis during the analysis phase. A first essential constraint for the purposes of this analysis is the presence or absence of a detector published as open-source for two reasons: (i) an open-source software is often developed collaboratively and has already gone through all the validation phases; (ii) the absence of an published detector is a symptom of a probable loss of commitment and attention by the proposing team. The last release metric, as well as the open-source metric, is significant in terms of the proposing team’s activity towards the project. A recent last release testifies to a project that is still active and consequently probably more solid and less prone to bugs; on the other hand, a remote last release probably attests to an obsolete and unmaintained project. The couple (family, min bit) demonstrates the versatility of the fiducial system regarding various applications, with a direct proportionality between the number of families and possible applications. The number of bits is important as the smaller number of coded bits corresponds to a greater theoretical recognition distance. This comparison has therefore produced a list of fiducial systems that will be analyzed consisting of two elements, specifically ArUco and AprilTag, that have complied with all the constraints imposed in terms of reliability, maintenance, and ease of access.
3.3. Fiducial System and Related Issues
The following two aspects should be considered by the fiducial system: (i.) narrowness of the fiducial codes; (ii.) drone hijacking to another user.
In medicine delivery, it is important to provide a unique fiducial marker code to the intended patient in order to not generate misdelivery caused by the simultaneous delivery of several drones in the area. To this aim, the number of fiducial codes in a given area should be unique, though they can be adopted again in a different (not overlapping) area. Then, following the cellular concept used in the cellular mobile radio systems, where portions of sub-bands are reused at a proper distance in order to not generate interference above a threshold, the group of the family fiducial codes can be reused in another area that does not overlap with the previous one. This methodology avoids any possible misdelivery, as two equal codes are far enough apart. A similar strategy can be implemented at the generation of the fiducial code by the system. In this case, the system should be aware of the code generation by considering a minimum distance within which the same fiducial code can be assigned. A third strategy can consider the coupling of two family codes, thus multiplying the number of possible assignable codes.
Concerning security aspects, any person can print a fiducial code by herself as they are defined in advance (i.e., they are always the same). For this reason, a drone can erroneously deliver a medicine to another person who has previously printed a fiducial code. To avoid this problem, the drone can be provided the correct patient position. Moreover, the validity of a fiducial code can be linked to a time interval. After it expires, the code is no longer valid. Furthermore, the correct patient can be alerted when the drone is close to his window and ready to deliver the medicine by a dedicated message on his smartphone. These three parameters (GPS coordinates, time validity of the fiducial code and an alert message on a patient’s smartphone) noticeably reduce drone hijacking towards another user.
4. Testbed Description and Dataset Creation
As detailed by Yu et al. [21], there is still no uniform shared dataset for fiducial marker evaluation. This makes it difficult to reproduce results and compare them with others. In addition, this evaluation requires the use of samples obtained from aerial images. In this work, we try to fill this gap by collecting a large dataset, including a total of 42.004 aerial images containing fiducial markers, which include various fiducial systems, fiducial families, distances, weather conditions, acquisition speed, light conditions, zoom, etc.
We used a widely available consumer drone, the DJI Mavic 2 Zoom, equipped with a camera having a shutter with 3840 × 2160 resolution streaming at 29.97 fps. The variable focal length allows a horizontal field of view of 83° at 24 mm (no zoom) and 48° at 48 mm (2× zoom). The native 12 Mpx CMOS resolution is scaled to 3840 × 2160 during acquisition in order to obtain an excellent image quality and to reduce image noise. The exposure time is set to automatic in order to allow the camera to adjust the parameters according to the conditions. The DJI Mavic 2 has a maximum vertical ascent speed of 4 m/s, a maximum vertical descent speed of 3 m/s and a maximum horizontal speed of 20 m/s. The maximum allowed height by the law is 120 m, although it could technically reach higher heights.
As discussed before, we acquired samples of two different fiducial systems, ArUco and AprilTag, selecting the fiducial families Original, 4 × 4, 5 × 5, 6 × 6, and 7 × 7 for the former and Tag16h5, Tag36h11, TagCircle21h7, TagStandard41h12 for the latter. For each family, we printed the fiducial marker having ID 1 in two different sizes, 0.15 m and 0.26 m, in order to fill an A4 and an A3 format paper, respectively. We acquired a total of nine different sequences:
- In seq #1, we acquired samples during a sunny day using the 0.15 m printed tag version of each fiducial family/system, setting the camera focal length at 24 mm (no zoom).
- In seq #2, we acquired samples during a sunny day using the 0.26 m printed tag version of each fiducial family/system, setting the camera focal length at 24 mm (no zoom).
- In seq #3, we acquired samples during a sunny day using the 0.15 m printed tag version of each fiducial family/system, setting the camera focal length at 48 mm (2× zoom).
- In seq #4, we acquired samples during a sunny day using the 0.26 m printed tag version of each fiducial family/system, setting the camera focal length at 48 mm (2× zoom).
- Sequences #5, #6, #7 and #8 are set up to be equivalent to sequences #1, #2, #3 and #4 except for the weather and light conditions; we acquired these sequences during a cloudy day.
- Sequence #9 was acquired during a sunny day using the 0.26 m printed tag version of each fiducial family/system, setting the camera focal length at 48 mm (2× zoom).
Sequences #1–#8 were acquired at a fixed angle of 90° between the camera and the printed fiducial marker, which is positioned on the ground. The drone started an ascending flight from 10 m height to 120 m, with a constant speed of 3 m/s. All paths were recorded with a 3840 × 2160 resolution at 29.97 fps, along with an SRT file containing the relationship between the frame number and the drone height, which in this case represents the distance between the fiducial marker and the camera. We enabled the DJI Vision Positioning System (VPS) for all flights in order to obtain an altitude measurement error less than m. Sequence #9 was acquired at a fixed distance, varying the drone speed from 2 m/s to 20 m/s. We started recording when the marker was exactly at the field of view edge, moving the drone at a fixed speed until it disappeared from view. We continued recording until the marker remains in view. After each capture, the recorded video file was processed using the ffmpeg library in order to extract all video frames, which were compressed using the lossless format .png and stored together with their SRT file.
5. Evaluation
5.1. Definitions
In order to assess the identification performances from an object classification point of view, we relied on the commonly used metrics accuracy, precision, recall and F-score. We started from the confusion matrix construction, where we defined as (i.e., true positives) the number of tags which have been correctly identified, considering both their location and the ID decoding. Conversely, (i.e., false positives) was the number of erroneous detections, in this case also considering location or ID decoding errors. Similarly to other object detection tasks, was not defined because iit is less informative than and , so it is always equal to zero. Eventually, we counted as (i.e., false negatives) all the markers which do exist in the image but have not been detected at all. Relating to the considered dataset, a would be a perfectly decoded marker. In this case, the drone has found the marker position within the image and decoded its value without errors. Conversely, an is a marker which has been detected in the wrong position within the image or which has been decoded to a different value in respect to ground-truth. refers to the last possibility, and therefore all the markers, which the system has failed to detect (i.e., missing localization and consequently missing decodification).
Accuracy is formally defined as follows:
Although it is quite intuitive, if used as a single metric, it can lead to misleading conclusions especially on unbalanced datasets. Precision and recall are also relevant and often used in combination to express more precisely the performances of a classifier. The respective mathematical expressions are
Both precision and recall can be used to define another metric, which is the F-score (or F-measure), which is defined as:
where and are the values of precision and recall, and is a weighting factor used to give different importance to precision and recall. It follows that, if , we are giving the same importance at precision and recall. In this case, the F-score is also called the score.
5.2. Results
Based on the definitions introduced in Section 5.1, we assessed the performances of Aruco and AprilTag systems using different configurations. For this evaluation, we used nine datasets containing an average of 4k images each (i.e., the ones described in Section 4) captured from our DJI Mavic 2 Zoom drone at different altitudes ranging from 10 to 120 m above the ground.
In order to create the ground truth reference, all the captured images were manually annotated. We then proceeded to feed the samples into the object classifier and partitioned the output into , , . In Table 2, we summarized the datasets created and the results obtained.
Eventually, we proceeded to calculate precision, recall, accuracy and the balanced score.
Based on the score results reported in Table 3, we can conclude that ArUco Original and AprilTag Tag36h11 are two valuable choices.
Although the object classification performance is indeed an important result to consider, we decided to evaluate other factors which are closely related to this problem.
In the next sections, we will define and measure the maximum detection distance (), pose estimation Error (), and maximum detection speed ().
6. Metrics and Results
6.1. Maximum Detection Distance
This analysis goes into detail regarding the recognition distance or maximum detection distance (): the activity concerns an accurate trend evaluation of the recognition performance of each fiducial system family as the marker–camera distance varies. For this operation we used the dataset sequences #1–#8, consisting of a total of 35,570 video-frames containing fiducial markers.
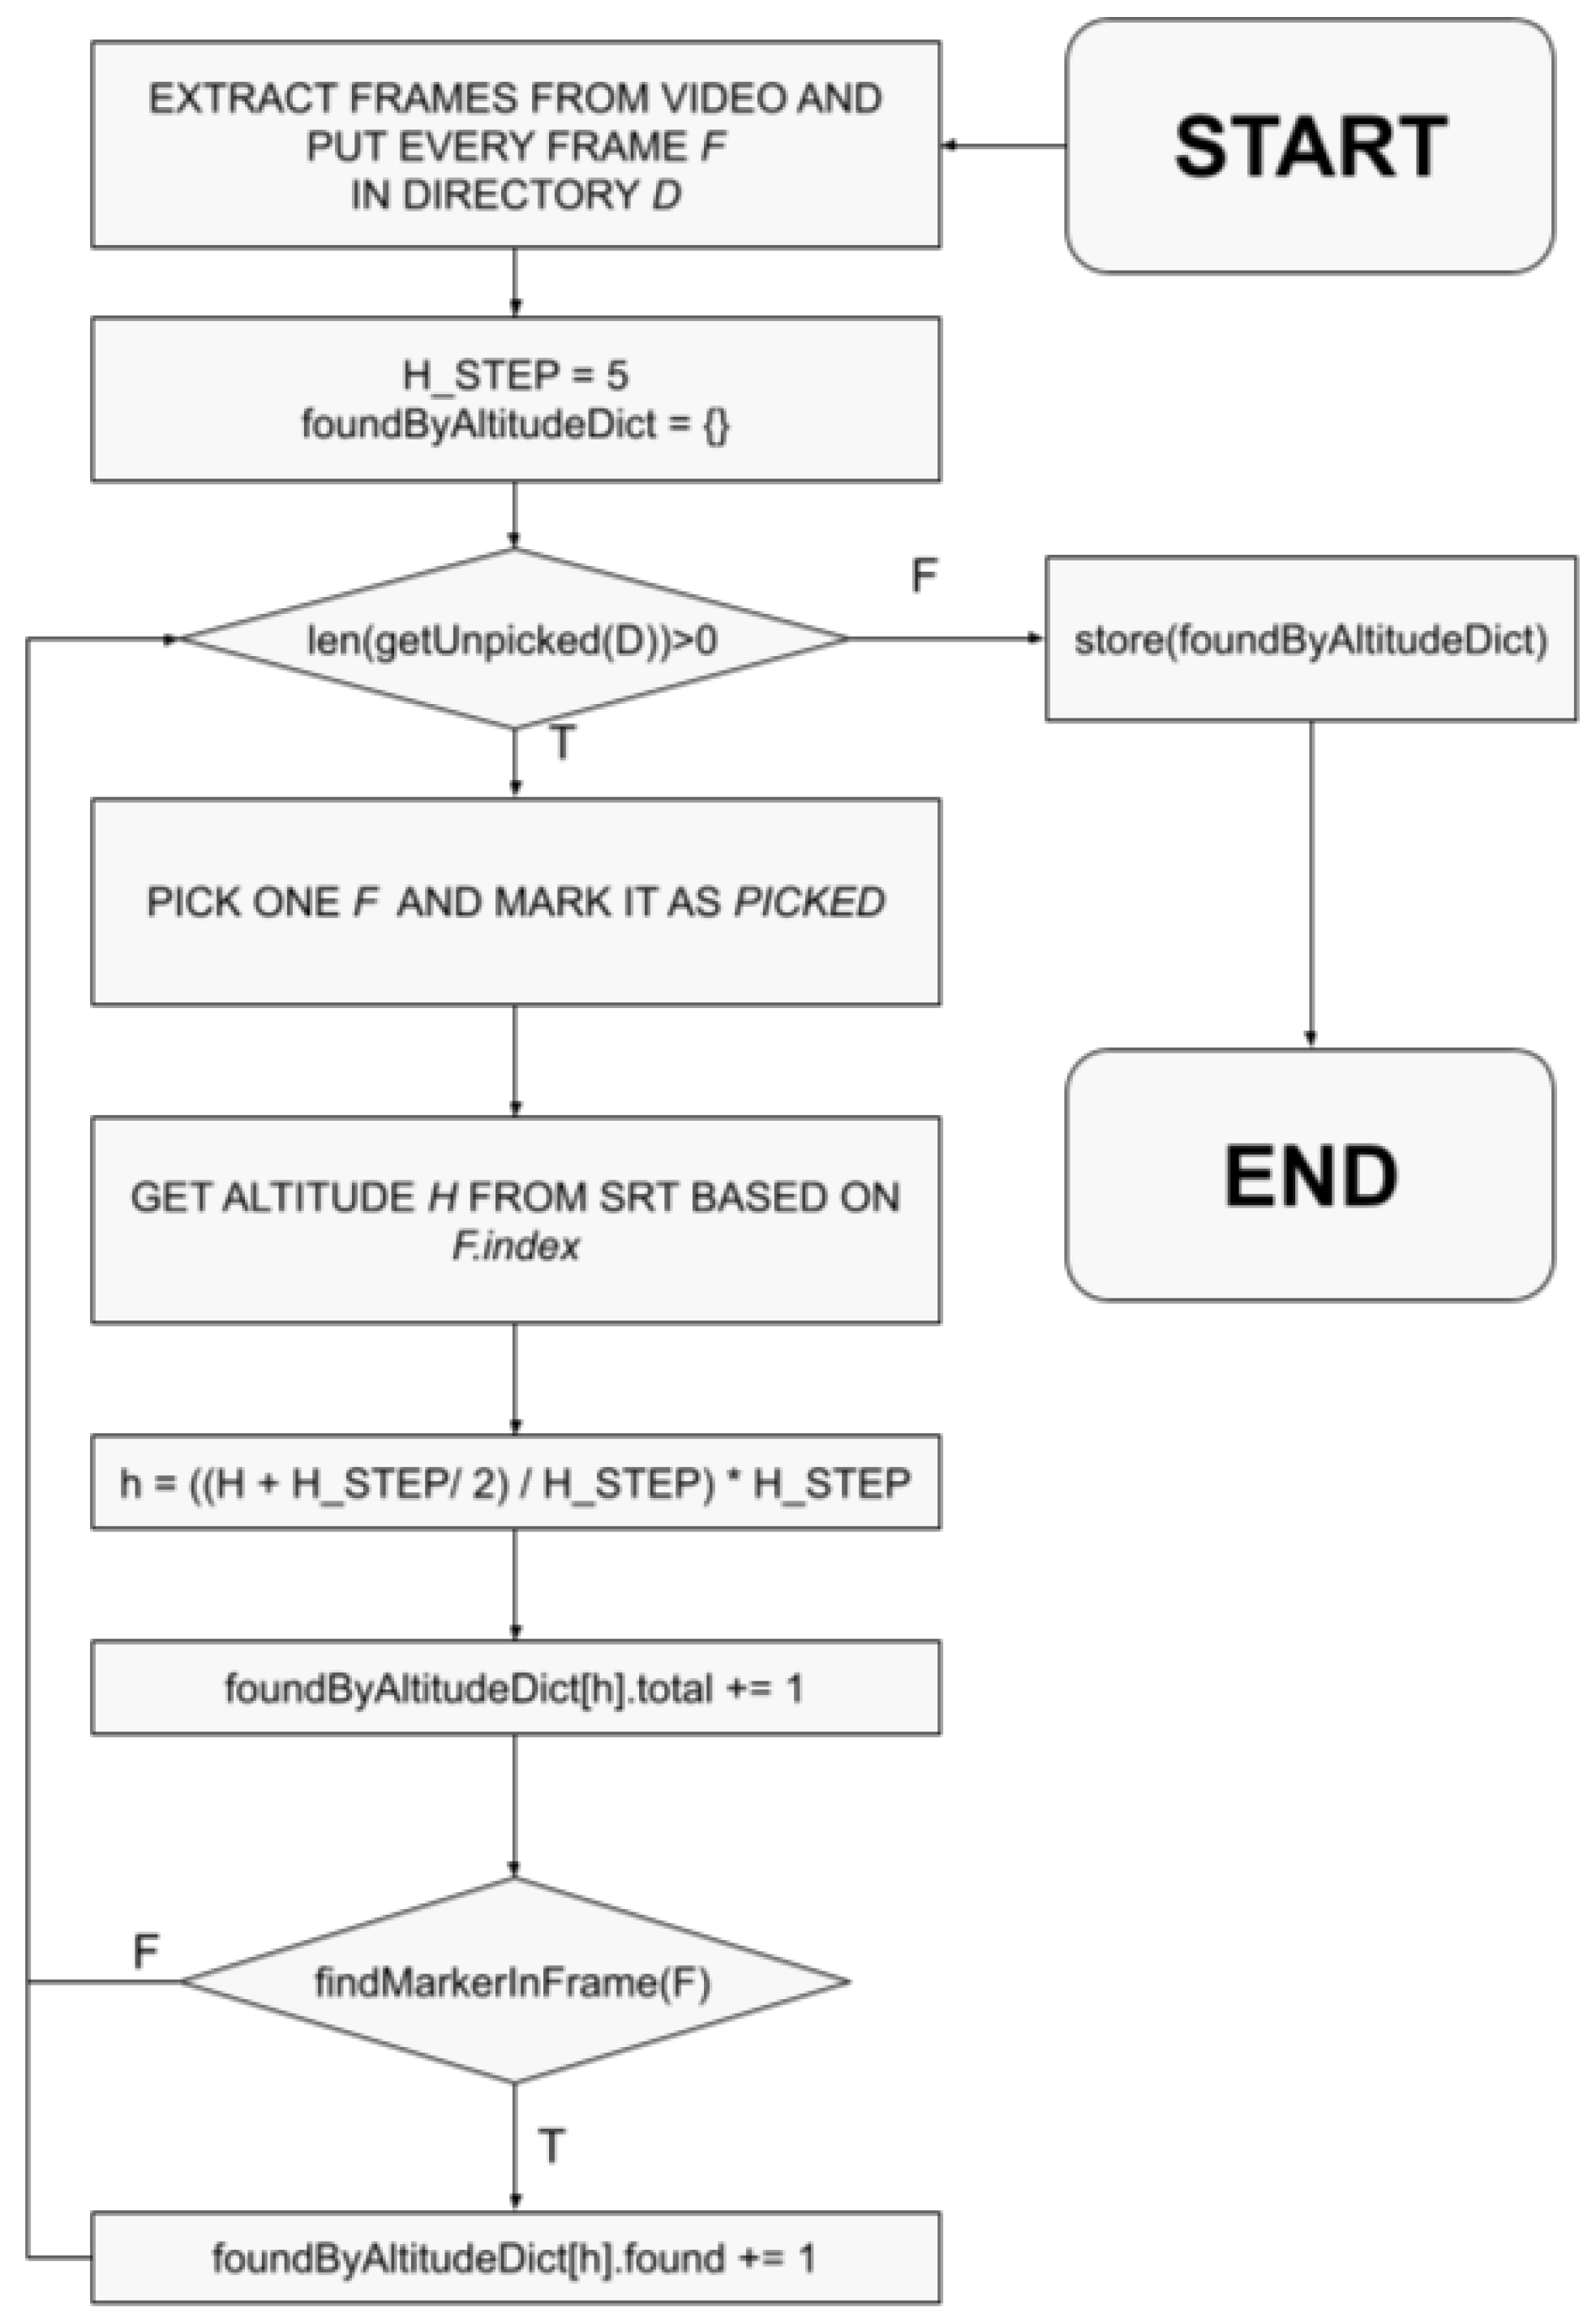
The flowchart in Figure 3 shows the flow we have implemented to calculate the metrics that evaluate the maximum detection distance. The algorithm goal is to group height values that differ at most H_STEP meters, and for each frame belonging to a group of samples of similar height increase a counter each time a marker is identified. A total counter is always incremented. For this analysis, an H_STEP equal to 5 was used, a value that allows us to theoretically have 50 samples for each group (considering 3 m/s drone speed during acquisition at 30 fps).
Dataset processing resulted in a series of tuples representing the performance of the recognition algorithms (ArUco, AprilTag) as the distance between the marker and the acquisition device varied. As shown in Table 4, the first metric considered is the probability of detection, or hit rate, at a given height, calculated through the ratio between the number of true positive samples and the total number of positive samples. In order to make a direct comparison between the fiducial system families, a second metric is identified, defined as 90th percentile, corresponding to .
From , we can evaluate the number of pixels per bit needed to correctly decode a marker bit through the relation in (4):
where s is the size of the marker (in meters), w is the size of the tag in bits, f is the field-of-view (FOV) of the lens (in radians), and r is the horizontal acquisition resolution. The meaning of the parameters in (4) is explained in the Figure 4.
As decreases, the minimum ratio between the surface of the correctly recognized marker and the total surface of the frame also decreases. Therefore, can be considered an indicator of the robustness of the family’s error correction algorithm. Lower values of correspond to better results in terms of in non-optimal conditions.
Table 5 shows the expected ratio compared to the detected ratio as the tag size, weather conditions or zoom changes. The detected zoom 2×/1× ratio is quite different from the expected ratio, and we can assume two causes: i. the 2× optical zoom tends to accentuate any small impurities/imperfections that may be present both in the lens and in the environment [22], and ii. 2× optical zoom makes autofocusing more difficult, increasing the time required. Thanks to an average increase in the recognition distance of 45%, the use of the 2× optical zoom can still be a good compromise between the cost of adoption and obtainable results. The sunny/cloudy ratio is consistent with the expected value considering a small experimental error margin. According to this analysis, adaptive measures and strategies based on weather conditions are therefore not necessary if the acquisition device is of adequate quality.
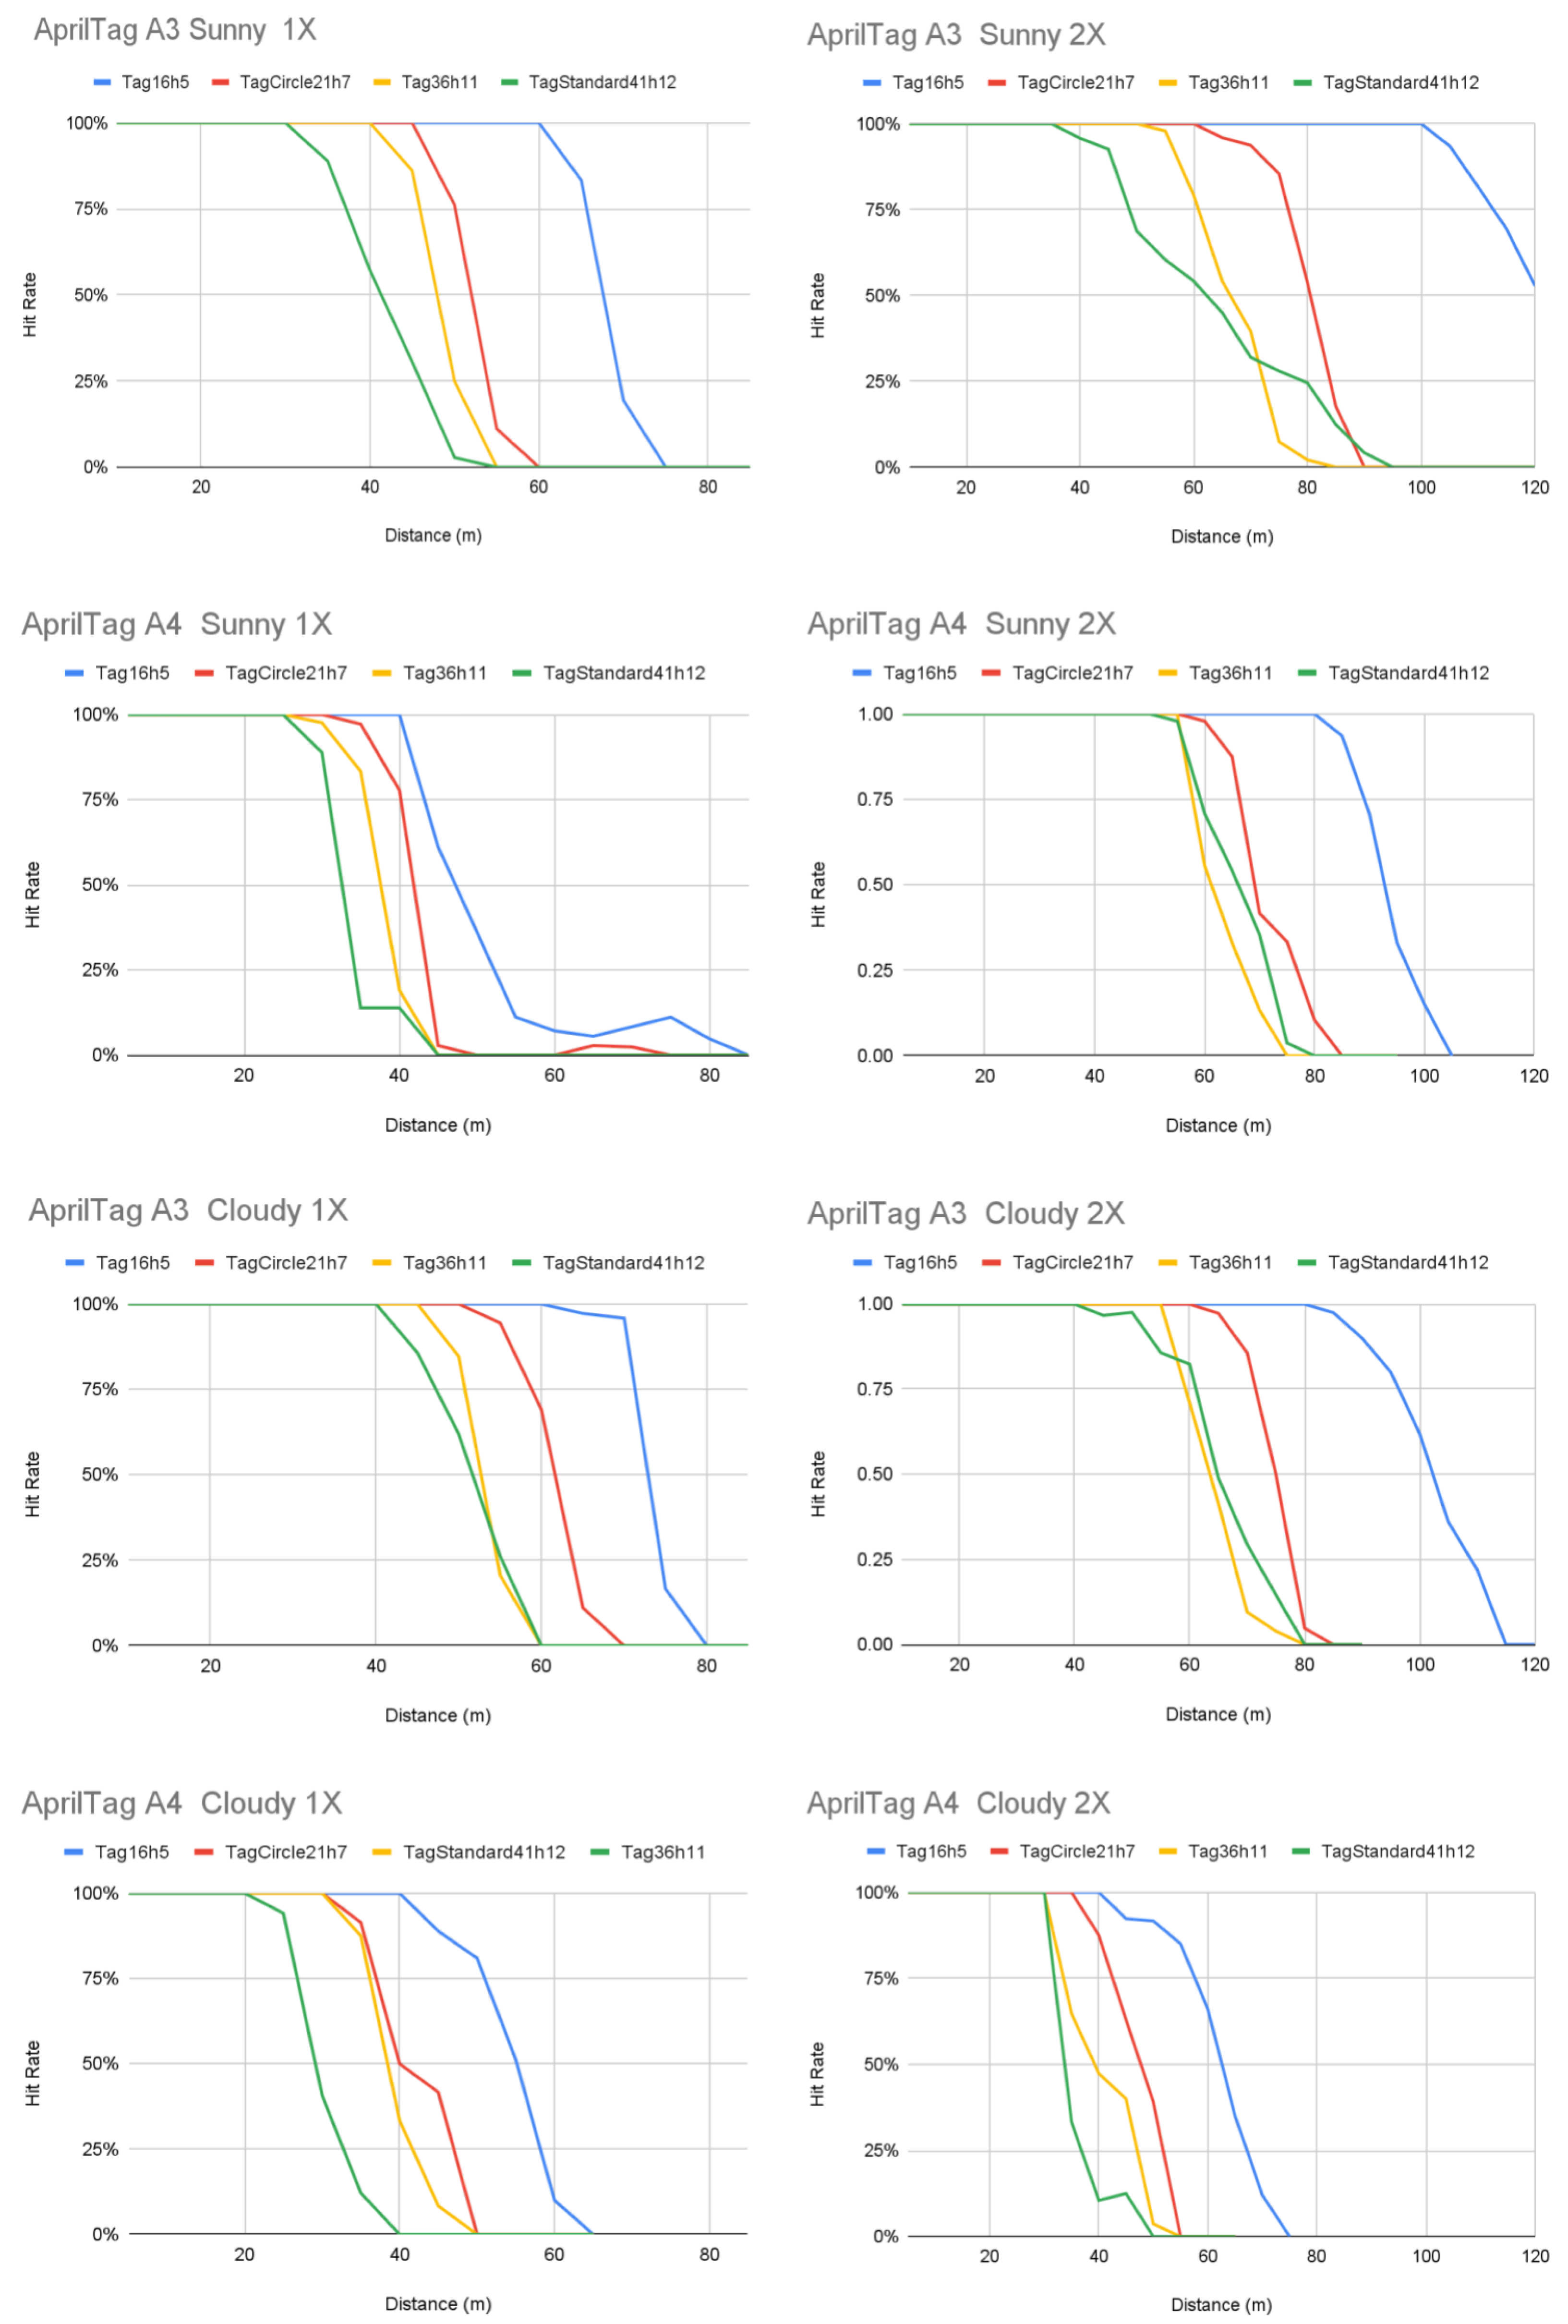
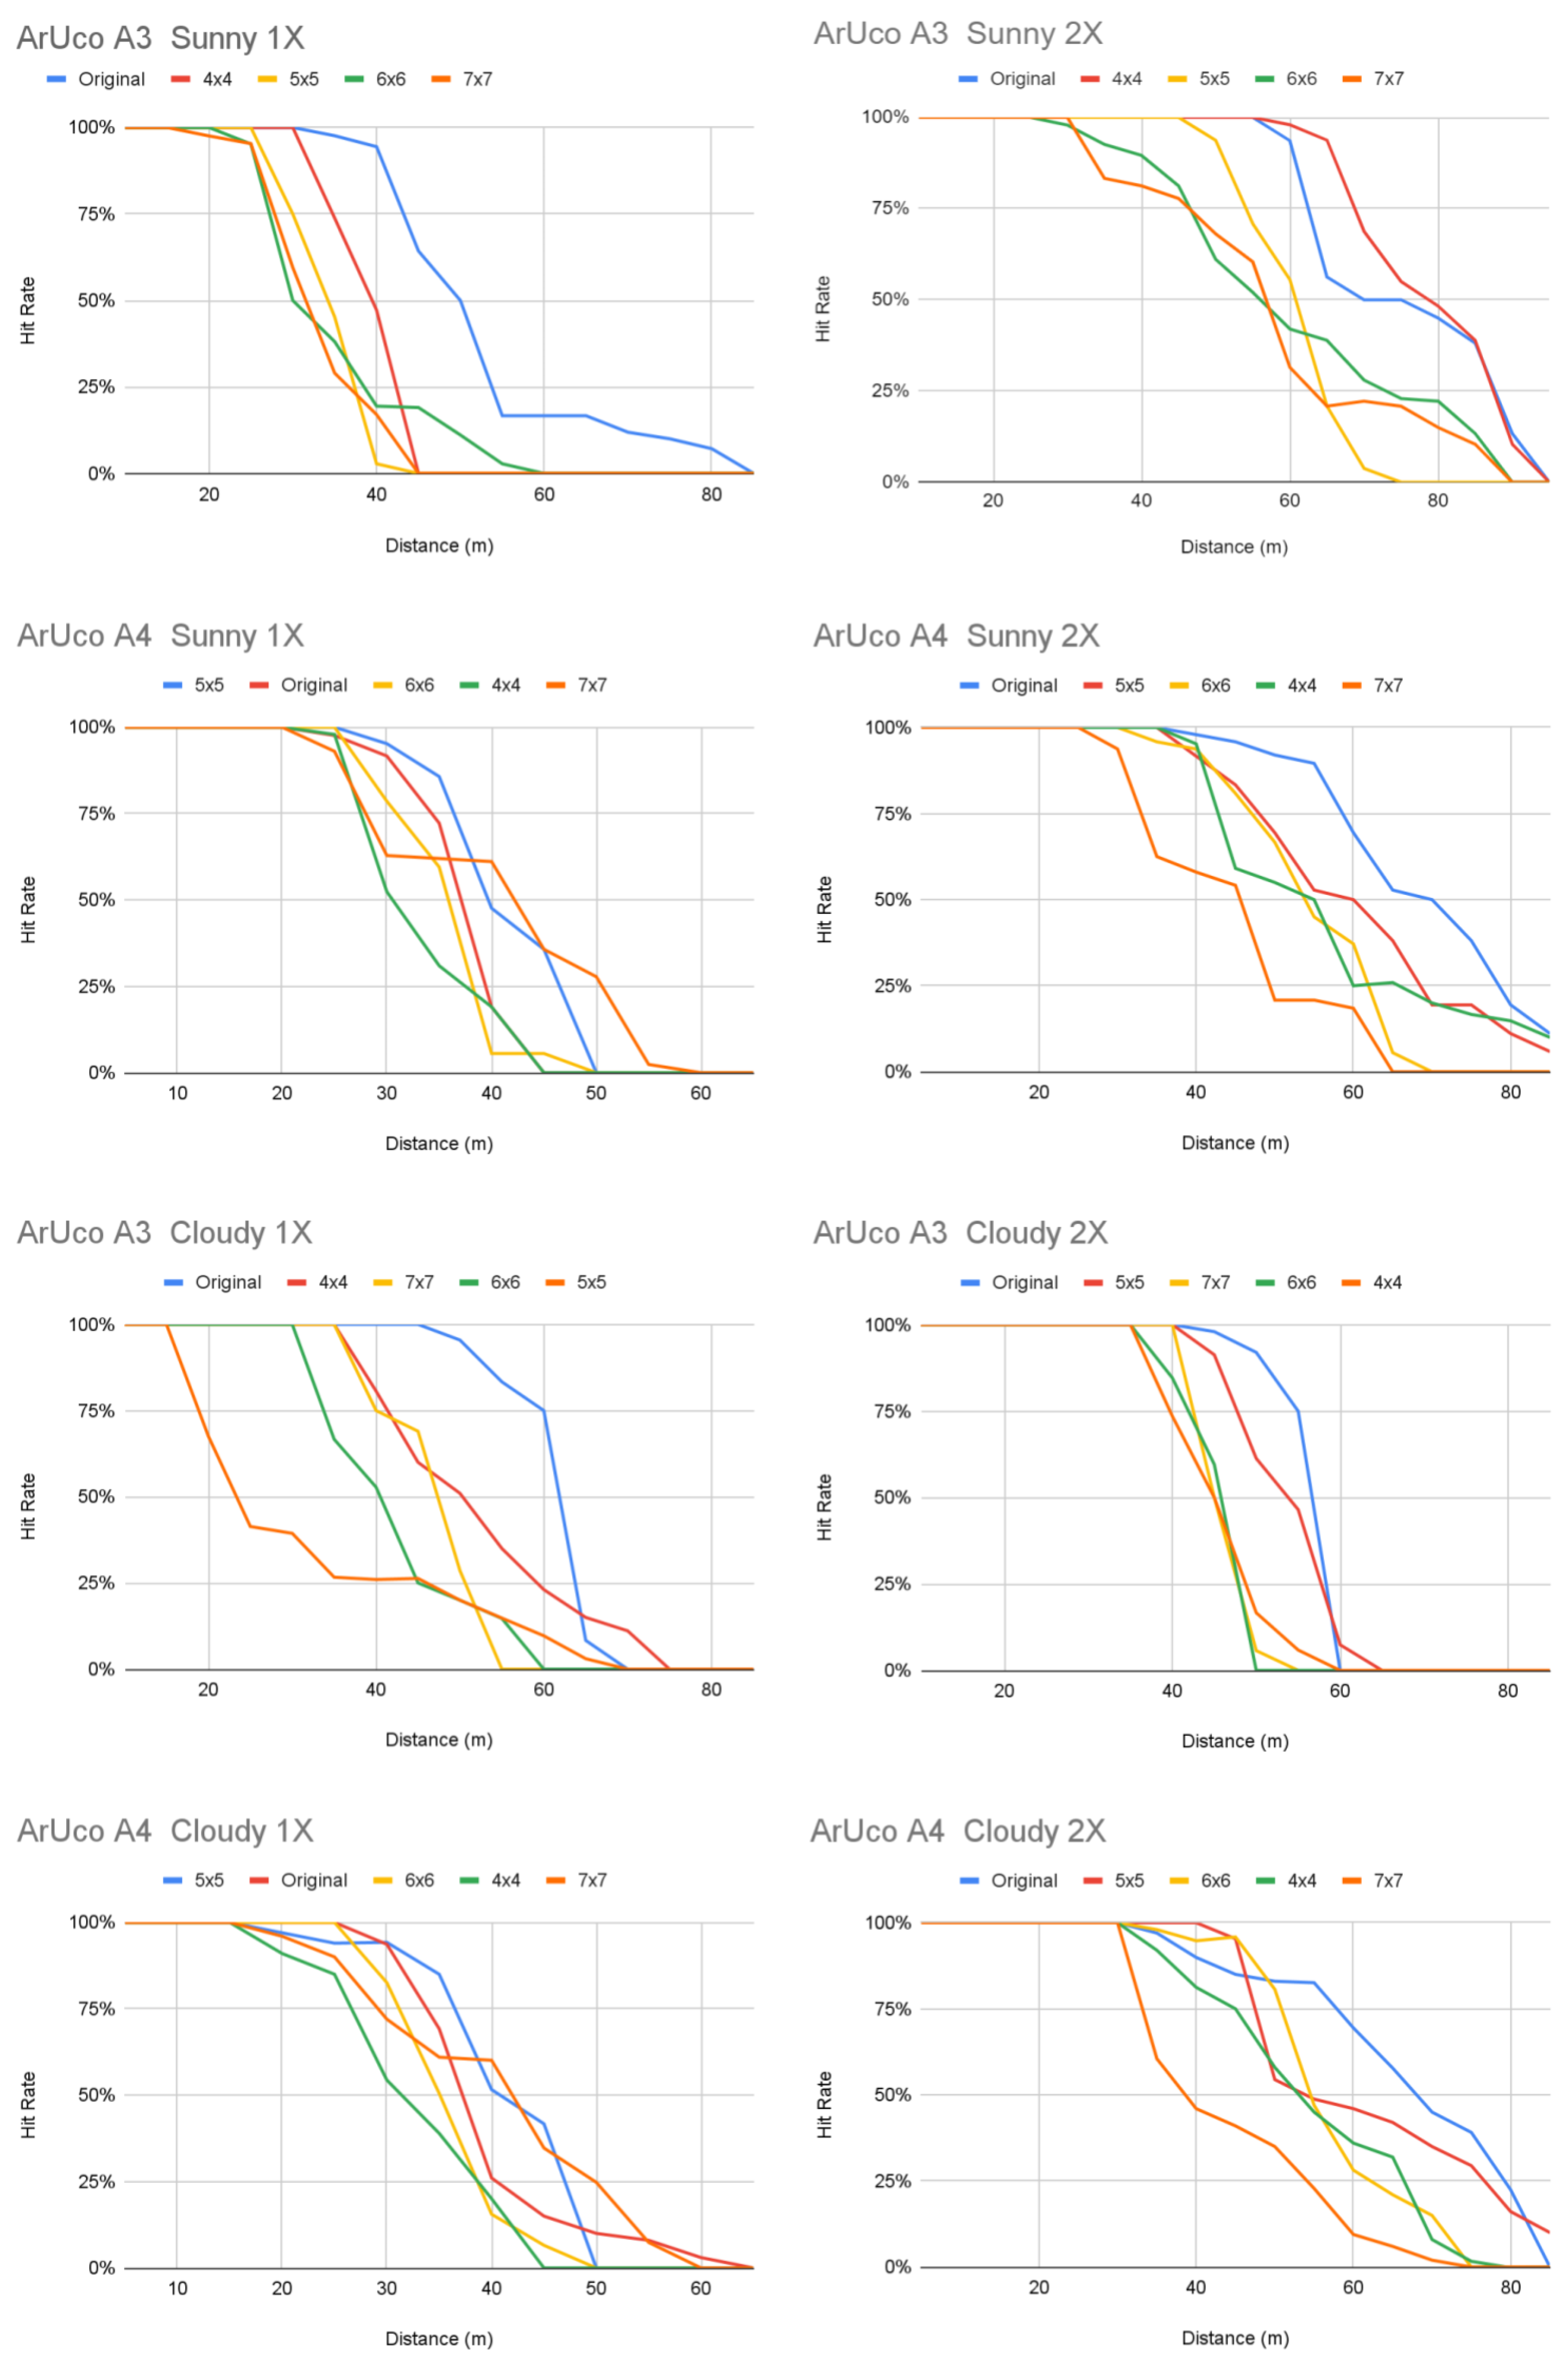
Table 6 shows the marker families with their calculated and their value. We can see that i. families with a lower bit width have a better , and ii. families with a higher bit width have a lower . The first point shows that in these conditions, the AprilTag detection algorithm is better performing than the ArUco detection algorithm, and the AprilTag Tag16h5 family has a maximum overall value of m.
6.2. Pose Estimation Error
The purpose of this analysis is to evaluate the performance of the ArUco and AprilTag pose estimation algorithms. Pose estimation is a general computer vision problem which aims to recognize the position and orientation of an object within an image and, as an estimate, is intrinsically subject to error. We define this error as pose estimation error (). The trend of this error is analyzed as the distance from tag to camera varies.
For this task, we used the same dataset of the previous work, sequences #1–#8, consisting of a total of 35,570 video-frames containing fiducial markers. However, further processing was necessary, aimed at optimizing the analysis process: we decided to calculate in advance the pose estimation on the dataset, historicizing the values obtained in conjunction with the distance measured by the drone’s on-board altimeter, thus avoiding having to subsequently analyze every single frame. The drone altimeter measure is used as a ground truth value.
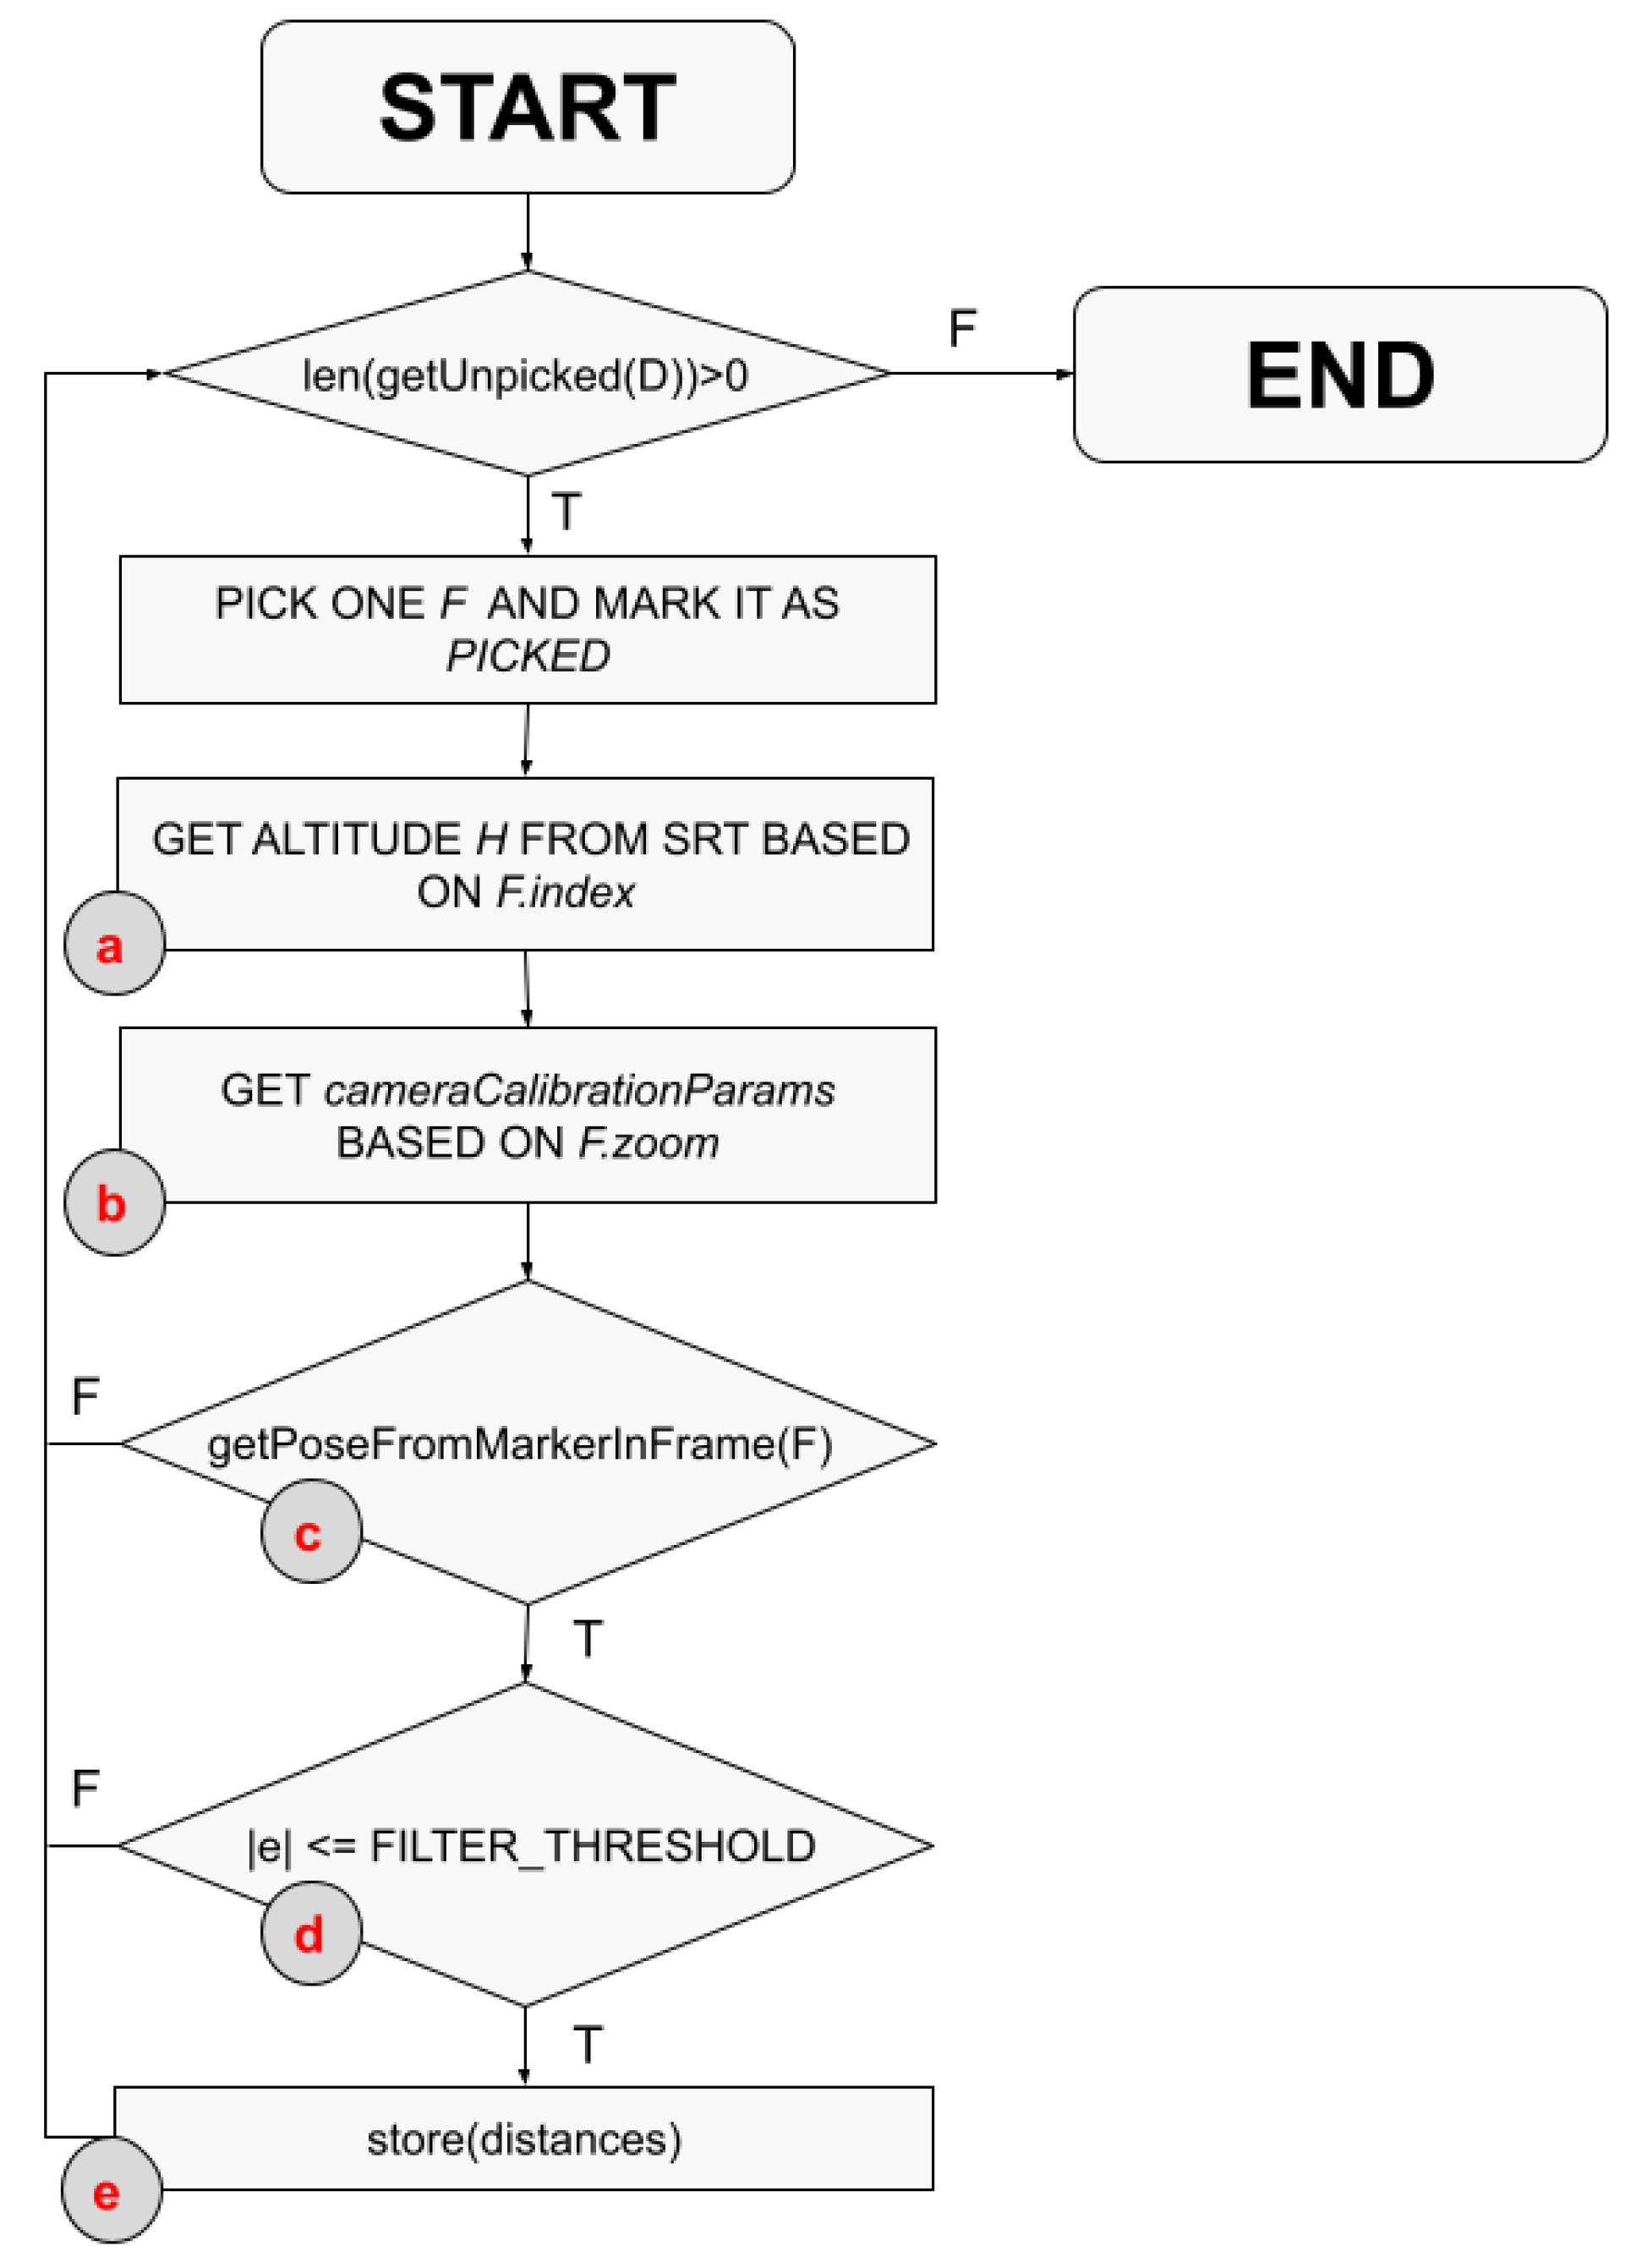
The flowchart in Figure 7 shows the process we developed to generate the dataset: the algorithm’s goal is to store a record composed of (frame_id, ground_truth_distance, estimated_distance). For this task, we first calibrated the camera, and then we used the same calibration parameters for all subsequent tasks. The flowchart in Figure 7 step c refers to the methods aruco.estimatePoseSingleMarkers and detector.detect of detectors cv.aruco [23] and pupil-apriltag [24], respectively.
The flowchart in Figure 8 shows the flow we have implemented to calculate the metrics that evaluate the pose estimation error. The goal of Algorithm a is to group records of the same condition subsets (fiducial family, zoom and size) having distance values that differ at most H_STEP meters, and for each record belonging to a group of samples of similar distance increase a counter each time an estimated distance is correct. A total counter is always incremented. An estimated distance is correct when the absolute error is below an ERROR_THRESHOLD value. We used for H_STEP the same value of the previous task, 5 m, and for ERROR_THRESHOLD a value of 0.5 m.
The goal of step b is to calculate n [0+] pairs of values (, ), which represent the interval boundaries in which the Finterp function assumes a value always greater than PERCENT_THRESHOLD. Finterp is a continuous function calculated from linear interpolation of the results from the previous step (x = distance, y = correct/total), and PERCENT_THRESHOLD was set to 0.8. Step c calculates the root-mean-square Error (RMSE) index between the ground truth distances list and the estimated distances list using the formula:
where n is the number of samples, is the i-th estimated value, and is the i-th ground truth value.
The flowchart in Figure 8 produces a series of records that represent the accuracy of the distance estimation as the distance varies.
As shown in Table 7, the first metric considered is the probability of correct estimates at a given distance, calculated through the ratio between the number of correctly estimated samples and the total number of samples. Using these values, we have been able to calculate all the interval boundaries [, ] for each dataset condition (fiducial family, zoom, size). We can, therefore, define the interval [, ] as the range of distances within which at least 80% of the distance estimates have an absolute error of less than 0.5 m. In order to make a direct comparison between the fiducial families and the various conditions of application (zoom, size), two metrics derived from the considerations set out above were used: i. the value of the pair, the upper_bound, ii. the width of the interval [, ] and iii. RMSE.
Table 8 shows the expected ratio compared to the detected ratio as the tag size or zoom changes. Both ratios are slightly higher than the expected values, in contrast to previous analysis, which showed lower values than expected values.
As shown by Table 9, the analysis of the concerned considerably greater distances than the distances involved for . Under these conditions, it is, therefore, conceivable to obtain a greater advantage using 2× zoom, but the A4 size remains a good trade-off between accessibility and performance.
Table 10 shows an extract of the metrics calculated (lower_bound, upper_bound) at the best conditions in terms of zoom ratio and marker size.
6.3. Maximum Detection Speed
The purpose of this analysis is to study the trend of detection performance as the camera speed relative to the tag varies at a fixed distance. The main metric to be detected is defined as the maximum detection speed () and corresponds to the maximum movement speed of the acquisition device (in meters per second) for which it is possible to correctly perform detection. For this task, we used dataset sequence #9, consisting of a total of 6434 video-frames containing fiducial markers. Sequence #9, unlike the others, contains only tags belonging to the Tag16h5 and Tag36h11 families, with a size of 0.15 m (A4) and acquired with 2× zoom, conditions selected based on the previous results.
This subset was obtained by positioning the drone at a height H for which corresponds to the maximum possible distance tag—camera, equal to
where FOV = 48° (2× optical zoom) and is obtained from the previous analysis. Table 11 shows the values actually used.
The flowchart in Figure 11 shows the flow we have implemented to calculate the metrics that evaluate the maximum detection speed. The algorithm’s goal is to group speed values v by populating a structure for each group of samples having the same value v, increasing a counter each time a marker is detected. A total counter is always incremented. The value v depends on the values we used for subset acquisition, and for this analysis, we acquired samples having values v equal to 2.77 m/s, 5.55 m/s, 8.33 m/s, 11.11 m/s, 13.88 m/s, 16.66 m/s, and 19.44 m/s.
Dataset processing resulted in a series of tuples representing the performance of the recognition algorithms as the speed between the marker and the acquisition device varied. As shown in Table 12, the first metric considered is the probability of detection, or hit rate, at a given speed, calculated through the ratio between the number of true positive samples and the total number of positive samples. In order to make a direct comparison between the fiducial families, a second metric is identified, defined as the 90th percentile: the speed under which at least 90% of the samples are always correctly detected. As stated in the previous sections, the definition is valid only if the curve is monotonic, and in this case, we can assume that it always is, at least in the range of interest. Since the dataset is a discrete set, it is necessary to use a linear interpolation method to obtain the speed value x at y = . The therefore corresponds to the 90th percentile speed.
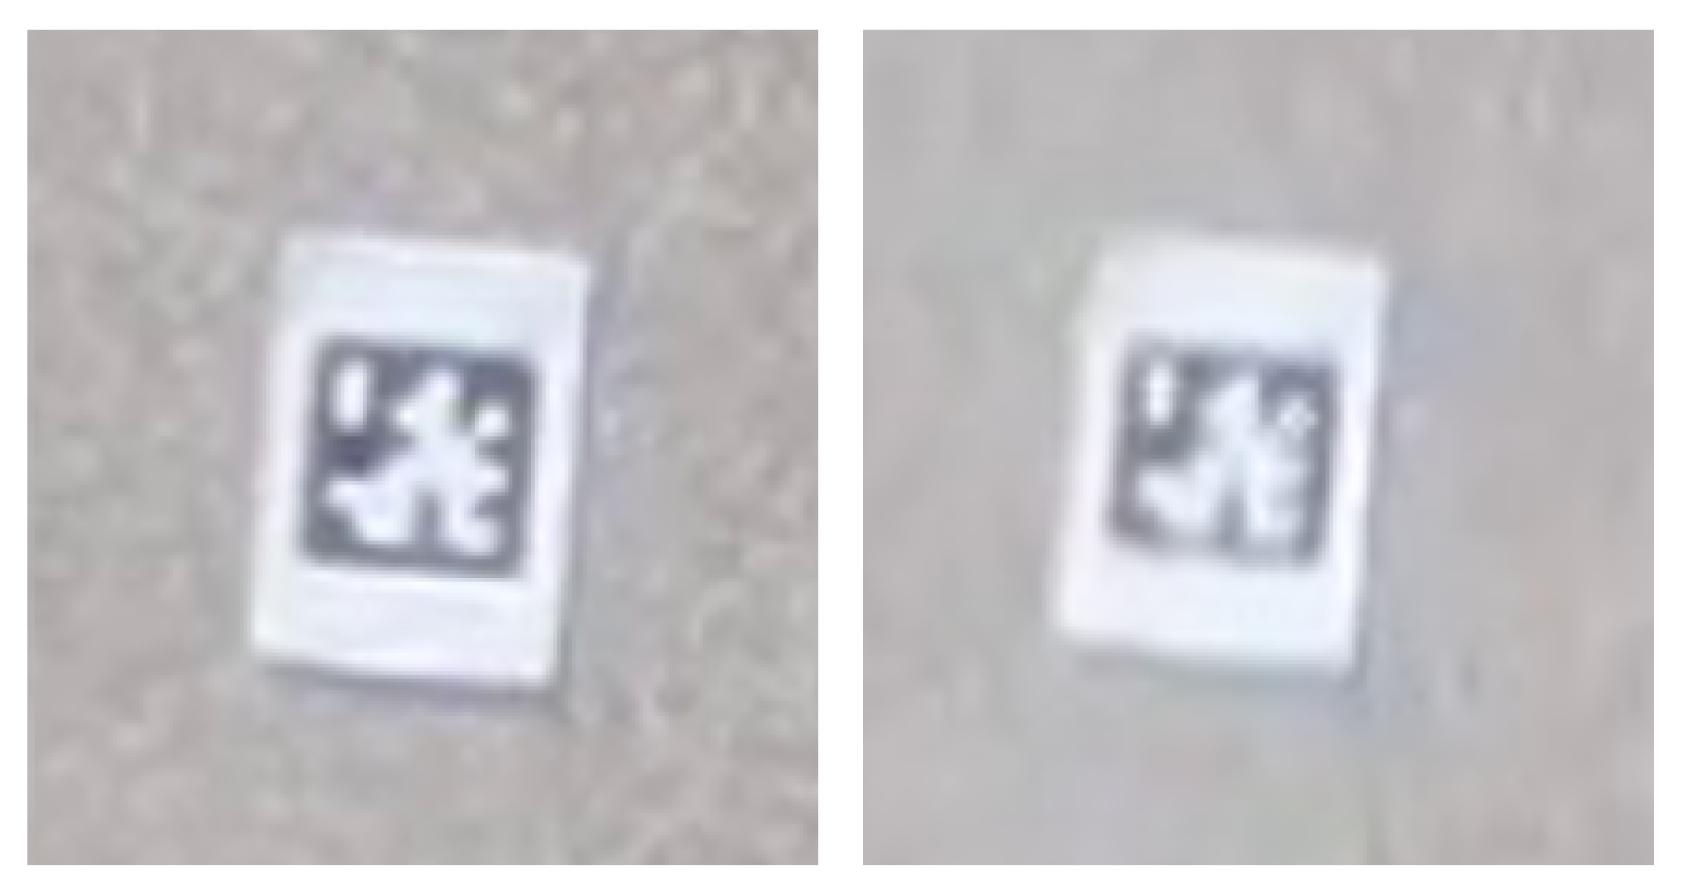
The degradation of detection performance as the speed varies depends on the motion blur effect, which increases with increasing speed and decreasing ambient brightness [25]. Figure 12 shows a real example of the motion blur effect, visually comparing a Tag36h11 marker acquired at 2.77 m/s and 19.44 m/s. In order to explain the results, we have to introduce a new acquisition property: the camera shutter time. Motion blur is directly proportional to the shutter time, so for this subset, we have chosen to fix this value at 1/500 s (i.e., 2 ms).
Figure 13 shows a linear decay of detection performance as drone speed increases, with a decreasing trend which starts from about 8 m/s for the Tag16h5 marker family and 11 m/s for the marker family Tag36h11. Similarly to the analysis, Tag36h11, thanks to a higher amount of significant bits, ensures a greater interval of correct data (above 90th percentile). The Tag16h5 family, thanks to it lower amount of bits (despite the shorter Hamming distance), ensures a smoother decay, with a detection percentage that remains around 50% at 19.77 m/s.
7. Conclusions and Future Work
The main contribution of this paper is to present and evaluate a working proof of concept for medicine delivery in a smart city using UAVs and fiducial markers. The performance evaluation of two different fiducial marker systems was performed from several points of view: i. object detection performance based on the most reliable metrics used in the literature; ii. maximum detection distance; iii. pose estimation error, and eventually iv. maximum detection speed. Although machine learning and deep learning techniques are frequently used nowadays, the energy requirements and the maintainability of these systems do not always justify the performance improvements obtained. In this paper, we evaluated the joint use of drones and fiducial markers, identifying the best conditions in which the system guarantees its efficient and safe operation. Future works concern deeper analysis on particular issues such as: i. security measures against malicious attacks; ii. route optimization for better energy efficiency; iii. sample recovery in addition to medicine delivery.
The AprilTag fiducial system achieved better overall results than the ArUco fiducial system. Tag16h5 and Tag36h11 are the two marker families that have obtained the best results in terms of maximum detection distance, pose estimation error (considering both RMSE and upper bound) and maximum detection speed. Table 13 shows the overall results obtained by AprilTag Tag16h5 and Tag36h11.
Designing a hypothetical UAV medicine delivery service in an urban area that uses AprilTag Tag16h5 as a fiducial family, it is possible to imagine a drone that moves towards the destination at a cruising height of 120 m (maximum legal altitude). After that, it positions itself at a scouting height of 106.49 m (maximum detection distance) and moves searching the marker at a scouting speed of 10.75 m/s (maximum detection speed). If the marker detection operation is successful, the drone lowers further until the distance with the marker is 37.91 m (pose estimation upper bound); then it activates the winch and delivers the medicine. Using AprilTag Tag36h11 instead as the fiducial family, the drone performs the scouting operation at 57.11 m and 11.67 m/s; if the tag is detected, it positions itself at 34.86 m from the marker and performs the delivery. Considering these results, the best fiducial family for a UAV medicine delivery service is AprilTag Tag16h5.
Author Contributions
Conceptualization, E.I. and R.G.; investigation, G.A.; methodology, R.G.; software, G.A.; supervision, R.G.; validation, E.I. and R.G.; writing—original draft, G.A. and E.I.; writing—review and editing, G.A., E.I. and R.G. All authors have read and agreed to the published version of the manuscript.
Funding
This research received no external funding.
Data Availability Statement
Not applicable.
Conflicts of Interest
The authors declare no conflict of interest.
References
- Reis, J.; Marques, P.A.; Marques, P.C. Where Are Smart Cities Heading? A Meta-Review and Guidelines for Future Research. Appl. Sci. 2022, 12, 8328. [Google Scholar] [CrossRef]
- Esashika, D.; Masiero, G.; Mauger, Y. An investigation into the elusive concept of smart cities: A systematic review and meta-synthesis. Technol. Anal. Strateg. Manag. 2021, 33, 957–969. [Google Scholar] [CrossRef]
- De Nicola, A.; Villani, M.L. Smart City Ontologies and Their Applications: A Systematic Literature Review. Sustainability 2021, 13, 5578. [Google Scholar] [CrossRef]
- Giuliano, R. The Next Generation Network in 2030: Applications, Services, and Enabling Technologies. In Proceedings of the 2021 8th International Conference on Electrical Engineering, Computer Science and Informatics (EECSI), Semarang, Indonesia, 20–21 October 2021; pp. 294–298. [Google Scholar]
- Košťák, M.; Slabý, A. Designing a Simple Fiducial Marker for Localization in Spatial Scenes Using Neural Networks. Sensors 2021, 21, 5407. [Google Scholar] [CrossRef] [PubMed]
- Lee, H.L.; Chen, Y.; Gillai, B.; Rammohan, S. Technological disruption and innovation in last-mile delivery. Value Chain. Innov. Initiat. 2016, 1–26. Available online: https://www.gsb.stanford.edu/faculty-research/publications/technological-disruption-innovation-last-mile-delivery (accessed on 12 October 2022).
- Singireddy, S.R.R.; Daim, T.U. Technology Roadmap: Drone Delivery—Amazon Prime Air. In Infrastructure and Technology Management; Springer: Cham, Switzerland, 2018; pp. 387–412. [Google Scholar]
- Lohn, A.J. What’s the Buzz? The City-Scale Impacts of Drone Delivery; Tech. Rep.; RAND Corporation: Santa Monica, CA, USA, 2017. [Google Scholar]
- Murray, C.; Chu, A.G. The flying sidekick traveling salesman problem: Optimization of drone-assisted parcel delivery. Transp. Res. Part C Emerg. Technol. 2015, 54, 86–109. [Google Scholar] [CrossRef]
- Ha, Q.; Deville, Y.; Pham, Q.D.; Hà, M. On the mincost traveling salesman problem with drone. Transp. Res. Part C Emerg. Technol. 2018, 86, 597–621. [Google Scholar] [CrossRef] [Green Version]
- Tavana, M.; Khalili-Damghani, K.; Santos-Arteaga, F.J.; Zandi, M.H. Drone shipping versus truck delivery in a cross-docking system with multiple fleets and products. Expert Syst. Appl. 2017, 72, 93–107. [Google Scholar] [CrossRef]
- Dorling, K.; Heinrichs, J.; Messier, G.G.; Magierowski, S. Vehicle routing problems for drone delivery. IEEE Trans. Syst. Man, Cybern.—Part A Syst. Humans 2016, 47, 70–85. [Google Scholar] [CrossRef] [Green Version]
- Stolaroff, J.K.; Samaras, C.; O’Neill, E.R.; Lubers, A.; Mitchell, A.S.; Ceperley, D. Energy use and life cycle greenhouse gas emissions of drones for commercial package delivery. Nat. Commun. 2018, 9, 1–13. [Google Scholar]
- Joerss, M.; Schrder, A.; Neuhaus, F.; Klink, C.; Mann, A.F.T. Parcel Delivery: The Future of the Last Mile; Tech. Rep. on Travel, Transport and Logistics; McKinsey & Company: New York, NY, USA, 2016. [Google Scholar]
- Guerrero, M.E.; Mercado, D.A.; Lozano, R.; García, C.D. Passivity based control for a quadrotor UAV transporting a cable-suspended payload with minimum swing. In Proceedings of the 54th IEEE Conference on Decision and Control, Osaka, Japan, 15–18 December 2015; pp. 6718–6723. [Google Scholar]
- Gatteschi, V.; Lamberti, F.; Paravati, G.; Sanna, A.; Demartini, C.; Lisanti, A.; Venezia, G. New frontiers of delivery services using drones: A prototype system exploiting a quadcopter for autonomous drug shipments. In Proceedings of the 39th IEEE Annual Computer Software and Applications Conference, Taichung, Taiwan, 1–5 July 2015; pp. 920–927. [Google Scholar]
- Brunner, G.; Szebedy, B.; Tanner, S.; Wattenhofer, R. The Urban Last Mile Problem: Autonomous Drone Delivery to Your Balcony. In Proceedings of the International Conference on Unmanned Aircraft Systems (ICUAS), Atlanta, GA, USA, 11–14 June 2019; pp. 1005–1012. [Google Scholar]
- Walsh, R.; Falesch, A.J. Landing Pad for Unmanned Aerial Vehicle Delivery. U.S. Patent No. 11,117,680, 14 September 2021. [Google Scholar]
- Wheeler, D.; Wilkinson, C. From calm to storm: The origins of the Beaufort wind scale. Mar. Mirror 2004, 90, 187–201. [Google Scholar] [CrossRef]
- Alyassi, R.; Khonji, M.; Karapetyan, A.; Chau, S.C.-K.; Elbassioni, K.; Tseng, C.-M. Autonomous Recharging and Flight Mission Planning for Battery-Operated Autonomous Drones. IEEE Trans. Autom. Sci. Eng. 2022, 1–13. [Google Scholar] [CrossRef]
- Yu, G.; Hu, Y.; Dai, J. TopoTag: A Robust and Scalable Topological Fiducial Marker System. IEEE Trans. Vis. Comput. Graph. 2021, 27, 3769–3780. [Google Scholar] [CrossRef] [PubMed] [Green Version]
- Gu, J.; Ramamoorthi, R.; Belhumeur, P.; Nayar, S. Removing image artifacts due to dirty camera lenses and thin occluders. ACM Trans. Graph. 2009, 28, 1–10. [Google Scholar] [CrossRef]
- ArUco Marker Detection. opencv.org. Available online: https://docs.opencv.org/4.x/d9/d6a/group__aruco.html (accessed on 13 March 2022).
- Python Bindings for Apriltags v3. pupil-labs.com. Available online: https://package.wiki/pupil-apriltags (accessed on 13 March 2022).
- Kurimo, E.; Lepistö, L.; Nikkanen, J.; Grén, J.; Kunttu, I.; Laaksonen, J. The Effect of Motion Blur and Signal Noise on Image Quality in Low Light Imaging. In Proceedings of the 16th Scandinavian Conference of Image Analysis, Oslo, Norway, 15–18 June 2009; Springer: Berlin/Heidelberg, Germany, 2009; pp. 81–90. [Google Scholar]
Figure 1.
Reference system architecture for medicine delivery.

Figure 2.
Medicine delivery flowchart.

Figure 3.
analysis flowchart.

Figure 4.
Diagram representing the relation between parameters in (4).
Figure 4.
Diagram representing the relation between parameters in (4).

Figure 5.
Hit rate percentage vs. distance (AprilTag).

Figure 6.
Hit rate percentage vs. distance (ArUco).

Figure 7.
dataset flowchart.

Figure 8.
analysis flowchart.

Figure 9.
Pose estimation absolute error by distance—ArUco.

Figure 10.
Pose estimation absolute error by distance—AprilTag.

Figure 11.
analysis flowchart.

Figure 12.
Marker acquired at 2.77 m/s (left) and 19.44 m/s (right).

Figure 13.
Hit rate by acquisition speed.


Table 1.
Fiducial System comparison.
| Fiducial System | Open-Source | Language | Last Release | Families | Min. Bit |
|---|---|---|---|---|---|
| AprilTag | Y | C, Python, Matlab | 29 November 2021 | 9 | 16 |
| ARTag | N | - | - | 1 | 36 |
| ARToolKit | Y | C, Python | 21 August 2020 | 1 | - |
| ArUco | Y | C, Python | 22 December 2021 | 16 | 16 |
| BlurTag | N | - | - | 1 | - |
| CALTag | Y | Matlab | 10–21 October 2019 | 1 | 64 |
| RuneTag | Y | C | 15 March 2017 | 1 | 43 |
Table 2.
Performance evaluation datasets.
| System | Family | # Samples | |||
|---|---|---|---|---|---|
| Aruco | 4 × 4 | 3130 | 1908 | 95 | 1222 |
| Aruco | 5 × 5 | 3485 | 2240 | 0 | 1245 |
| Aruco | 6 × 6 | 3609 | 1855 | 0 | 1754 |
| Aruco | 7 × 7 | 3307 | 1721 | 0 | 1586 |
| Aruco | Original | 3037 | 2165 | 339 | 872 |
| AprilTag | Tag16h5 | 4722 | 4265 | 4070 | 457 |
| AprilTag | Tag36h11 | 5346 | 3252 | 0 | 2094 |
| AprilTag | TagCircle21h7 | 4712 | 3299 | 1153 | 1413 |
| AprilTag | TagStandard41h12 | 4743 | 2757 | 0 | 1986 |
Table 3.
Performance evaluation results.
| System | Family | Precision, | Recall, | Accuracy, | F-Score |
|---|---|---|---|---|---|
| Aruco | 4 × 4 | 0.95 | 0.61 | 0.59 | 0.74 |
| ArUco | 5 × 5 | 1.00 | 0.64 | 0.64 | 0.78 |
| ArUco | 6 × 6 | 1.00 | 0.51 | 0.51 | 0.68 |
| ArUco | 7 × 7 | 1.00 | 0.52 | 0.52 | 0.68 |
| ArUco | Original | 0.86 | 0.71 | 0.64 | 0.78 |
| AprilTag | Tag16h5 | 0.51 | 0.90 | 0.49 | 0.65 |
| AprilTag | Tag36h11 | 1.00 | 0.61 | 0.61 | 0.76 |
| AprilTag | TagCircle21h7 | 0.74 | 0.70 | 0.56 | 0.72 |
| AprilTag | TagStandard41h12 | 1.00 | 0.58 | 0.58 | 0.74 |
Table 4.
Extract of hit rate results.
| Dataset_id | Distance (m) | Total | Found | Probability |
|---|---|---|---|---|
| 3 | 85 | 21 | 8 | 38.10% |
| 3 | 80 | 54 | 25 | 46.29% |
| 3 | 75 | 48 | 29 | 60.42% |
| 3 | 70 | 48 | 34 | 70.83% |
| 3 | 65 | 48 | 39 | 81.25% |
| 3 | 60 | 47 | 44 | 93.62% |
| 3 | 55 | 48 | 48 | 100.00% |
| 3 | 50 | 48 | 48 | 100.00% |
Table 5.
Expected ratios vs detected ratios.
| Expected Value | Detected Value | Difference % | |
|---|---|---|---|
| 2×/1× ratio | 2 | 1.45 | −27.50% |
| Cloudy/Sunny ratio | 1 | 0.98 | −2.00% |
| A3/A4 ratio | 1.28 | −9.48% |
Table 6.
and by tag families and systems.
| System | Fiducial Family | Best Zoom | Best Size | (m) | |
|---|---|---|---|---|---|
| AprilTag | Tag16h5 | 2× | A3 | 106.49 | 2.26 |
| AprilTag | Tag36h11 | 2× | A3 | 57.11 | 2.74 |
| AprilTag | TagCircle21h7 | 2× | A3 | 73.64 | 1.81 |
| AprilTag | TagStandard41h12 | 2× | A3 | 71.10 | 1.81 |
| Aruco | 4 × 4 | 2× | A3 | 59.70 | 5.09 |
| Aruco | 5 × 5 | 2× | A3 | 50.82 | 4.78 |
| Aruco | 6 × 6 | 2× | A4 | 48.32 | 3.33 |
| Aruco | 7 × 7 | 2× | A3 | 81.66 | 5.26 |
| Aruco | Original | 2× | A3 | 66.94 | 4.02 |
Table 7.
Extract of probability of correct estimation.
| Family | Zoom | Size | Distance | Total | Correct | Probability |
|---|---|---|---|---|---|---|
| Original | 2× | A4 | 10 | 54 | 38 | 70.37% |
| Original | 2× | A4 | 15 | 53 | 51 | 96.23% |
| Original | 2× | A4 | 20 | 54 | 43 | 79.63% |
| Original | 2× | A4 | 25 | 48 | 26 | 54.17% |
| Original | 2× | A4 | 30 | 68 | 28 | 41.18% |
| Original | 2× | A4 | 35 | 90 | 19 | 21.11% |
| Original | 2× | A4 | 40 | 51 | 18 | 35.29% |
| Original | 2× | A4 | 45 | 70 | 17 | 24.29% |
Table 8.
Expected ratios vs detected ratios.
| Expected Value | Detected Value | Difference % | |
|---|---|---|---|
| 2×/1× ratio | 2 | 2.22 | +11.00% |
| A3/A4 ratio | 1.59 | +12.43% |
Table 9.
Upper Bound and calculated for different zoom values.
| Zoom | Upper Bound (m) | (m) |
|---|---|---|
| 1× | 8.21 | 37.19 |
| 2× | 18.23 | 52.53 |
Table 10.
Lower Bound and Upper Bound calculated on best size and zoom conditions.
| Fiducial System | Family | Best Zoom | Best Size | Lower Bound | Upper Bound |
|---|---|---|---|---|---|
| AprilTag | Tag16h5 | 2× | A3 | 5.00 | 37.91 |
| AprilTag | Tag36h11 | 2× | A3 | 5.00 | 34.86 |
| AprilTag | TagCircle21h7 | 2× | A3 | 27.29 | 33.64 |
| AprilTag | TagStandard41h12 | 2× | A3 | 19.16 | 24.10 |
| ArUco | 4 × 4 | 2× | A3 | 5.00 | 59.70 |
| ArUco | 5 × 5 | 2× | A3 | 9.52 | 50.82 |
| ArUco | 6 × 6 | 2× | A4 | 5.00 | 48.32 |
| ArUco | 7 × 7 | 2× | A3 | 15.90 | 51.66 |
| ArUco | Original | 2× | A3 | 5.00 | 48.94 |
Table 11.
and relative subset height by marker family.
| Fiducial System | Fiducial Family | Conditions | (m) | Height (m) |
|---|---|---|---|---|
| AprilTag | Tag16h5 | Zoom 2×, A4 | 85.79 | 78.37 |
| AprilTag | Tag36h11 | Zoom 2×, A4 | 57.11 | 52.17 |
Table 12.
hit rate results.
| Dataset_id | Speed (m/s) | Total | Found | Probability |
|---|---|---|---|---|
| 72 | 19.44 | 22 | 0 | 0.00% |
| 73 | 16.66 | 29 | 9 | 31.03% |
| 74 | 13.88 | 48 | 28 | 58.33% |
| 75 | 11.11 | 51 | 50 | 98.04% |
| 76 | 8.33 | 61 | 61 | 100.00% |
| 77 | 5.55 | 83 | 83 | 100.00% |
| 78 | 2.77 | 361 | 361 | 100.00% |
| 79 | 19.44 | 23 | 11 | 47.83% |
| 80 | 16.66 | 31 | 19 | 61.29% |
| 81 | 13.88 | 56 | 41 | 73.21% |
| 82 | 11.11 | 61 | 54 | 88.52% |
| 83 | 8.33 | 131 | 131 | 100.00% |
| 84 | 5.55 | 151 | 137 | 90.73% |
| 85 | 2.77 | 351 | 350 | 99.72% |
Table 13.
AprilTag Tag16h5 and Tag36h11 overall results.
| AprilTag Tag16h5 | AprilTag Tag36h11 | |
|---|---|---|
| Family Size | 30 | 587 |
| Best Zoom | 2× | 2× |
| Maximum Shutter Time | 1/500 s | 1/500 s |
| Best Marker Size | A3 | A3 |
| Maximum Detection Distance | 106.49 m | 57.11 m |
| Pose Estimation Upper Bound | 37.91 m | 34.86 m |
| Maximum Detection Speed | 10.75 m/s | 11.67 m/s |
Publisher’s Note: MDPI stays neutral with regard to jurisdictional claims in published maps and institutional affiliations. |
© 2022 by the authors. Licensee MDPI, Basel, Switzerland. This article is an open access article distributed under the terms and conditions of the Creative Commons Attribution (CC BY) license (https://creativecommons.org/licenses/by/4.0/).
Share and Cite
MDPI and ACS Style
Innocenti, E.; Agostini, G.; Giuliano, R. UAVs for Medicine Delivery in a Smart City Using Fiducial Markers. Information 2022, 13, 501. https://doi.org/10.3390/info13100501
AMA Style
Innocenti E, Agostini G, Giuliano R. UAVs for Medicine Delivery in a Smart City Using Fiducial Markers. Information. 2022; 13(10):501. https://doi.org/10.3390/info13100501
Chicago/Turabian StyleInnocenti, Eros, Giacomo Agostini, and Romeo Giuliano. 2022. "UAVs for Medicine Delivery in a Smart City Using Fiducial Markers" Information 13, no. 10: 501. https://doi.org/10.3390/info13100501
Note that from the first issue of 2016, this journal uses article numbers instead of page numbers. See further details here.