
Identifying the Early Signs of Preterm Birth from U.S. Birth Records Using Machine Learning Techniques


1
Industrial and Systems Engineering, Virginia Tech, Blacksburg, VA 24060, USA
2
UCSF Health, San Francisco, CA 94143, USA
*
Author to whom correspondence should be addressed.
Information 2022, 13(7), 310; https://doi.org/10.3390/info13070310
Submission received: 9 May 2022
/
Revised: 16 June 2022
/
Accepted: 21 June 2022
/
Published: 25 June 2022
(This article belongs to the Special Issue Data Science in Health Services)
Abstract
:Preterm birth (PTB) is the leading cause of infant mortality in the U.S. and globally. The goal of this study is to increase understanding of PTB risk factors that are present early in pregnancy by leveraging statistical and machine learning (ML) techniques on big data. The 2016 U.S. birth records were obtained and combined with two other area-level datasets, the Area Health Resources File and the County Health Ranking. Then, we applied logistic regression with elastic net regularization, random forest, and gradient boosting machines to study a cohort of 3.6 million singleton deliveries to identify generalizable PTB risk factors. The response variable is preterm birth, which includes spontaneous and indicated PTB, and we performed a binary classification. Our results show that the most important predictors of preterm birth are gestational and chronic hypertension, interval since last live birth, and history of a previous preterm birth, which explains 10.92, 5.98, and 5.63% of the predictive power, respectively. Parents’ education is one of the influential variables in predicting PTB, explaining 7.89% of the predictive power. The relative importance of race declines when parents are more educated or have received adequate prenatal care. The gradient boosting machines outperformed with an AUC of 0.75 (sensitivity: 0.64, specificity: 0.73) for the validation dataset. In this study, we compare our results with seminal and most related studies to demonstrate the superiority of our results. The application of ML techniques improved the performance measures in the prediction of preterm birth. The results emphasize the importance of socioeconomic factors such as parental education as one of the most important indicators of preterm birth. More research is needed on these mechanisms through which socioeconomic factors affect biological responses.
1. Introduction
Preterm birth (PTB), defined as a birth before 37 weeks of pregnancy, is the leading cause of infant mortality in the U.S. and the world [1]. In 2013, PTB accounted for 36% of U.S. infant deaths in their first year of life [2,3]. In addition to the monetary cost of PTB, which exceeds 25 billion dollars annually, these babies may suffer from life-long deficiencies [4,5]. Many current interventions for reducing the probability of preterm delivery, like progesterone therapy, are effective only if administered early—between 16 and 24 weeks of gestation—in the pregnancy [6]. In prenatal care settings, patients can be enrolled in effective interventions to reduce behavioral risks without significant disruption of services [7]. Therefore, it is critical to study risk factors of a preterm delivery that are present early or even before pregnancy. In addition, identifying the risk factors might help define a population useful for studying specific interventions. Identifying risk factors might also provide insight into the mechanisms of preterm birth, which remain largely unknown [8,9,10,11,12].
A large and growing body of literature has focused on locating the individual risk factors of preterm birth [8,10,13,14]. The most important individual risk factor for predicting preterm delivery is a history of a previous PTB (both indicated and spontaneous) [15,16,17,18]. Race is another significant predictor of a PTB. The preterm birth rate (PBR) among the non-Hispanic (NH) Black population is 52% more than the NH White population—13.77 vs. 9.04%, respectively [19]. Other significant risk factors of preterm birth include age [20], short cervix between 16 to 28 weeks of pregnancy [21], and chronic medical disorders like hypertension [22] or diabetes [23]. Some studies attempted to increase the generalizability of the risk factors by including large cohorts [24].
Machine learning techniques are extensively used in advancing the understanding of spontaneous PTB risk factors [25,26,27,28,29]. Initial applications of ML techniques have assisted experts in better predicting PTB [28,30]. Studies have continuously used updated ML techniques on a more diverse obstetric population to extract generalizable PTB predictors [18,31,32,33]. Such efforts proved to have the potential to significantly benefit women’s and children health by identifying significant risk factors [34].
Despite the vast body of literature on the risk factors of PTB, very few interventions have been proven to effectively prolong gestational age in at-risk women [17,35]. This is partly because two-thirds of preterm deliveries happen to women with no risk factors [36]. The current risk assessment in the obstetrical population shows limitations because of the low prevalence of individual risk factors in the general obstetric population [37]. For example, the most important risk factor for preterm birth in singleton pregnancies is the history of a previous PTB [19,37]. However, the history of a previous PTB is not applicable to the women without a prior birth (nulliparous) which includes more than a third of the total births. Many of the proposed studies consider only the main effect of the individual risk factor of PTB while controlling for a limited number of confounding variables and interactions that were selected manually [14,25,36,38]. In sum, previous studies have not examined PTB risk factors present in early pregnancy on a dataset representative of the whole population while controlling for diverse confounding factors and their interactions.
To address these issues, we investigate the risk factors of preterm birth (PTB) in one of the largest obstetric populations in this field. By applying the latest statistical and machine learning techniques, we study the PTB risk factors that are both generalizable and identifiable during the early stages of pregnancy. We also implement novel techniques, such as variable importance and partial dependence plots, to interpret and explain the results.
The remainder of the paper is structured as follows. In Section 2, we define the study population and data elements. In Section 3, we outline the model development steps. We also discuss the handling of missing values and the interpretation techniques for getting insights from ML model outputs. Section 4 evaluates the results and compares them with other seminal studies. We further discuss our findings in Section 5 and provide a conclusion in Section 6.
2. Materials and Methods
2.1. Study Population
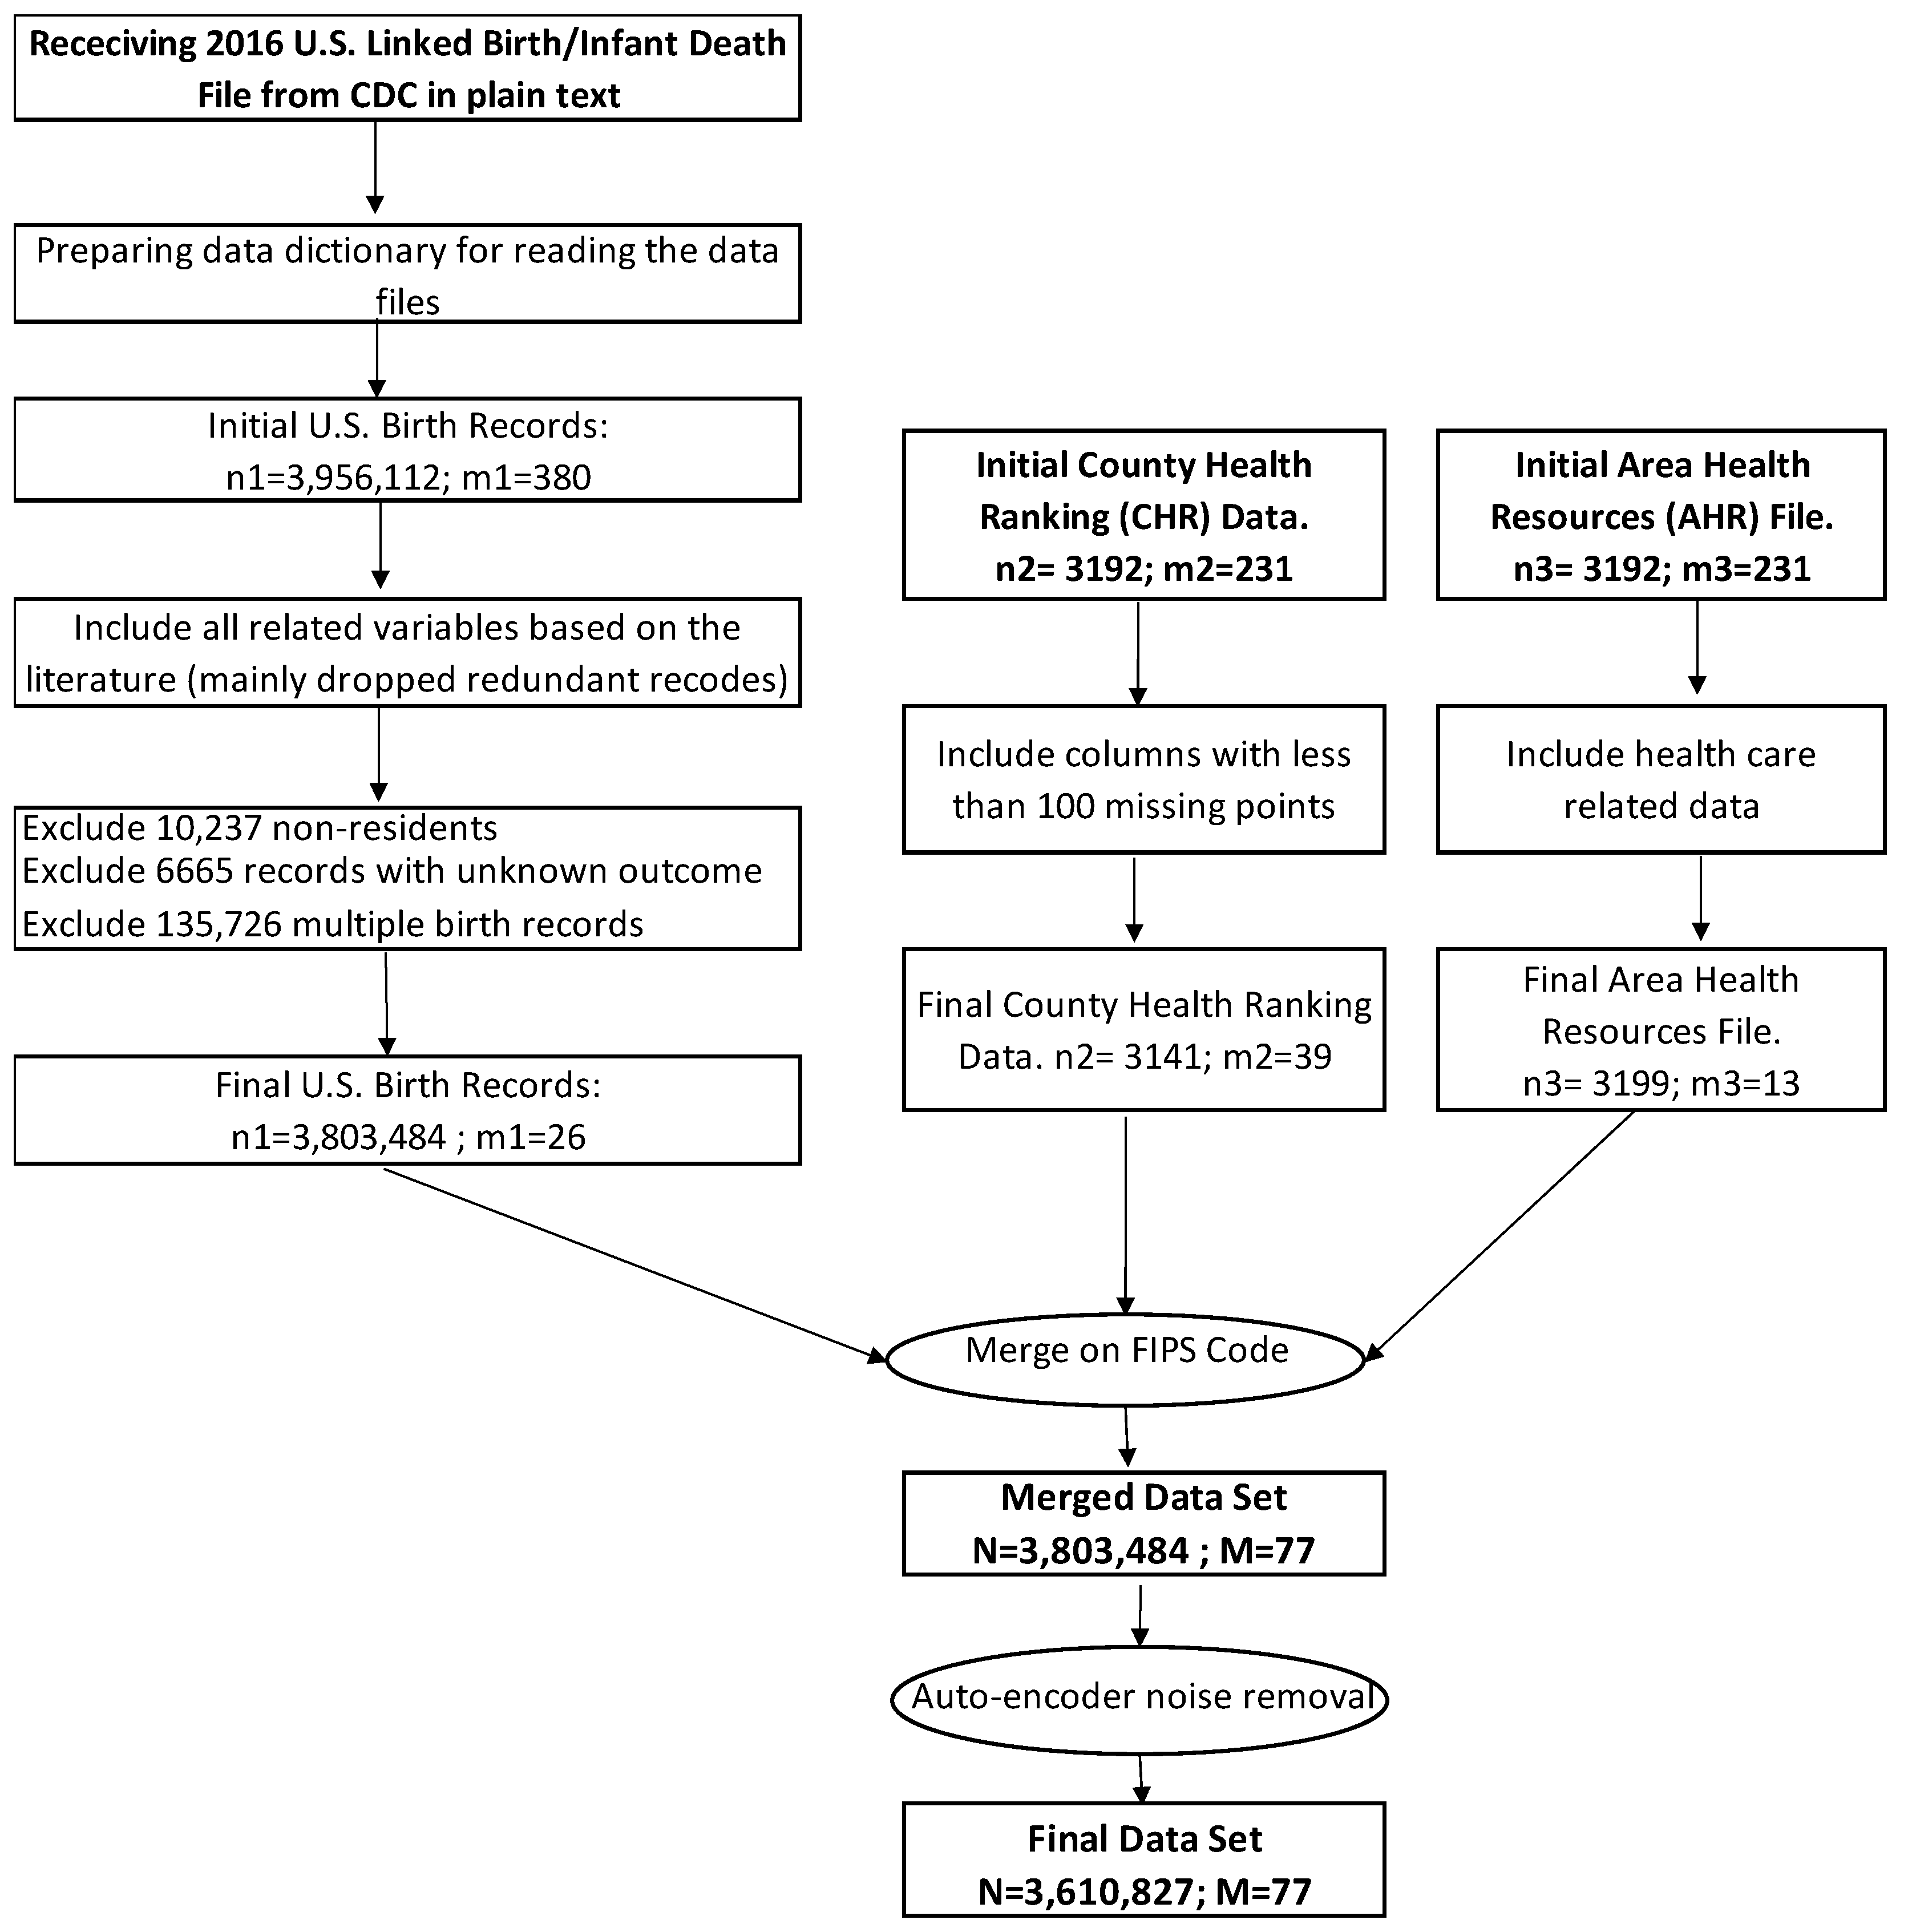
We obtained the 2016 birth records collected by the CDC [39]. We then combined the birth records with other data sources, including the County Health Rankings and the Area Health Resources File. The FIPS county codes linked all datasets using a common geographical identifier. This allowed us to integrate and examine multiple influences on preterm birth. We performed the data cleaning and preparation in STATA 14.0, and the processing was coded in R 4.0.3.
2.2. Data Elements
The CDC reports about 380 variables for every birth in the U.S. Some of these variables are recoded a few times for the same feature. For example, the mother’s age is reported in four types of recoding. Therefore, we only included 77 main variables. The CDC dataset contains variables collected through self-reported surveys from practitioners and parents at the time of birth. Therefore, we need to ensure that the quality of observation is suitable before using it in the model. To detect the data points that contain random errors or have a significant difference from the other data points, we trained an unsupervised autoencoder deep neural network (DNN), then used it in an anomaly detection model [40]. The autoencoder-based anomaly detector (AD) outperforms the other methods that are based on distance, density, clustering, or the support vector machine (SVM) [41,42]. We also used a grid search to find the parameters of the autoencoder that minimizes the mean square error (MSE). The final neural net that minimizes the MSE has three hidden layers with 20, 10, and 20 neurons, respectively. We also used the hyperbolic tangent function (“Tanh”) as the activation function for the neurons in the hidden layers. In addition, the model passes the training dataset in batches through the neural network 30 times (the number of epochs).
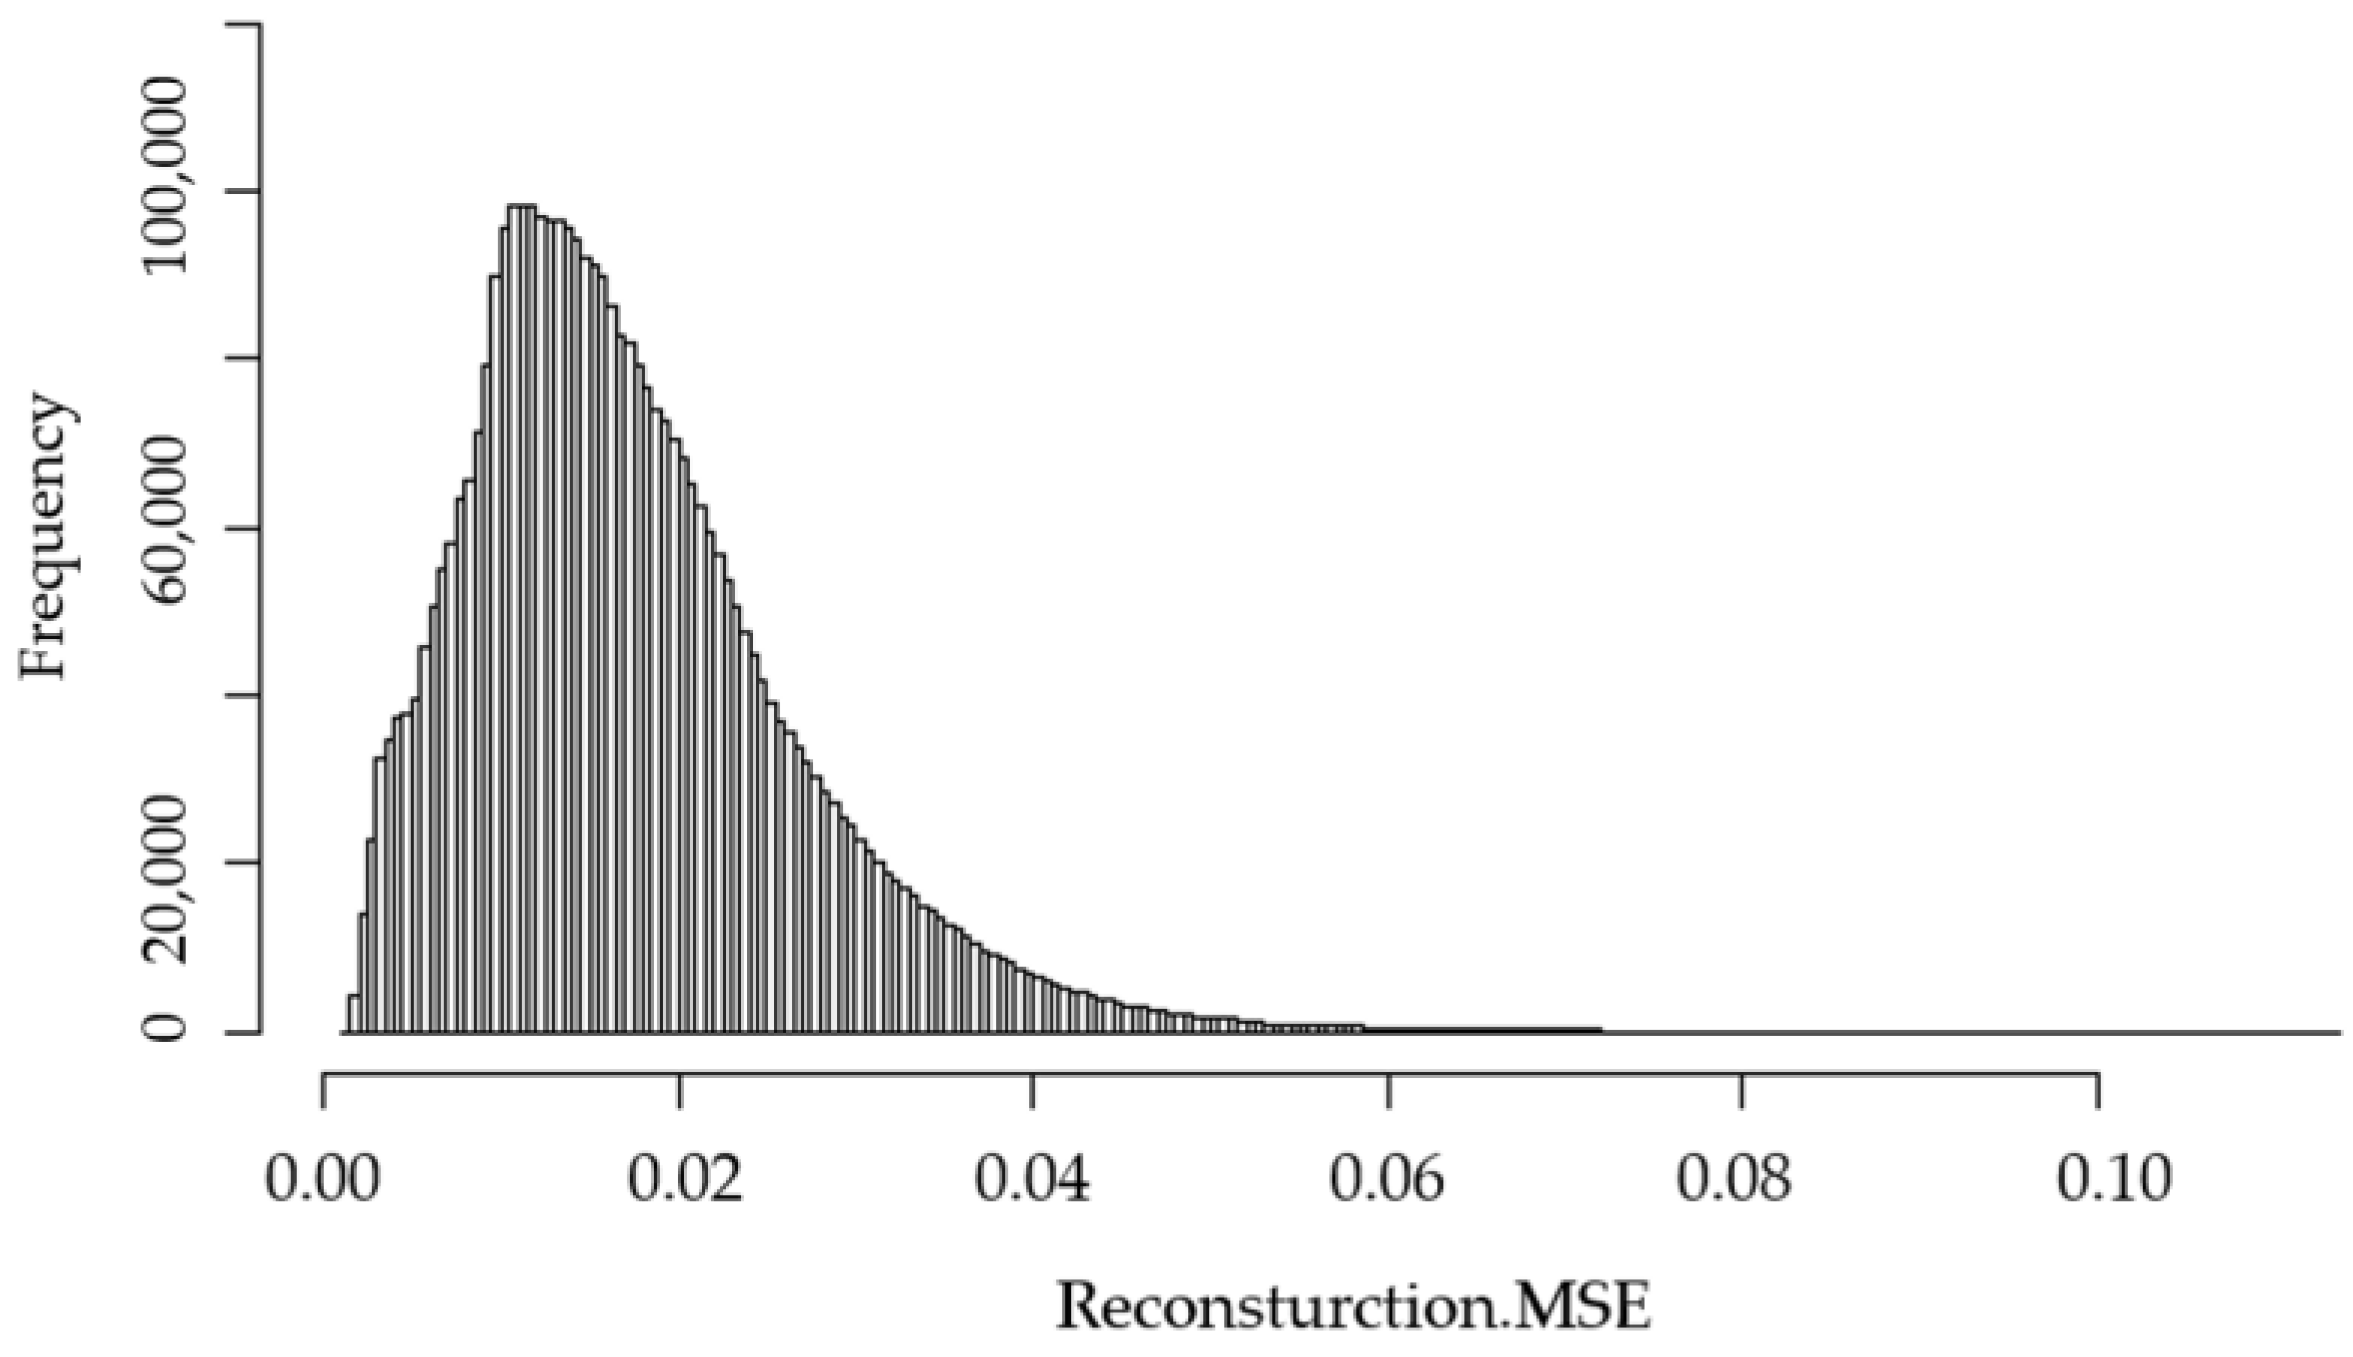
Figure 1 shows the reconstruction mean square error (Reconstruction.MSE) for all of the observations in the dataset calculated by the anomaly detection method. The figure shows that the majority of observations have an MSE of 0.035 or less; therefore, we remove the observations with a greater value than this threshold.
After applying the noise removal steps, 5.07% of the initial 3,803,484 observations are removed. The proportion of singleton preterm birth at 7.73% in the final dataset remains close to the initial distribution at 8.02%. The final dataset includes 3,610,827 observations with 77 variables. Figure 2 shows all of the data preparation steps.
Note that “n1” is the number of observations, and “m1” is the number of variables in the CDC dataset; “n2” and “n3” shows the number of counties in CHR and AHRF, respectively. “m2” and “m3” shows the number of variables in CHR and AHRF, respectively.
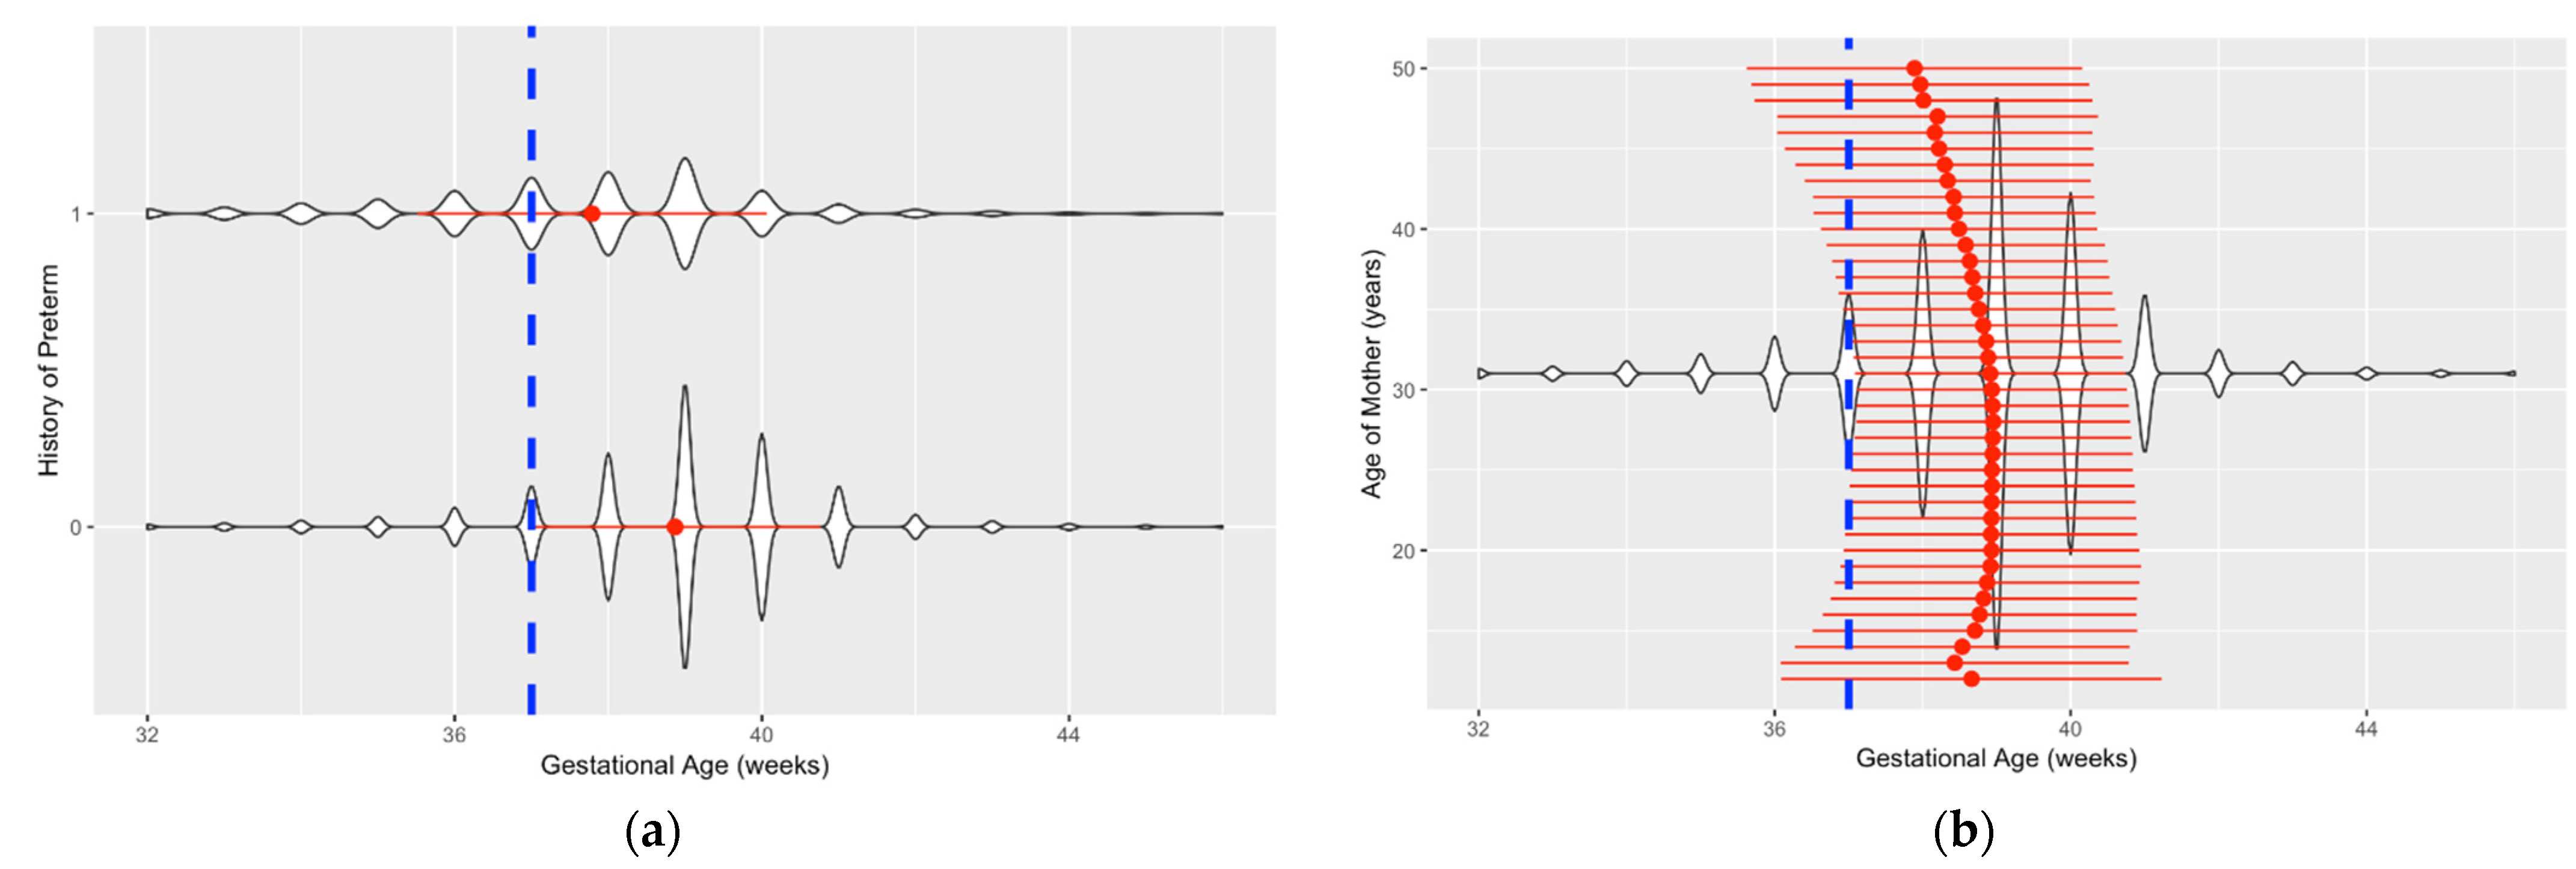
Data visualization is a challenging but insightful task in this study due to a large number of observations. We used Violin graphs from the ggplot2 package in R to plot the data and gain more information about the features and their relationship with preterm birth. The violin graph shows the density of data points at each level. Figure 3 shows two samples of these graphs. Figure 3a shows the kernel distribution of “History of Preterm” vs. “Gestational Age”. This graph shows that mothers with a history of preterm delivery (represented as 1 in the graph) have a lower average gestational age (represented with a red dot) compared to those without such a history. In addition, the dotted vertical line separates the preterm and full-term births. Preterm births are at the left side of the vertical line, and full-term births are on the right. Figure 3b shows the kernel distribution of “Age of Mother” vs. “Gestational Age”.
3. Model Development
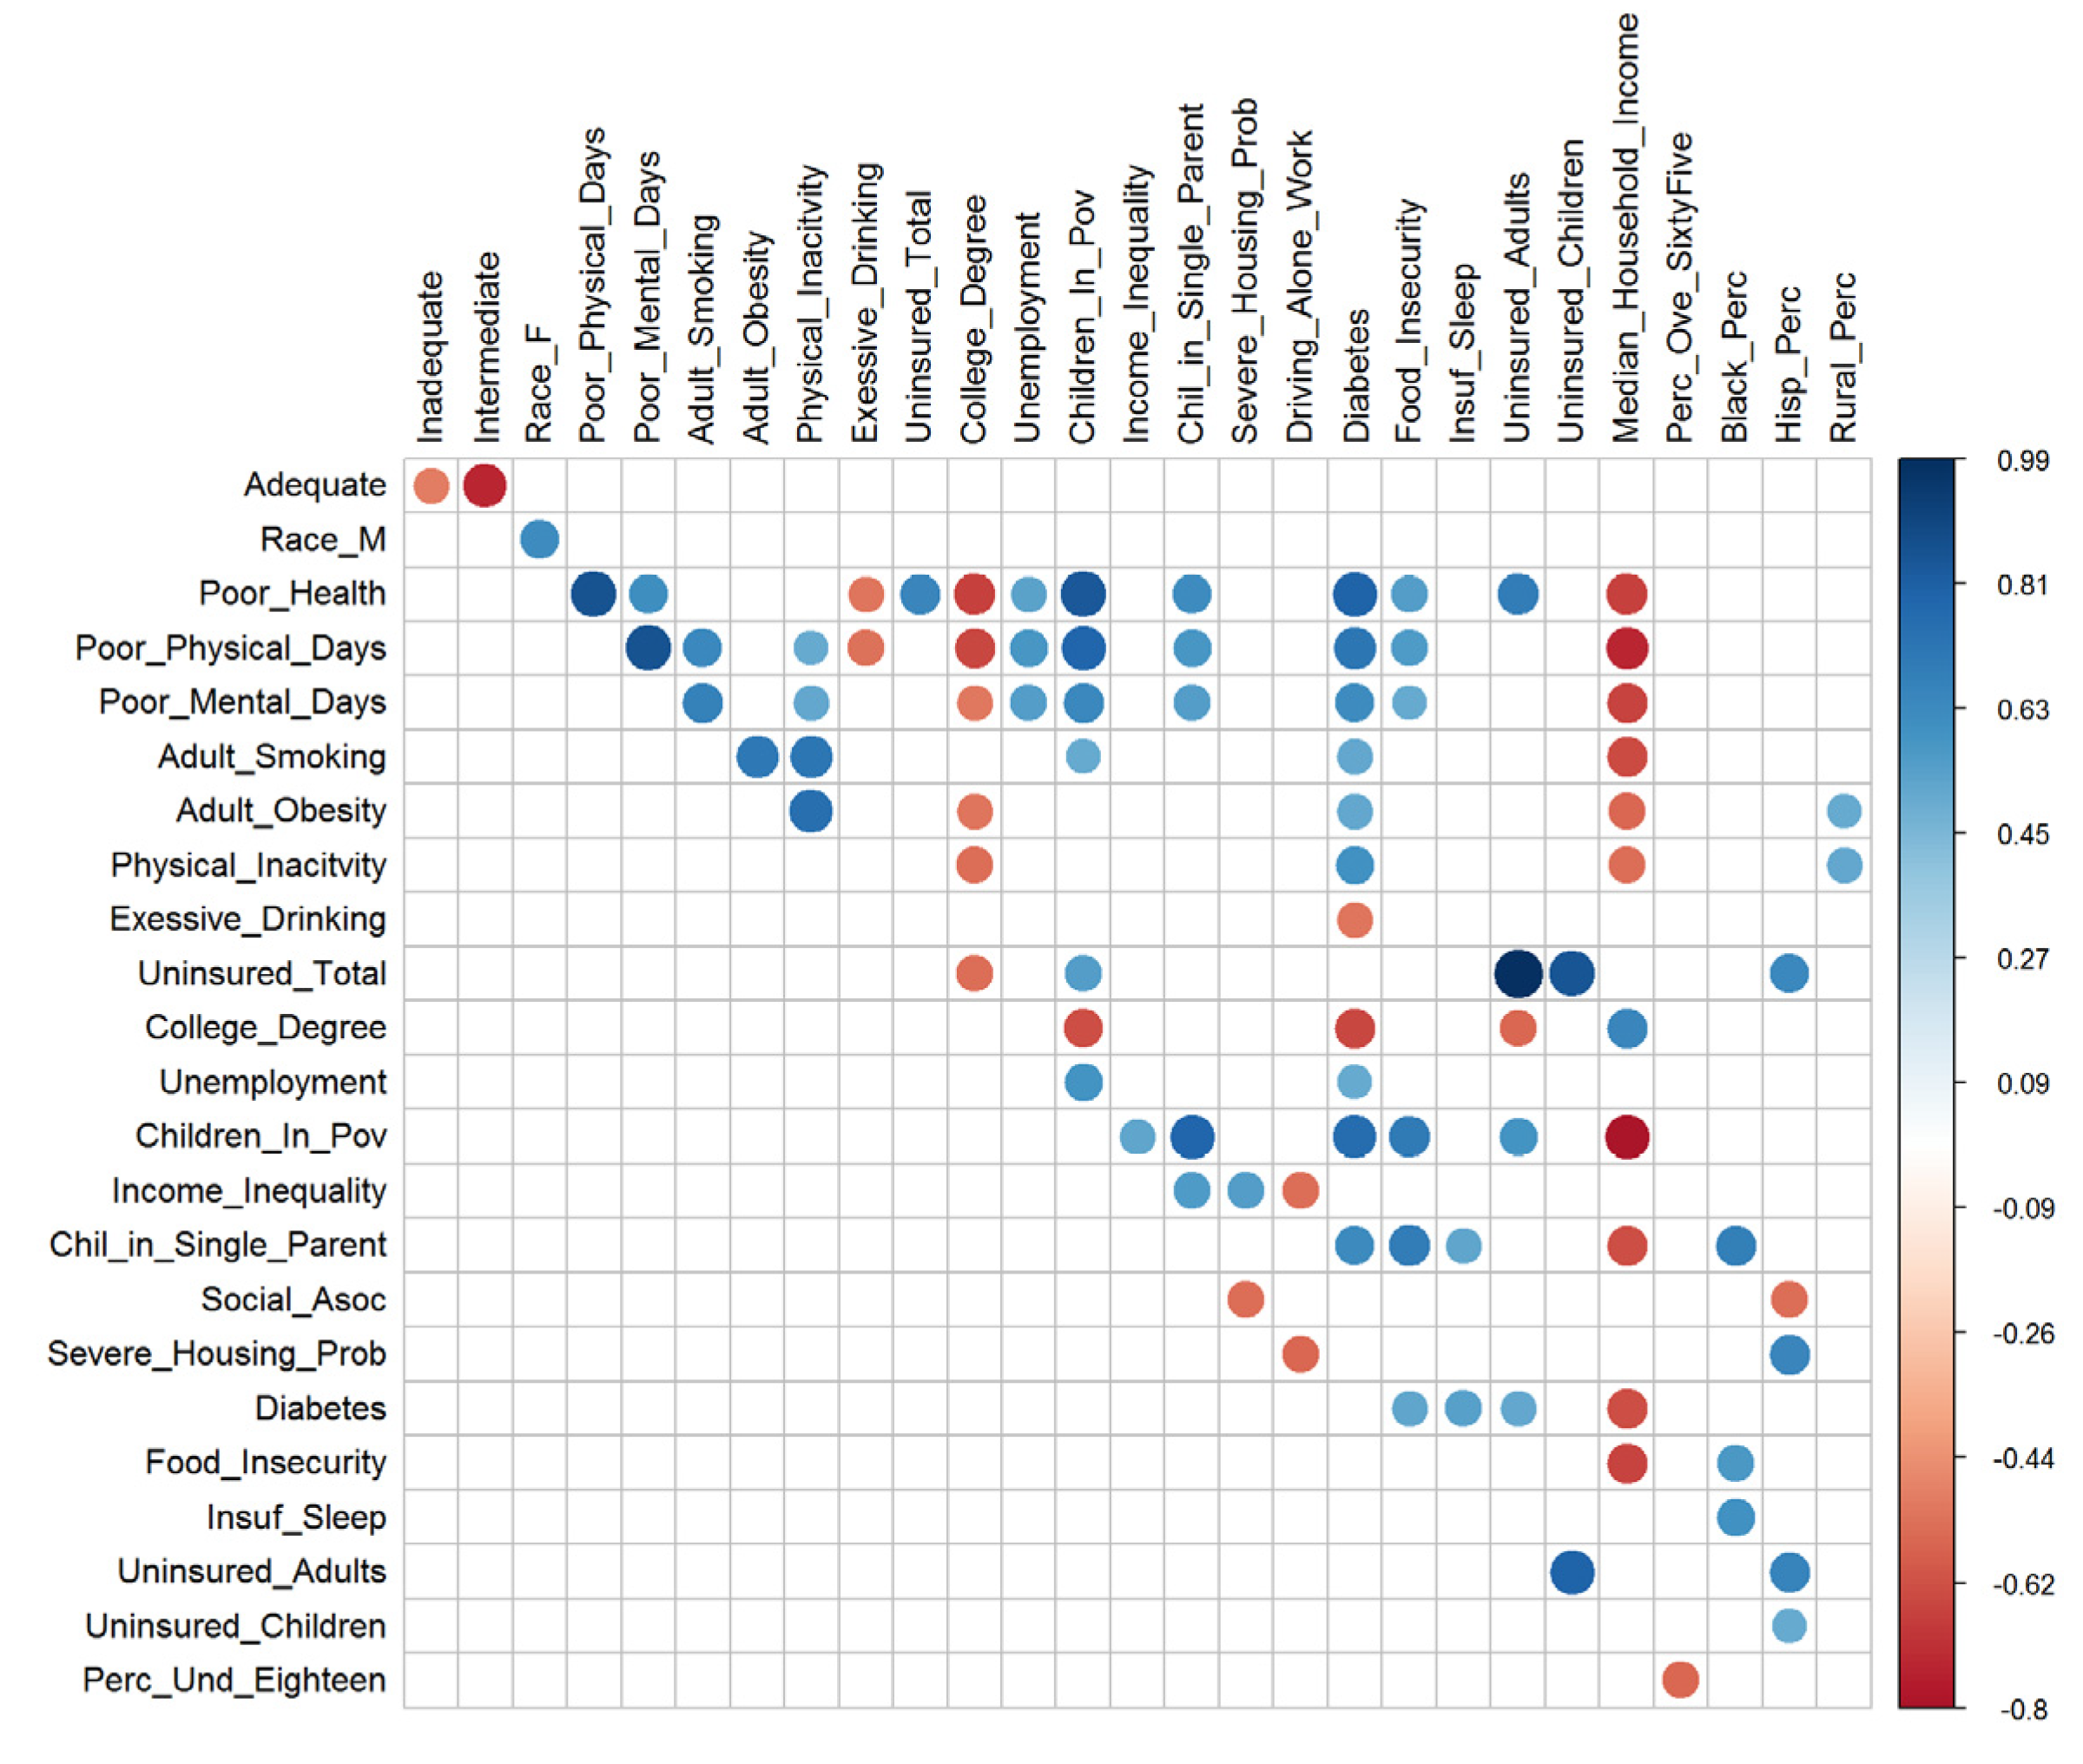
Our dataset has five characteristics that guide us in the selection of the methods. First, the distribution of the response variable is imbalanced. Preterm birth in singleton pregnancies occurs only in eight percent of the deliveries, and the remaining are full-term. Second, many of the features, such as age and education, have collinearity (Pearson’s correlation coefficient = 0.41). Figure 4 shows the pair of variables with an absolute correlation coefficient of 0.5 or more. This limited the use of methods like logistic regression, which has the assumption of little or no multicollinearity between independent features.
Third, we were interested in finding significant interactions among the variables. One of the best methods for learning the interactions with minimal supervision is the use of decision trees [43]. Fourth, our dataset had 3.6 million records with 77 variables, which limited the use of methods that are memory intensive, like support vector machines. Fifth, the dataset has 20 categorical variables. This limited the application of distance-based methods like the K-Nearest Neighbor algorithm. Based on these five characteristics, we applied regularized logistic regression [44], random forest (RF) [43,45,46], gradient boosting machines (GBM) [23,47], and LightGBM on our dataset [48].
We used a grid search to find the best hyperparameters of models. We used early stopping methods to prevent overfitting and reduce run-time (1 × 10⁻⁴ after five rounds). We used a system equipped with a Core I 7 2.50 GHz processor and 32.0 GB memory, with an Ubuntu 18.04.3 operating system.
3.1. Handling Missing Values and Categorical Variables
Handling missing data points and categorical variables in both methods is based on the capabilities of algorithms. Logistic regression needs to have a value for all data points, or it will drop any observation with a missing value. Therefore, we use the mean of each variable to impute the missing values. For the decision trees, however, the missing data points carry some type of information, and the method will keep such observations and consider them as one category. Table 1 shows the number of missing words for each variable. The number of missing values for most of the variables is zero. Table 1 shows the number and percentage of missing values for variables with more than 1% missing values.
Many of the variables in our dataset are categorical. The typical method to handle categorical variables is to create N new columns for categorical features with N levels. This method is called creating dummy variables or hot-encoding. However, we use a more efficient and interpretable method for handling the categorical variables. Instead of hot-encoding, we use a method called “Enum_Limited” in which the strings are internally mapped to integers and splits are done over these integers.
3.2. Interpretation Techniques
To obtain the ‘effect size’ of each variable on the response, we use partial dependence plots (PDP). This is useful for our study, particularly because we consider high-order interactions between our independent variables. A partial dependence plot returns the marginal ‘effect size’ of each variable on the response after accounting for the effect (average) of other responses:
where and complement the set of , and are the values of occurring in the training dataset of .
It is important to note that the PDP does not ignore the effect . The latter case can be estimated by
The quantities and will be the same only if the two events of and are independent, which is an unlikely situation.
4. Results
We randomly separated 75% of the data for the training set and the remaining 25% for validation purposes. The performance metrics are reported for the test set that is not part of the training process. The number of cross-validations for the methods is five-fold.
4.1. Study Design
The parameters for Logistic Regression with Elastic Net regularization (LR-EN) are set as , and after performing a grid search. The tuned hyperparameters are shown in Table 2. The results of tuning the parameters of GBM return 800 decision trees (ntrees) with a learning rate of and an annealing rate of 0.99. The maximum depth is 13 for each tree. This means that each tree checks up to 13 interactions among variables. Each tree is trained on a random sample of observations, n = 0.55 × N, and each split of the tree is performed on a random sample of features, p = 0.80 × M. The grid search result for LightGBM returns ntrees =280, , and a maximum depth of 14. We also used “Lossguide” for the “grow” policy, “dart” for booster type, and “histogram” for the tree method in the LightGBM method.
4.2. Results of the Machine Learning Algorithms
The results of the machine learning algorithms in Table 3 provide the performance metrics for each method. Sensitivity, specificity, and accuracy are a function of the cut-off threshold. Therefore, we report these metrics corresponding to the threshold that returns the highest mean per-class accuracy for all of the methods. Logistic regression with elastic net regularization (LR-EN) and RF return very close testing and training AUC, which shows that they do not overfit to the noise. However, their AUC metrics are less than the gradient boosting machines (GBM) and the LightGBM on both testing and training datasets.
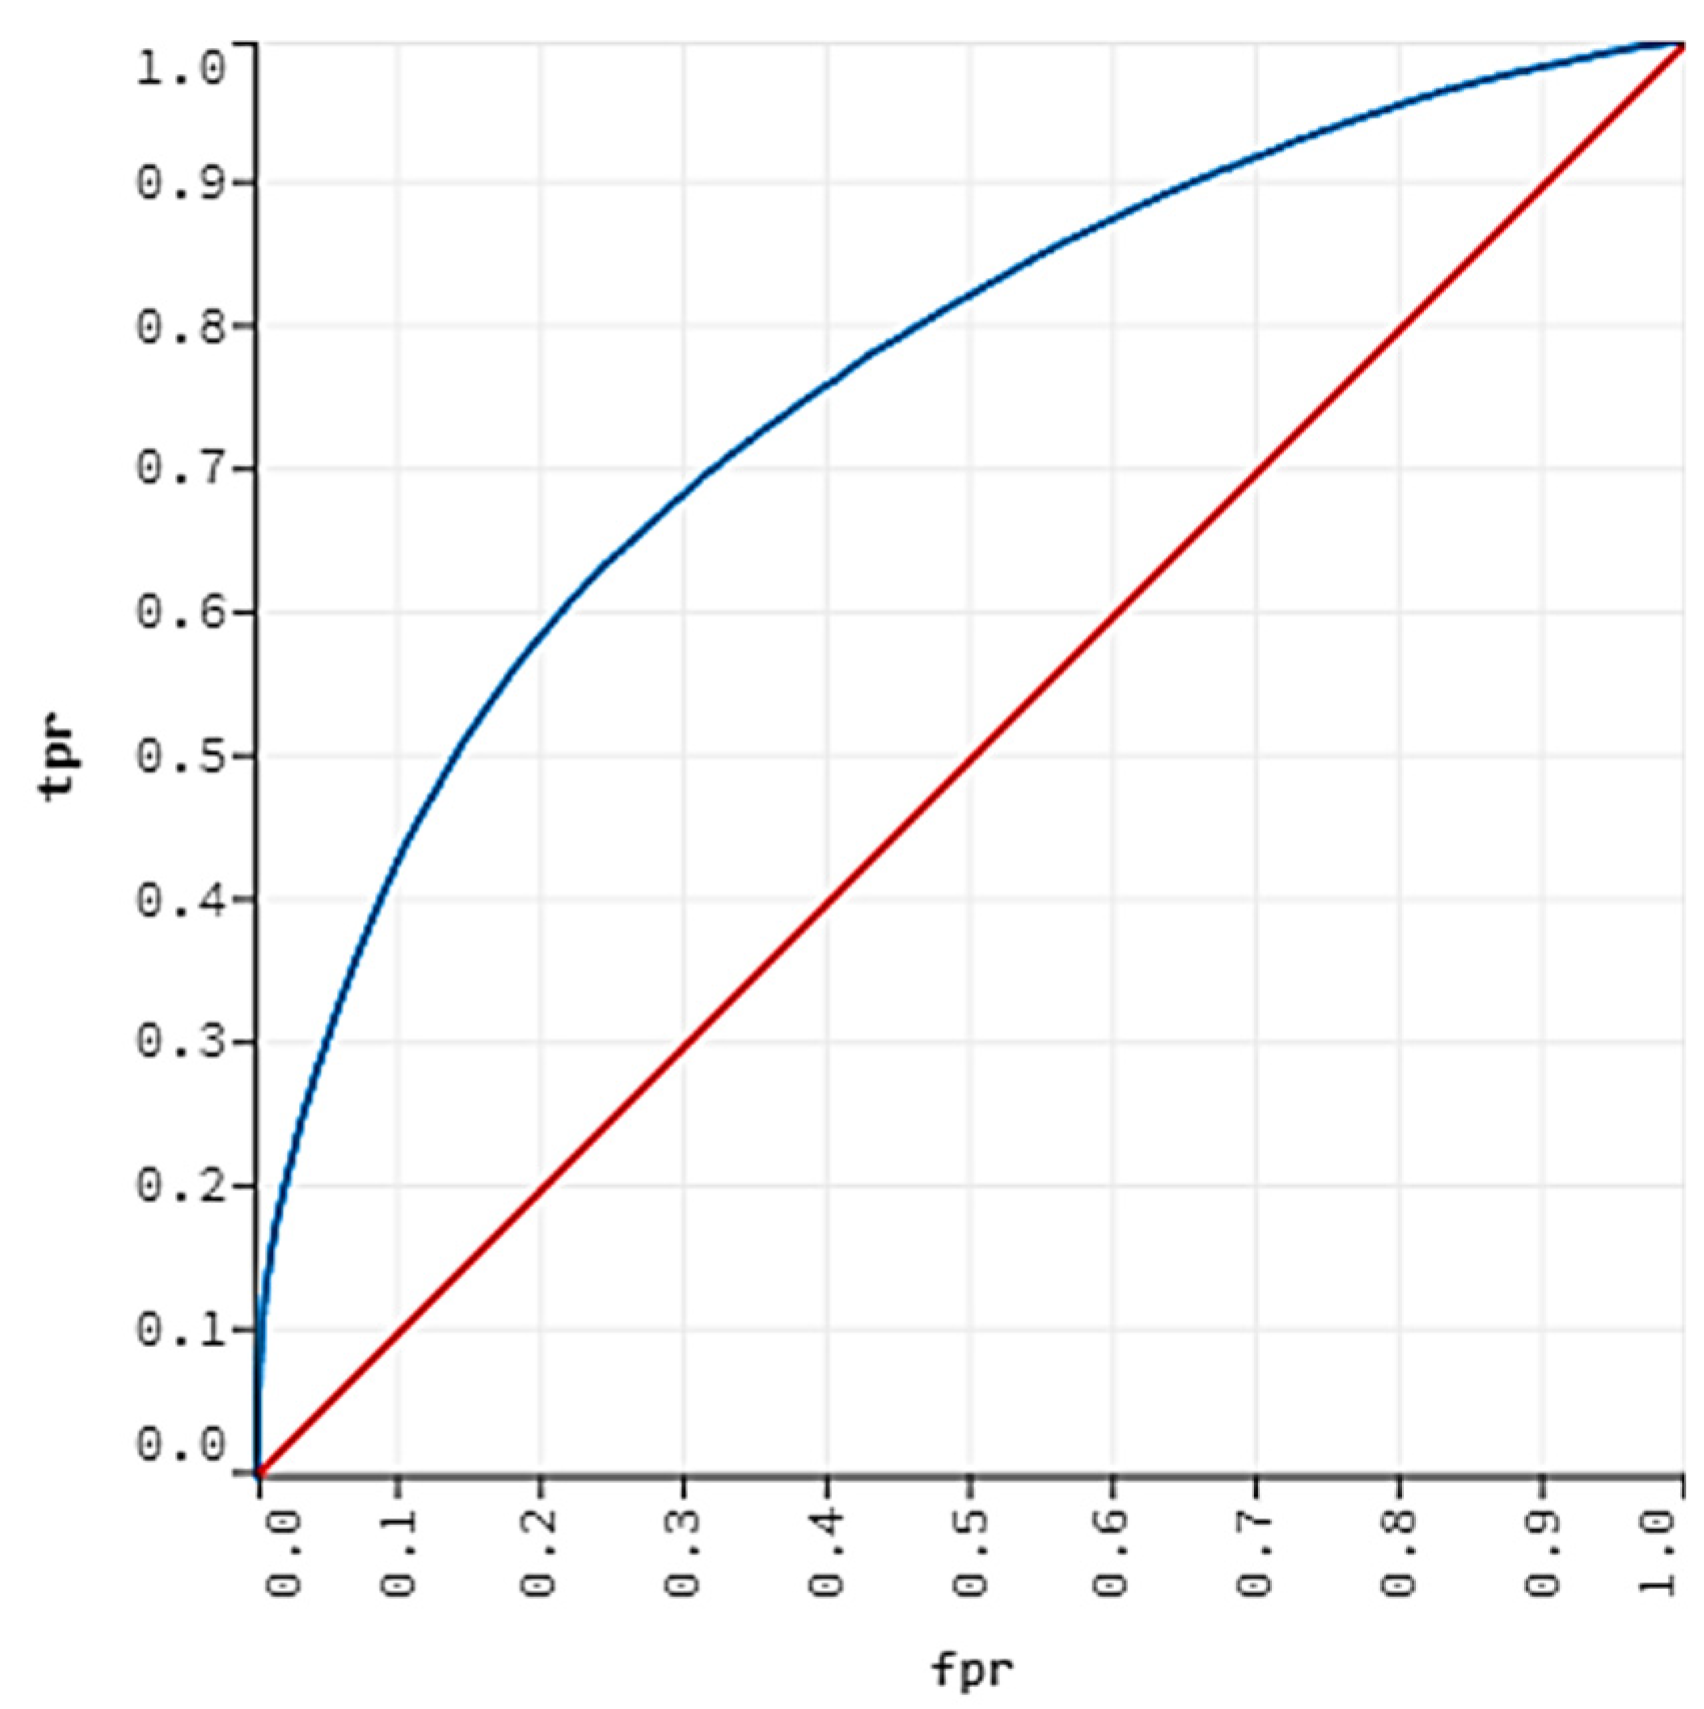
The LightGBM returns the highest testing AUC at 75.91%. We pick the GBM with an AUC at 75.58% as the best model for the prediction of preterm birth because it returns a slightly higher sensitivity (TPR) at 64.82% while maintaining the specificity at a comparable rate (73.01%) with LightGBM (73.93%). Figure 5 shows the validation ROC curve for the GBM with an AUC of 75.58%.
4.3. Comparison with Other Studies
There are few similar studies that used high-dimensional datasets in their studies. Weber, Darmstadt, Gruber, Foeller, Carmichael, Stevenson and Shaw [25] developed their model on a high dimensional dataset with 1000 initial features and 2.7 million observations. However, they developed their predictive model for the early spontaneous preterm birth, which occurred at a much lower rate of 1.02% compared to the singleton preterm deliveries at 7.63% in our study. Another study by Alleman, Smith, Byers, Bedell, Ryckman, Murray and Borowski [24] had the closest setup in terms of developing the predictive model for singleton pregnancies but has a smaller dataset compared to our study.
Table 4 compares the performance of our best GBM with the most relevant preterm birth studies. The criteria for inclusion of a paper were that it had to (1) use data with a large sample size that includes demographical information as predictors, or (2) it has used machine learning techniques for building a predictive model for preterm birth. We report each study’s sample size, the prevalence of the positive class, test AUC, sensitivity, and specificity. As shown in Table 4, the best performance of past studies for the AUC was 72% by Goodwin, et al. [49] on a relatively small population. Alleman, Smith, Byers, Bedell, Ryckman, Murray and Borowski [24] only reported the training AUC at 69.5%. Weber, Darmstadt, Gruber, Foeller, Carmichael, Stevenson and Shaw [25] reported 67% AUC for a large cohort study. Our best GBM model outperforms all of these models by improving the AUC to 75.58% for the largest population size. This is a more than 5%, 9%, and 13% improvement in AUC compared to the work of Goodwin, Iannacchione, Hammond, Crockett, Maher and Schlitz [49], Alleman, Smith, Byers, Bedell, Ryckman, Murray and Borowski [24] and Weber, Darmstadt, Gruber, Foeller, Carmichael, Stevenson and Shaw [25], respectively.
We also improved the sensitivity for preterm birth prediction compared to Weber, Darmstadt, Gruber, Foeller, Carmichael, Stevenson and Shaw [25], which has the most comparable population size to our study. Our model correctly identifies 2.82% more of the actual preterm births compared to Weber, Darmstadt, Gruber, Foeller, Carmichael, Stevenson and Shaw [25] and outperforms the other models. The improvement in the combined AUC, sensitivity, and accuracy stems from pre-processing steps that remove anomaly and noise removal, regularization methods, an optimized set of hyperparameters, and the superior ability of the GBM algorithms in the extraction of high-level features in the data.
4.4. Interpretations
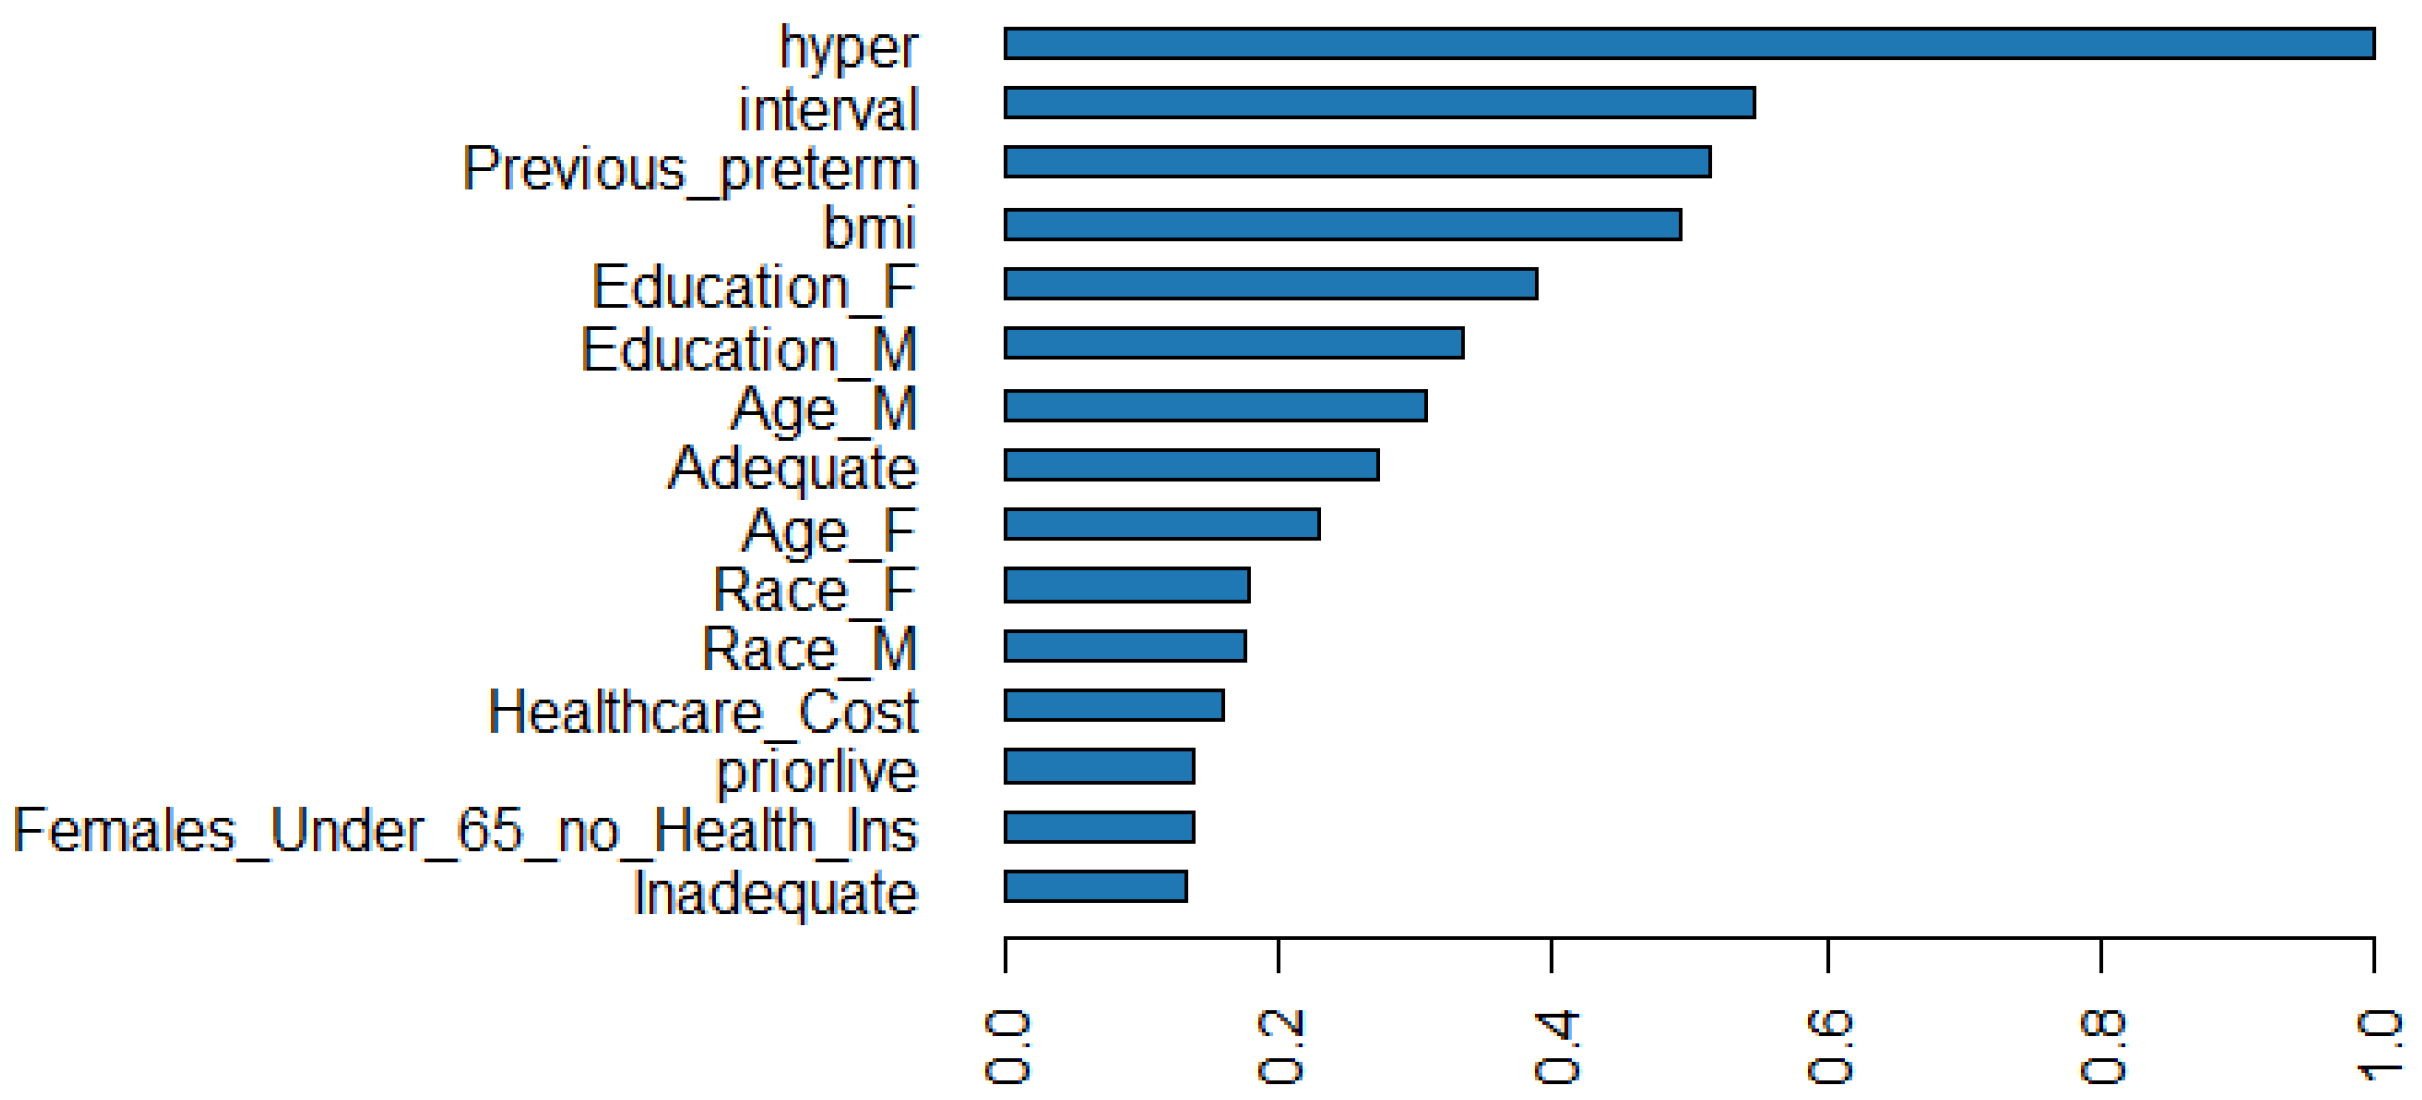
Figure 6 shows the scale importance of the top 15 variables in predicting preterm birth in the obstetric population. The relative importance, scaled importance, and scaled percentage importance of these variables are also shown in Table 5. Hypertension (“hyper”), interval since last live birth (“interval”), and history of PTB (“Previous_preterm”) are the most important predictors of preterm birth that can respectively explain 10.92, 5.98, and 5.63% of the predictive power. Mothers’ pre-pregnancy BMI (“bmi”) is also a significant predictor of preterm birth.
The outcomes in Table 5 show this interesting result that race has less relative importance when considering factors like parents’ education, age, and adequacy of care during pregnancy. The predictive power of a parent’s race is 3.87%, while education explains 7.89% of the power.
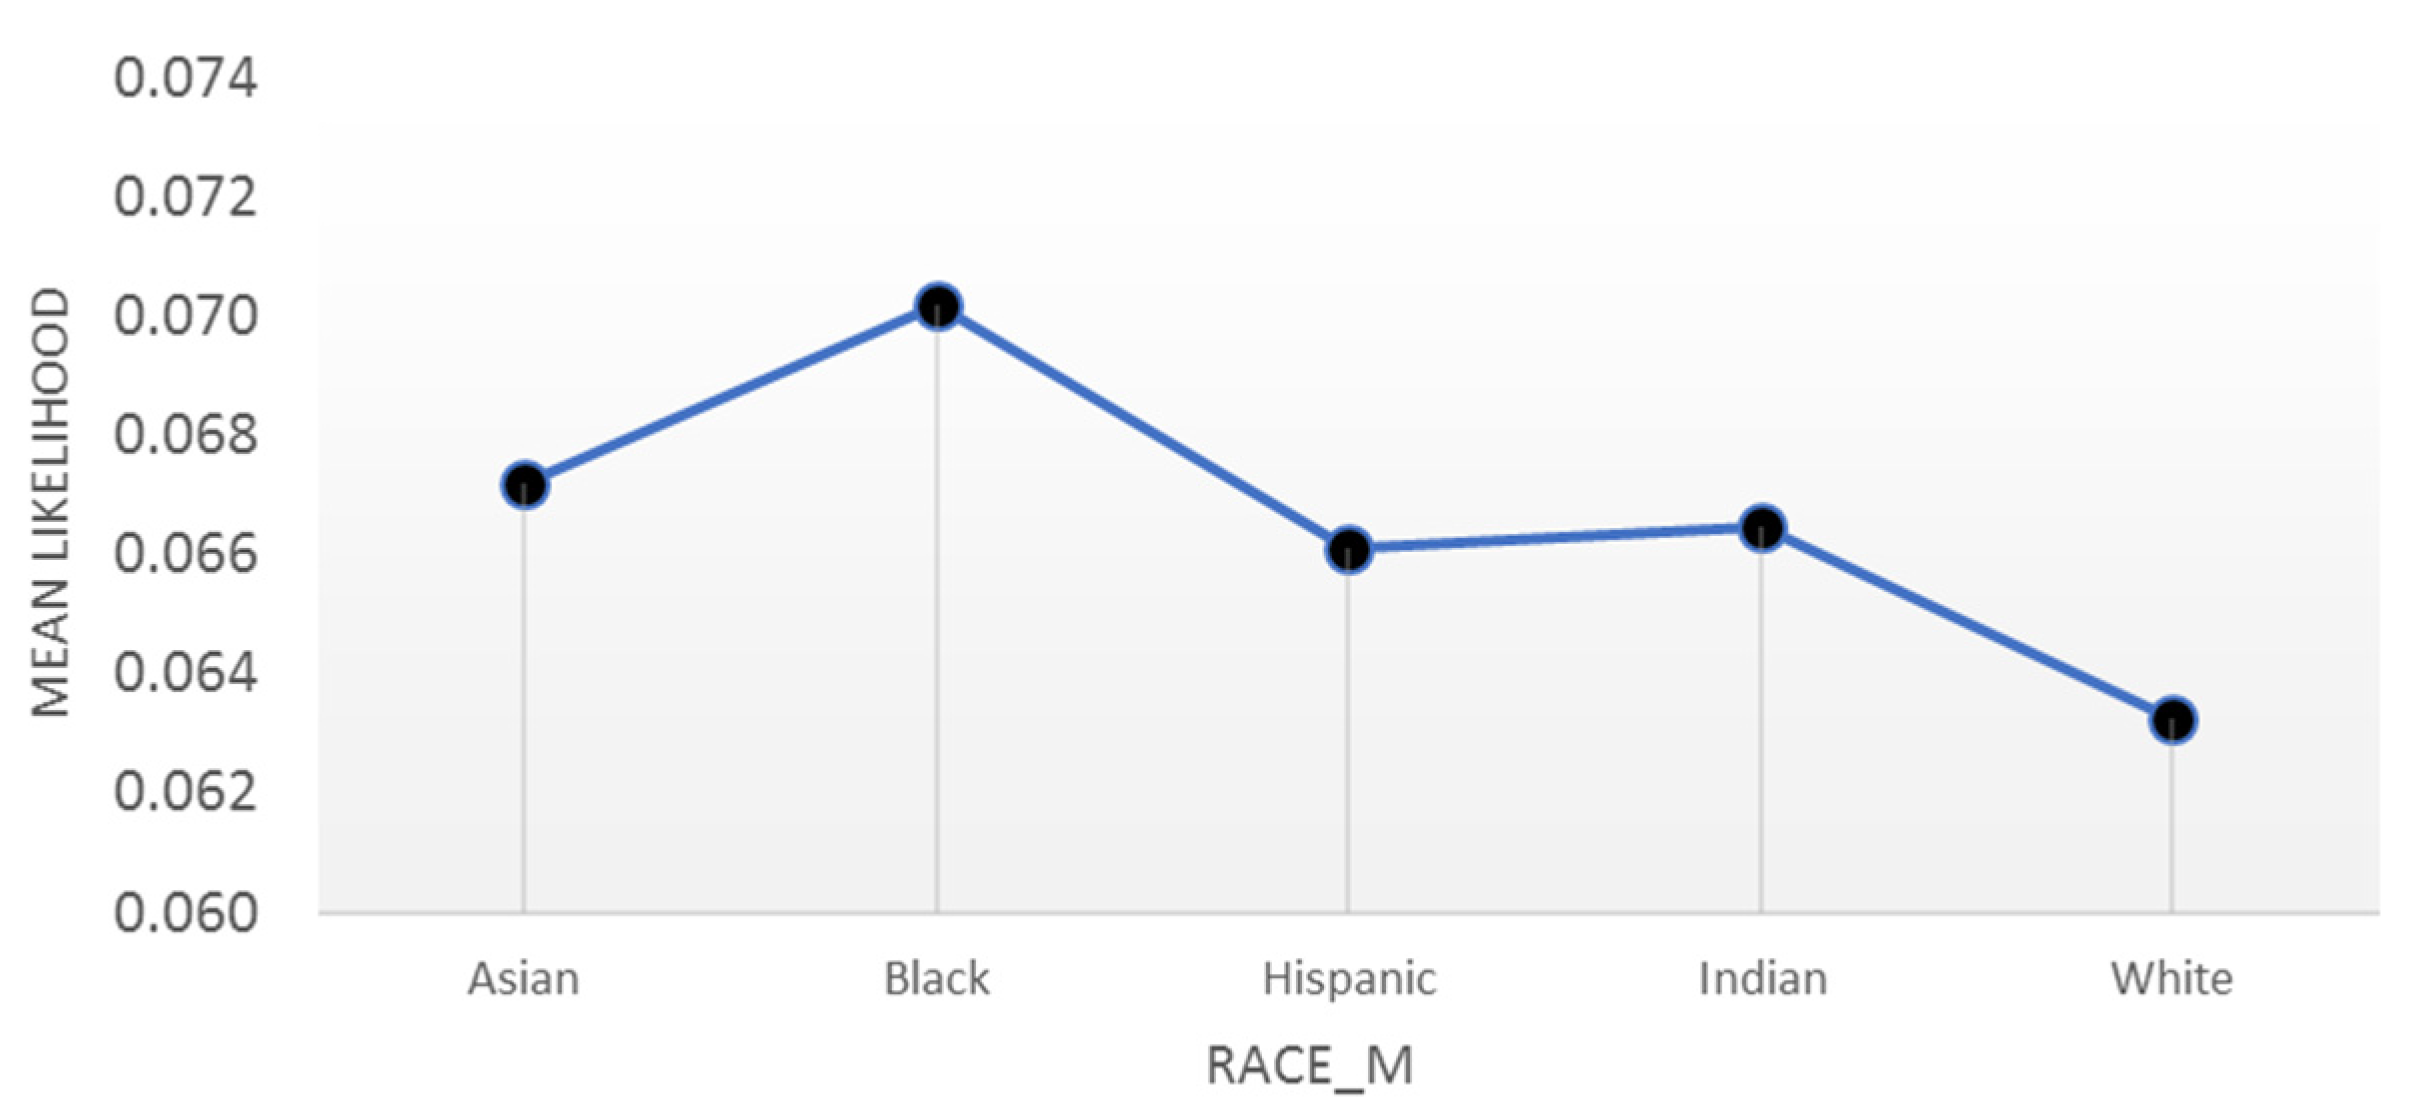
Building the model on a high-dimensional dataset that is representative of almost all the deliveries in the U.S. indicates that the level of parent education is a more important predictor than demographic characteristics like race. If considered as the single explanatory variable, race is a significant predictor of both preterm birth and infant mortality, where African American mothers have consistently been at a higher risk of preterm delivery [19,51]. In 2016, 10.88% of Black singleton pregnancies resulted in a preterm baby versus 7.11% for White mothers. Our results in Figure 7 show that this probability is 7.02% (p-Value < 0.001) for Black versus 6.32% (p-Value < 0.001) for White mothers when we account for the (average) effect of all factors such as education and age of parents, and adequacy of care during pregnancy in each class. A partial dependence plot shows the marginal ‘effect’ of a variable on the response—the probability of preterm birth—while accounting for the effect of other variables.
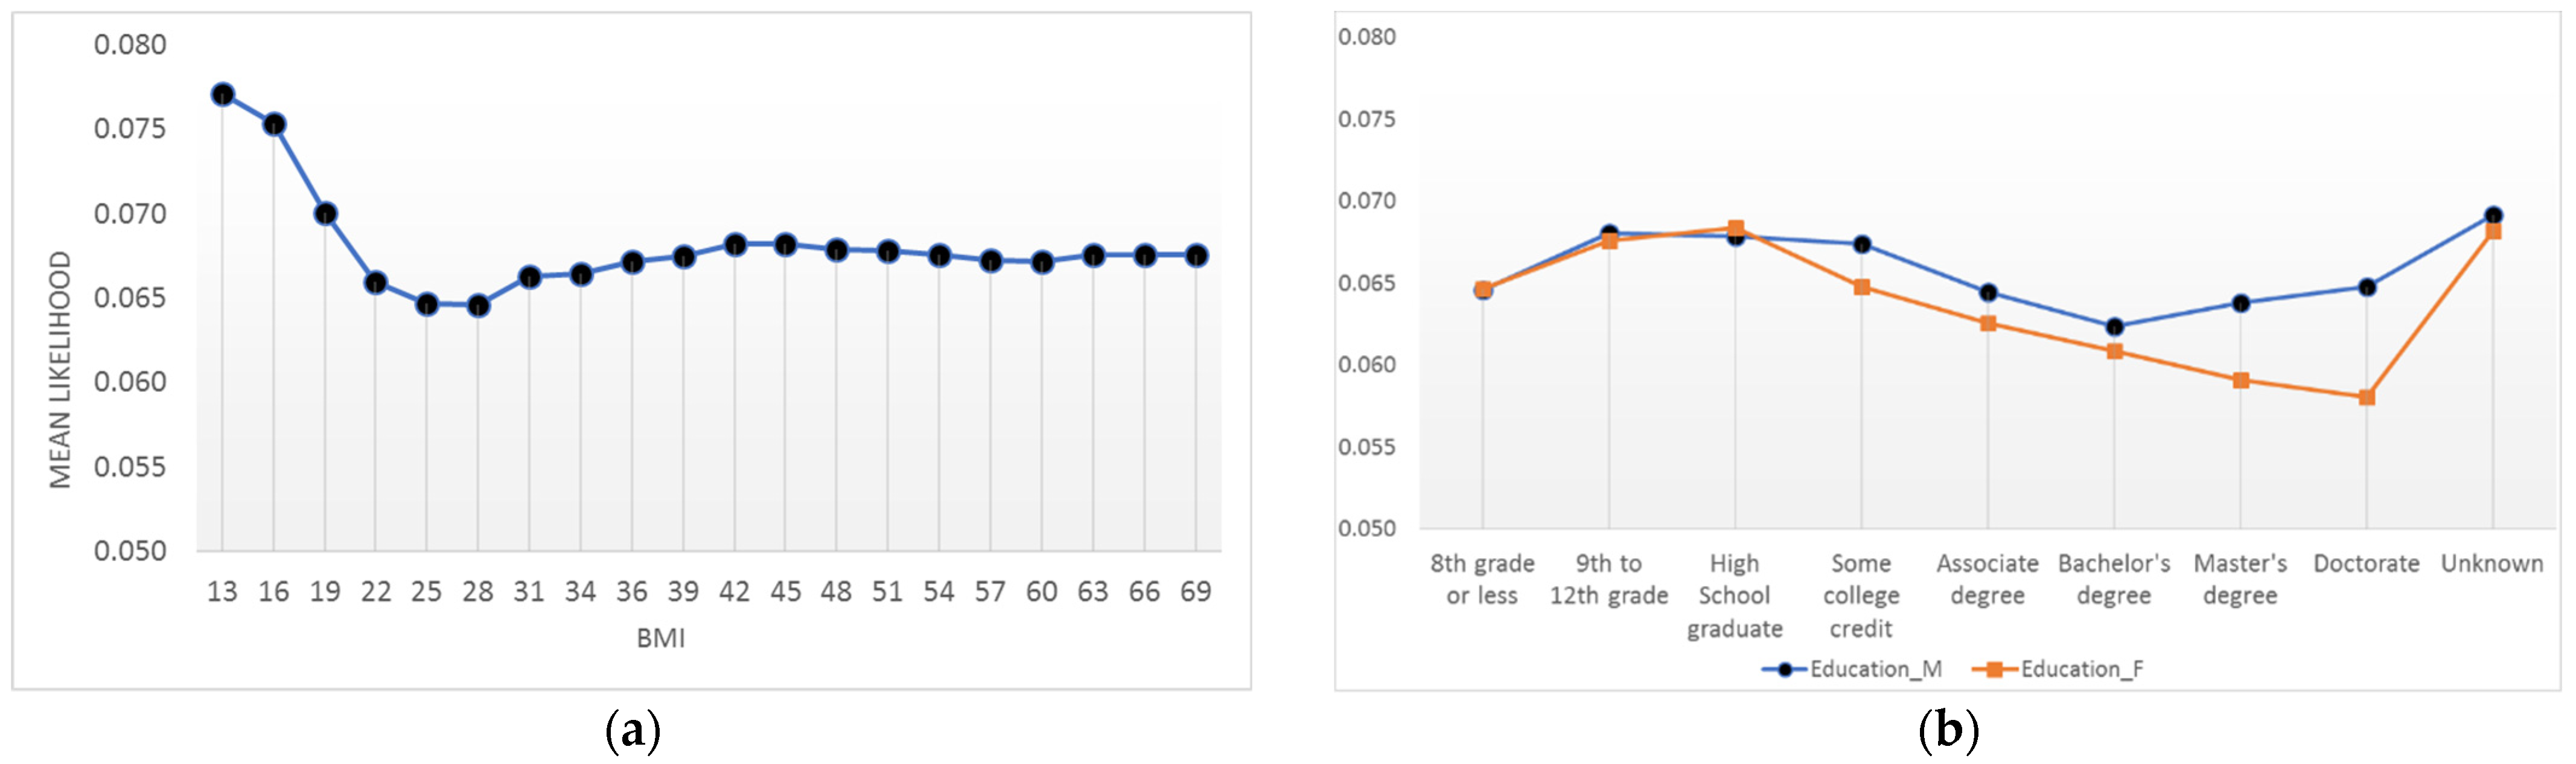
Figure 8 shows two examples of partial dependence plots (PDP). Figure 8a shows the relationship between a mother’s BMI and the probability of preterm delivery. The PDP shows that mothers with very low BMI—less than 19—are at higher risk of delivering a preterm baby. Figure 8b shows the relationship between the parent’s education and the probability of preterm birth. The probability of having a preterm infant for fathers decreases as their level of education increases. However, mothers with a bachelor’s degree are the least likely group to have a preterm baby (6.24% with p-value < 0.001), and the probability increases for any degree more or less than that. The graph also shows an important insight into the interpretation of missing values. A missing value in the education of a father or mother carries an important information showing that the probability of preterm delivery for these types of observations is the highest (6.92% with p-value < 0.001) compared to other groups. Supplementary Materials include the PDP for three more variables.
5. Discussion
In this study, we deployed statistical and machine learning techniques to first build a predictive model and then extract the risk factors of preterm birth (PTB) that are present during the early stages of pregnancy. This study is novel in that the application of ML techniques to a large cohort increases the generalizability of the risk factors. We included both nulliparous and multiparous mothers, spontaneous and indicated preterm birth, but excluded multifetal pregnancies that also increase the generalizability of our PTB prediction model. We reported the variable importance and partial dependence plots for the first time in the study of PTB.
The reported metrics indicate that our best GBM model improves the performance of preterm prediction compared to the similar works shown in Table 4 that combined maternal characteristics with important biological markers like serum analytes [24,49]. We obtained better results in AUC, sensitivity, and accuracy by (1) implementing the pre-processing steps that remove anomaly and noise removal, (2) optimizing the set of hyperparameters, and (3) applying the superior ability of the GBM algorithms in the extraction of high-level features in the data.
One of the major findings of this study is that the importance of race in predicting preterm birth can be explained when both individual risk factors such as interval since live birth, education of parents, and whether the person received adequate care during pregnancy, and their interactions are added to the model. This analytical finding is consistent with the theory of Lifecourse for addressing the racial disparities in the preterm birth outcomes [52,53,54]. The theory of Lifecourse emphasizes the socioeconomic factors as the main determinants of health that can result in a positive shift in the long-term individual’s health trajectory.
Hypertension is the most important predictor of preterm birth in a large cohort study, where 10.92 percent of the predictive power is attributed to this variable. The relative importance of hypertension is partly because of the deliveries that are scheduled preterm to prevent further complications in the pregnancy, especially when the placenta is not providing enough nutrients and oxygen to the baby [55]. The other important finding of this paper is that history of a previous PTB is not the most important variable in the prediction of PTB and it can only explain 5.63 percent of the predictive power. This finding can be explained in two ways. First, a history of preterm is useful only when the mother had a previous pregnancy. Second, the frequency of hypertension among the preterm population is almost two times the population of those with a history of a PTB in singleton pregnancies. In 2016, the number of singleton pregnancies that resulted in preterm birth was 290,584. Among this population, 56,768 were hypertension positive, while a much smaller group—28,501—had a history of PTB.
The results of our GBM model agree with the findings of previous studies. The variables like hypertension (“hyper”), interval since last live birth (“interval”), and history of PTB (“Previous_preterm”) are among the most important predictors of a preterm birth, which is consistent with past studies [8,37]. The variable importance plot (VIP) reveals a novel and insightful finding compared to the previous studies. While the plot shows that the variables like a previous preterm are important predictors for preterm birth, it attributes larger relative importance to factors like hypertension or interval since last live birth in the prediction of preterm in the general obstetric population. This new finding can be explained by the limitation of traditional studies. Logistic regression models have no direct way to provide variable importance plots. This capability of the DTs provides insights about the variables that can explain a larger portion of the AUC. The new hierarchy of the important variables in the prediction of PTB can address a gap in literature where already known risk factors cannot predict many actual preterm deliveries.
This study contributes to the literature in several ways. First, the results are generalizable to the US population. Past studies lacked generalizability for different reasons [24,25]. For example, some studies used a majority White population or their sample was from one geographical location to assess the PTB risk factors [24,26]. A major strength of this study was the application of data science on a population-based linked singleton births in the U.S. to address this gap. However, using the U.S. birth dataset had its own challenges like the existence of anomalous observations and random errors. To mitigate this problem, we applied one of the advanced machine learning techniques, auto-encoders with deep neural nets, to perform data cleaning and preparation. This study also contributes to the literature of preterm birth study by providing important insights by using advanced visualization techniques. The initial visualization of variables like the mother’s age versus gestational age (see Figure 3b) shows a clear relationship between these two variables in which the risk of a preterm delivery is the highest at the extremes of maternal age. These findings match the results of known concepts available from decades of research on PTB analyses [20,56]. Partial dependence plots (PDP) are the other insightful tool that we used in this analysis. The PDPs, like the mother’s BMI in Figure 8, show that the extremes of pre-pregnancy BMI is associated with increased rates of PTB, which is compatible with the finding of other studies [37,57]. The PDP provides a better estimation of this association compared to previous studies [58] because it takes the (average) interdependent effect of other variables into account. The PDPs also show that the relationship between parent’s education and PTB risk is not linear. The risk of delivering a PTB baby is the lowest for mothers with a Bachelor’s degree and increases at both ends of the education level as discussed by other studies [59,60,61].
There is still significant room for improving the precise study of preterm birth in large cohort studies. Positive predictive value (precision) of the past studies varied between 17 to 30 percent, depending on the sample used in the analysis [36,62]. Our model shows a maximum precision of 28.13% in a national-level dataset, which approaches the best practices of similar studies. However, this metric is still relatively low. This low precision is due to the lack of knowledge regarding the cause(s) of PTB and the absence of important predictors of preterm birth (e.g., cervical length) in the CDC dataset [36]. Our study was subject to other limitations. Despite using the obstetric estimation for categorization of the PTB, there remains potential for errors [63]. However, we used large samples and multifold cross-validations that minimize the effect of the incorrect categorization. In addition, some of the biomarkers like cervical length or fetal fibronectin that are routinely measured in the obstetrical screenings were unavailable in the U.S. linked birth datasets. The association of these biomarkers and their interactions on the probability of a PTB can be assessed in future research.
6. Conclusions
In this article, we used state-of-the-art statistical and machine learning techniques to enhance our understanding of the influential risk factors of preterm birth (PTB). We used the high-dimensional dataset of U.S. birth records in 2016 and combined it with two other major area-level datasets to increase the number of potential predictors of PTB that are present in early pregnancy—before the second trimester. Analyzing national-level data with machine learning techniques increases the generalizability of the risk factors in the obstetric population. Test AUC and sensitivity of our predictive models exceed the highest test accuracy reported by previous studies. Performing pre-processing steps, removing anomalies and random errors, tuning hyperparameters, and employing the boosting techniques were the key factors to attain such performance.
Given the high sensitivity of our model compared to other studies, it can be deployed for early detection of at-risk pregnancies as an important tool for better utilizing the healthcare services among resource-constrained and vulnerable populations. We also showed that socioeconomic factors such as parent education are more important than generally known factors such as race in the prediction of PTB. This finding is significant evidence for theories like Lifecourse, which postulate that the main determinants of a health trajectory are the social scaffolding that addresses the upstream roots of health. However, much remains to be understood about the preterm birth risk factors and the relative impact of interventions that can control these factors.
Supplementary Materials
The following supporting information can be downloaded at: https://github.com/ebrahimvandi/preterm_prediction (accessed on 20 June 2022).
Author Contributions
Conceptualization, A.E. and N.H.; methodology, A.E., N.H. and Z.J.K.; software, A.E.; validation, A.E.; formal analysis, A.E. and N.H.; investigation, A.E.; resources, A.E. and N.H.; data curation, A.E.; writing—original draft preparation, A.E.; writing—review and editing, A.E. and N.H.; visualization, A.E.; supervision, N.H. and Z.J.K.; project administration, N.H. All authors have read and agreed to the published version of the manuscript.
Funding
This research received no external funding.
Institutional Review Board Statement
Not applicable. The medical records are collected from a retrospective dataset. All the birth records are fully anonymized by the CDC. Therefore, an institutional review board was not needed.
Informed Consent Statement
Not applicable.
Data Availability Statement
The datasets analyzed during the current study are available in the three different repositories. The first dataset, the 2016 Period Linked Birth-Infant Death Data Files, can be accessed via this link. To obtain the same dataset with geographical identifiers, researchers should submit a formal request to the National Center for Health Statistics. The files are in the plain text format. Due to the large size, data dictionaries should be used to read these files. These dictionaries can be found on National Bureau of Economic Research website. The second dataset comprised of the 2016 CHR CSV Analytic Data and County Health Ranking Data is publicly available via this link. The third dataset, the Area Health Resources file, is publicly available to researchers via this link. The historical data can also be accessed by sending an email to [email protected]. The codes for preparing the data files are uploaded on my personal GitHub. The processed files for the second and third datasets are also uploaded in the same repository.
Conflicts of Interest
The authors declare no conflict of interest.
References
- Blencowe, H.; Cousens, S.; Chou, D.; Oestergaard, M.; Say, L.; Moller, A.-B.; Kinney, M.; Lawn, J.; the Born Too Soon Preterm Birth Action Group. Born Too Soon: The global epidemiology of 15 million preterm births. Reprod. Health 2013, 10 (Suppl. S1), S2. [Google Scholar] [CrossRef] [PubMed] [Green Version]
- Mathews, T.J.; MacDorman, M.F.; Menacker, F. Infant Mortality Statistics from the 2013 Period: Linked Birth/Infant Death Data Set. Natl. Vital Stat. 2015, 64, 1–30. [Google Scholar]
- Ebrahimvandi, A.; Hosseinichimeh, N.; Iams, J. Understanding State-Level Variations in the US Infant Mortality: 2000 to 2015. Am. J. Perinatol. 2018, 36, 1271–1277. [Google Scholar] [CrossRef] [Green Version]
- Butler, A.S.; Behrman, R.E. Preterm Birth: Causes, Consequences, and Prevention; National Academies Press: Washington, DC, USA, 2007. [Google Scholar]
- Saigal, S.; Doyle, L.W. An overview of mortality and sequelae of preterm birth from infancy to adulthood. Lancet 2008, 371, 261–269. [Google Scholar] [CrossRef]
- Iams, J.D. Identification of candidates for progesterone: Why, who, how, and when? Obstet. Gynecol. 2014, 123, 1317–1326. [Google Scholar] [CrossRef] [Green Version]
- Katz, K.S.; Blake, S.M.; Milligan, R.A.; Sharps, P.W.; White, D.B.; Rodan, M.F.; Rossi, M.; Murray, K.B. The design, implementation and acceptability of an integrated intervention to address multiple behavioral and psychosocial risk factors among pregnant African American women. BMC Pregnancy Childbirth 2008, 8, 22. [Google Scholar] [CrossRef] [Green Version]
- Goldenberg, R.L.; Culhane, J.F.; Iams, J.D.; Romero, R. Epidemiology and causes of preterm birth. Lancet 2008, 371, 75–84. [Google Scholar] [CrossRef]
- Singh, N.; Bonney, E.; McElrath, T.; Lamont, R.F.; Shennan, A.; Gibbons, D.; Guderman, J.; Stener, J.; Helmer, H.; Rajl, H. Prevention of preterm birth: Proactive and reactive clinical practice-are we on the right track? Placenta 2020, 98, 6–12. [Google Scholar] [CrossRef]
- Hooft, J.V.; Duffy, J.M.N.; Daly, M.; Williamson, P.R.; Meher, S.; Thom, E.; Saade, G.R.; Alfirevic, Z.; Mol, B.W.J.; Khan, K.S. A Core Outcome Set for Evaluation of Interventions to Prevent Preterm Birth. Obstet. Gynecol. 2016, 127, 49–58. [Google Scholar] [CrossRef]
- Hosseinichimeh, N.; Kim, H.; Ebrahimvandi, A.; Iams, J.; Andersen, D.J.S.R.; Science, B. Using a Stakeholder Analysis to Improve Systems Modelling of Health Issues: The Impact of Progesterone Therapy on Infant Mortality in Ohio. Syst. Res. Behav. Sci. 2019, 36, 476–493. [Google Scholar] [CrossRef]
- Darabi, N.; Ebrahimvandi, A.; Hosseinichimeh, N.; Triantis, K. A DEA evaluation of US States’ healthcare systems in terms of their birth outcomes. Expert Syst. Appl. 2021, 182, 115278. [Google Scholar] [CrossRef]
- Boots, A.B.; Sanchez-Ramos, L.; Bowers, D.M.; Kaunitz, A.M.; Zamora, J.; Schlattmann, P. The short-term prediction of preterm birth: A systematic review and diagnostic metaanalysis. Am. J. Obstet. Gynecol. 2014, 210, 54.e1–54.e10. [Google Scholar] [CrossRef] [PubMed]
- Davey, M.-A.; Watson, L.; Rayner, J.A.; Rowlands, S. Risk-scoring systems for predicting preterm birth with the aim of reducing associated adverse outcomes. Cochrane Database Syst. Rev. 2015, 2015, CD004902. [Google Scholar] [CrossRef] [PubMed]
- Bhattacharya, S.; Raja, E.A.; Mirazo, E.R.; Campbell, D.M.; Lee, A.J.; Norman, J.E.; Bhattacharya, S. Inherited Predisposition to Spontaneous Preterm Delivery. Obstet. Gynecol. 2010, 115, 1125–1133. [Google Scholar] [CrossRef] [PubMed] [Green Version]
- Laughon, S.K.; Albert, P.S.; Leishear, K.; Mendola, P. The NICHD Consecutive Pregnancies Study: Recurrent preterm delivery by subtype. Am. J. Obstet. Gynecol. 2013, 210, 131.e1–131.e8. [Google Scholar] [CrossRef] [Green Version]
- Webb, D.A.; Mathew, L.; Culhane, J.F. Lessons learned from the Philadelphia Collaborative Preterm Prevention Project: The prevalence of risk factors and program participation rates among women in the intervention group. BMC Pregnancy Childbirth 2014, 14, 368. [Google Scholar] [CrossRef] [Green Version]
- Belaghi, R.A.; Beyene, J.; McDonald, S.D. Clinical risk models for preterm birth less than 28 weeks and less than 32 weeks of gestation using a large retrospective cohort. J. Perinatol. 2021, 41, 2173–2181. [Google Scholar] [CrossRef]
- Martin, J.A.; Hamilton, B.E.; Osterman, M.J.; Driscoll, A.K.; Drake, P. Births: Final Data for 2016; National Vital Statistics Reports: Hyattsville, MD, USA, 2018. [Google Scholar]
- Fuchs, F.; Monet, B.; Ducruet, T.; Chaillet, N.; Audibert, F. Effect of maternal age on the risk of preterm birth: A large cohort study. PLoS ONE 2018, 13, e0191002. [Google Scholar] [CrossRef] [Green Version]
- Newman, R.; Goldenberg, R.; Iams, J.; Meis, P.; Mercer, B.; Moawad, A.; Thom, E.; Miodovnik, M.; Caritis, S.; Dombrowski, M. Preterm prediction study: Comparison of the cervical score and Bishop score for prediction of spontaneous preterm delivery. Obstet. Gynecol. 2008, 112, 508. [Google Scholar] [CrossRef]
- Magee, L.; Von Dadelszen, P.; Chan, S.; Gafni, A.; Gruslin, A.; Helewa, M.; Hewson, S.; Kavuma, E.; Lee, S.; Logan, A. The control of hypertension in pregnancy study pilot trial. BJOG Int. J. Obstet. Gynaecol. 2007, 114, 770-e20. [Google Scholar] [CrossRef]
- Friedman, J.H. Greedy function approximation: A gradient boosting machine. Ann. Stat. 2001, 29, 1189–1232. [Google Scholar] [CrossRef]
- Alleman, B.W.; Smith, A.R.; Byers, H.M.; Bedell, B.; Ryckman, K.K.; Murray, J.C.; Borowski, K.S. A proposed method to predict preterm birth using clinical data, standard maternal serum screening, and cholesterol. Am. J. Obstet. Gynecol. 2013, 208, 472.e1–472.e11. [Google Scholar] [CrossRef] [PubMed] [Green Version]
- Weber, A.; Darmstadt, G.L.; Gruber, S.; Foeller, M.E.; Carmichael, S.L.; Stevenson, D.K.; Shaw, G.M. Application of machine-learning to predict early spontaneous preterm birth among nulliparous non-Hispanic black and white women. Ann. Epidemiol. 2018, 28, 783–789.e1. [Google Scholar] [CrossRef] [PubMed]
- Gao, C.; Osmundson, S.; Edwards, D.R.V.; Jackson, G.P.; Malin, B.A.; Chen, Y. Deep learning predicts extreme preterm birth from electronic health records. J. Biomed. Inform. 2019, 100, 103334. [Google Scholar] [CrossRef] [PubMed]
- Goodwin, L.; VanDyne, M.; Lin, S.; Talbert, S. Data mining issues and opportunities for building nursing knowledge. J. Biomed. Inform. 2003, 36, 379–388. [Google Scholar] [CrossRef] [Green Version]
- Woolery, L.K.; Grzymala-Busse, J. Machine Learning for an Expert System to Predict Preterm Birth Risk. J. Am. Med. Inform. Assoc. 1994, 1, 439–446. [Google Scholar] [CrossRef] [Green Version]
- Chen, H.-Y.; Chuang, C.-H.; Yang, Y.-J.; Wu, T.-P. Exploring the risk factors of preterm birth using data mining. Expert Syst. Appl. 2011, 38, 5384–5387. [Google Scholar] [CrossRef]
- Van Dyne, M.; Woolery, L.; Gryzmala-Busse, J.; Tsatsoulis, C. Using machine learning and expert systems to predict preterm delivery in pregnant women. In Proceedings of the Tenth Conference on Artificial Intelligence for Applications, San Antonia, TX, USA, 1–4 March 1994; pp. 344–350. [Google Scholar]
- Sun, Q.; Zou, X.; Yan, Y.; Zhang, H.; Wang, S.; Gao, Y.; Liu, H.; Liu, S.; Lu, J.; Yang, Y.; et al. Machine Learning-Based Prediction Model of Preterm Birth Using Electronic Health Record. J. Health Eng. 2022, 2022, 9635526. [Google Scholar] [CrossRef]
- Kim, J.-I.; Lee, J.Y. Systematic Review of Prediction Models for Preterm Birth Using CHARMS. Biol. Res. Nurs. 2021, 23, 708–722. [Google Scholar] [CrossRef]
- Pereira, G.; Regan, A.K.; Wong, K.; Tessema, G.A. Gestational age as a predictor for subsequent preterm birth in New South Wales, Australia. BMC Pregnancy Childbirth 2021, 21, 607. [Google Scholar] [CrossRef]
- Bertini, A.; Salas, R.; Chabert, S.; Sobrevia, L.; Pardo, F. Using Machine Learning to Predict Complications in Pregnancy: A Systematic Review. Front. Bioeng. Biotechnol. 2022, 9, 780389. [Google Scholar] [CrossRef] [PubMed]
- Nelson, D.B.; McIntire, D.D.; McDonald, J.; Gard, J.; Turrichi, P.; Leveno, K.J. 17-alpha Hydroxyprogesterone caproate did not reduce the rate of recurrent preterm birth in a prospective cohort study. Am. J. Obstet. Gynecol. 2017, 216, 600.e1–600.e9. [Google Scholar] [CrossRef] [PubMed]
- Robinson, J.N.; Norwitz, E. Preterm Birth: Risk Factors, Interventions for Risk Reduction, and Maternal Prognosis. Available online: https://www.uptodate.com/contents/preterm-birth-risk-factors-interventions-for-risk-reduction-and-maternal-prognosis (accessed on 2 March 2019).
- Iams, J.D. Prevention of preterm parturition. N. Engl. J. Med. 2014, 370, 254–261. [Google Scholar] [CrossRef] [PubMed]
- He, J.-R.; Ramakrishnan, R.; Lai, Y.-M.; Li, W.-D.; Zhao, X.; Hu, Y.; Chen, N.-N.; Hu, F.; Lu, J.-H.; Wei, X.-L.; et al. Predictions of Preterm Birth from Early Pregnancy Characteristics: Born in Guangzhou Cohort Study. J. Clin. Med. 2018, 7, 185. [Google Scholar] [CrossRef] [PubMed] [Green Version]
- Centers for Disease Control and Prevention (CDC). Linked Birth/Infant Death Records 2007–2019. Available online: https://wonder.cdc.gov/lbd-current.html (accessed on 2 March 2019).
- Bengio, Y. Deep learning of representations: Looking forward. In Proceedings of the International Conference on Statistical Language and Speech Processing, Tarragona, Spain, 29–31 July 2013; pp. 1–37. [Google Scholar]
- Goldstein, M.; Uchida, S. A Comparative Evaluation of Unsupervised Anomaly Detection Algorithms for Multivariate Data. PLoS ONE 2016, 11, e0152173. [Google Scholar] [CrossRef] [PubMed] [Green Version]
- Leng, Q.; Qi, H.; Miao, J.; Zhu, W.; Su, G. One-Class Classification with Extreme Learning Machine. Math. Probl. Eng. 2015, 2015, 412957. [Google Scholar] [CrossRef]
- Friedman, J.; Hastie, T.; Tibshirani, R. The Elements of Statistical Learning; Series in Statistics; Springer: New York, NY, USA, 2001; Volume 1. [Google Scholar]
- Tibshirani, R. Regression shrinkage and selection via the lasso. J. R. Stat. Soc. Ser. B (Methodol.) 1996, 58, 267–288. [Google Scholar] [CrossRef]
- Breiman, L. Random forests. Mach. Learn. 2001, 45, 5–32. [Google Scholar] [CrossRef] [Green Version]
- Chen, T.; Guestrin, C. Xgboost: A scalable tree boosting system. In Proceedings of the 22nd ACM Sigkdd International Conference on Knowledge Discovery and Data Mining, San Francisco, CA, USA, 13–17 August 2016; pp. 785–794. [Google Scholar]
- Schapire, R.E.; Freund, Y. Boosting: Foundations and algorithms. Kybernetes 2013, 42, 164–166. [Google Scholar] [CrossRef]
- Ke, G.; Meng, Q.; Finley, T.; Wang, T.; Chen, W.; Ma, W.; Ye, Q.; Liu, T.-Y. Lightgbm: A highly efficient gradient boosting decision tree. In Proceedings of the Advances in Neural Information Processing Systems, Long Beach, CA, USA, 4–9 December 2017; pp. 3146–3154. [Google Scholar]
- Goodwin, L.K.; Iannacchione, M.A.; Hammond, W.E.; Crockett, P.; Maher, S.; Schlitz, K. Data Mining Methods Find Demographic Predictors of Preterm Birth. Nurs. Res. 2001, 50, 340–345. [Google Scholar] [CrossRef]
- Vovsha, I.; Rajan, A.; Salleb-Aouissi, A.; Raja, A.; Radeva, A.; Diab, H.; Tomar, A.; Wapner, R. Predicting preterm birth is not elusive: Machine learning paves the way to individual wellness. In Proceedings of the 2014 AAAI Spring Symposium Series, Palo Alto, CA, USA, 24–26 March 2014. [Google Scholar]
- Meis, P.J.; Goldenberg, R.L.; Mercer, B.M.; Iams, J.D.; Moawad, A.H.; Miodovnik, M.; Menard, M.; Caritis, S.; Thurnau, G.R.; Bottoms, S.F.; et al. The preterm prediction study: Risk factors for indicated preterm births. Am. J. Obstet. Gynecol. 1998, 178, 562–567. [Google Scholar] [CrossRef]
- Manuck, T.A. Racial and ethnic differences in preterm birth: A complex, multifactorial problem. Semin. Perinatol. 2017, 41, 511–518. [Google Scholar] [CrossRef]
- Lu, M.C.; Kotelchuck, M.; Hogan, V.; Jones, L.; Wright, K.; Halfon, N. Closing the Black-White gap in birth outcomes: A life-course approach. Ethn. Dis. 2010, 20 (Suppl. S2), 62–76. [Google Scholar]
- Wadhwa, P.D.; Entringer, S.; Buss, C.; Lu, M.C. The Contribution of Maternal Stress to Preterm Birth: Issues and Considerations. Clin. Perinatol. 2011, 38, 351–384. [Google Scholar] [CrossRef] [PubMed] [Green Version]
- Krishna, U.; Bhalerao, S. Placental Insufficiency and Fetal Growth Restriction. J. Obstet. Gynecol. India 2011, 61, 505–511. [Google Scholar] [CrossRef] [Green Version]
- Fraser, A.M.; Brockert, J.E.; Ward, R. Association of Young Maternal Age with Adverse Reproductive Outcomes. N. Engl. J. Med. 1995, 332, 1113–1118. [Google Scholar] [CrossRef]
- Hendler, I.; Goldenberg, R.L.; Mercer, B.M.; Iams, J.D.; Meis, P.J.; Moawad, A.H.; MacPherson, C.A.; Caritis, S.N.; Miodovnik, M.; Menard, K.M.; et al. The Preterm Prediction study: Association between maternal body mass index and spontaneous and indicated preterm birth. Am. J. Obstet. Gynecol. 2005, 192, 882–886. [Google Scholar] [CrossRef] [Green Version]
- Honest, H.; Bachmann, L.M.; Ngai, C.; Gupta, J.K.; Kleijnen, J.; Khan, K.S. The accuracy of maternal anthropometry measurements as predictor for spontaneous preterm birth—A systematic review. Eur. J. Obstet. Gynecol. Reprod. Biol. 2005, 119, 11–20. [Google Scholar] [CrossRef]
- El-Sayed, A.M.; Galea, S. Temporal Changes in Socioeconomic Influences on Health: Maternal Education and Preterm Birth. Am. J. Public Health 2012, 102, 1715–1721. [Google Scholar] [CrossRef]
- Auger, N.; Abrahamowicz, M.; Park, A.L.; Wynant, W. Extreme maternal education and preterm birth: Time-to-event analysis of age and nativity-dependent risks. Ann. Epidemiol. 2013, 23, 1–6. [Google Scholar] [CrossRef]
- Luo, Z.-C.; Wilkins, R.; Kramer, M.S. Effect of neighbourhood income and maternal education on birth outcomes: A population-based study. Can. Med. Assoc. J. 2006, 174, 1415–1420. [Google Scholar] [CrossRef] [PubMed] [Green Version]
- Meertens, L.J.; Van Montfort, P.; Scheepers, H.C.; Van Kuijk, S.M.; Aardenburg, R.; Langenveld, J.; Van Dooren, I.M.; Zwaan, I.M.; Spaanderman, M.E.; Smits, L.J. Prediction models for the risk of spontaneous preterm birth based on maternal characteristics: A systematic review and independent external validation. Acta Obstet. Gynecol. Scand. 2018, 97, 907–920. [Google Scholar] [CrossRef] [PubMed]
- Martin, J.A.; Osterman, M.J.K.; Kirmeyer, S.E.; Gregory, E.C.W. Measuring Gestational Age in Vital Statistics Data: Transitioning to the Obstetric Estimate. Natl. Vital Stat. Rep. 2015, 64, 1–20. [Google Scholar] [PubMed]
Figure 1.
Histogram of Reconstruction. MSE for birth records after using autoencoders.

Figure 2.
Steps of data preparation.

Figure 3.
Data visualization for the kernel distribution of variables versus gestational age. (a) Gestational age vs. history of preterm birth; (b) gestational age distribution vs. age of the mother.
Figure 3.
Data visualization for the kernel distribution of variables versus gestational age. (a) Gestational age vs. history of preterm birth; (b) gestational age distribution vs. age of the mother.

Figure 4.
Correlation Plot.

Figure 5.
ROC curves for the GBM model.

Figure 6.
Variable Importance Plot.

Figure 7.
Partial dependence plot for the probability of a preterm based on the mother’s race.

Figure 8.
Partial dependence plot for BMI and parent’s education: (a) preterm delivery likelihood for different values of BMI; (b) preterm delivery likelihood for different levels of education.
Figure 8.
Partial dependence plot for BMI and parent’s education: (a) preterm delivery likelihood for different values of BMI; (b) preterm delivery likelihood for different levels of education.


Table 1.
The number of missing values in the dataset.
| Name | Number of Missing Values | Percent Missing |
|---|---|---|
| Father’s Age (Age_F) | 450,617 | 11.85 |
| Number of prior live births (priorlive) | 6608 | 0.17 |
| Number of prior dead births (priordead) | 13,552 | 0.36 |
| Number of daily cigarettes before pregnancy (cig_before) | 18,119 | 0.48 |
| Number of daily cigarettes during the first trimester of pregnancy (cig_1) | 18,481 | 0.49 |
| Number of daily cigarettes during the second trimester of pregnancy (cig_2) | 18,734 | 0.49 |
| Body mass index (BMI) | 102,932 | 2.71 |
| Sexually transmitted disease (STD) | 6592 | 0.17 |
| Nutrition Program for Women, Infants, and Children (WIC) | 46,744 | 1.23 |
| Access_to_Exercise | 3441 | 0.09 |
| Alchohol_Driving_Death | 536 | 0.01 |
| Prev_Hospital_Stays | 45,901 | 1.21 |
Table 2.
Hyperparameters.
| Method | Parameter | Optimal Value | Range |
|---|---|---|---|
| RF | |||
| Number of trees | 220 | [20, 500] | |
| Max depth | 13 | [5, 20] | |
| Sample rate | 0.65 | [0.1, 1] | |
| GBM | |||
| Learning rate | 0.04 | [0.001, 0.05] | |
| Learning rate annealing | 0.99 | [0.9, 1] | |
| Number of trees | 800 | [50, 1000] | |
| Max depth | 13 | [5, 15] | |
| Sample rate | 0.55 | [0.1, 1] | |
| Min child row | 50 | [10, 100] | |
| Column sample rate | 0.8 | [0, 1] | |
| LightGBM | |||
| Learning rate | 0.08 | [0.01, 1] | |
| Number of trees | 280 | [50, 600] | |
| Max depth | 14 | [5, 15] | |
| Sample rate | 0.55 | [0.2, 0.8] | |
| Min child row | 20 | [10, 100] | |
| Column sample rate | 0.80 | [0.1, 1] |
Table 3.
Performance metrics for machine learning models.
| Method | Train AUC (%) | Test AUC (%) | Sensitivity (%) | Specificity (%) | Accuracy (%) |
|---|---|---|---|---|---|
| LR-EN | 66.59 | 66.61 | 51.98 | 71.68 | 70.22 |
| RF | 70.24 | 70.78 | 57.36 | 73.01 | 71.78 |
| GBM | 77.94 | 75.58 | 64.82 | 73.01 | 72.37 |
| LightGBM | 78.34 | 75.91 | 62.24 | 73.93 | 72.99 |
Table 4.
Performance comparison with the most related studies.
| Model | Method | Sample Size (n) | Prevalence of Positive Class (%) | Test AUC (%) | Sensitivity (%) | Specificity (%) |
|---|---|---|---|---|---|---|
| Goodwin, Iannacchione, Hammond, Crockett, Maher and Schlitz [49] | Neural nets, Stepwise LR | 19,970 | 22.20 | 72.00 | NR | NR |
| Vovsha, et al. [50] | SVM with Radial Basis kernel | 3002 | NR | NR | 57.60 | 62.10 |
| Alleman, Smith, Byers, Bedell, Ryckman, Murray and Borowski [24] | LR | 2509 | 7.50 | 69.50 ** | 31.20 | 90.60 |
| Weber, Darmstadt, Gruber, Foeller, Carmichael, Stevenson and Shaw [25] * | Super learner (Combination of RF, lasso, ridge) | 336,214 | 1.02 * | 67.00 | 62.00 | 65.00 |
| Best model in this study | GBM | 3,610,827 | 7.73 | 75.58 | 64.82 | 73.01 |
* Early (before 32 weeks) spontaneous preterm; ** Training AUC; NR = Not reported, LR = Logistic regression, RF = Random forest, SVM = Support vector machine
Table 5.
The Top 15 Variables in Prediction of Preterm Birth.
| Variable | Relative Importance | Scaled Importance | Scaled Percentage |
|---|---|---|---|
| hyper | 312,937.2813 | 1 | 0.1092 |
| interval | 171,301.625 | 0.5474 | 0.0598 |
| Previous_preterm | 161,489.9844 | 0.516 | 0.0563 |
| bmi | 154,535.0781 | 0.4938 | 0.0539 |
| Education_F | 121,954.1797 | 0.3897 | 0.0425 |
| Education_M | 104,375.5859 | 0.3335 | 0.0364 |
| Age_M | 96,351.9531 | 0.3079 | 0.0336 |
| Adequate | 84,977.4063 | 0.2715 | 0.0296 |
| Age_F | 72,292.6953 | 0.231 | 0.0252 |
| Race_F | 56,246.9297 | 0.1797 | 0.0196 |
| Race_M | 54,843.5078 | 0.1753 | 0.0191 |
| Healthcare_Cost | 49,813.7344 | 0.1592 | 0.0174 |
| priorlive | 43,385.2227 | 0.1386 | 0.0151 |
| Females_Under_65_no_Health_Ins | 42,884.2578 | 0.137 | 0.015 |
Publisher’s Note: MDPI stays neutral with regard to jurisdictional claims in published maps and institutional affiliations. |
© 2022 by the authors. Licensee MDPI, Basel, Switzerland. This article is an open access article distributed under the terms and conditions of the Creative Commons Attribution (CC BY) license (https://creativecommons.org/licenses/by/4.0/).
Share and Cite
MDPI and ACS Style
Ebrahimvandi, A.; Hosseinichimeh, N.; Kong, Z.J. Identifying the Early Signs of Preterm Birth from U.S. Birth Records Using Machine Learning Techniques. Information 2022, 13, 310. https://doi.org/10.3390/info13070310
AMA Style
Ebrahimvandi A, Hosseinichimeh N, Kong ZJ. Identifying the Early Signs of Preterm Birth from U.S. Birth Records Using Machine Learning Techniques. Information. 2022; 13(7):310. https://doi.org/10.3390/info13070310
Chicago/Turabian StyleEbrahimvandi, Alireza, Niyousha Hosseinichimeh, and Zhenyu James Kong. 2022. "Identifying the Early Signs of Preterm Birth from U.S. Birth Records Using Machine Learning Techniques" Information 13, no. 7: 310. https://doi.org/10.3390/info13070310
Note that from the first issue of 2016, this journal uses article numbers instead of page numbers. See further details here.