
Design and Implementation of Intelligent Gateway System for Monitoring Livestock and Poultry Feeding Environment Based on Bluetooth Low Energy


Abstract
:1. Introduction
2. Related Work
2.1. Application of WSN in Breeding Environment Monitoring
2.2. Smart Gateway
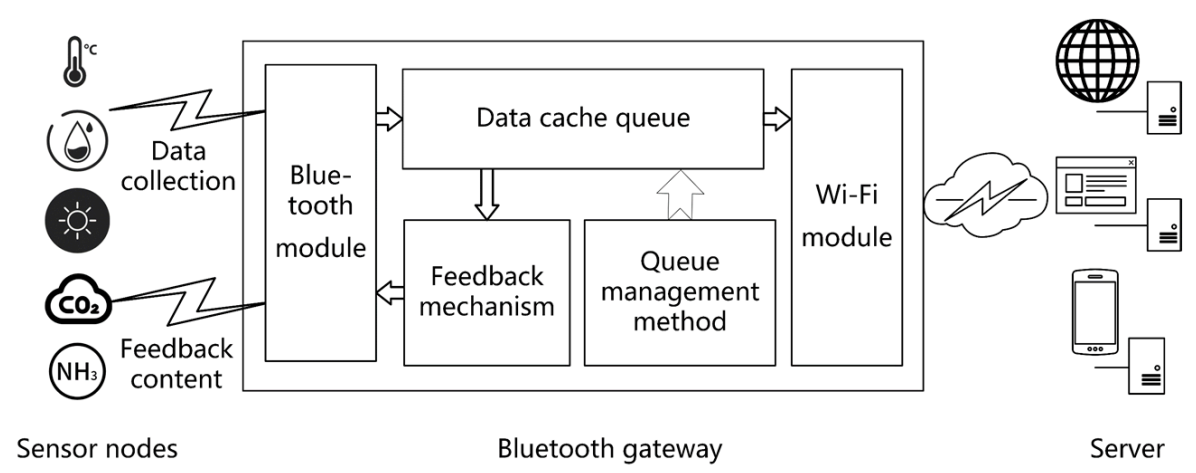
3. System Structure
- Data priority queue queuing mechanism.A sorting mechanism that assigns priority according to parameter types and numerical abnormalities is used for the data of multiple types of sensors transmitted to the Bluetooth gateway. The sorting mechanism means that for data frames that require low latency, the gateway assigns high priority to them and stores them in the cache queue, and the gateway forwards information to the server in order of priority from high to low.
- Cache queue management method.When the cache queue is full, it deletes the data with low priority and high redundancy, and caches the current data in the queue. The priority is to calculate the priority of the data, compare the priority of the data with the priority of the existing data in the cache queue, and delete the data with the lowest priority in the cache queue. Data with higher redundancy means that the data are the same as the data at the adjacent time, and the more of the same part, the higher the redundancy.
- Sampling frequency adaptive mechanism.Performing threshold judgment on the multi-parameter data transmitted by the node to the Bluetooth gateway, determining the sensor sampling frequency according to the abnormality of the parameter, and sending feedback information to the node to realize the adaptive control of the sampling frequency of the node sensor. The feedback information is a data frame containing the node number and the collection period value.
3.1. Hardware Selection and Design
- E73-2G4M08S1C Bluetooth module
- E73-2G4M04S1B Bluetooth module
- E103-W01 Wi-Fi module
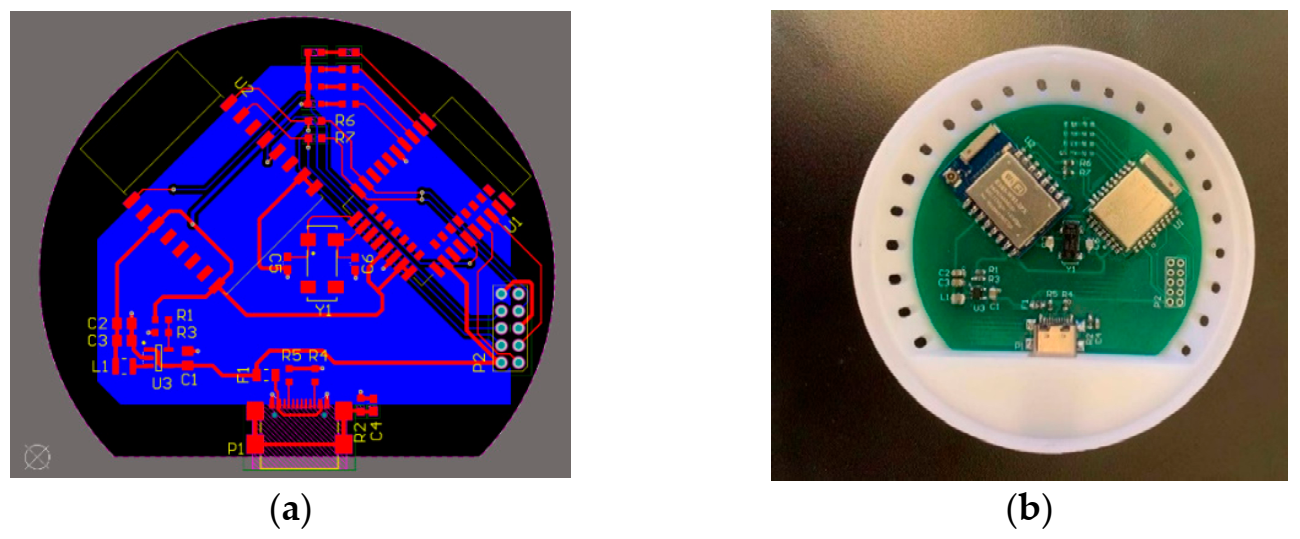
- Hardware Design and Implementation of the Bluetooth Gateway
3.2. Software Design of the Bluetooth Gateway System
3.2.1. Introduction to BLE
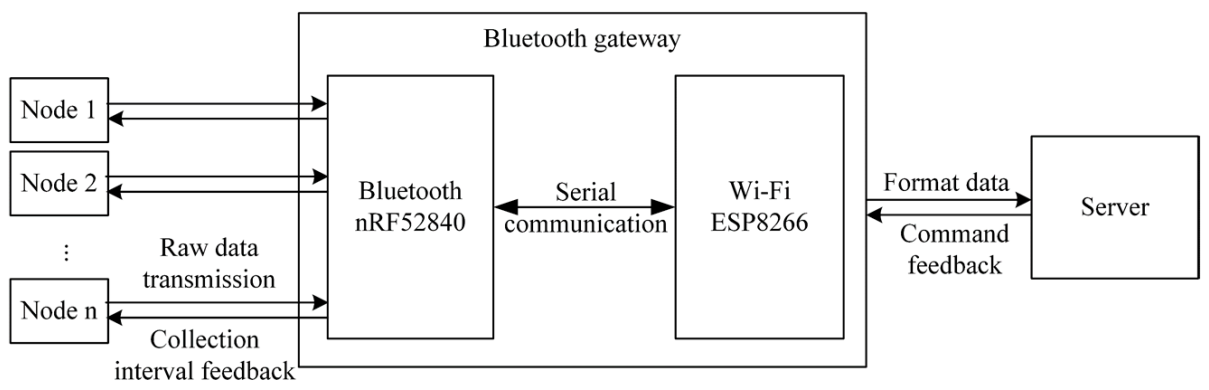
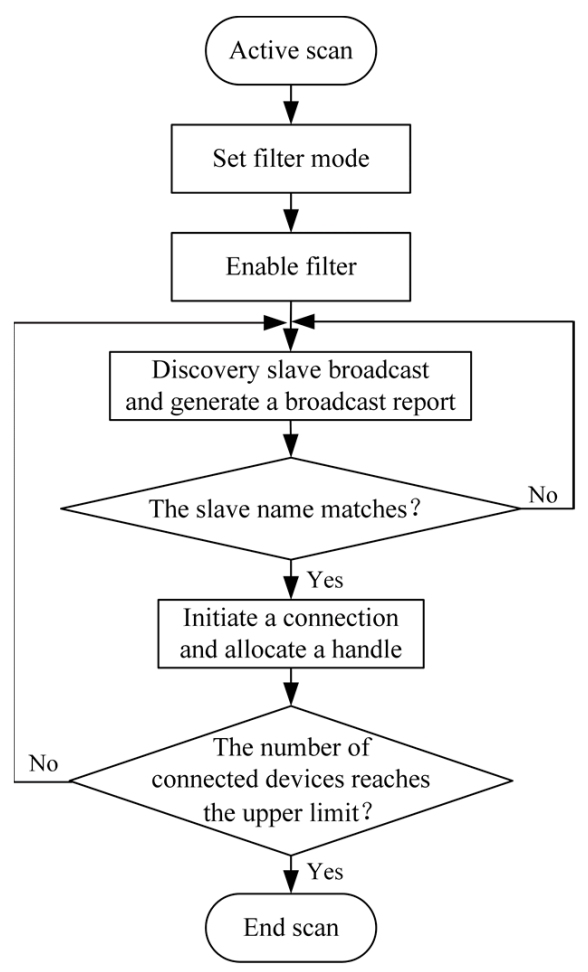
3.2.2. Bluetooth Gateway Function Realization
3.2.3. Bluetooth Gateway Optimization Solution
- 1.
- Design Data Priority Queue Queuing Mechanism
- 2.
- Design a Cache Queue Management Method
- 3.
- Design Sampling Frequency Adaptive Mechanism
4. Test Results and Analysis
4.1. The Longest Communication Distance Test
4.2. Communication Stability Test
4.3. Packet Loss Statistics
- The communication distance between the gateway and the sensor node being too long or multiple nodes being arranged in a straight line. If the distance was too long (≥20m), the signal would be weak and the data transmission link would be unstable. The arrangement of multiple nodes in a straight line would cause the pairing of distant nodes to be blocked and packet loss would occur.
- There was a wall between the gateway and the sensor node, or the ionization shielding phenomenon caused by a metal barrier weakened the signal.
- The poor LAN signal in the test pig house caused occasional packet loss in the Wi-Fi-based gateway remote transmission module.
4.4. Power Consumption Test
4.5. Latency
5. Conclusions
Author Contributions
Funding
Institutional Review Board Statement
Informed Consent Statement
Data Availability Statement
Conflicts of Interest
References
- Chen, Q.; Yang, L.; Liu, X.; Guo, J.; Wu, S.; Chen, X. Multiple gateway placement in large-scale constellation networks with inter-satellite links. Int. J. Satell. Commun. Netw. 2021, 39, 47–64. [Google Scholar] [CrossRef]
- Tashiro, S.; Yoshihiro, T. Duty-cycle Communication Protocol with Wi-Fi Direct for Wireless Sensor Networks. Sens. Mater. 2021, 33, 127. [Google Scholar] [CrossRef]
- Ryu, S.; Park, B.B.; El-Tawab, S. WiFi Sensing System for Monitoring Public Transportation Ridership: A Case Study. KSCE J. Civ. Eng. 2020, 24, 3092–3104. [Google Scholar] [CrossRef]
- AlQammaz, A.; Darabkh, K.A.; Sha’ar, B.A.; Ghatasheh, O. A Framework for Artificial Intelligence Assisted Smart Agriculture Utilizing LoRaWAN Wireless Sensor Networks. In International Workshop Soft Computing Applications; Springer: Cham, Switzerland, 2018; pp. 408–421. [Google Scholar]
- Li, C.; Adhikari, R.; Yao, Y.; Miller, A.G.; Kalbaugh, K.; Li, D.; Nemali, K. Measuring plant growth characteristics using smartphone based image analysis technique in controlled environment agriculture. Comput. Electron. Agric. 2020, 168, 105123. [Google Scholar] [CrossRef]
- Zou, L. Design of reactive power optimization control for electromechanical system based on fuzzy particle swarm optimization algorithm. Microprocess. Microsyst. 2021, 82, 103865. [Google Scholar] [CrossRef]
- Ya, W.; Meng-Ran, Z.; Lei, N.; Jia, Z. Trust analysis of WSN nodes based on fuzzy theory. Int. J. Comput. Appl. 2017, 42, 52–56. [Google Scholar] [CrossRef]
- Dauxois, T.; Peacock, T.; Bauer, P.; Caulfield, C.P.; Cenedese, C.; Gorlé, C.; Haller, G.; Ivey, G.N.; Linden, P.F.; Meiburg, E.; et al. Confronting Grand Challenges in environmental fluid mechanics. Phys. Rev. Fluids 2021, 6, 020501. [Google Scholar] [CrossRef]
- Blazy, V.; de Guardia, A.; Benoist, J.; Daumoin, M.; Guiziou, F.; Lemasle, M.; Wolbert, D.; Barrington, S. Correlation of chemical composition and odor concentration for emissions from pig slaughterhouse sludge composting and storage. Chem. Eng. J. 2015, 276, 398–409. [Google Scholar] [CrossRef]
- Tang, J.; Dong, T.; Li, L.; Shao, L. Intelligent Monitoring System Based on Internet of Things. Wirel. Pers. Commun. 2018, 102, 1521–1537. [Google Scholar] [CrossRef]
- Guo, B.; Sun, A.; Ding, W.; Shi, Z.; Zhao, S.; Yang, H. Development and experiment of intelligent monitoring system for geese house environment. Trans. Chin. Soc. Agric. Eng. 2017, 33, 180–186. [Google Scholar]
- Wang, P.; Ye, F.; Chen, X. A Smart Home Gateway Platform for Data Collection and Awareness. IEEE Commun. Mag. 2018, 56, 87–93. [Google Scholar] [CrossRef] [Green Version]
- Chlebus, B.S.; Cholvi, V.; Kowalski, D.R. Stability of adversarial routing with feedback. Networks 2015, 66, 88–97. [Google Scholar] [CrossRef] [Green Version]
- Ghosh, S.; De, B.P.; Maji, K.B.; Kar, R.; Mandal, D.; Mal, A.K. Optimal Design of Ultra-Low-Power 2.4 GHz LNA for IEEE 802.15.4/Bluetooth Applications. J. Circuitssyst. Comput. 2020, 29, 2050261. [Google Scholar] [CrossRef]
- Guo, Y.; Lin, H.; Gao, Z.; Huang, L. Gesture Recognition System Based on Normalized Neural Network. J. Comput. 2020, 31, 274–281. [Google Scholar]
- Ahlawat, H.D.; Chauhan, R.P. Detection and monitoring of forest fire using serial communication and Wi-Fi wireless sensor network. In Handbook of Wireless Sensor Networks: Issues and Challenges in Current Scenario’s; Springer: Cham, Switzerland, 2020; pp. 464–492. [Google Scholar]
- Pan, D.; Ng, S.X.; Ruan, D.; Yin, L.; Long, G.; Hanzo, L. Simultaneous two-way classical communication and measurement-device-independent quan-tum key distribution with coherent states. Phys. Rev. A 2020, 101, 012343. [Google Scholar] [CrossRef] [Green Version]
- Olatinwo, S.O.; Joubert, T.H. Efficient energy resource utilization in a wireless sensor system for monitoring water quality. Eurasip. J. Wirel. Commun. Netw. 2019, 2019, 1–22. [Google Scholar] [CrossRef] [Green Version]
- Huang, C.; Zhuang, Y.; Liu, H.; Li, J.; Wang, W. A Performance Evaluation Framework for Direction Finding Using BLE AoA/AoD Receivers. IEEE Internet Things J. 2020, 8, 3331–3345. [Google Scholar] [CrossRef]
- Nomura, R.; Yagi, H. Optimum Overflow Thresholds in Variable-Length Source Coding Allowing Non-Vanishing Error Prob-ability. IEEE Trans. Inf. Theory 2019, 65, 8213–8221. [Google Scholar] [CrossRef]
- Spörk, M.; Boano, C.A.; Römer, K. Improving the Timeliness of Bluetooth Low Energy in Dynamic RF Environments. ACM Trans. Internet Things 2020, 1, 1–32. [Google Scholar] [CrossRef]
- Macedo, M.N.; Galo, J.J.; Almeida, L.A.; Lima, A.C. Methodology for the calculation of the factor of priority for smart grid im-plantation using fuzzy logic. Int. J. Electr. Power Energy Syst. 2016, 78, 563–568. [Google Scholar] [CrossRef]
- Matsypura, D.; Veremyev, A.; Prokopyev, O.A.; Pasiliao, E.L. On exact solution approaches for the longest induced path problem. Eur. J. Oper. Res. 2019, 278, 546–562. [Google Scholar] [CrossRef]
- Liu, Y.Y.; Feng, L. Stability Analysis and Stabilization for Sampled-data Systems Based on Adaptive Deadband-triggered Communication Scheme. In Proceedings of the 2019 IEEE 4th Advanced Information Technology, Electronic and Automation Control Conference (IAEAC), Chengdu, China, 20–22 December 2019; pp. 2568–2571. [Google Scholar]
- Mohammadzadeh, A.; Tavassoli, B.; Moaveni, B. Simultaneous estimation of state and packet-loss occurrences in networked control systems. ISA Trans. 2020, 107, 307–315. [Google Scholar] [CrossRef] [PubMed]
- Kindt, P.H.; Yunge, D.; Diemer, R.; Chakraborty, S. Energy modeling for the Bluetooth Low Energy protocol. ACM Trans. Embed. Comput. Syst. (TECS) 2020, 19, 1–32. [Google Scholar] [CrossRef] [Green Version]
- Saban, M.; Medus, L.D.; Casans, S.; Aghzout, O.; Rosado, A. Sensor Node Network for Remote Moisture Measurement in Timber Based on Bluetooth Low Energy and Web-Based Monitoring System. Sensors 2021, 21, 491. [Google Scholar] [CrossRef]


| Product Name | Producer | Feature |
|---|---|---|
| Amazon Echo Plus | Amazon | Supports ZigBee and Wi-Fi; not compatible with Z-wave equipment, high cost. |
| SmartThings Hub | SAMSUNG | Supports Wi-Fi and Z-Wave; secondary development is difficult, security loopholes. |
| Mijia Multifunctional Gateway | Xiaomi | Supports Wi-Fi and ZigBee; smart accessories can still work normally when Wi-Fi is unstable or even interrupted. |
| SX1301 LoRa Gateway | Semtech | Only supports LoRaWAN; has 1 independent transmission channel and 8 independent reception channels. |
| Parameter | Technical Index |
|---|---|
| Operating Voltage | 1.7~5.5 V |
| Transmit power | ≤6 mW (Multi-level adjustable) |
| Working frequency | 2.4 GHz |
| RAM | 256 KB |
| FLASH | 1024 KB |
| Communication distance | (In ideal conditions) 120 m |
| Volume | 13 × 18 mm |
| Range of working temperature | −40 °C~+85 °C |
| Parameter | Technical Index |
|---|---|
| Operating Voltage | 1.8~3.6 V |
| Transmit power | 3.8~4.3 dBm |
| Working frequency | 2.4 GHz |
| RAM | 64 KB |
| FLASH | 512 KB |
| Communication distance | (In ideal conditions) 100 m |
| Volume | 17.5 × 28.7 mm |
| Range of working temperature | −40 °C~+85 °C |
| Parameter | Technical Index |
|---|---|
| Operating Voltage | 3.0~3.6 V |
| Transmit power | ≤100 mW (Multi-level adjustable) |
| Working frequency | 2.4 GHz |
| Communication distance | (In ideal conditions) 100 m |
| Volume | 13 × 18 mm |
| Range of working temperature | -40 °C~+85 °C |
| Specifications | BLE | Classic Bluetooth |
|---|---|---|
| Radio frequency | 2.4 GHz | 2.4 GHz |
| Distance | ≤100 m | 10 m |
| Time required to send data | <3 ms | 100 ms |
| Response delay | 6 ms | About 100 ms |
| Safety | 128-bit AES and user-defined application layer | 64/128-bit and user-defined application layer |
| Energy consumption | 0.01~0.5 W | 1 W |
| Air transmission data rate | 2 Mb/s | 1–3 Mb/s |
| Byte 0 | Byte 1 | Byte 2–3 | Byte 4–5 |
|---|---|---|---|
| Type | ID | Valid data | Check digit |
| Attribute Name | Attribute Description |
|---|---|
| Type | Data types are used to distinguish differentiate different sensor data |
| ID | The node number is used to distinguish different nodes |
| Valid data | The available data collected by the sensors |
| Check Digit | Used to check the correctness of the packet data |
| Test Group | Test Distance/m | Whether Succeeded | The Longest Communication Distance/m |
|---|---|---|---|
| 1 | 10 | Yes | 21 |
| 15 | Yes | ||
| 20 | Yes | ||
| 21 | Yes | ||
| 22 | No | ||
| 2 | 10 | Yes | 20 |
| 15 | Yes | ||
| 20 | Yes | ||
| 21 | No | ||
| 22 | Yes | ||
| 3 | 10 | Yes | 20 |
| 15 | Yes | ||
| 20 | Yes | ||
| 21 | No | ||
| 22 | Yes | ||
| Average value | 20.33 |
| Test Distance/m | Sending Cycle/s | Test Start Time | Test End Time | Receivable Data/Piece | Actual Data/Piece | Communication Success Rate |
|---|---|---|---|---|---|---|
| 10 | 20 | 15:07 | 15:27 | 60 | 60 | 100% |
| 15 | 20 | 15:07 | 15:27 | 60 | 60 | 100% |
| 20 | 20 | 15:07 | 15:27 | 60 | 60 | 100% |
| Index | Breeding Room | Delivery Room | Brooding Room | Growth Chamber |
|---|---|---|---|---|
| Effective time/h | 62 | 88 | 65 | 61 |
| Receivable data packet/piece | 3726 | 5280 | 11,724 | 5856 |
| Actually received data packet/a | 3681 | 5223 | 11,596 | 5799 |
| Number of lost packets/piece | 45 | 57 | 128 | 57 |
| Packet loss rate/% | 1.208 | 1.080 | 1.092 | 0.973 |
| Number of Connected Slaves | Peak Latency/ms | |
|---|---|---|
| The System Proposed in This Article | Ordinary Bluetooth Gateway | |
| 4 | 22 | 22 |
| 8 | 29 | 37 |
| 10 | 46 | 59 |
| 12 | 69 | 95 |
| 14 | 91 | 118 |
| 16 | 109 | 145 |
| 18 | 113 | 153 |
Publisher’s Note: MDPI stays neutral with regard to jurisdictional claims in published maps and institutional affiliations. |
© 2021 by the authors. Licensee MDPI, Basel, Switzerland. This article is an open access article distributed under the terms and conditions of the Creative Commons Attribution (CC BY) license (https://creativecommons.org/licenses/by/4.0/).
Share and Cite
Du, Y.; Sun, G.; Zheng, B.; Qu, Y. Design and Implementation of Intelligent Gateway System for Monitoring Livestock and Poultry Feeding Environment Based on Bluetooth Low Energy. Information 2021, 12, 218. https://doi.org/10.3390/info12060218
Du Y, Sun G, Zheng B, Qu Y. Design and Implementation of Intelligent Gateway System for Monitoring Livestock and Poultry Feeding Environment Based on Bluetooth Low Energy. Information. 2021; 12(6):218. https://doi.org/10.3390/info12060218
Chicago/Turabian StyleDu, Yawen, Guiling Sun, Bowen Zheng, and Yunlong Qu. 2021. "Design and Implementation of Intelligent Gateway System for Monitoring Livestock and Poultry Feeding Environment Based on Bluetooth Low Energy" Information 12, no. 6: 218. https://doi.org/10.3390/info12060218