Review

State of the Art on Two-Phase Non-Miscible Liquid/Gas Flow Transport Analysis in Radial Centrifugal Pumps Part B: Review of Experimental Investigations

by
Michael Mansour
1,2,* and
Dominique Thévenin
2
1
Mechanical Power Engineering Department, Faculty of Engineering—Mataria, Helwan University, Cairo 11718, Egypt
2
Laboratory of Fluid Dynamics & Technical Flows, University of Magdeburg “Otto Von Guericke”, 39106 Magdeburg, Germany
*
Author to whom correspondence should be addressed.
Int. J. Turbomach. Propuls. Power 2023, 8(4), 42; https://doi.org/10.3390/ijtpp8040042
Submission received: 17 December 2022 / Revised: 6 August 2023 / Accepted: 26 September 2023 / Published: 13 October 2023
(This article belongs to the Special Issue Advances in Critical Aspects of Turbomachinery Components and Systems)

Abstract

:
This paper aims to summarize the results of several experimental investigations regarding two-phase liquid–gas flows in radial centrifugal pumps. The main objective is to combine the corresponding experimental results and collect the obtained knowledge to provide a better understanding of this configuration. The simultaneous transport of the two phases, the phase segregation, and the regions of safe or critical pump performance were described for a wide variety of pump configurations. This review covers single- and two-phase pumping conditions, performance degradation, pump breakdown, performance hysteresis, different flow regimes, flow regime maps, flow instabilities, and surging. This manuscript also considers the influence of employing different pump configurations on pump performance and flow regimes. This includes comparisons between closed and semi-open impellers, standard and increased tip clearance gaps, and running the pump with and without an inducer. Many of the results discussed have been published in a series of research papers. They were all collected, summarized, and compared systematically in the present review.

1. Introduction

The transport of two-phase liquid–gas flows is relevant for numerous engineering-, industrial-, and energy-related applications. Such a two-phase flow exists in the pipes of many solar collectors, chemical reactors, oil wells, membrane processes, refrigeration devices, energy-storing devices, and heat exchangers [1,2,3,4]. Accordingly, to optimize the operation of these applications, comprehensive investigations for the complex flow of two-phase mixtures are necessary, given that the behavior of a two-phase flow is significantly different from that of a single-phase flow. Additionally, numerical studies are only useful when an appropriate validation against experimental data is first performed.
Centrifugal pumps are utilized in numerous applications, i.e., industrial, engineering, and domestic, due to their simple and efficient design, as well as their wide flexibility. For instance, centrifugal pumps provide a very wide operating range, which can be easily adapted based on the desired conditions. Additionally, these pumps require low maintenance [5,6].
The simultaneous flow of gas and liquid phases in radial centrifugal pumps is also found in many engineering and industrial applications. For instance, pumping gas–liquid mixtures is necessary for natural gas and petroleum transportation [7,8], the production of crude oil, medical systems, the paper-making industry, the treatment of wastewater, geothermal plants [9], and the cooling pipes of nuclear plants [10,11].
Centrifugal pumps were initially developed for the transport of pure liquids, and had excellent properties for this purpose. However, the performance, efficiency, and most of the flow parameters significantly drop for two-phase flows. This happens because the gas phase has a very high tendency to accumulate and stay in the impeller channels. When the flow separates, a big flow recirculation often occurs, which is considered the primary mechanism for bubble accumulation in two-phase flows [12,13,14]. Additionally, the gas and liquid phases are subjected to dissimilar centrifugal and Coriolis forces due to their density difference. These factors create low-pressure zones, where the lighter phase accumulates accordingly. In the pump flow, separation and flow recirculations may take place on the suction or pressure side of the impeller channels or the pump tongue [15,16,17,18,19,20,21,22,23]. The following is a summary of the results regarding two-phase liquid–gas flow transport in radial centrifugal pumps, mostly based on our own investigations and with appropriate connections to the relevant literature.
As already mentioned, transporting gas–liquid mixtures with centrifugal pumps is a very complex job due to the high tendency of the gas phase to separate and accumulate within the impeller. In this case, the pump works very inefficiently due to gas locking [7,24], and, in some cases, the pump completely loses its functionality [11,25,26,27]. This phenomenon is know as pump “breakdown” [28,29,30,31,32]. In the literature, pump breakdown is frequently referred to as “gas locking” [33,34,35].
The presence of large gas pockets is not only responsible for the dramatic deterioration of the head and flow but can also lead, under some specific conditions, to severe flow instabilities and system vibrations. Under these conditions, the continuous formation and discharge of huge gas pockets occur. This phenomenon is known as pump “surging”, which corresponds to two different operational points, resulting in strong fluctuations of the pump performance between two distinct points [36,37,38]. The two-phase flow pattern in the impeller is strongly unsteady in this condition, where the gas pockets are characterized by considerable size changes, large oscillations, and alternating appearing and disappearing behavior [39,40]. These unsteady characteristics are directly reflected in the flow parameters and pump delivery.
The pumping performance of a single-stage radial centrifugal pump, transporting air–water mixtures at suction pressures near atmospheric levels, can be negatively affected even by a very small amount of gas. Also, levels of air slightly above 1% can adversely increase the required net positive suction head of the pump NPSHrequired [41]. Usually, the drop is more apparent away from the nominal flow rate (at partial load or overload conditions) for gas volume fractions (GVF) lower than 3% [19,28,42,43]. For gas contents between 4% and 6%, the performance also considerably drops at optimal flow conditions [19,44]. Furthermore, at about 7% to 10% of air content, a complete failure of the performance (pump breakdown) usually occurs [11,19,28,29,42,44,45,46]. However, other impeller designs, e.g., mixed impellers, can handle a higher amount of gas (up to 30%), as discussed below. Further, helico-axial pumps, which move the fluid along the axial direction, are broadly utilized for conveying multiphase mixtures. These particular pumps can handle gas volume fractions ranging from 50% to 80% and are primarily suitable for low-head applications [47,48]. The present investigations concentrate on evaluating the performance of single-stage radial centrifugal pumps.
Another problem related to transporting gas–liquid two-phase flows with radial centrifugal pumps is the hysteresis of the performance. This phenomenon means that the final pump performance changes according to the steps (history) used to reach the desired conditions, i.e., the flow rates of both phases. Hysteresis can be seen in a variety of flow applications, such as the Taylor vortex flow, where the height and number of vortices strongly depend on how the flow is initiated [49]. Similar to this, for formally identical operating points, large differences in performance can occur in centrifugal pumps when reducing the air flow rate from an initially high value or starting from zero and increasing the air flow rate. This is caused by a previous buildup of large air pockets, which can continue along the blades under certain flow conditions, even after the air flow rate is reduced to levels where smaller or no air accumulations should take place.
The bubble size in the impellers of centrifugal pumps is a critical factor that affects the performance of the pump [20,34,38,50,51,52,53]. It is also an important aspect of the accurate modeling of the pump performance in numerical studies [54,55,56,57,58,59]. Previous investigations revealed that the bubble size is impacted by several parameters, including the inlet gas volume fraction, the rotational speed, and the liquid flow rate [34,50,51,52]. The bubble size typically increases with the increasing inlet gas volume fraction, since the number of gas bubbles present in the liquid increases and the bubbles start to coalesce and grow in size [20,51,52]. Further, the increase in the rotational speed decreases the bubble size due to the higher shear force applied to the bubbles, which leads to a break up of the bubbles to finer ones [20,32,51,52,53]. The increase in the liquid flow rate also affects the bubble size. Usually, when the flow rate increases, more turbulence is generated in the impeller, which helps break up the bubbles [38,51,53,54]. Still, the bubble size in the impellers of radial centrifugal pumps is a complex issue. The relationship between the factors affecting the bubble size is not always straightforward. Additionally, the effect of the impeller design, the size of the tip clearance gap, and the installation of an inducer on the bubble size distribution have been not clarified in the literature.
Earlier investigations published in the literature studied the effects of numerous important flow factors, revealing significant information concerning the research problem. For instance, higher rotational speeds can enhance the transport of a two-phase flow [32,34,35,38]. When the rpm is increased, the flow becomes faster in the inlet pipe and the gas phase becomes more dispersed before entering the impeller. The increased rotational speed also enhances the shear force and turbulence within the impeller, which hinders the accumulation of the gas phase and delays flow regime transition [32,38,40,42,60]. Accordingly, the pump maintains a more stable performance under higher gas contents when running with higher rotational speeds.
The specific speed of a pump ( n q ) is a parameter that relates the rotational speed, flow rate, and pressure head of a pump (see, later, Equation (1)). The specific speed can be used to indicate the geometric type of the impeller. There are generally three main categories of geometric types: having either an axial, mixed, or radial impeller. Axial impellers typically fall within the higher specific speed range ( 140 n q 400 ). Mixed flow impellers have intermediate specific speeds ( 40 n q 140 ), with a design combining radial and axial properties, while radial impellers, similar to those used in the present investigations, have a low specific speed range ( n q 40 ).
In the study of Cirilo [46], a radial pump impeller (low specific speed) was compared to a mixed one (moderate specific speed). It was shown that the mixed impeller could transport air–water mixtures with air content up to 30%, while the radial one was only able to pump air content lower than 10%. Similarly, the pumping performance was enhanced in reference [60] by increasing the specific speed of a radial impeller. However, the performance was negatively impacted by rising the specific speed in reference [40]. Gülich [61] tried to explain this apparent contradiction. The reason for this inconsistency is believed to be the combined effects of impeller shape and rotational speed, both of which contribute to the specific speed. As discussed earlier, when the rotational speed increases, i.e., a higher specific speed, the pumping performance is enhanced. Additionally, increasing the outer diameter of the impeller at a constant rotational speed decreases the specific speed. This decreases the blade loading. It also provides extra length for the flow to reattach after a gas accumulation zone, thereby boosting the two-phase pumping performance [40,61]. However, it is hard to explain in such a simple manner the complex influence of the specific speed; further investigations are still needed.
According to some studies [62,63,64,65], a higher liquid viscosity causes less turbulence, which promotes gas accumulation and performance degradation. Nevertheless, in similar studies investigating oil–gas flows, the increase in the viscosity of oil resulted in an improvement in the two-phase performance, particularly at overload conditions. The reason is that the bubbles are subjected to a higher drag in this case, which slowed down the segregation of the phases [40].
Several research studies demonstrated that increasing the suction pressure improves pumping performance by reducing gas volume expansion within the pump and lowering the liquid-to-gas density ratio, improving, accordingly, the gas handling capacity of the pump [45,66,67,68]. An experimental study also demonstrated that injecting a surfactant can significantly enhance gas–liquid pumping [69]. The interfacial characteristics of the fluids changed as a result of the injected surfactant (isopropanol IPA). A surfactant leads to drag reduction. Additionally, it changes the polarity of the bubble interface into a foamy flow at low-flow conditions and a dispersed bubble flow at high-flow conditions. The sudden drop in performance could, therefore, be reduced, and the pump could transport more gas with a lower performance reduction.
It might be expected that the approach flow may have an impact on the two-phase pumping performance. However, our preliminary experiments indicated that the approach flow has almost no effect on the final two-phase pumping performance. In preliminary tests, no difference in the performance could be seen when changing the diameter of the inlet pipe, adding a mixer in the inlet pipe, changing the radial and axial locations of gas injection, changing the size of gas bubbles, or changing the flow regime in the inlet pipe. Even bubbly and stratified flow regimes in the inlet pipe led to identical performances. Similar observations were found and discussed in references [39,40,61,70,71]. This confirms that the performance is mainly dominated by the inlet gas volume fraction and what happens inside the pump, i.e., impeller geometry and rotational speed, while the approach flow shows a generally negligible influence.
The fine details of the two-phase flow interactions within the impeller channels were only investigated in a limited number of experimental studies, even though it was confirmed to be directly related to the two-phase pumping performance [9,11,24,72,73,74,75]. The two-phase flow patterns were mainly recognized by making a transparent part (window) in the pump body or using a transparent pump casing. Nonetheless, some new studies used a modern non-intrusive method to determine the distribution of gas and liquid in an opaque industrial pump [76,77]. Still, this new method seems to be very complicated.
Visualization experiments revealed that the formation of gas pockets on the blades, frequently close to the impeller inlet, is the primary cause of the degradation of the pump performance [24,38,73,78]. Murakami and Minemura [50] demonstrated that the pump performance discontinuities correlate to changes in the two-phase flow regimes in the impeller channels when the gas flow rate is increased. According to the results in reference [79], the pump breakdown takes place when the gas builds up to the outer diameter of the impeller. In the literature, several distinct two-phase flow patterns have been noted, including the following:
  • Bubble, agglomerated bubble, gas pocket, and segregated flow in references [35,38].
  • Bubble, slug, and pocket flows in reference [79].
  • Bubble, unstable pocket, stable pocket, segregated flow in reference [68].
  • Isolated bubbles, bubble, gas pocket, and segregated flow in reference [75].
Figure 1 shows sample images and schematic sketches for the various flow patterns observed in the impeller of the centrifugal pump studied in reference [38]. The reason for the uneven phase distribution in different impeller channels is the typically non-uniform pressure distribution surrounding the impeller. Additionally, the unsteady nature of the two-phase flow and the irregular structures of the gas phase entering from the impeller’s eye may also contribute to this uneven phase distribution.
There are different observations in the literature about where the first gas accumulation occurred. The onset was occasionally seen on the blade suction side in some investigations [11,73,74]. Poullikkas (2003) [11] showed that the gas starts accumulating on the blade suction side, and near the impeller back plate. Figure 2 describes the three stages of gas accumulation in the impeller as observed in reference [11] using high-speed video recordings when the gas content is gradually increased. This behavior might be related to the considered steam–water two-phase mixture. Nevertheless, a similar behavior was observed for air–water mixtures in reference [73], where the large gas pockets started from the blade suction side, near the impeller inlet. Figure 3 shows the progress of the two-phase flow inside the impeller channels observed in reference [73] for a progressive increase in the gas percentage.
Other studies [7,24,50,75,80] noticed, conversely, the onset of the gas accumulation close to or on the pressure side of the blades. Figure 4 depicts the flow patterns and the gradual gas buildup found in reference [24]. The gas pockets are first visible on the pressure side here. As a result, additional research is necessary because there is still no widely accepted explanation for the observations. Sato et al. [80] could find a relation between the incidence angle of the impeller and the location of gas accumulation as described below. Further, the different flow conditions (part-load, nominal, or overload), impeller designs (closed, semi-open, or open impeller), and mixture components (air–water or steam–water) used in the studies all contributed to the distinct conclusions. In addition, only a very small number of flow regime maps were produced in the literature, as noted in the references [36,38,68,81], and the maps were frequently not directly related to the performance curves of the pump. The present review includes this as one of its goals.
Sato et al. [80] took into account five various closed impellers. It was found that the accumulation begins on the blade suction side for the impellers with a high incidence angle, while it begins on the blade pressure side for the impellers with a low incidence angle. As discussed before, large separation zones correspond directly to the locations of gas accumulations in two-phase flows. Due to the very low pressure that is available, and the zero velocities close to the recirculation core, flow separation creates the ideal space for the gas phase to accumulate [82]. Since flow separation occurs on the suction side for high incidence angles and on the pressure side for low incidence angles, the observations of Sato et al. [80] can be explained, as indicated in Figure 5. However, the accumulation location also depends on the interaction of several forces, i.e., centrifugal, pressure, drag, and Coriolis forces, acting on the gas bubbles in the impeller [35,74,83,84,85].
Murakami and Minemura [86], examined the impact of the number of blades when using semi-open impellers with three, five, or seven blades. The pump performance with a three-blade impeller for pure liquid was significantly worse than the others due to a lack of blades; though, for low gas flow rates, the two-phase performance could be slightly enhanced by using three blades. The five- and seven-blade impellers did not significantly differ from one another, suggesting that any number of blades between five and seven would be appropriate for both single- and two-phase transport. Cappellino et al. [45] also evaluated the performance of two- and five-blade semi-open impellers. It can be observed that the two-blade impeller can maintain its performance at higher gas flow rates by increasing the tip clearance gap.
Semi-open impellers typically exhibit higher resistance to gas accumulation and better two-phase pumping capability [45,87,88,89]. The accumulated gas is disturbed by the leakage flow that crosses the blades within the tip clearance gap, which improves phase mixing [20,90]. As a result, the pump performance degradation is postponed and large gas pockets can only build up at higher gas volume fractions. Up to a gas volume fraction of about 3–4%, semi-open impellers with standard tip clearance gaps exhibit excellent two-phase performance. However, for higher gas volume fractions, a sharp decline occurs in the performance. Single-phase flow and mixtures with low gas contents (1–3%) perform worse when the tip clearance gap is increased. Nevertheless, for higher gas volume fractions, a larger gap offers enhanced turbulence and a higher resistance to gas accumulation, which is advantageous concerning the transport of a two-phase flow [45,84]. Recently, novel front shrouds with macroscopic grooves were developed and applied to enhance secondary flow [90]. The use of such grooved shrouds could substantially improve two-phase mixing and delay gas accumulation. This happens mainly due to the development of an intensified secondary flow with many small-scale vortices induced by the grooves.
Pump inducers are axial impellers that can be installed before the main pump impeller. According to reference [61], inducers typically have two to four blades to avoid increasing the inlet solidity, which can block the inlet flow. The cavitation characteristics of pumps and the suction conditions can regularly be improved using inducers. Usually, inducers are employed for pumps to decrease the required net positive suction head [43,61]. Furthermore, inducers also have beneficial effects on the transport of gas–liquid flows by centrifugal pumps. This is mostly observed at part-load conditions [20,29,30,45,82,91,92].
Despite the numerous studies on the transport of gas–liquid two-phase flows in radial centrifugal pumps, the details of the flow features and the two-phase interactions are still not well described. Furthermore, there are some discrepancies in earlier studies regarding the influence of various factors on flow and pump performance. The mechanisms causing performance degradation and the segregation of the phases in the pump are still not fully explained. The literature only contains a small number of general statements regarding this complex flow.
This review mainly focuses on the transport of two-phase mixtures, considering two-component air–water gas–liquid flow by combining and summarizing several recent successive investigations performed experimentally by the authors to provide further explanations for the scientific gaps found in the literature and to afford a detailed experimental database for the transport of gas–liquid two-phase flows in radial centrifugal pumps.
Various experimental results for six different pump configurations are considered in this review. As a result, the specific requirements for the effective transport of two-phase flows are covered in detail. In Section 2, all details of the employed experimental set-up are presented. The calculations of the pump parameters are explained in Section 3, followed by descriptions of the experimental procedures used to measure the two-phase performance in Section 4. Afterward, Section 5 presents the experimental results with corresponding discussions, including comparisons of the single-phase performances (Section 5.1), two-phase performances (Section 5.2, Section 5.3, Section 5.4, Section 5.5, Section 5.6 and Section 5.7), performance degradation (Section 5.8), surging and flow instabilities (Section 5.9), and the performance for constant air flow rates (Section 5.10). The two-phase flow patterns were detected using a high-speed system and are presented in Section 5.11. Additionally, flow regime maps were plotted on the pump performance curves for all the covered pump configurations, which are provided and discussed in Section 5.12. In this way, the two-phase flow regime can be easily linked to the pumping behavior. Lastly, Section 5.13 presents measurements of bubble size distributions in the impeller. The following analysis and comparisons are very beneficial for selecting the best pump and impeller settings based on the required flow conditions. Similarly, a summary of the subsequent experimental findings is valuable for developing and validating appropriate numerical models and methods.

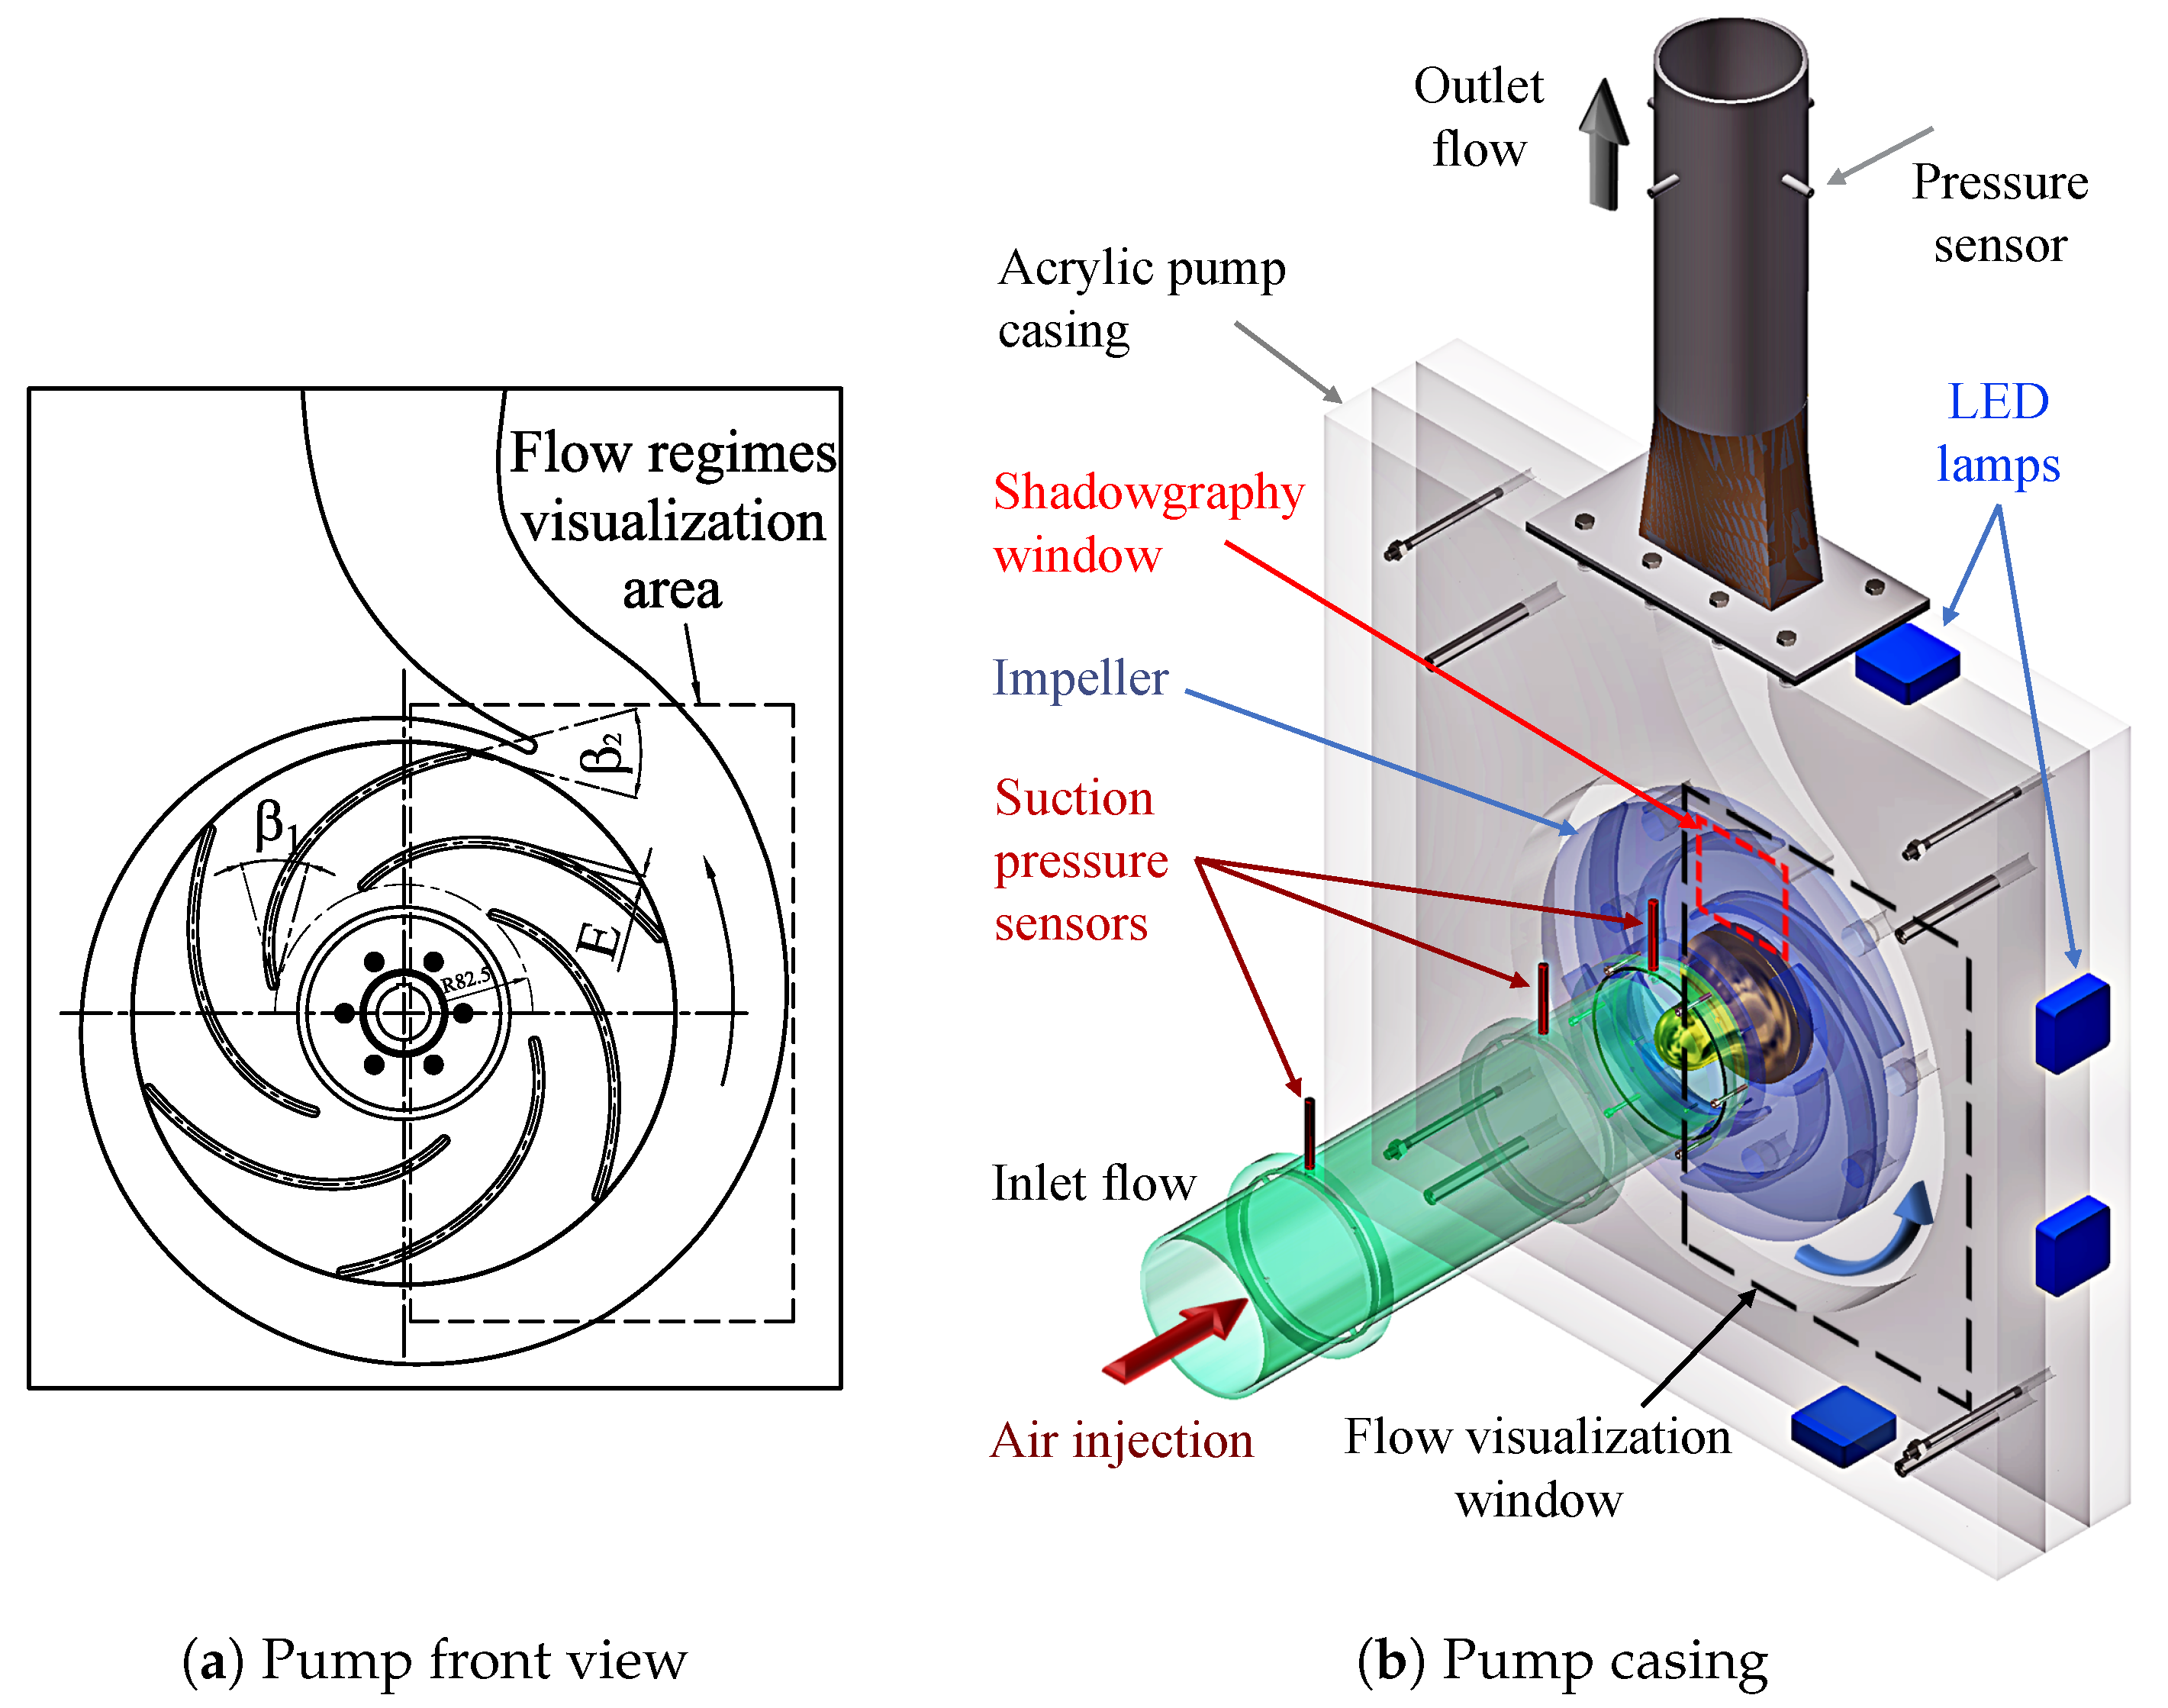
2. Experimental Set-Up

The details of the pump used are shown in Figure 6. To enhance the visualization of the flow behavior and regimes, the entire pump casing and a section of the suction pipe were constructed using transparent acrylic glass, as depicted in Figure 6. All impellers were fabricated with 6 elliptical, non-twisted blades, as shown in Figure 6a, for maximum optical accessibility. The blades have a constant thickness ( E = 6 mm ) and the same inlet and outlet blade angles ( β 1 = β 2 = 24 ). For these fundamental investigations, the selected blade design is straightforward to manufacture and results in minimal vibrations. The dashed rectangles shown in Figure 6 indicate the locations where flow regimes and bubble size distributions were observed. As shown, to illuminate the flow and record the flow regimes, LED lights were mounted on the pump body.
As illustrated in Figure 7a,b, the semi-open impeller (with a round trailing edge) and the closed impeller are geometrically similar. The semi-open impeller was designed with a front shroud that is identical to the one fixed to the blades of a closed impeller; it is attached to the pump body to provide comparable flow passages for both cases. By varying some small shaft rings placed behind the impeller, the tip clearance gap of the semi-open impeller can be set as indicated in Figure 7b. As mentioned, two different tip clearance gaps were compared, i.e., a standard gap ( S / b 2 = 2.5 % ) and an increased gap ( S / b 2 = 5 % ), where b 1 and b 2 are the inlet and outlet blade widths, respectively. Additionally, two common varieties of blade trailing edges, i.e., round trailing edge (RTE) and trimmed trailing edge (TTE) (see Figure 8) were compared for the semi-open impeller with a standard gap. The diameter of the round trailing edge is equal to the blade thickness. Two rotational speeds were also taken into account, i.e., n = 650 rpm and n = 1000 rpm. According to Equation (1), the specific speed of the pump is approximately n q = 21   min 1 , calculated using the conditions at the best efficiency point, where n, Q, and H are the rotational speed in rpm, the volume flow rate in m 3 / s , and the head of the pump in m , respectively.
n q = n Q H 3 / 4
Figure 9 and Table 1 depict the geometrical specifications of the inducer used. Figure 9 presents a 3D view of the inducer along with two sectional views, two developed views of the linear cascade, and the geometrical parameters. The suction pipe diameter ( D s ) is used to determine some parameters, as listed in Table 1. By swapping out the impeller nut, the three-bladed inducer can be installed before the impeller. The employed inducer was originally optimized for low-flow conditions, achieving its peak efficiency in the Q / Q o p t range of 0.6 to 0.8., where Q o p t is the best efficiency flow of the pump. In another study of our group [92], 9 different inducer geometries with widely different geometrical and flow conditions were investigated. It was found that most of them have a higher positive influence on the pump performance at part-load conditions compared to other loading conditions, as also observed here.
The test rig loop is shown in Figure 10. To achieve a closed-loop pump operation, a water tank with a volume of 6.3   m 3 is used. The return air phase can exit the tank from a release pipe attached at the top of the tank. To prevent air carry-under, the returning flow is injected in the tank from the top side over the free surface of the water, which is 3 m high above the inlet pipe. As indicated in Figure 6b, the transparent part of the inlet pipe just before the pump inlet allows for an additional check of the pure water flow. A gate valve is mounted on the inlet pipe near the tank for maintenance reasons. During the measurements, this valve was always fully open. An electromagnetic flow meter is used to determine the water flow rate ( ± 0.5 % RD accuracy), which is installed in the suction line before mixing with air. Please note that the leakage flow rates (internal and external) were not tracked or measured explicitly in these experiments. On the return line, a motorized gate valve is set up so that the required water flow rate can be regulated.
A mass flow meter was used to determine the air flow rate. A throttle valve and an on/off ball valve are also installed on the air line to set the inlet air flow rate. A gas distribution nozzle (made of pure borosilicate glass) was employed to inject the air into the inlet pipe to the pump. The porous part of the used distribution nozzle has an inner diameter of 17 mm, an outer diameter of 34 mm, a length of 85 mm, and a pore size range of 10 to 16 μ m . The static pressure change across the pump was determined using a differential pressure measuring device. Additionally, the air volume flow rate and the air volume fraction at the pump inlet were calculated using explicit measurements of the suction pressure recorded by an absolute pressure sensor. A temperature sensor was used to measure the flow temperature close to the air injection location. The pump was operated using an electric motor with variable speed ( 5.7 kW, max. rpm = 3000 ). An analog tachometer was employed to measure the rotational speed, and a frequency controller was used to control it. A torque transducer was installed on the motor shaft to measure the shaft power and pump efficiency. Table 2 gives a list of the models and the uncertainties of the measurement devices. The sequential perturbation method of Moffat [93] was used to perform an uncertainty analysis on the experimental results. The final uncertainties were presented as root mean square values of all data points collected for various pump configurations. For the specific delivery work Y , the gas volume fraction ( ε ), the shaft power ( P S h ), and the efficiency ( η ), the analysis provides values of uncertainty that are better than 1.45%, 3.2%, 4.7%, and 4.95%. The details of the uncertainty calculations can be found in reference [82].
Utilizing shadowgraphy measurements, as shown in Figure 11a, some bubble size distributions were determined. Illuminating LED lamps were installed behind the transparent pump body facing the camera. The interface between the two phases appears dark in this way, allowing for the precise determination of the bubble sizes. The same high-speed camera, used to measure the flow regimes, was used to capture the shadowgraphy images. A particular window in the impeller channels was chosen to follow the bubbles, as indicated in Figure 11b (see again Figure 6b). Though the depth of the impeller, in a line perpendicular to the image plane, is limited, the camera exposure was adjusted so that only the bubbles passing through a single plane approximately in the middle of the impeller height appear sharp. Thus, only those sharp bubbles are recognized and processed by the software, while the bubbles moving in other planes appear blurred and are not recognized. In this way, the measurements were done in a quasi-2D plane, and the errors that may result from 3D effects are minimized. The image scale was adjusted and calibrated using a 2D CAD sketch, as depicted in Figure 11b, to ensure the accurate determination of bubble sizes. For each measurement, cyclic image recording was performed with the same frequency of the impeller rotation, always acquiring images of the impeller in the same relative position (frozen rotor approach). In total, 50 images were taken for each measurement, leading to determinations of bubble size distributions based on more than 15,000 recognized bubbles in each case.
In the following sections, the two-phase flow transport and the characteristics of a centrifugal pump were compared for various flow conditions, which are based on a series of publications from our group [20,28,29,30,31,32,82]. Overall, 6 different pump configurations were compared, as listed in Table 3. Additionally, the performance curves were evaluated for constant gas volume fractions and constant air flow rates at the pump inlet. By taking a variety of approaches to set the operating conditions, the potential performance hysteresis could be studied. Additionally, the behaviors of head deterioration, surging, and flow instabilities were compared for the different pump configurations considered. Using a high-speed imaging system, the two-phase flow patterns were recorded and categorized for each pump configuration. For selected flow conditions, the bubble size distributions were obtained using shadowgraphy measurements and compared for some pump configurations. In addition, flow pattern maps were generated and correlated with the performance curves.

3. Pump Performance Calculations

The following is a description of how the pump parameters were calculated. The water flow rate ( Q w ) and air mass flow rate ( m a ˙ ) are directly quantified as explained above. Using the universal gas law (Equation (2)), the air density ( ρ a ) can be calculated, where T and p S are the flow conditions (temperature and pressure, respectively) at the pump suction. For all different configurations, the suction pressure ( p S ) was always constrained within 1.06 and 1.28 bar. It should be noted that there is almost no error when calculating the air compressibility using the universal gas law, i.e., treating the air as an ideal gas. This is valid up to a pressure of 5 bar. However, the associated error was verified by checking the resulting density values against those of the models of Soave–Redlich–Kwong [94] and Peng–Robinson [95]. The difference was always lower than 0.1% and is thus negligible.
ρ a = p S R T
Using Equations (3) and (4), the air volume flow rate ( Q a ) and the air (gas) volume fraction ( ε ) were calculated, respectively.
Q a = m a ˙ ρ a
ε = Q a Q t = Q a Q a + Q w
where Q t is the total volume flow rate of the two phases, determined by summing the air volume flow rate ( Q a ) and the water volume flow rate ( Q w ). Equation (5) was used to determine the water mass flow rate ( m w ˙ ) after obtaining the water density ( ρ w ) based on the temperature (T). The mass fraction of air ( μ ˙ ) was then calculated using Equation (6). This parameter is also called the mixture quality.
m ˙ w = ρ w Q w
μ ˙ = m ˙ a m ˙ t = m ˙ a m ˙ a + m ˙ w
The ratio of shaft power ( P S h ) to pumping power ( P p ) is the pump efficiency ( η ), as provided by Equation (7).
η = P p P S h = m ˙ t Y τ ω
In Equation (7), m ˙ t is the total mass flow rate of the two fluids ( m w ˙ + m a ˙ ), τ is the shaft torque, and ω is the angular velocity obtained by Equation (8).
ω = 2 π n 60
Equation (9) was deduced to calculate the specific delivery work ( Y ), taking into account the specific work of the water and the isothermal compression of air.
Y = 1 μ ˙ ρ w ( p D p S ) + μ ˙ R T ln ( p D p S ) + 1 2 ( V D 2 V S 2 ) + g ( z D z S )
In Equation (9), V S and V D are the superficial velocities in the inlet and discharge pipes, respectively. The total superficial velocities can be determined using the total flow rate ( Q t ) and the cross-sectional areas of the suction and discharge pipes ( A S and A D ), as shown in Equations (10) and (11). The superficial velocity of a specific phase is a hypothetical velocity of the phase if it alone occupies the entire cross-sectional area of the pipe, while the total superficial velocity in each pipe is the sum of the individual superficial velocities of each phase. z S and z D are the static heights of suction and discharge pipes, respectively. g is the acceleration due to gravity. The rotational Reynolds number (Re ω ) of the single-phase flow of water is determined by Equation (12), where μ w is the dynamic viscosity of water. Likewise, the liquid-to-gas density ratio ( D R ) is determined using Equation (13). Further details about the calculations can be found in references [29,82]. All the covered flow conditions are listed in Table 4.
V S = Q t A S
V D = Q t A D
Re ω = ρ w ω D 2 2 μ w
D R = ρ w ρ a

4. Measurements of Two-Phase Pumping Performance

The performance hysteresis was investigated by setting the pump flow conditions according to three various experimental approaches. As discussed before, significant performance variations can take place for identical two-phase flow conditions, according to whether the air flow is set starting from a low value or a high value. The three approaches are explained in Figure 12 and below:
  • First measurement approach (Figure 12a).
    • Full closing of the motorized gate valve.
    • Progressive increasing of the water flow rate by opening the motorized valve.
    • Progressive increasing of the air flow rate until reaching the desired air volume fraction and recording the measurement points after attaining a steady-state.
  • Second measurement approach (Figure 12b).
    • Full opening of the motorized gate valve.
    • Progressive increasing of the air flow rate until reaching the desired air volume fraction of the first measurement point.
    • Reducing the air flow rate to set the following measurement point.
    • Reducing the water flow rate until attaining the desired gas volume fraction and recording the measurement points after attaining a steady-state.
  • Third measurement approach (Figure 12c).
    • Setting a single-phase water flow and keeping the water gate valve fixed.
    • Progressive increasing of the air flow rate and recording the measurement points after attaining a steady-state at each air volume fraction.
    • Progressive reducing of the air flow rate and recording the measurement points again after attaining a steady-state at each air volume fraction.
Please note that the water (and total) flow rate, and the specific work delivered by the pump, have an inverse relationship with the air flow rate. As shown in Figure 12, when increasing or decreasing the air flow rate, the preset water flow rate changes accordingly due to the change in pumping performance. Therefore, to set the desired conditions of air and water, several adjustment steps may be needed. The results of the three approaches are compared in the upcoming sections for each pump configuration. The first approach was used as a standard approach, if not mentioned further.

5. Results

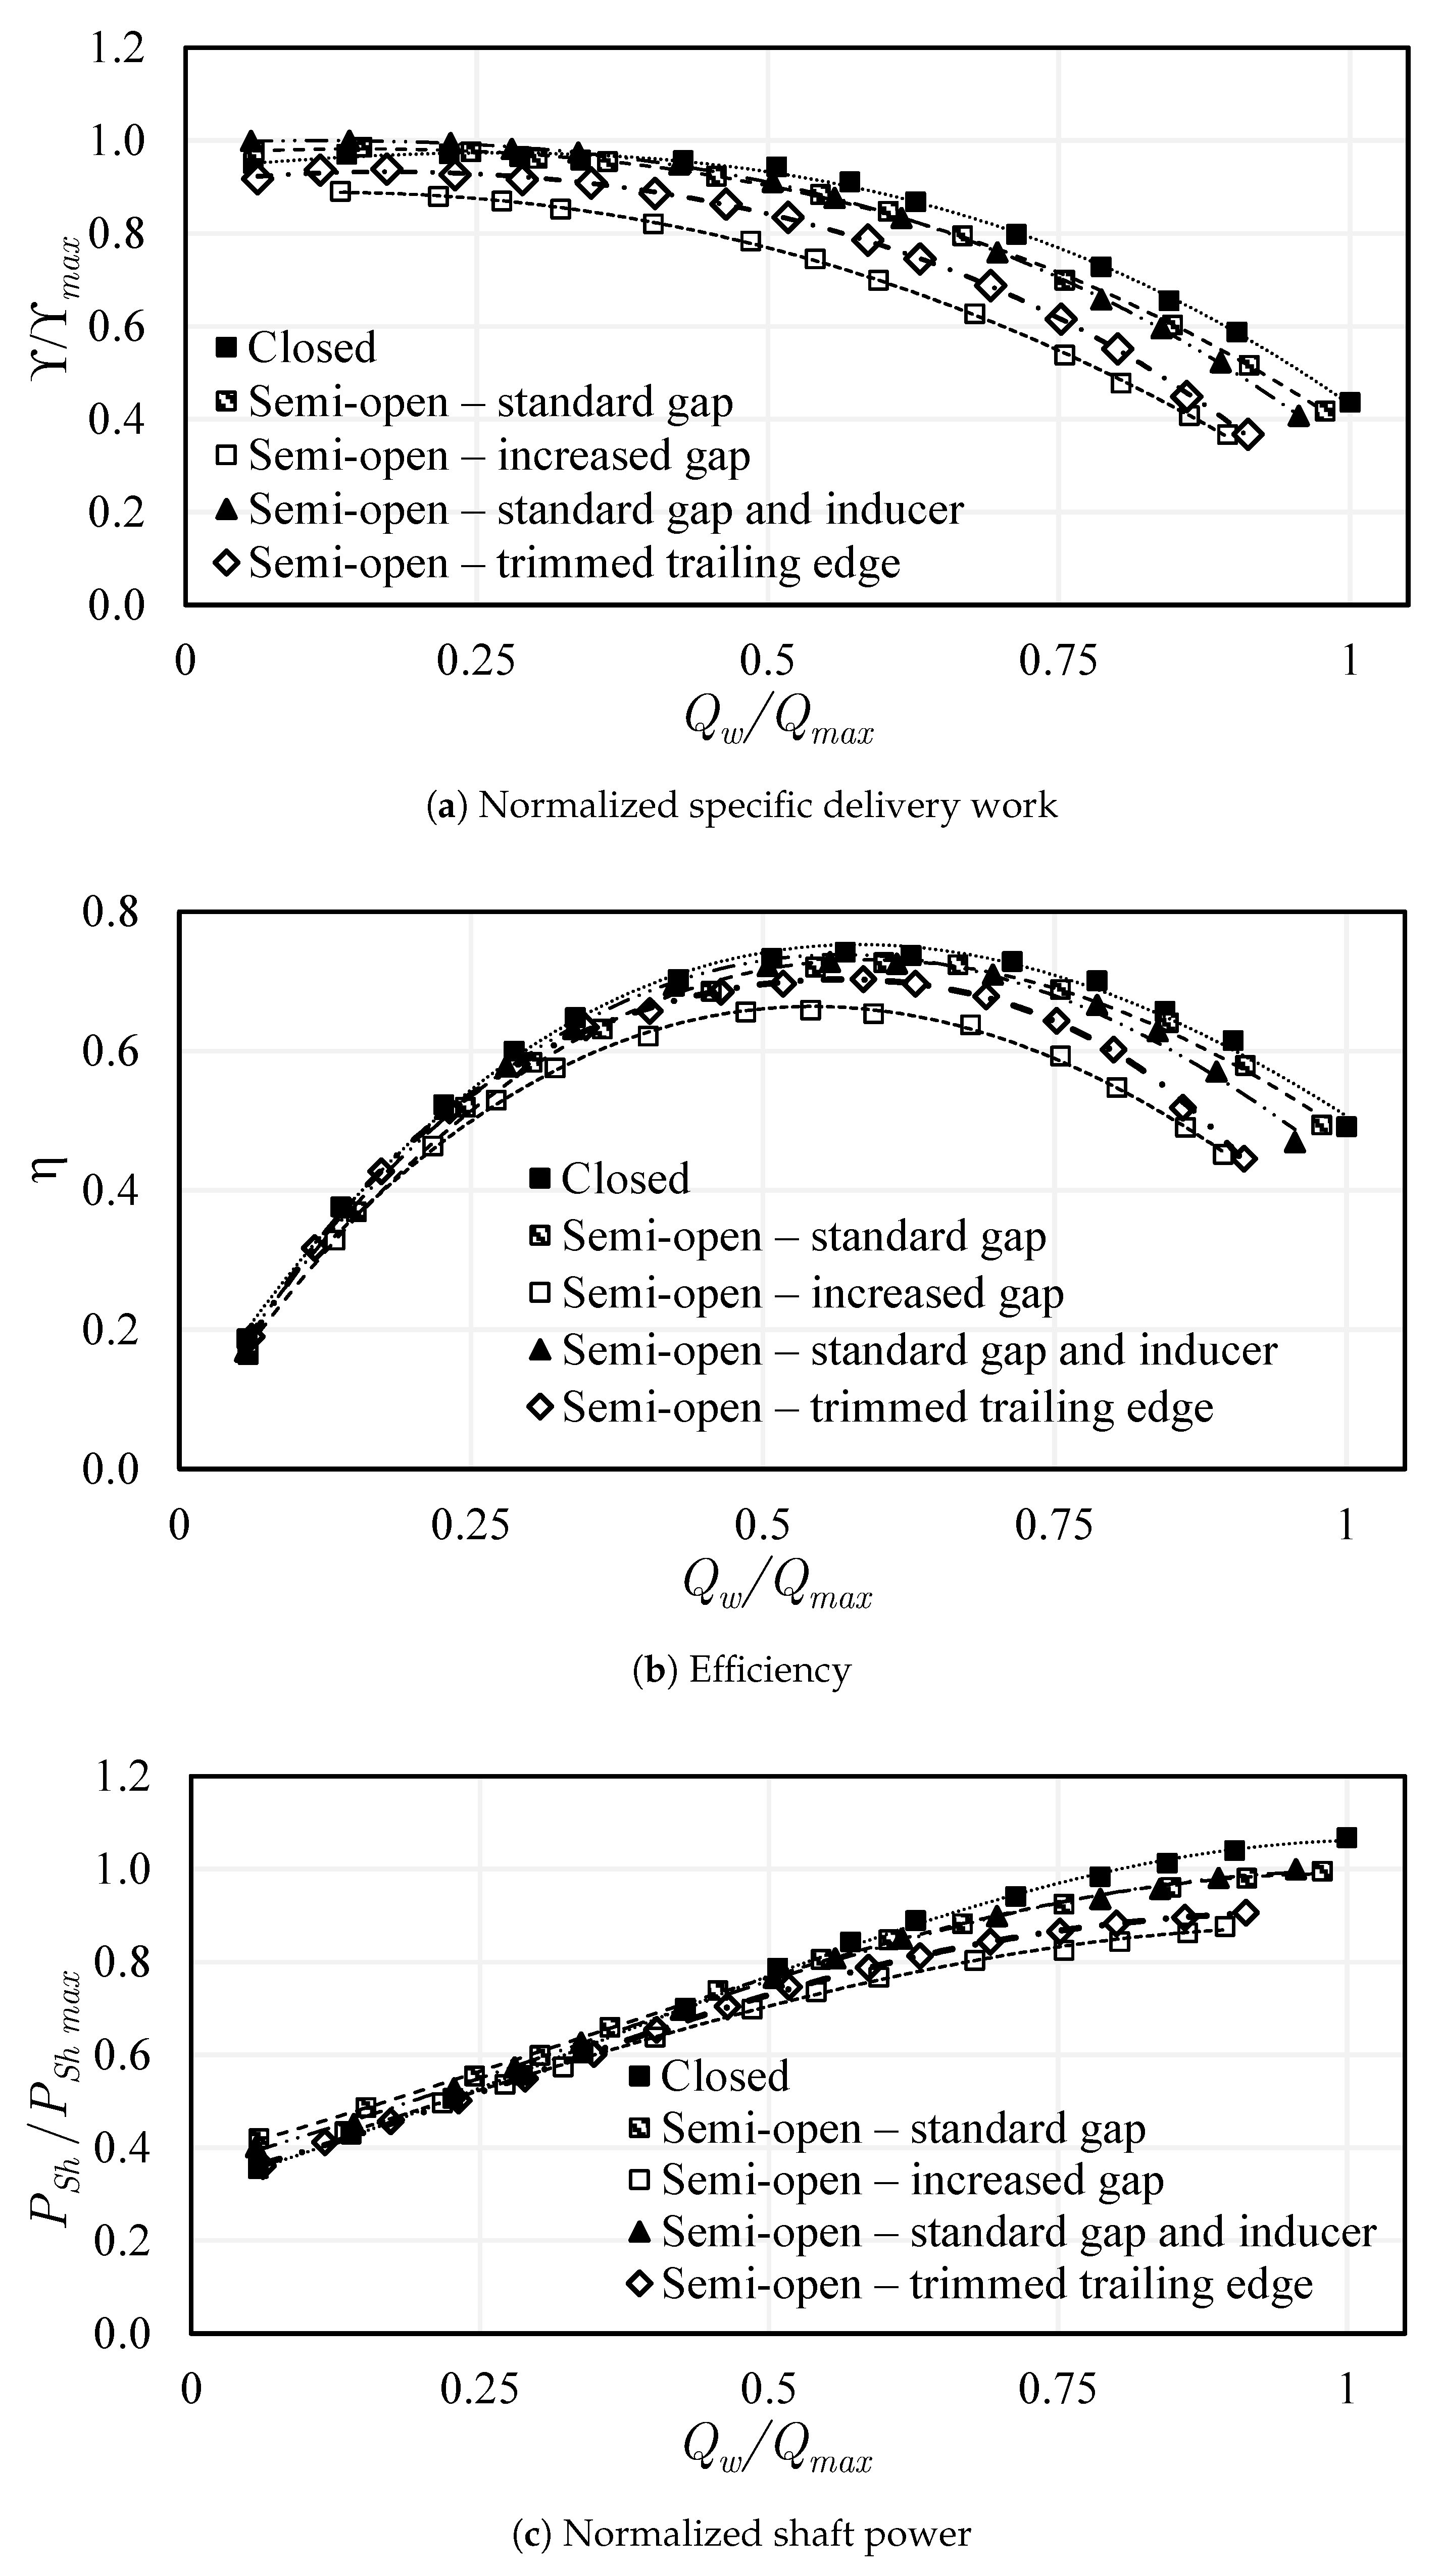
5.1. Performance of Single-Phase Flow

The curves for single-phase performance (specific delivery work, pump efficiency, and shaft power) of the first five pump configurations, i.e., at 650 rpm are shown together and compared in Figure 13. Here, the curves are normalized with the maximum values ( Q m a x , Y m a x , and P S h m a x ) to ensure fair comparisons. However, the optimal conditions ( Q o p t , Y o p t , and P S h o p t ), which correspond to the maximum efficiency of each case, are used for normalization when comparing configurations 5 (650 rpm) and 6 (1000 rpm) in Figure 14, and in the following sections when discussing each pump case individually. The pump performance was averaged over a period of time to eliminate any possible error related to flow rate fluctuation, ensuring accurate determination of each data point. For each measurement, 200 data points were always collected at a frequency of 4 Hz. This was found to be adequate for no-surging conditions; it was possible to obtain identical data points by repeating multiple measurements under the same conditions.
Comparing the performance of the single-phase flow of the closed impeller to that of the semi-open impeller with a standard gap, it can be recognized that the closed impeller performs slightly better than the semi-open impeller, particularly at overload conditions (2–4.5% higher). Similarly, the efficiency of the closed impeller is, overall, 1 to 3% higher than that of the semi-open impeller with a standard gap, due to the volumetric losses that occur across the tip clearance gap. The losses shift the location of the maximum efficiency slightly to a higher volume flow rate. Nevertheless, with the increased gap, the volumetric loss rises considerably, which causes the location of the maximum efficiency to shift back to a lower volume flow rate and decreases efficiency at overload conditions. When the tip clearance gap is increased, all curves show a greater drop. Comparing the increased gap to the standard gap case, reductions of between 1% to 14% in efficiency, 9% to 40% in specific delivery work, and 7% to 8% in shaft power occur.
The performance of the pump is marginally improved at part-load conditions by installing the inducer with a standard gap semi-open impeller. However, under overload conditions, the performance is slightly reduced. This is primarily caused by an increase in shock losses due to flow separation and the generated axial vortices on the inducer blades at high flow rates. Additionally, inducers usually have a steep Q-H curve. Accordingly, a limited improvement in pumping performance is achieved at high flows [20,29,91,96,97]
As can be seen, over the entire working flow range, the round trailing edge (RTE) impeller (marked as a semi-open impeller with a standard gap) consistently outperforms the trimmed trailing edge (TTE, i.e., non-profiled) impeller. This is more obvious in overload conditions, where the normalized specific delivery work of the TTE impeller decreases by about 29% compared to the RTE impeller, while, in part-load conditions, the drop is limited to about 7.5%. The efficiency curves of the two designs show only minor variations under part-load conditions, while the efficiency of the TTE impeller is noticeably lower than that of the RTE impeller under overload conditions. As a result, the effective working flow range of the TTE impeller becomes narrower, whereas the maximum efficiency point is slightly shifted to a lower volume flow rate. Note that the RTE profile has a greater length between the blades near the outlet diameter of the impeller compared to that of the TTE. This helps to increase the pressure head since the flow velocity is more efficiently decreased near the impeller outlet. Furthermore, the RTE design improves the interaction between the volute tongue and the rotating impeller blades, which boosts performance [31].
When comparing the two rotational speeds for pump configurations 5 and 6, using the trimmed trailing edge semi-open impeller with a standard gap, as depicted in Figure 14, the normalized curves are nearly identical for both rotational speeds in the case of a single-phase flow, as usual. On the non-normalized scales, the effective working flow range of the higher rotational speed is, of course, broader (not shown). Overall, to ensure the highest possible performance for single-phase flow, the closed impeller would be preferred over the semi-open impeller, the standard gap over the increased gap, and the round (profiled) trailing edge over the trimmed (non-profiled) trailing edge.

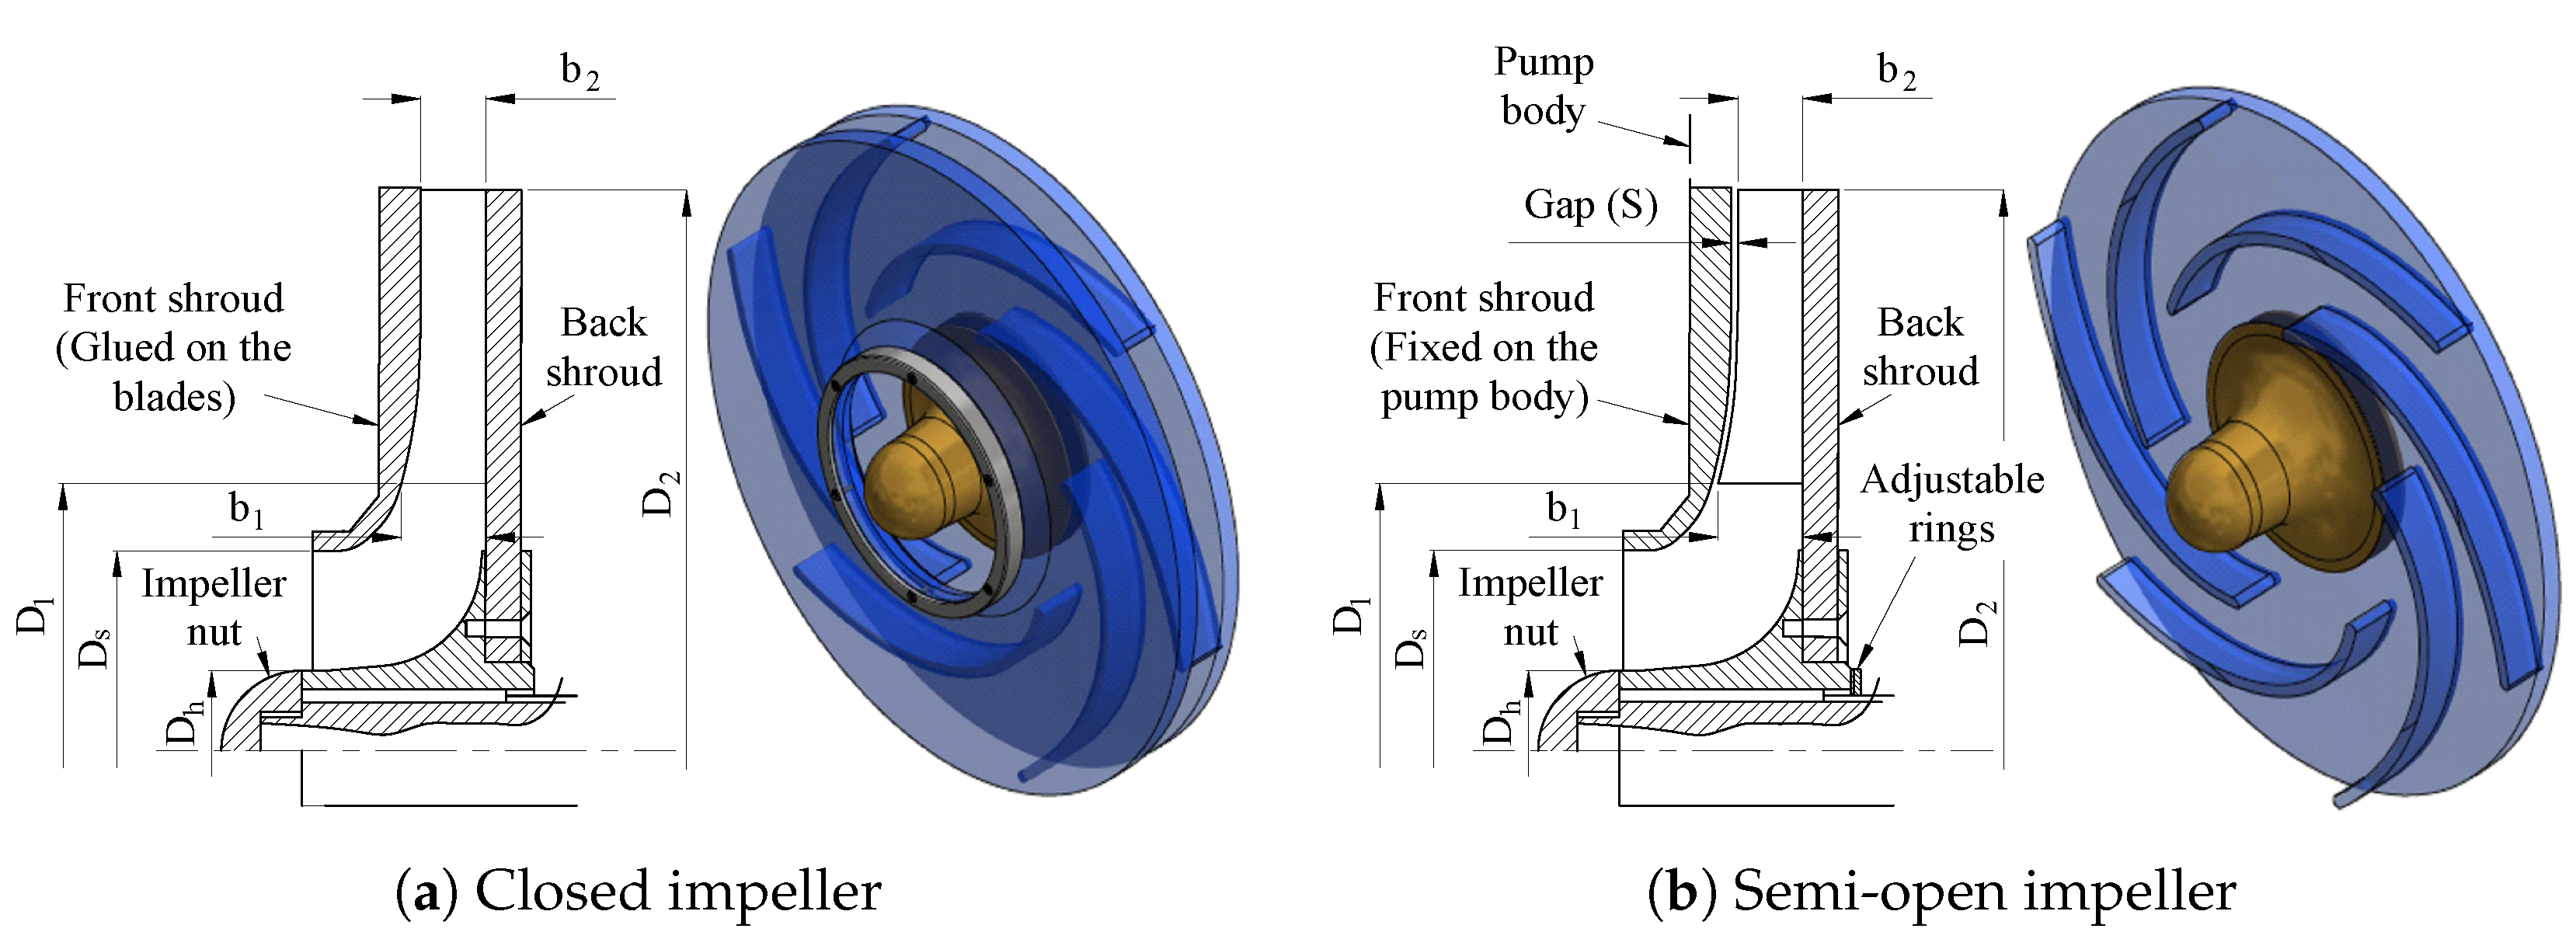
5.2. Pump Configuration 1: Closed Impeller

Figure 15a–c, respectively, depict the normalized specific delivery work, efficiency, and normalized shaft power of the closed impeller. The data points obtained by the first (black-filled markers) and third experimental approaches are shown concurrently in Figure 15. For the third method, data points recorded while raising the gas volume fraction are shown with hatched markers, and data points recorded while lowering the gas volume fraction are shown with non-filled markers. Additionally, gray markers display the data points that could be captured during pump surging. Each dotted line represents the trend line of the data recorded by the first approach for a constant gas volume fraction. The same annotations are used for the performance curves of all the subsequent pump configurations.
As shown in Figure 15, the pump parameters ( Y , η , and P S h ) decrease continuously, as the air volume flow is increased. In addition, the operating flow range of the pump becomes gradually narrower. The pump breakdown occurs at part-load for Q t / Q o p t roughly lower than 0.5. Additionally, the maximum pump flow rate steadily decreases as the air flow increases, which prevents the transfer of kinetic energy.
The regions of cavitation, breakdown, and surging, i.e., all critical conditions, are also indicated in Figure 15a. To identify the cavitation, breakdown, and surging regions, the pump flow conditions were changed starting from multiple stable points near each critical region. Subsequently, these critical and undesirable regions were reported based on their occurrences in the measurements, and their positions were drawn manually onto the performance curve for each case. This was done to highlight and compare the ranges for the safe or critical transport of single and two-phase flow by the pump in each case.
Cavitation takes place normally very close to the maximum flow rate for the single-phase flow. Sometimes, cavitation was observed first near the volute tongue due to the strong separation that occurs at maximum flow, which allows the pressure to drop below the vapor pressure of the liquid. When a tiny amount of air enters the impeller, cavitation can, however, be easily suppressed. Similar observations were reported and discussed in references [41,78]. In reference [41], it was shown that air contents of 0.3 to 1% can considerably decrease the suction pressure pulsation due to cavitation by a factor of 5.
In the breakdown conditions, despite the impeller rotation, the pump fails to transport the flow. In the pump surging zone, intense instabilities in the delivery occur, together with strong system vibrations. In this instance, the pump swings simultaneously between two different operational conditions. Pump surging mainly takes place for ε 6 % for the closed impeller. Under surging conditions, the flow behavior and two-phase interactions become strongly unstable within the impeller. Additionally, a non-uniform distribution of the two-phase flow occurs within the volute flow; however, no large gas accumulations are observed there (in the volute).
Figure 16 compares the data recorded by the first and second approaches. The results of the first approach are displayed using filled markers and dotted trend lines, while the results of the second approach are provided using empty markers and dashed trend lines. When comparing all results from the various approaches, no discernible performance hysteresis could be seen for the closed impeller.

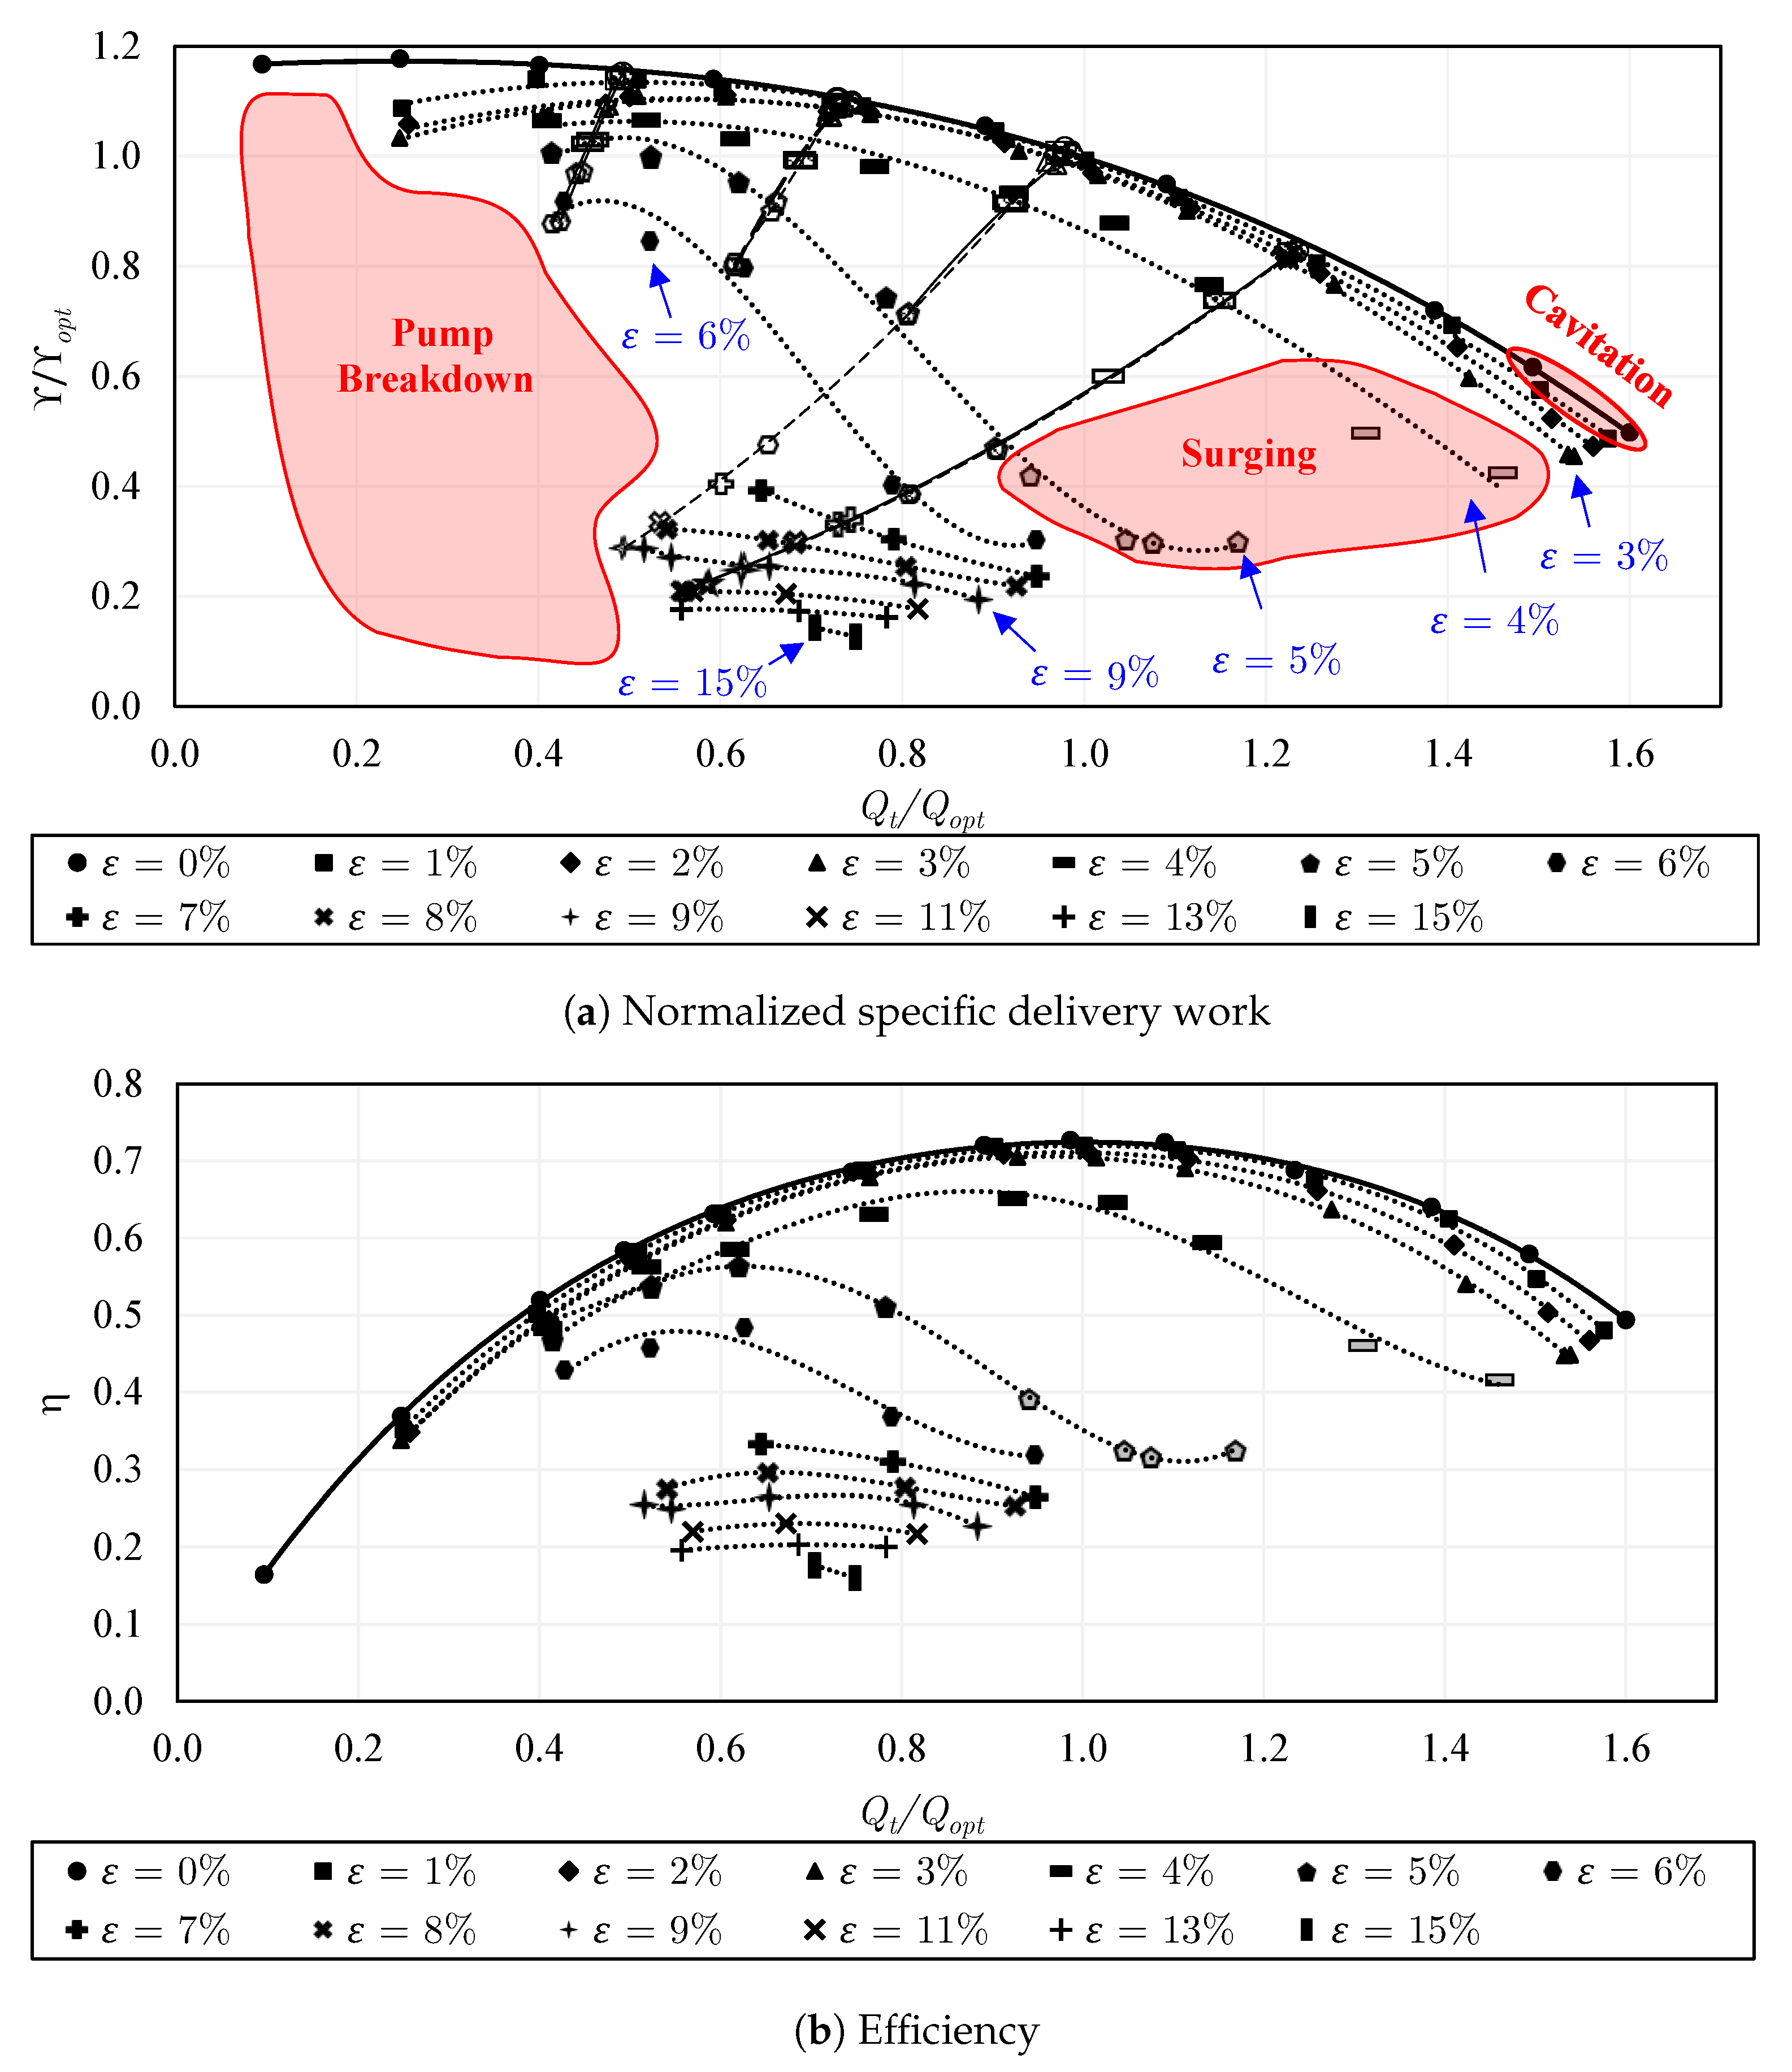
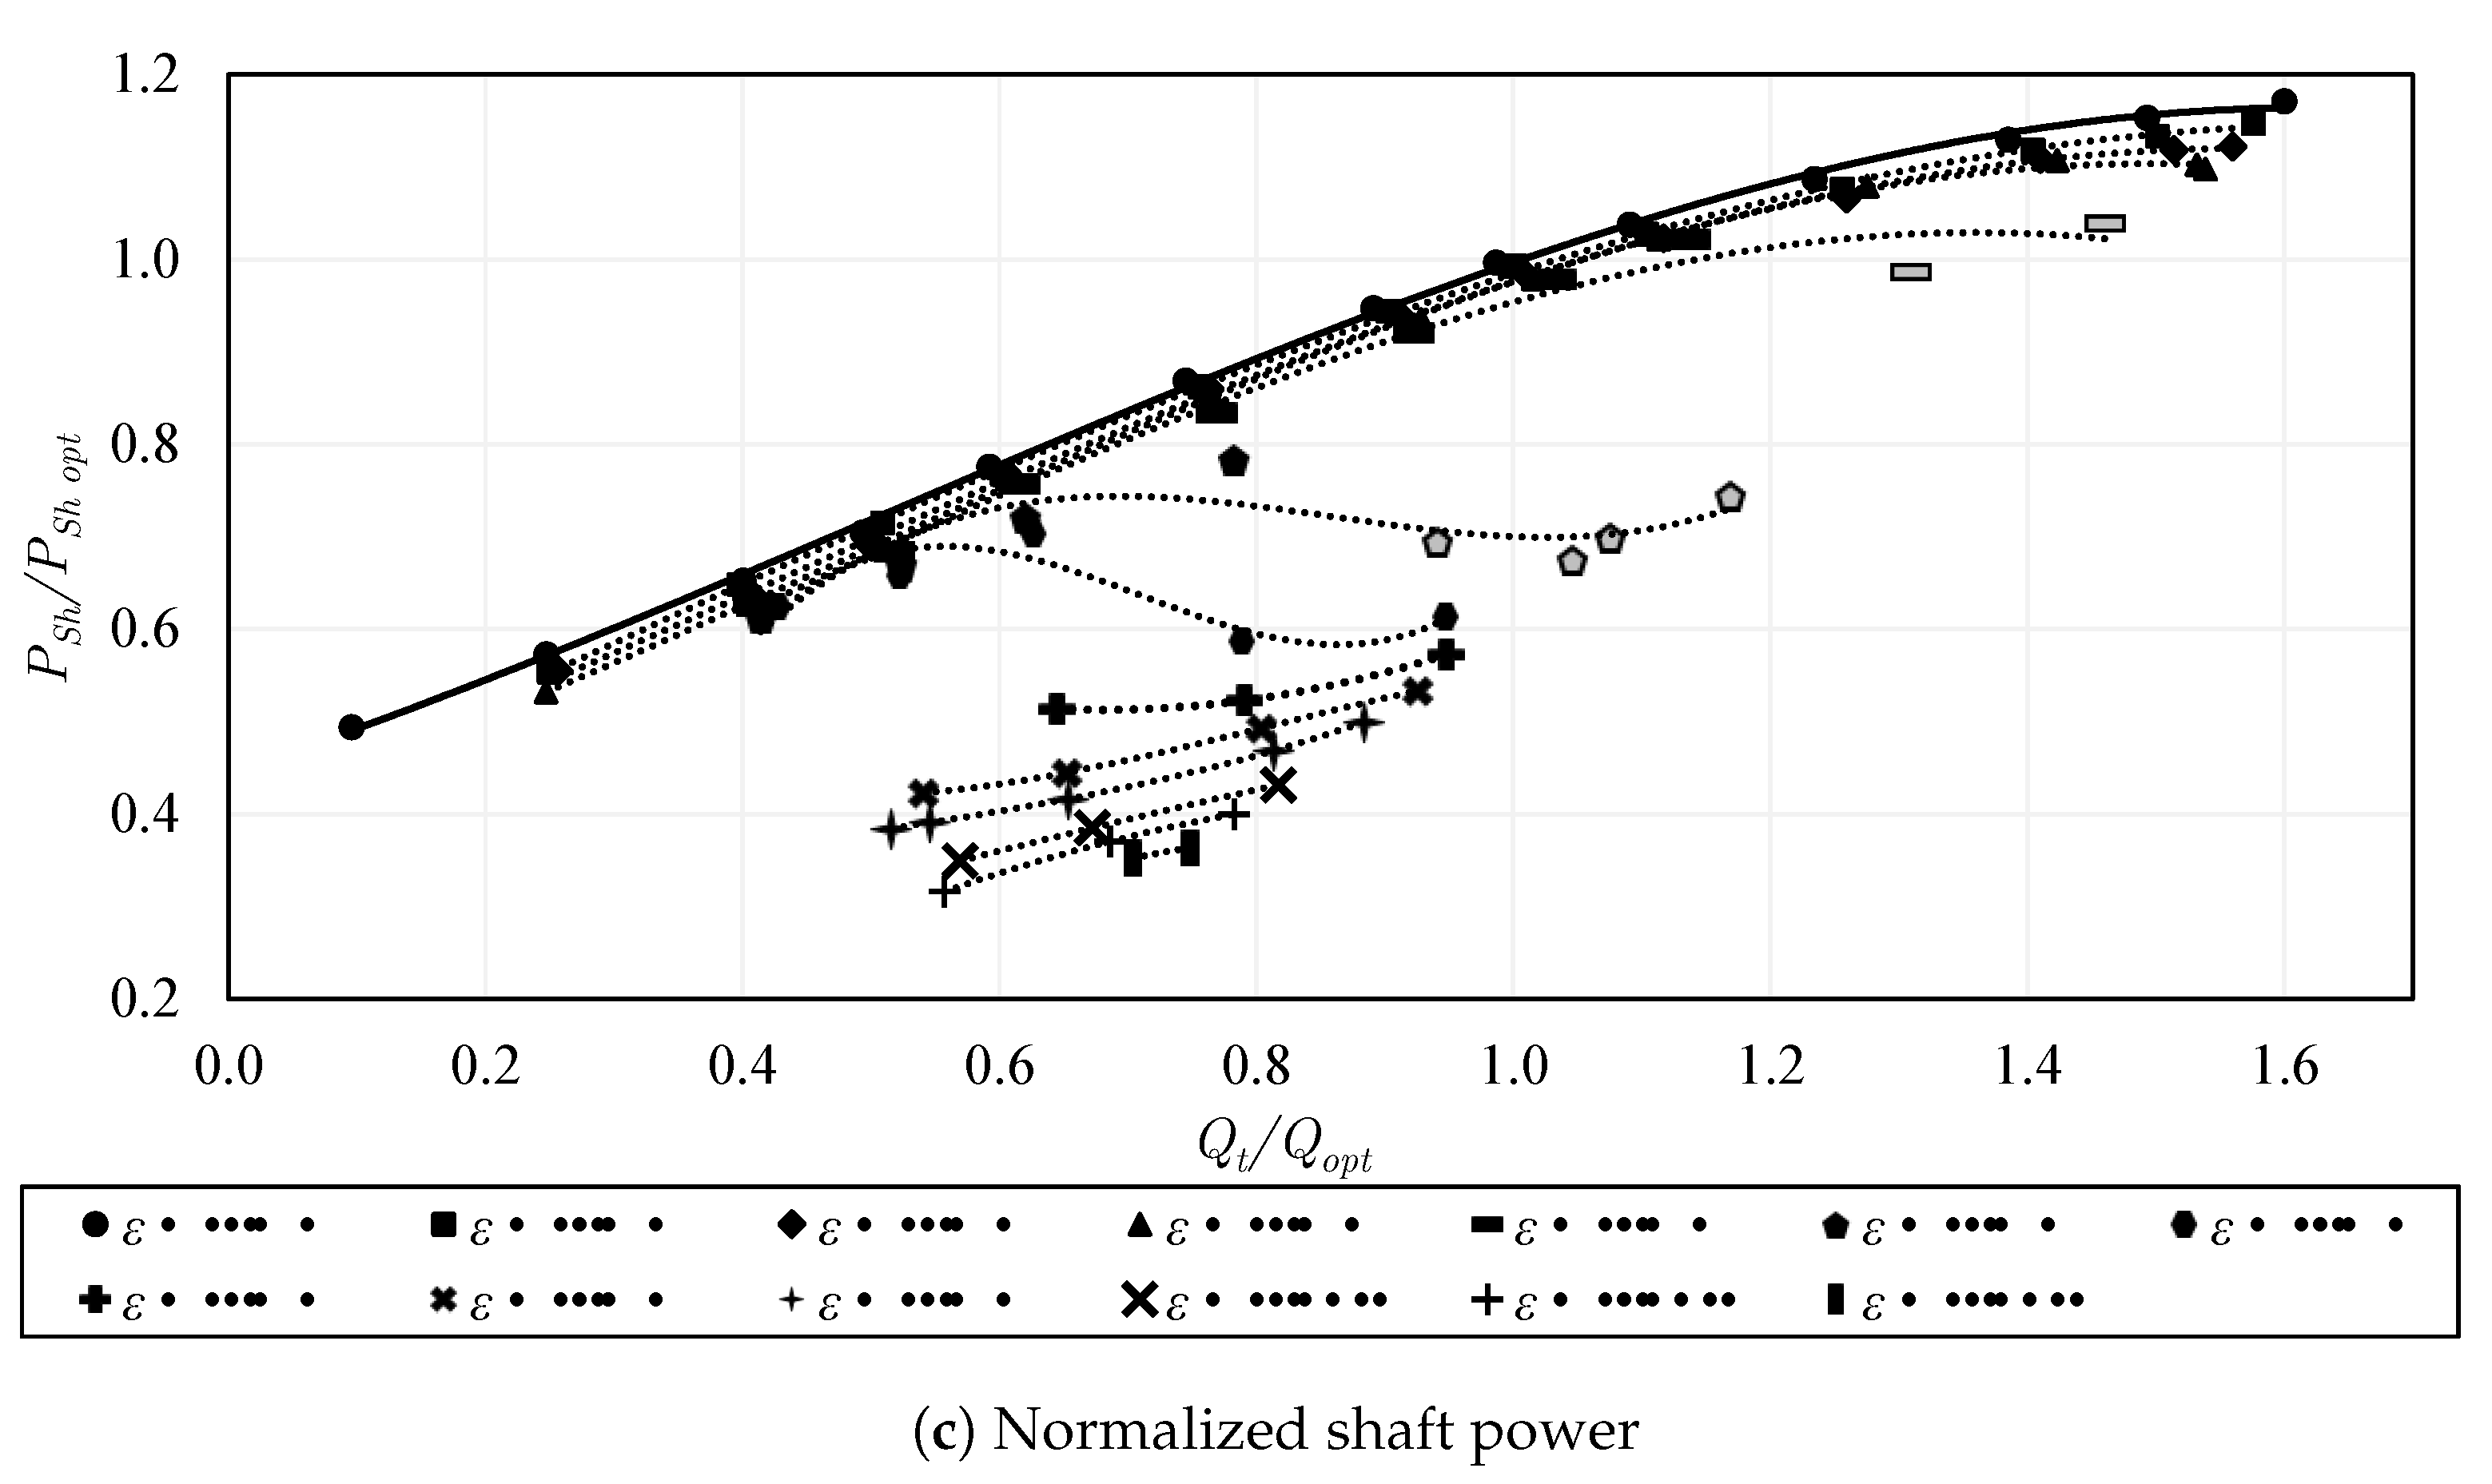
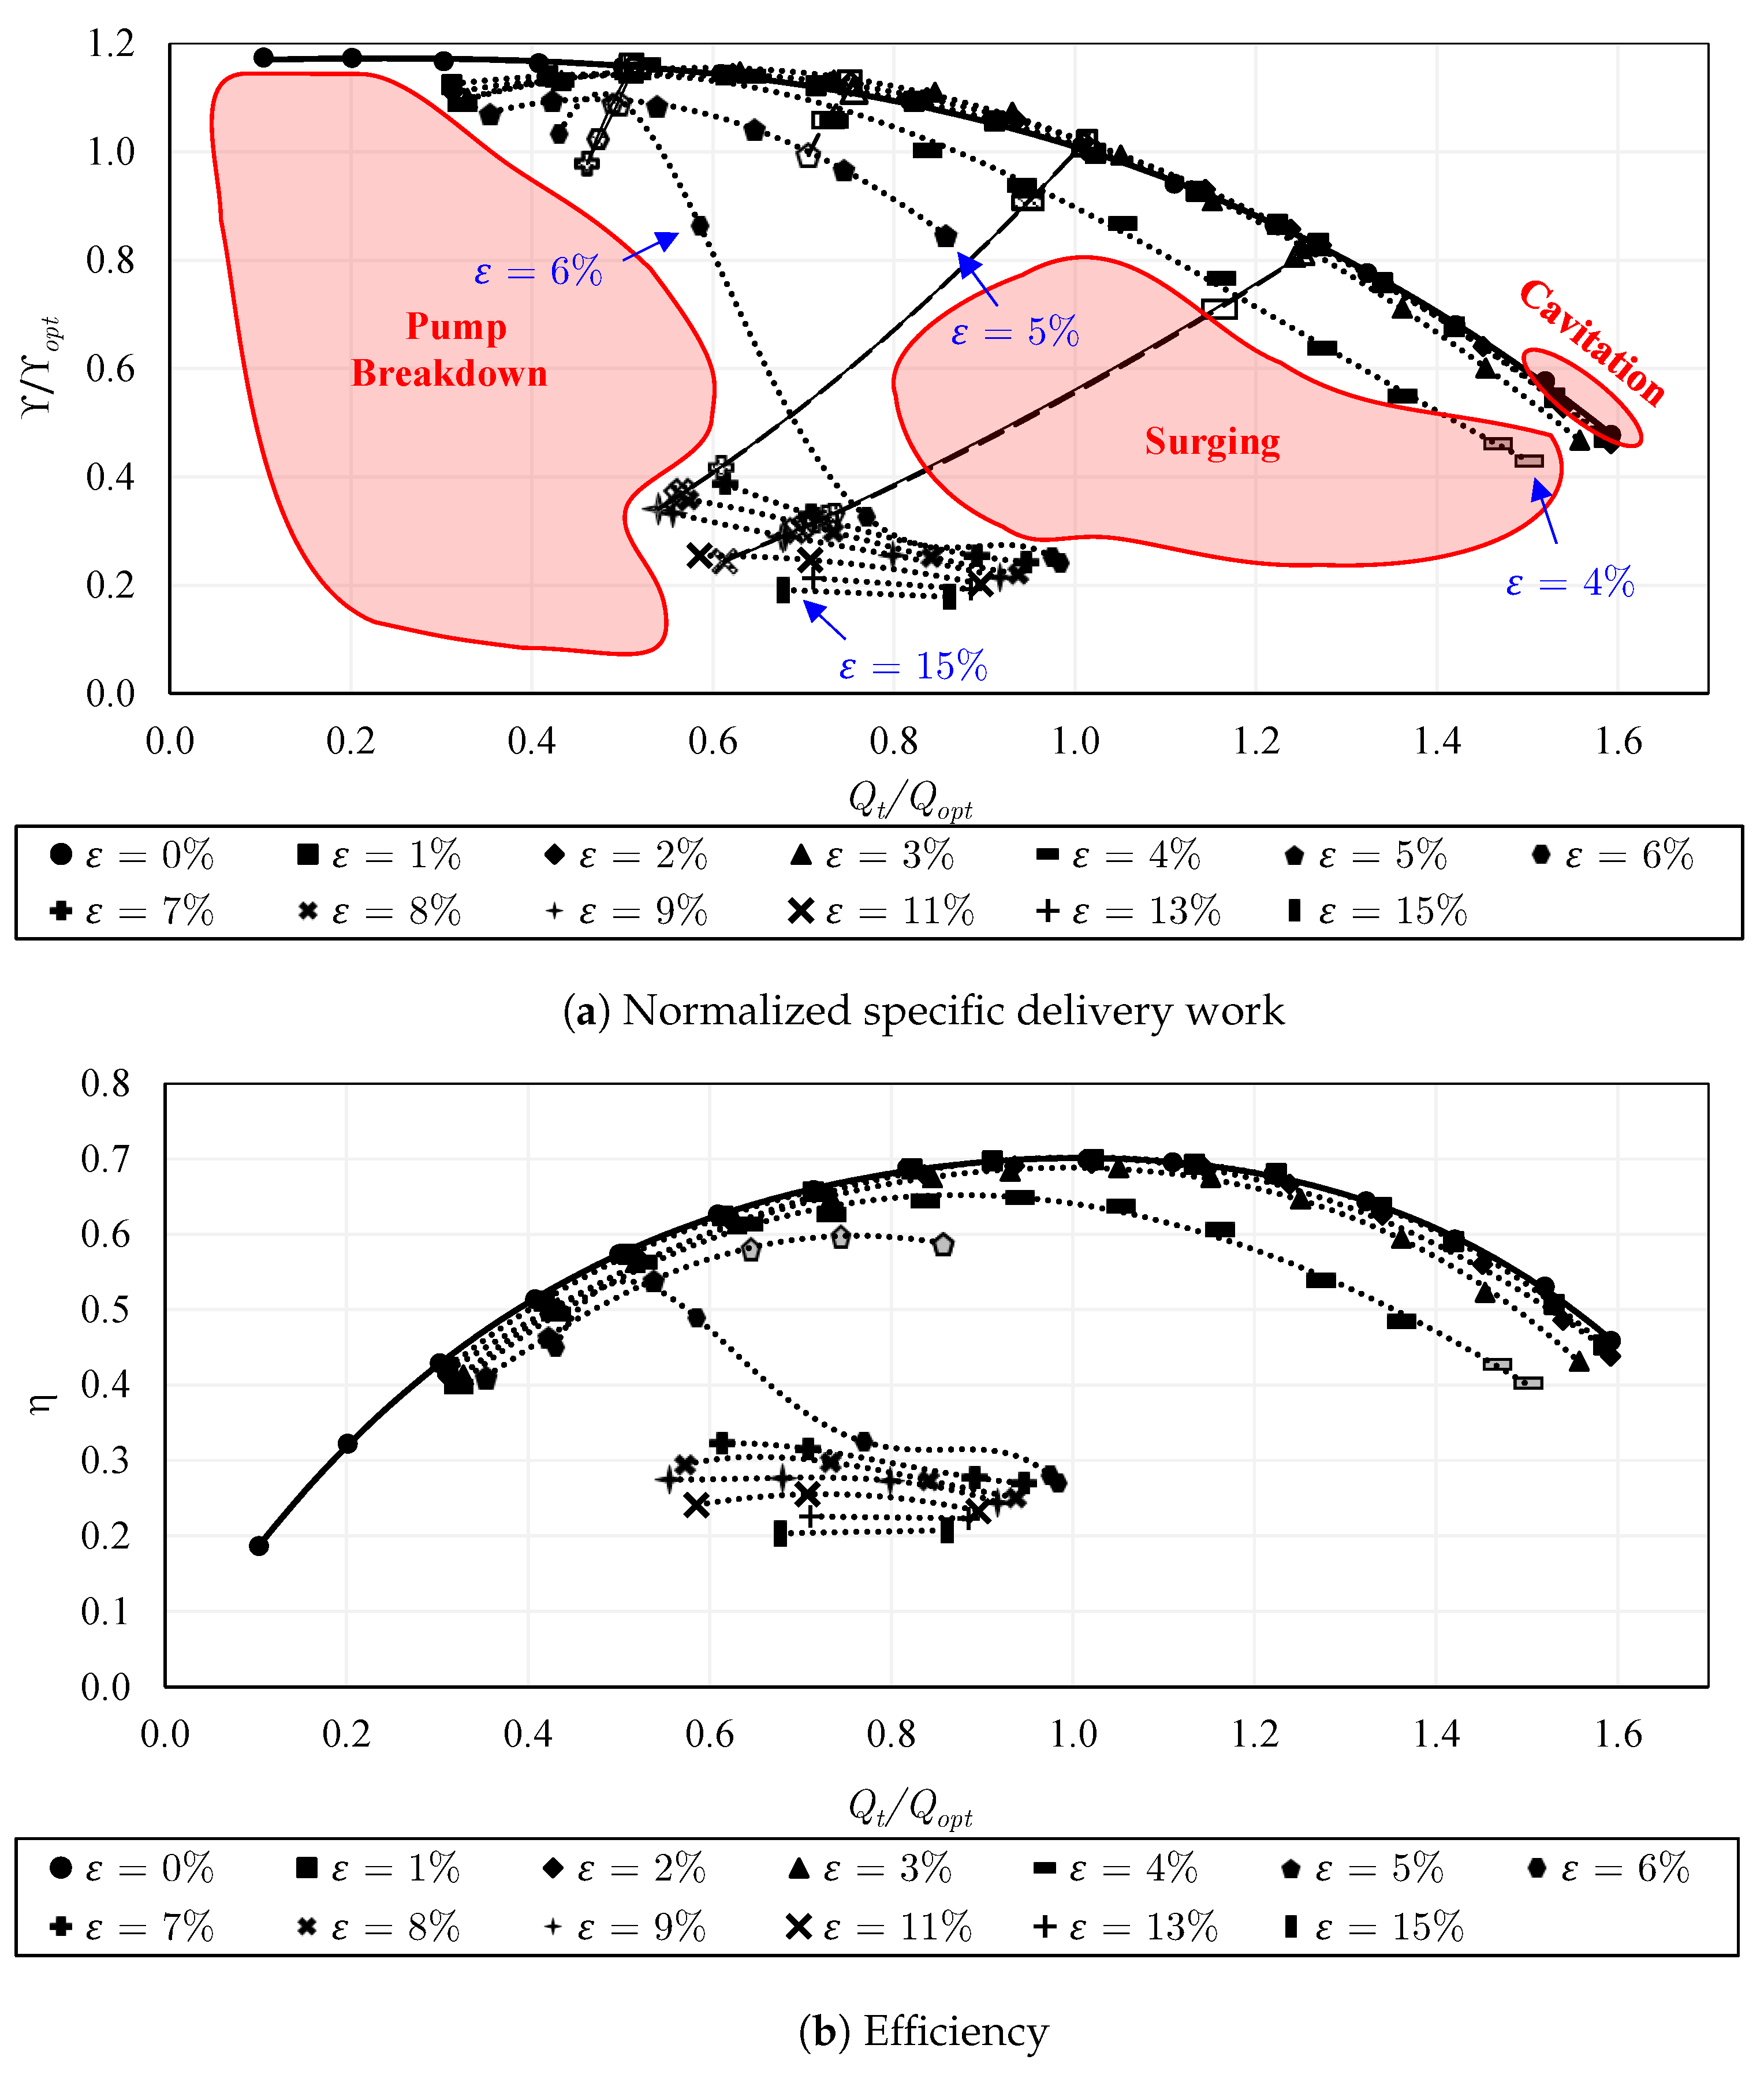
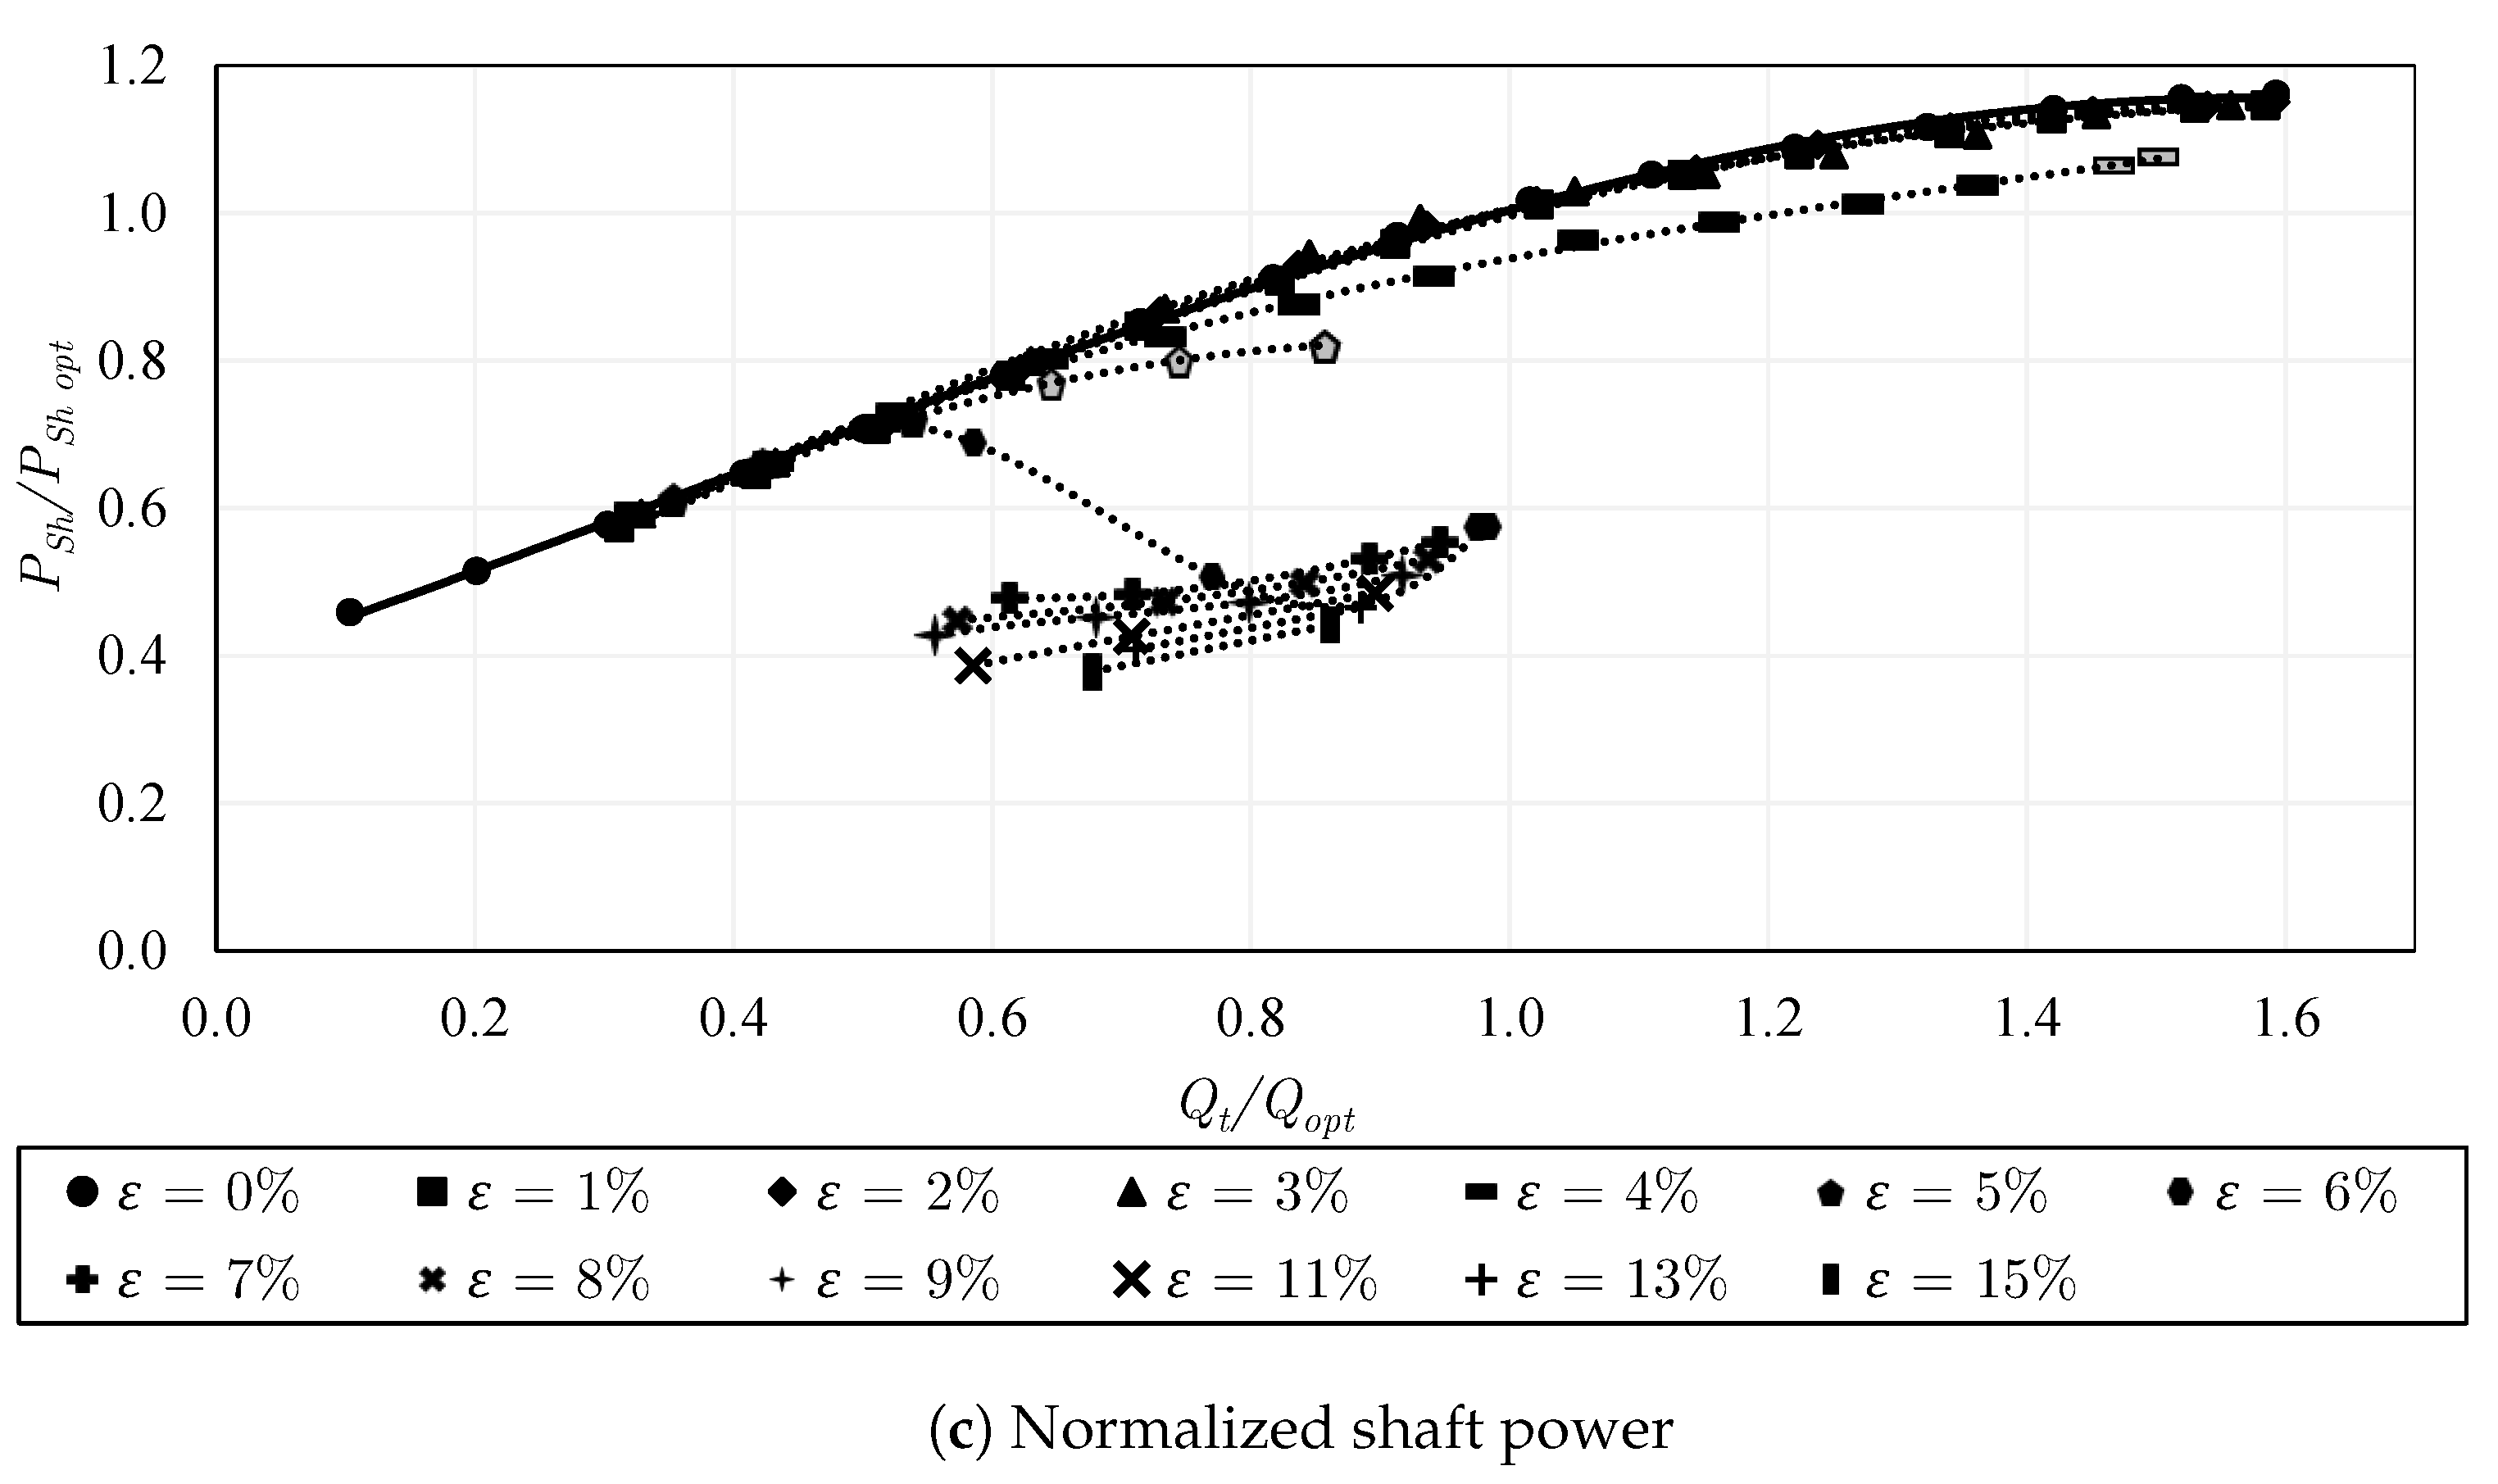
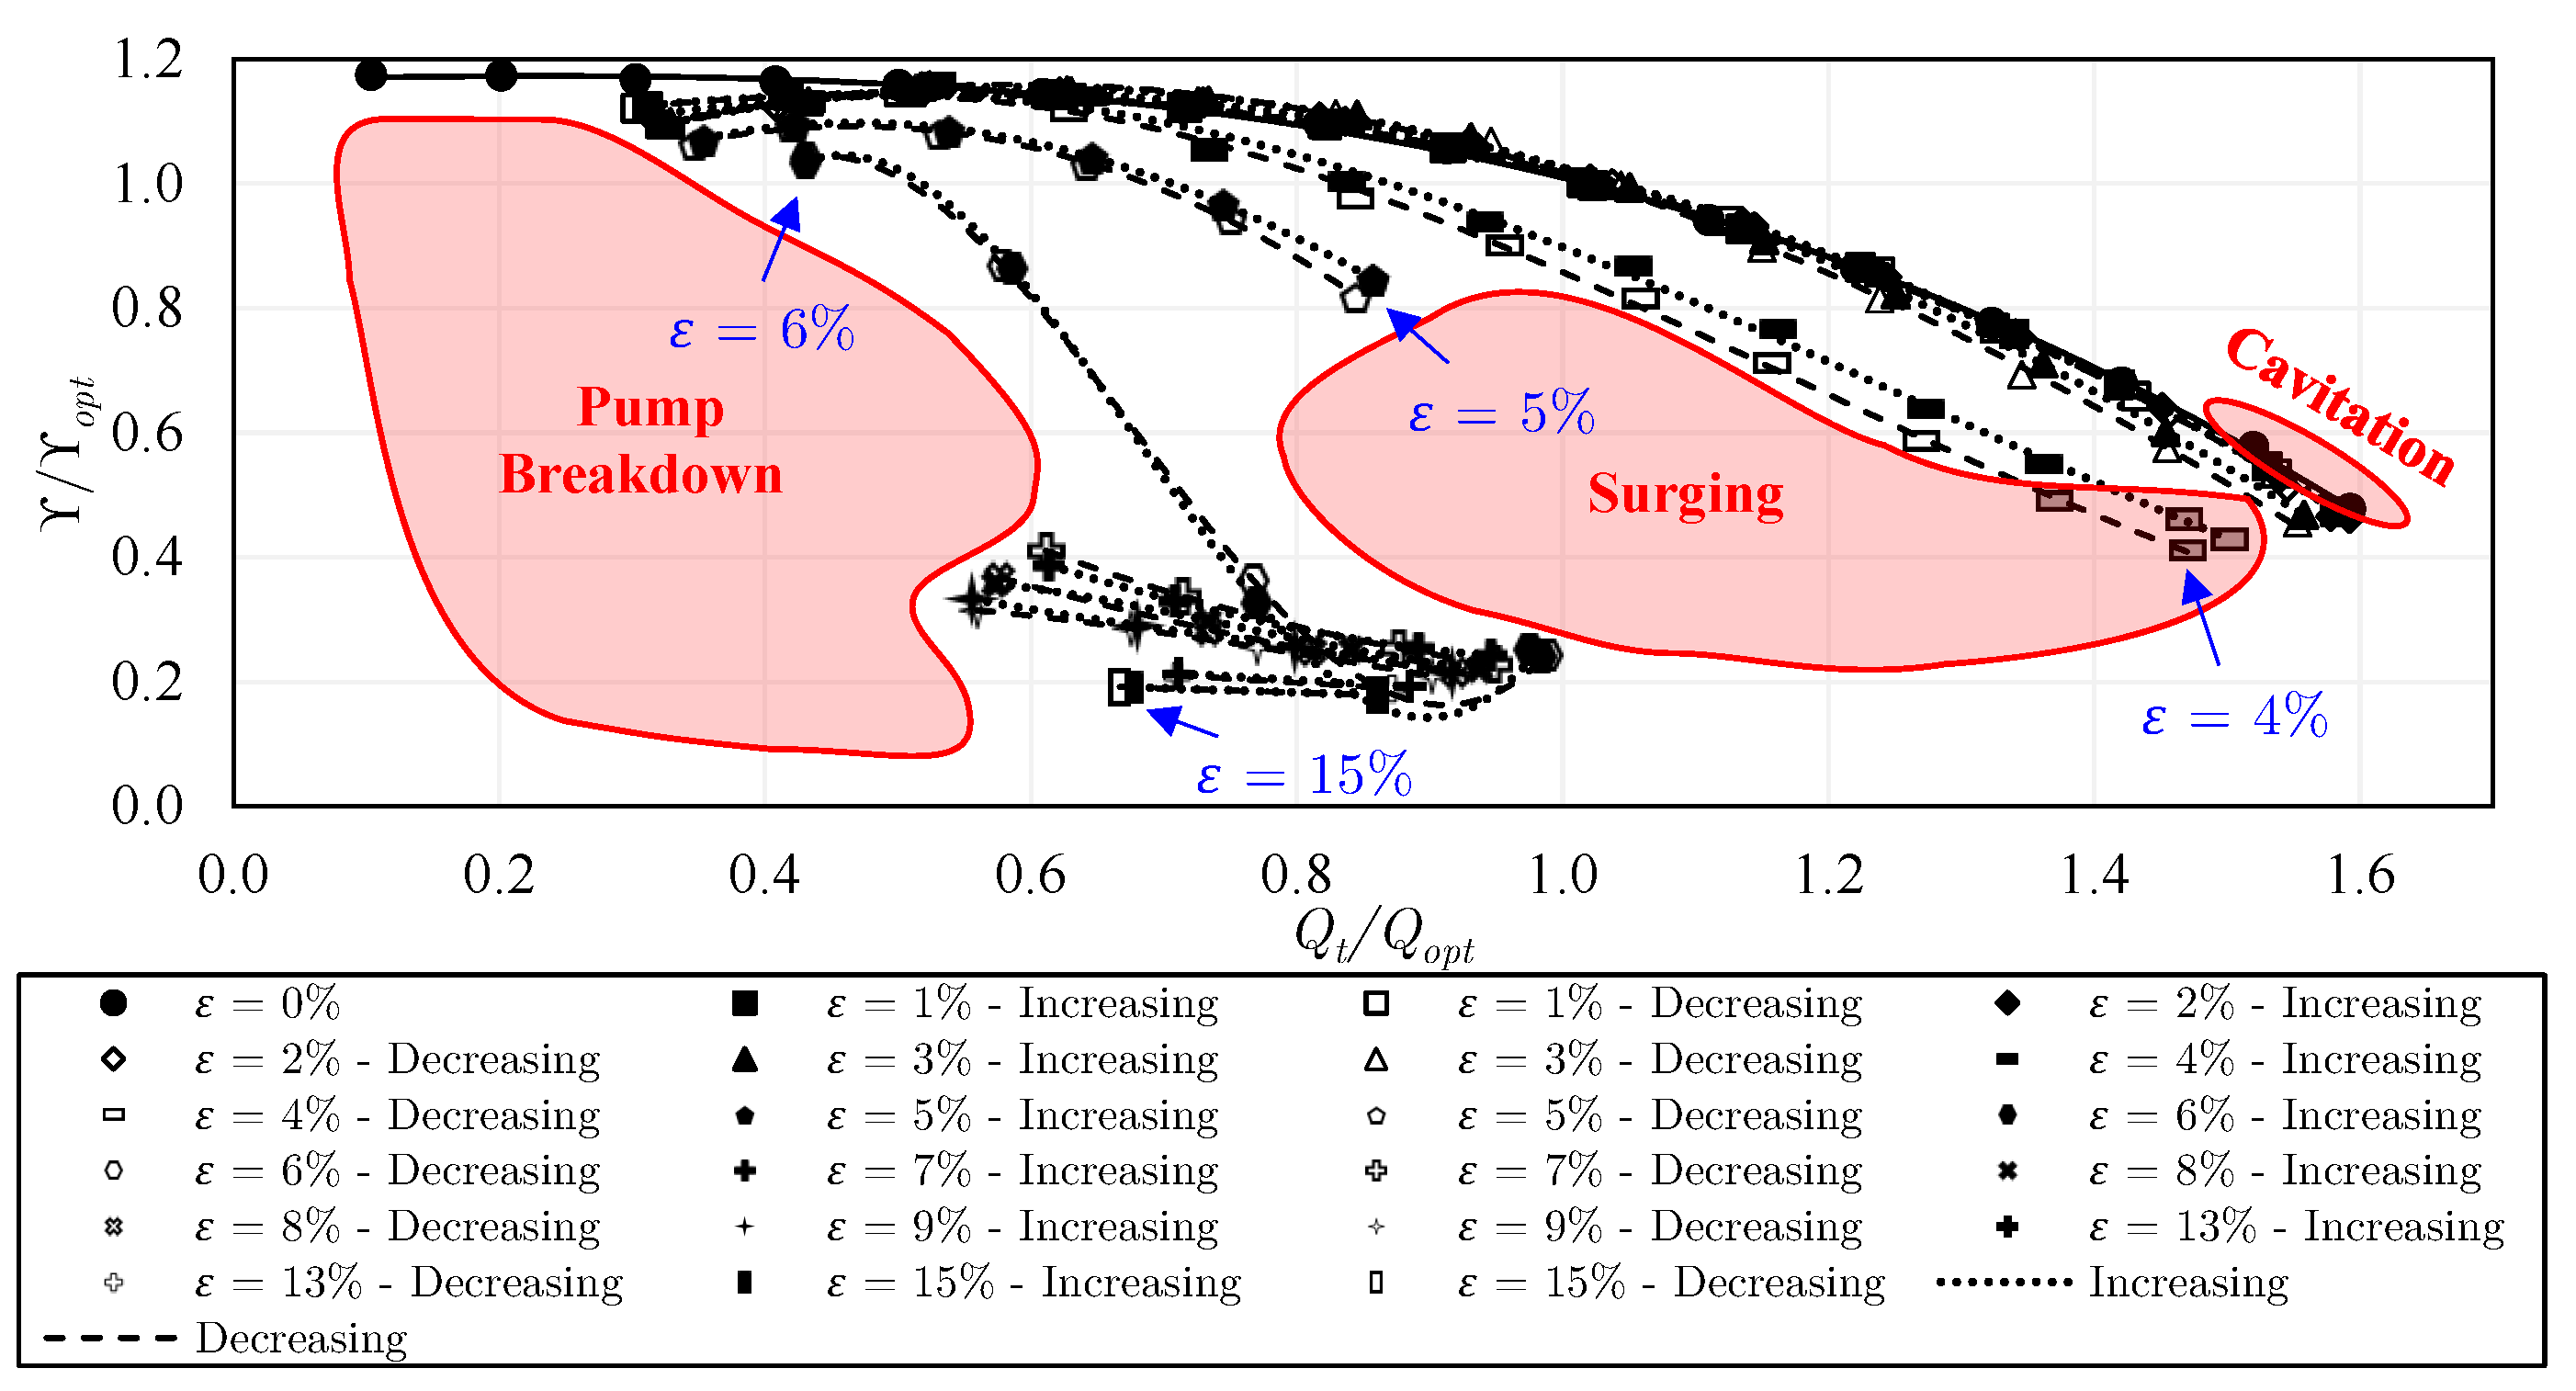
5.3. Pump Configuration 2: Semi-Open Impeller with a Standard Gap

The performance of the (round trailing edge) semi-open impeller with a standard gap is presented in Figure 17. Again, the curves become gradually narrower as ε is increased. Until a 3 % gas volume fraction, the variables are only insignificantly affected, performing better than the closed impeller in this range. Nonetheless, within ε = 4 to 6 % , a strong reduction in the pump performance is observed. The reduction is less evident in the range of 0.4 Q t / Q o p t 0.6 . Thereafter, for ε > 6 % , the semi-open impeller performs marginally better than the closed impeller.
Strong hysteresis occurs in this pump configuration when comparing the data of the different measurement approaches. This is happening specifically during air reduction in the third approach for ε = 4 % and ε = 6 % . The results of the third approach differ significantly from those of the first approach. For instance, the specific delivery work and the pump capacity of the third experimental approach are 20% and 11% lower than those of the first approach, respectively. When the gas is decreased from a primarily high value, as carried out in the third approach, a large amount of air enters and accumulates on the blades before recording the data point. For some data points, it was impossible to remove the formerly accumulated gas by simply reducing the gas flow rate to lower values. Consequently, the performance results are obviously lower if recorded using the third approach compared to the other approaches for the “same” conditions.
As discussed before, the separation of the liquid stream, and the dissimilar centrifugal and Coriolis forces acting on the phases due to density differences, lead to phase segregation and large gas accumulations. This creates low-pressure zones, which force the gas bubbles to accumulate. To clear these gas accumulations, the gas flow rate must be substantially reduced or high turbulence has to be provided for an adequate time [12,13,82]. Some hysteresis takes place between the first and the second experimental approaches, as seen in Figure 18. This is visible at overload for ε = 4 % as well as ε = 5 % . The instabilities are mostly lower and less likely to happen in the semi-open impeller (with a standard gap). Pump surging occurs only for ε = 4–5% near the highest Q t / Q o p t , as shown in Figure 17a.

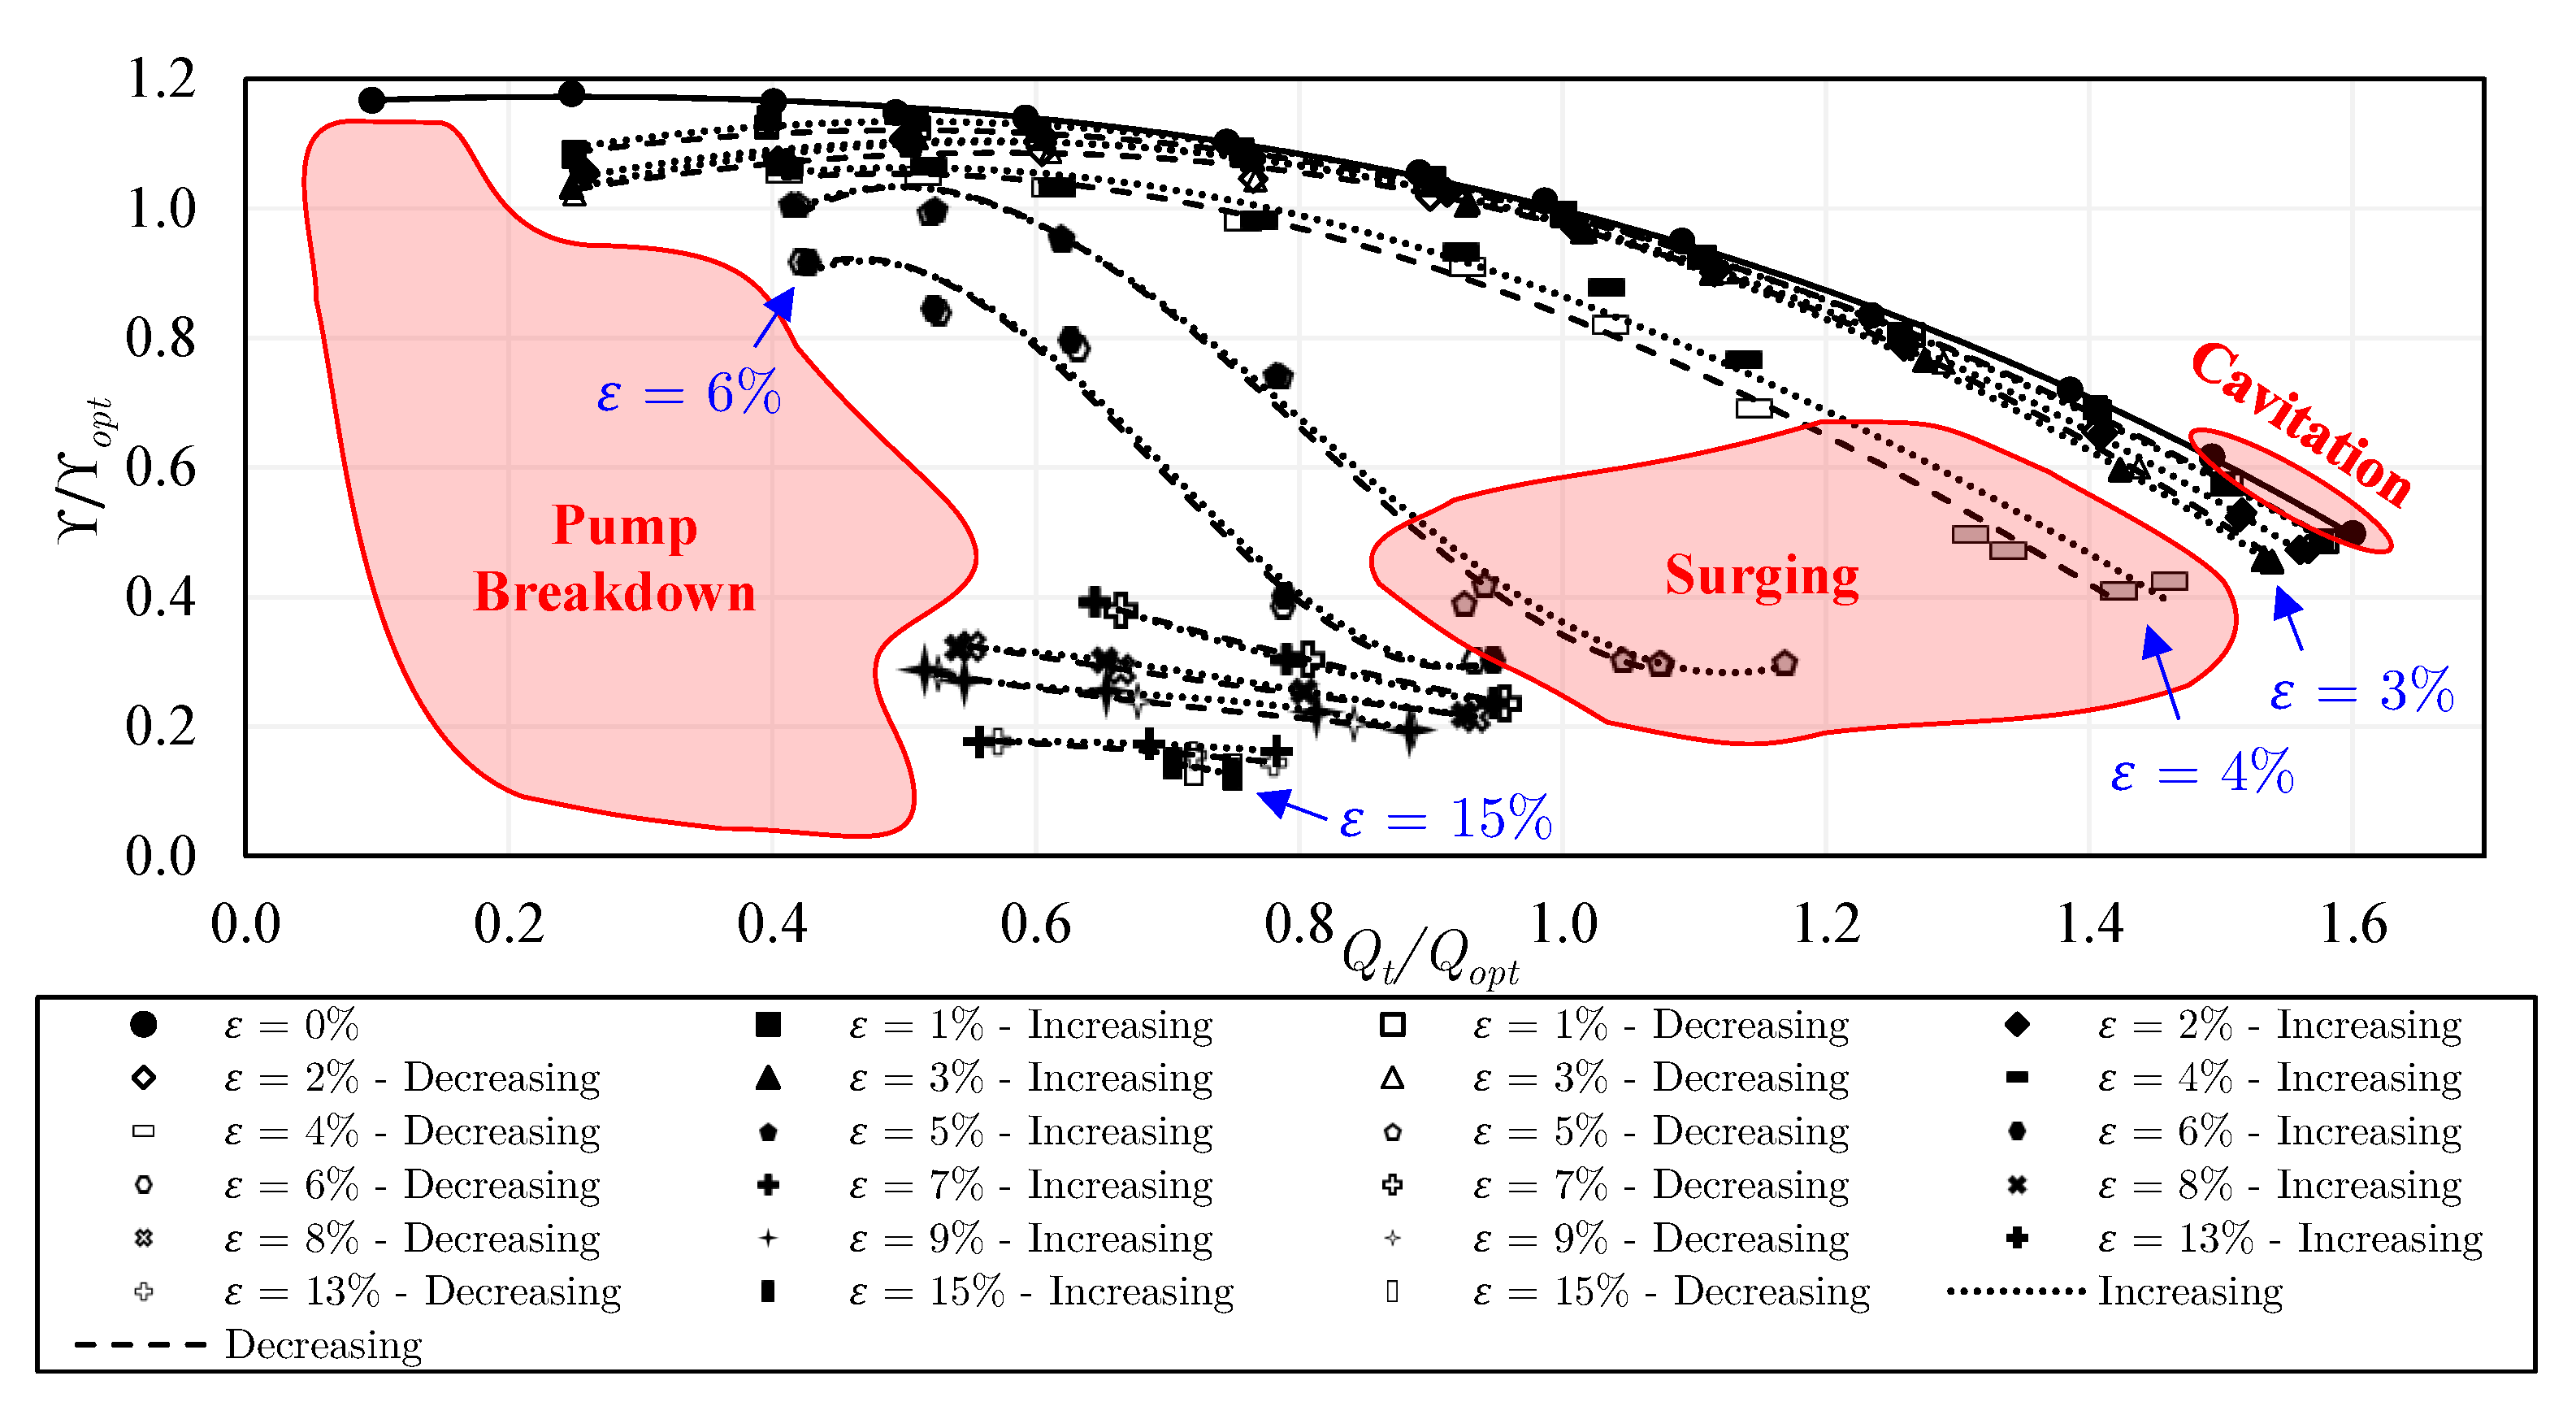
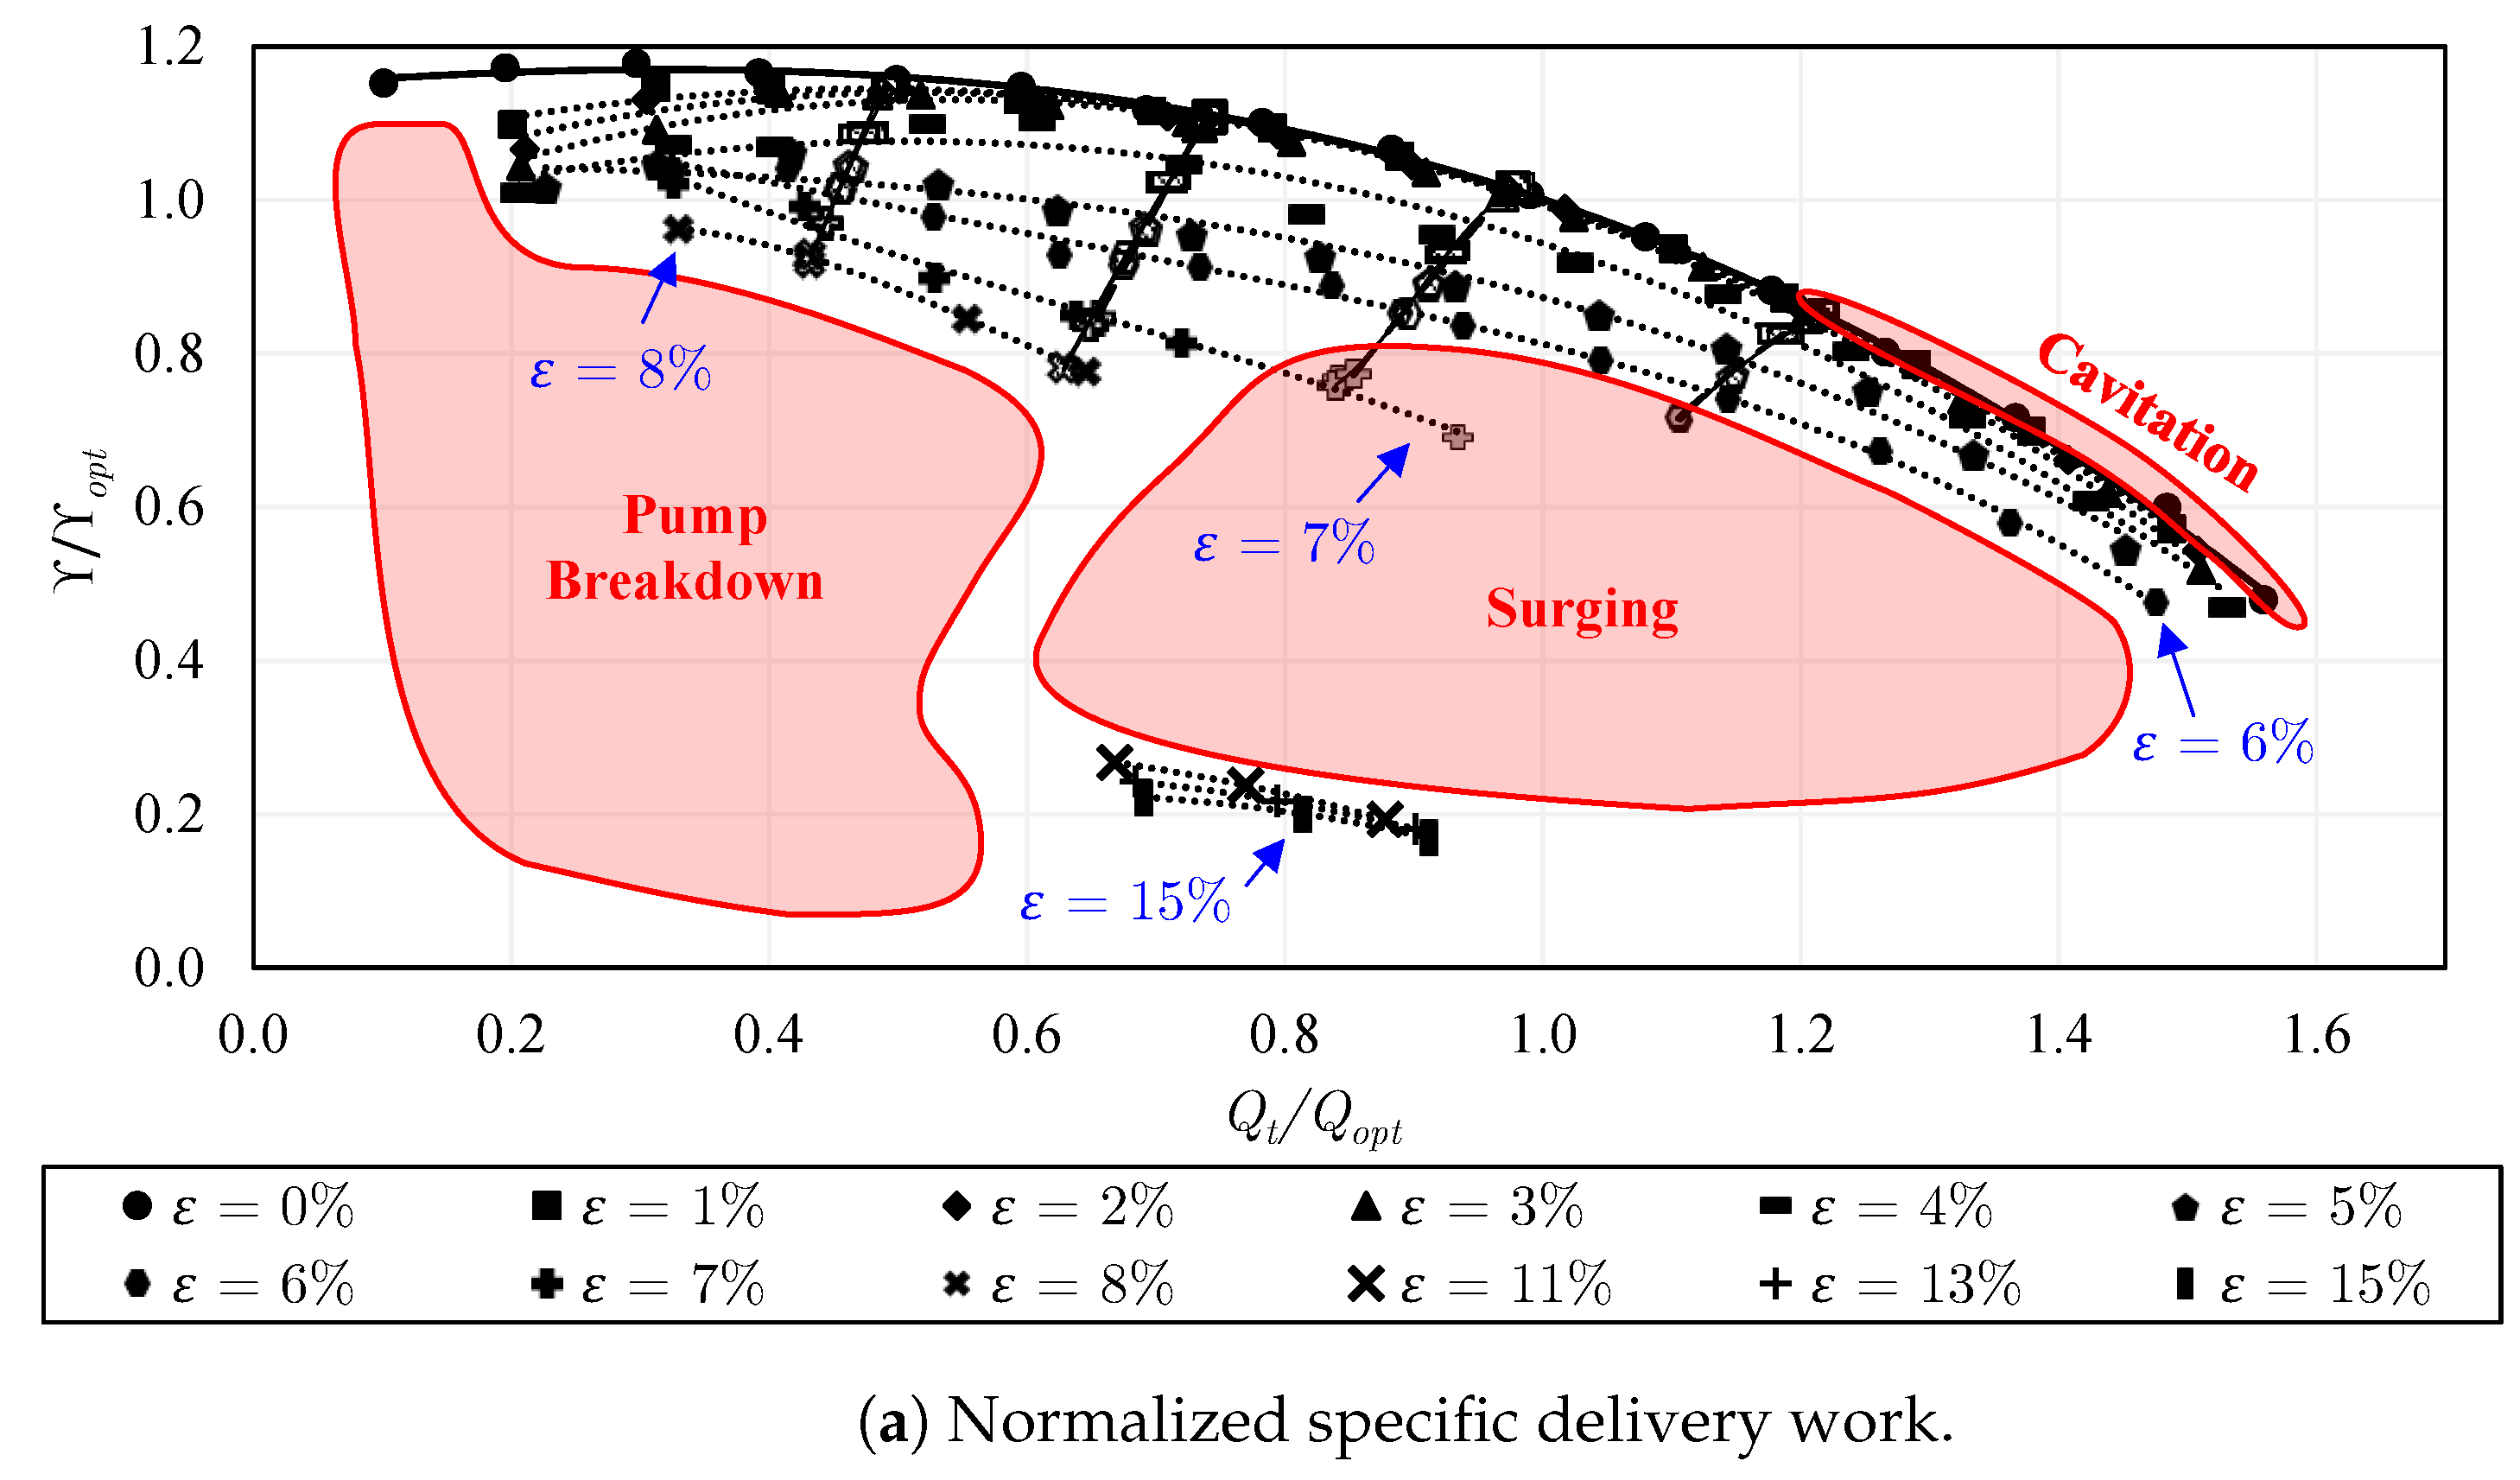
5.4. Pump Configuration 3: Semi-Open Impeller with an Increased Gap

Figure 19 displays the performance of the semi-open impeller with an increased gap. The performance is, in general, reduced as a result of the higher leakage flow within the clearance gap for single-phase flow. Nevertheless, the enhanced leakage flow offers much better gas accumulation resistance. Therefore, very gradual performance degradation is seen, where the pump could maintain good performance until the gas volume fraction was 7 % .
When Figure 17 and Figure 19 are compared, it can be recognized that the increased gap helps to improve the performance considerably for 5 % ε 7 % . This happens mainly due to the improved secondary (leakage) flow over the blades across the tip clearance gap, which disturbs the gas structures and hinders the big gas accumulations. Accordingly, the sharp performance loss is delayed. Nonetheless, for high air contents ( ε 9 ), a similar performance is provided by either of the two tip clearance gaps.
For the increased gap, the performance hysteresis is completely suppressed, as shown in Figure 19, if the experimental approaches are compared. Similarly, no big changes occur in the results of the first and the second approaches, as presented in Figure 20, which compares the normalized specific delivery work for the third pump configuration. The enhanced leakage flow hinders gas accumulations within the pump for all the considered measurement approaches. Further, the use of the increased gap configuration helps to postpone the beginning of pump surging to elevated gas volume fractions. Yet, the pump surging zone appears larger. According to these results, the standard gap would only be preferred for pure liquid flow and ε up to 3% or 4%. On the other hand, the increased gap would be recommended for ε 5 % , to make use of the various benefits discussed here.

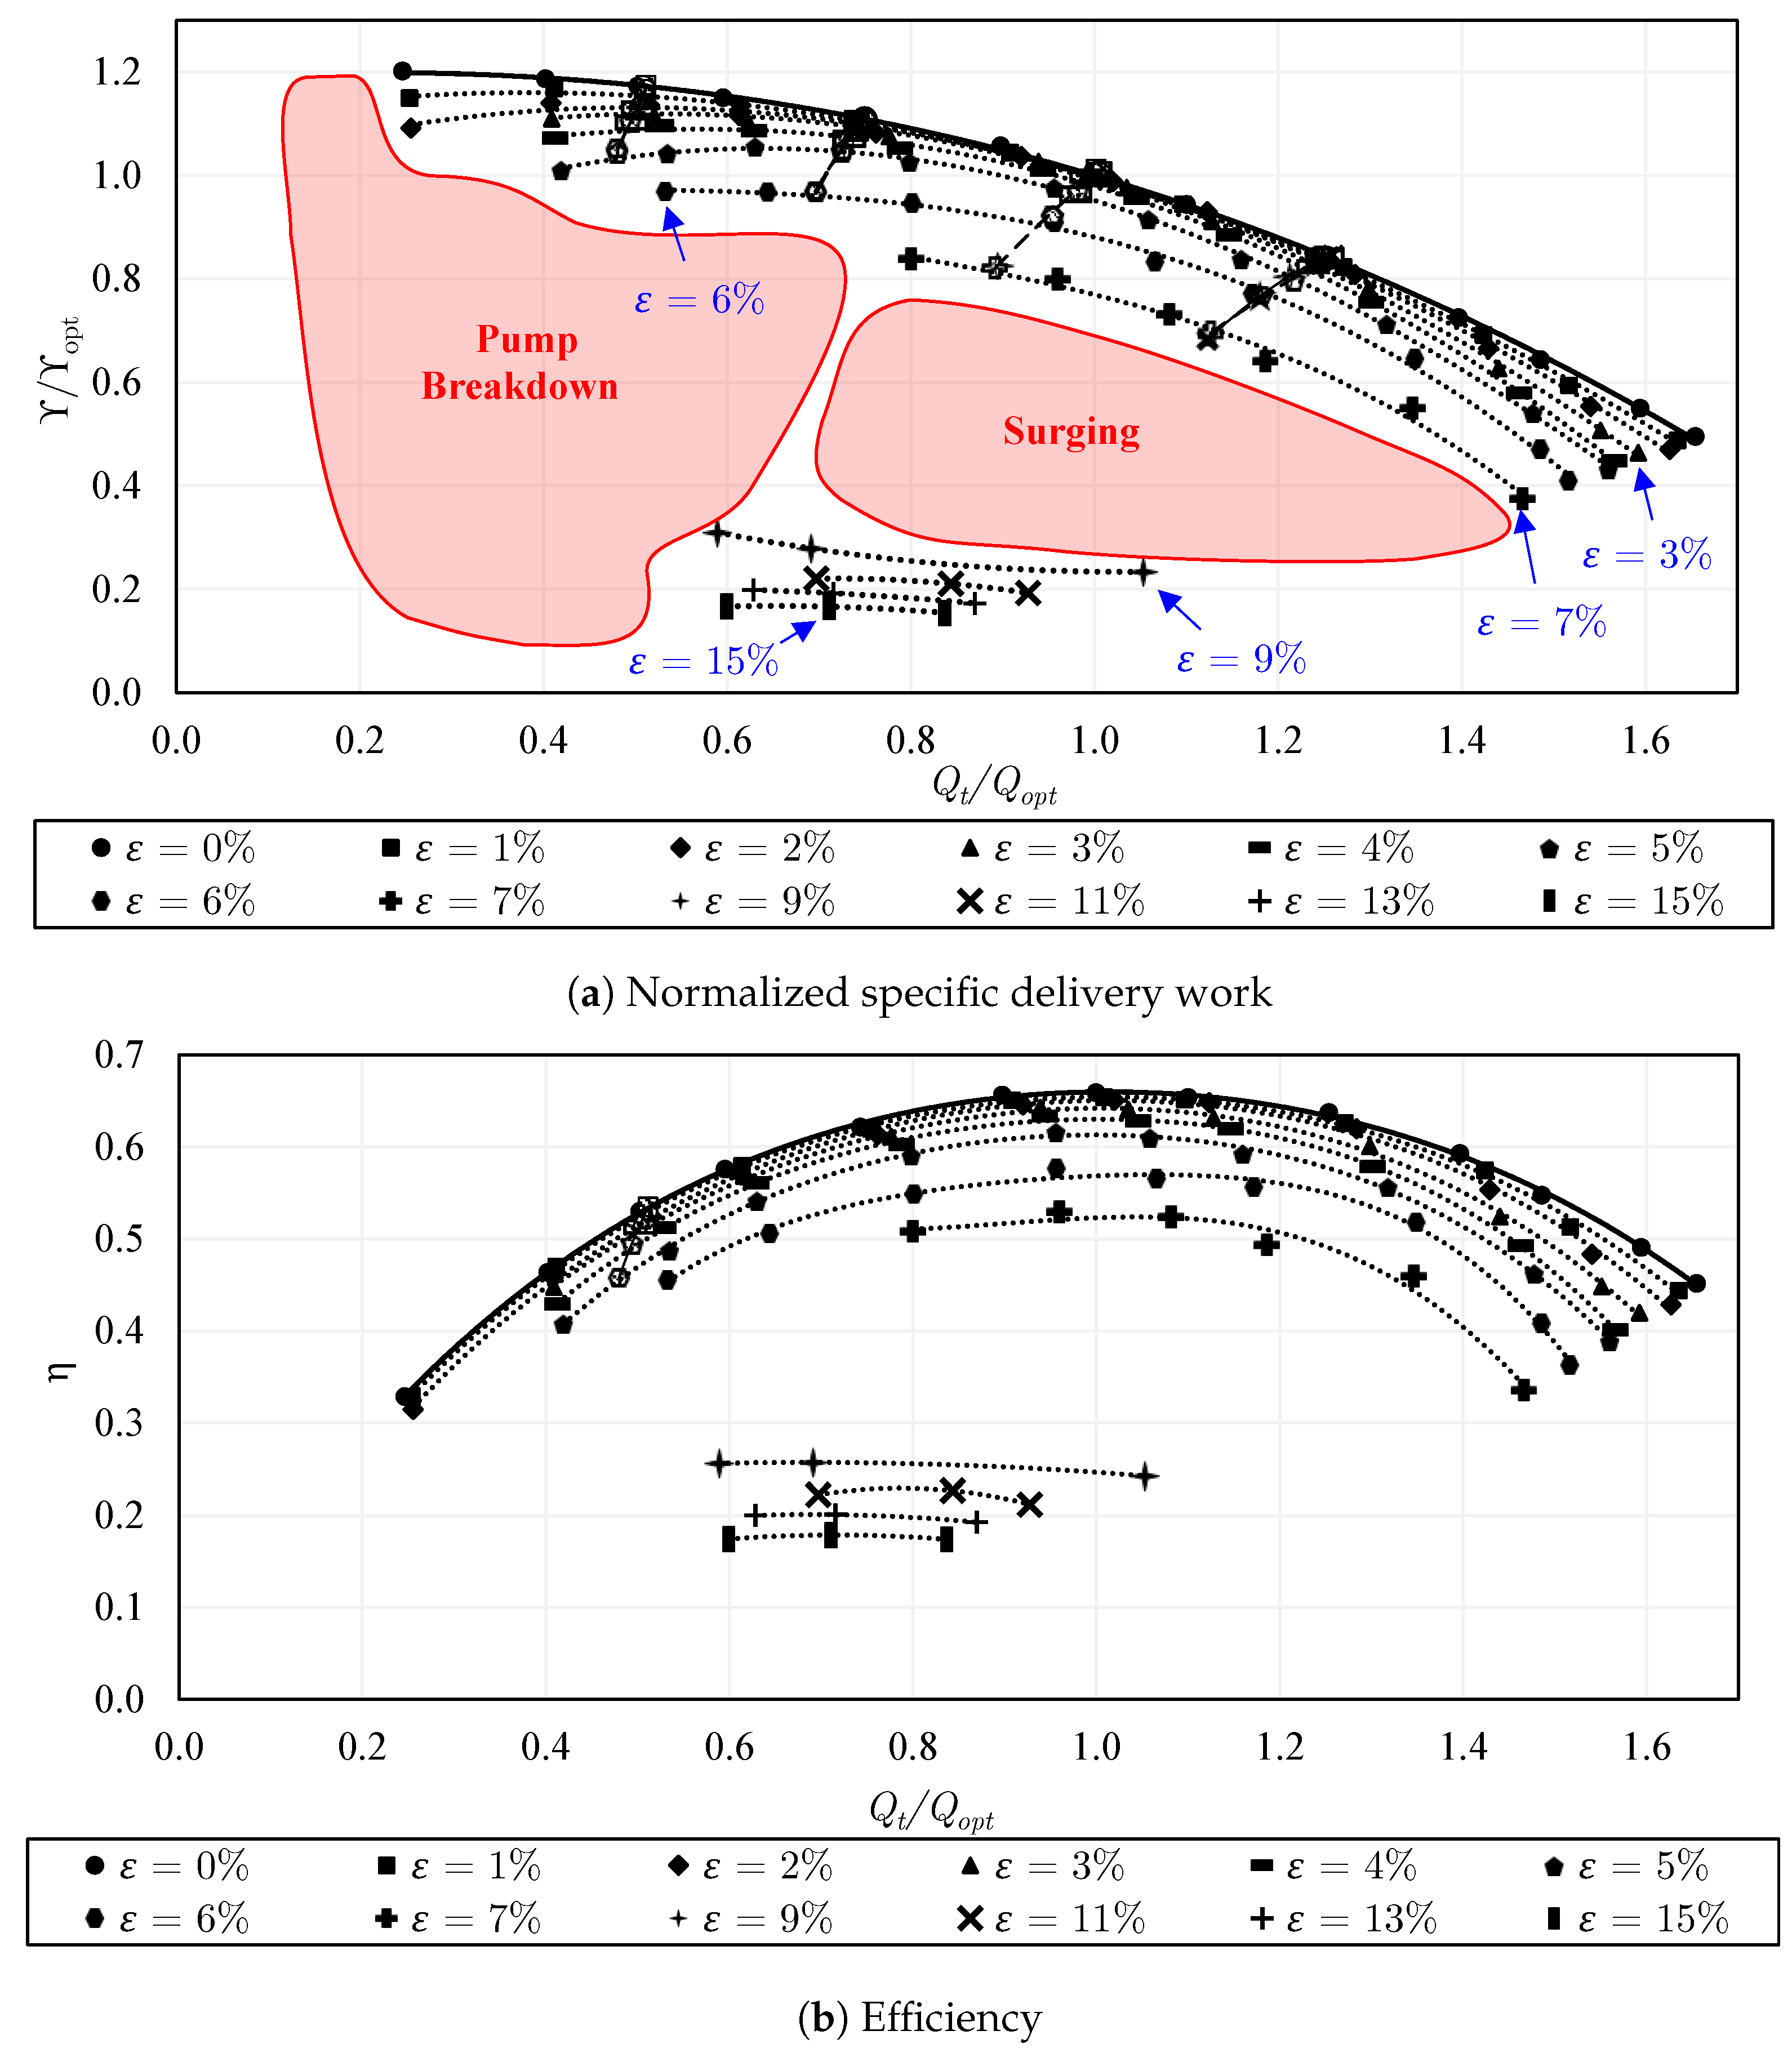
5.5. Pump Configuration 4: Semi-Open Impeller with a Standard Gap and Inducer

Figure 21 presents the pump performance after installing the inducer with the semi-open impeller with a standard gap. The installation of the inducer improves, to some extent, the transport of the mixture for most flow conditions and especially for ε = 4 % as well as 5 % . A significant enhancement in the curves can be seen at part-load up to ε = 7 % . Still, the curves are only slightly impacted for higher gas volume fractions ( ε 8 % ). The installation of the inducer results in two positive effects concerning two-phase pumping. Firstly, it raises the flow pressure at the impeller inlet, which lowers the volume inhabited by the air within the passages of the impeller, boosting the performance. Secondly, it delivers a more homogeneous mixture to the impeller through its rotation; the gas structures become smaller and better distributed at the impeller’s eye. This inhibits the segregation of air near the pump inlet.
Here, the used inducer was found effective only at part-load, while, at overload, no big positive influence takes place. The inducer reduces the gas volume fraction by approximately 2% to 3% at part-load, so that a gas volume fraction of 6% at the inducer inlet will be approximately 5.85% at the impeller, which improves the performance. However, the inducer has a steep Q-H-curve, and, thus, does not improve the pumping performance at high flow. Additionally, for very high flow (overload), the flow separates on the blades of the inducer, which creates axially propagating vortices within the inducer, leading to a sudden drop in the performance of the inducer [20,91]. Similarly, the mixing of the two phases provided by the inducer was found to be very effective only at part-load, while, at overload, the flow is very fast, strongly reducing the residence time and the two-phase mixing of the inducer before entering the impeller inlet [20,91].
Comparing the behavior of the first to that of the second experimental approach, as shown in Figure 22, merely low hysteresis is visible for ε between 6 % and 7 % . The inducer could positively restrain the strong hysteresis for the third approach. As shown in Figure 21a and Figure 22, the use of the inducer could also retard the pump surging to elevated gas volume fractions. Still, the pump breakdown region is insignificantly impacted by using the inducer.

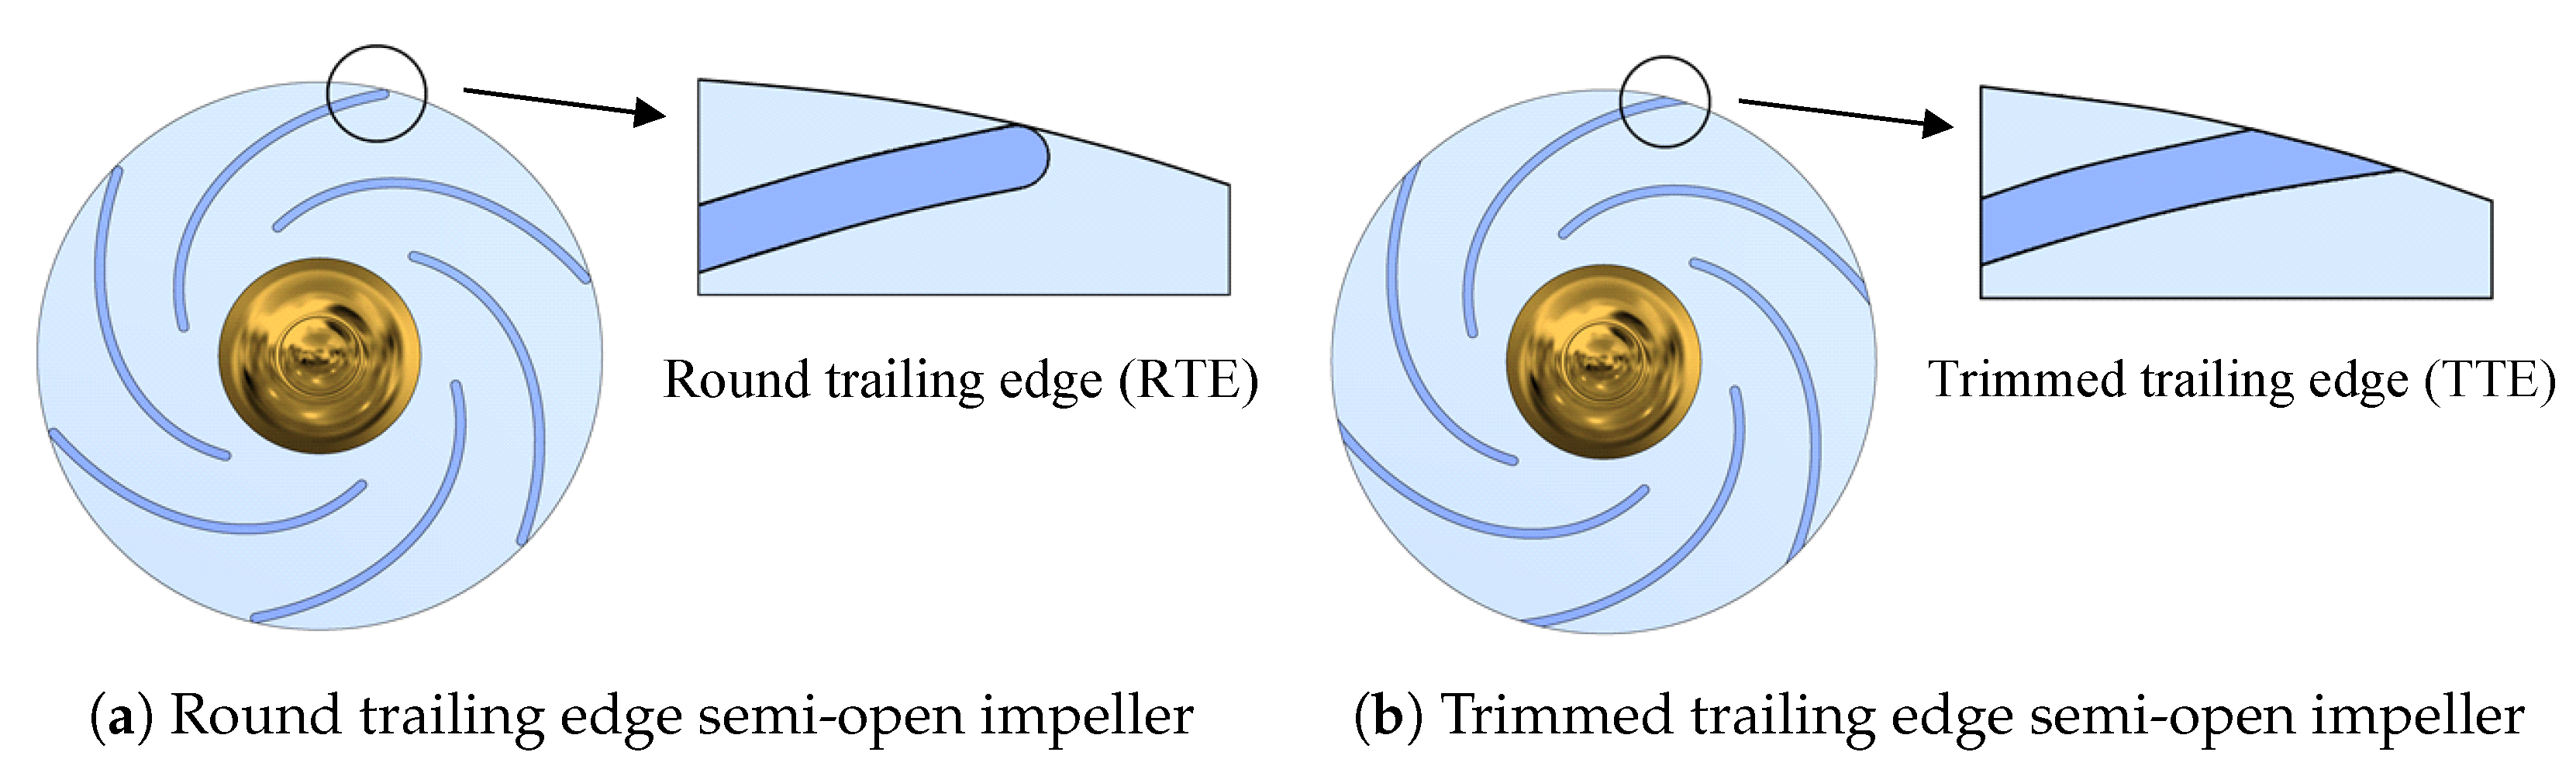
5.6. Pump Configuration 5: TTE Semi-Open Impeller with a Standard Gap at 650 Rpm

The two-phase pump performance with the TTE semi-open impeller and a standard gap is presented in Figure 23. The TTE semi-open impeller performs mostly less than the RTE impeller for two-phase flow, because its preliminary single-phase performance is also less than that of the RTE semi-open impeller. Despite this, when compared to the RTE impeller, the TTE impeller (Figure 23) exhibits a very high gas accumulation resistance and only a small decrease in the pump performance occurs up to ε = 3 % . Then, as for the RTE impeller, the performance quickly degrades, since large gas pockets start to build up in the impeller channels.
Comparing the various experimental approaches for the TTE impeller, lower hysteresis is visible, where no significant changes are visible among the results of the first and the third approaches, as shown in Figure 23. Nonetheless, some obvious hysteresis is apparent in Figure 24, which shows a comparison of the first two approaches. Additionally, the hysteresis begins at lower gas volume fractions ( ε = 3 % ) for the TTE impeller when compared to the RTE impeller. The pump breakdown and cavitation regions are comparable among both trailing edge cases. However, the surging conditions taking place in the pump with the TTE impeller are visibly bigger, limiting the pump stability at overload operation for ε = 5 % at overload.

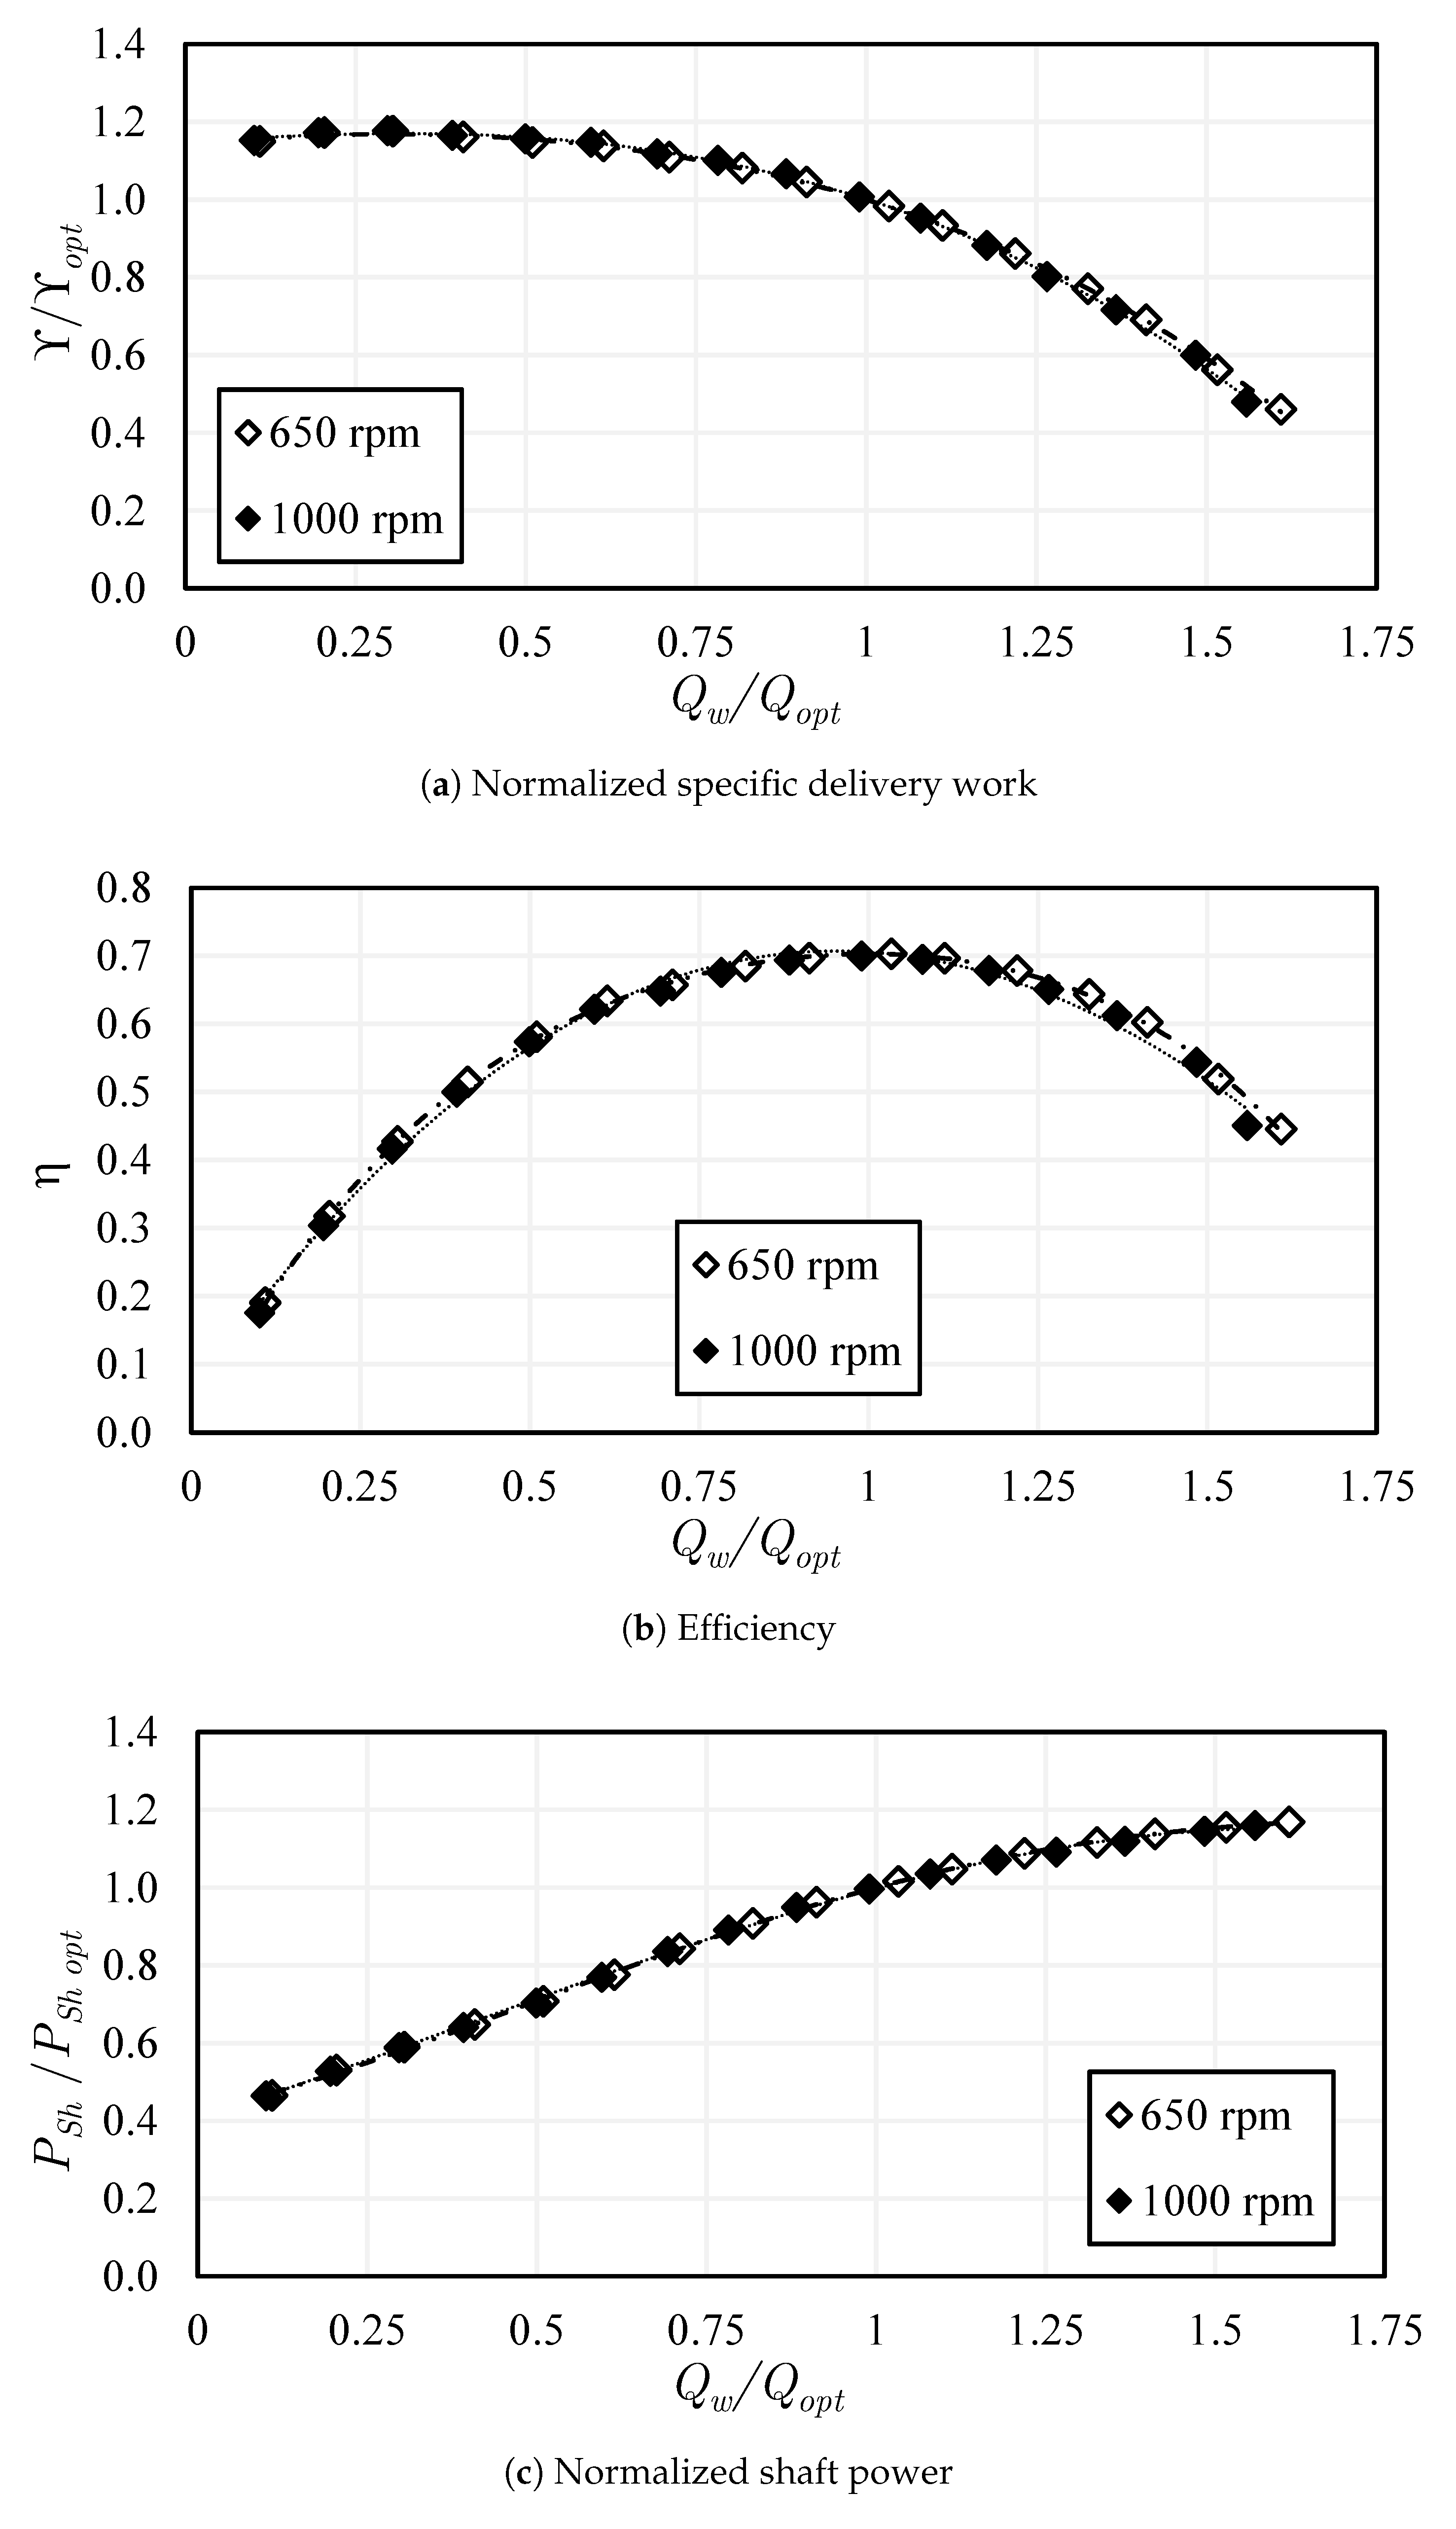
5.7. Pump Configuration 6: TTE Semi-Open Impeller with a Standard Gap at 1000 Rpm

Figure 25 depicts the pump performance with the trimmed trailing edge semi-open impeller with a standard gap when the rotational speed is now increased to 1000 rpm. Note that the rotational speed of all previous pump configurations was set to 650 rpm. The influence of increasing the rotational speed is discussed by comparing configurations 5 and 6.
Similar to the lower rotational speed, the pump performance is also lowered by raising the air amount in the mixture, which also reduces the operating flow range. The performance of the higher rpm is generally superior to that of the lower rpm, as can be seen from Figure 23 and Figure 25. For the higher rpm, there is no noticeable loss in specific work up to ε = 3 % compared to the curve of pure liquid, where the performance reduction is very slow. This is mainly visible around the optimal conditions and high flow rates. Moreover, the performance reduction is also restricted until ε = 8 % .
The increased mixing between the two-phases due to the higher turbulence levels available in the flow at an increased rpm is the main reason for the enhanced performance. These positive effects help to break the big gas accumulations, increasing the ability of the pump to convey higher gas volume fractions with a lower reduction in performance. Nonetheless, for ε 8 % , big gas bubbles begin to accumulate in the impeller, degrading the performance quickly.
Comparing the measurement approaches for the 1000 rpm, only limited hysteresis takes place among the data points of the first and the third approaches (Figure 25). Yet, increased hysteresis takes place among the first and second approaches, as shown in Figure 26. In this case, performance hysteresis starts even from ε = 2 % and reaches up to ε = 6 % . Adversely, bigger changes occur in the performance at the higher rpm for identical two-phase flow conditions. At overload conditions, the impeller and the volute are operating beyond their design limits, and flow separation may occur more readily on the impeller blades and the volute tongue due to the increased flow. Running at a higher rotational speed further increases the overloaded flow and pushes the pump even farther away from its optimal operating range, making the impeller and the volute more susceptible to flow separation. Accordingly, when doing the measurements with the second experimental procedure (which starts from the maximum flow), a bigger separation occurs for the higher rotational speed, allowing more gas to accumulate at these conditions compared to the lower rotational speed. The increased flow separation occurring in the impeller passages, when the rotational speed is increased, could be a reason for increased hysteresis. Additionally, the measurements of the second approach evidently start from much higher volume flow rates (of liquid and gas) for the higher rpm. Further, the difference in the centrifugal force acting on the phases increases with rotational speed, which may intensify phase segregation at such very high flow rates. This increases the possibility for the gas phase to build up at high flow and impact the performance in the second approach in spite of the enhanced mixing.
When comparing the behavior of the two rotational speeds, only minor modifications can be observed in the breakdown region. However, the larger surging region of the higher rpm substantially impairs the ability of the pump to operate steadily at overload for ε = 7–8%. Furthermore, cavitation occurs for a wider single-phase flow range for the increased rpm, as a result of the increased flow velocities within the pump.

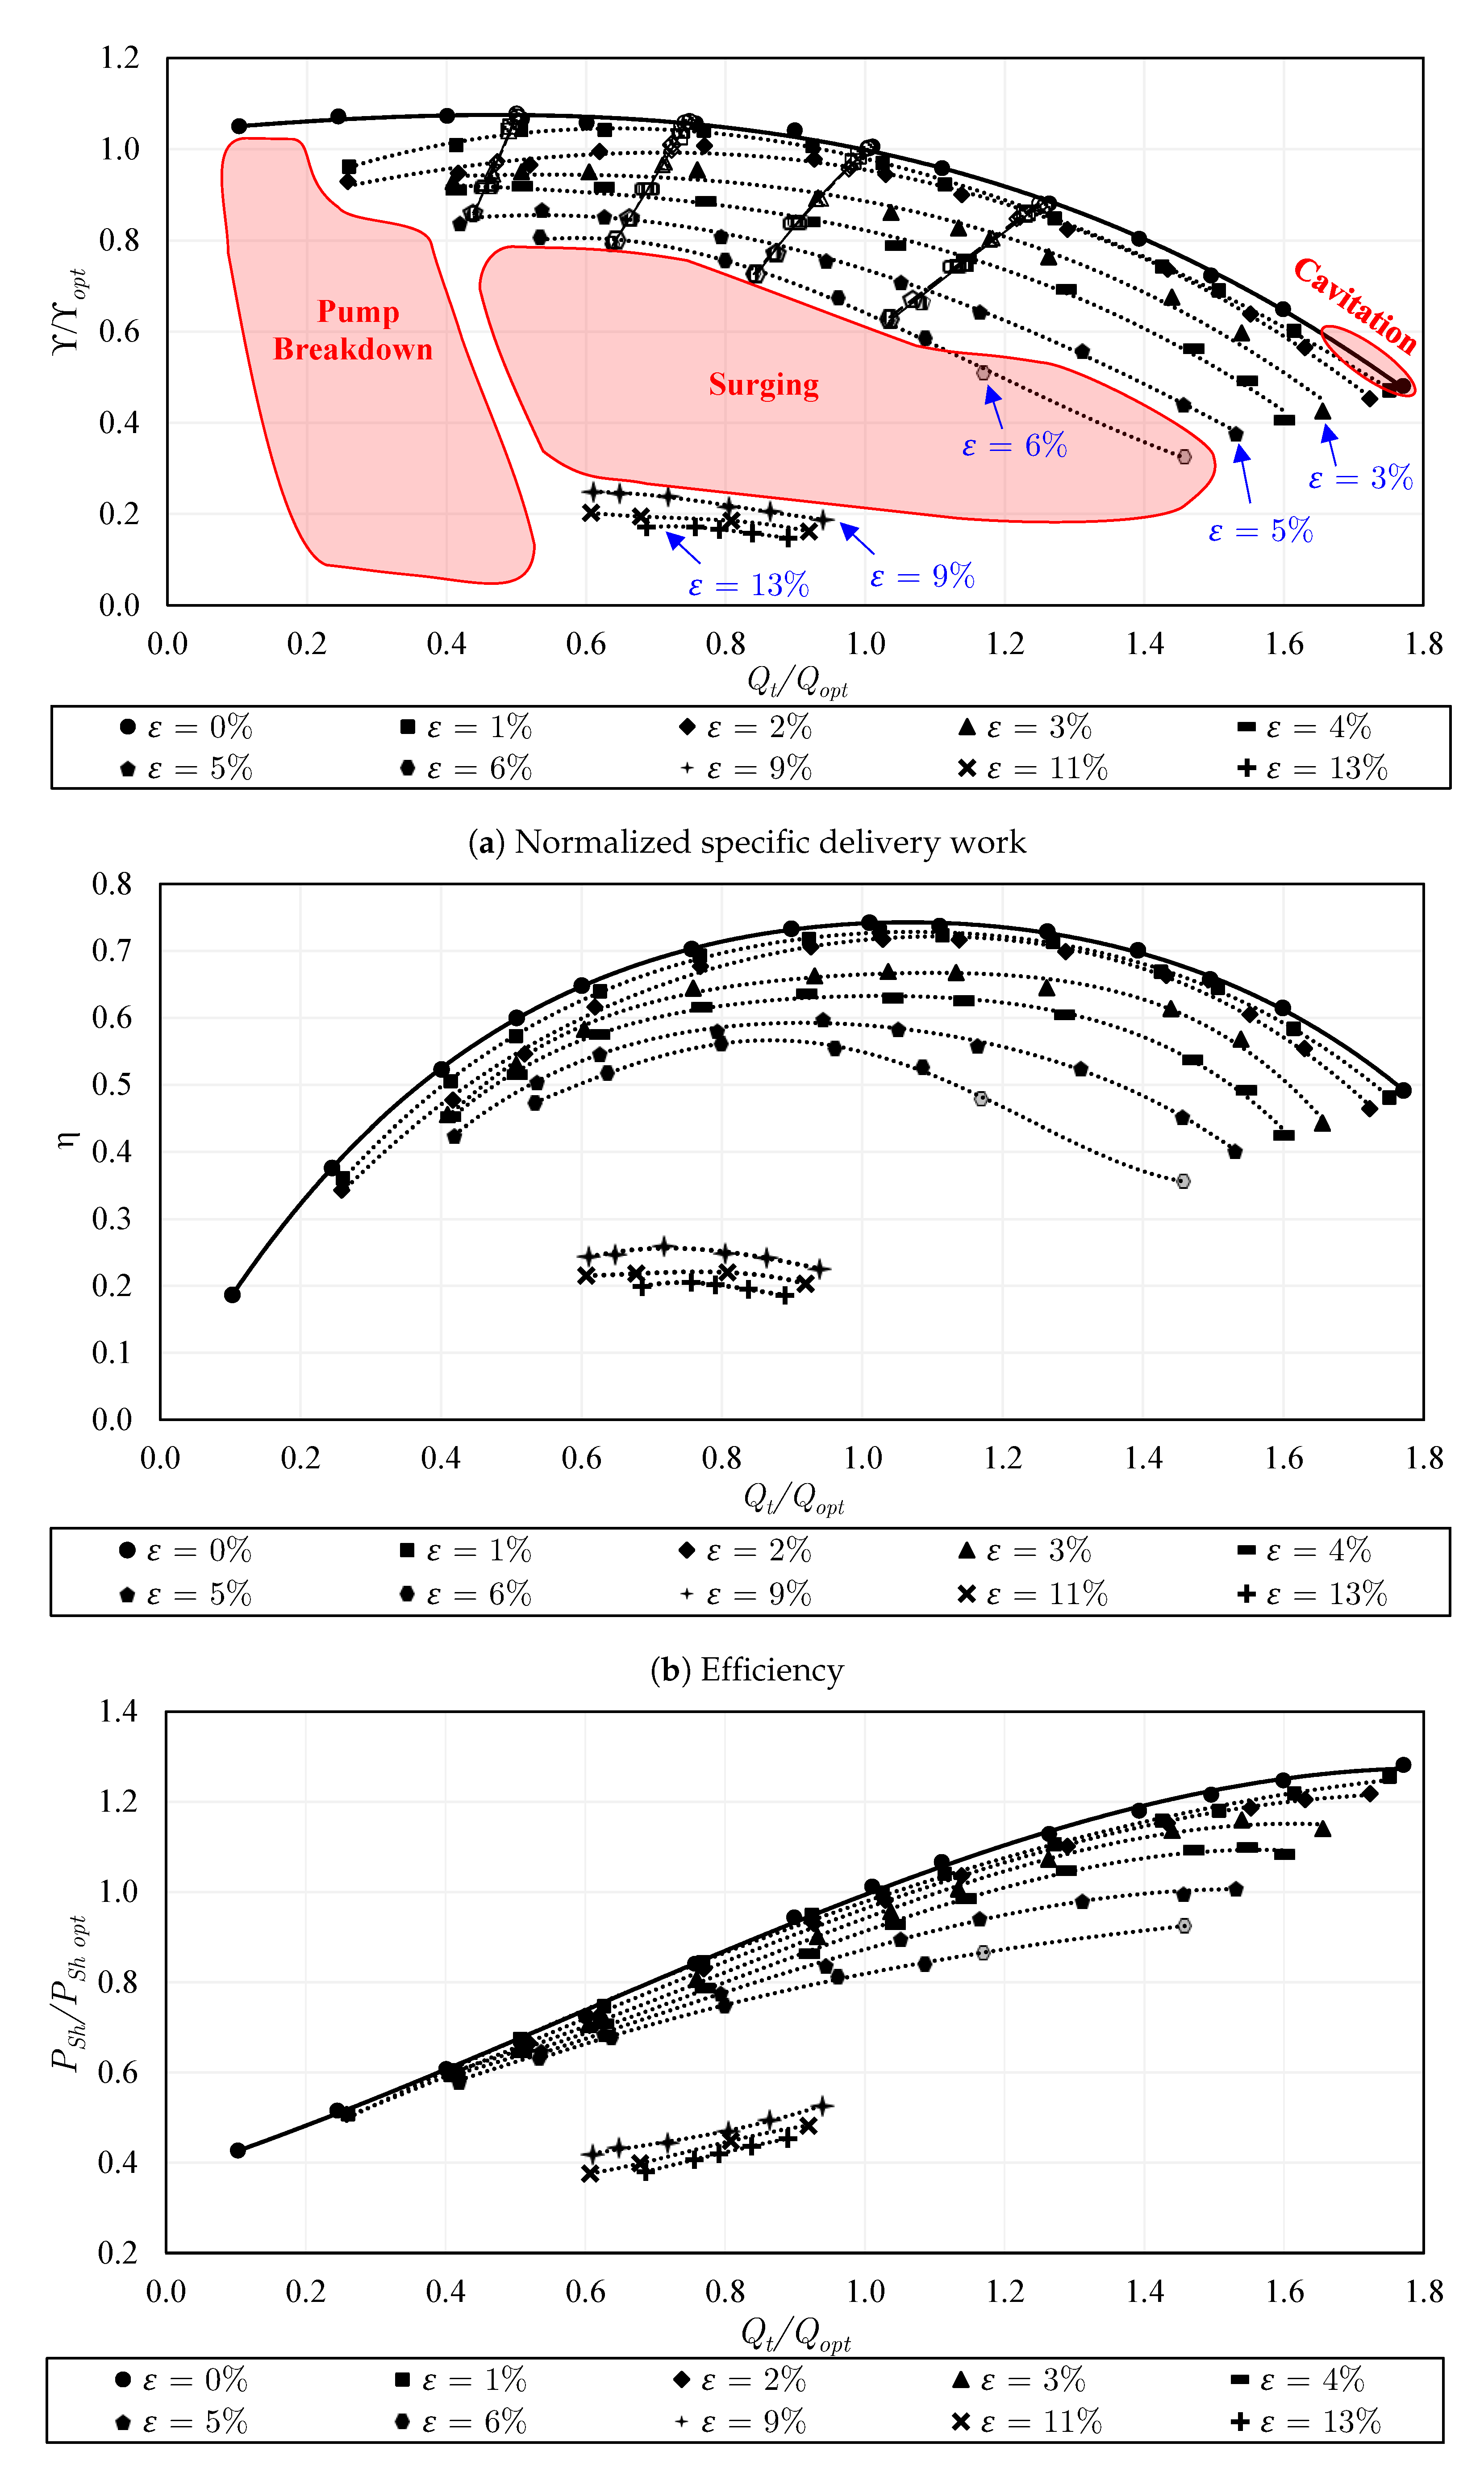
5.8. Performance Degradation

The performance degradation of all considered pump configurations is compared in Figure 27 as a result of increasing the gas volume fraction. As shown in Figure 27a, the curves of the closed impeller are generally decreasing with a higher slope compared to the other cases, due to the easier and faster gas accumulation. This happens up to a 6% gas volume fraction before the onset of pump surging. It can be also noted that the degradation slope is steeper at overload conditions ( Q w / Q o p t 1.0 ).
Note that some curves are discrete, where a few data points are missing in the mid-range of Figure 27, due to the occurrence of strong surging and system vibrations. Since they might harm the acrylic glass and the mechanical components of the pump, the operating points in surging conditions could not be maintained for a long period of time.
As shown in Figure 27b, for the semi-open impeller with a standard gap, the curves are nearly unaffected up to a 3% gas volume fraction for different loading conditions. Here, the performance is very slightly decreased compared to that of the pure liquid flow, indicating a higher resistance to the formation of big air structures. Nevertheless, for ε 4 % , a sharp degradation occurs, where the air begins to build up rapidly in the impeller channels. In this case, the leakage flow across the (standard) gap is not strong enough to hinder the gas accumulation.
Figure 27c demonstrates that the curves of the semi-open impeller with an increased gap exhibit more stable behavior until ε = 7 % before the occurrence of pump surging. Again, for ε 8 % , the semi-open impeller shows a slightly better performance than the closed impeller. This is more evident in the increased gap configuration.
The use of the inducer could retard the intense degradation to approximately ε = 6 % and ε = 5 % at optimal and overload conditions, respectively, as presented in Figure 27d. Furthermore, the performance drop is very gradual until ε = 7 % at part-load. Afterward, a sharp drop takes place at ε 8 % .
For the trimmed trailing edge semi-open impeller with a standard gap shown in Figure 27e, the curves are almost flat until a gas content of 3 % , which can be considered an as advantage of this impeller design over the round trailing edge one. Nevertheless, a sharper drop in the performance starts at 4 % . Finally, the performance of the increased rotational speed (configuration 6) is shown in Figure 27f. Again, it is apparent that the increased rotational speed improves the performance deterioration due to the increased turbulence. This increases the ability of the pump to resist gas accumulations. In this case, the performance is similarly flat with negligible degradation until ε = 3–4%. The degradation becomes a bit steeper between ε = 4 % and ε = 8 % . Thereafter, surging starts, hindering the measurements.
Figure 28 compares the degradation of the specific delivery work as a function of gas volume fraction at Q w / Q o p t = 1.0 for all different pump configurations considered. As shown, in the range of 1 % ε 3 % , all semi-open impeller alternatives exhibit limited degradation and perform better than the closed impeller. Afterward, the semi-open impeller with a standard gap shows a steep drop starting from ε = 4 % . This can be slightly delayed to ε = 5 % by installing the inducer. Overall, the increased gap and the increased rotational speed show the softest performance deterioration compared to the other considered pump configurations. Additionally, the increased gap configuration performs even slightly better at Q w / Q o p t = 1.0 .

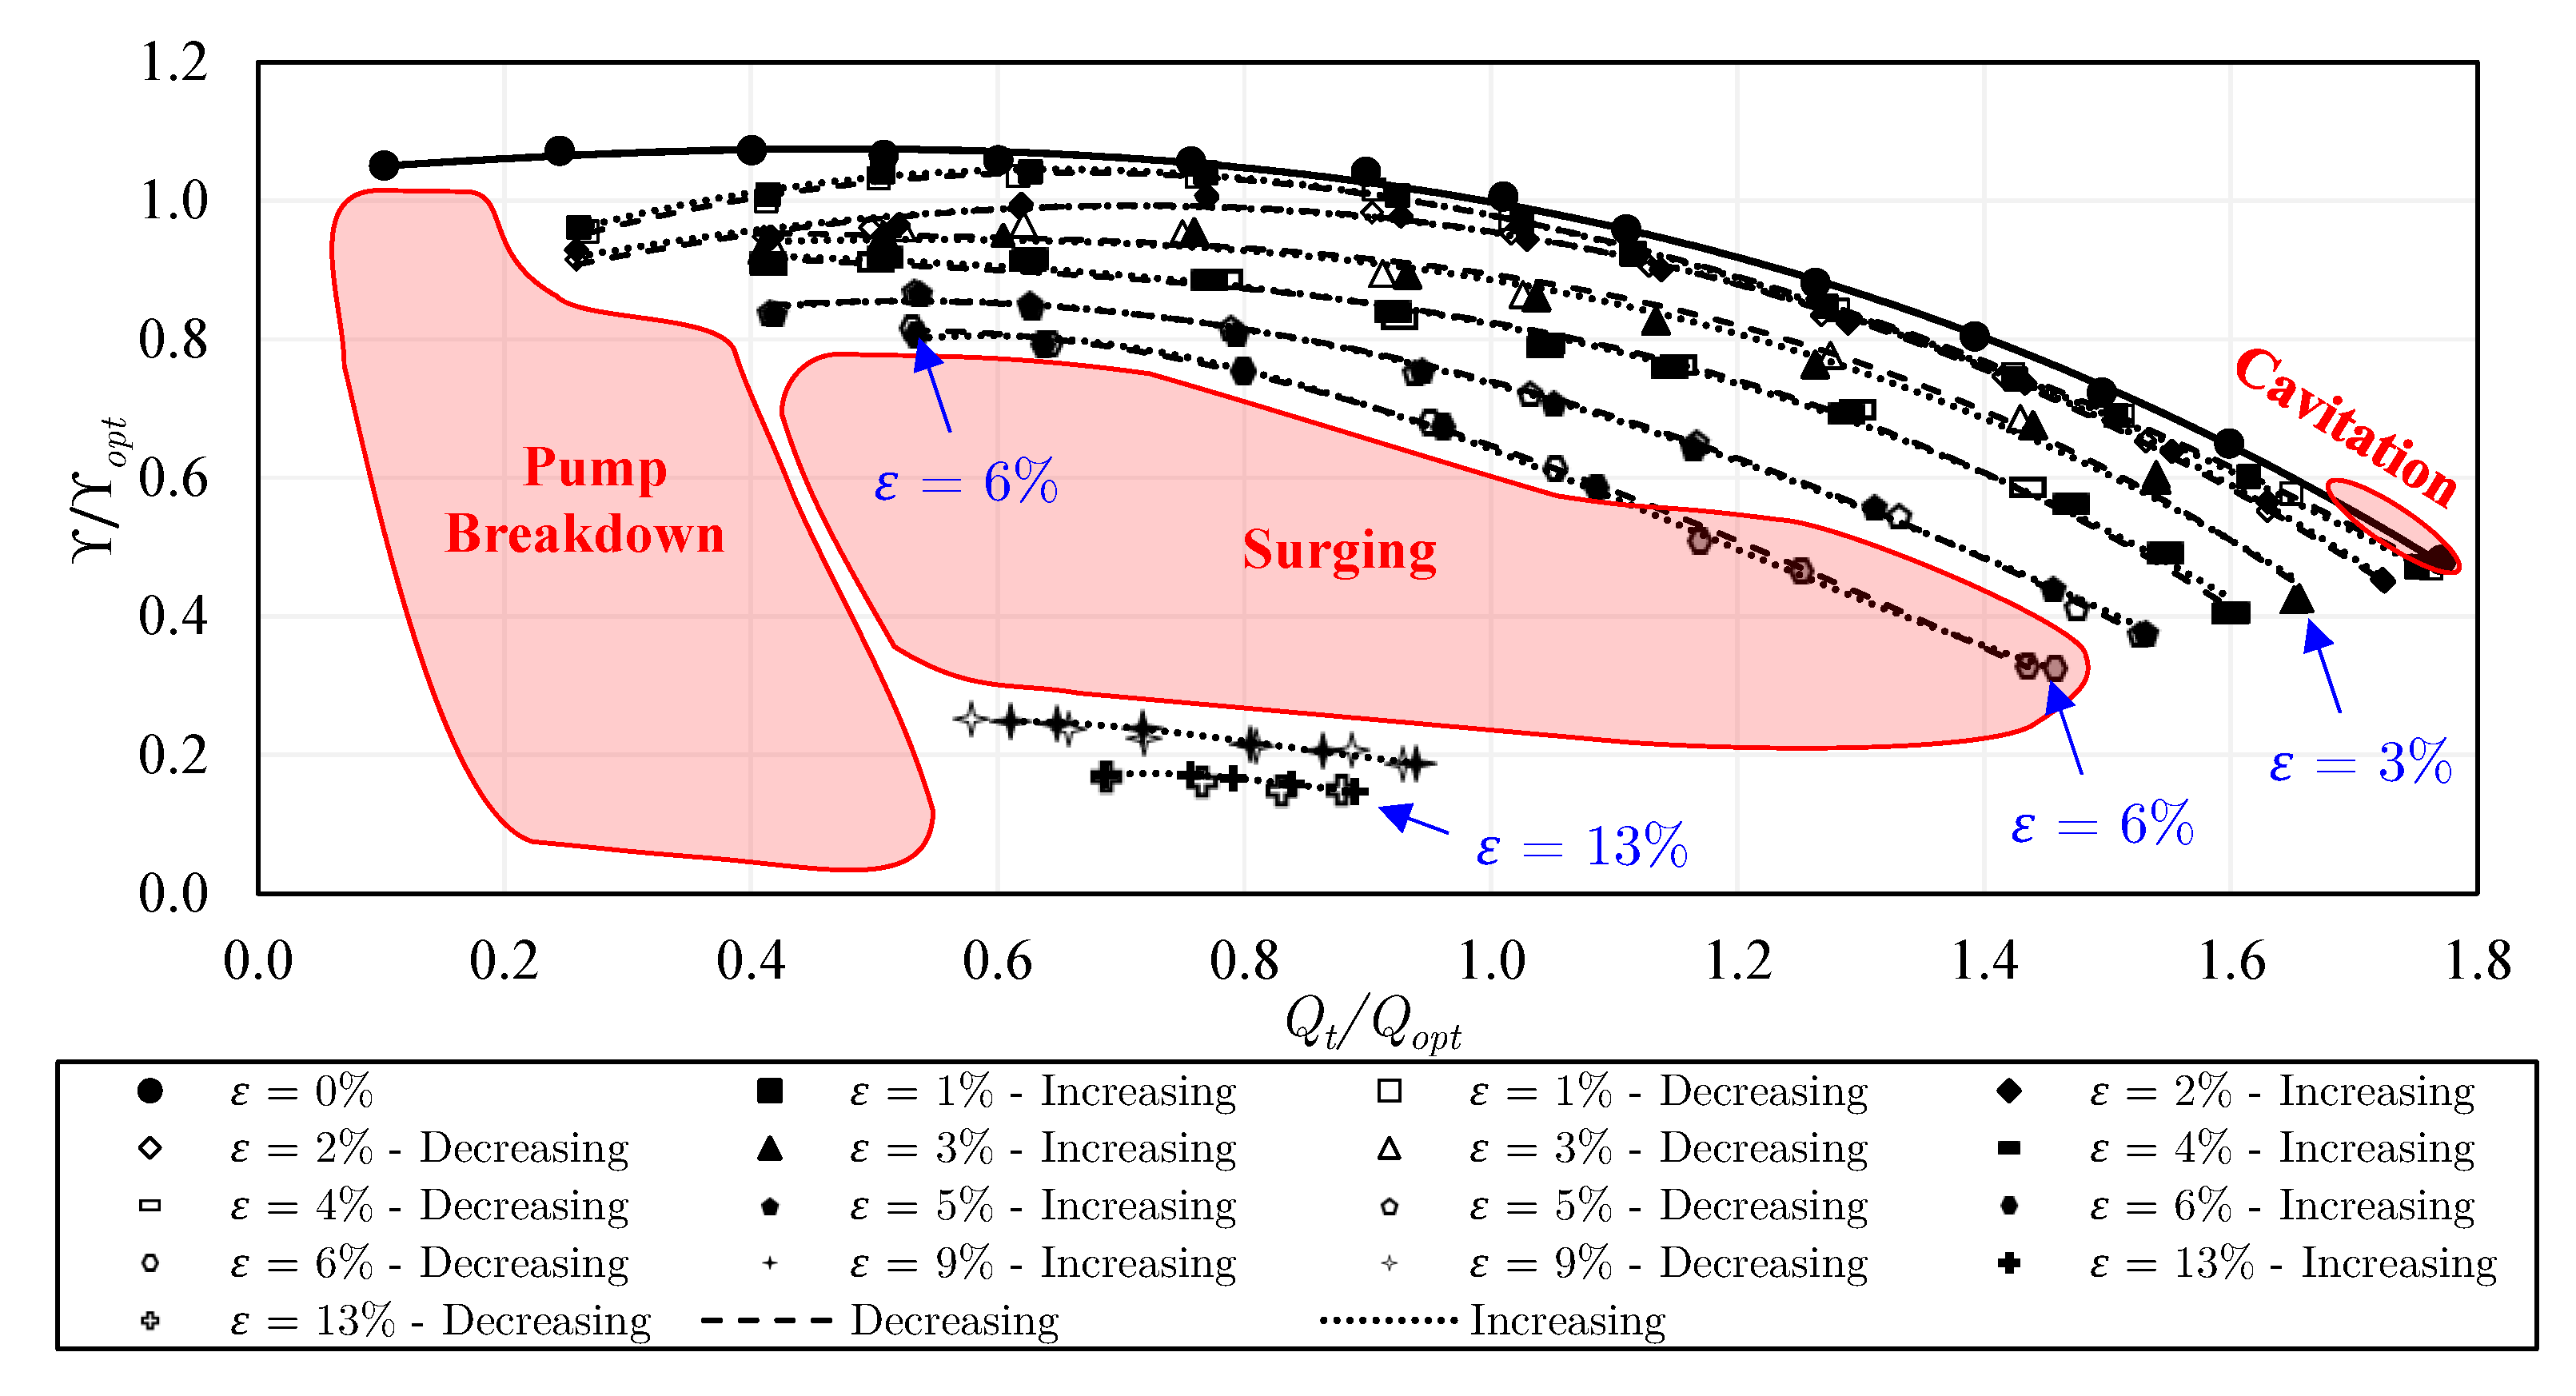
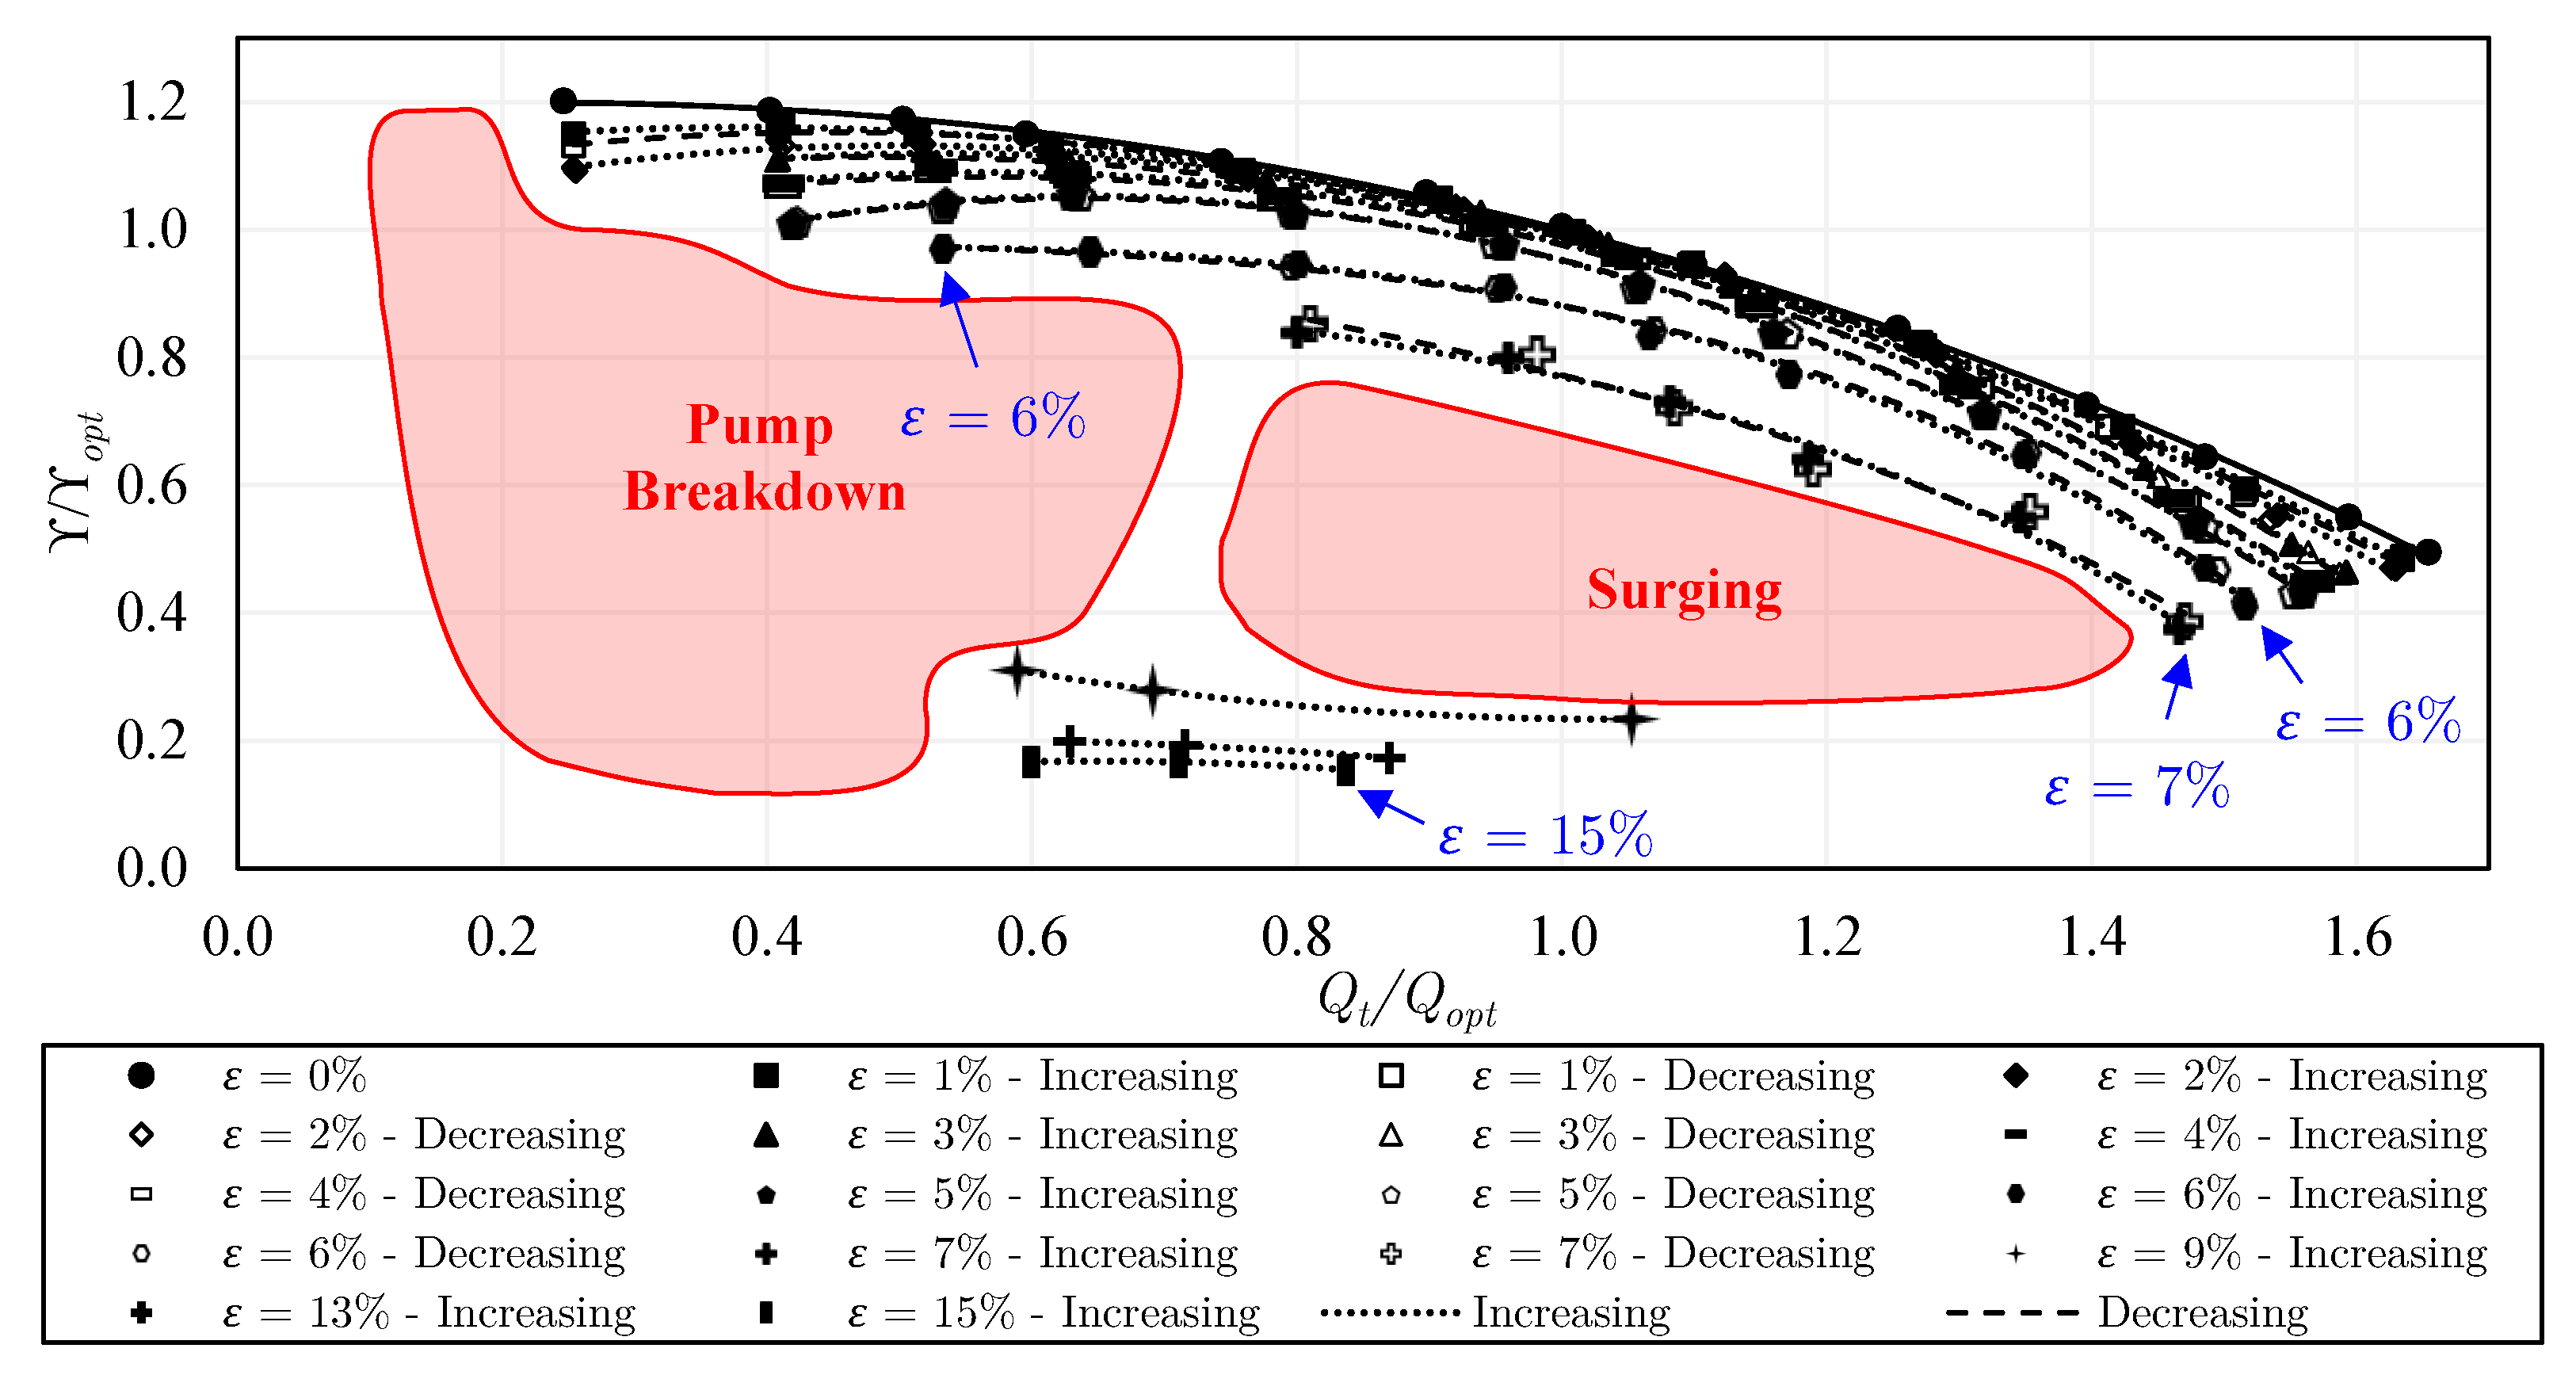
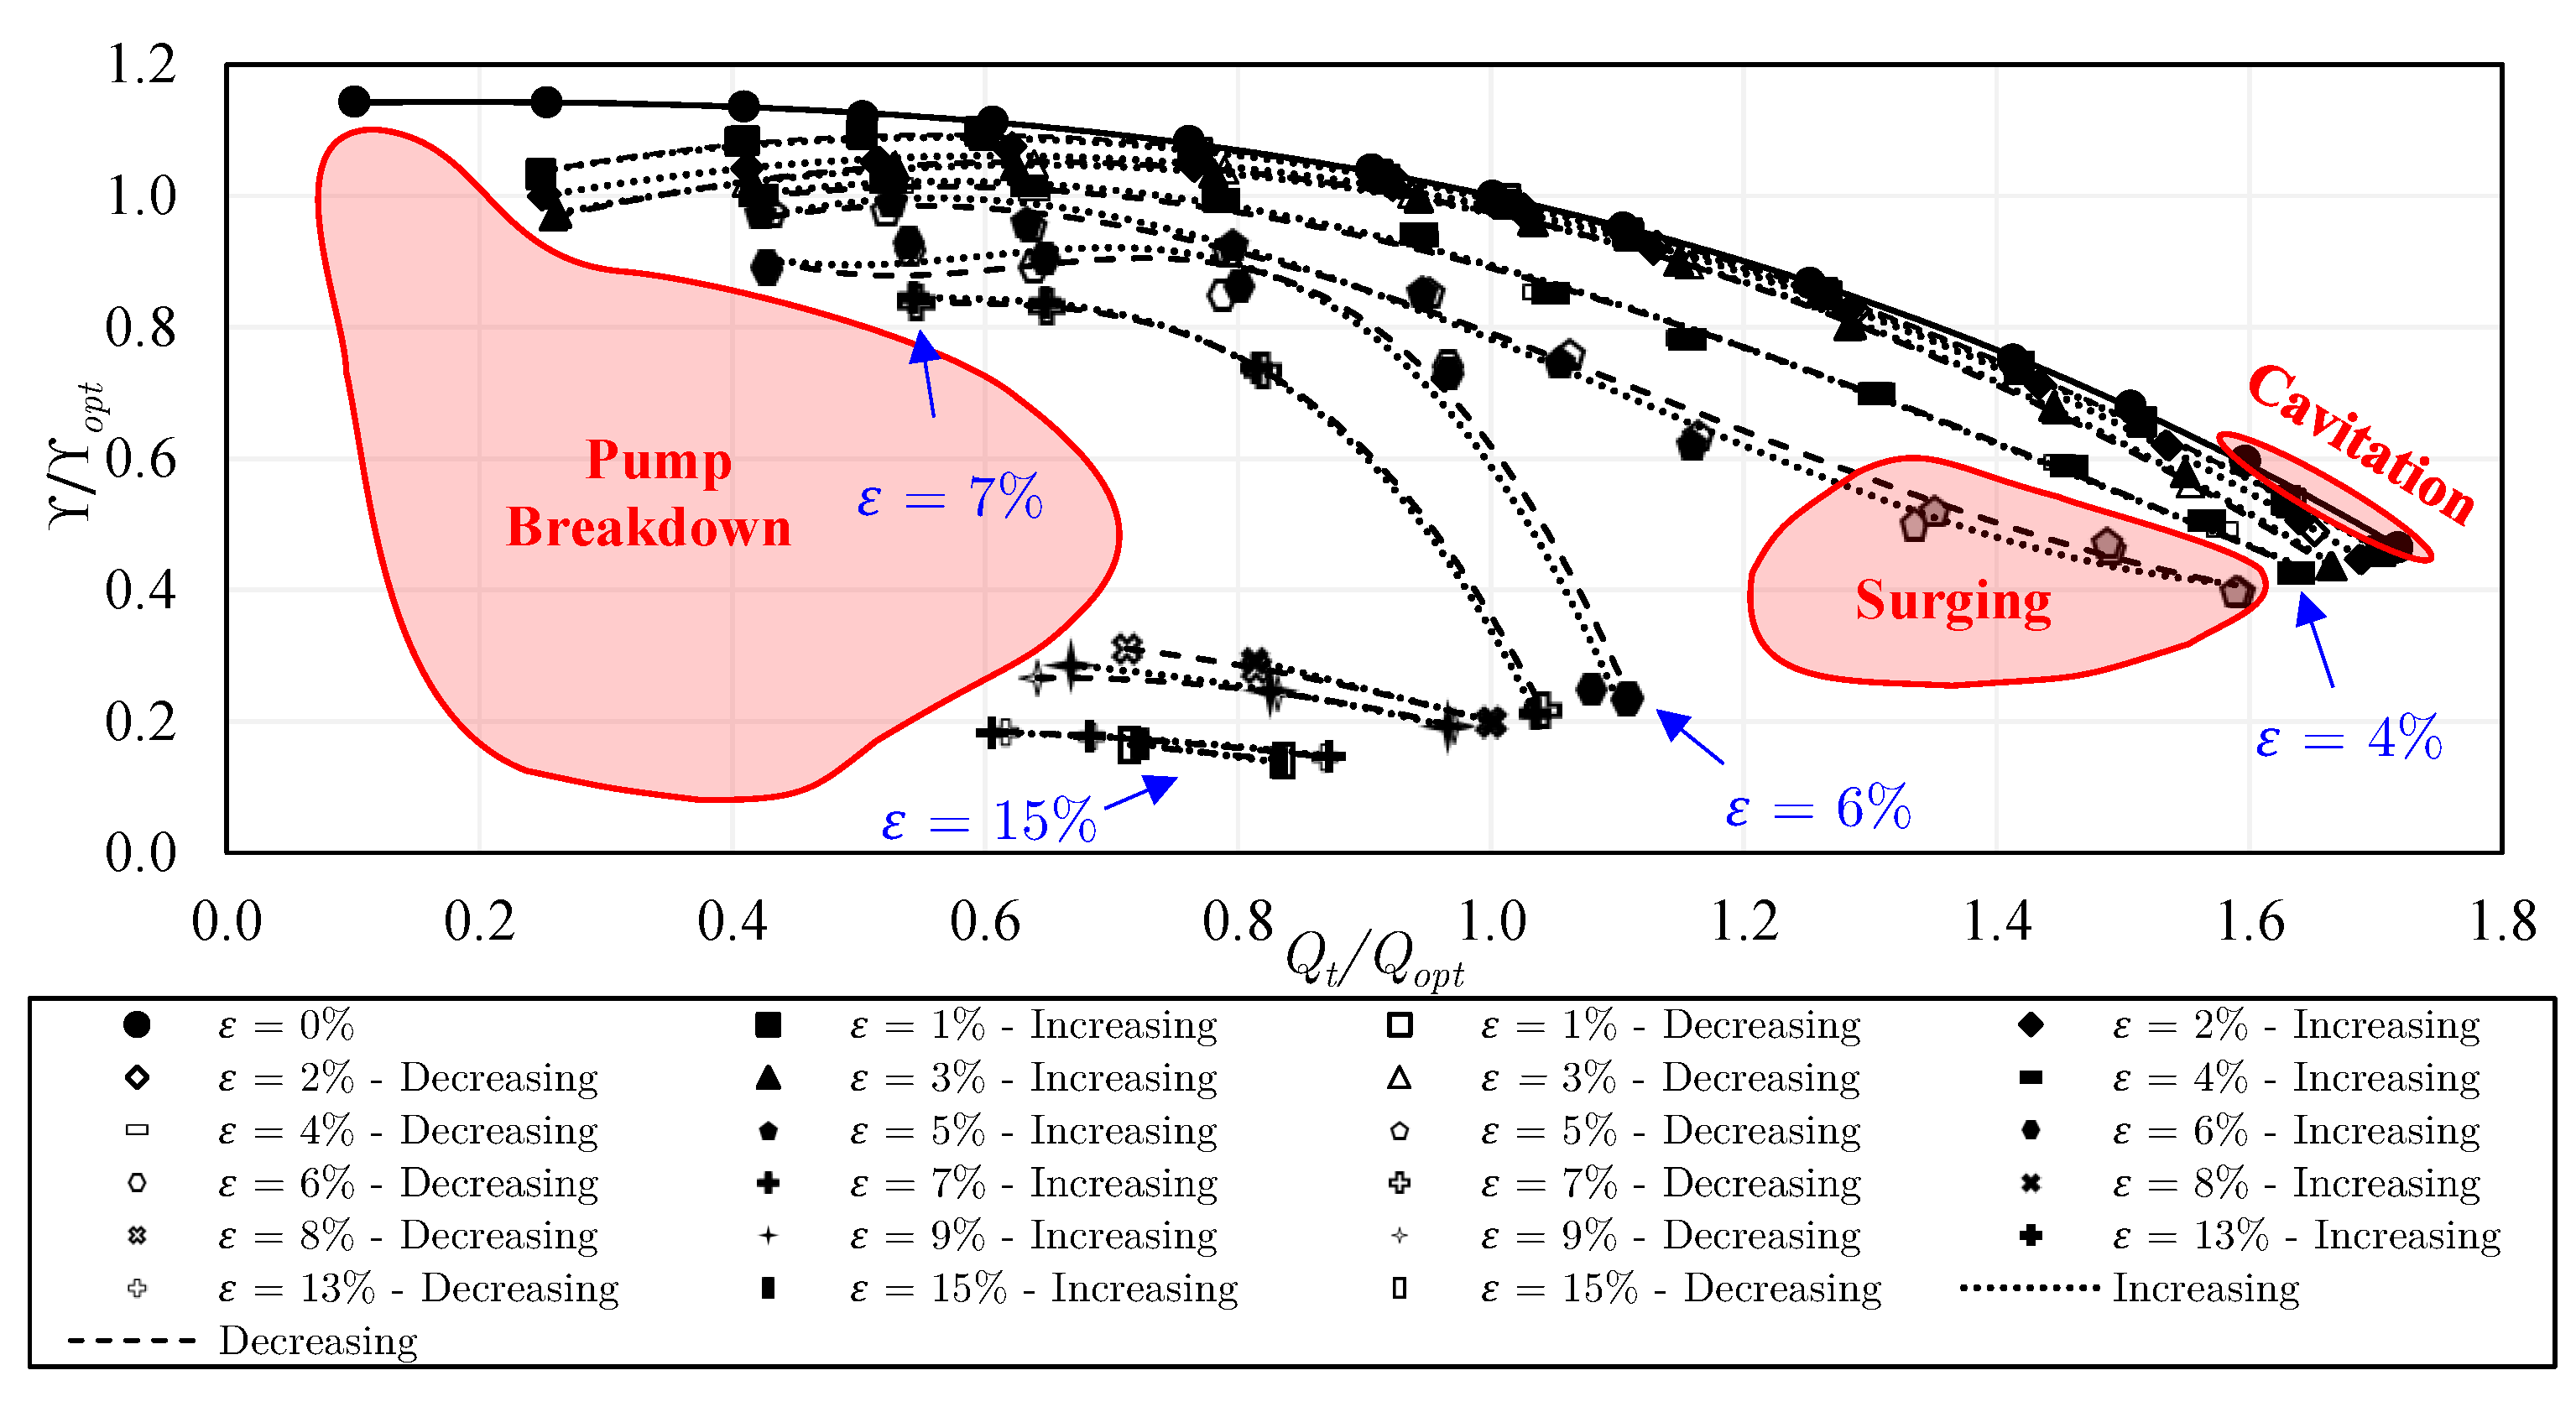
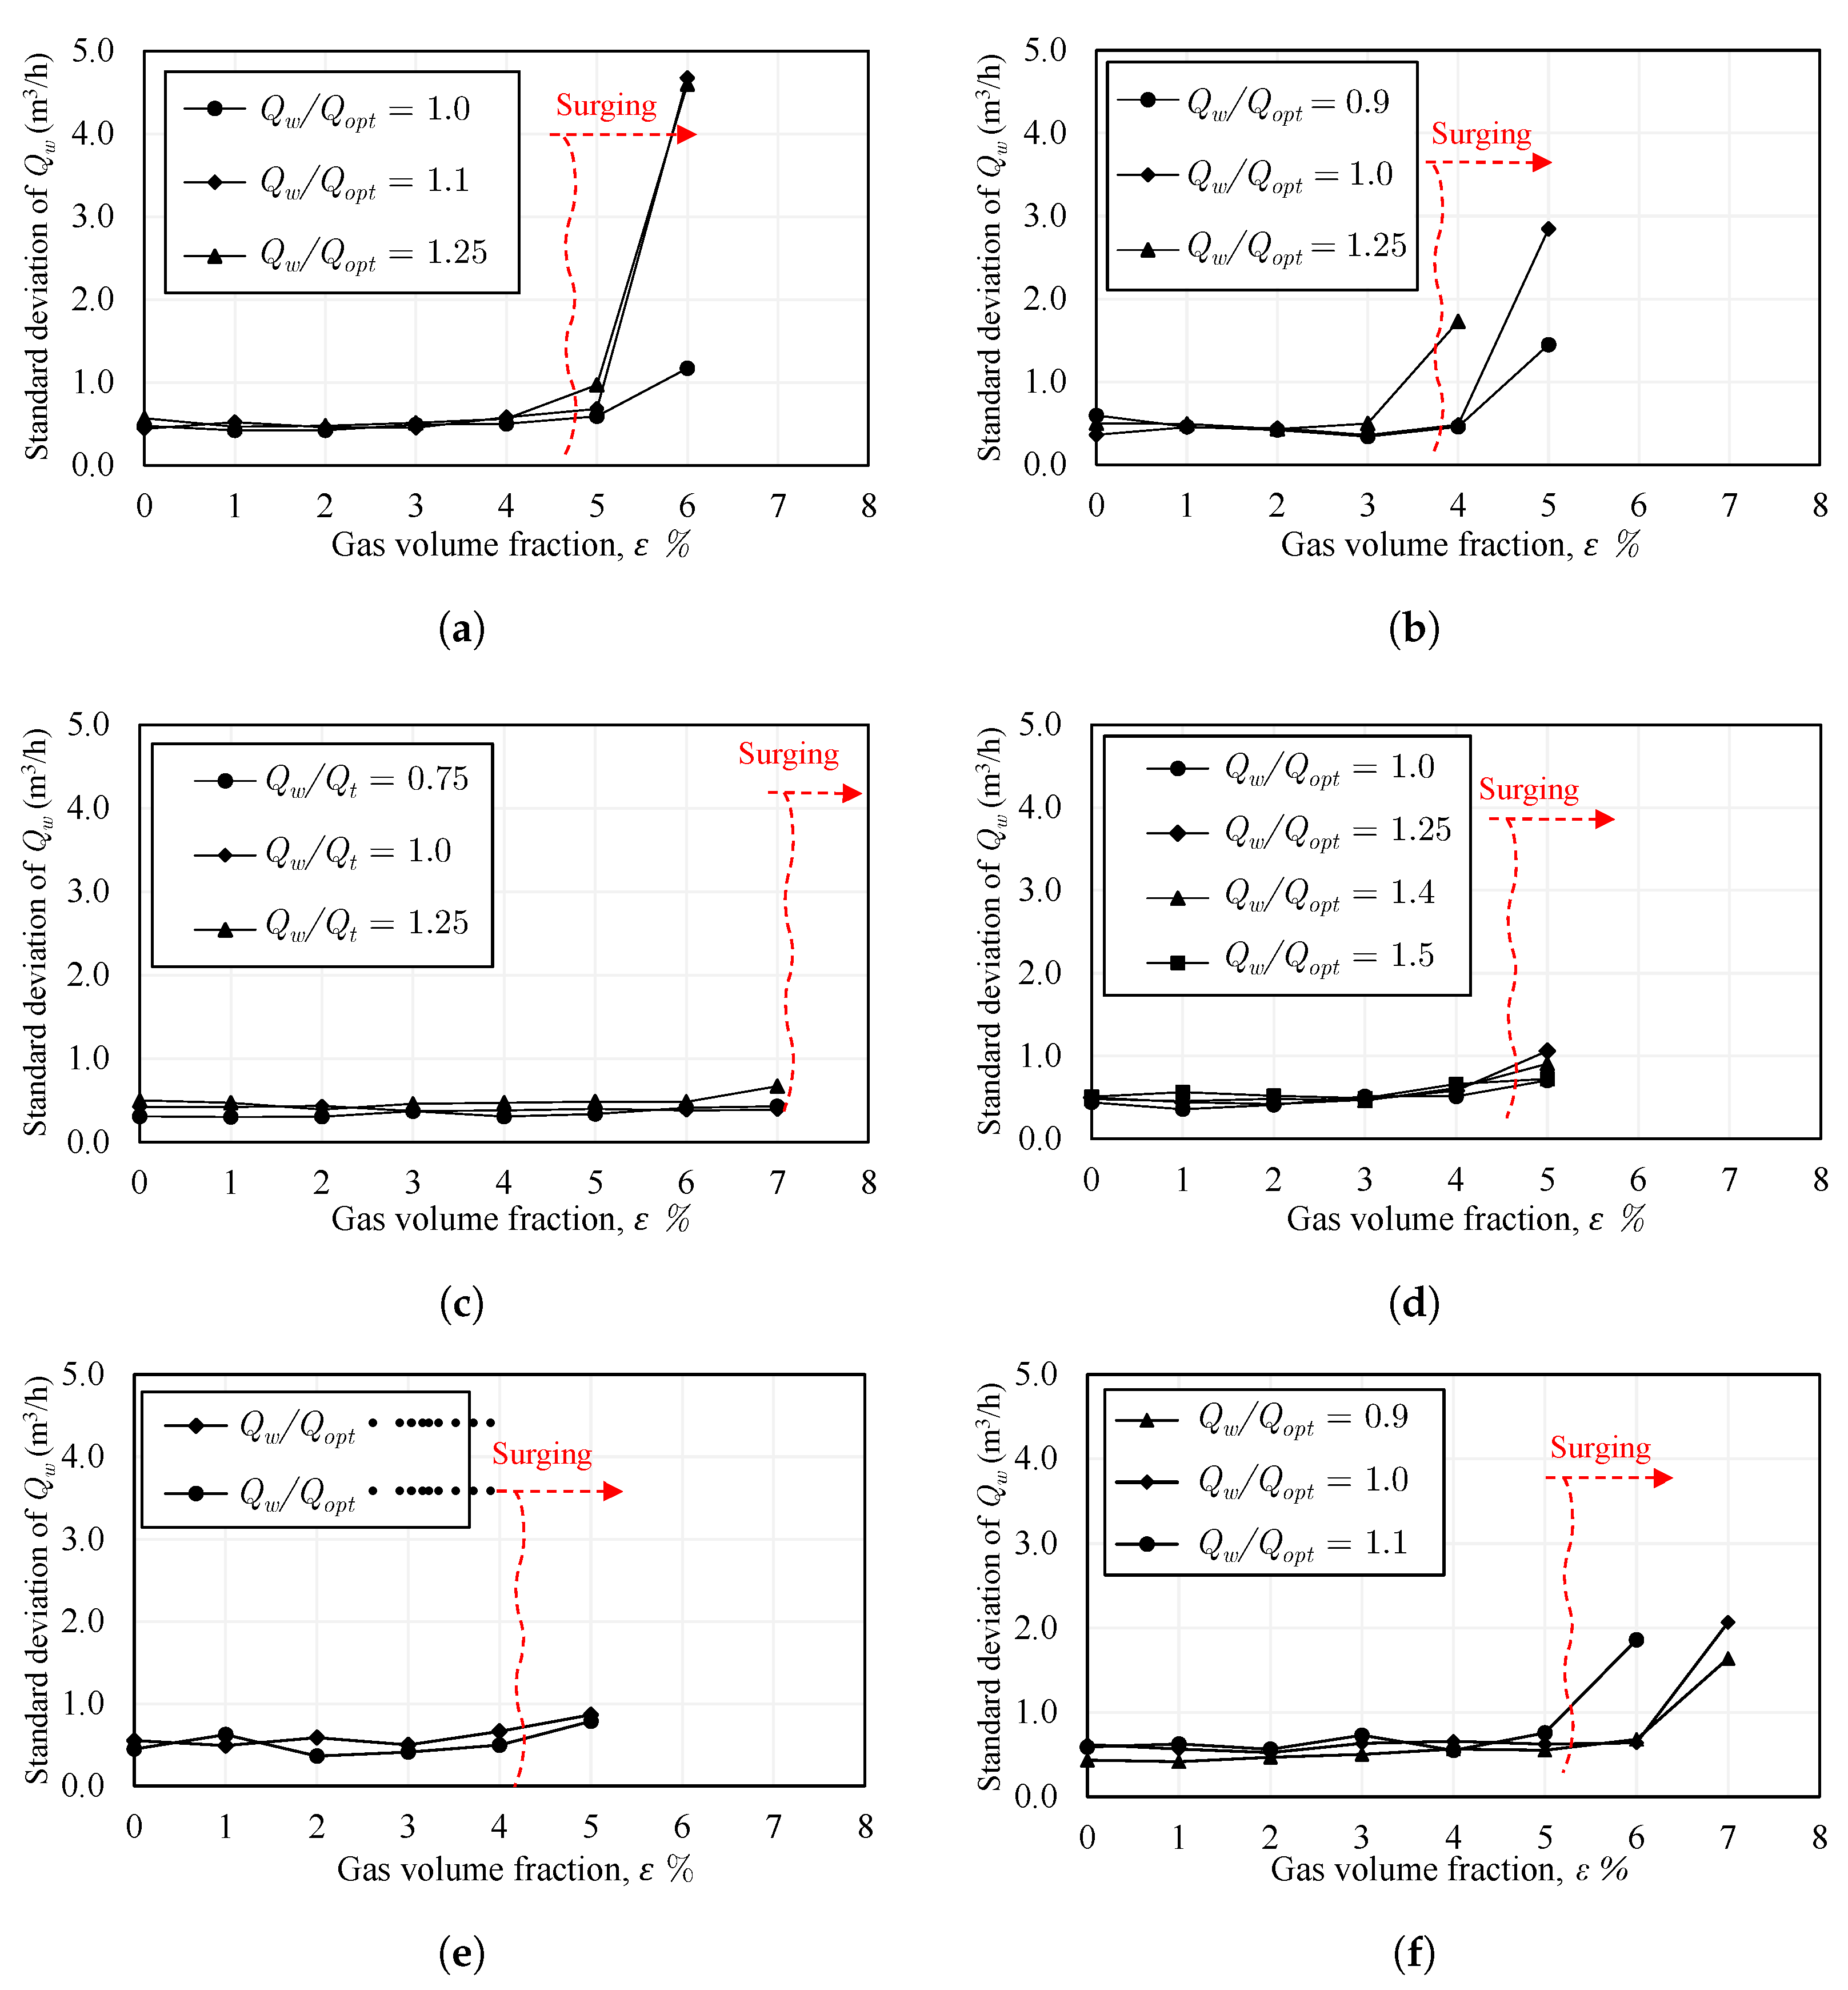
5.9. Intensity of Pump Surging and Instabilities

The flow surging instabilities are now evaluated against the classical turbulence fluctuations caused by the components installed on the piping system (flanges, valves, bends, etc.) under normal conditions (no surging) to clarify how strong the instabilities are. Figure 29 shows the standard deviation of water flow rate Q w , which is used as a measure of the intensity of instabilities. Some preliminary tests led to the determination of an appropriate recording time and sample count for computing the standard deviation. For normal operation (no surging), 200 data points were sufficient to be recorded with a frequency of 4 Hz. However, under surging conditions, 500 data points were needed to effectively capture intense and low-frequency fluctuations. Please note that only a limited number of measurements could be set and recorded under surging because of the strongly unstable conditions and the accompanying possibility of damage to the pump parts.
Due to turbulence, the standard deviation of Q w is around 0.5 m 3 / h for normal operation, as shown for the closed impeller in Figure 29a. As ε increases, the standard deviation becomes slightly elevated for ε > 4 % . For such increased gas volume fraction, the compressibility of the gas and the unstable phase distribution add a slight contribution to the fluctuations. Nonetheless, the standard deviation increases sharply to higher than 4.5 m 3 / h for ε > 5 % , due to the onset of surging. This is mainly caused by the unsteady accumulation and evacuation of gas in the impeller under surging conditions, which causes the pump to oscillate accordingly between different operating points.
It can be noted in Figure 29 that the intensity of the instabilities is commonly lower in all the semi-open impeller cases (Figure 29b–f) when compared to the closed impeller (Figure 29a). Additionally, pump surging is generally less likely to occur in semi-open impeller cases. For instance, surging occurs in the standard gap configuration only near the end of the flow range for a limited gas volume fraction range ( ε = 4–5%), as illustrated in Figure 29b. Further, the intensity of surging in all semi-open impeller cases does not exceed 3 m 3 / h . Nonetheless, it can take place at lower gas volume fractions when compared to the closed impeller.
Pump surging is retarded to ε > 7 % for the increased gap, as presented in Figure 29c. Similarly, by installing the inducer, the possible surging is delayed and strongly dampened down, as shown in Figure 29d. When the semi-open impeller with a standard gap and trimmed trailing edge is used (Figure 29e), the observed surging is weaker, as shown in Figure 29e, compared to the semi-open impeller with a standard gap and round training edge (Figure 29b). However, it cannot be stated that surging is generally lower when using a trimmed trailing edge, since the surging conditions are wider compared to the round training edge impeller (see, again, Figure 18 and Figure 24). Additionally, only a limited number of data points could be measured and compared in surging conditions, as mentioned above.
Now concerning the influence of the rpm on the intensity of flow instabilities, Figure 29e,f are compared. For the 650 rpm, the flow instabilities are apparently softer yet occur at lower air contents ( ε 4 % ). The reason is the lower resistance to air accumulations for the low rotational speed. Conversely, surging could be retarded by increasing the rpm to 1000 rpm, but it is more intense. Overall, to avoid or limit the occurrence of strong pump instabilities, the semi-open impeller should be employed. Increasing the gap or adding an upstream inducer would help to suppress the instabilities even further. The round trailing edge impeller, as well as the lower rotational speed, are also preferable.

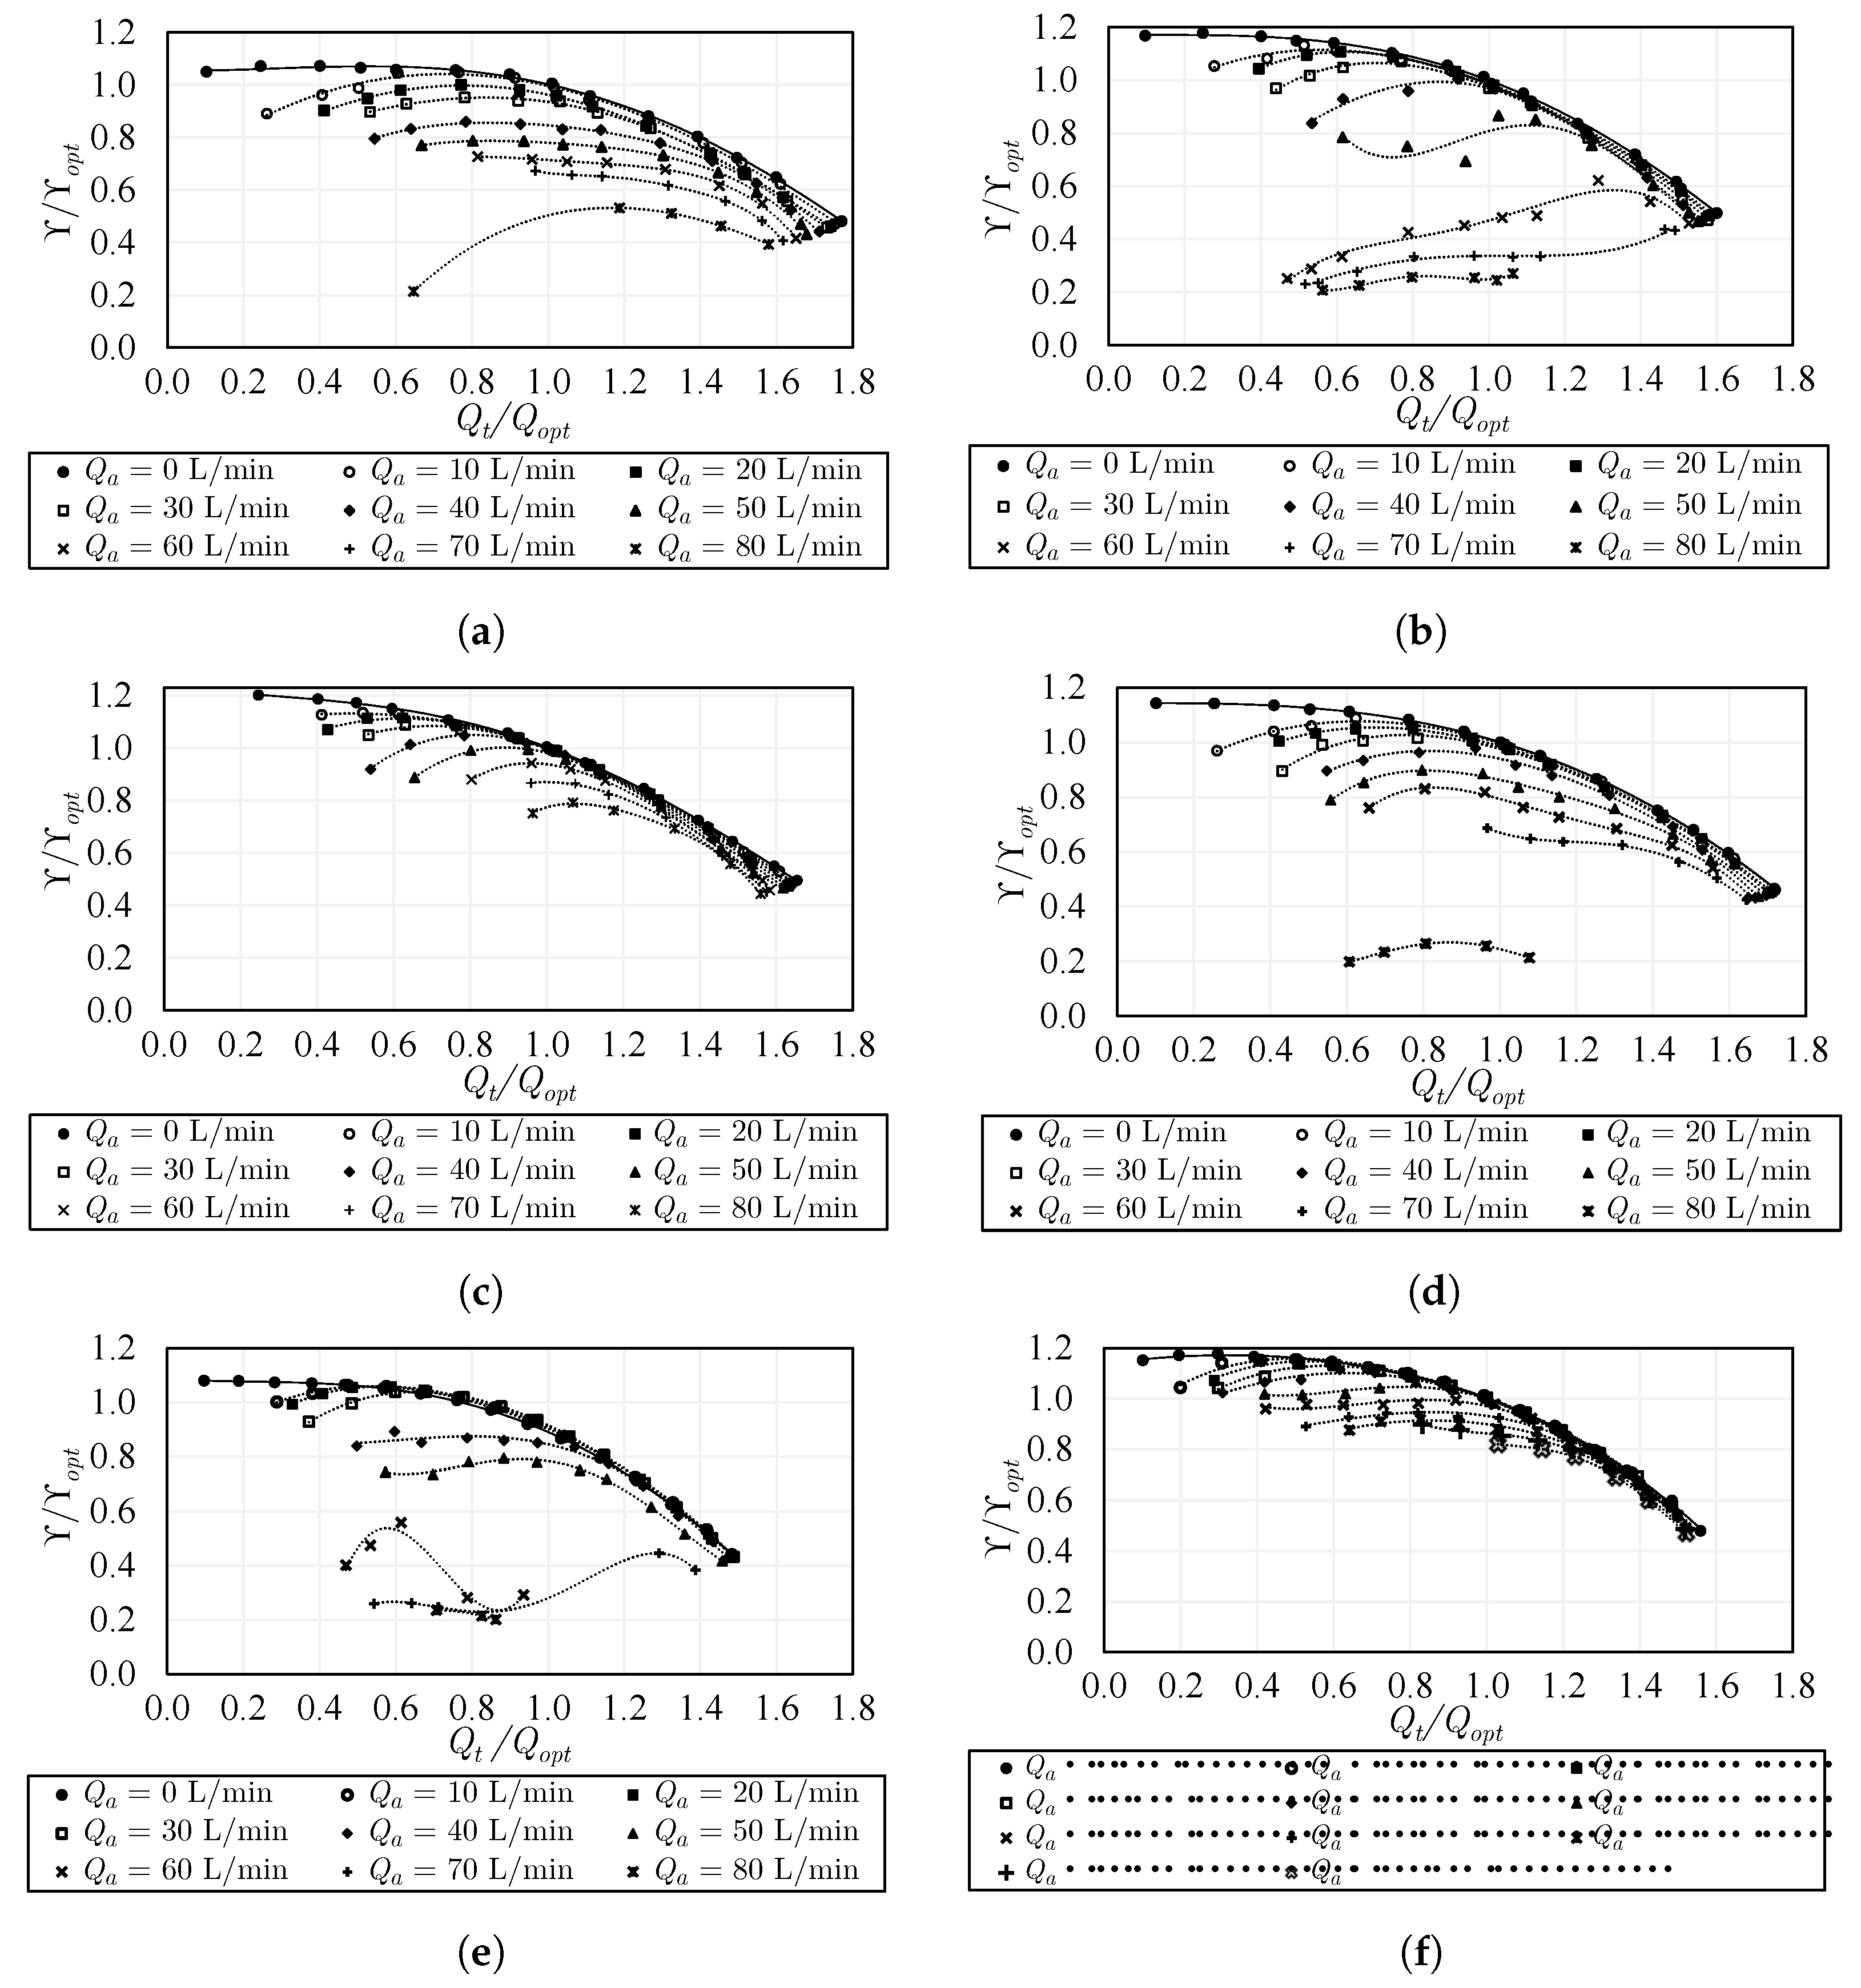
5.10. Performance Curves for Constant Air Flow Rates

Figure 30 compares the specific delivery work for constant gas volume flow rates among the considered pump configurations. For the closed impeller case shown in Figure 30a, the curves become much more unstable for Q a = 80 L / min , where the curves show a strong positive slope at a low flow rate. This can result in system curves with two different operational points. This strong unstable curve indicates that surging can easily take place in the closed impeller at high gas contents.
Concerning the semi-open impeller with a standard gap shown in Figure 30b, the curves show a reversed behavior at high air volume flow rates ( Q a = 60–80 L/min). However, the behavior is not as unstable as for the closed impeller, which indicates less possibility of pump surging in the semi-open impeller with a standard gap.
For the increased gap shown in Figure 30c, the pump can transport higher gas contents with less unstable curves, and the two-phase curves become very comparable to that of the pure liquid curve ( Q a = 0 L / min ). In addition, pump surging is positively retarded to higher gas contents, as mentioned earlier.
Similarly, when the inducer is used with the semi-open impeller with a standard gap, the stability of most curves is improved, as seen in Figure 30d, compared to the case without the inducer (Figure 30b). Still, for very high air flow rates ( Q a = 80 L / min ), the improvement of the performance is negligible.
Now, for the semi-open impeller with a standard gap and trimmed tailing edge presented in Figure 30e, only very low performance reduction takes place up to Q a = 30 L / min . This confirms the high resistance to gas accumulation at low gas flow rates. Nonetheless, the degradation is obviously bigger up to Q a = 50 L / min . Afterward, the specific delivery work becomes very limited starting from Q a = 60 L / min .
For 1000 rpm, the specific delivery work is strongly improved, as shown in Figure 30f. In this case, the performance degradation is very gradual until Q a = 100 L / min . This confirms the enhanced ability of the pump to transport mixtures with higher gas contents. However, the curves become narrower as the gas contents increase. Overall, the increased gap and the high rotational speed appear to be the best solutions concerning the pump operation with constant gas volume flow rates.

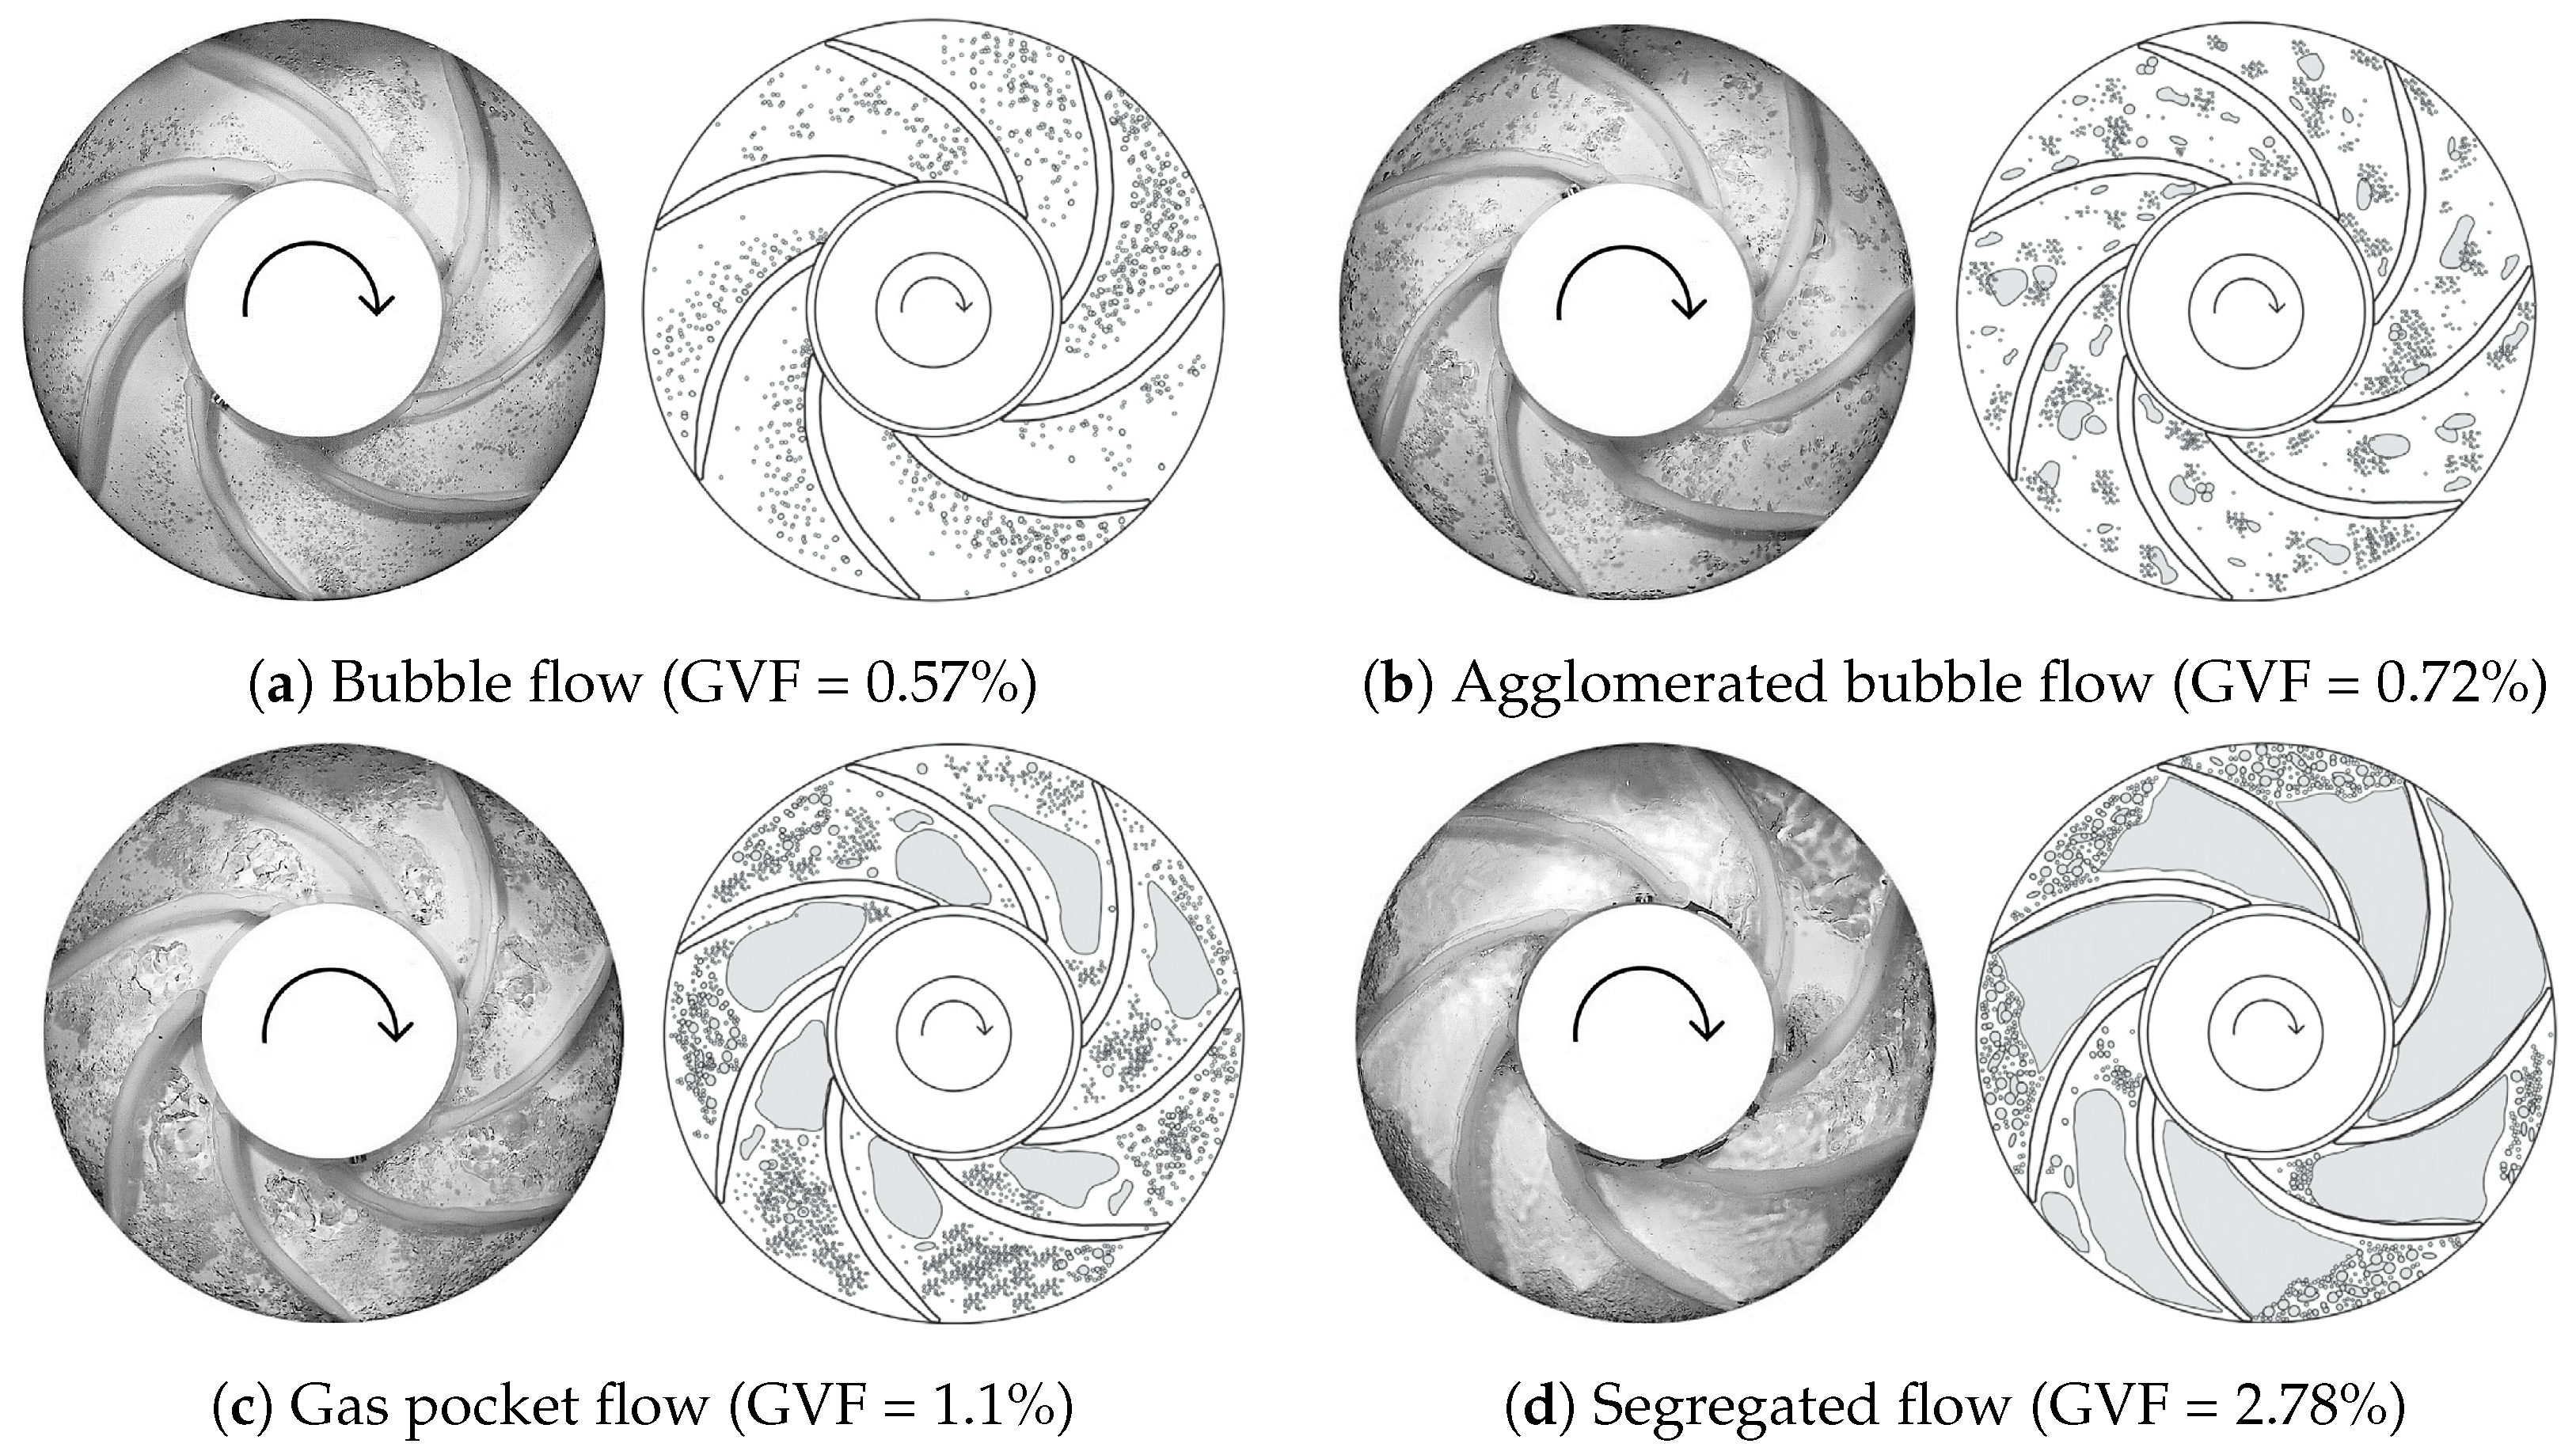
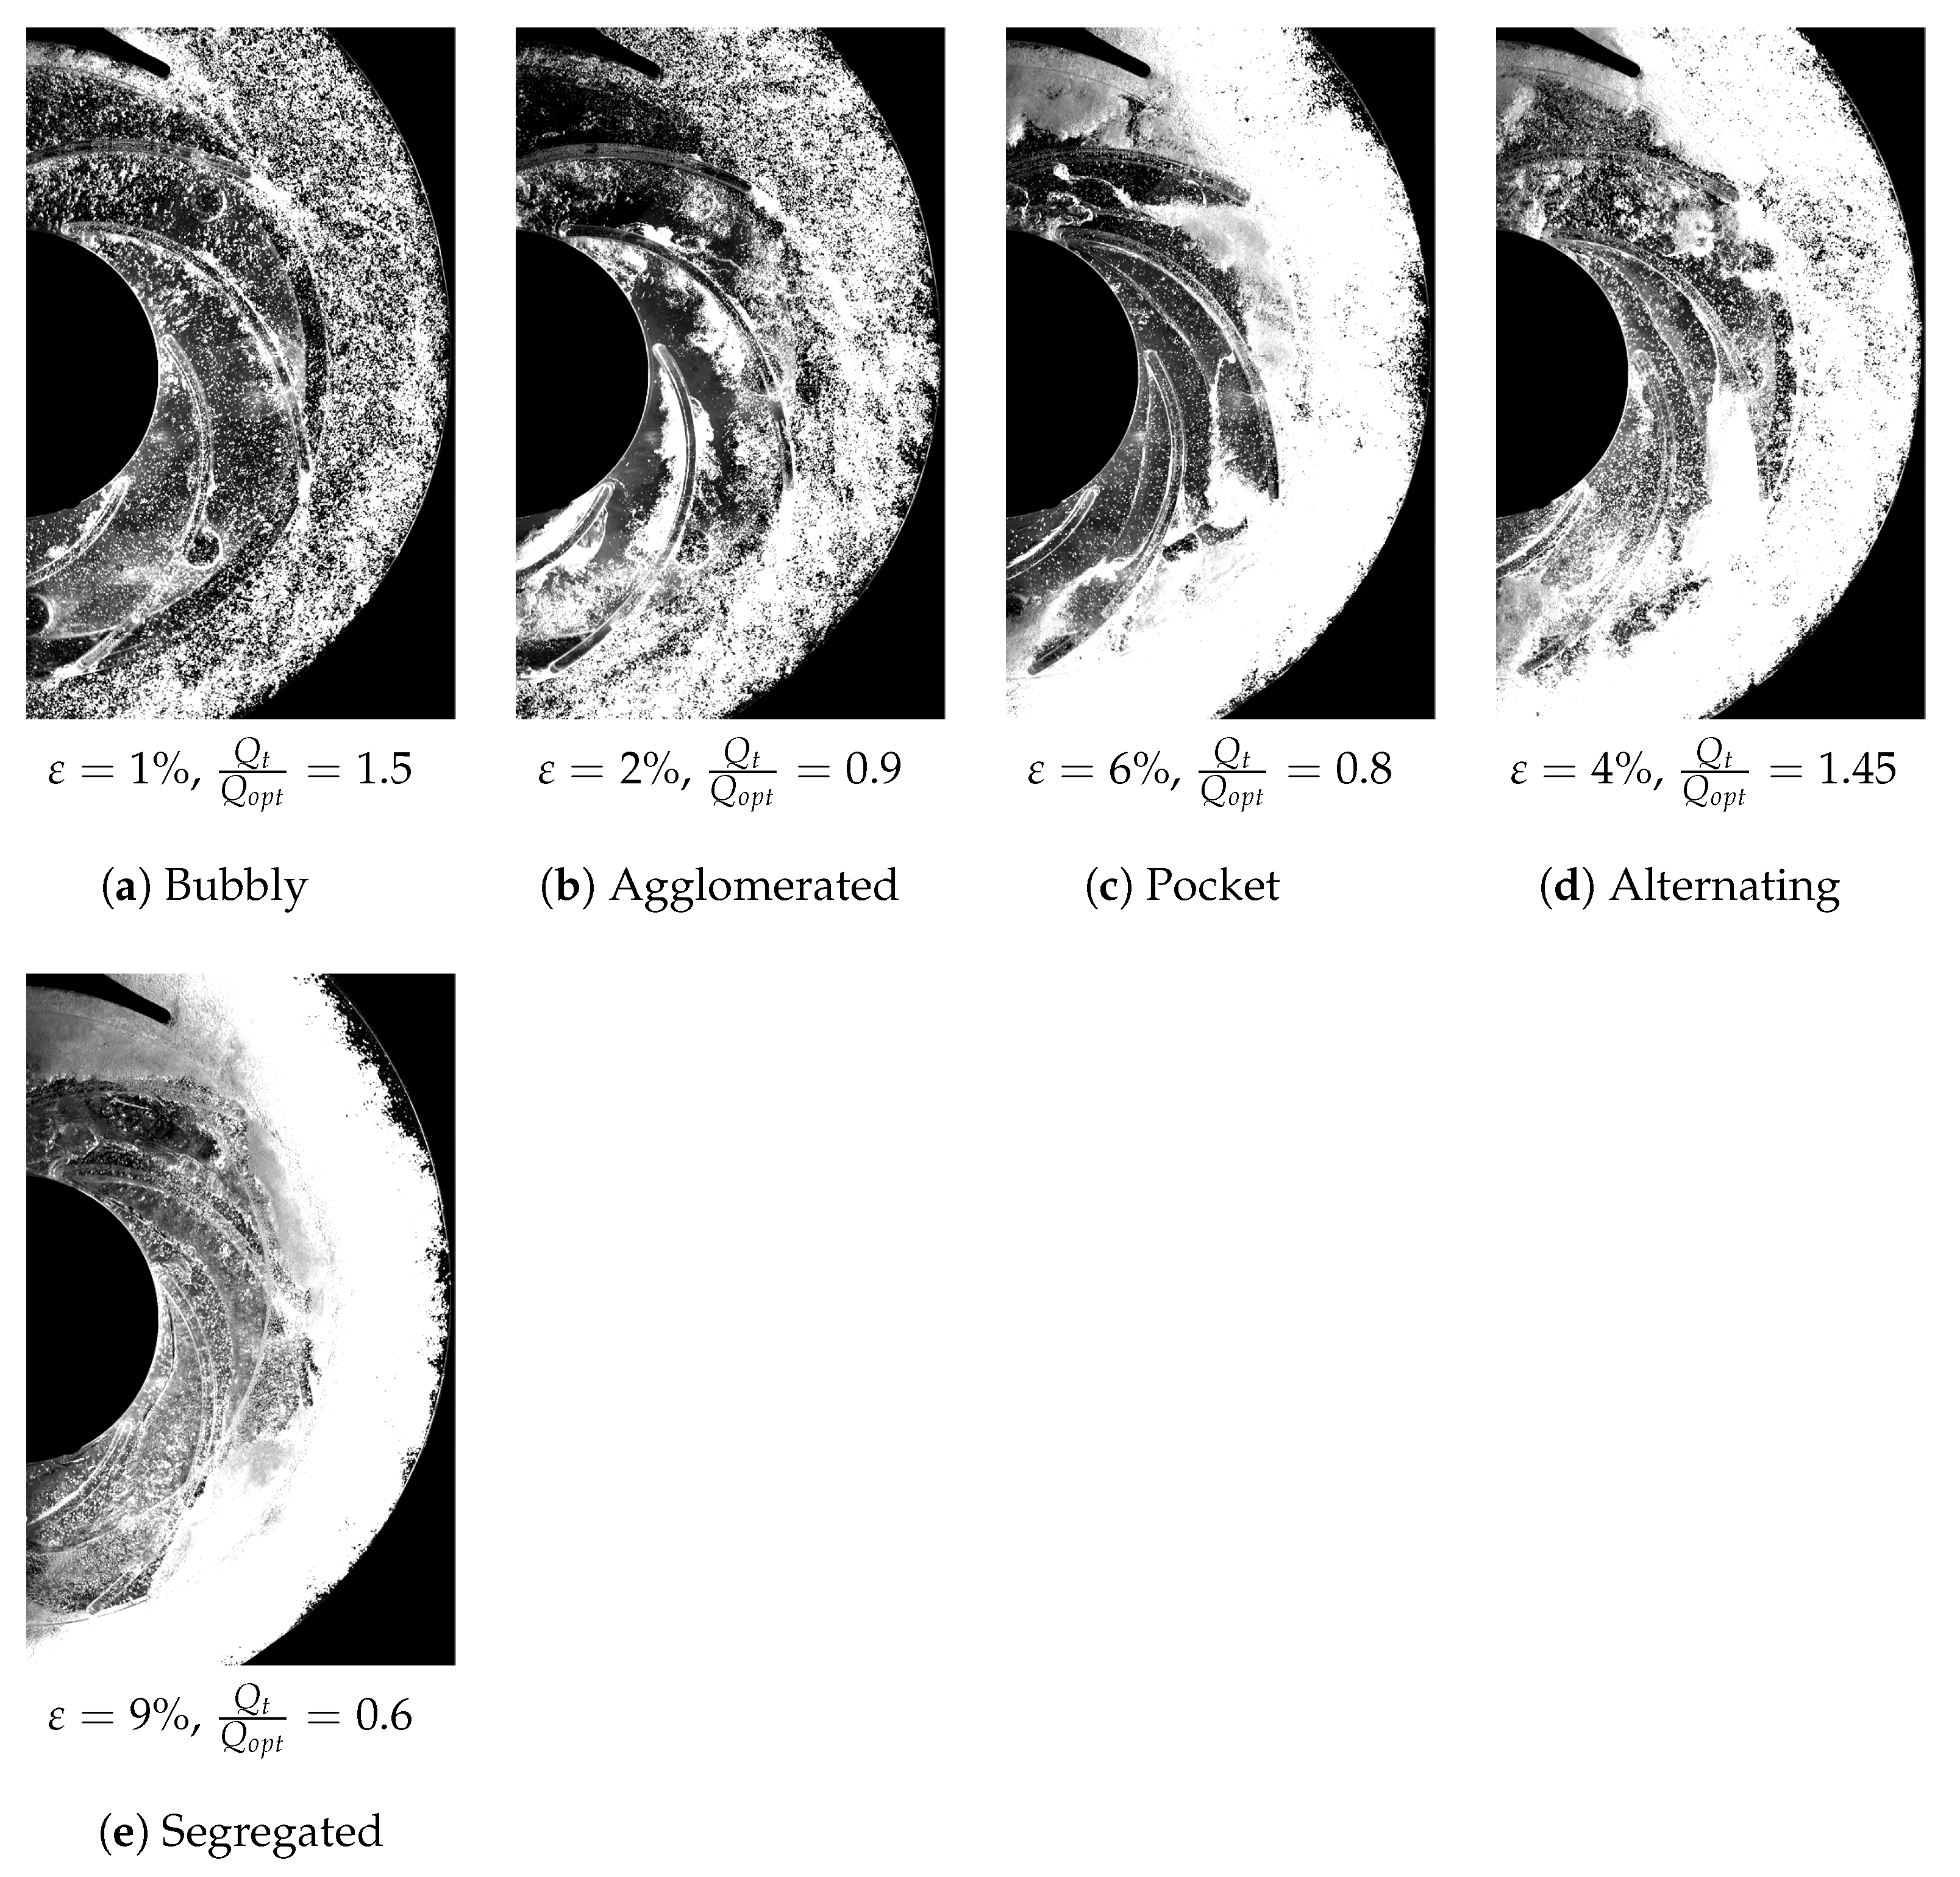
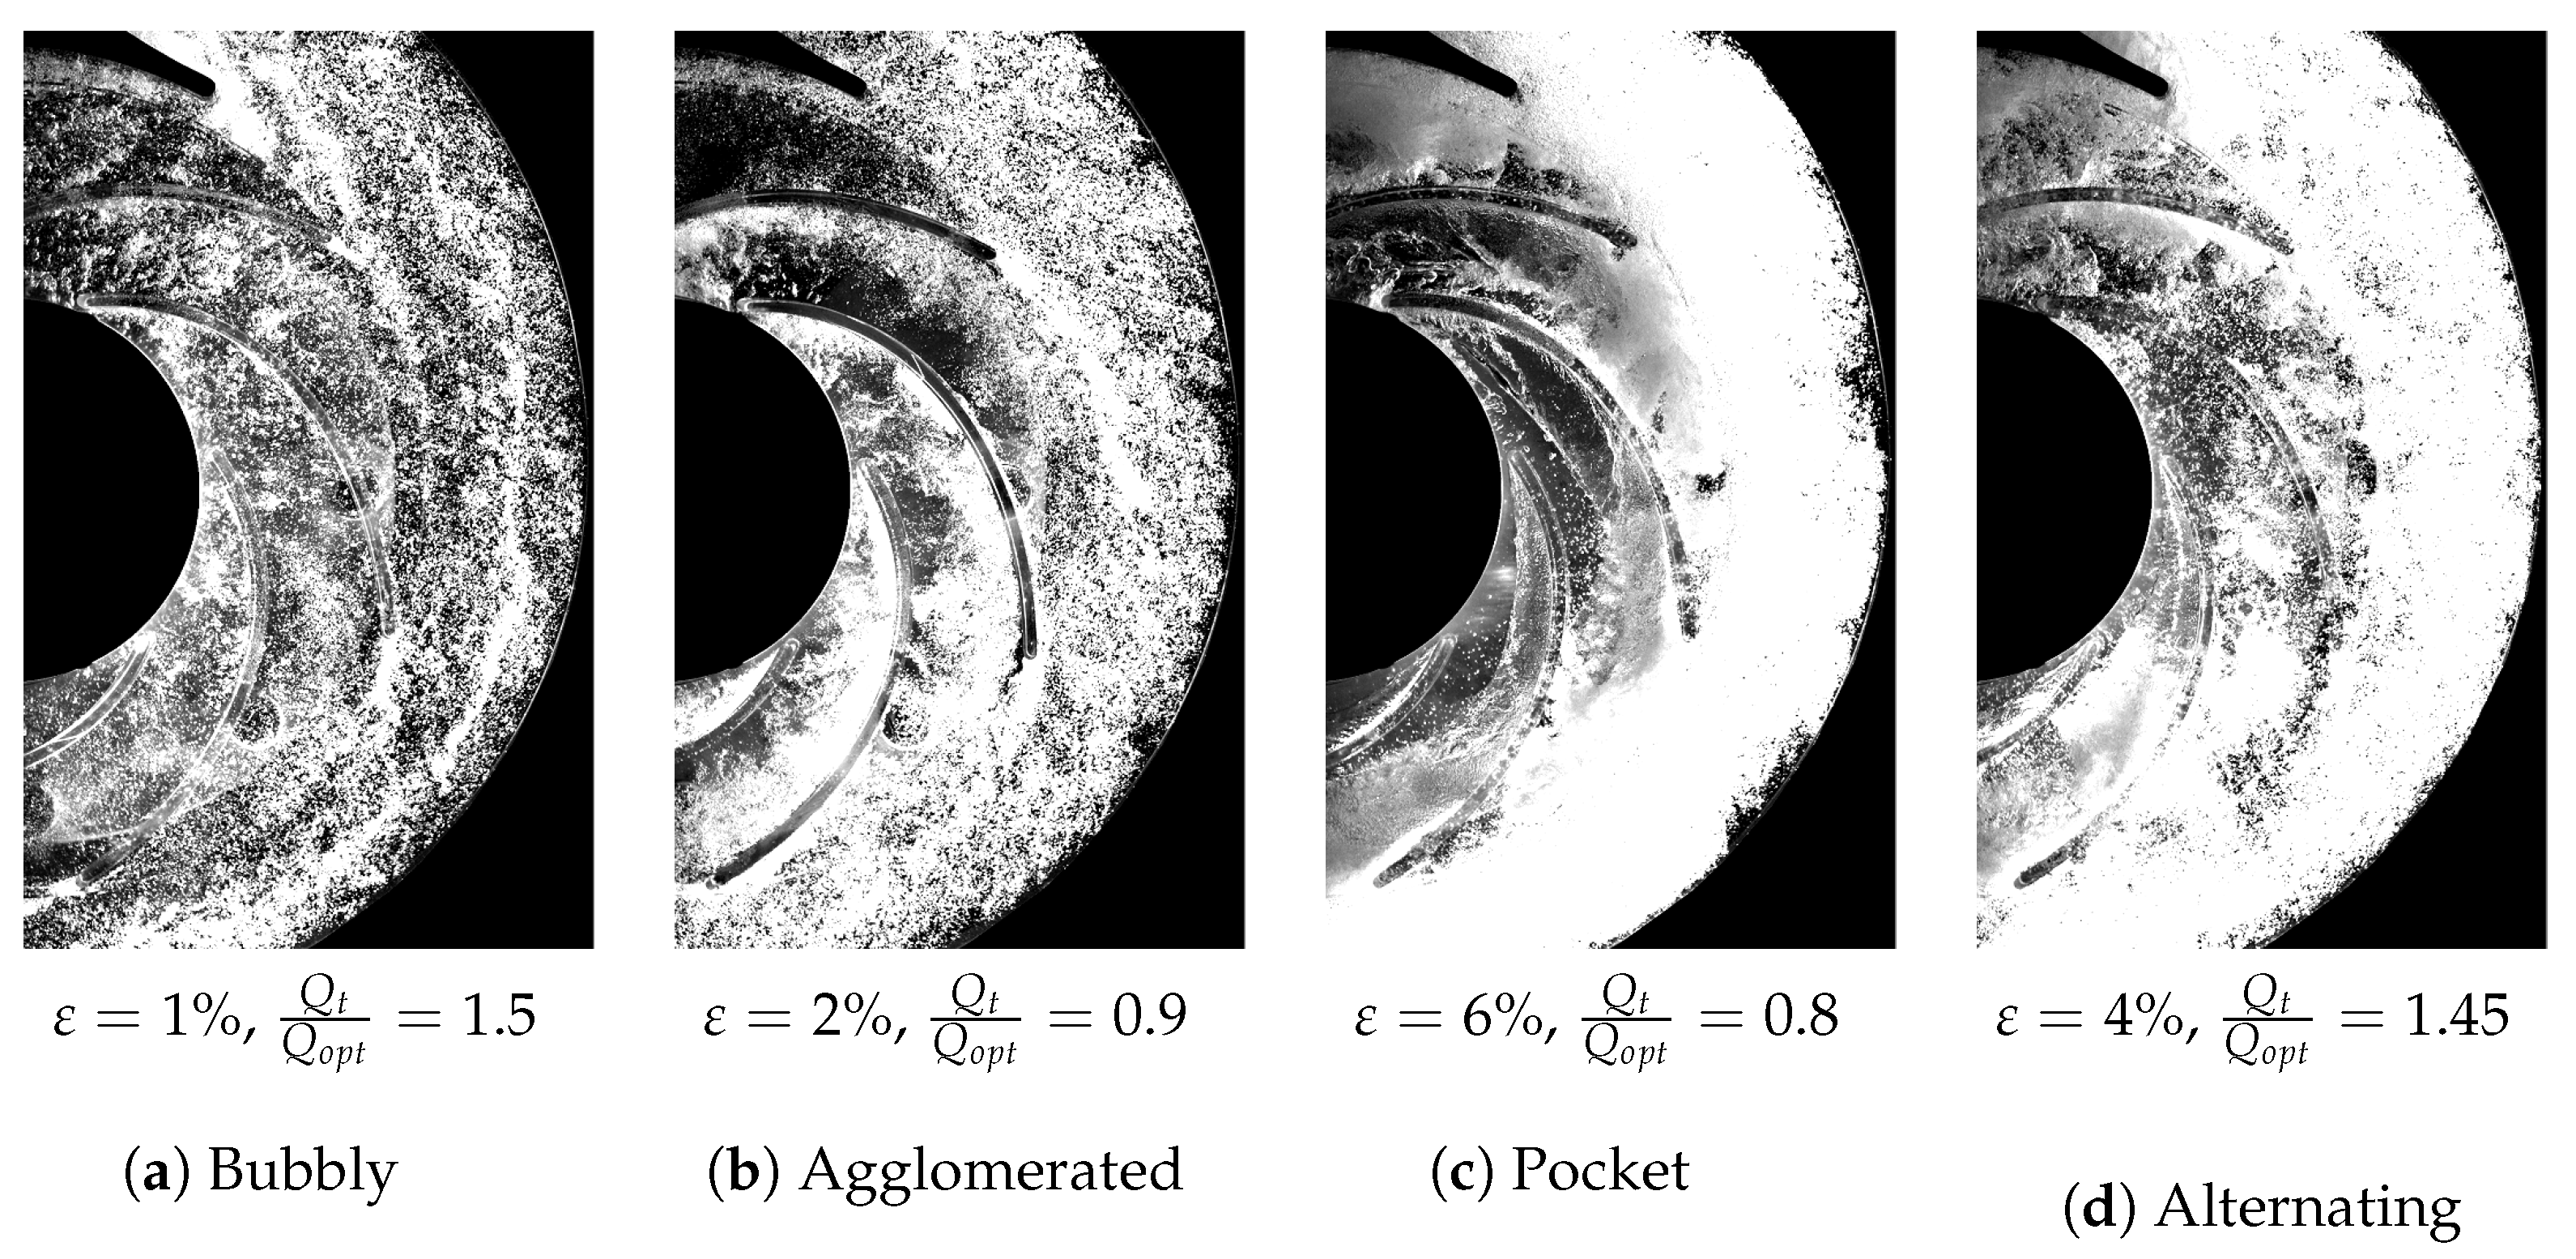
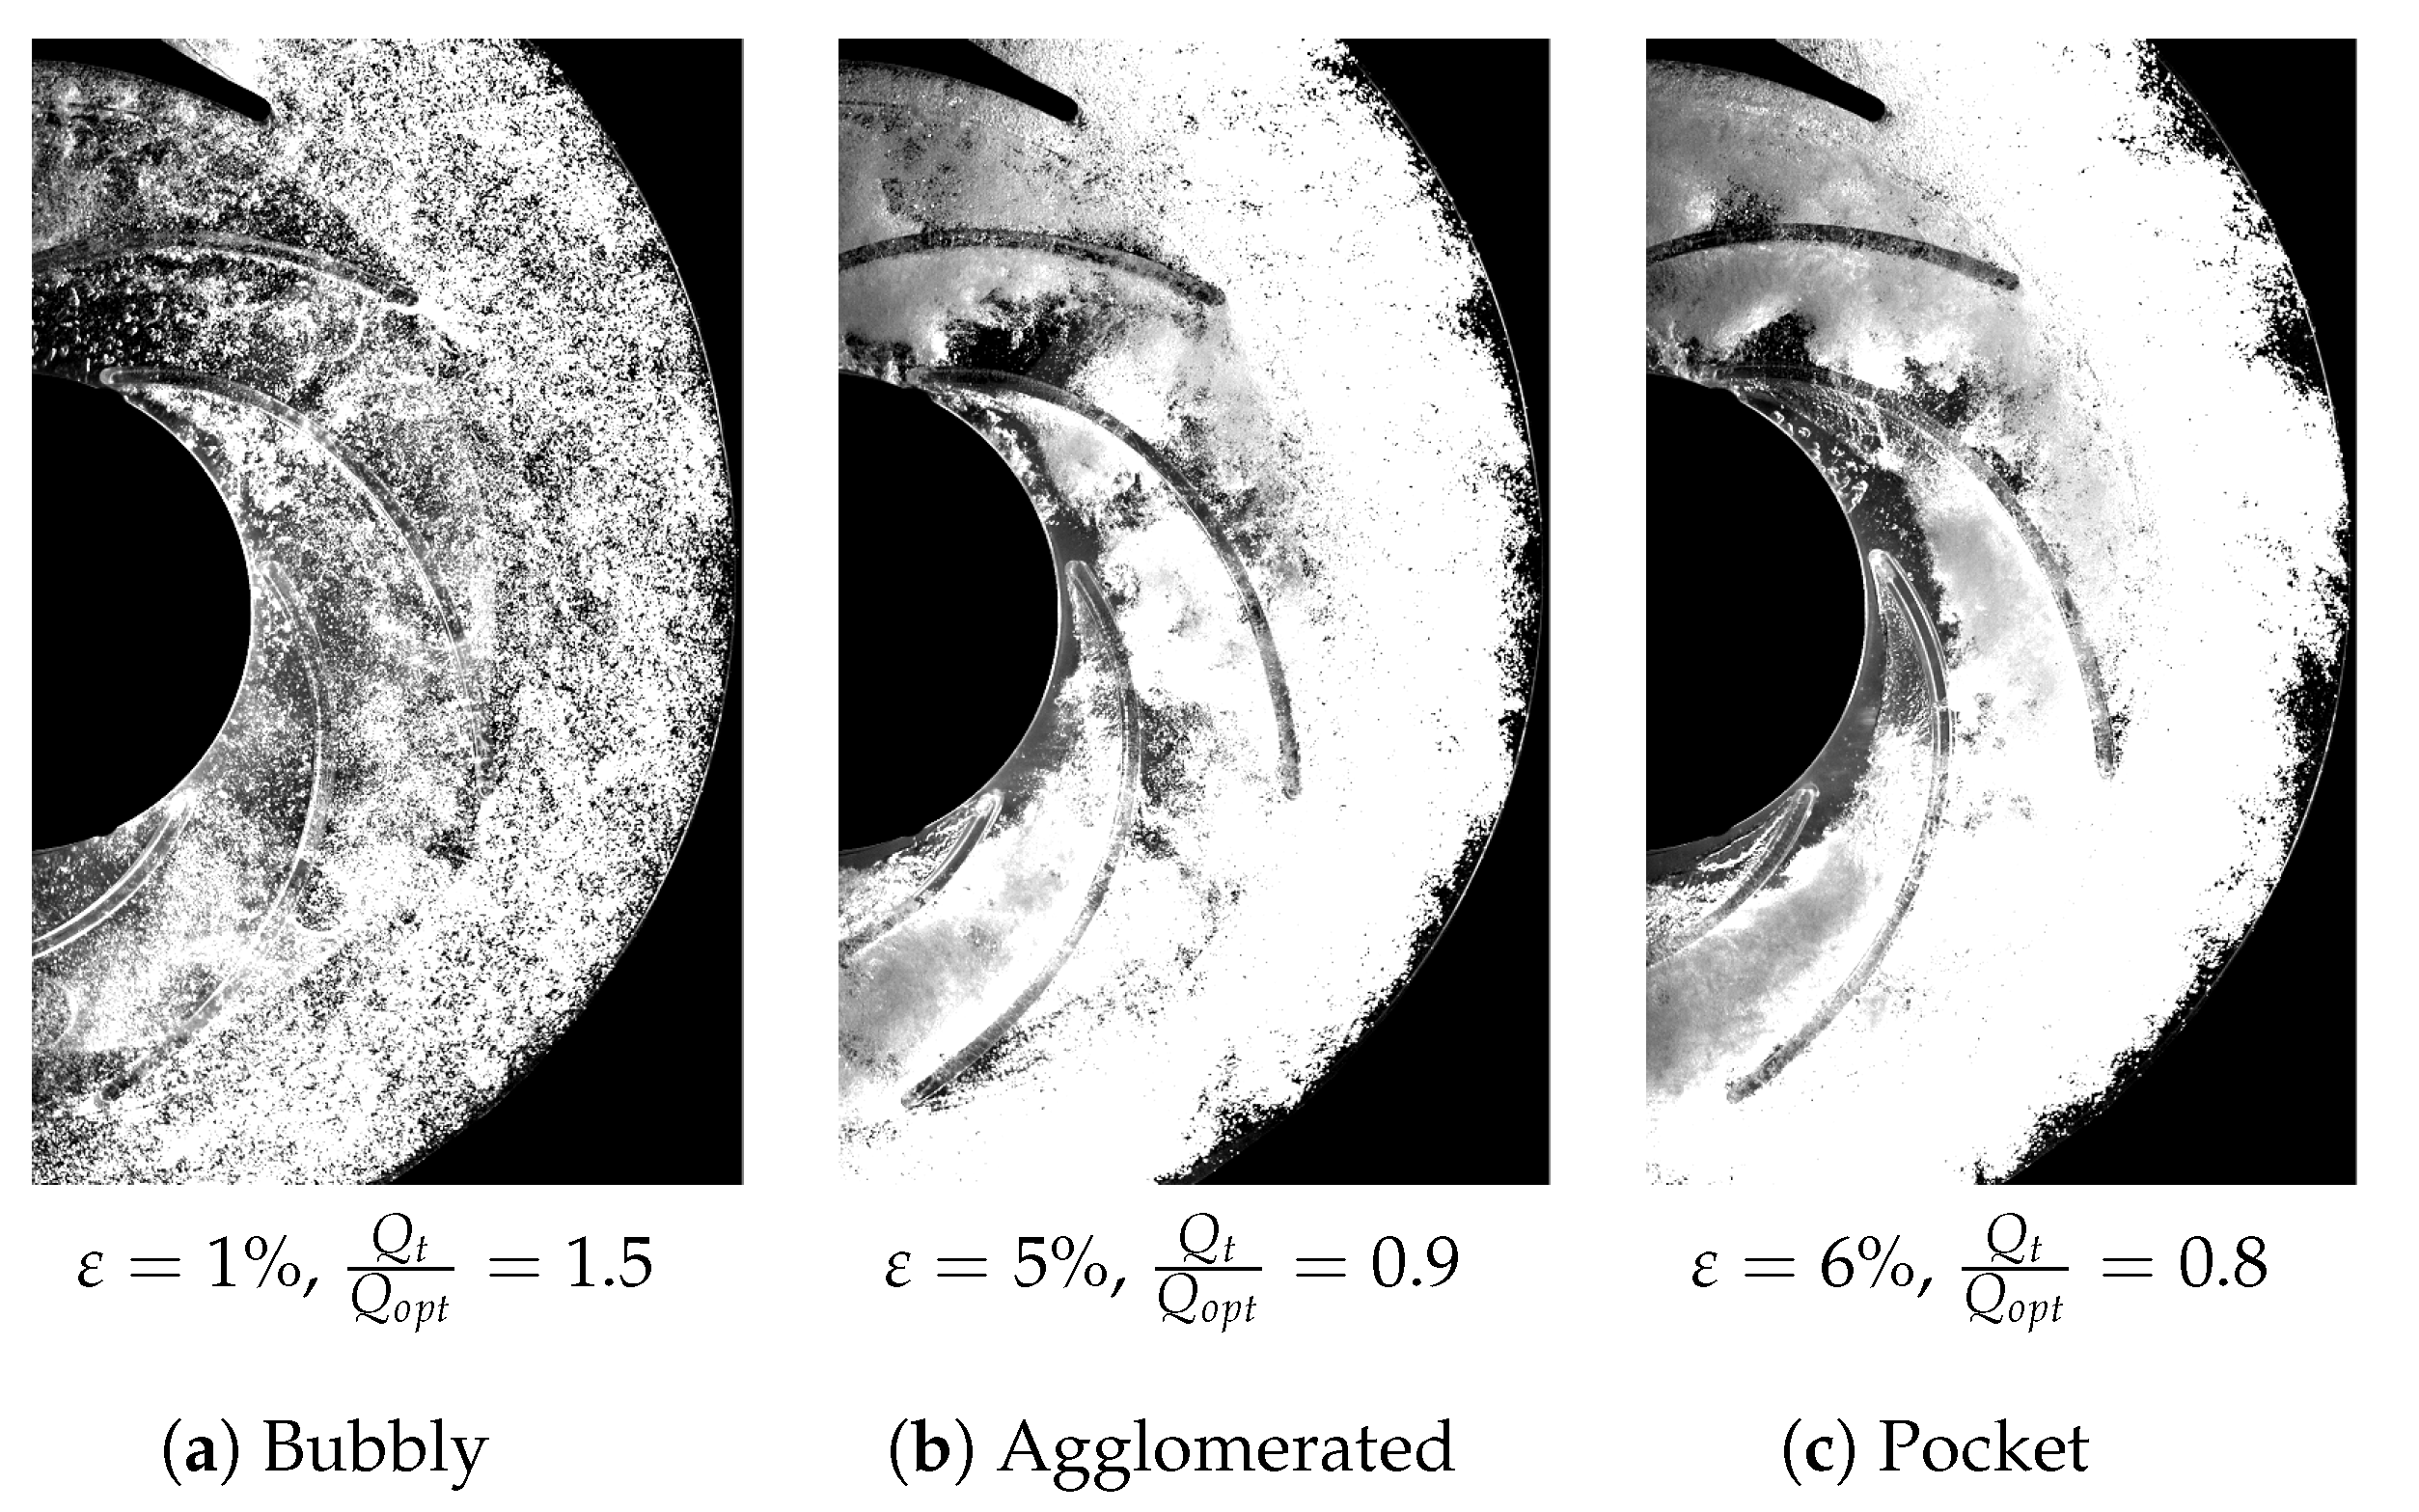
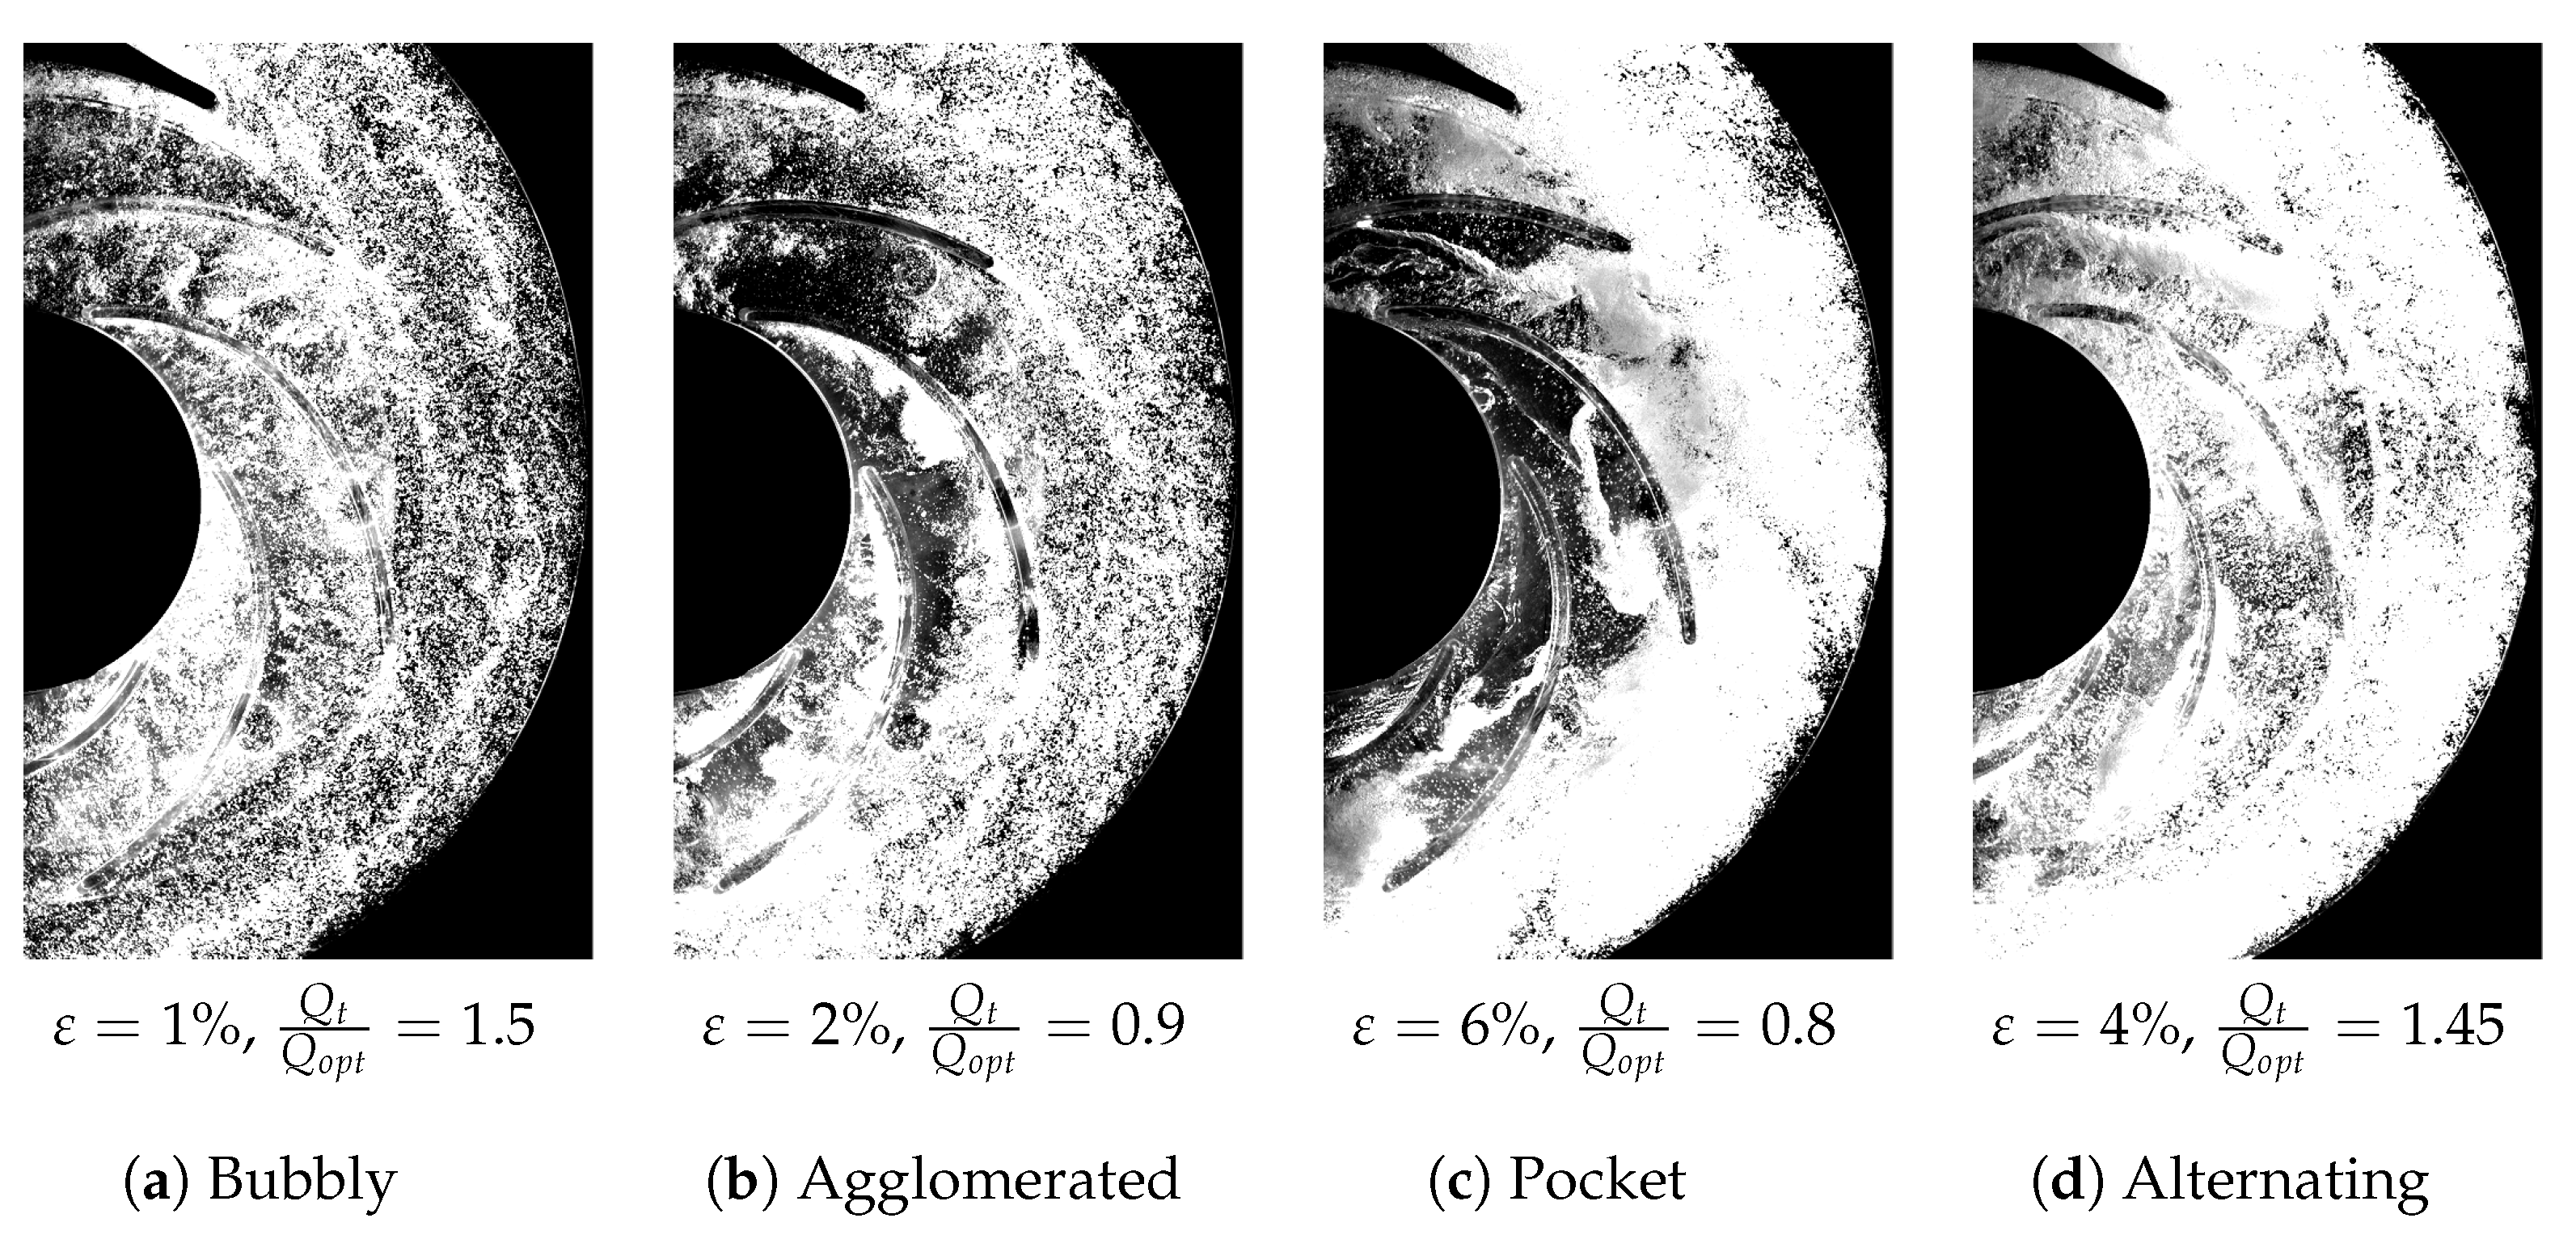
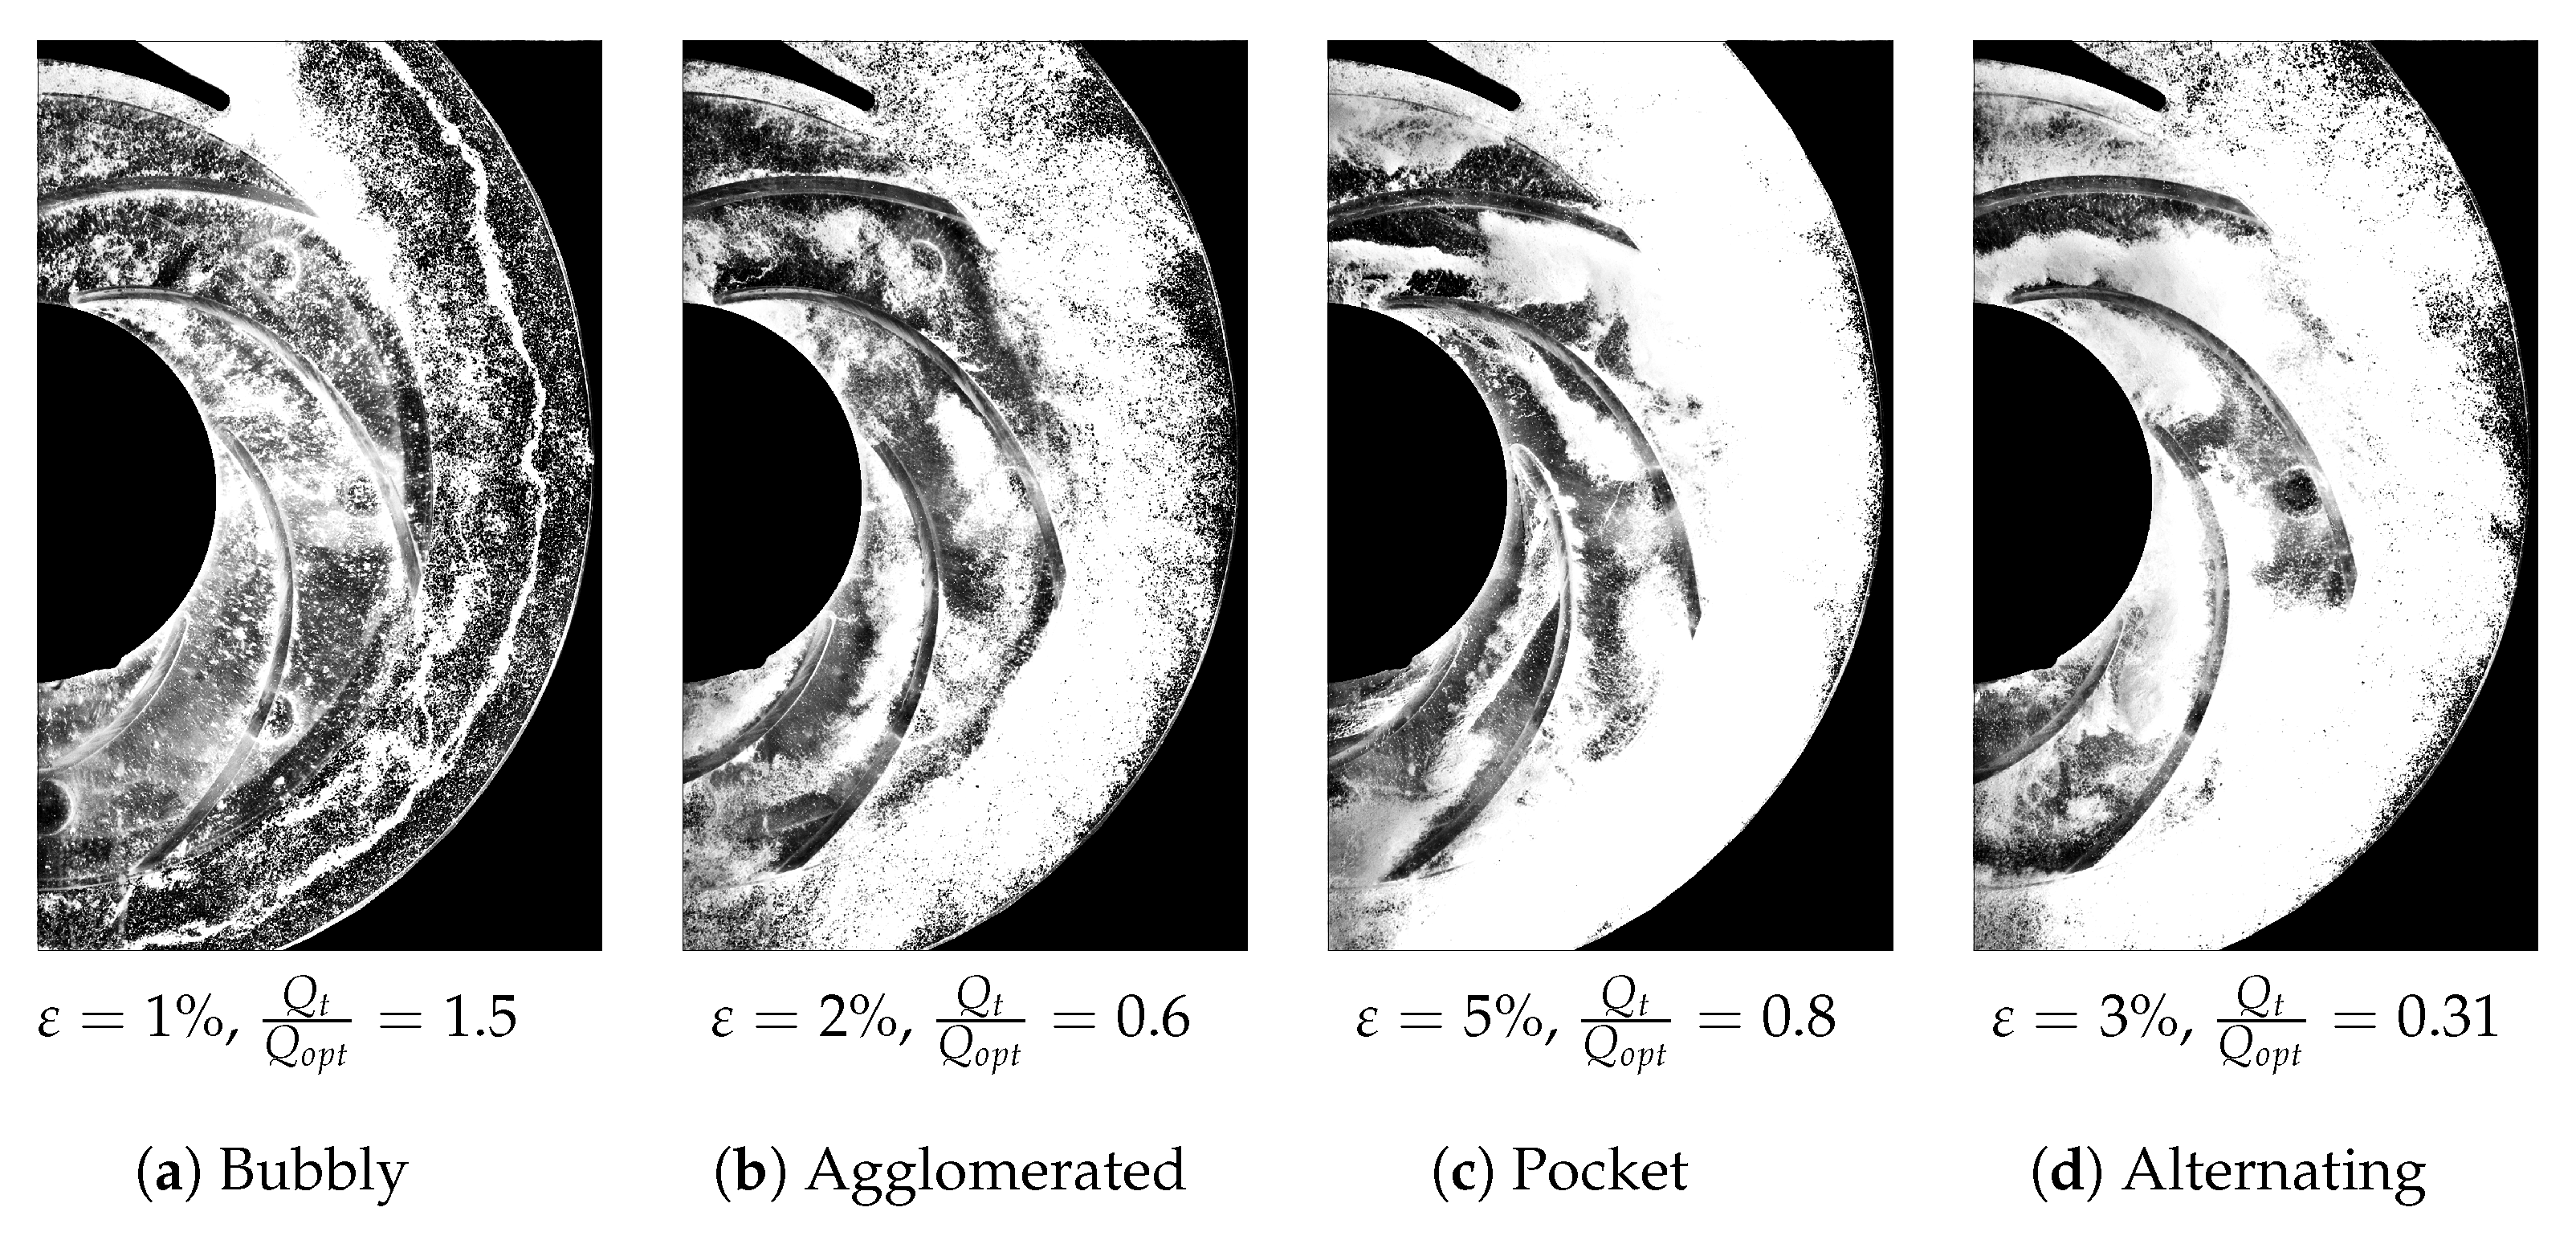
5.11. Visualization of Flow Regimes

The two-phase flow details were visualized via the thoroughly transparent pump casing and photographed using a high-speed camera (Imager pro-HS 4M CCD) with a resolution of 2016 × 2016 pixels and LED lighting to illuminate the flow (see, again, Figure 6b). Additionally, for maximum optical accessibility from the front side of the pump, all impellers were designed with six non-twisted blades. Further, for the accurate identification of the different flow regimes, 220 images were recorded using a high-speed time-resolved recording with a 1 kHz acquisition rate for each data point. All details can be seen by playing these time-resolved images in slow motion. For some data points near flow regime transitions, a cyclic recording was also needed to confirm the decision regarding the flow regime, where the images have been acquired with the same frequency of the impeller revolution, always keeping the impeller blades in place (frozen impeller), which helps to only show the oscillations and changes of the two-phase flow patterns.
Considering all the pump configurations, the flow regimes were categorized into five different categories following the literature. The various regimes observed are bubbly flow, agglomerated bubbles, pocket flow, alternating pocket, and segregated flow. Note that some flow regimes were not observed for specific pump configurations. Figure 31, Figure 32, Figure 33, Figure 34, Figure 35 and Figure 36 show sample instantaneous images for each observed flow regime separately for the different pump configurations considered. The important characteristics of each flow regime are explained below:
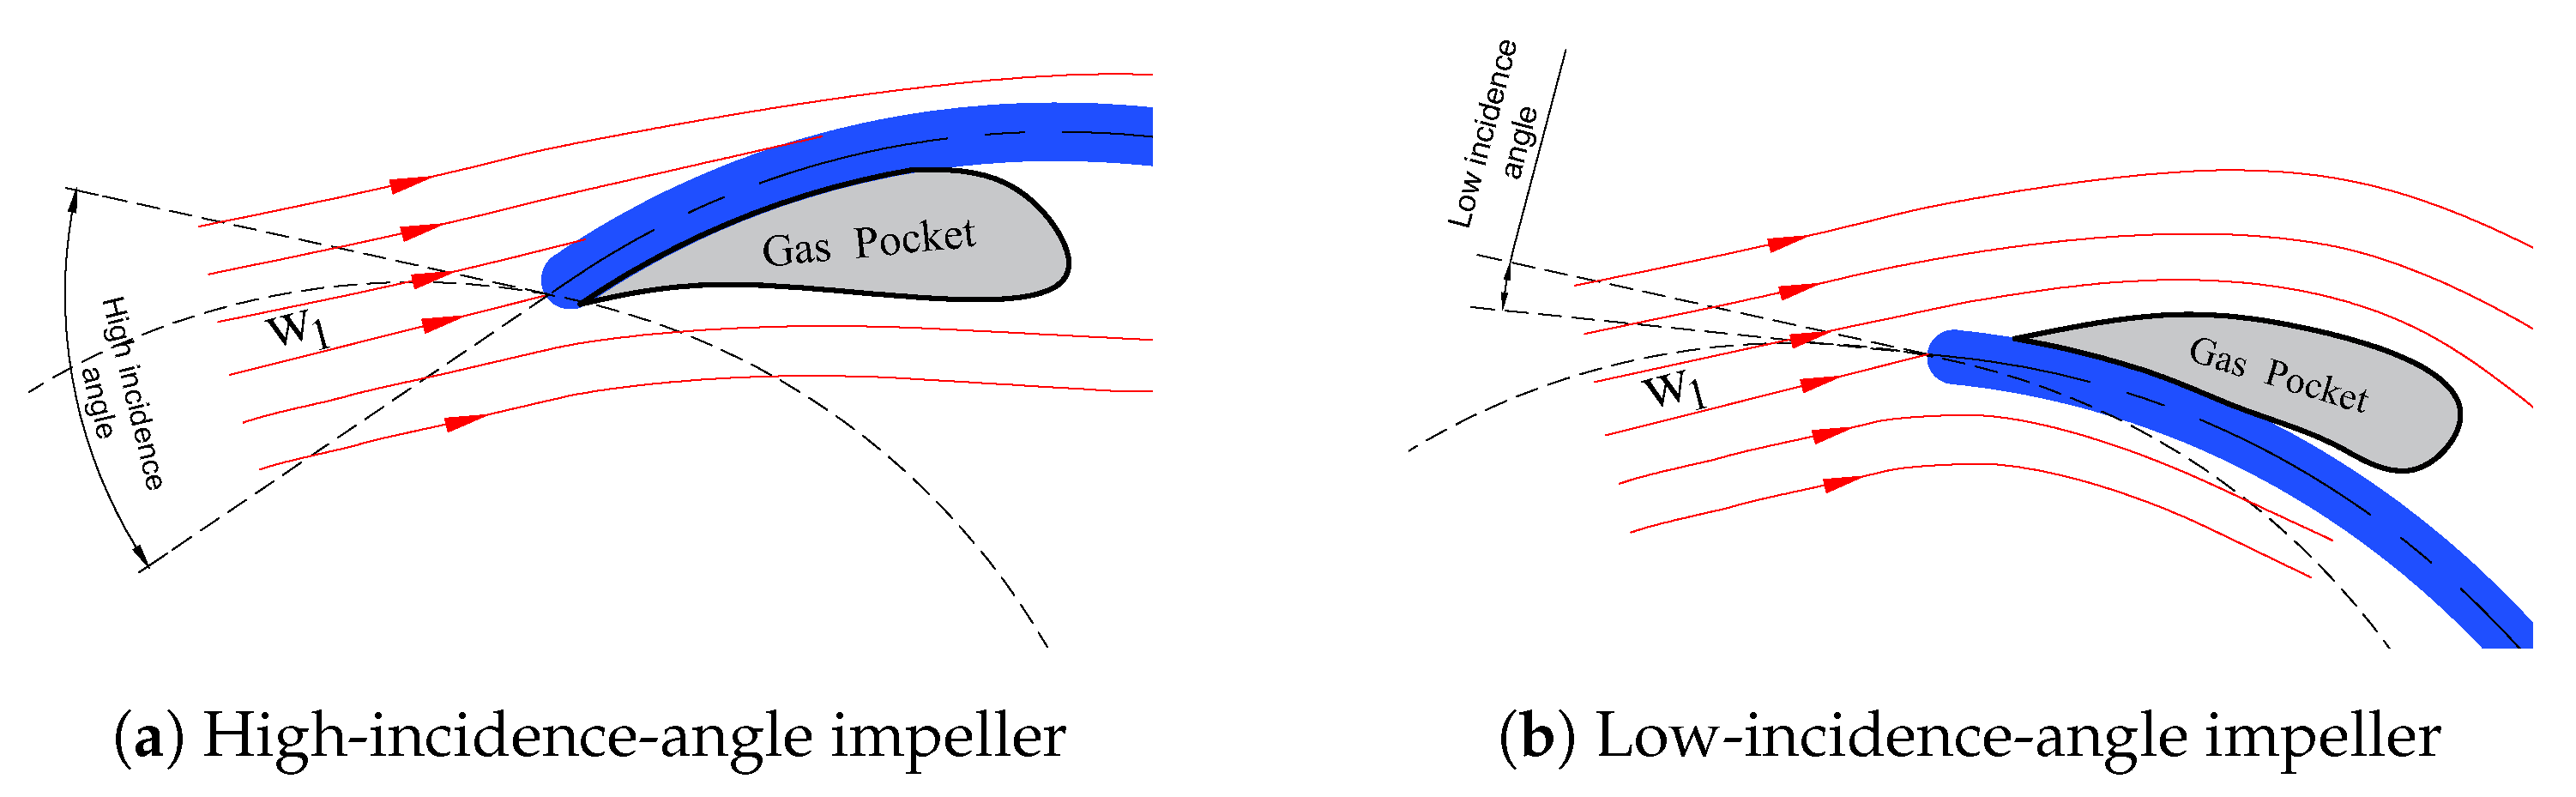
  • Bubbly regime—Gas bubbles are distributed nearly all over the impeller without considerable agglomerations between them. In the majority of cases, more bubbles appear closer to the suction side of the blades (see, for example, Figure 33a).
  • Agglomerated bubbles regime—Interactions and agglomerations take place between the bubbles. Accordingly, bigger bubbles and gas structures are observed. Again, the gas can be denser near the suction side (Figure 31b, Figure 32b, Figure 33b, Figure 34b, Figure 35b and Figure 36b).
  • Pocket regime—Large air pockets steadily stand on the suction side of all impeller blades. These pockets are characterized by only a slight variation in size.
  • Alternating pocket regime—Large air pockets stand close to the blade inlet and mostly on the suction surface with unstable characteristics (appearing, disappearing, and large fluctuations in size).
  • Segregated regime—The air pockets spread over the whole length of the blades until the impeller outlet. This was only found in the closed impeller and it did not take place in the semi-open impeller cases. Sometimes, an asymmetric air ring forms in front of the (closed) impeller, as shown in Figure 31e. A. Poullikkas [11] observed a similar asymmetric gas ring.
Figure 31, Figure 32, Figure 33, Figure 34, Figure 35 and Figure 36 compare sample images for all the possible flow regimes in each pump configuration. The sample images are shown at comparable flow conditions whenever possible. Generally, the interaction between the liquid and gas phases, as well as the appearance of accumulated gas, vary for different pump configurations. The increased resistance to gas accumulation of the semi-open impeller can be noted when comparing the images. For instance, the bubbly flow regime of most semi-open impeller cases (Figure 32a, Figure 33a, Figure 34a, Figure 35a and Figure 36a) are more homogeneous, and the bubbles are almost spread all over in the pump. This effect is more apparent when increasing the gap (Figure 33a), installing the inducer (Figure 34a), and increasing the rotational speed (Figure 36a). Similar observations are visible for the agglomerated bubbles and the pocket flow regimes. Furthermore, the gas pockets at increased rotational speed (Figure 36c) are slightly smaller compared to the bubbles in the same impeller at lower rpm (Figure 35c) under identical flow conditions. This confirms the enhanced phase mixing associated with higher rotational speeds.

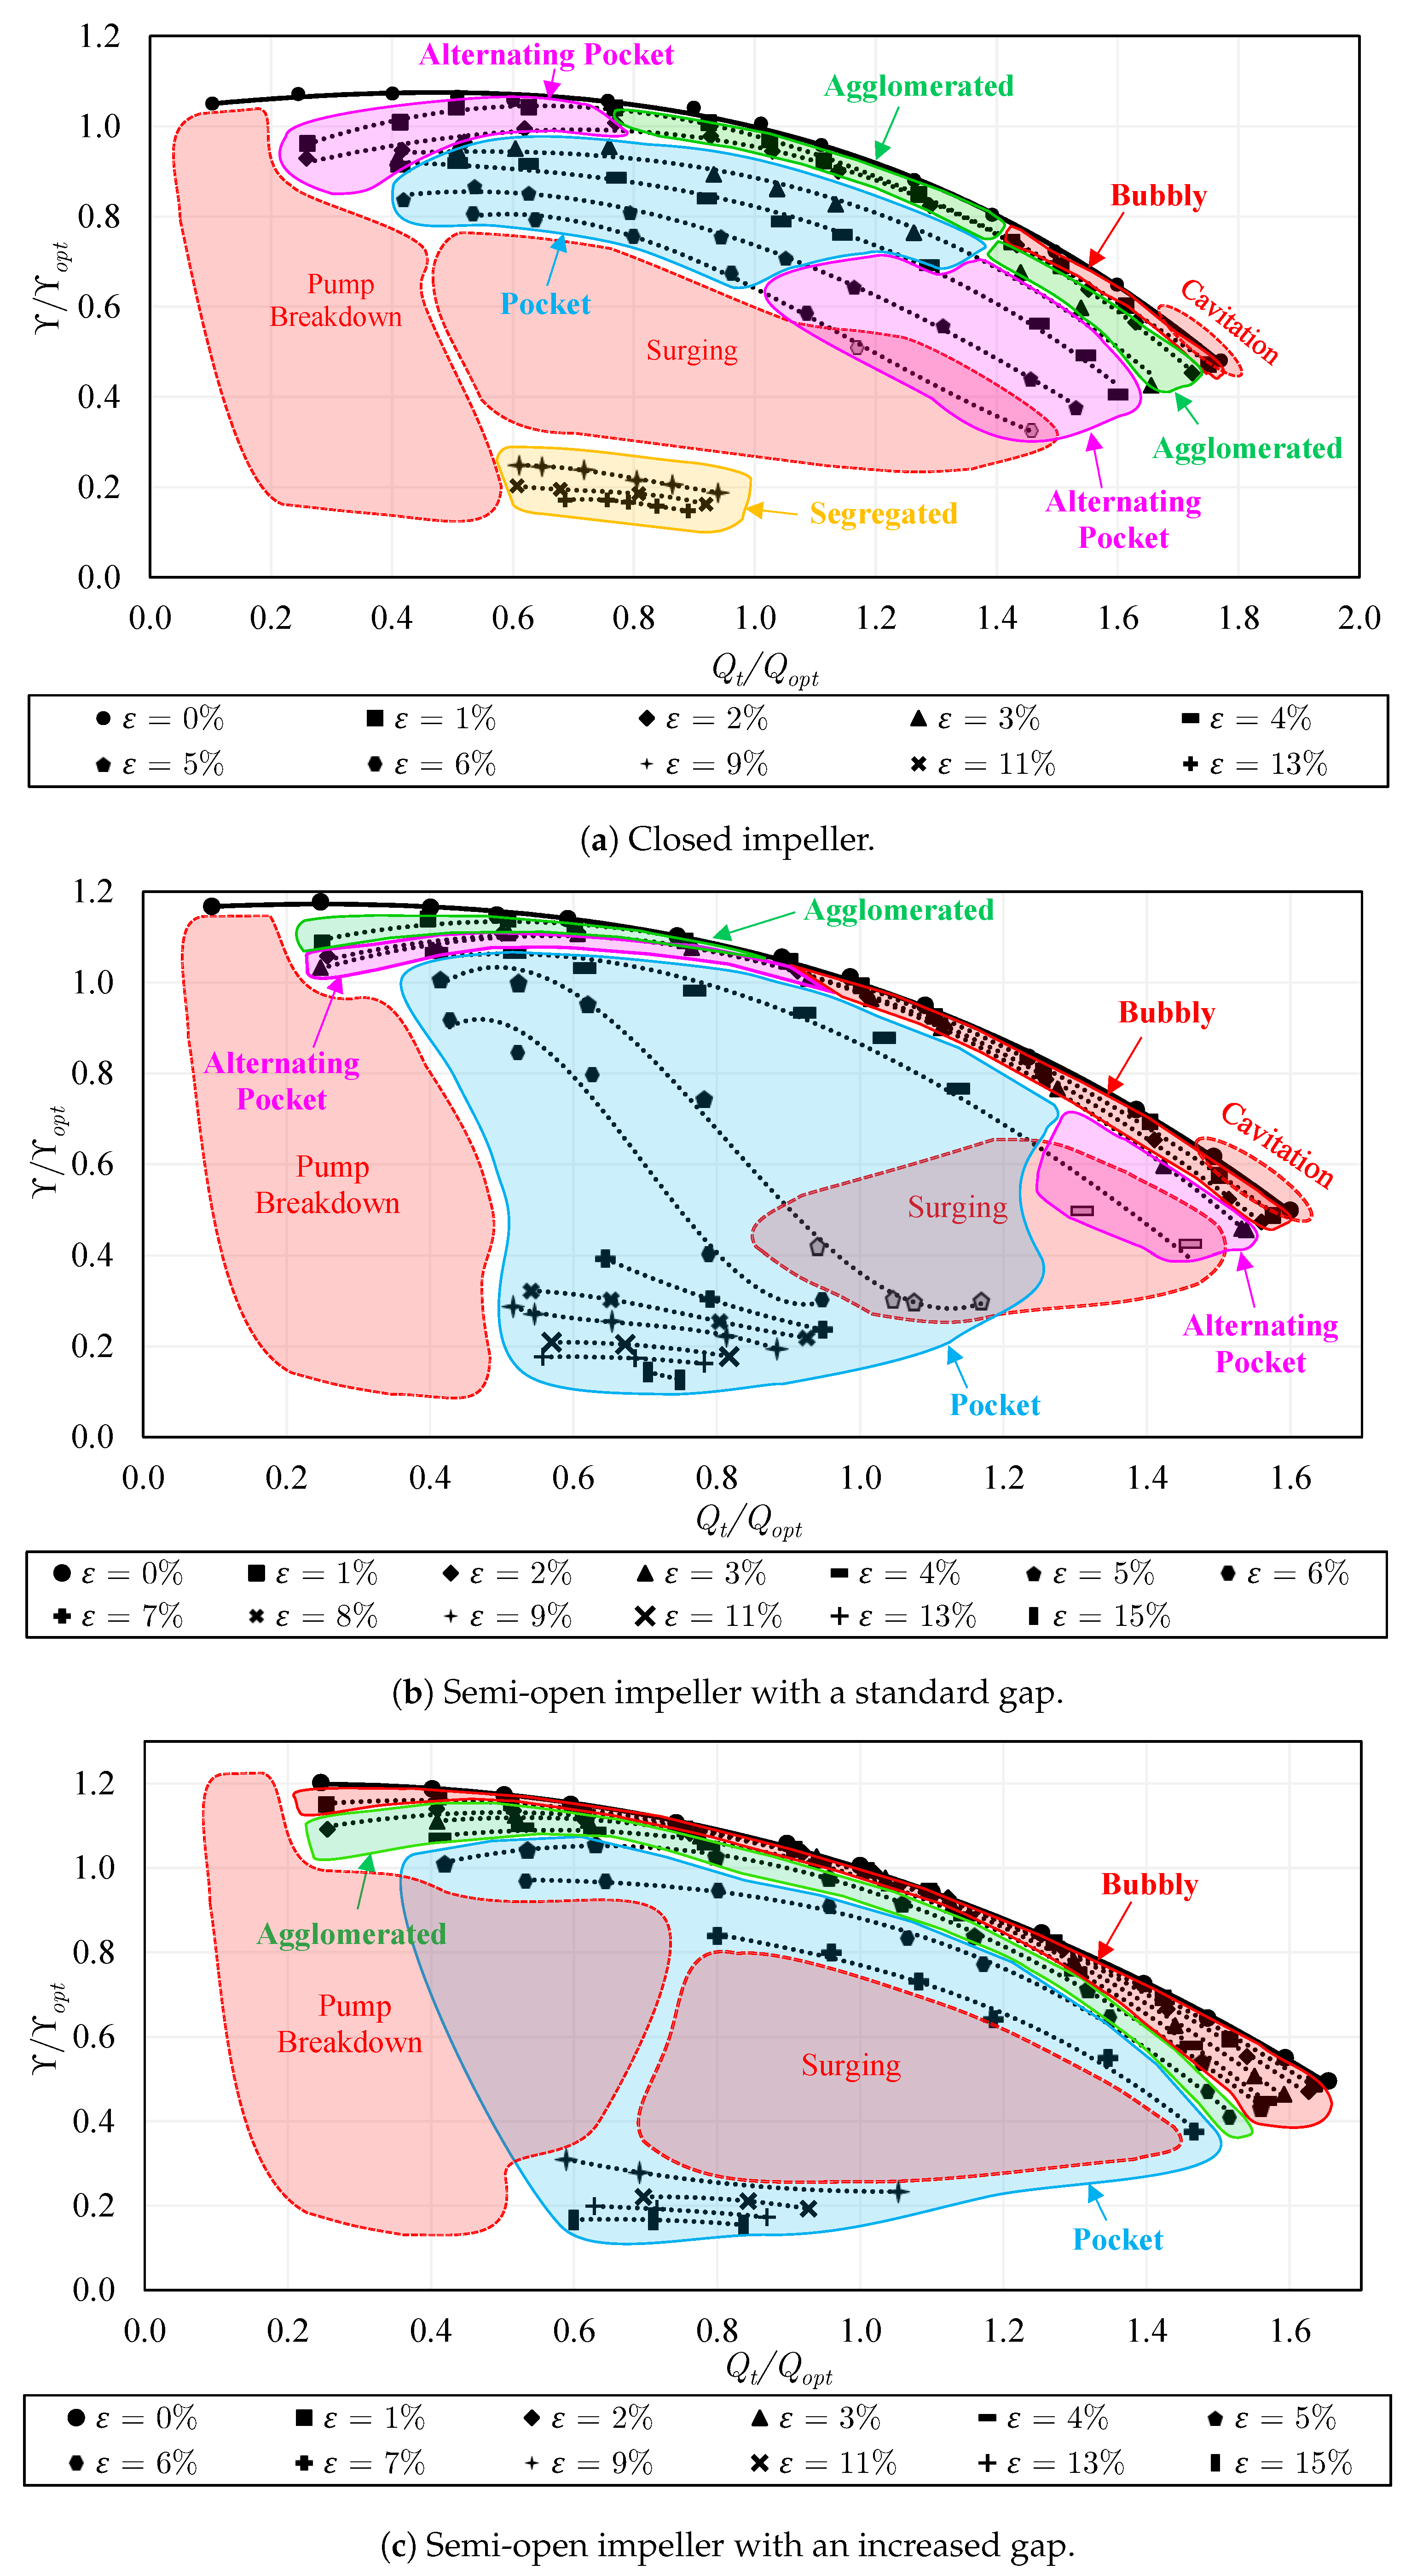
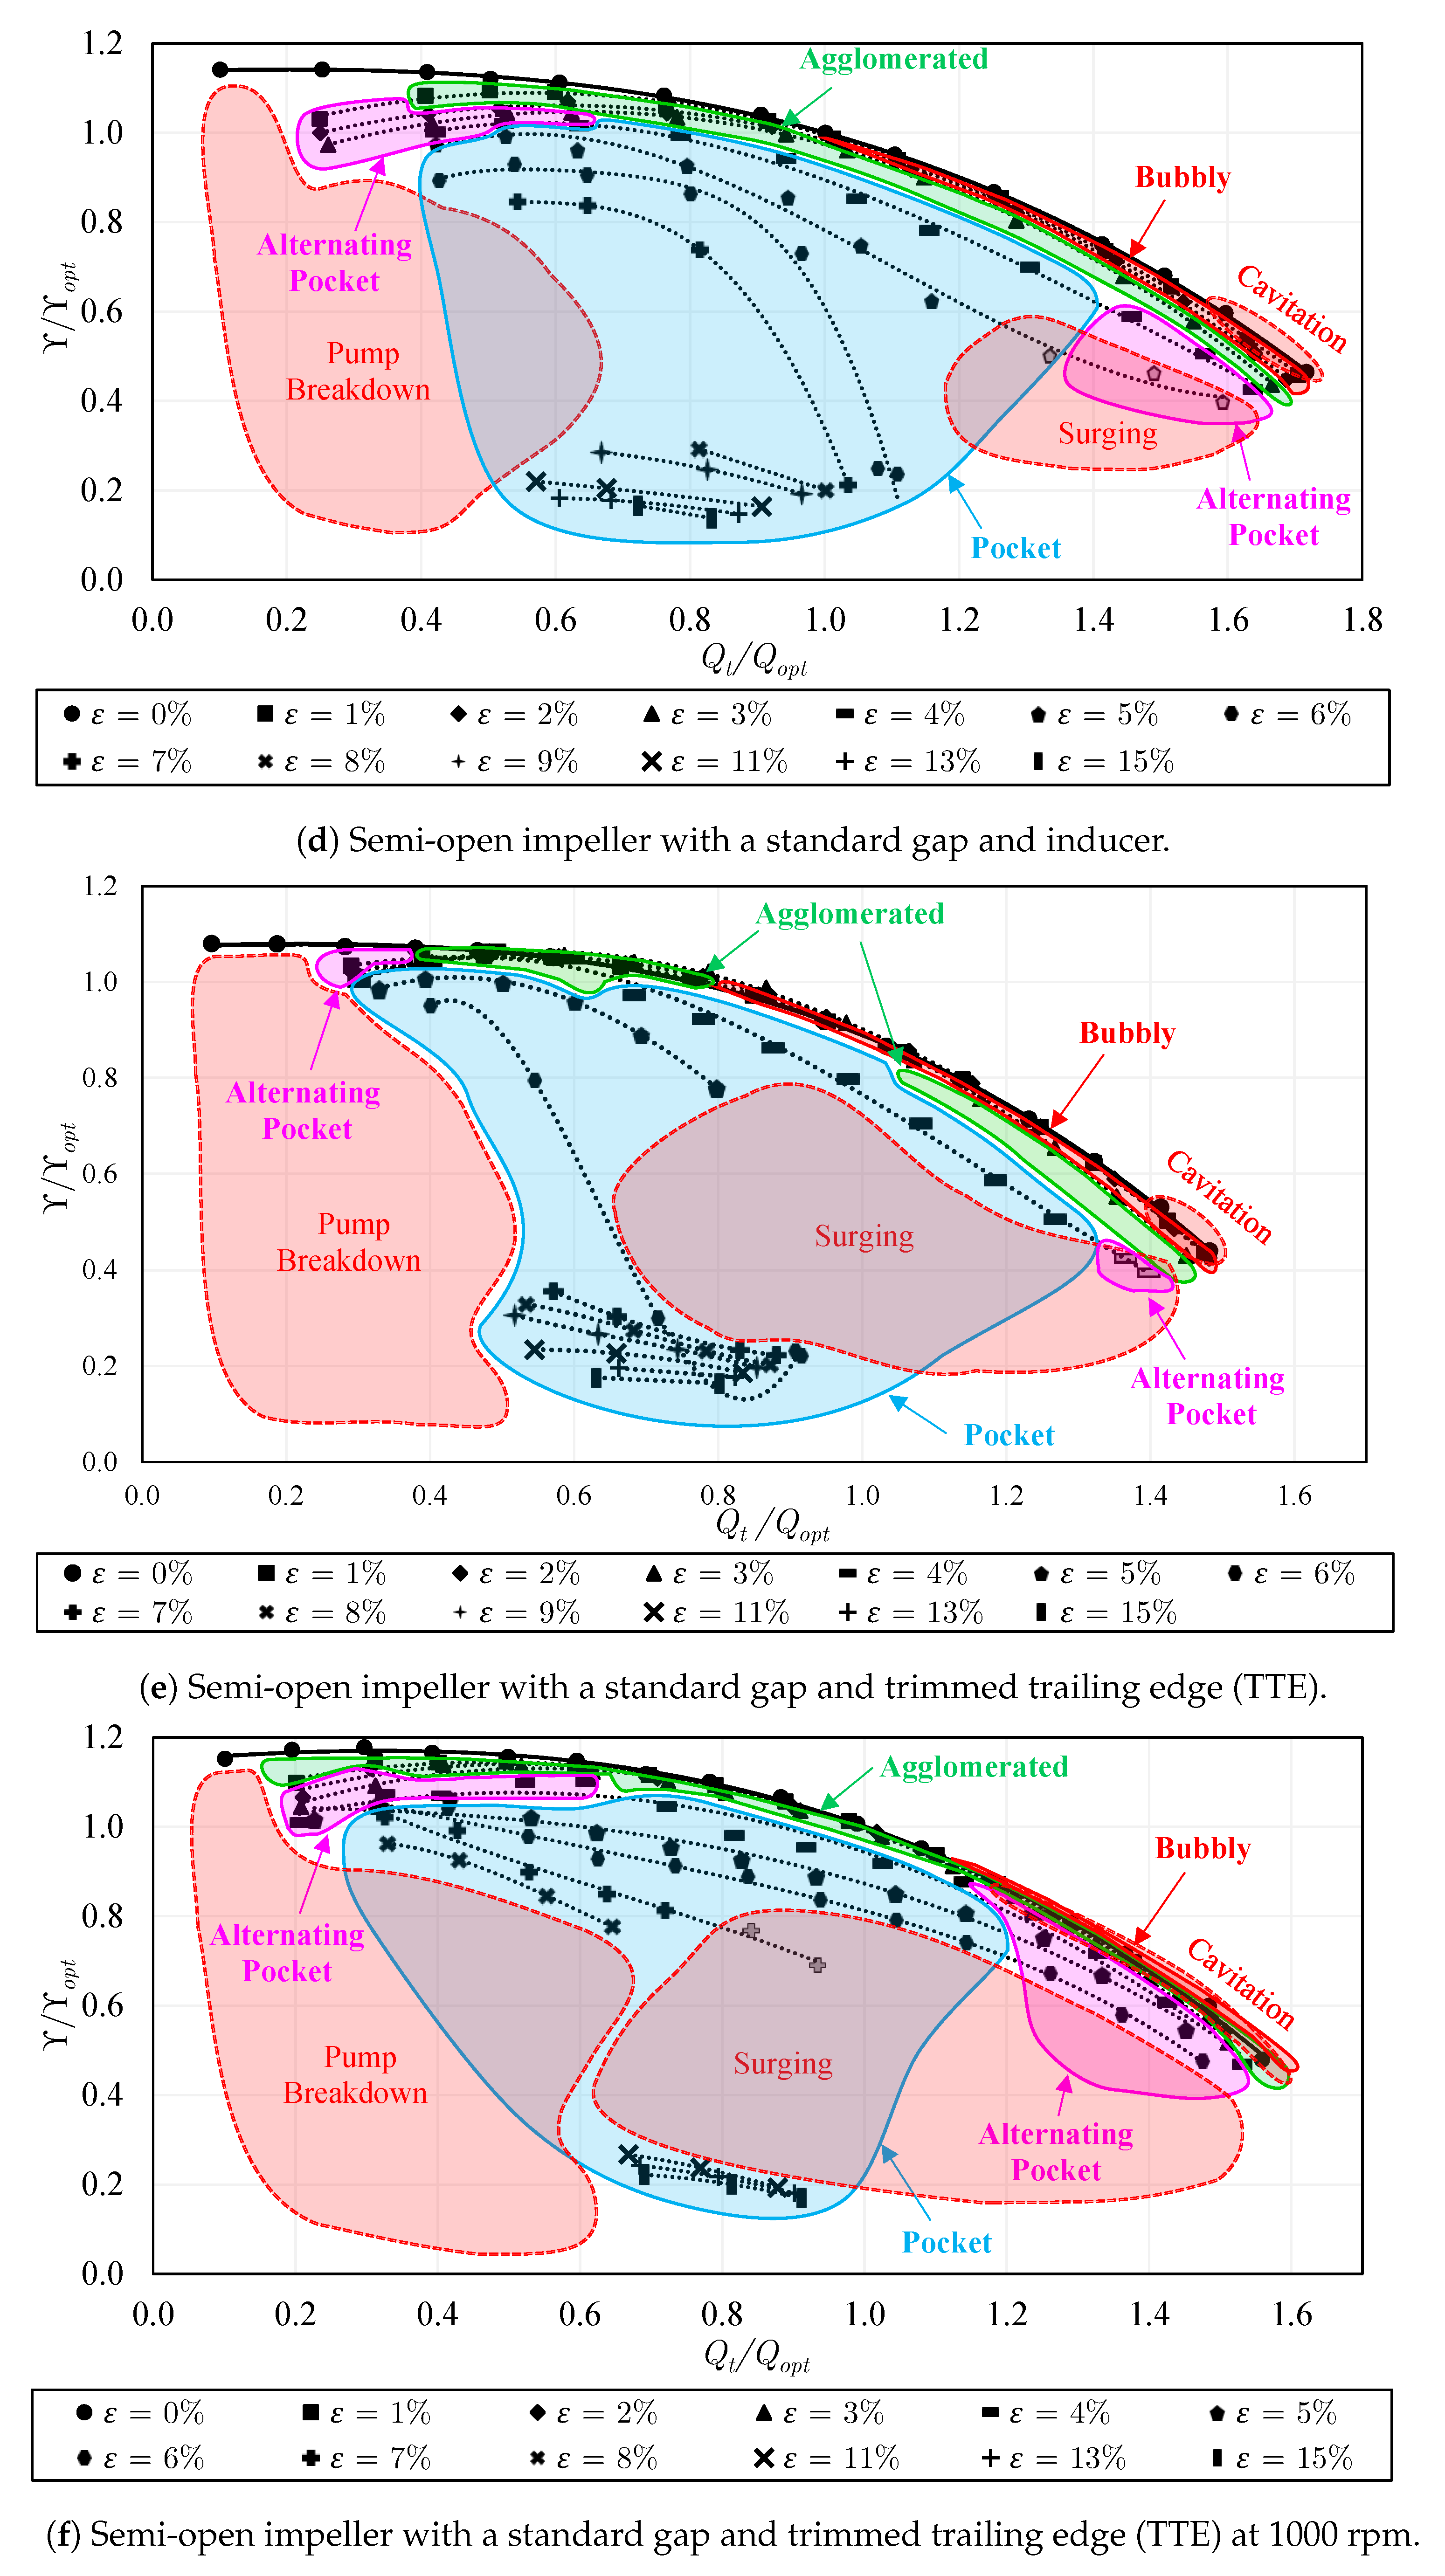
5.12. Flow Regime Maps

Figure 37 shows detailed flow regime maps on the performance curves of each considered pump configuration. The zones of pump breakdown, surging, and cavitation are also indicated. In this way, the behavior of the pump and the discontinuities of the performance can be better illustrated. The shown maps share several similarities. For instance, the bubbly flow regime appears, in most cases, principally at overload conditions and low gas contents ( ε < 2 % ). However, the region of the bubbly flow regime is very limited in the closed impeller (Figure 37a) due to the lower shear rates and the absence of the leakage flow (no tip clearance gap).
The alternating pocket flow regimes appear, in most cases, at part-load and overload conditions. Nevertheless, due to the decreased resistance to gas accumulation, it is apparently bigger for the closed impeller. This confirms the higher flow instabilities in the closed impeller, as presented and discussed before.
When comparing the map of the closed impeller (Figure 37a) with the semi-open impeller with a standard gap (Figure 37b), it can be noted that the agglomerated bubbles regime takes place within wider flow conditions in the closed impeller. Similarly, the pocket flow regime appears earlier in the closed impeller, starting from ε 3 % with no remarkable discontinuities in the performance curves. This is not the case for the semi-open impeller with a standard gap, where the pocket flow regime starts later at ε 4 % , leading to a sharp and significant drop in performance. Additionally, for ε = 4 to 7 % , the semi-open impeller with standard gap experiences quite a lot of significant reductions in performance in the pocket flow regime. As shown, the segregated flow regime appears only in the closed impeller (Figure 37a) for ε 9 % , where the gas pockets become very long, covering the entire blade length until the outer diameter of the closed impeller (Figure 31e). This two-phase flow pattern was not observed in all the other pump configurations when using semi-open impellers, due to the strong bubble break-up in such cases.
As shown in Figure 37c, the use of a semi-open impeller with an increased gap results in considerable variations in the flow regime map. Unlike the standard gap case, a larger bubbly flow regime and agglomerated bubbles flow regime are observed along the whole flow rate range due to the increased secondary flow which hinders gas accumulation. Thereafter, the pocket flow regime does not appear until a gas volume fraction of ε = 6 % is reached. Further, the alternating pocket flow regime was not observed for the semi-open impeller with the increased gap due to improved phase mixing in this case. Surging occurs only for gas volume fractions between ε = 7 % and ε = 9 % . Still, the pump breakdown region becomes bigger for the increased gap (Figure 37c) compared to that of the standard gap case (Figure 37b).
To clarify the effect of installing the inducer, Figure 37d and Figure 37b are compared. As shown, the installation of the inducer does not lead to important differences in the location or the size of the flow regimes and the other phenomena of the semi-open impeller with the standard gap. A single exception is that the agglomerated flow regime spreads now along the whole flow range until overload conditions after installing the inducer. This happens because of the slightly reduced performance at overload conditions when the inducer is installed. Similarly, the flow regime maps of the semi-open impeller with a standard gap with either a round trailing edge (Figure 37b) or a trimmed trailing edge (Figure 37e) are very comparable. However, the alternating pocket flow regime appears within more restricted flow conditions for the trimmed trailing edge impeller. Further, at overload conditions, a small portion of the bubbly flow regime is transformed to the agglomerated bubbles flow regime for the trimmed trailing edge, due to the lower performance. Finally, by increasing the rotational speed to 1000 rpm (Figure 37f), the alternating pocket flow regimes increase in size again when compared to the same impeller with lower rpm (Figure 37e) due to the increased turbulence and instabilities. Otherwise, only minor differences can be seen between the two maps.

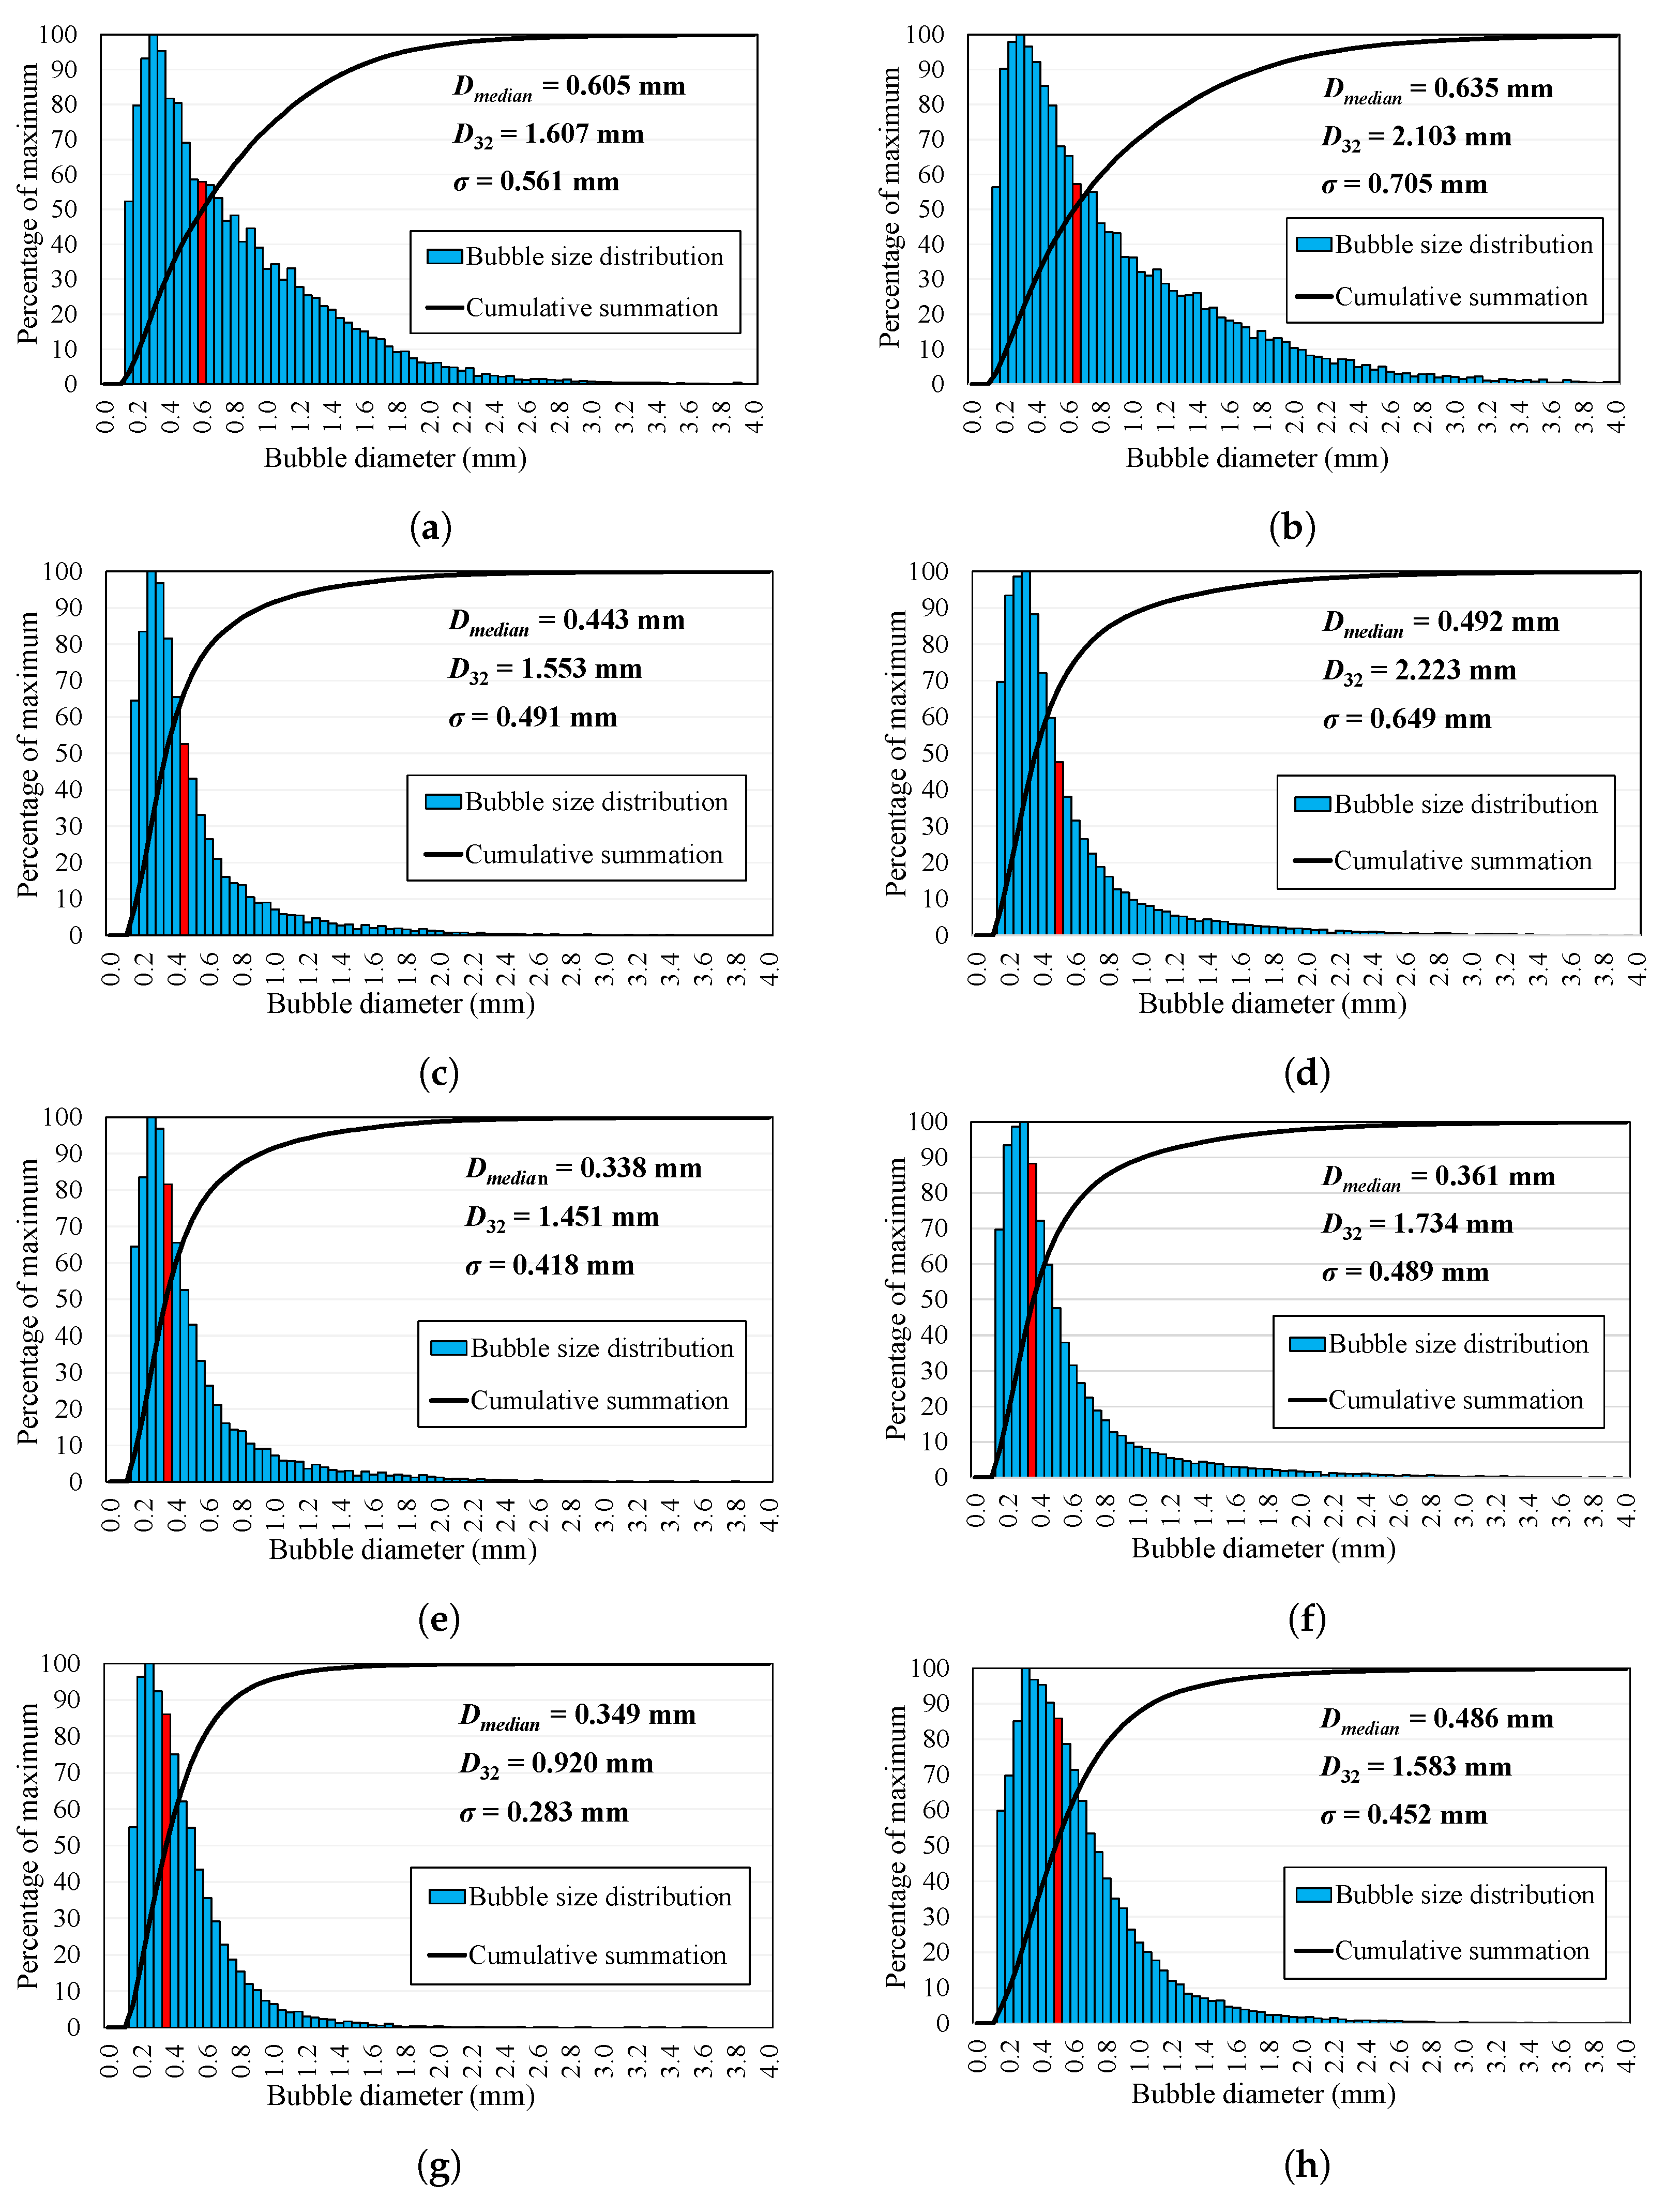
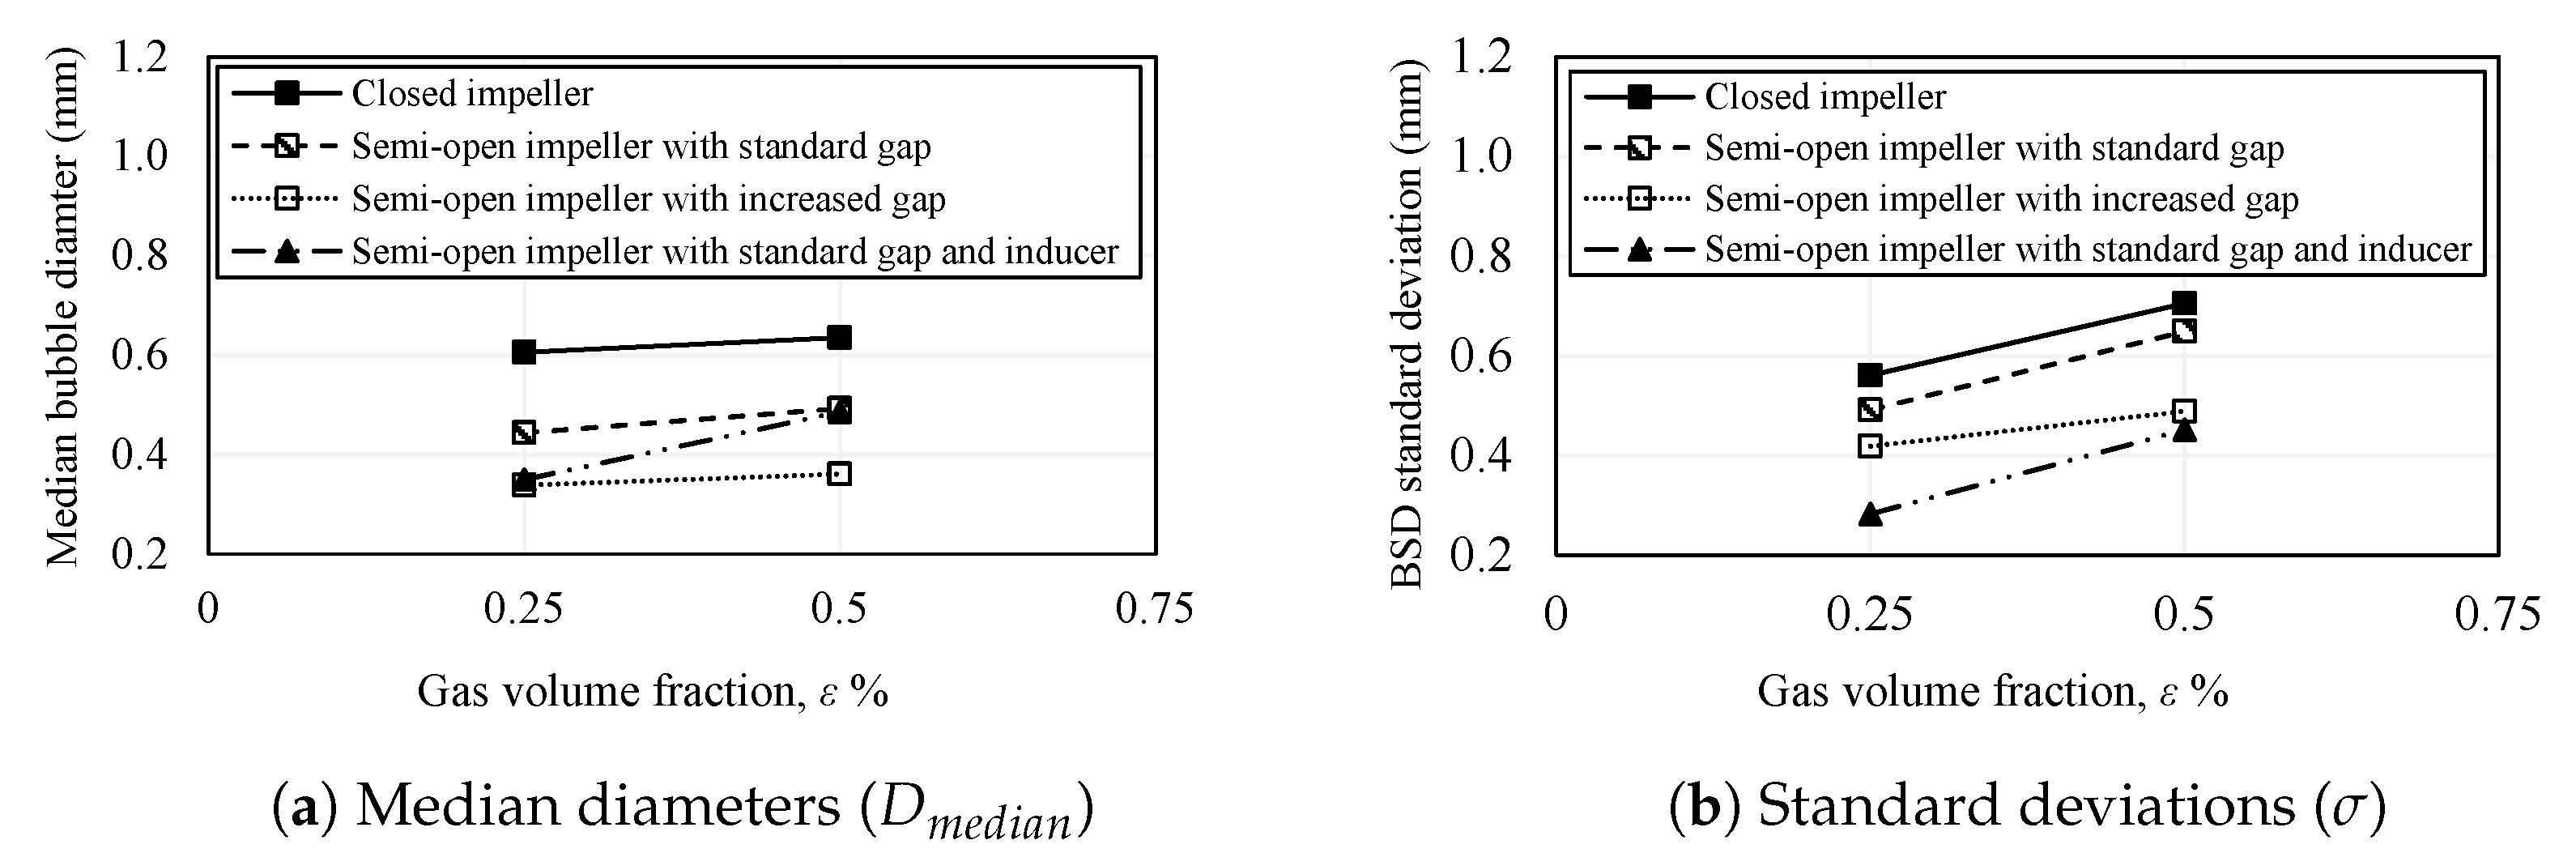
5.13. Bubble Size Distribution

This section compares the bubble size distributions (BSD) for four of the pump configurations that were taken into consideration (configurations 1 through 4, i.e., closed impeller, semi-open impeller with the standard gap, semi-open impeller with the increased gap, and semi-open impeller with standard gap and inducer). Two values of gas volume fraction ( ε = 0.25 % and 0.5 % ) at overload conditions ( Q w = 105   m 3 / h ) were taken into consideration for the comparison of the bubble size distributions between the four pump configurations. The acquired bubble size distributions are all displayed in Figure 38. As shown, increasing the gas volume fraction from ε = 0.25 % to ε = 0.5 % results in an increase in the median diameter ( D m e d i a n ), the Sauter mean diameter ( D 32 ), and the BSD standard deviation ( σ ) for all configurations. Additionally, the BSD of the closed impeller is generally wider with higher median diameters compared to the other three cases of the semi-open impeller. Figure 39 displays precise comparisons between the four configurations. Once more, the bubble sizes found in the semi-open impeller are typically smaller than those in the impeller that is closed. This happens because the blades of the semi-open impeller are subjected to greater shear rates. The increase of the tip clearance gap produces slightly smaller median diameters and more uniform distributions (lower standard deviations), as seen in Figure 39b. When the upstream inducer is employed, a comparable effect takes place. Overall, the semi-open impeller with an inducer has the narrowest BSD compared to the other configurations, with very small standard deviations. In this configuration, the phase mixing is enhanced and the uniformity of the BSD is increased through the additional rotary action offered by the inducer before the main impeller. The influence of changing the rotational speed from 600 rpm to 900 rpm on the bubble size was considered in reference [51], using an inlet gas volume faction of 1.1–1.3%. It was shown that the average bubble size is approximately 0.5 mm for 600 rpm, while the average bubble size typically decreases to approximately 0.4 mm for 900 rpm. Additionally, the distribution of bubbles within the impeller channels becomes more homogeneous for the higher rpm.

6. Conclusions

In this paper, experimental investigations of two-phase gas–liquid pumping in a radial centrifugal pump were reviewed and discussed, considering various single-phase and two-phase conditions. Comparisons were carried out for various pump configurations, i.e., closed versus semi-open impellers, standard versus increased tip clearance gaps, operating with versus without inducer, round (profiled) versus trimmed (non-profiled) trailing edge semi-open impellers, and low (650 rpm) versus high rotational speeds (1000 rpm). The performance degradation, pump breakdown, performance hysteresis, two-phase flow regimes, flow pattern maps, flow instabilities (pump surging), and sample bubble size distributions were covered in the comparisons. All employed impellers, the pump body, and part of the suction pipe were made of transparent materials to allow flow visualization. For each pump configuration, the two-phase flow patterns were measured using a high-speed system. The main conclusions can be listed as follows:
  • The single-phase flow performance of the closed impeller is slightly higher than that of the semi-open impeller with the standard gap due to the leakage flow. A substantial reduction in the single-phase performance happens in the semi-open impeller when the gap is increased. Quantitatively, a drop of 9% to 40% in specific delivery work takes place from part-load to overload, respectively. On the other hand, the installation of the inducer does not lead to important variations in the single-phase performance. The use of the trimmed trailing edge semi-open impeller causes a drop of about 7 to 28% in the specific delivery work compared to the same impeller with a round trailing edge. The two considered rotational speeds typically show very comparable single-phase performance on normalized scales. Accordingly, for achieving the highest possible single-phase performance, the closed impeller is recommended over the semi-open impeller, the standard gap over the increased gap, and the round trailing edge over the trimmed trailing edge.
  • No significant hysteresis occurs in the closed impeller, while, in the semi-open impeller with a standard gap, strong hysteresis is visible between ε = 4 % and ε = 6 % , due to the former gas accumulations on the blades. However, increasing the tip clearance gap could beneficially prevent hysteresis among different experimental approaches. Likewise, the use of the inducer before the semi-open impeller could strongly decrease the performance hysteresis. When the first two experimental approaches are compared, performance hysteresis takes place within a wider range of gas volume fractions with the trimmed trailing edge semi-open impeller (configuration 5), i.e., ε = 3–5%, compared to ε = 4–5% in the round trailing edge semi-open impeller (configuration 2). Nevertheless, the hysteresis is lower in the trimmed trailing edge semi-open impeller compared to that of the round trailing edge semi-open impeller when the first and third approaches are compared. When the rotational speed is increased to 1000 rpm, the performance hysteresis increases remarkably and occurs within a wider range of gas volume fraction, i.e., ε = 2–6% compared to ε = 3–5% in the lower rotational speed (650 rpm) when comparing the results of the first and second approaches.
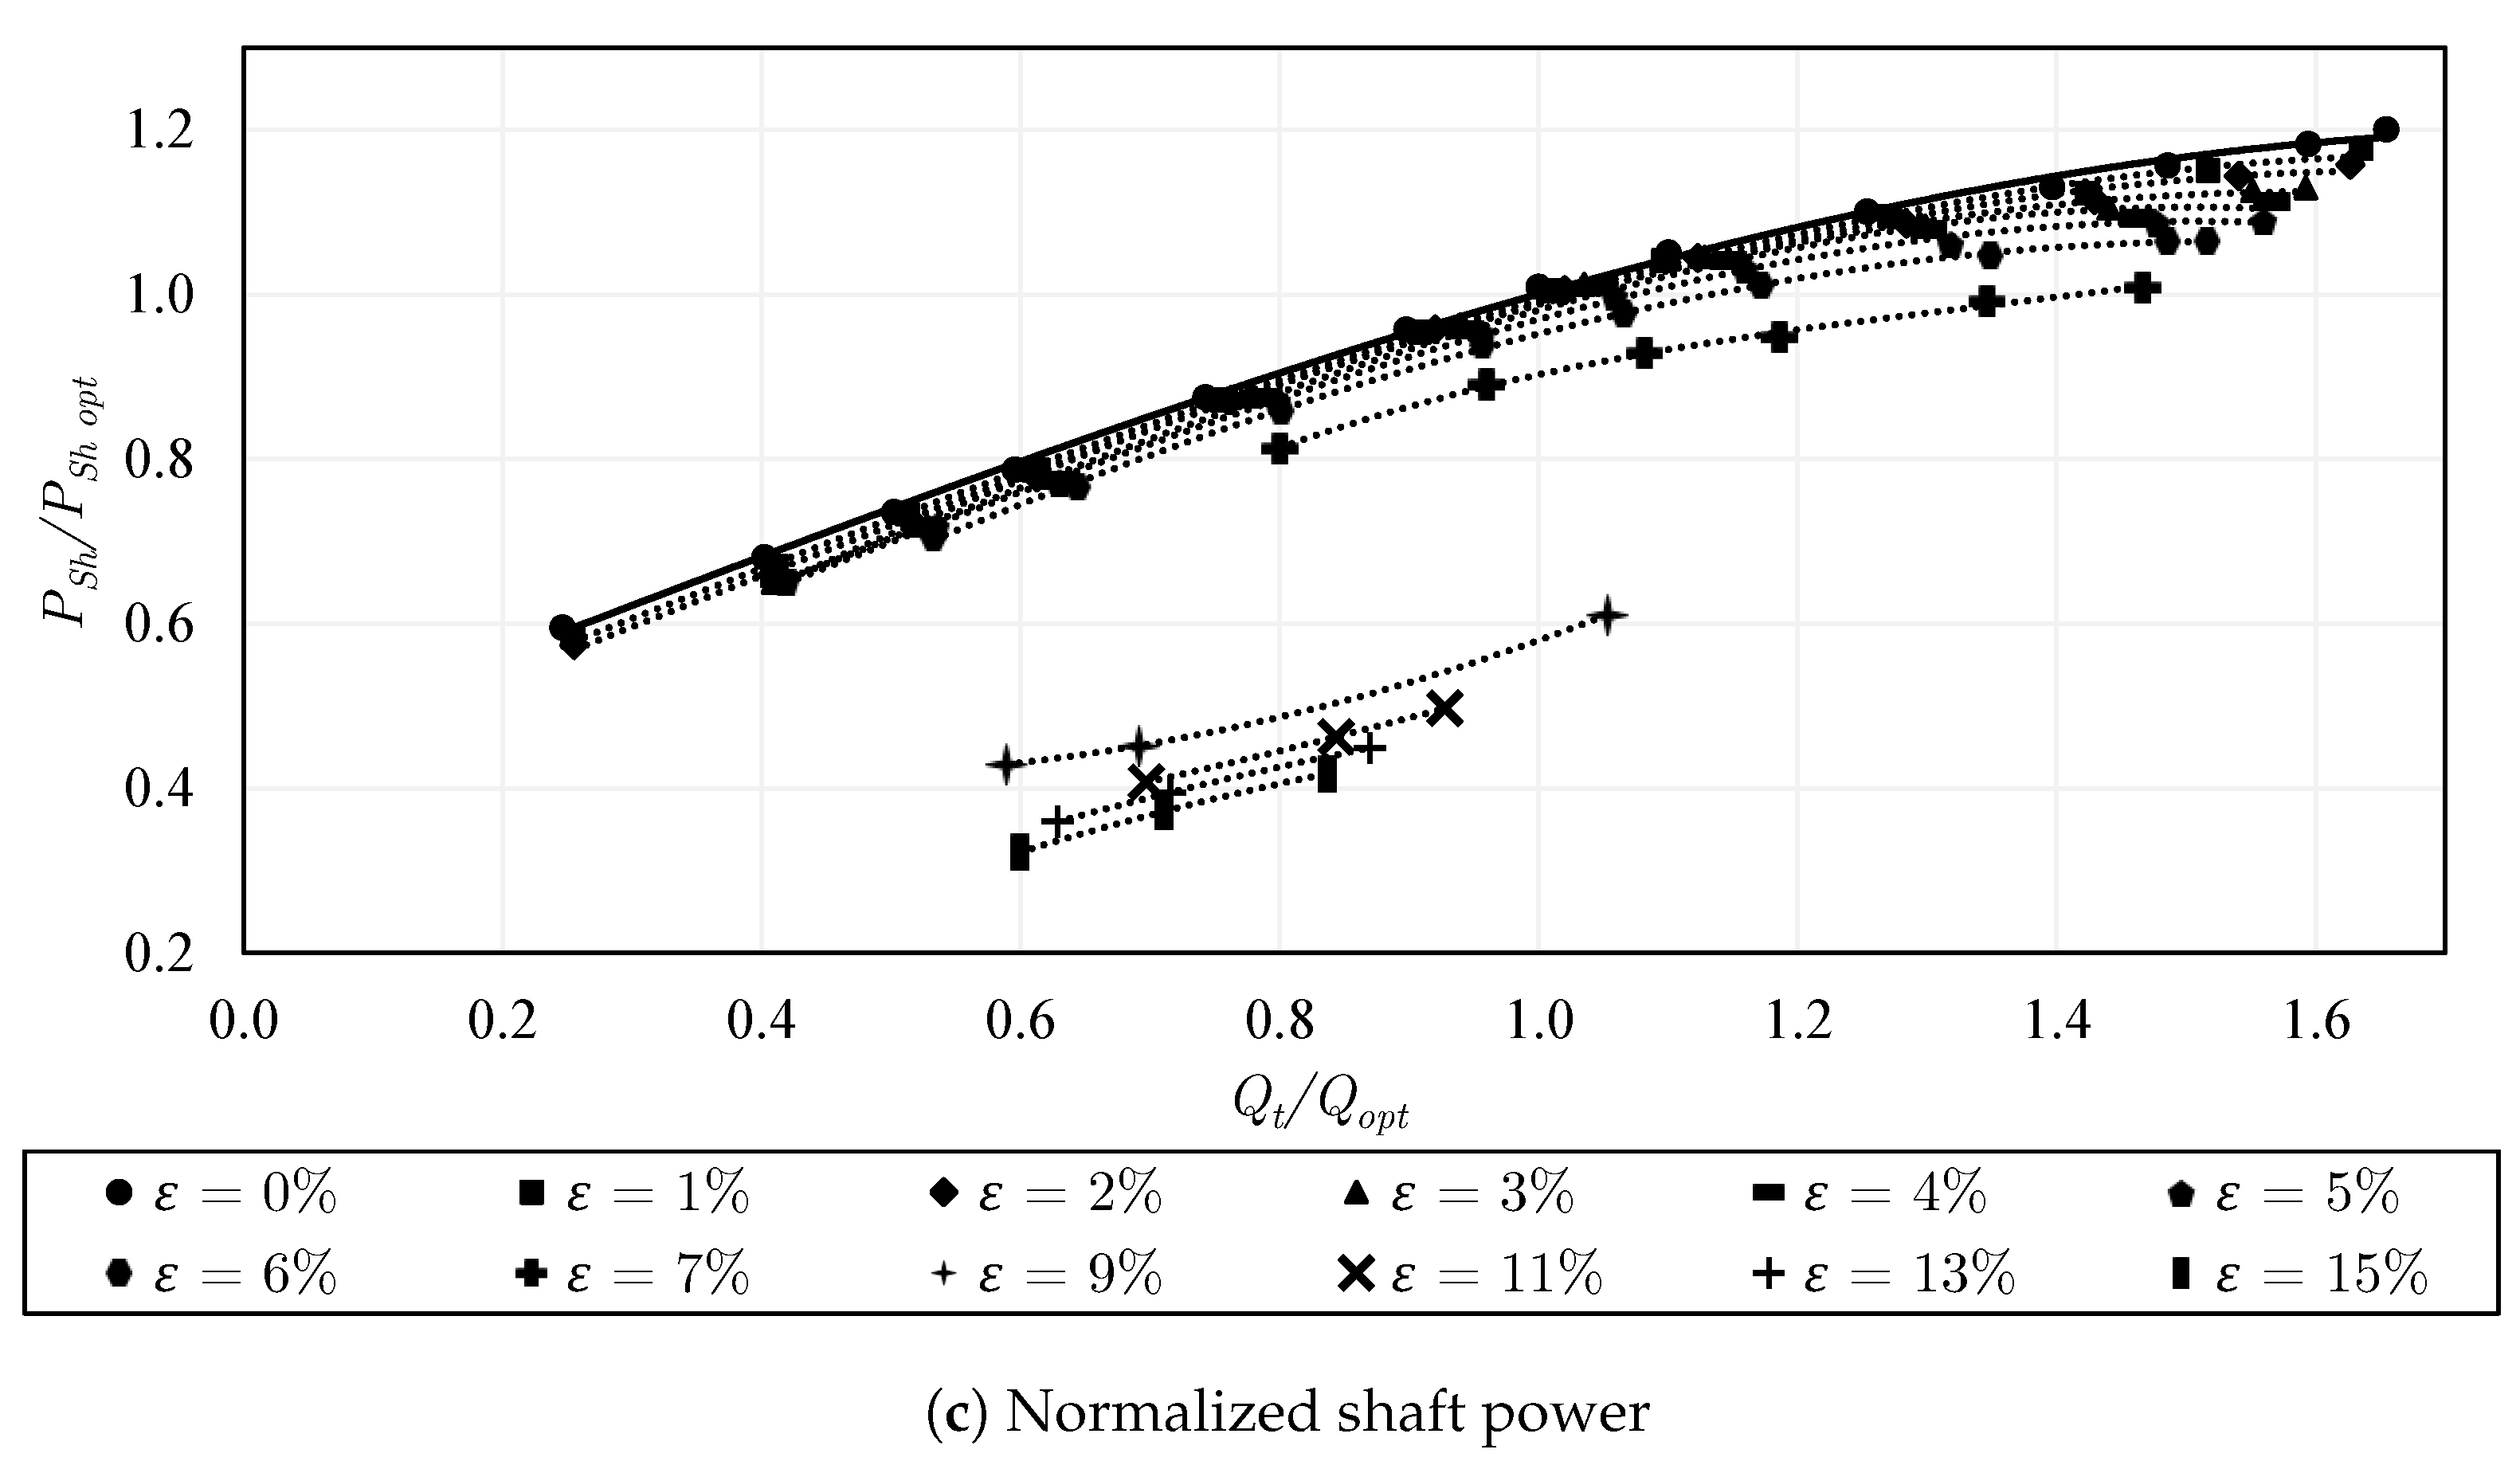
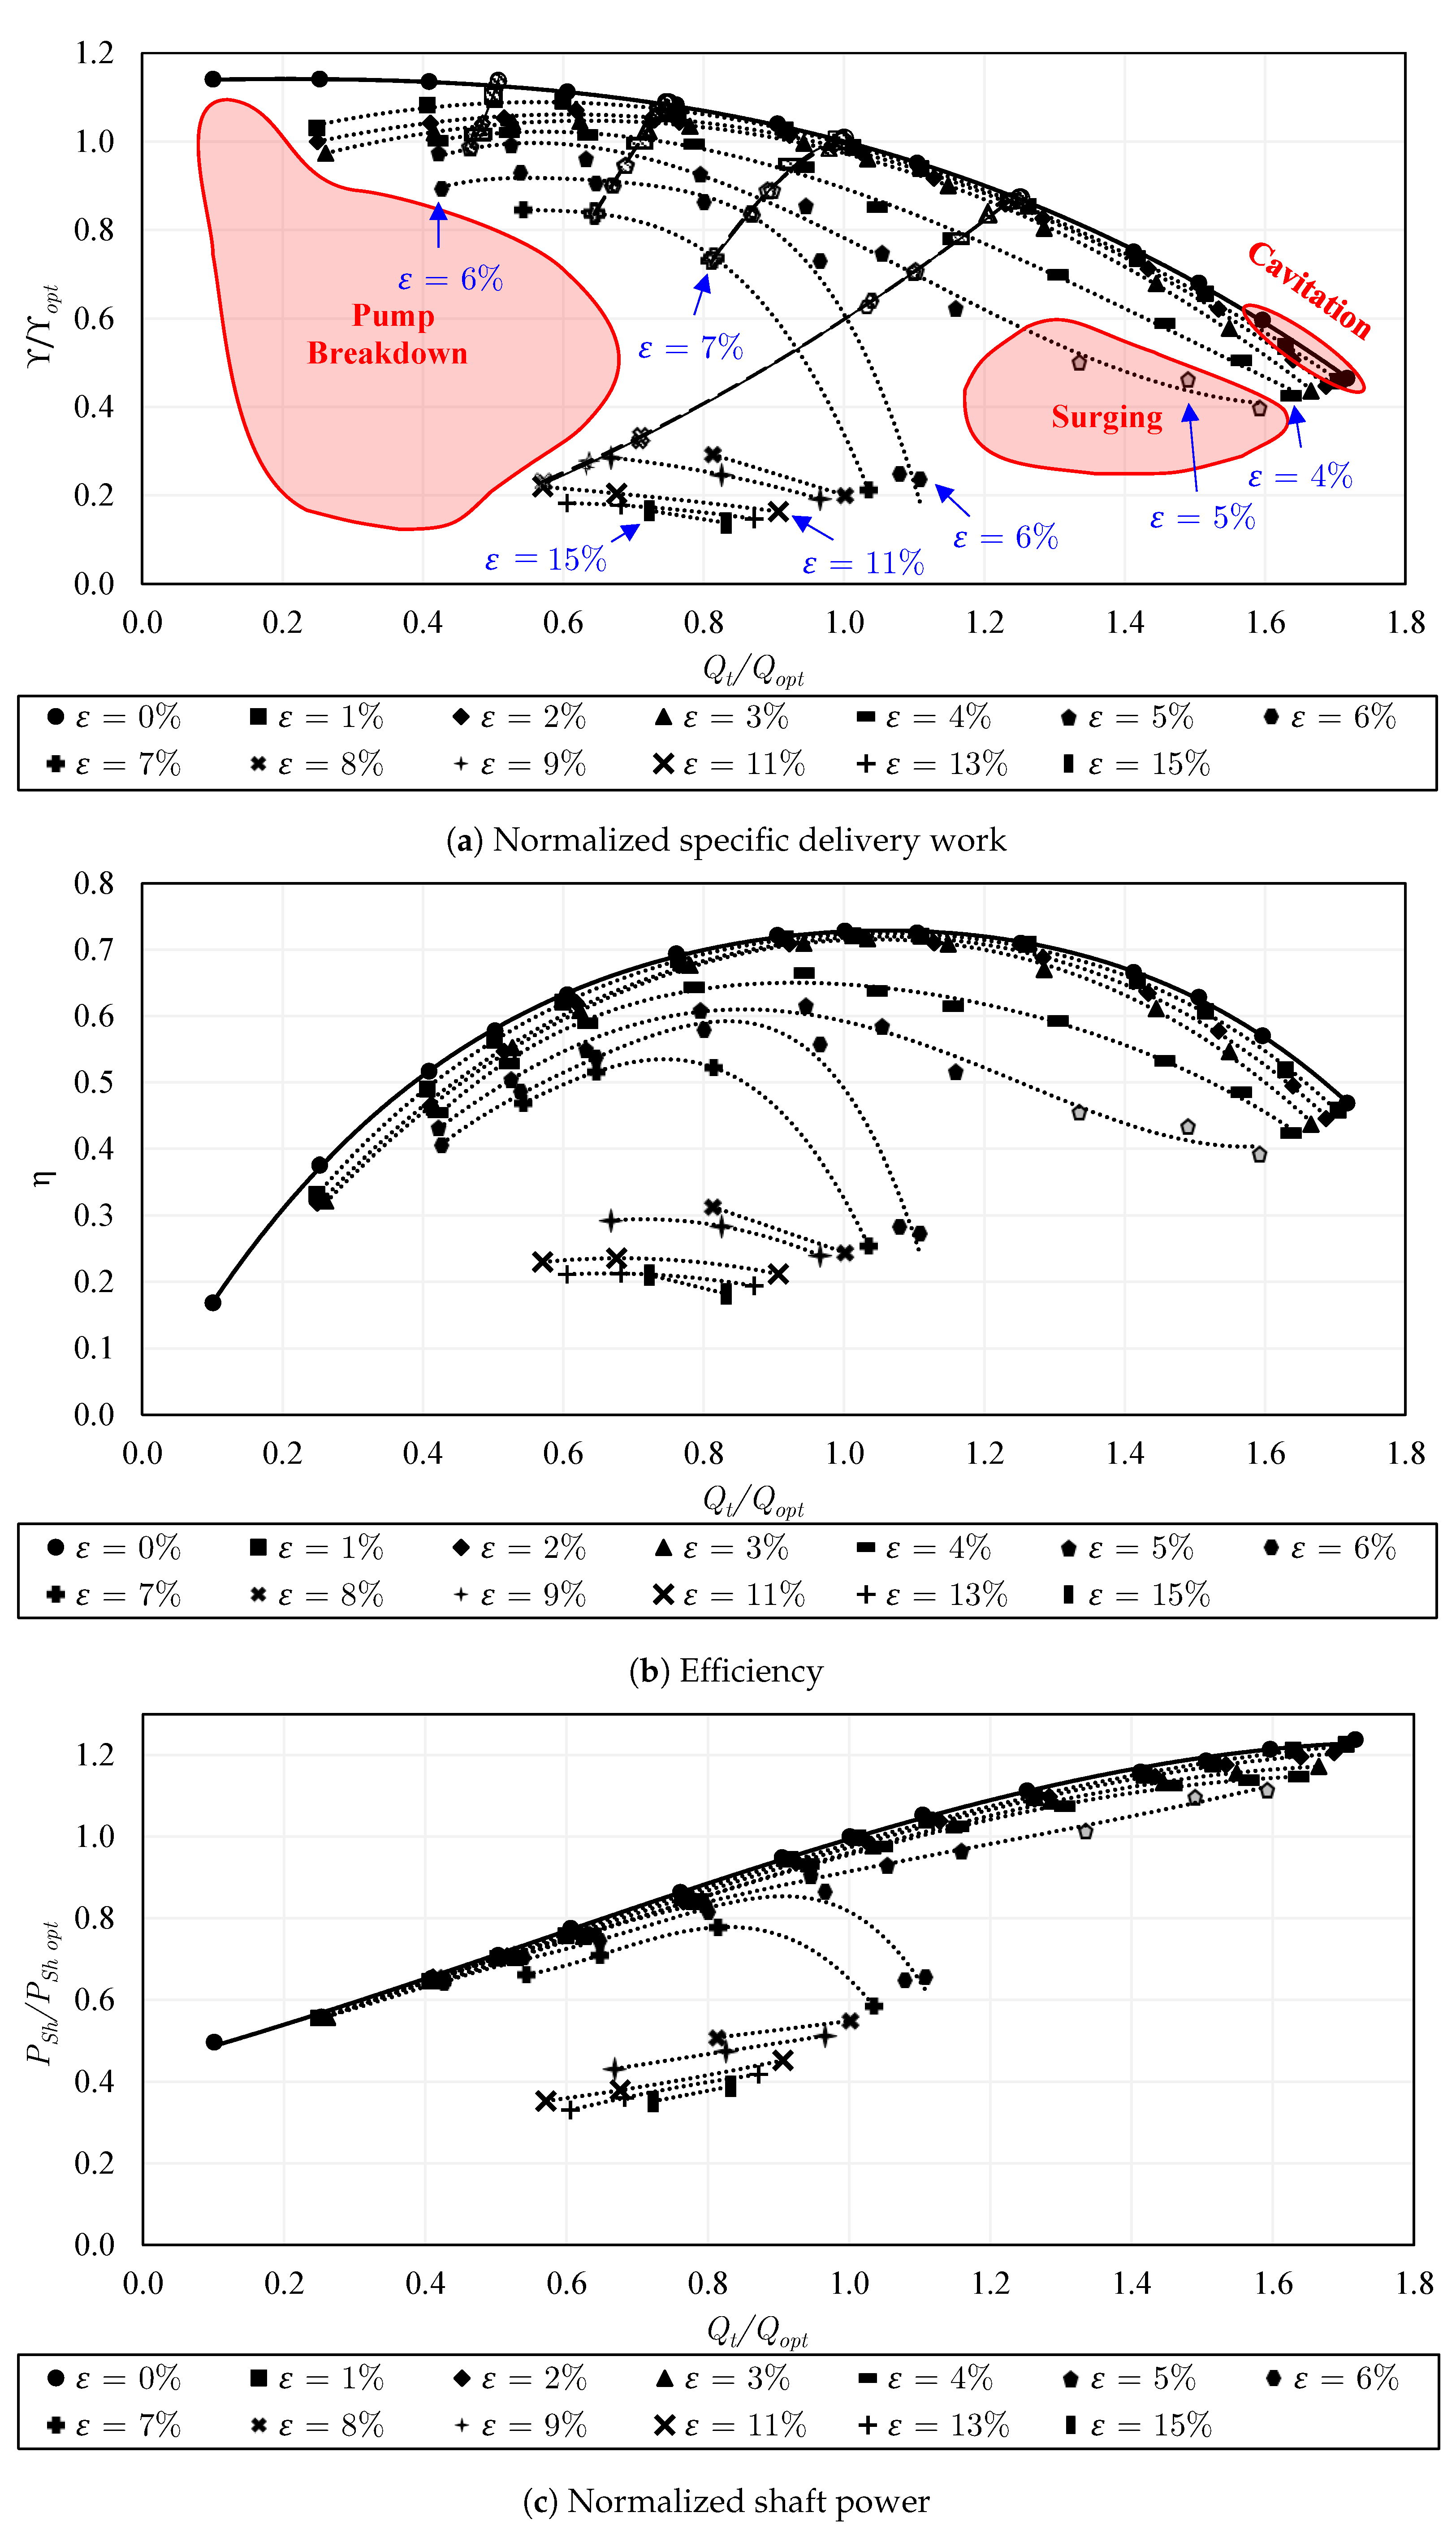
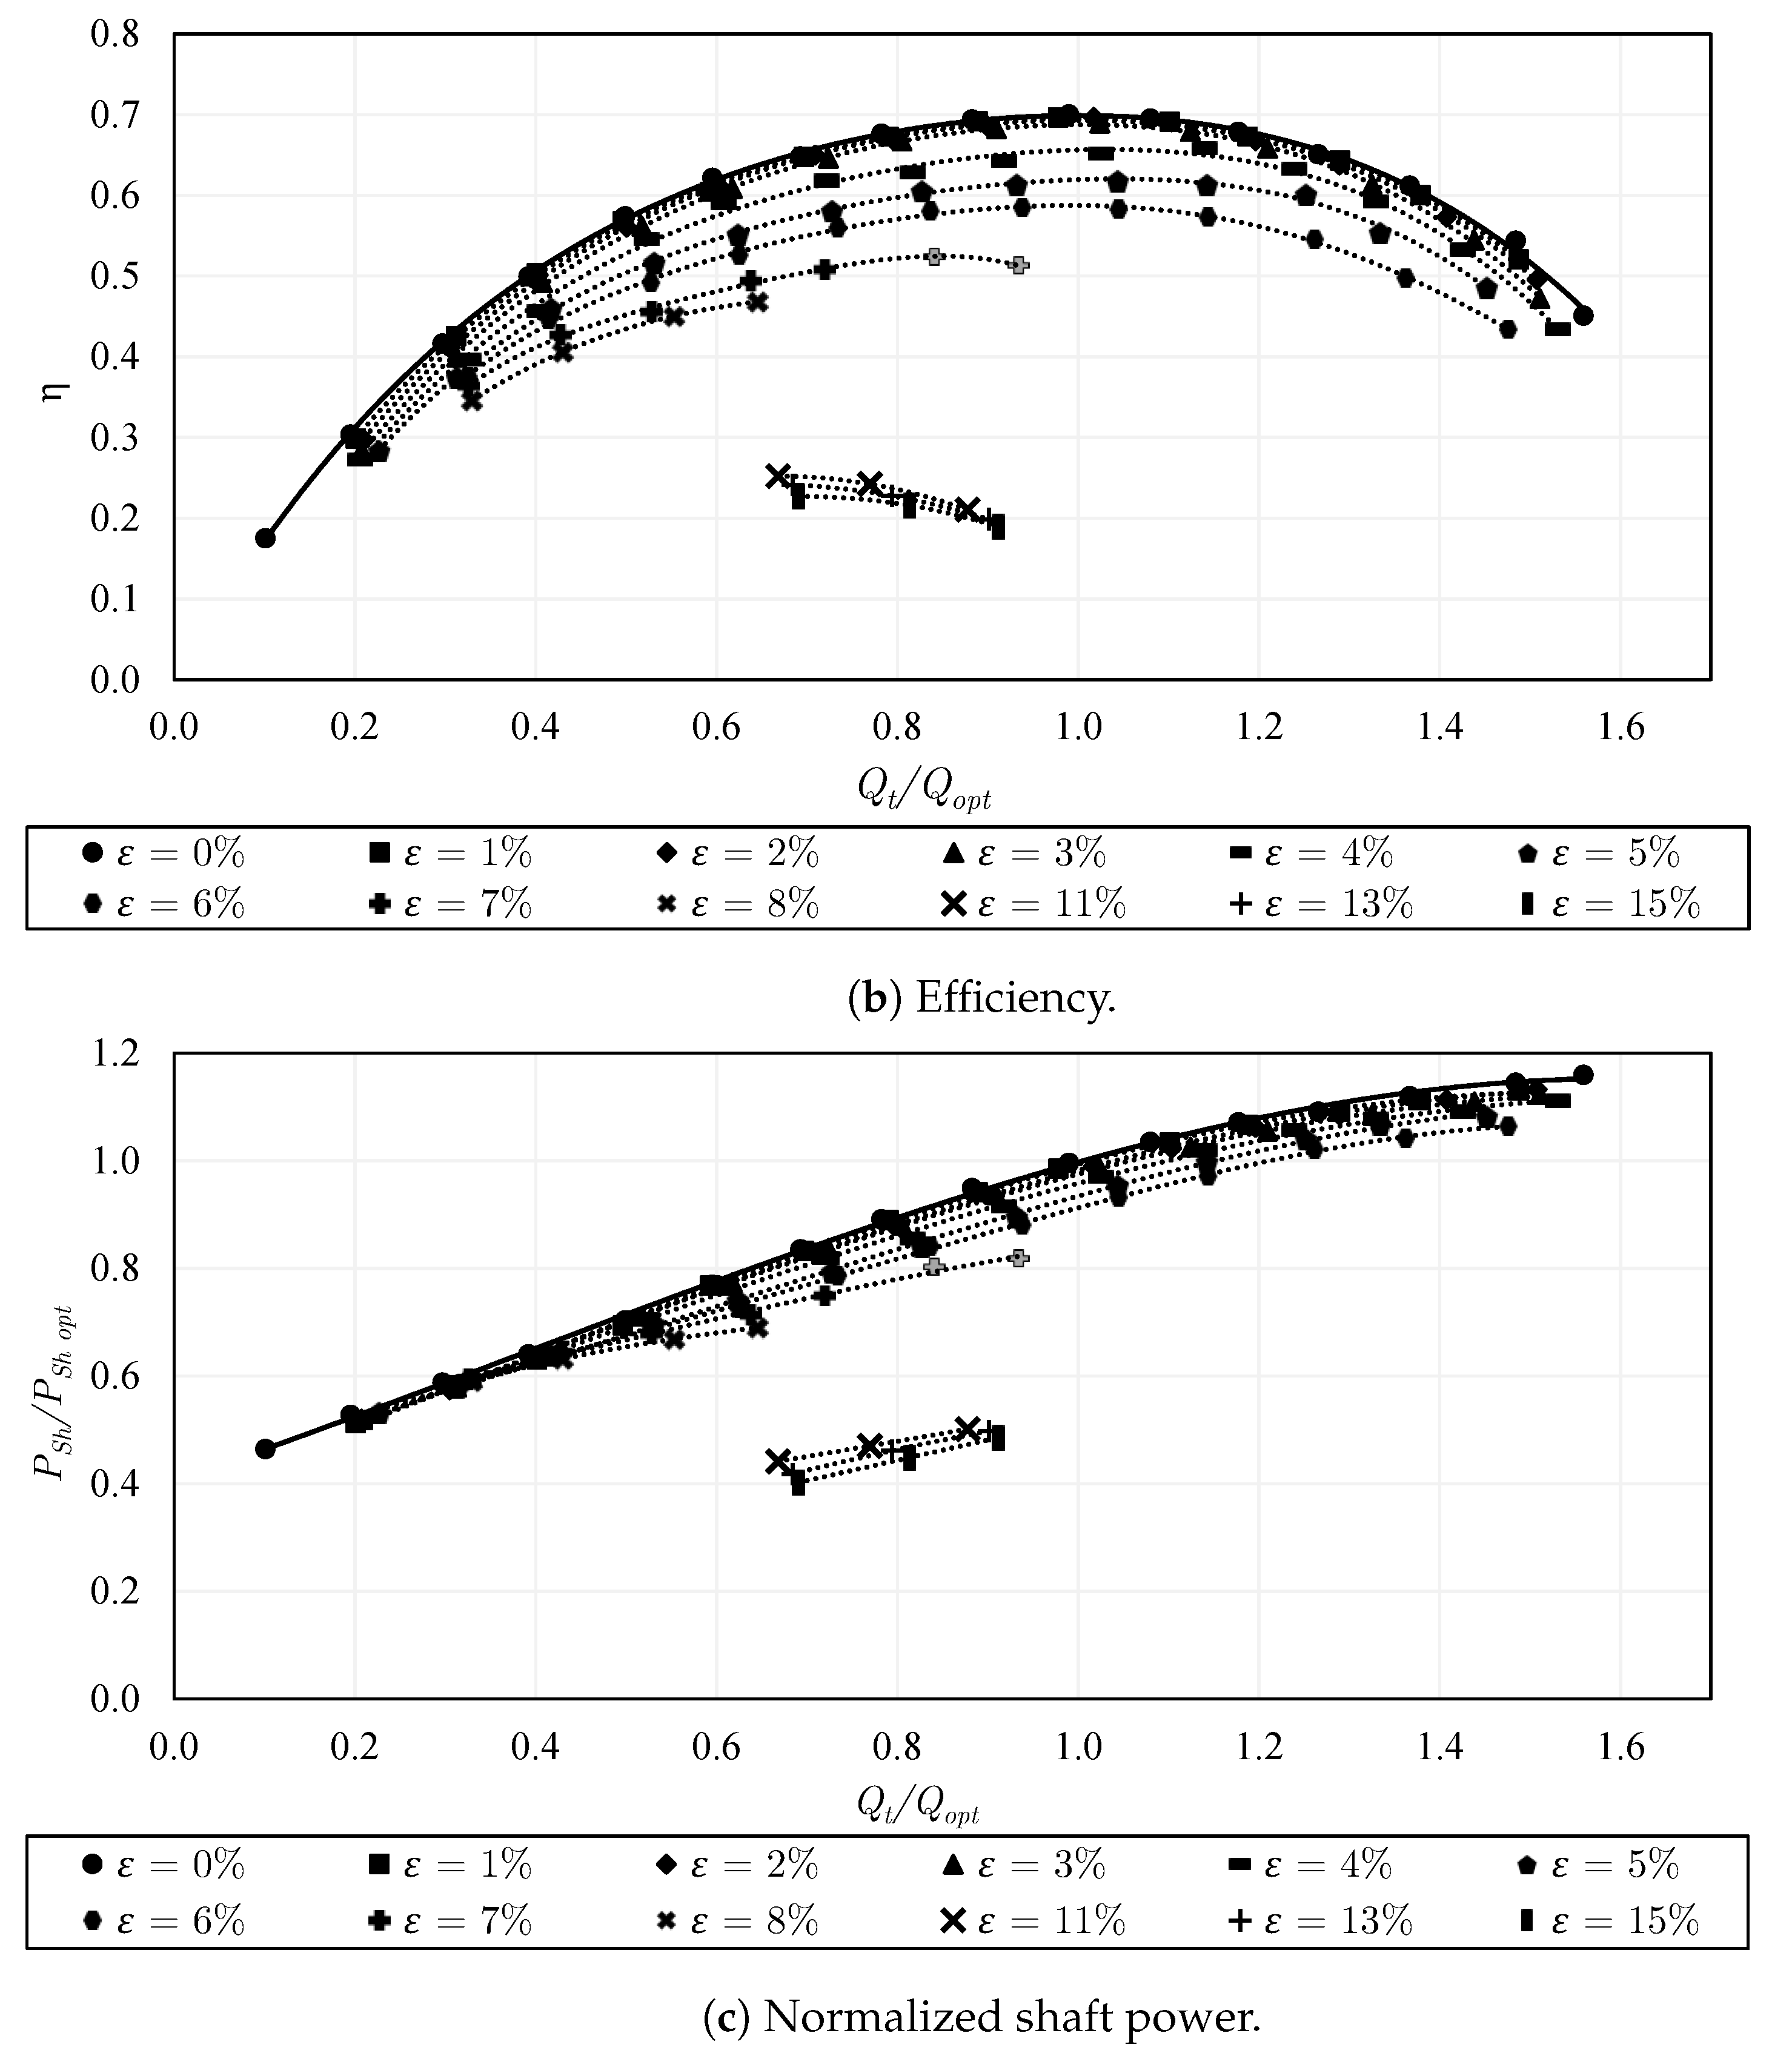
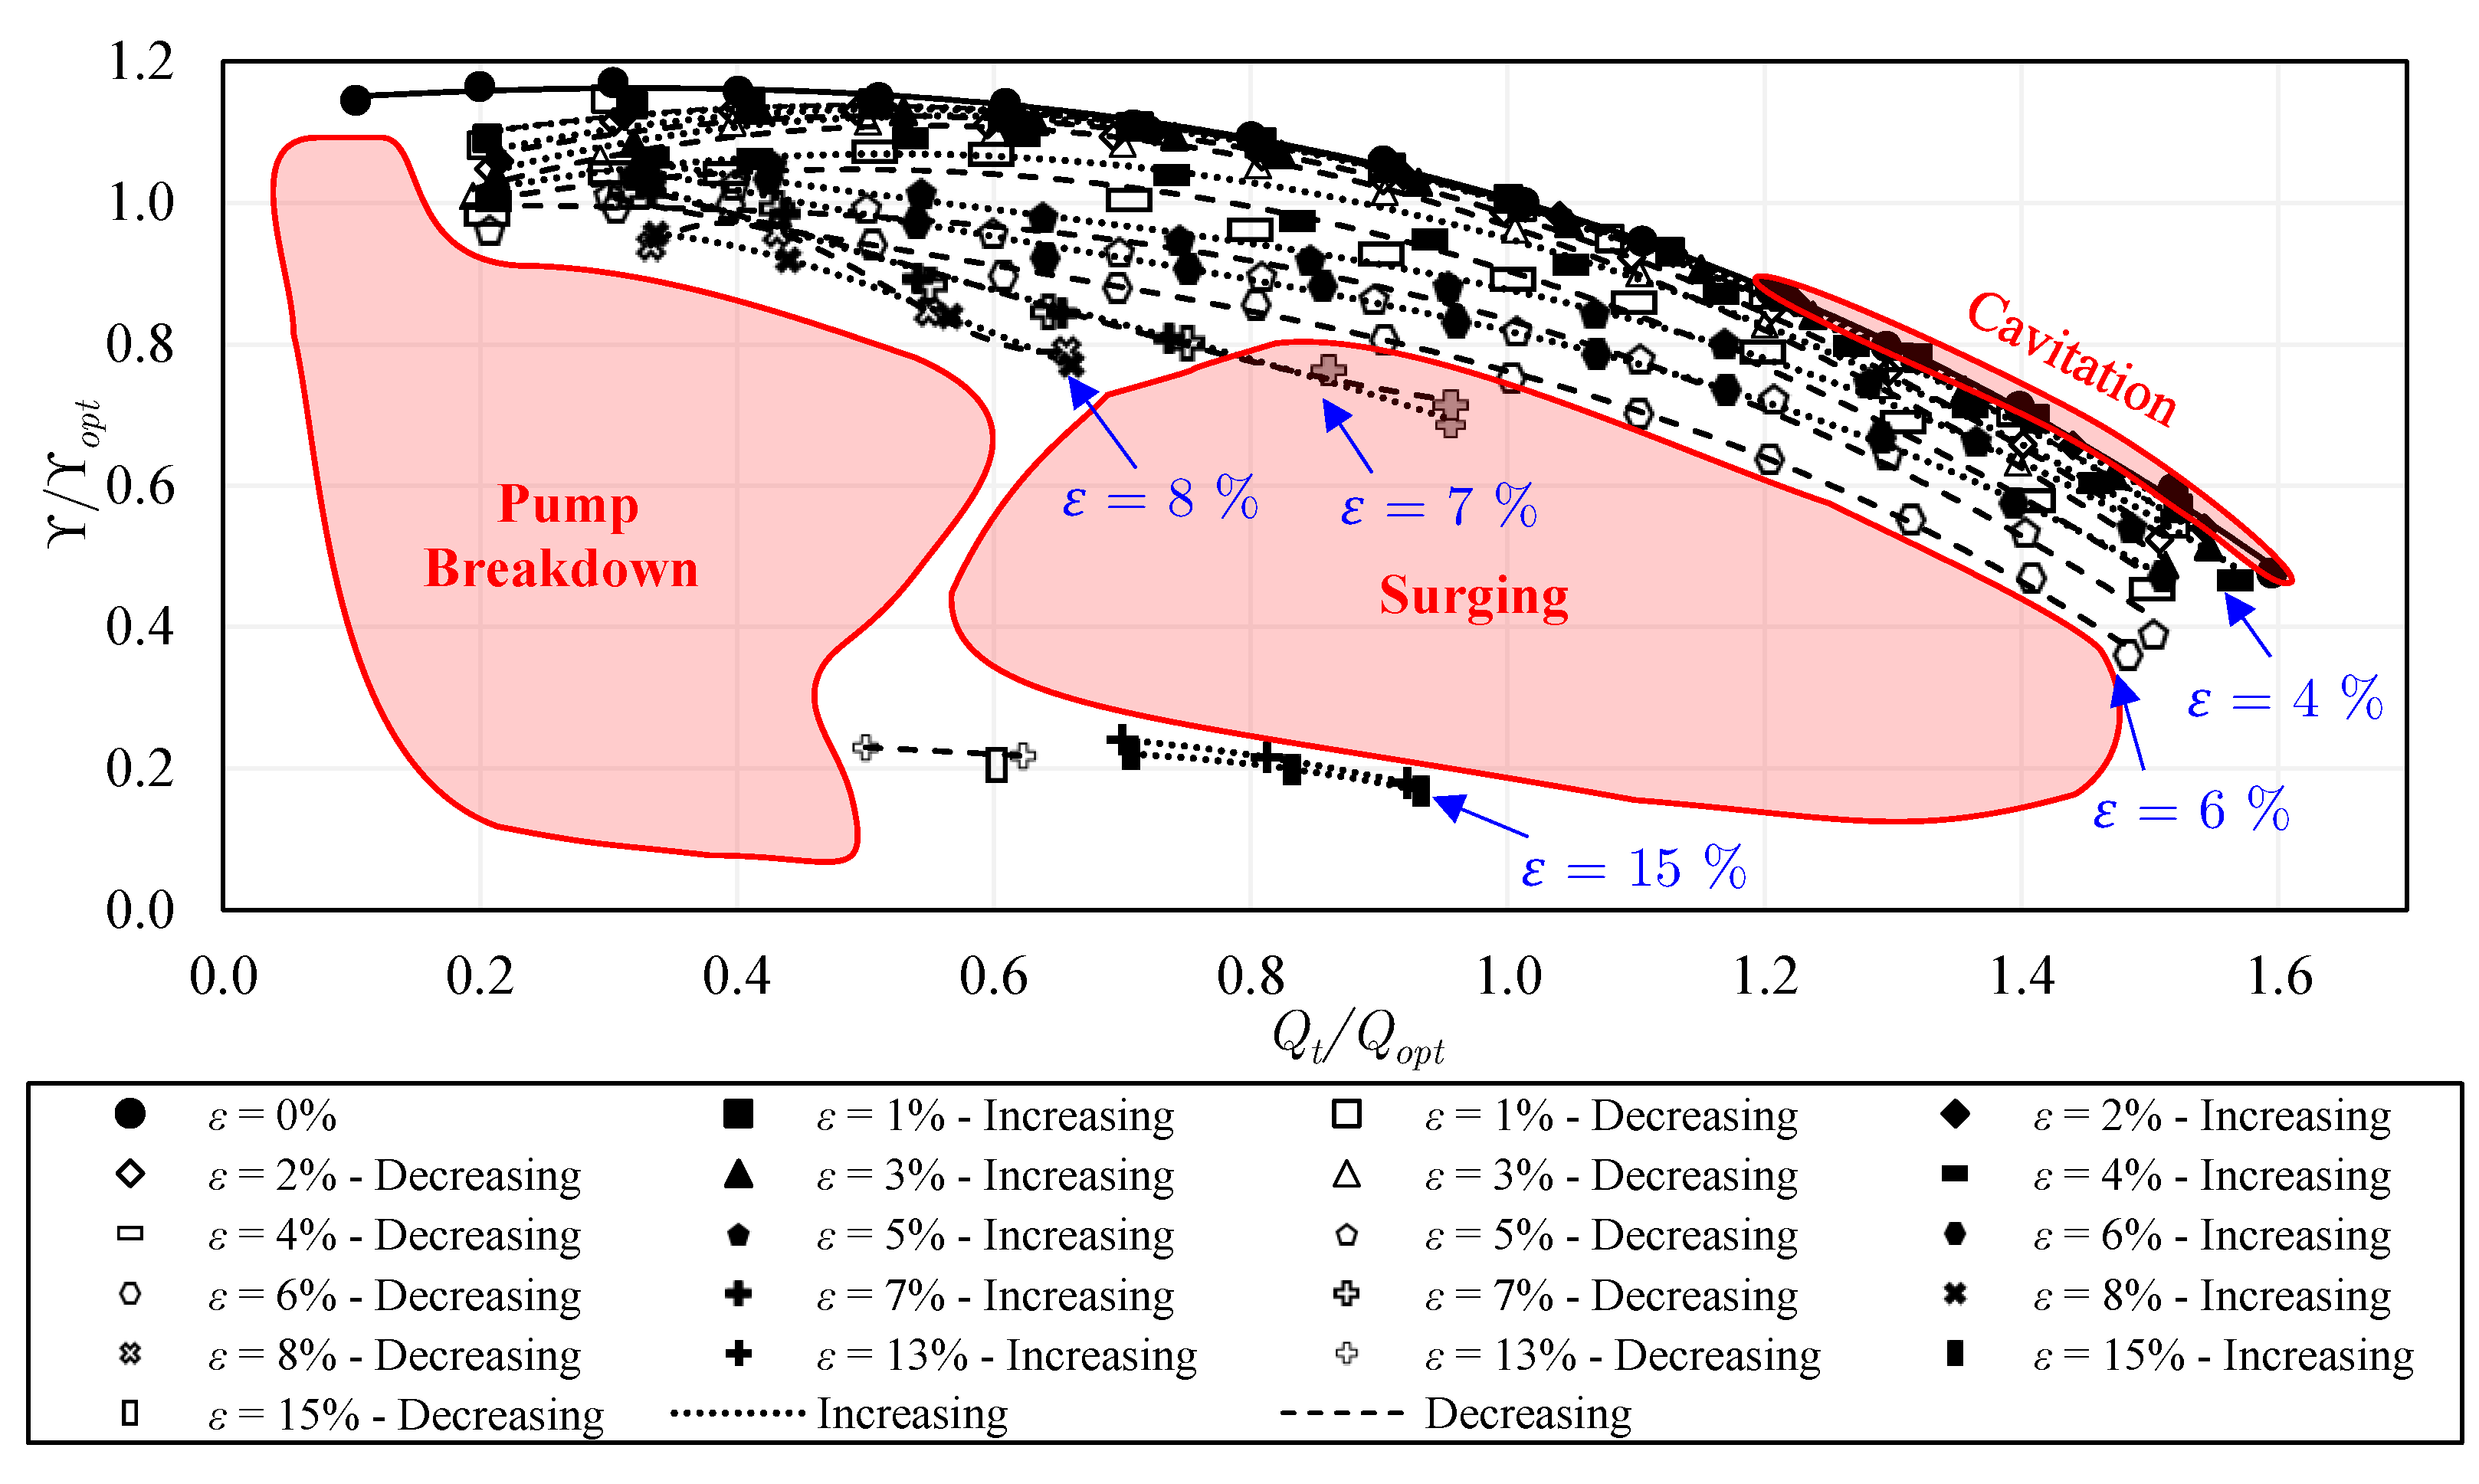
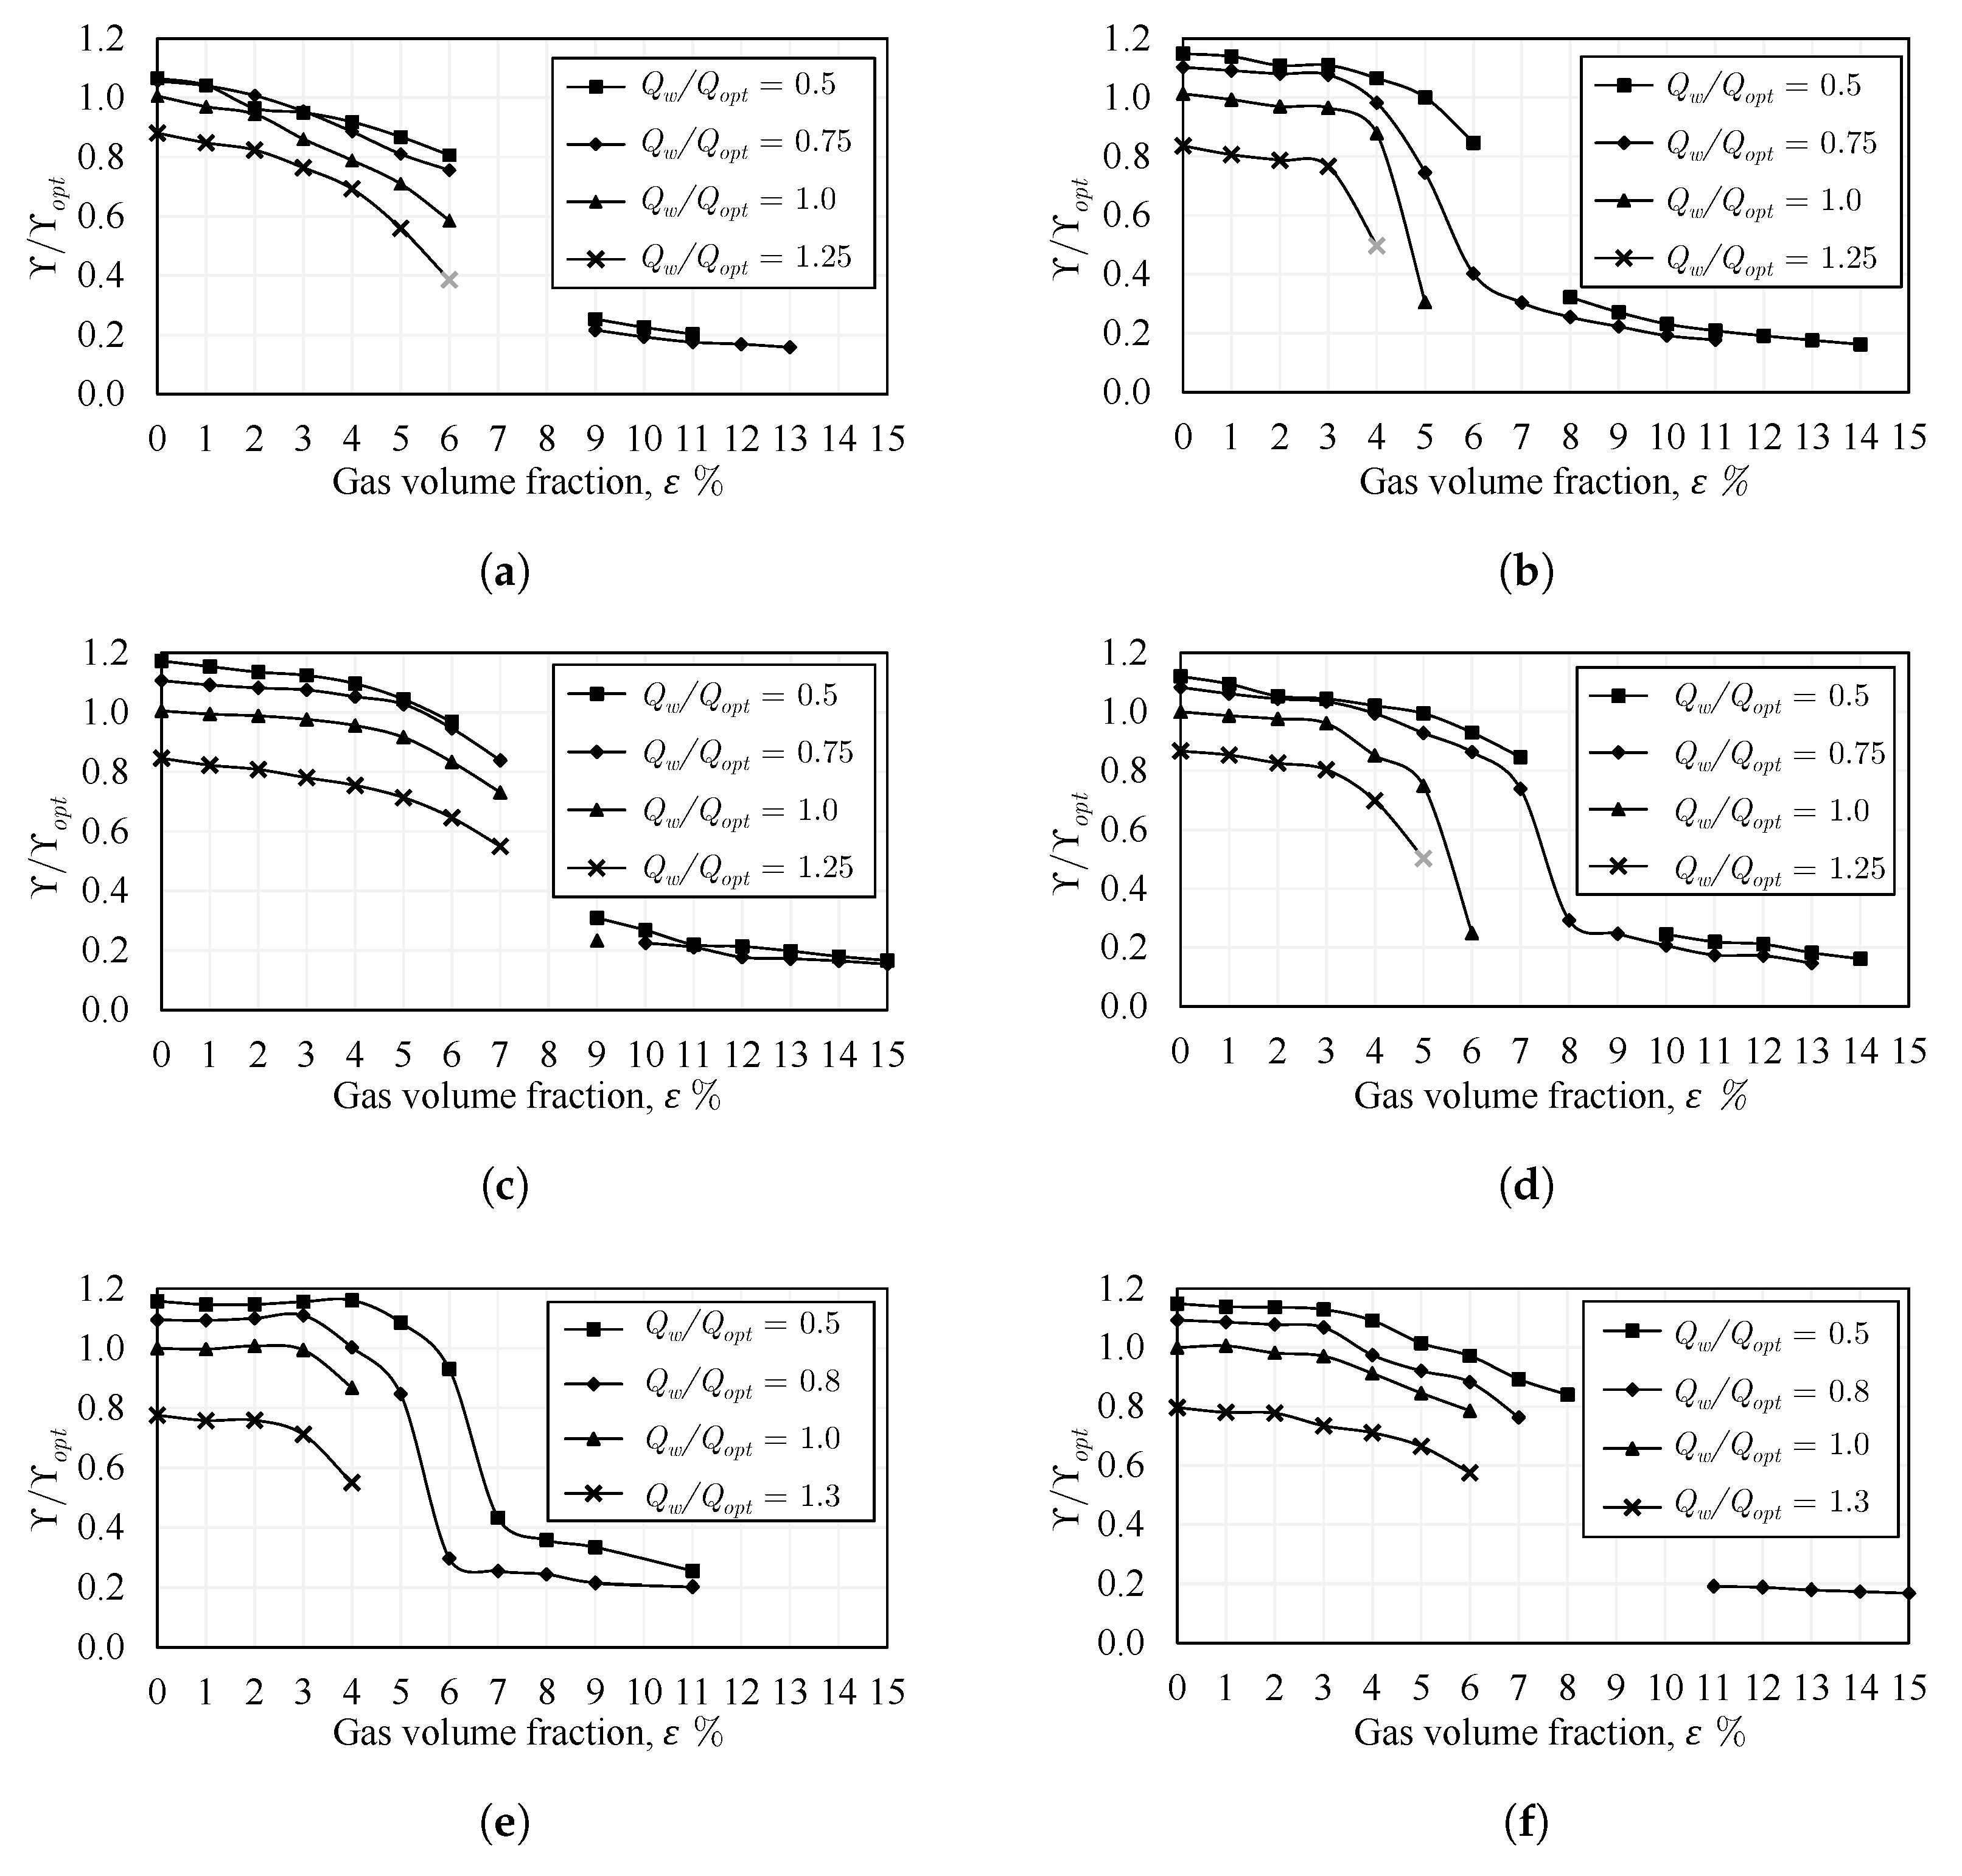
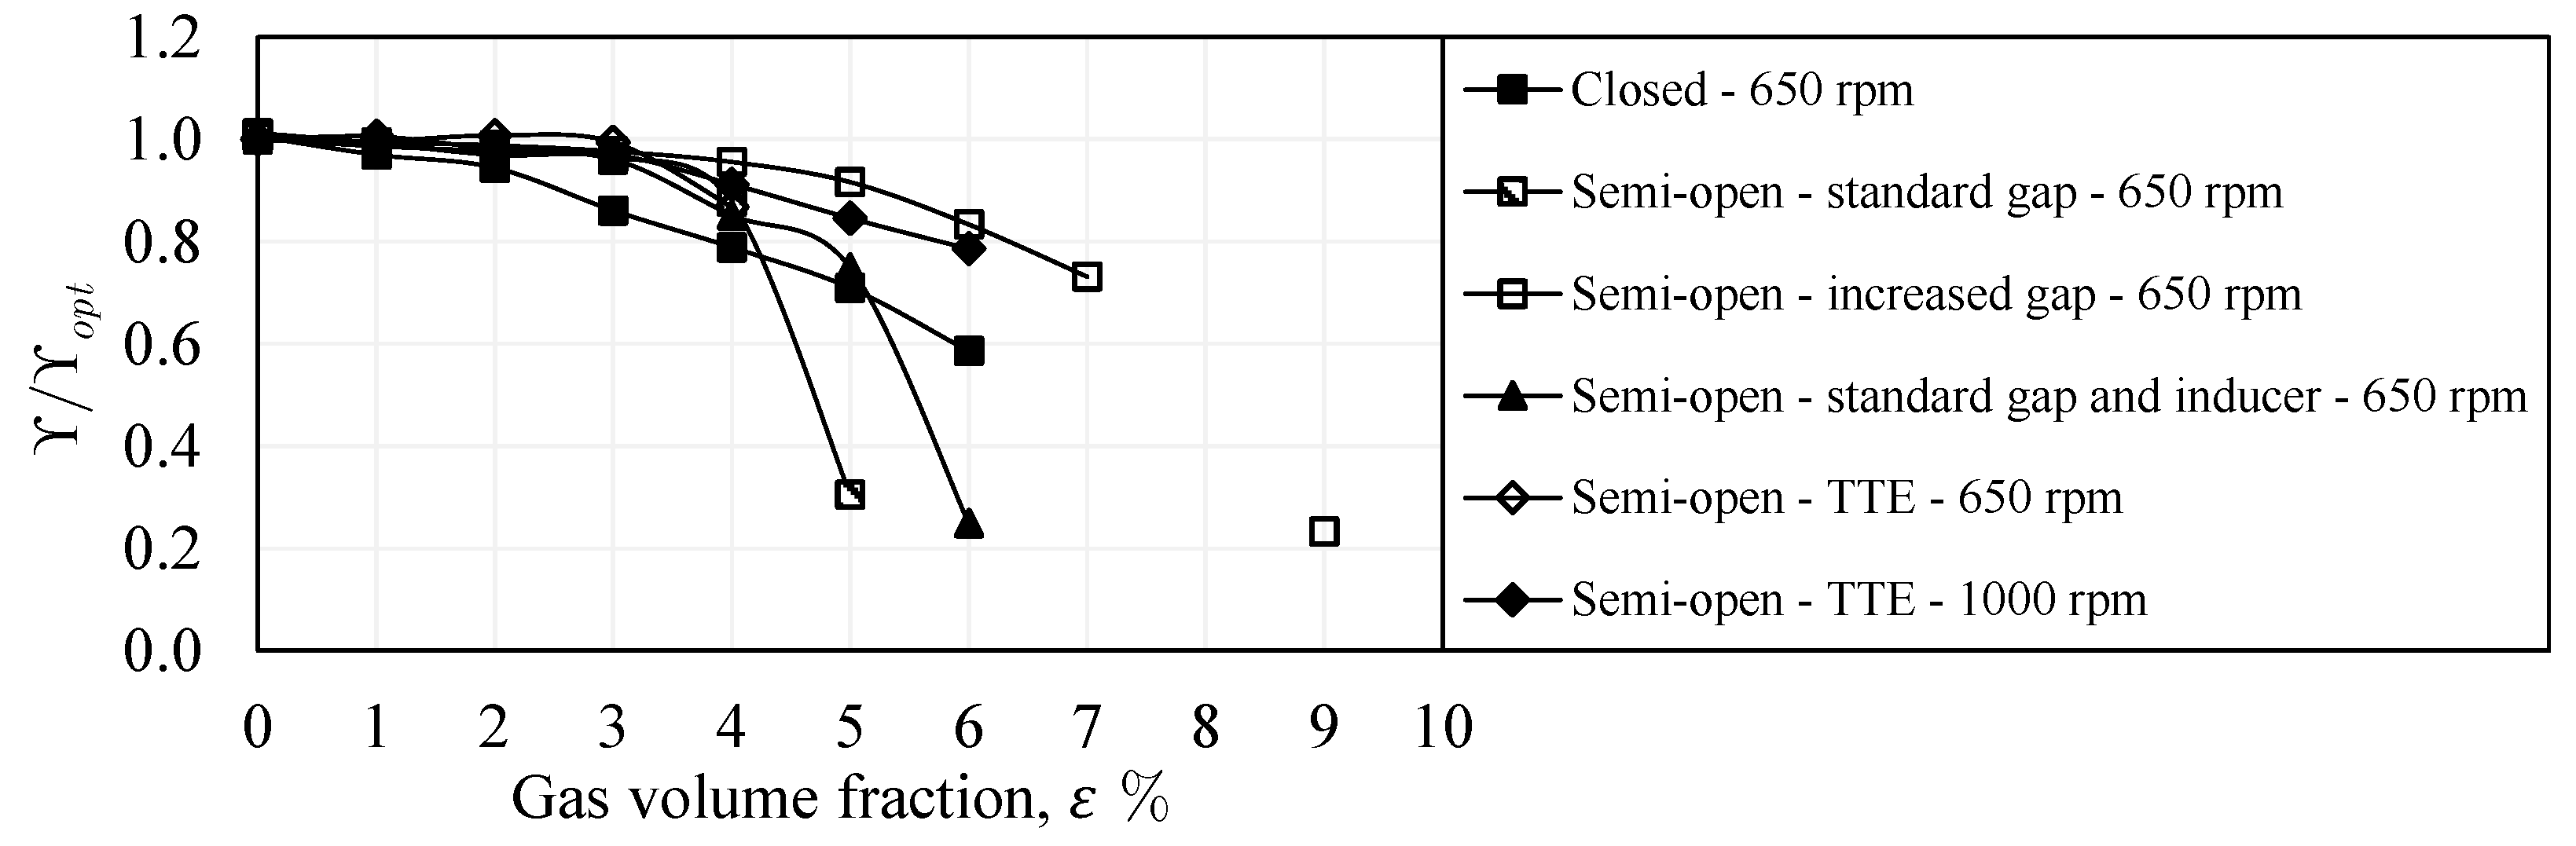
  • For two-phase pumping performance, the degradation is much lower in the semi-open impeller with the standard gap compared to that of the closed impeller for 1 % ε 3 % . However, for 4 % ε 6 % the behavior is reversed, where the performance of the semi-open impeller with a standard gap drops significantly compared to that of the closed impeller. This is mainly apparent at overload flow. Increasing the gap of the semi-open impeller could positively shift the sharp performance drop, allowing very solid pumping until ε = 7 % , followed by pump surging. Further, adding the inducer to the semi-open impeller with a standard gap enhances the part-load performance within the range of ε = 4 % to 7 % and overload performance within ε = 4 % to 5 % . The two-phase performance and the effective operating range of the round trailing edge semi-open impeller were found to be better than those of the trimmed trailing edge semi-open impeller. Similarly, the overall two-phase performance and the working range of the increased rpm are improved compared to the lower rpm as a result of the enhanced phase mixing, where the abrupt performance reduction is shifted to ε > 8 % .
  • Regarding the performance curves of constant air flow inlet, the closed impeller exhibits strongly unstable curves compared to most of the semi-open impeller cases. Consequently, the flow instabilities were found to be stronger in the closed impeller. Additionally, pump surging takes place in a wider range of flow conditions in the closed impeller. Increasing the tip clearance gap of the semi-open impeller could strongly decrease the instabilities when compared to those of the semi-open impeller with a standard gap. Similarly, the use of the inducer could diminish the instabilities and reduce the surging region of the semi-open impeller. Comparing the performance curves of the constant air flow inlet, the trimmed trailing edge semi-open impeller shows higher instabilities compared to the round trailing edge semi-open impeller. The intensity of pump surging in the trimmed trailing edge semi-open impeller was found to be lower than that of the round trailing edge semi-open impeller. However, only a low number of data points could be measured and compared under surging conditions. Additionally, the surging region of the trimmed trailing edge semi-open impeller is larger than that of the round trailing edge semi-open impeller. The increase of the rotational speed increases the flow rate and the occurrence of pump surging.
  • The transitions between different two-phase flow patterns on the two-phase performance maps explain the location of each flow regime, and the sudden variations and discontinuities of the performance in each pump configuration. Further, the maps reveal the improved gas accumulation resistance of the semi-open impeller with a standard gap compared to the closed impeller. The resistance to gas accumulation increases with increasing the tip clearance gap. Still, the inducer has only a slight impact on the flow regime map of the semi-open impeller. Additionally, gas accumulations take place easier in the trimmed trailing edge impeller due to its lower performance compared to the round trailing edge semi-open impeller.
  • The comparisons of sample bubble size distributions showed that the curves of the closed impeller are generally wider with higher median diameters compared to the other pump configurations using semi-open impellers. When the tip clearance gap is increased or the inducer is installed, the bubble size distributions become narrower, with somewhat lower median diameters.
Based on the experimental observations:
The closed impeller is suitable only for single-phase flow.
The semi-open impeller with a standard gap is recommended for gas volume fractions between 1 % and 3 % .
Installing the inducer is advised for gas volume fractions between 3 % and 4 % .
For gas volume fractions between 5 % and 7 % , a larger tip clearance gap is preferred.
The round trailing edge (profiled) is always a better choice compared to the trimmed trailing edge (non-profiled).
In general, a higher rotational speed is preferred over a lower one, even at the cost of some increased instabilities.
In future work, the investigations can be extended to include the effect of increased suction pressure, other types of two-phase mixtures (e.g., with different density ratios), other types of impellers (e.g., with twisted blades), and other types of pumps, which have not been considered in the present study.

Author Contributions

Conceptualization, M.M.; methodology, M.M.; software, M.M.; validation, M.M.; formal analysis, M.M.; investigation, M.M.; resources, D.T.; data curation, M.M.; writing—original draft preparation, M.M.; writing—review and editing, D.T.; visualization, M.M.; supervision, D.T.; project administration, D.T.; funding acquisition, D.T. All authors have read and agreed to the published version of the manuscript.

Funding

The research project was carried out in the framework of the industrial collective research program (IGF no. 20638 BG). It was supported by the Federal Ministry for Economic Affairs and Climate Action (BMWK) through the AiF (German Federation of Industrial Research Associations e.V.) based on a decision taken by the German Bundestag.

Data Availability Statement

The data that support the findings of this study are available from the corresponding author upon reasonable request.

Acknowledgments

The authors gratefully acknowledge the support for the project from the Verband Deutscher Maschinen-und Anlagenbau e.V. (VDMA), as well as the collaboration with R. Skoda and M. Hundshagen from Ruhr University in Bochum. The authors would like to thank K. Zähringer, P. Kováts, S. Kopparthy, and T. Parikh for their support and help with the experiments.

Conflicts of Interest

The authors declare no conflict of interest.

Nomenclatures

The following nomenclatures and abbreviations are used in this manuscript:
Roman characters
A D Cross-sectional area of discharge line( m 2 )
A S Cross-sectional area of suction line( m 2 )
b 1 Blade inlet width( m )
b 2 Blade outlet width( m )
C h Chord length at inducer blade hub( m )
C t Chord length at inducer blade tip( m )
D 1 Impeller blade inlet diameter( m )
D 2 Impeller blade outlet diameter( m )
D 32 The Sauter mean diameter of bubbles( m )
D m e d i a n Median bubble diameter( m )
D R Liquid-to-gas density ratio(-)
D S Diameter of suction pipe( m )
EBlade thickness( m )
gGravitational acceleration( m / s 2 )
HPump head( m )
m ˙ Mass flow rate of the fluid( kg / s )
m a ˙ Air mass flow rate( kg / s )
m w ˙ Water mass flow rate( kg / s )
m t ˙ Total mass flow rate ( m a ˙ + m w ˙ )( kg / s )
nRotational speed( rpm )
n q Specific speed( rpm )
p D Discharge static pressure( Pa )
P h Pitch at inducer blade hub( m )
P P Pump useful power( W )
p S Suction static pressure( Pa )
P S h Shaft power( W )
P S h m a x Maximum shaft power( W )
P S h o p t Shaft power at optimal conditions( W )
P t Pitch at inducer blade tip( m )
QVolume flow rate( m 3 / s )
Q a Air volume flow rate( m 3 / s )
Q m a x Maximum flow rate( m 3 / s )
Q o p t Optimal (nominal) flow rate( m 3 / s )
Q w Water volume flow rate( m 3 / s )
Q t Total volume flow rate ( Q a + Q w )( m 3 / s )
RGas constant of air( J / kg · K )
Re ω Rotational Reynolds number of water(-)
SImpeller tip clearance gap( m )
S i Inducer tip clearance gap( m )
TFlow temperature( K )
z s Suction elevation( m )
z D Delivery elevation( m )
Greek characters
β 1 Blade inlet angle( )
β 2 Blade outlet angle( )
ε (Inlet) Gas volume fraction(%)
η Pump efficiency(%)
μ w Water dynamic viscosity( Pa · s )
μ ˙ Gas mass fraction(%)
ω Angular speed( rad / s )
ρ Fluid density( kg / m 3 )
ρ a Air density( kg / m 3 )
ρ w Water density( kg / m 3 )
σ Standard deviation of the bubble size distribution( m )
σ a Inducer area solidity(-)
σ h Inducer hub solidity(-)
σ t Inducer tip solidity(-)
τ Torque( N · m )
Y Specific delivery work( m 2 / s 2 )
Y m a x Maximum specific delivery work( m 2 / s 2 )
Y o p t Optimal specific delivery work( m 2 / s 2 )
Subscripts
1Inlet
2Outlet
aAir phase
DDischarge
iInducer
o p t Optimal conditions of the pump (conditions at maximum efficiency)
m a x Maximum values
SSuction
S h Shaft (power)
tTotal parameters
wWater phase
Abbreviations
% FSPercentage of full scale (Quantification of accuracy)
% RDPercentage of reading (Quantification of accuracy)
BSDBubble size distribution
CFDComputational fluid dynamics
GVFGas volume fraction
HireCTHigh-resolution gamma-ray-computed tomography
LEDLight-emitting diodes
NPSHNet positive suction head (m)

References

  1. Ewing, M.E.; Weinandy, J.J.; Christensen, R.N. Observations of Two-Phase Flow Patterns in a Horizontal Circular Channel. Heat Transf. Eng. 1999, 20, 9–14. [Google Scholar]
  2. Wibisono, Y.; Cornelissen, E.R.; Kemperman, A.J.B.; Van Der Meer, W.G.J.; Nijmeijer, K. Two-phase flow in membrane processes: A technology with a future. J. Membr. Sci. 2014, 453, 566–602. [Google Scholar] [CrossRef]
  3. Chen, I.Y.; Tseng, C.Y.; Lin, Y.T.; Wang, C.C. Two-phase flow pressure change subject to sudden contraction in small rectangular channels. Int. J. Multiph. Flow 2009, 35, 297–306. [Google Scholar] [CrossRef]
  4. Sharma, A.; Tyagi, V.; Chen, C.; Buddhi, D. Review on thermal energy storage with phase change materials and applications. Renew. Sustain. Energy Rev. 2009, 13, 318–345. [Google Scholar] [CrossRef]
  5. Volk, M. Pump Characteristics and Applications; CRC Press: Boca Raton, FL, USA, 2013. [Google Scholar]
  6. Jones, W.V. Motor Selection Made Easy: Choosing the Right Motor for Centrifugal Pump Applications. IEEE Ind. Appl. Mag. 2013, 19, 36–45. [Google Scholar] [CrossRef]
  7. Caridad, J.; Asuaje, M.; Kenyery, F.; Tremante, A.; Aguillón, O. Characterization of a centrifugal pump impeller under two-phase flow conditions. J. Pet. Sci. Eng. 2008, 63, 18–22. [Google Scholar] [CrossRef]
  8. Zhu, Z.; Xie, P.; Ou, G.; Cui, B.; Li, Y. Design and experimental analyses of small-flow high-head centrifugal-vortex pump for gas-liquid two-phase mixture. Chin. J. Chem. Eng. 2008, 16, 528–534. [Google Scholar] [CrossRef]
  9. Amoresano, A.; Langella, G.; Niola, V.; Quaremba, G. Advanced image analysis of two-phase flow inside a centrifugal pump. Adv. Mech. Eng. 2014, 6, 1–11. [Google Scholar] [CrossRef]
  10. Chan, A.; Kawaji, M.; Nakamura, H.; Kukita, Y. Experimental study of two-phase pump performance using a full size nuclear reactor pump. Nucl. Eng. Des. 1999, 193, 159–172. [Google Scholar] [CrossRef]
  11. Poullikkas, A. Effects of two-phase liquid-gas flow on the performance of nuclear reactor cooling pumps. Prog. Nucl. Energy 2003, 42, 3–10. [Google Scholar] [CrossRef]
  12. Mansour, M.; Kováts, P.; Wunderlich, B.; Thévenin, D. Experimental investigations of a two-phase gas/liquid flow in a diverging horizontal channel. Exp. Therm. Fluid Sci. 2018, 93, 210–217. [Google Scholar] [CrossRef]
  13. Kopparthy, S.; Mansour, M.; Janiga, G.; Thévenin, D. Numerical investigations of turbulent single-phase and two-phase flows in a diffuser. Int. J. Multiph. Flow 2020, 130, 103333. [Google Scholar] [CrossRef]
  14. Ahmed, W.H.; Ching, C.Y.; Shoukri, M. Development of two-phase flow downstream of a horizontal sudden expansion. Int. J. Heat Fluid Flow 2008, 29, 194–206. [Google Scholar] [CrossRef]
  15. Li, W.G. Effects of viscosity of fluids on centrifugal pump performance and flow pattern in the impeller. Int. J. Heat Fluid Flow 2000, 21, 207–212. [Google Scholar] [CrossRef]
  16. Zhu, J.; Zhu, H.; Zhang, J.; Zhang, H.Q. A numerical study on flow patterns inside an electrical submersible pump (ESP) and comparison with visualization experiments. J. Petrol. Sci. Eng. 2019, 173, 339–350. [Google Scholar] [CrossRef]
  17. Zhu, J.; Zhang, H.Q. Mechanistic modeling and numerical simulation of in-situ gas void fraction inside ESP impeller. J. Nat. Gas Sci. Eng. 2016, 36, 144–154. [Google Scholar] [CrossRef]
  18. Zhou, L.; Shi, W.; Cao, W.; Yang, H. CFD investigation and PIV validation of flow field in a compact return diffuser under strong part-load conditions. Sci. China Technol. Sci. 2015, 58, 405–414. [Google Scholar] [CrossRef]
  19. Si, Q.; Bois, G.; Zhang, K.; Yuan, S. Air-water two-phase flow experimental and numerical analysis in a centrifugal pump. In Proceedings of the 12th European Conference on Turbomachinery Fluid Dynamics and Thermodynamics, ETC12, Stockholm, Sweden, 3–7 April 2017; Volume 12. [Google Scholar]
  20. Parikh, T.; Mansour, M.; Thévenin, D. Investigations on the effect of tip clearance gap and inducer on the transport of air-water two-phase flow by centrifugal pumps. Chem. Eng. Sci. 2020, 218, 115554. [Google Scholar] [CrossRef]
  21. Kye, B.; Park, K.; Choi, H.; Lee, M.; Kim, J.H. Flow characteristics in a volute-type centrifugal pump using large eddy simulation. Int. J. Heat Fluid Flow 2018, 72, 52–60. [Google Scholar] [CrossRef]
  22. Posa, A. LES investigation on the dependence of the flow through a centrifugal pump on the diffuser geometry. Int. J. Heat Fluid Flow 2021, 87, 108750. [Google Scholar] [CrossRef]
  23. Jiang, Q.; Heng, Y.; Liu, X.; Zhang, W.; Bois, G.; Si, Q. A review of design considerations of centrifugal pump capability for handling inlet gas-liquid two-phase flows. Energies 2019, 12, 1078. [Google Scholar] [CrossRef]
  24. Campo, A.; Chisely, E.A. Experimental characterization of two-phase flow centrifugal pumps. In Proceedings of the ASME 2010 Power Conference American Society of Mechanical Engineers, Chicago, IL, USA, 13–15 July 2010; pp. 803–816. [Google Scholar]
  25. Poullikkas, A. Two Phase Flow and Cavitation in Centrifugal Pump: A Theoretical and Experimental Investigation. Ph.D. Thesis, Loughborough University, Loughborough, UK, 1992. [Google Scholar]
  26. Manzano Ruiz, J.J. Experimental and Theoretical Study of Two-Phase Flow in Centrifugal Pumps. Ph.D. Thesis, Massachusetts Institute of Technology, Cambridge, MA, USA, 1980. [Google Scholar]
  27. Noghrehkar, G.R.; Kawaji, M.; Chan, A.M.C.; Nakamura, H.; Kukita, Y. Investigation of centrifugal pump performance under two-phase flow conditions. J. Fluids Eng. 1995, 117, 129–137. [Google Scholar] [CrossRef]
  28. Mansour, M.; Wunderlich, B.; Thévenin, D. Experimental study of two-phase air/water flow in a centrifugal pump working with a closed or a semi-open impeller. In Proceedings of the ASME Turbo Expo 2018: Turbomachinery Technical Conference and Exposition, American Society of Mechanical Engineers, Oslo, Norway, 11–15 June 2018; p. V009T27A012. [Google Scholar]
  29. Mansour, M.; Wunderlich, B.; Thévenin, D. Effect of tip clearance gap and inducer on the transport of two-phase air-water flows by centrifugal pumps. Exp. Therm. Fluid Sci. 2018, 99, 487–509. [Google Scholar] [CrossRef]
  30. Mansour, M.; Parikh, T.; Engel, S.; Wunderlich, B.; Thévenin, D. Investigation on the influence of an inducer on the transport of single and two-phase air-flows by centrifugal pumps. In Proceedings of the 48th Turbomachinery & 35th Pump Symposia, Houston, TX, USA, 9–12 September 2019. [Google Scholar]
  31. Mansour, M.; Parikh, T.; Thévenin, D. Influence of the shape of the impeller blade trailing edge on single and two-phase air-water flows in a centrifugal pump. In Proceedings of the 49th Turbomachinery & 36th Pump Symposia, Virtual, Houston, TX, USA, 8–10 December 2020. [Google Scholar]
  32. Mansour, M.; Kopparthy, S.; Thévenin, D. Investigations on the effect of rotational speed on the transport of air-water two-phase flows by centrifugal pumps. Int. J. Heat Fluid Flow 2022, 94, 108939. [Google Scholar] [CrossRef]
  33. Pessoa, R.; Prado, M. Two-phase flow performance for electrical submersible pump stages. SPE Prod. Facil. 2003, 18, 13–27. [Google Scholar] [CrossRef]
  34. He, D.; Zhao, L.; Chang, Z.; Zhang, Z.; Guo, P.; Bai, B. On the performance of a centrifugal pump under bubble inflow: Effect of gas-liquid distribution in the impeller. J. Pet. Sci. Eng. 2021, 203, 108587. [Google Scholar] [CrossRef]
  35. Zhao, L.; Chang, Z.; Zhang, Z.; Huang, R.; He, D. Visualization of gas-liquid flow pattern in a centrifugal pump impeller and its influence on the pump performance. Meas. Sens. 2021, 13, 100033. [Google Scholar] [CrossRef]
  36. Gamboa, J.; Prado, M. Review of electrical-submersible-pump surging correlation and models. SPE Prod. Oper. 2011, 26, 314–324. [Google Scholar] [CrossRef]
  37. Zhu, J.; Guo, X.; Liang, F.; Zhang, H.Q. Experimental study and mechanistic modeling of pressure surging in electrical submersible pump. J. Nat. Gas Sci. Eng. 2017, 45, 625–636. [Google Scholar] [CrossRef]
  38. Monte Verde, W.; Biazussi, J.L.; Sassim, N.A.; Bannwart, A.C. Experimental study of gas-liquid two-phase flow patterns within centrifugal pumps impellers. Exp. Therm. Fluid Sci. 2017, 85, 37–51. [Google Scholar] [CrossRef]
  39. Tillack, P. Förderverhalten von Kreiselpumpen bei Viskosen, Gasbeladenen Flüssigkeiten. Ph.D. Thesis, Technische Universität Kaiserslautern, Kaiserslautern, Germany, 1998. [Google Scholar]
  40. Sauer, M. Einfluss der Zuströmung auf das Förderverhalten von Kreiselpumpen Radialer Bauart bei Flüssigkeits-/Gasförderung. Ph.D. Thesis, Technische Universität Kaiserslautern, Kaiserslautern, Germany, 2003. [Google Scholar]
  41. Budris, A.R.; Mayleben, P.A. Effects of entrained air, NPSH margin, and suction piping on cavitation in centrifugal pumps. In Proceedings of the 15th International Pump Users Symposium, Houston, TX, USA, 2–5 March 1998. [Google Scholar]
  42. Si, Q.; Bois, G.; Jiang, Q.; He, W.; Ali, A.; Yuan, S. Investigation on the handling ability of centrifugal pumps under air–water two-phase inflow: Model and experimental validation. Energies 2018, 11, 3048. [Google Scholar] [CrossRef]
  43. Pumps, S. Sulzer Centrifugal Pump Handbook; Elsevier: Amsterdam, The Netherlands, 2013. [Google Scholar]
  44. Beltur, R. Experimental Investigation of Two-Phase Flow Performance of ESP Stages. Master’s Thesis, Department of Petroleum Engineering, University of Tulsa, Tulsa, OK, USA, 2003. [Google Scholar]
  45. Cappellino, C.A.; Roll, D.R.; Wilson, G. Design Considerations and application guidelines for pumping liquids with entrained gas using open impeller centrifugal pumps. In Proceedings of the 9th International Pump Users Symposium, Houston, TX, USA, 3–5 March 1992; pp. 262–264. [Google Scholar]
  46. Cirilo, R. Air-Water Flow through Electric Submersible Pumps. Ph.D. Thesis, Department of Petroleum Engineering, University of Tulsa, Tulsa, OK, USA, 1998. [Google Scholar]
  47. Shi, G.; Tao, S.; Liu, X.; Wen, H.; Shu, Z. Effect of gas volume fraction on the gas-phase distribution in the passage and blade surface of the axial flow screw-type oil-gas multiphase pump. Processes 2021, 9, 760. [Google Scholar] [CrossRef]
  48. Xu, Y.; Cao, S.; Reclari, M.; Wakai, T.; Sano, T. Multiphase performance and internal flow pattern of helico-axial pumps. IOP Conf. Ser. Earth Environ. Sci. 2019, 240, 032029. [Google Scholar] [CrossRef]
  49. Mansour, M.; Ali, M.H.; Abdel-Maksoud, R.M. Experimental study of expansion and compression effects on the stability of Taylor vortex flow. Fluid Dyn. Res. 2016, 48, 045502. [Google Scholar] [CrossRef]
  50. Murakami, M.; Minemura, K. Effects of entrained air on the performance of a centrifugal pump: 1st report, performance and flow conditions. Bull. JSME 1974, 17, 1047–1055. [Google Scholar] [CrossRef]
  51. Minemura, K.; Murakami, M.; Katagiri, H. Characteristics of centrifugal pumps handling air-water mixtures and size of air bubbles in pump impellers. Bull. JSME 1985, 28, 2310–2318. [Google Scholar] [CrossRef]
  52. Chang, L.; Xu, Q.; Yang, C.; Su, X.; Wang, H.; Guo, L. Experimental study on gas–liquid flow patterns and bubble size in a high-speed rotating impeller of a three-stage centrifugal pump. Exp. Therm. Fluid Sci. 2023, 145, 110896. [Google Scholar] [CrossRef]
  53. Cubas, J.M.; Stel, H.; Ofuchi, E.M.; Marcelino Neto, M.A.; Morales, R.E. Visualization of two-phase gas-liquid flow in a radial centrifugal pump with a vaned diffuser. J. Pet. Sci. Eng. 2020, 187, 106848. [Google Scholar] [CrossRef]
  54. Barrios, L.; Prado, M.G. Modeling Two-Phase Flow Inside an Electrical Submersible Pump Stage. J. Energy Resour. Technol. 2011, 133, 042902. [Google Scholar] [CrossRef]
  55. Zhu, J.; Zhang, H.Q. CFD simulation of ESP performance and bubble size estimation under gassy conditions. In Proceedings of the SPE Annual Technical Conference and Exhibition SPE 2014, Amsterdam, The Netherlands, 27–29 October 2014; p. SPE-170727. [Google Scholar]
  56. Hundshagen, M.; Rave, K.; Nguyen, B.D.; Popp, S.; Hasse, C.; Mansour, M.; Thévenin, D.; Skoda, R. Two-phase flow simulations of liquid/gas transport in radial centrifugal pumps with special emphasis on the transition from bubbles to adherent gas accumulations. J. Fluids Eng. 2022, 144, 101202. [Google Scholar] [CrossRef]
  57. Hundshagen, M.; Mansour, M.; Thévenin, D.; Skoda, R. Numerical investigation of two-phase air-water flow in a centrifugal pump with closed or semi-open impeller. In Proceedings of the 13th European Turbomachinery Conference on Turbomachinery Fluid Dynamics and Thermodynamics, ETC13 2019, Lausanne, Switzerland, 8–12 April 2019; Volume 13. [Google Scholar]
  58. Hundshagen, M.; Mansour, M.; Thévenin, D.; Skoda, R. Experimental investigation and 3D-CFD simulation of centrifugal pumps for gas-laden liquids with closed and semi-open impeller. In Proceedings of the 4th International Rotating Equipment Conference 2019, Wiesbaden, Germany, 24–25 September 2019. [Google Scholar]
  59. Yan, S.; Sun, S.; Luo, X.; Chen, S.; Li, C.; Feng, J. Numerical investigation on bubble distribution of a multistage centrifugal pump based on a population balance model. Energies 2020, 13, 908. [Google Scholar] [CrossRef]
  60. Schiavello, B. Two-Phase Flow Rotodynamic Pumps-Experiments and Design Criteria. Pumps Offshore, Course; Number 7133; Worthing ton Simson Ltd.: Newark, UK, 1986. [Google Scholar]
  61. Gülich, J.F. Centrifugal Pumps; Springer: Berlin/Heidelberg, Germany, 2008. [Google Scholar]
  62. Trevisan, F.E. Modeling and Visualization of Air and Viscous Liquid in Electrical Submersible Pump. Ph.D. Thesis, Department of Petroleum Engineering, University of Tulsa, Tulsa, OK, USA, 2009. [Google Scholar]
  63. Trevisan, F.E.; Prado, M. Experimental investigation of the viscous effect on two-phase-flow patterns and hydraulic performance of electrical submersible pumps. J. Can. Pet. Technol. 2011, 50, 45–52. [Google Scholar] [CrossRef]
  64. Banjar, H.M.; Gamboa, J.; Zhang, H.Q. Experimental study of liquid viscosity effect on two-phase stage performance of electrical submersible pumps. In Proceedings of the SPE Annual Technical Conference and Exhibition. Society of Petroleum Engineers 2013, New Orleans, LA, USA, 30 September–2 October 2013. [Google Scholar]
  65. Paternost, G.M.; Bannwart, A.C.; Estevam, V. Experimental study of a centrifugal pump handling viscous fluid and two-phase flow. SPE Prod. Oper. 2015, 30, 146–155. [Google Scholar] [CrossRef]
  66. Stepanoff, A.J. Pumps and Blowers: Two-Phase Flow; J. Wiley & Sons: Hoboken, NJ, USA, 1965. [Google Scholar]
  67. Turpin, J.L.; Lea, J.F.; Bearden, J.L. Gas-liquid flow through centrifugal pumps—Correlation of data. In Proceedings of the 3rd International Pump Symposium Turbomachinery Laboratories, Houston, TX, USA, 1986; pp. 13–20. [Google Scholar]
  68. Gamboa, J. Prediction of the Transition in Two-Phase Performance of an Electrical Submersible Pump. Ph.D. Thesis, Department of Petroleum Engineering, University of Tulsa, Tulsa, OK, USA, 2008. [Google Scholar]
  69. Zhu, J.; Zhu, H.; Zhang, J.; Zhang, H.Q. An experimental study of surfactant effect on gas tolerance in electrical submersible pump (ESP). In Proceedings of the ASME 2017 International Mechanical Engineering Congress Exposition, Tampa, FL, USA, 3–9 November 2017; p. V007T09A038. [Google Scholar]
  70. Kosmowski, I.; Hergt, P. Förderung gasbeladener Medien mit Hilfe von Normal-und Sonderausführungen von Kreiselpumpen. KSB Technical Report 26, 1990.
  71. Thum, D. Untersuchung von Homogenisierungseinrichtungen auf das Förderverhalten Radialer Kreiselpumpen bei Gasbeladenen Strömungen. Ph.D. Thesis, Technische Universität Kaiserslautern, Kaiserslautern, Germany, 2007. [Google Scholar]
  72. Barrios, L. Visualization and Modeling of Multiphase Performance inside an Electrical Submersible Pump. Ph.D. Thesis, Department of Petroleum Engineering, University of Tulsa, Tulsa, OK, USA, 2007. [Google Scholar]
  73. Barrios, L.; Prado, M.G. Experimental visualization of two-phase flow inside an electrical submersible pump stage. J. Energy Resour. Technol. 2011, 133, 042901. [Google Scholar] [CrossRef]
  74. Zhang, J.; Cai, S.; Li, Y.; Zhu, H.; Zhang, Y. Visualization study of gas–liquid two-phase flow patterns inside a three-stage rotodynamic multiphase pump. Exp. Therm. Fluid Sci. 2016, 70, 125–138. [Google Scholar] [CrossRef]
  75. Shao, C.; Li, C.; Zhou, J. Experimental investigation of flow patterns and external performance of a centrifugal pump that transports gas-liquid two-phase mixtures. Int. J. Heat Fluid Flow 2018, 71, 460–469. [Google Scholar] [CrossRef]
  76. Schäfer, T.; Bieberle, A.; Neumann, M.; Hampel, U. Application of gamma-ray computed tomography for the analysis of gas holdup distributions in centrifugal pumps. Flow Meas. Instrum. 2015, 46, 262–267. [Google Scholar] [CrossRef]
  77. Neumann, M.; Schäfer, T.; Bieberle, A.; Hampel, U. An experimental study on the gas entrainment in horizontally and vertically installed centrifugal pumps. J. Fluids Eng. 2016, 138, 91301. [Google Scholar] [CrossRef]
  78. Murakami, M.; Minemura, K.; Takimoto, M. Effects of entrained air on the performance of centrifugal pumps under cavitating conditions. Bull. JSME 1980, 23, 1435–1442. [Google Scholar] [CrossRef]
  79. Sekoguchi, K.; Takada, S.; Kanemori, Y. Study of air-water two-phase centrifugal pump by means of electric resistivity probe technique for void fraction measurement: 1st report, measurement of void fraction distribution in a radial flow impeller. Bull. JSME 1984, 27, 931–938. [Google Scholar] [CrossRef]
  80. Sato, S.; Furukawa, A.; Takamatsu, Y. Air-water two-phase flow performance of centrifugal pump impellers with various blade angles. JSME Int. J. Ser. B Fluids Therm. Eng. 1996, 39, 223–229. [Google Scholar] [CrossRef]
  81. Zhu, J. Experiments, CFD Simulation and Modeling of ESP Performance under Gassy Conditions. Ph.D. Thesis, Department of Petroleum Engineering, University of Tulsa, Tulsa, OK, USA, 2017. [Google Scholar]
  82. Mansour, M. Transport of Two-Phase Air-Water Flows in Radial Centrifugal pumps. Ph.D. Thesis, University of Magdeburg, Magdeburg, Germany, 2020. [Google Scholar]
  83. Sterrett, J.D. An Experimental and Analytical Investigation into the Performance of Centrifugal Pumps Operating with Air-Water Mixtures. Ph.D. Thesis, Auburn University, Auburn, AL, USA, 1994. [Google Scholar]
  84. Serena, A. A Multiphase Pump Experimental Analysis. Ph.D. Thesis, Norwegian University of Science and Technology, Trondheim, Norway, 2016. [Google Scholar]
  85. Ge, Z.; He, D.; Huang, R.; Zuo, J.; Luo, X. Application of CFD-PBM coupling model for analysis of gas-liquid distribution characteristics in centrifugal pump. J. Pet. Sci. Eng. 2020, 194, 107518. [Google Scholar] [CrossRef]
  86. Murakami, M.; Minemura, K. Effects of entrained air on the performance of centrifugal pumps: 2nd report, effects of number of blades. Bull. JSME 1974, 17, 1286–1295. [Google Scholar] [CrossRef]
  87. Merry, H. Effects of two-phase liquid/gas flow on the performance of centrifugal pumps. In Proceedings of the Pumps Compressors Offshore Oil Gas, IMechE Conference C130/76, London, UK, 1976; p. 61. [Google Scholar]
  88. Furukawa, A.; Kuwano, T.; Okuma, K. Air-water two-phase flow performance of centrifugal pump with tandem circular cascades. Proc. JSME ICFE 1997, 97, 479–484. [Google Scholar]
  89. Furukawa, A.; Shirasu, S.; Sato, S. Experimental study of gas-liquid two-phase flow pumping action of centrifugal impeller. Proc. ASME Conf. Fed 1995, 226, 89–96. [Google Scholar]
  90. Mansour, M.; Kopparthy, S.B.; Thévenin, D. Improving air-water two-phase flow pumping in centrifugal pumps using novel grooved front shrouds. Chem. Eng. Res. Des. 2023, 197, 173–191. [Google Scholar] [CrossRef]
  91. Mansour, M.; Parikh, T.; Engel, S.; Thévenin, D. Numerical investigations of gas-liquid two-phase flow in a pump inducer. J. Fluids Eng. 2019, 142, 021302. [Google Scholar] [CrossRef]
  92. Mansour, M.; Parikh, T.; Thévenin, D. Influence of blade pitch and number of blades of a pump inducer on single and two-phase flow performance. In Proceedings of the ASME Turbo Expo 2020: Turbomachinery Technical Conference and Exposition. American Society of Mechanical Engineers, London, UK, 21–25 June 2020; Volume 9, p. V009T21A010. [Google Scholar]
  93. Moffat, R.J. Describing the uncertainties in experimental results. Exp. Therm. Fluid Sci. 1988, 1, 3–17. [Google Scholar] [CrossRef]
  94. Soave, G. Equilibrium constants from a modified Redlich-Kwong equation of state. Chem. Eng. Sci. 1972, 27, 1197–1203. [Google Scholar] [CrossRef]
  95. Peng, D.Y.; Robinson, D.B. A new two-constant equation of state. Ind. Eng. Chem. Fund. 1976, 15, 59–64. [Google Scholar] [CrossRef]
  96. Guo, X.M.; Zhu, Z.C.; Shi, G.P.; Huang, Y. Effects of rotational speeds on the performance of a centrifugal pump with a variable-pitch inducer. J. Hydrodyn. Ser. B 2017, 29, 854–862. [Google Scholar] [CrossRef]
  97. Moore, J. A Wake and an Eddy in a Rotating, Radial-Flow Passage—Part 1: Experimental Observations. J. Eng. Power 1973, 95, 205–212. [Google Scholar] [CrossRef]
Figure 1. Gas–liquid two-phase flow patterns observed in centrifugal impellers at 900 rpm in reference [38].
Ijtpp 08 00042 g001
Figure 2. Stages of gas accumulation for a steam–water two-phase flow, as observed in reference [11].
Ijtpp 08 00042 g002
Figure 3. High-speed observations for the air–water flow with a density ratio of 830 inside the impeller channel at 1200 rpm from reference [73].
Ijtpp 08 00042 g003
Figure 4. Gas accumulation and air–water two-phase flow regimes in the radial pump impeller passages at 2000 rpm, as detected in reference [24]. The amount of gas increases gradually from (AD).
Ijtpp 08 00042 g004
Figure 5. Schematic explanation for the location of gas accumulation according to the incidence angle.
Ijtpp 08 00042 g005
Figure 6. Pump details.
Ijtpp 08 00042 g006
Figure 7. Geometrical details of the impellers.
Ijtpp 08 00042 g007
Figure 8. Details of the considered trailing edges.
Ijtpp 08 00042 g008
Figure 9. Inducer geometrical details.
Ijtpp 08 00042 g009
Figure 10. Schematic sketch of the experimental set-up.
Ijtpp 08 00042 g010
Figure 11. Illustration of measurements of the bubble size distribution.
Ijtpp 08 00042 g011
Figure 12. Experimental approaches used for measuring the two-phase flow performance.
Ijtpp 08 00042 g012
Figure 13. Comparison of the single-phase performance curves at 650 rpm.
Ijtpp 08 00042 g013
Figure 14. Comparison of the single-phase performance curves for 650 and 1000 rpm using a semi-open impeller with trimmed trailing edge.
Ijtpp 08 00042 g014
Figure 15. Performance of the closed impeller for constant gas volume fractions.
Ijtpp 08 00042 g015
Figure 16. Normalized specific delivery work of the closed impeller recorded by the 1 st approach (filled markers and dotted curves) and the 2 nd approach (empty markers and dashed curves).
Ijtpp 08 00042 g016
Figure 17. Performance of the semi-open impeller with a standard gap for constant gas volume fractions.
Ijtpp 08 00042 g017aIjtpp 08 00042 g017b
Figure 18. Normalized specific delivery work of the semi-open impeller with a standard gap recorded by 1 st (filled markers and dotted curves) and 2 nd (empty markers and dashed curves) s.
Ijtpp 08 00042 g018
Figure 19. Performance of the semi-open impeller with an increased gap for constant gas volume fractions.
Ijtpp 08 00042 g019aIjtpp 08 00042 g019b
Figure 20. Normalized specific delivery work of the semi-open impeller with an increased gap recorded by 1 st (filled markers and dotted curves) and 2 nd (empty markers and dashed curves) approaches.
Ijtpp 08 00042 g020
Figure 21. Performance of the semi-open impeller with a standard gap and inducer for constant gas volume fractions.
Ijtpp 08 00042 g021
Figure 22. Normalized specific delivery work of the semi-open impeller with the standard gap and inducer recorded by 1 st (filled markers and dotted curves) and 2 nd (empty markers and dashed curves) approaches.
Ijtpp 08 00042 g022
Figure 23. Performance of the semi-open impeller with a standard gap and trimmed trailing edge (TTE) at 650 rpm for constant gas volume fractions.
Ijtpp 08 00042 g023aIjtpp 08 00042 g023b
Figure 24. Normalized specific delivery work of the semi-open impeller with trimmed trailing edge (TTE) recorded by the first approach (filled markers and dotted curves) and the second approach (empty markers and dashed curves).
Ijtpp 08 00042 g024
Figure 25. Performance of the semi-open impeller with a standard gap and trimmed trailing edge (TTE) at 1000 rpm for constant gas volume fractions.
Ijtpp 08 00042 g025aIjtpp 08 00042 g025b
Figure 26. Normalized specific delivery work of the semi-open impeller with trimmed trailing edge (TTE), at 1000 rpm, recorded by the first approach (filled markers and dotted curves) and the second approach (empty markers and dashed curves).
Ijtpp 08 00042 g026
Figure 27. Degradation of the specific delivery work as a function of gas volume fraction (gray markers indicate surging conditions). (a) Closed impeller. (b) Semi-open impeller with a standard gap. (c) Semi-open impeller with an increased gap. (d) Semi-open impeller with a standard gap and inducer. (e) Semi-open impeller with a standard gap and trimmed trailing edge (TTE) at 650 rpm. (f) Semi-open impeller with a standard gap and trimmed trailing edge (TTE) at 1000 rpm.
Ijtpp 08 00042 g027
Figure 28. Comparison of degradation of the specific delivery work as a function of gas volume fraction at Q w / Q o p t = 1.0 for all different pump configurations considered.
Ijtpp 08 00042 g028
Figure 29. Standard deviation of Q w as a measure of the intensity of the flow instabilities. (a) Closed impeller; (b) Semi-open impeller with a standard gap; (c) Semi-open impeller with an increased gap; (d) Semi-open impeller with a standard gap and inducer; (e) Semi-open impeller with a standard gap and trimmed trailing edge (TTE); (f) Semi-open impeller with a standard gap and trimmed trailing edge (TTE) at 1000 rpm.
Ijtpp 08 00042 g029
Figure 30. Normalized specific delivery work for constant air flow rates. (a) Closed impeller; (b) Semi-open impeller with a standard gap; (c) Semi-open impeller with an increased gap; (d) Semi-open impeller with a standard gap and inducer; (e) Semi-open impeller with a standard gap and trimmed trailing edge (TTE); (f) Semi-open impeller with a standard gap and trimmed trailing edge (TTE) at 1000 rpm.
Ijtpp 08 00042 g030
Figure 31. Regimes observed in the closed impeller.
Ijtpp 08 00042 g031
Figure 32. Regimes observed in the semi-open impeller with the standard gap.
Ijtpp 08 00042 g032
Figure 33. Regimes observed in the semi-open impeller with an increased gap.
Ijtpp 08 00042 g033
Figure 34. Regimes observed in the semi-open impeller with a standard gap and inducer.
Ijtpp 08 00042 g034
Figure 35. Regimes observed in the trimmed trailing edge semi-open impeller with a standard gap.
Ijtpp 08 00042 g035
Figure 36. Regimes observed in the semi-open impeller with a standard gap and trimmed trailing edge (TTE) at 1000 rpm.
Ijtpp 08 00042 g036
Figure 37. Detailed maps for the two-phase flow regimes in each pump configuration.
Ijtpp 08 00042 g037aIjtpp 08 00042 g037b
Figure 38. Bubble size distributions for different pump configurations. (a) Closed impeller, ε = 0.25 % . (b) Closed impeller, ε = 0.5 % . (c) Semi-open impeller with the standard gap, ε = 0.25 % . (d) Semi-open impeller with a standard gap, ε = 0.5 % . (e) Semi-open impeller with an increased gap, ε = 0.25 % . (f) Semi-open impeller with an increased gap, ε = 0.5 % . (g) Semi-open impeller with a standard gap and inducer, ε = 0.25 % . (h) Semi-open impeller with a standard gap and inducer, ε = 0.5 % .
Ijtpp 08 00042 g038
Figure 39. Comparison of bubble size distributions.
Ijtpp 08 00042 g039
Table 1. Impeller geometrical dimensions.
ParameterSymbolValue
Impeller outer to inlet diameter ratio D 2 / D 1 2.1
Blade thicknessE6 mm
Blade inlet angle β 1 24
Blade outlet angle β 2 24
Inducer hub to tip diameter ratio D h / D t 41.85 %
Inducer hub solidity σ h = C h / P h 2.836
Inducer tip solidity σ t = C t / P t 1.807
Inducer area solidity σ a 23.326 %
Inducer hub blade angle θ h 58
Inducer tip blade angle θ t 34
Inducer sweep angle φ 29.4
Inducer hub blade thickness t h / D s 7.26 %
Inducer tip blade thickness t t / D s 6.22 %
Inducer blade axial length L b / D s 1.0
Standard tip clearance gap to blade outlet width S / b 2 2.5 %
Increased tip clearance gap to blade outlet width S / b 2 5 %
Inducer tip clearance gap to blade outlet width S i / b 2 12.5 %
Table 2. Measurement instrument specifications and uncertainties.
DeviceModelUncertainty
Water volume flow meterEndress+Hauser Promag 30 F ± 0.5 % RD
Air mass flow meterBronkhorst F-113AC-HD-55-V ± 0.5 % RD plus ± 0.1 % FS
Differential pressure sensorDeltabar M PMD55 (−3:+3 bar) ± 0.1 % FS
Suction pressure sensorSensotec Z ± 0.25 % FS
Suction temperature sensorPt100 Sensor Probe, Class B ± 0.3 K (max. absolute error)
Torque transducerHBM T1 ± 0.4 % FS
Analog tachometerTDP 0.2 LT-4 ± 1 % RD
Table 3. Details of all considered pump configurations.
#Impeller TypeTip Clearance GapBlade Trailing EdgeWith InducerRotational Speed
1ClosedNo gapRoundNo650 rpm
2Semi-openStandard gapRoundNo650 rpm
3Semi-openIncreased gapRoundNo650 rpm
4Semi-openStandard gapRoundYes650 rpm
5Semi-openStandard gapTrimmedNo650 rpm
6Semi-openStandard gapTrimmedNo1000 rpm
Table 4. Flow conditions of the experiments.
ParameterRangeUnit
Normalized water volume flow rate, Q w / Q o p t 0.1–1.6
Gas volume fraction, ε 0–15%
Suction pressure, p S 1.06–1.28 bar
Suction temperature, T 299 ± 3 K
Rotational speed, n 650 & 1000 rpm
Rotational Reynolds number of water at 650 rpm , Re ω 9,181,340
Rotational Reynolds number of water at 1000 rpm , Re ω 14,125,138
Density ratio, D R = ρ w / ρ a 670–810
Disclaimer/Publisher’s Note: The statements, opinions and data contained in all publications are solely those of the individual author(s) and contributor(s) and not of MDPI and/or the editor(s). MDPI and/or the editor(s) disclaim responsibility for any injury to people or property resulting from any ideas, methods, instructions or products referred to in the content.

