Article

In Silico Analysis Highlights Potential Predictive Indicators Associated with Secondary Progressive Multiple Sclerosis

IRCCS Centro Neurolesi “Bonino-Pulejo”, Via Provinciale Palermo, Contrada Casazza, 98124 Messina, Italy
*
Author to whom correspondence should be addressed.
Int. J. Mol. Sci. 2024, 25(6), 3374; https://doi.org/10.3390/ijms25063374
Submission received: 16 February 2024 / Revised: 12 March 2024 / Accepted: 15 March 2024 / Published: 16 March 2024
(This article belongs to the Section Molecular Informatics)

Abstract

:
Multiple sclerosis (MS) is a complex inflammatory disease affecting the central nervous system. Most commonly, it begins with recurrent symptoms followed by partial or complete recovery, known as relapsing–remitting MS (RRMS). Over time, many RRMS patients progress to secondary progressive MS (SPMS), marked by gradual symptom deterioration. The factors triggering this transition remain unknown, lacking predictive biomarkers. This study aims to identify blood biomarkers specific to SPMS. We analyzed six datasets of SPMS and RRMS patients’ blood and brain tissues, and compared the differential expressed genes (DEGs) obtained to highlight DEGs reflecting alterations occurring in both brain and blood tissues and the potential biological processes involved. We observed a total of 38 DEGs up-regulated in both blood and brain tissues, and their interaction network was evaluated through network analysis. Among the aforementioned DEGs, 21 may be directly involved with SPMS transition. Further, we highlighted three biological processes, including the calcineurin–NFAT pathway, related to this transition. The investigated DEGs may serve as a promising means to monitor the transition from RRMS to SPMS, which is still elusive. Given that they can also be sourced from blood samples, this approach could offer a relatively rapid and convenient method for monitoring MS and facilitating expedited assessments.

1. Introduction

Multiple sclerosis (MS) is a complex inflammatory demyelinating disease that affects the central nervous system (CNS) [1]. Its origin is believed to result from intricate interactions between genetic and environmental factors, although the full details of these dynamics remain elusive [2]. Beyond its inflammatory characteristics, MS is also widely recognized as a neurodegenerative condition [3]. MS is a condition that exhibits a low incidence during childhood but undergoes a notable increase after the age of 18. Its prevalence peaks between the ages of 20 and 40 years, with the average onset occurring around 30 years, and women typically experience symptoms 2–5 years earlier than men [4]. In Europe, MS occurs at a rate of approximately 83 cases per 100,000 individuals, and the mean annual incidence rate hovers around 4.3 cases per 100,000 [5]. Individuals diagnosed with MS face a reduced life expectancy, with a shortening of their life span by 7–10 years. Although the standardized mortality ratio has tripled, there has been discernible improvement in this ratio over the last few decades [6]. Despite advancements in medical understanding, the primary trigger for the immune response in MS remains unidentified. In the initial phases of the inflammatory cascade, a reaction is triggered against myelin antigens, encompassing the myelin basic protein, proteolipid protein, myelin/oligodendrocyte glycoproteins, and gangliosides. The lesions associated with MS are classified as acute, chronically active, and inactive. While lesions may manifest throughout the CNS, they are most frequently observed in the optic nerves, cerebral periventricular white matter, brainstem, and white-matter tracts of the spinal cord [7]. The course of MS exhibits considerable variability; however, in the majority of cases, it entails the onset of recurrent clinical symptoms followed by either complete or partial recovery, a characteristic feature of the classic relapsing–remitting form of MS (RRMS). However, approximately 15% of individuals with MS experience relentless disease progression from the onset, known as primary progressive MS (PPMS) [8]. After 10–15 years of the disease, nearly 50% of untreated RRMS patients enter a progressive phase characterized by a slow and continuous deterioration of clinical symptoms over many years. This stage is termed secondary progressive multiple sclerosis (SPMS) [9]. Nevertheless, studies have demonstrated that frequent relapses within the initial 2 years are correlated with later disability, increasing the likelihood of developing SPMS and shortening the latency of its onset [10]. Identifying the precise point of the transition to SPMS can be challenging and is often acknowledged only retrospectively, sometimes years after subtle signs of progression first emerge [11]. The investigation into MS remains dynamic, as many aspects of its intricate pathogenesis remain unknown, leading to a lack of curative medications for affected individuals. Ongoing research aims to explore potential imaging and laboratory biomarkers that can differentiate SPMS from RRMS, characterize the transition from RRMS to SPMS, and potentially predict this transition. While various therapies designed to impact the immune response against the CNS are in use, they primarily serve to slow down and/or mitigate the severity of the clinical course of MS. This sobering reality underscores the significance of exploring other components in the pathology of MS [12]. The use of transcriptomics data may provide helpful insights to better define MS etiopathogenesis [13]. To better elucidate the specific cellular mechanisms underlying SPMS compared to RRMS, and thus enable early identification of MS subtypes, we analyzed brain and blood expression datasets for SPMS compared to a group of healthy controls (HCs). Peripheral blood biomarkers furnish crucial insights into both the immune triggers of MS and the therapeutic efficacy of administered drugs [14]. Notably, the accessibility of blood surpasses that of other bodily tissues. Additionally, blood serves as a conduit for molecules originating from diverse tissues, offering a comprehensive reflection of the overall biological status of the body [15]. The aim of this study was to pinpoint DEGs that could contribute to a deeper comprehension of the transition from RRMS to SPMS. Additionally, we directed our investigation towards elucidating the significance of altered genes within cells, aiming to clarify their role in altered cellular mechanisms.

2. Results

In the present study, we analyzed MS databases containing information on gene expression data from blood and brain tissues of patients with SPMS and HCs. Our main focus was to provide useful information that may enable the identification of potential diagnostic, predictive, or treatment response biomarkers, as well as key biological pathways involved in the SPMS transition.

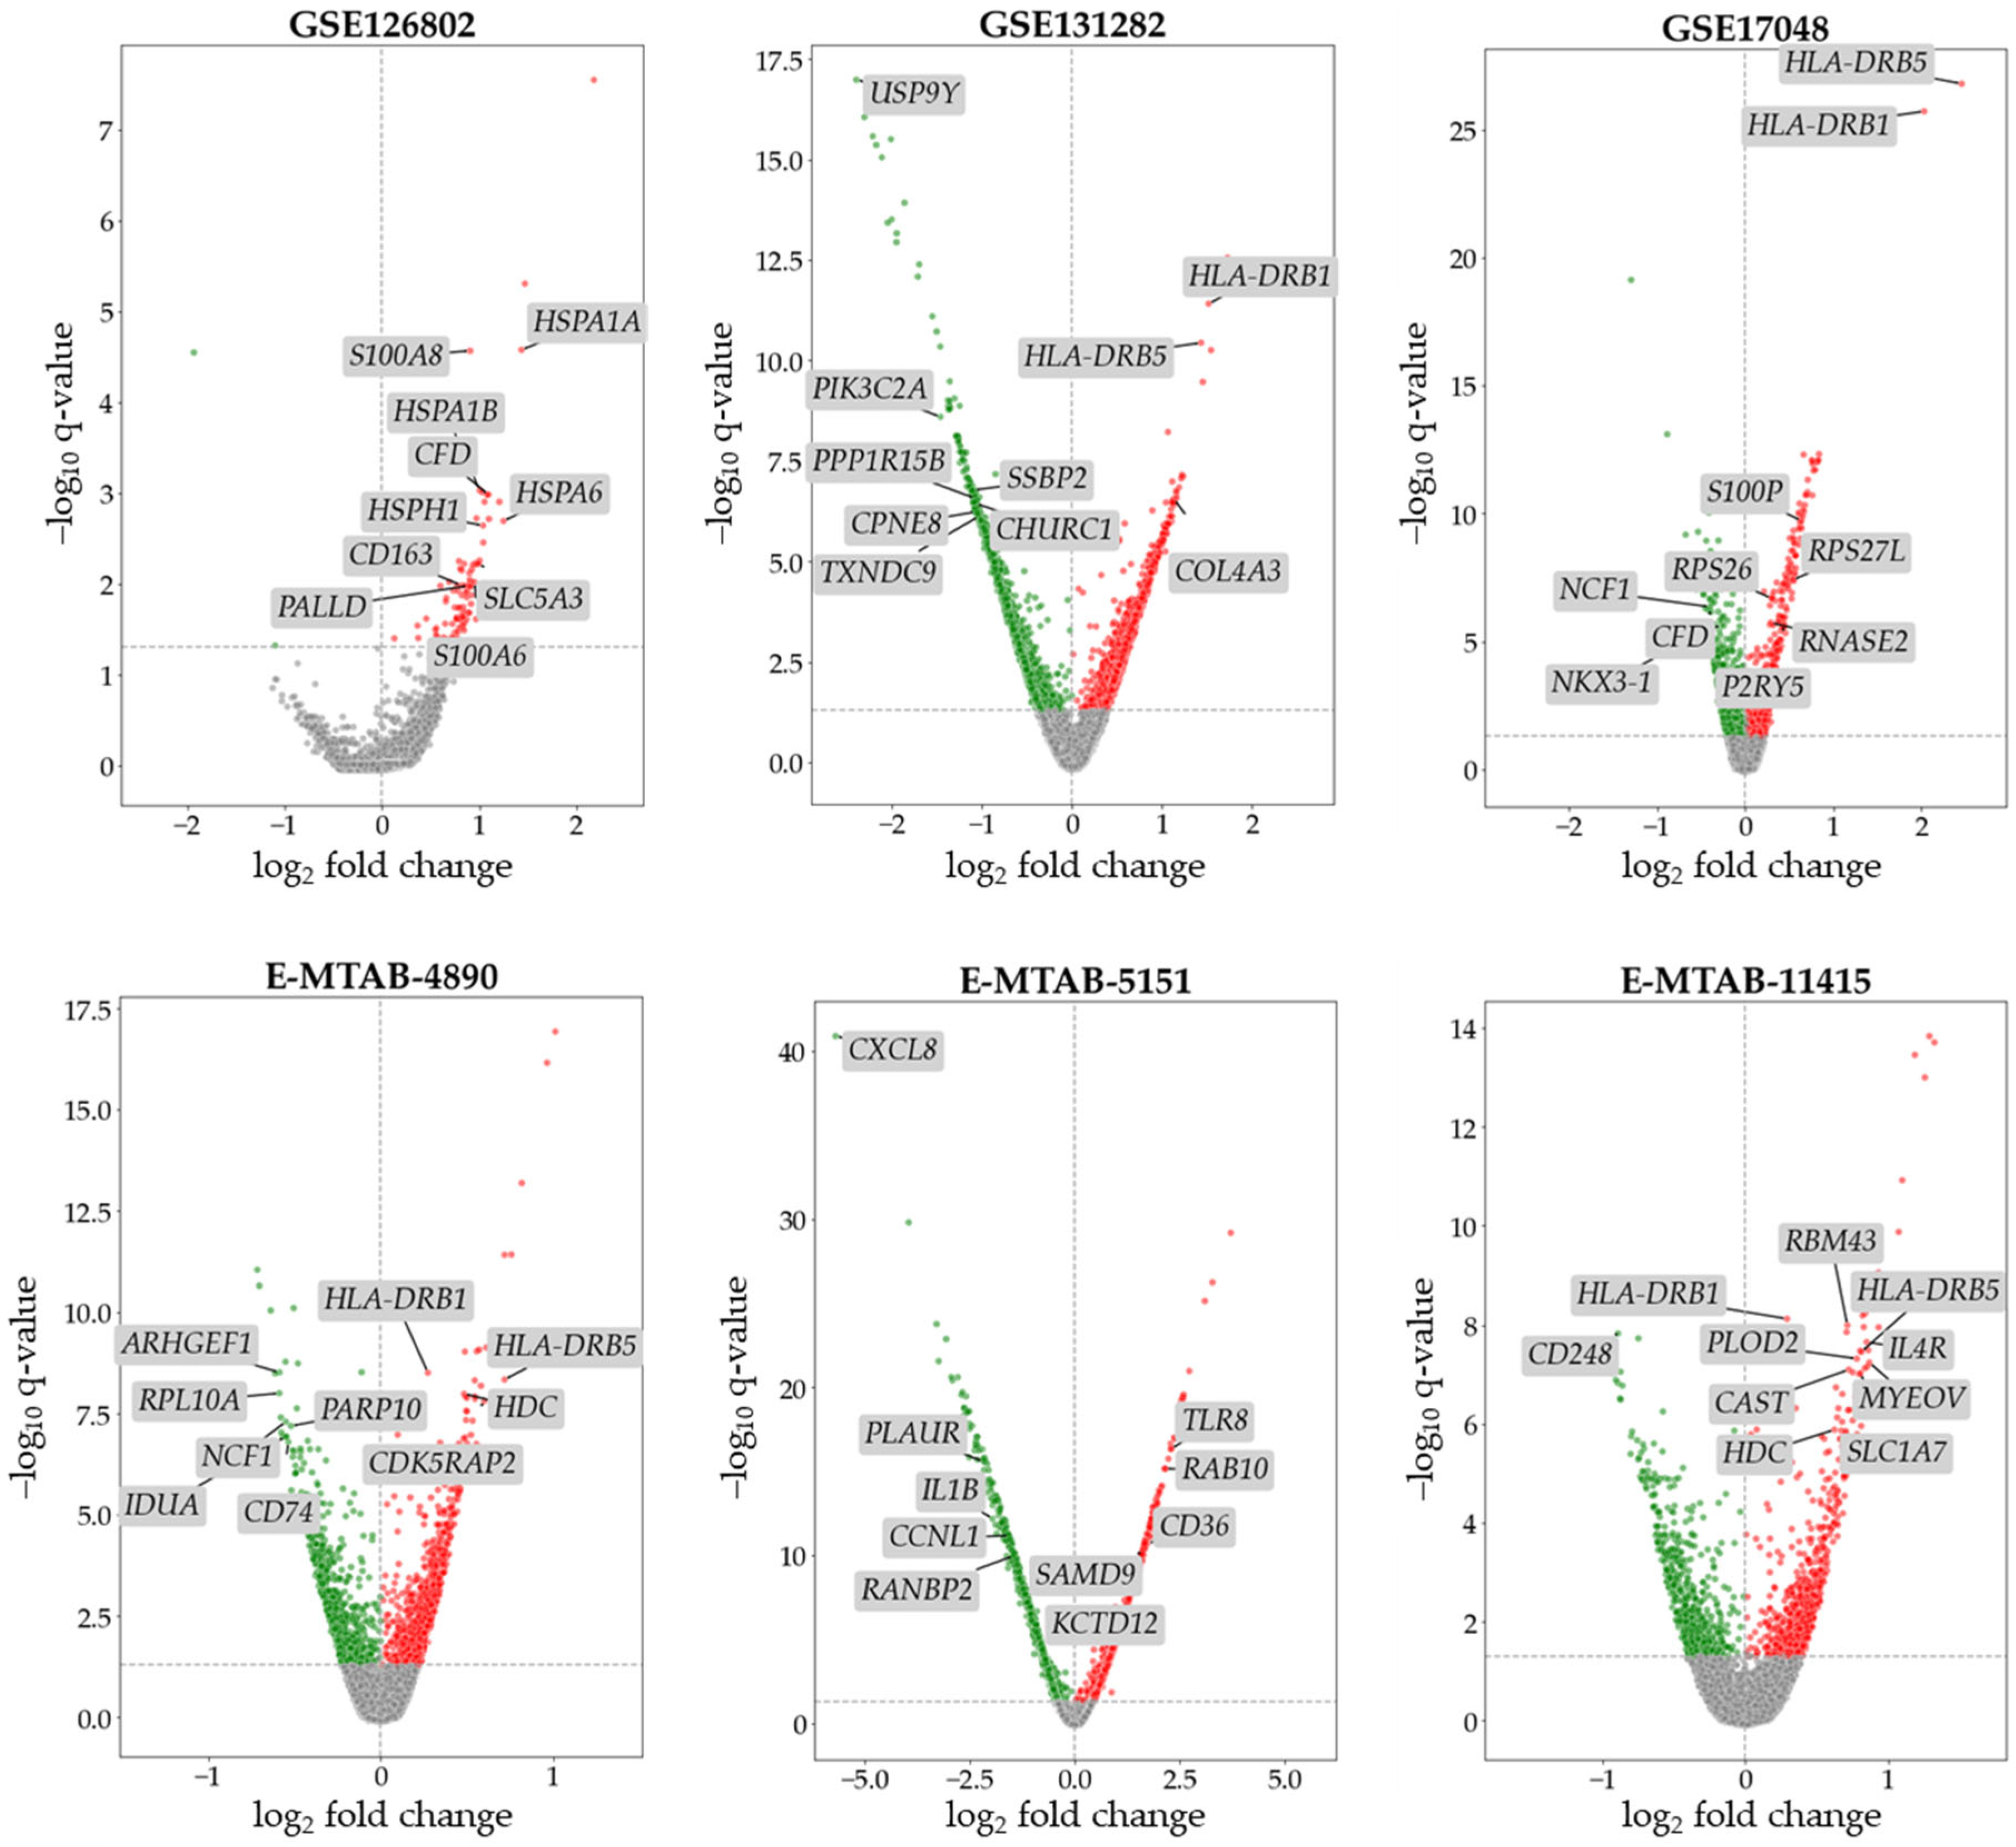
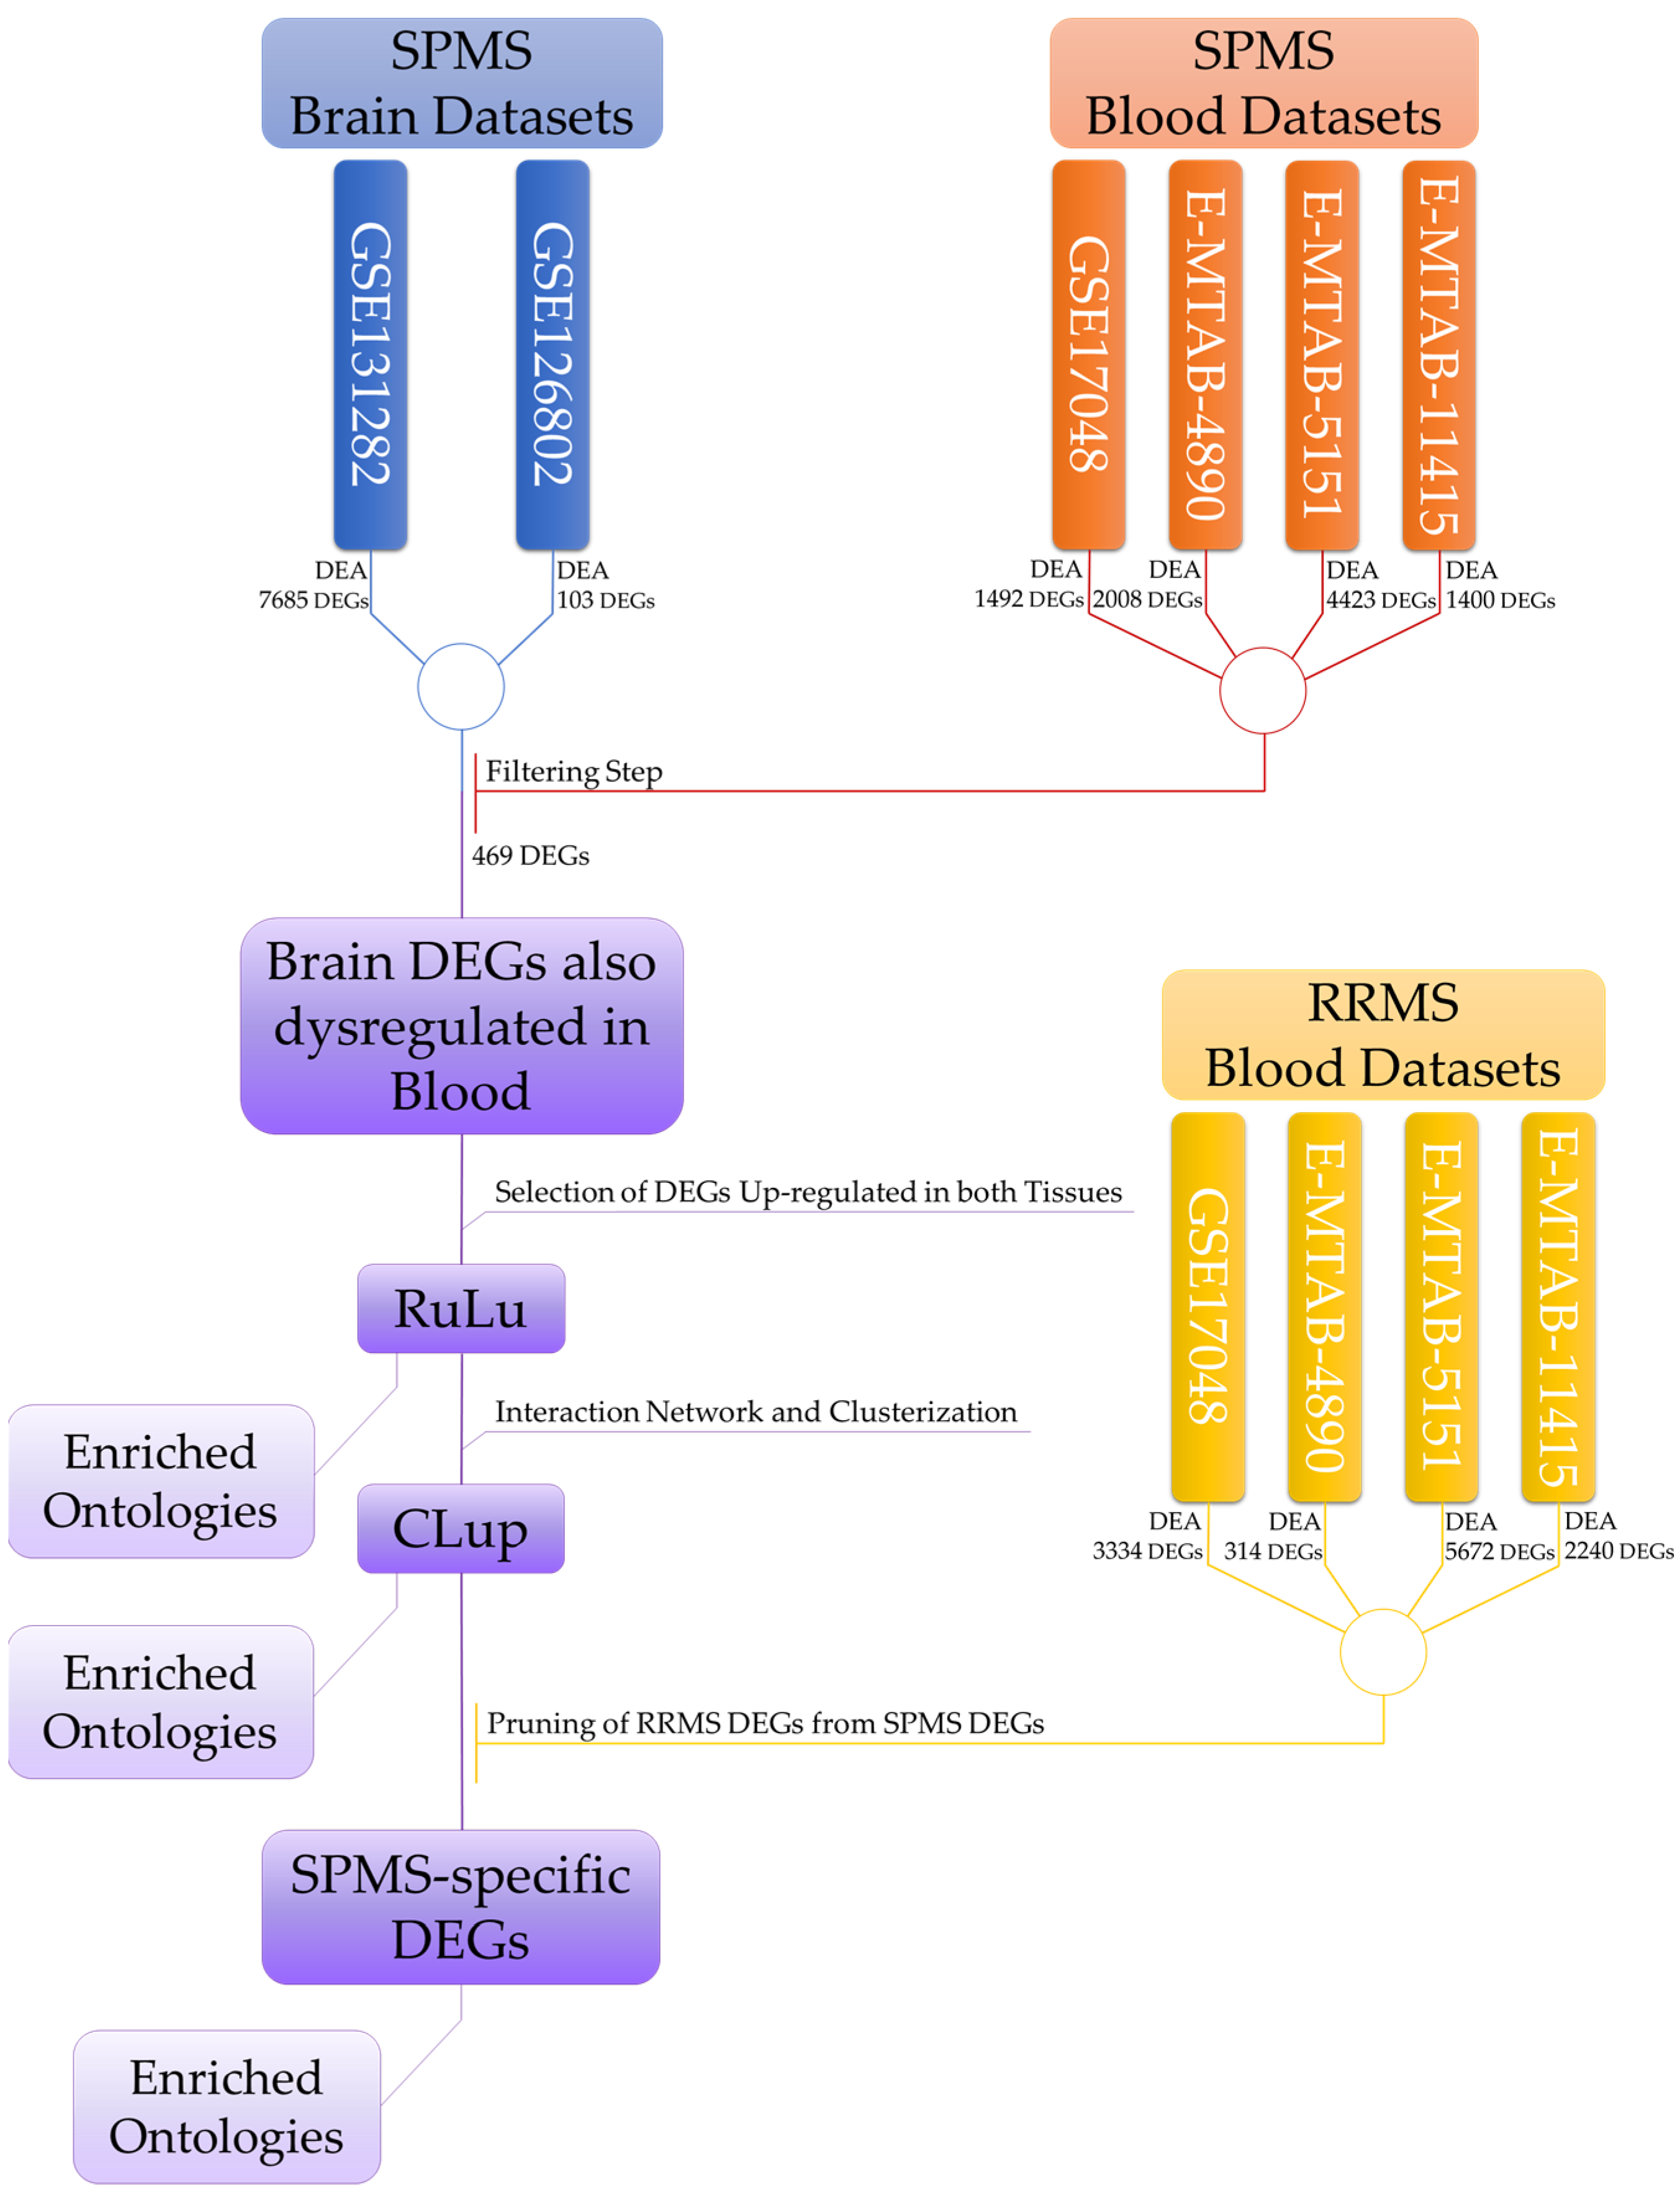
2.1. Differential Expression Analysis (DEA) of SPMS Data

The data collected from each dataset on SPMS patients and HCs were used to perform DEA, which constituted the first step of our analysis. This analysis aimed to provide a preliminary pool of DEGs to be further analyzed in the study’s following steps. We utilized the rank product method, through the BioTEA tool, to diminish biases related to the use of different samples/arrays. In the DEA, we highlighted a set of DEGs for each dataset. The results of the analysis are shown in Figure 1, where volcano plots summarize the distribution of up-regulated, down-regulated, and non-significant altered genes for each dataset. Specific details on the number, distribution, and names of the DEGs are reported in Supplementary Table S1.
As can be observed in Figure 1, the DEA returned heterogenous sets of DEGs. Interestingly, most of the top-ranking DEGs in each dataset were not replicated in other datasets, further stressing the heterogeneity and complexity of MS in general and the SPMS subtype in this specific case. As such, a filtering step was deemed necessary to select the DEGs shared among multiple datasets.

2.2. DEG Filtering and Selection

To identify the DEGs reflecting alterations occurring in both brain and blood tissues, we conducted a comparative analysis across the results obtained from the previous step. Specifically, we selected DEGs present in at least 50% of the brain datasets that were also identified as DEGs in the blood datasets with consistent expression patterns across at least 75% of the datasets. This filtering process yielded a set of 469 brain DEGs that exhibited differential expression in both brain and blood tissues, thereby representing potential biomarker candidates for the condition under study. The top 10 DEGs that survived the filtering step for each dataset are reported in Figure 1. From the filtered pool of DEGs, we further refined our selection by focusing on those that were up-regulated in both brain and blood tissues, resulting in a subset of 100 DEGs (referred to as RuLu). By focusing on up-regulated DEGs, we aimed to streamline the identification process and prioritize candidates with the potential to be used as robust biomarkers. This approach not only increased the likelihood of identifying clinically relevant markers, but also facilitated the translation of our research findings into practical diagnostic or therapeutic applications. Therefore, the selection of up-regulated DEGs aligned with the overarching objective of identifying actionable biomarkers with translational significance. Supplementary Figure S1 shows the number of DEGs that survived the filtering step, and Supplementary Table S2 provides the details concerning these genes.

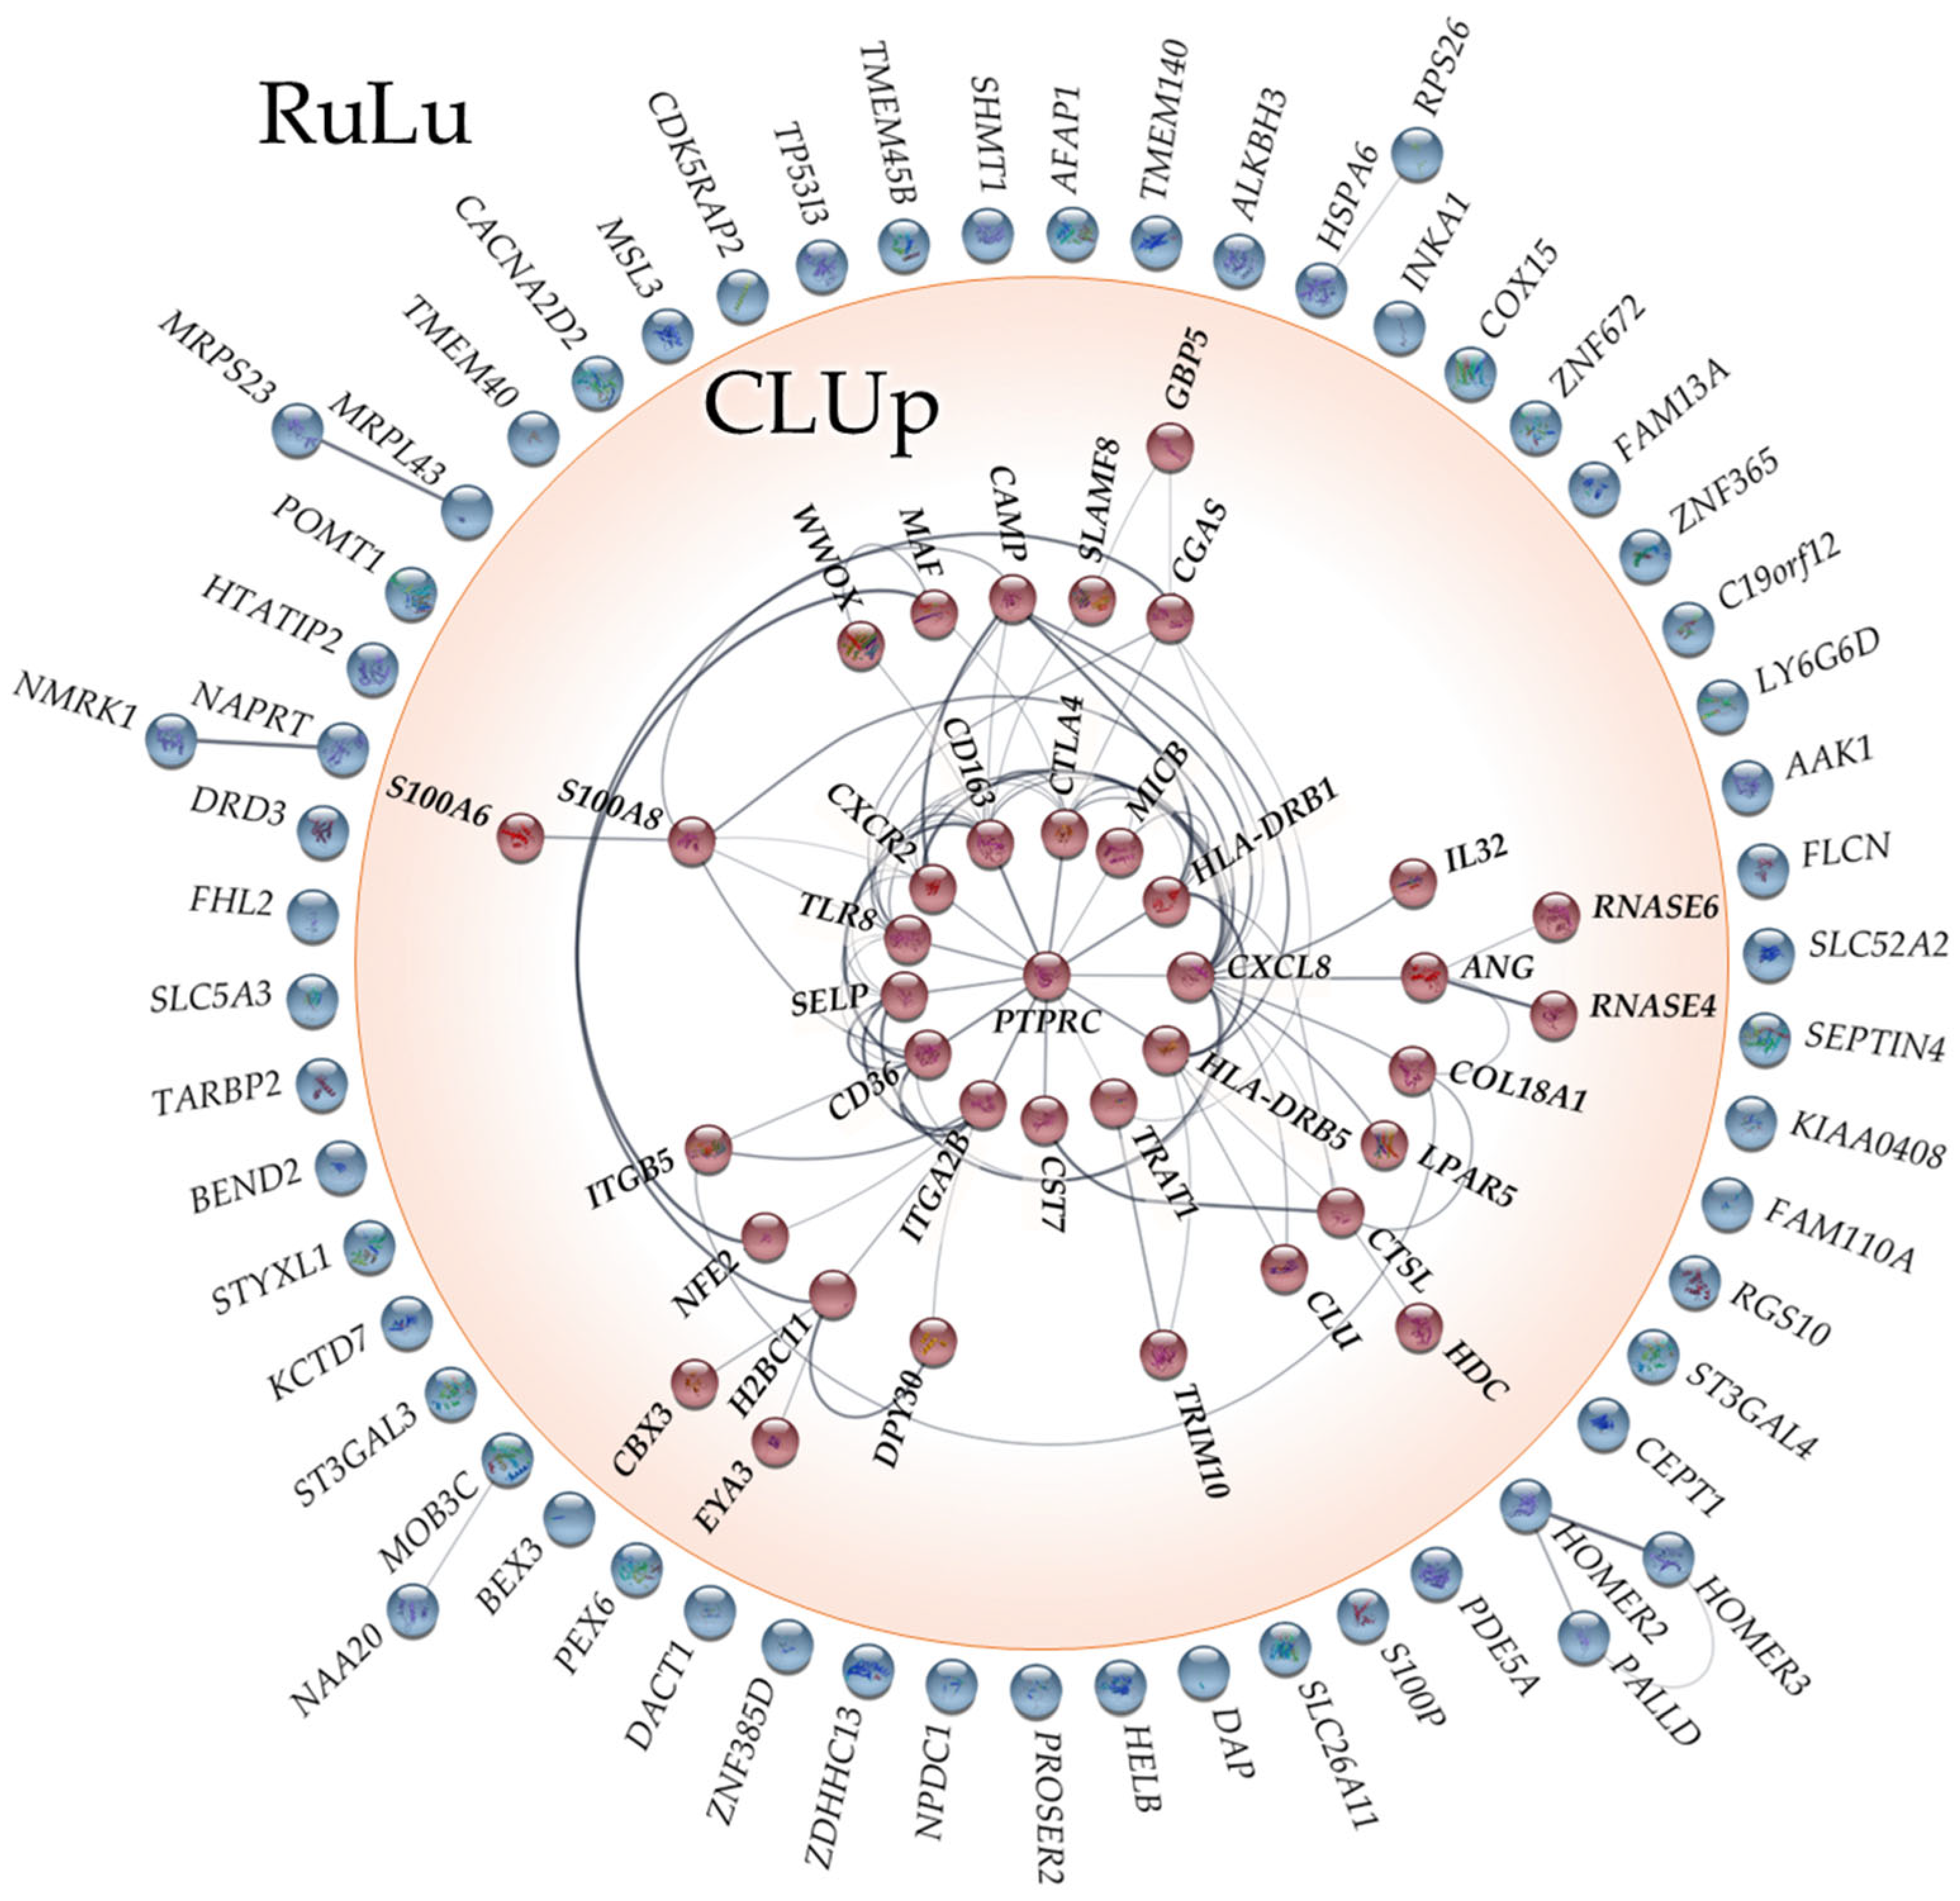
2.3. Network Analysis

The 100 identified Rulu DEGs were used as the input for a network analysis, utilizing the STRING plugin v2.0.2 within Cytoscape software v3.10.1. This analysis was performed with the aim of exploring and assessing potential interactions among the DEGs’ encoded proteins, to ultimately elucidate the interconnectedness of these proteins and evaluate their collective role in biological processes. The resulting network revealed a distinct subcluster, denoted as CLUp, comprising 38 DEGs. These 38 interconnected elements highlight the presence of potentially coordinated biological processes or pathways that may be perturbed in the context of the condition under investigation. Figure 2 illustrates the findings of the network analysis, providing valuable insights into the interconnectedness of the identified DEGs and their potential implications for understanding disease mechanisms.

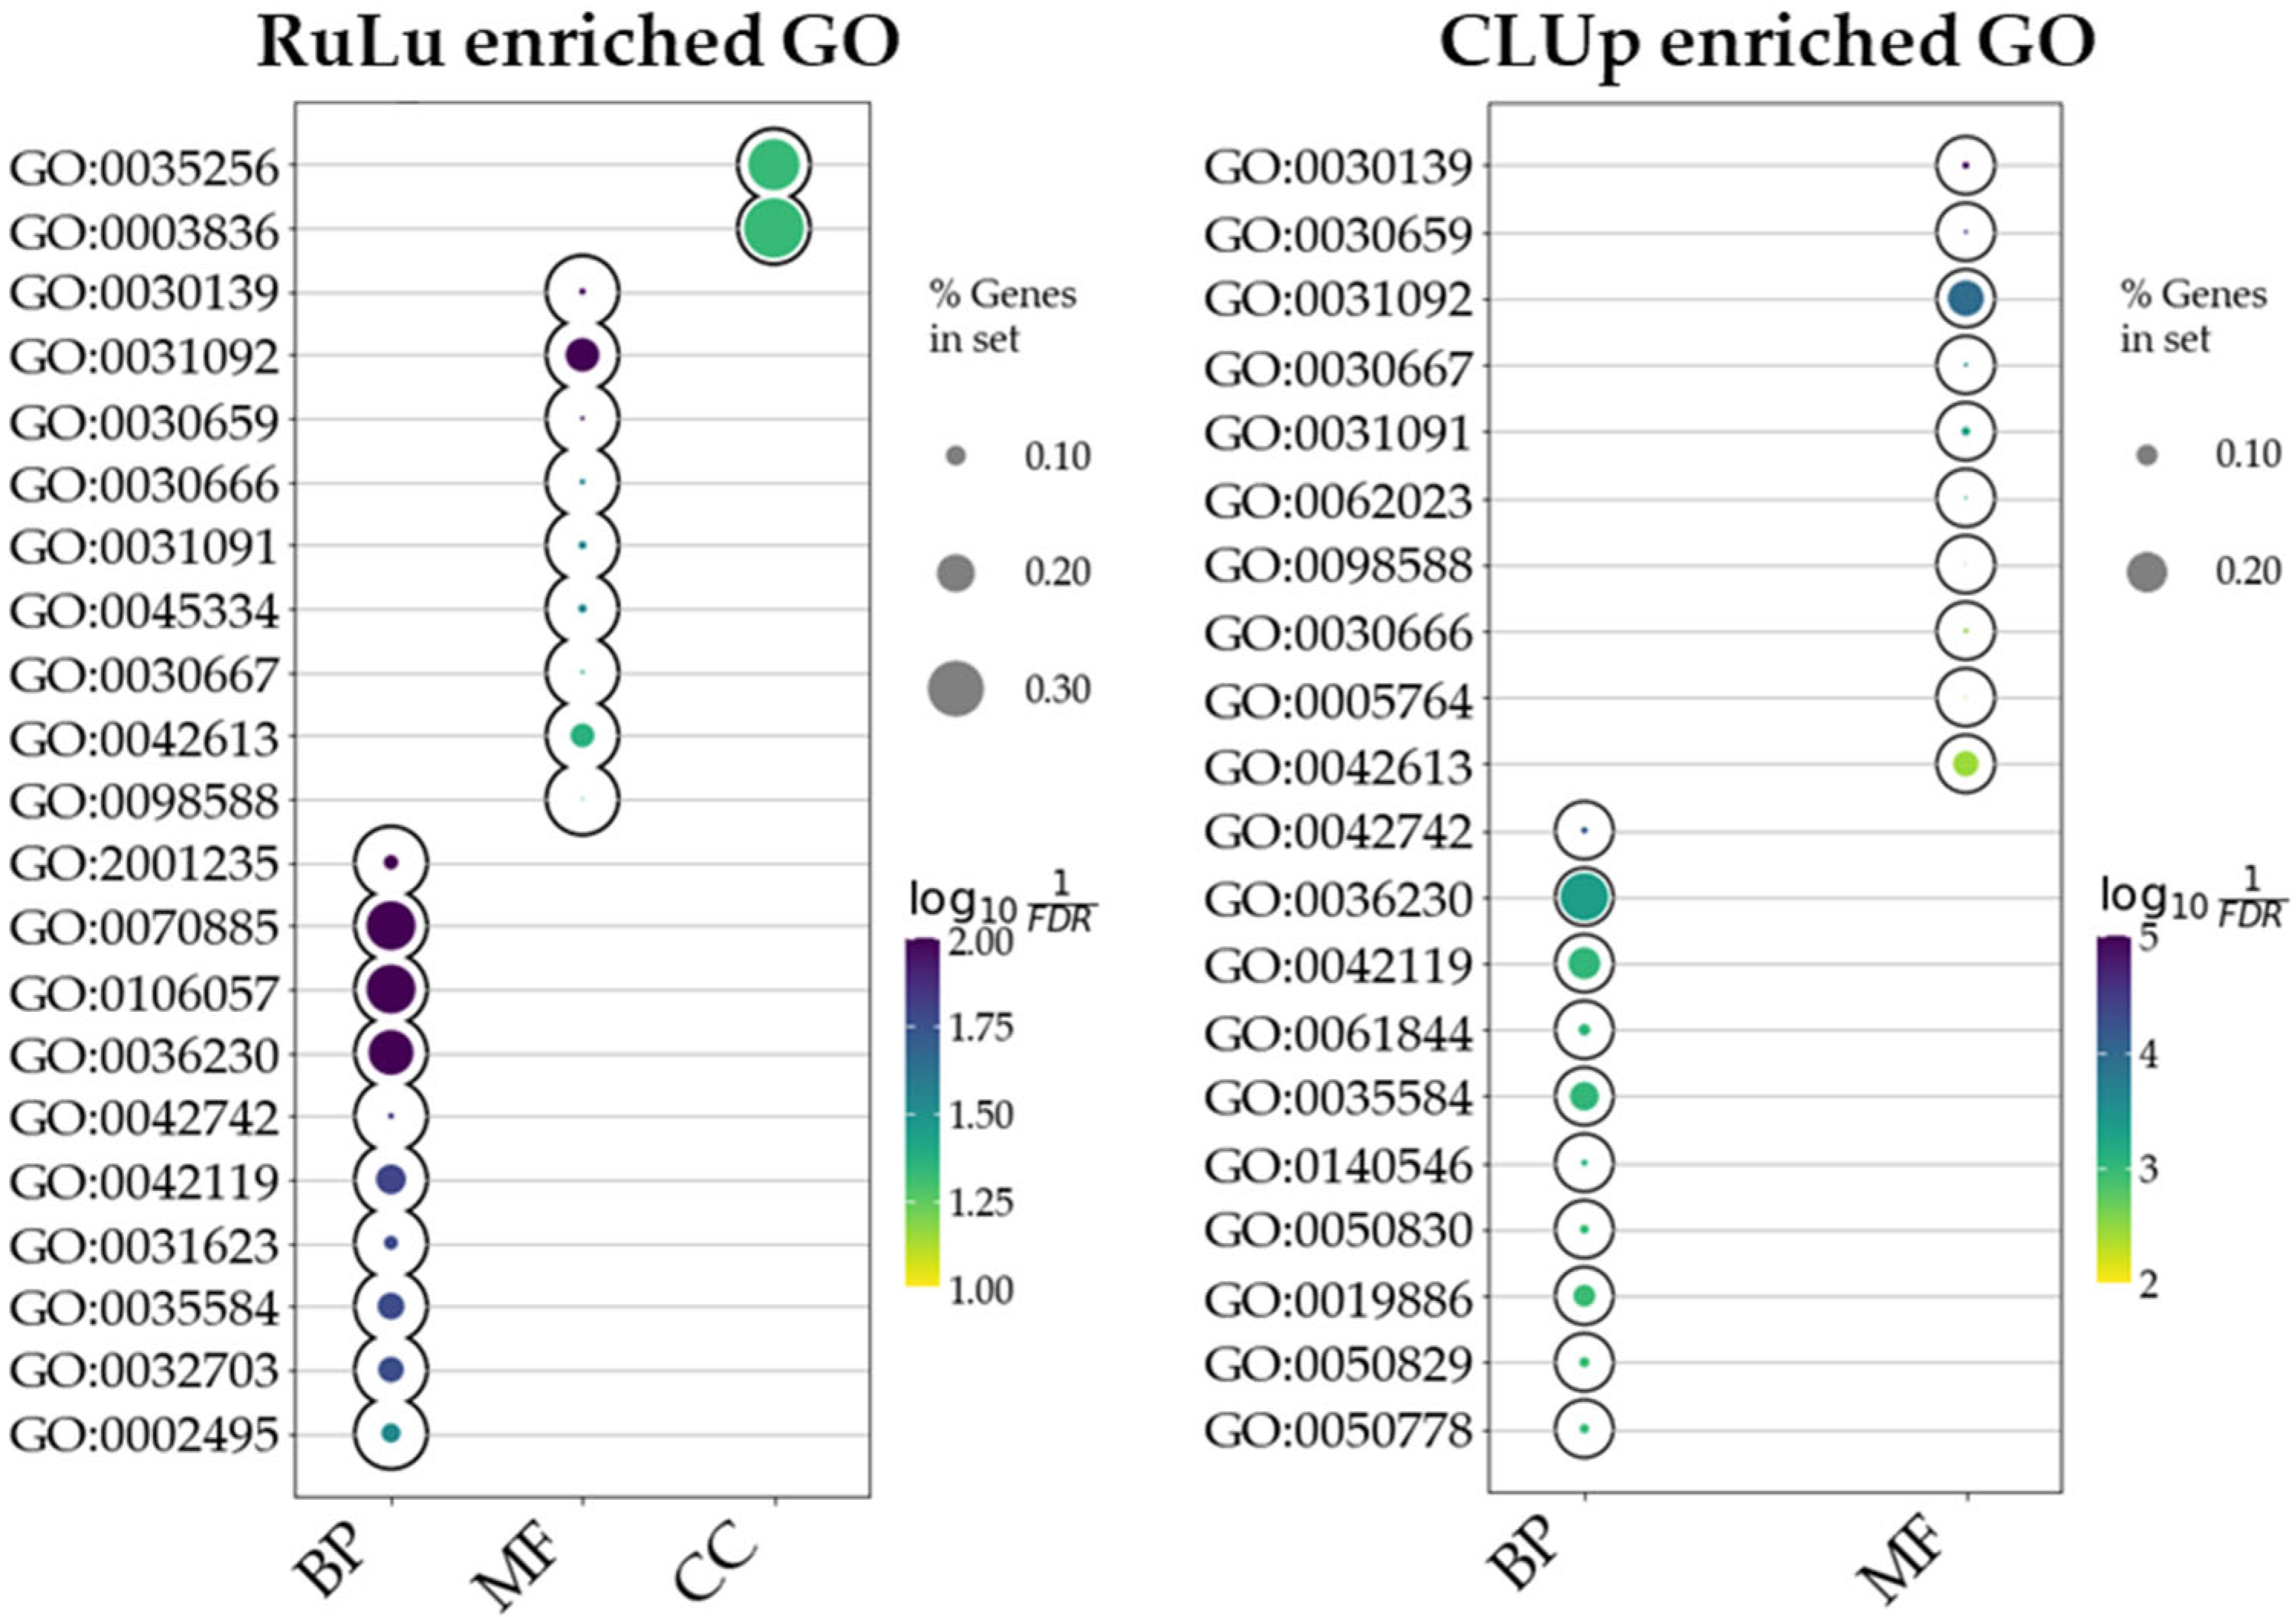
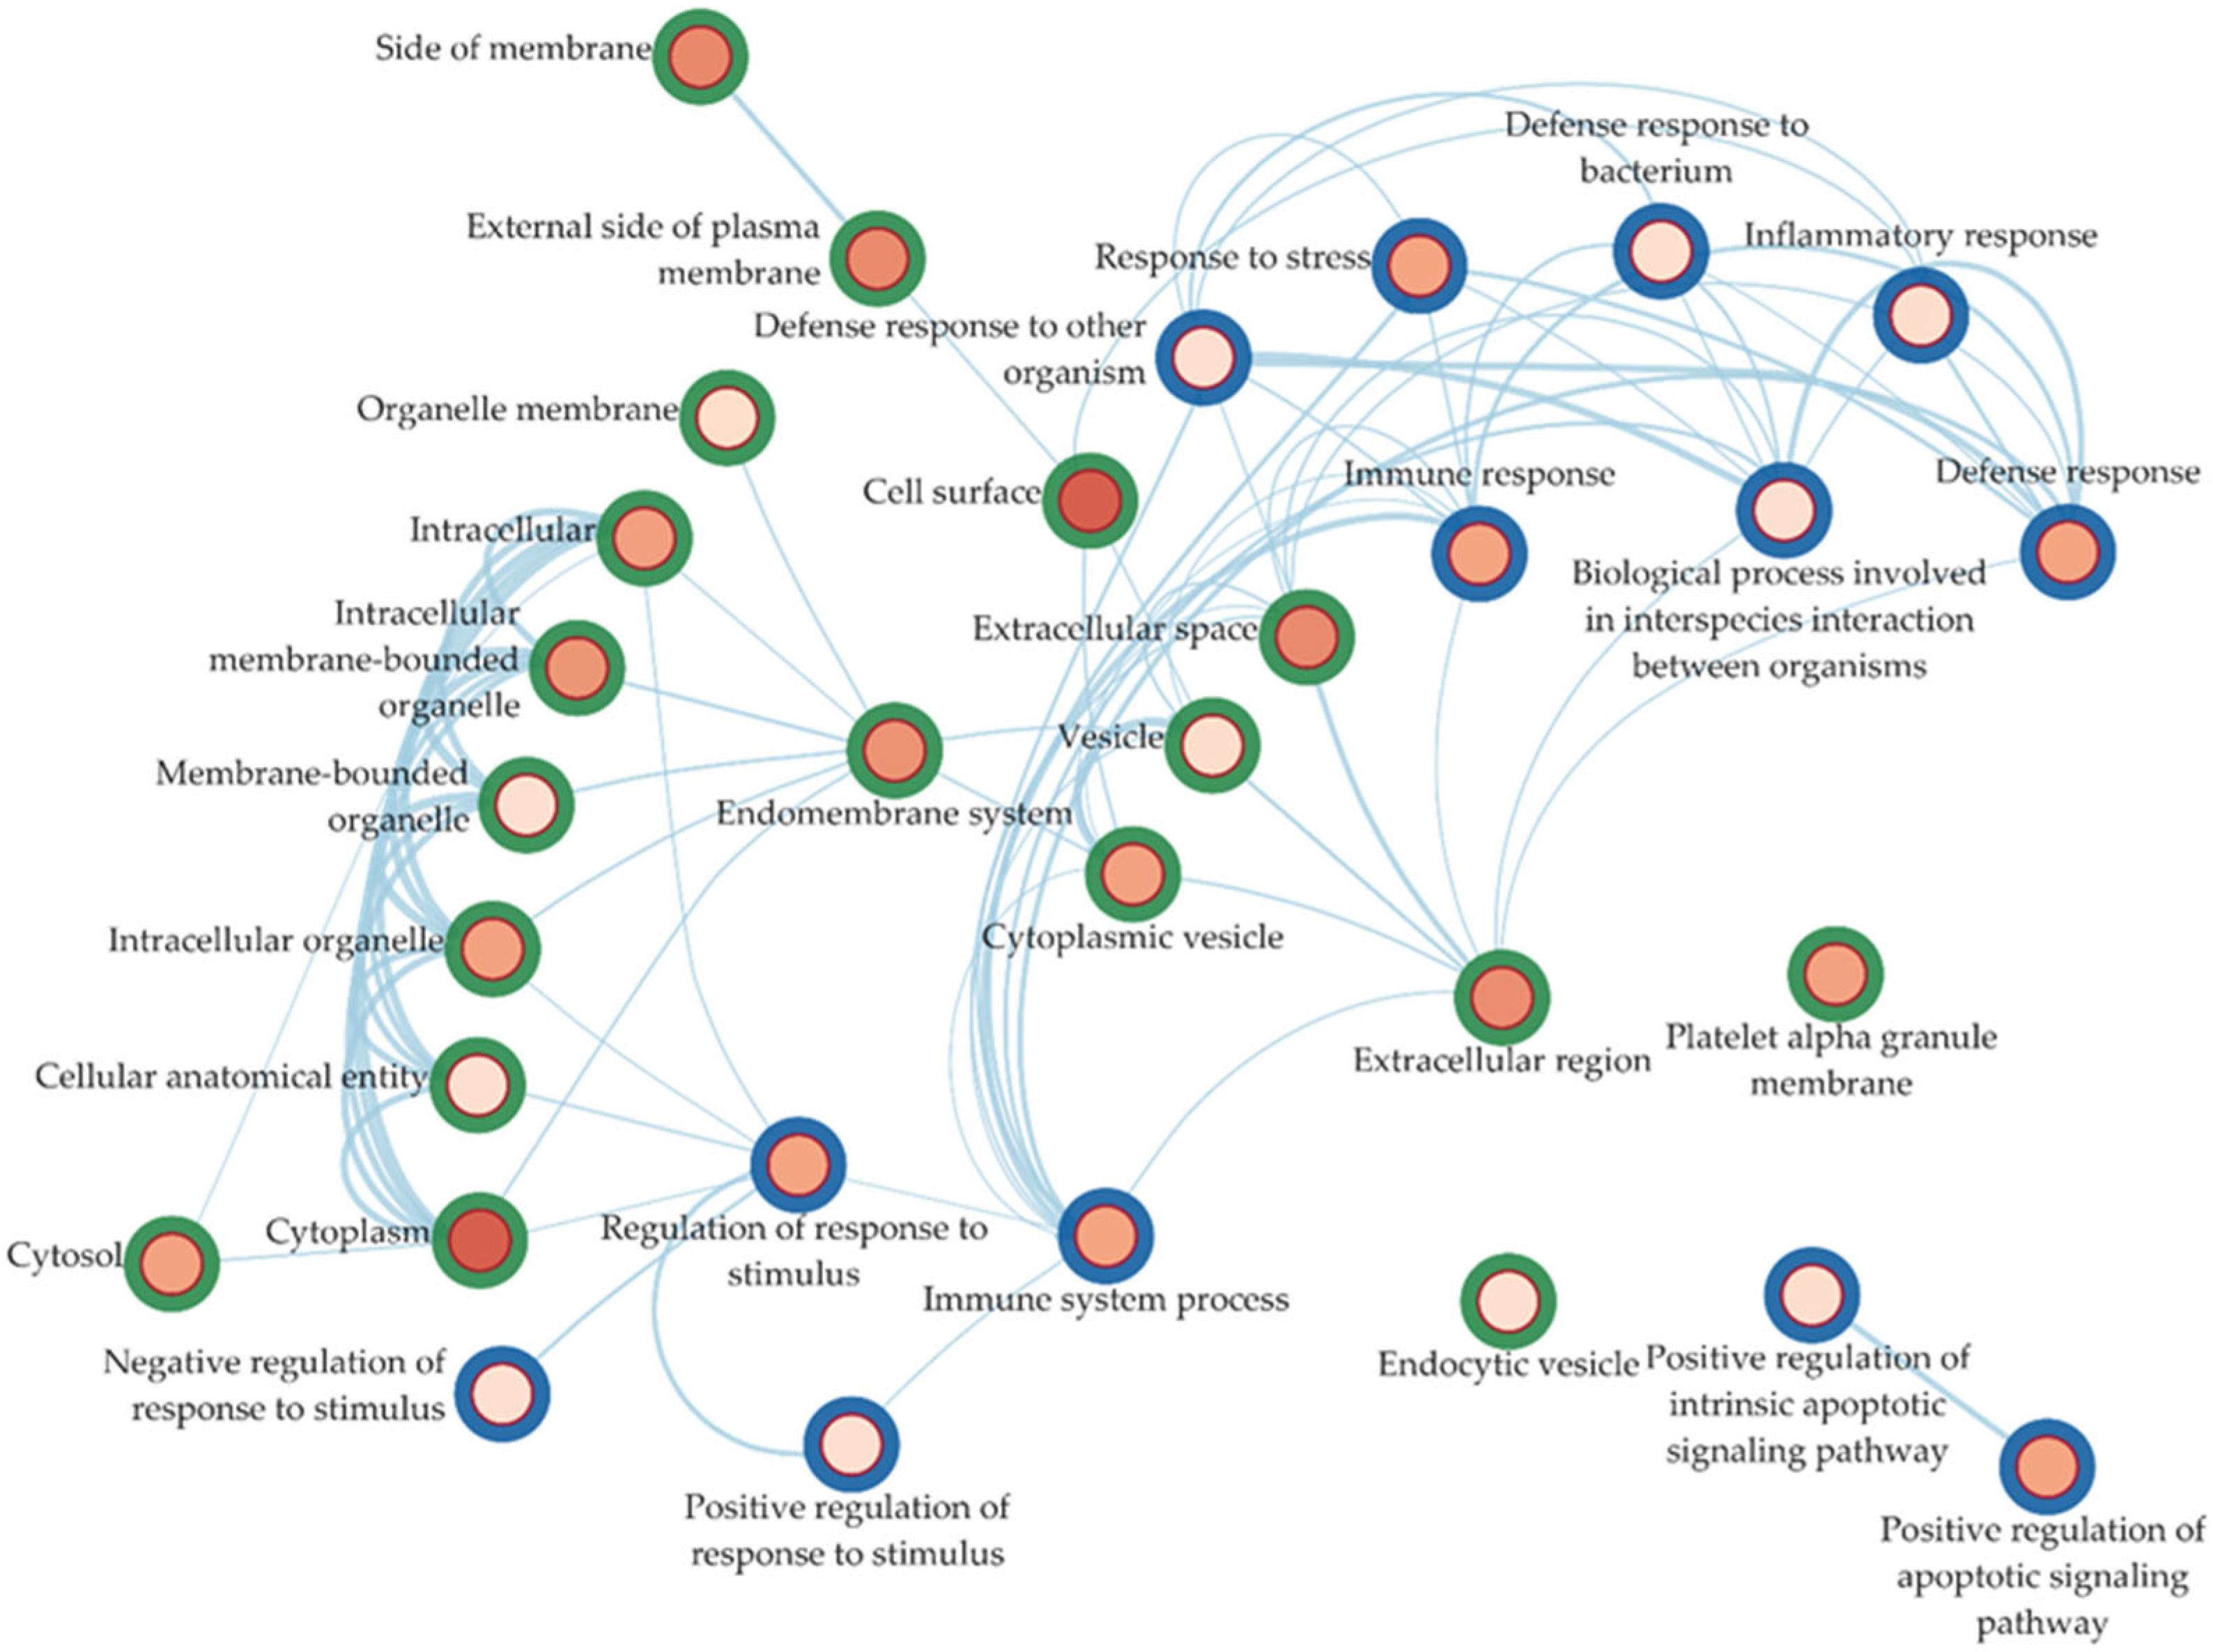
2.4. Ontology Enrichment

To elucidate the predominant gene ontologies (GOs) characterizing our identified DEGs, we conducted a comprehensive over-representation analysis (ORA) encompassing all selected DEGs as well as the cluster derived from the network analysis. This analysis used information on biological process (BP), cellular component (CC), and molecular function (MF) ontologies to highlight significant over-represented ontologies, providing a broader perspective on potential dysregulations across these various ontological categories. The ORA conducted using all 100 DEGs from the RuLu group revealed enrichment in 29 BP, 9 CC, and 2 MF ontologies. Similarly, the ORA performed on the CLUp DEGs exhibited enrichment in 95 BP, 37 CC, and no MF ontologies. It is noteworthy that in both cases, the enriched ontologies were determined based on the significance of the q-values, highlighting those with the most statistically significant associations. The top 10 enriched ontologies for RuLu and CLUp are presented in Figure 3. These selections were made based on the lowest q-values, signifying the highest degree of statistical significance. Furthermore, Supplementary Table S3 provides a comprehensive list of all enriched GO terms along with their associated DEGs.
To comprehensively observe how the enriched ontologies interact with each other, we also built an interaction network of the ontologies, aiming to provide insights into the interplay and potential crosstalk among various biological pathways and cellular components implicated in the condition under investigation. The functional analysis indicated immune processes as the predominant pathways associated with SPMS, consistent with the existing literature and supported by the original authors of the investigated datasets [16,17,18,19,20,21]. These DEGs primarily localized on cell surfaces, emphasizing the involvement of immune receptors in MS pathology. In Figure 4, we report the BP and CC interaction network.

2.5. Comparison with RRMS Patients’ Data

Up to this step, the analyses performed provided information on the DEGs likely involved with the SPMS phenotype and the processes potentially altered in this condition regardless of factors such as the sample origin, as they resulted from the intersection of multiple datasets.
However, the CLUp DEGs may also be indicators of MS in general, since they may also be dysregulated in other subtypes. To assess their potential use as biomarkers of progression/transition from RRMS to SPMS, we needed to prune from our DEGs all of the elements that show similar dysregulation in the RRMS subtype. To perform such pruning, we performed a DEA on the patients with RRMS vs. HCs of the blood dataset. The selection of the blood dataset was based on the fact that eventual biomarkers should be present in blood (for easiness of use); any other element which also results in DEGs in RRMS patients would not be useful as a progression biomarker. The execution of the DEA and the subsequent filtering followed the same scheme used for the SPMS data analysis (please refer to Section 2.1 and 2.2). As expected, the results obtained from the RRMS DEA evidenced a partial overlap of DEGs. In detail, for RuLu, we found 37 DEGs with the same expression behavior; 4 DEGs that appeared in both SPMS and RRMS but with opposite expression behavior; and 67 genes specific for SPMS. Finally, for CLUp, we found 17 genes with the same expression behavior, which we deemed not eligible as biomarkers specific for SPMS; 1 DEG that appeared in both SPMS and RRMS but with opposite expression behavior; and 20 genes specific for SPMS. These latter 21 genes represent the DEGs that more likely have the potential to be biomarkers of the RRMS transition to SPMS. The results are summarized in Figure 5 for the CLUp DEGs and in Supplementary Figure S2 for the RuLu DEGs. Further details on the RRMS DEA are reported in Supplementary Table S4.
As an additional step, we performed an ORA on the DEG subgroups specific to SPMS and common in RRMS and SPMS to identify BPs specific to SPMS. This analysis was performed with the aim of identifying potential processes whose alteration may constitute a potential mechanic behind MS’s transition from RRMS to SPMS. To increase the specificity of this comparison, we performed a three-layered assessment. In the first layer, we compared CLUp DEGs that were specific for SPMS vs. DEGs shared with RRMS patients. In the second-layer, we extended the analysis to all DEGs from the RuLu group. In the third layer, we compared all of the SPMS DEGs that exhibited opposite/different behavior in RRMS patients (i.e., up-regulated in SPMS and down-regulated/not DEGs in RRMS) vs. DEGs with the same behavior in both SPMS and RRMS patients. From these comparisons, we selected the BPs that were specifically enriched in SPMS patients but not in RRMS patients. The final results of these analyses are summarized in Table 1, and are detailed in Supplementary Table S5, respectively.

3. Discussion

MS exhibits a multifactorial nature, complicating the identification of its genetic background and prediction of its progression across subtypes.
For our study, we used a subset of subjects from six different databases containing information on gene expression from both brain (GSE126802 [16] and GSE131282 [17]) and blood (GSE17048 [18], E-MTAB-11415 [19], E-MTAB-4890 [20], and E-MTAB-5151 [21]) tissues. We opted to use both brain and blood tissues for our analysis. The rationale for this choice was based on the fact that (1) MS is a pathology mainly acting on the CNS [1], and (2) biomarkers should be easily accessible. Thus, we first selected all DEGs from the brain tissues, which should be informative of MS-related expression alterations, and then focused on the ones that also appeared as DEGs in the blood, which is an easily accessible tissue. These choices allowed our analysis to have some advantages: the use of multiple heterogenous samples would highlight alterations caused by the phenotype under investigation, filtering out genes whose dysregulation was due to other – sample-related – factors; the filtering of brain DEGs in the blood helped us to isolate DEGs that were likely involved in MS physiopathology in CNS, and, at the same time, easy to detect given their presence in blood; and the use of both brain and blood samples gave us an increased sample size.
Overall, the results we obtained, especially in first steps of our analyses, are supportive of the important role of immune/inflammatory processes in MS, which constituted the main findings of the original works related to the datasets used [16,17,18,19,20,21], as many of the top genes found to be up-regulated (please refer to Figure 1 and the Supplementary Materials) were related to such processes. The datasets’ original studies also greatly described the shared molecular pathways at work in MS pathogenesis, regardless of the subtype, and were informative of the regulatory architecture behind MS-associated altered gene expression. Different from the datasets’ original works, this study aimed to highlight gene expression alterations that could serve as potential biomarkers for the progression of MS towards the SPMS subtype. Additionally, we sought to infer specific biological processes contributing to this transition: we compared CLUp DEGs with those obtained from RRMS patients versus HCs in blood analyses. Filtering out the common elements, we obtained a set of 21 (up-regulated) DEGs specific for SPMS. This list included CBX3, CGAS, CLU, COL18A1, CST7, CTLA4, CTSL, CXCL8, CXCR2, GBP5, H2BC11, HDC, ITGB5, LPAR5, MICB, PTPRC, S100A6, SELP, SLAMF8, TRIM10, WWOX. The potential role of these genes in MS is discussed as follows.
The CBX3-encoded protein has been implicated in T-cell self-tolerance modulation and homeostasis mechanics [22], processes involved in MS. Up-regulation of CBX3 may lead to consistent inhibition of regulatory CD4+ T-cells, diminishing their function as suppressors of autoimmune events. Additionally, CBX3 acts as a positive regulator of the high-affinity antibody response [23,24]. While high-affinity antibody production is crucial for pathogen clearance, it promotes the production of auto-antibodies in MS and other autoimmune diseases, exacerbating immune system effects on patients.
The CGAS-encoded protein is involved with immune processes, as well as autoinflammatory and neurodegenerative disorders [25,26]. CGAS produces cyclic GMP-AMP, a second messenger involved in interferon (IFN) production [27]. While IFN has anti-inflammatory properties [27], it has been observed that subjects with autoimmune diseases have an increased/chronic production of IFN and are more prone to produce auto-antibodies [28]. Based on these data, the up-regulation of CGAS may be an indicator of chronic inflammation and increased auto-antibody production in MS.
The CLU gene encodes for a chaperone promoted as a potential biomarker of MS by independent studies [29]. In certain stress-associated conditions, including active inflammatory states [30], CLU can accumulate in the cytoplasm, where it inhibits apoptosis [31], or in the nucleus, where it promotes apoptosis [32,33]. It can be hypothesized that extended exposure to stressing conditions may lead to intracellular accumulation of CLU in MS, which could trigger pro-apoptotic processes, consequently aggravating the disease.
The COL18A1 gene encodes for the precursor of endostatin [34], and is up-regulated in several immune-related diseases [35,36]. Although angiogenesis appears to have a deleterious role in MS, this is true only in the early phases of lesion formation [37,38]. In the later phases, this process acquires a beneficial role and contributes to remission after relapses [34]. Further on in MS’s progression, lesions are characterized by a marked hypoperfusion, causing hypoxia and triggering disease progression [34]. According to this data, COL18A1 may be an indicator of the transition to the advanced phases of MS and, as suggested by our results, it may be a good indicator of the RRMS-to-SPMS transition.
The CST7 gene is mainly expressed in immune system cells [39], and seems to be linked to demyelination processes. Data from the literature report that CST7 expression appears to be up-regulated in activated microglia during demyelination, and totally absent in normal brains [40]. This observation highlights the potential of this gene for use as a marker of active demyelination. Notably, CST7 showed a high affinity for cathepsin L, a protein encoded by CTSL, another overexpressed gene in our results [41], suggesting a complex balancing mechanism acting between the two elements.
The CTLA4 gene is involved in T-cell homeostasis and self-tolerance [42]. Despite autoimmunity being linked to its loss [43], our results indicate an up-regulation of CTLA4. This overexpression may represent an effort to modulate the immune response, as increased CTLA4 expression is physiological in activated T-cells [44]. In MS, T-cells’ increased tolerance to this regulatory mechanism [45] may hinder CTLA4’s ability to deactivate/regulate T-cells effectively. The literature suggests that the activation of T-cells in MS is independent of co-stimulatory signals [46], and CTLA4 signaling is impaired in MS patients [42]. Notably, CTLA4 is down-regulated in RRMS patients [47]. Thus, CTLA4 overexpression, combined with persistent inflammation, could serve as a potential marker for T-cell regulation loss, particularly prominent in SPMS compared to RRMS.
The CTSL gene encodes for an enzyme involved in the cleavage of complement C3 into its active fragments C3a and C3b [48]. C3a promotes T-cell survival and regulates T-cell responses and cytokine production [49,50]. Up-regulation of CTSL suggests increased production of C3a fragments. Interestingly, T-cells from patients with autoimmune diseases exhibit CTSL-dependent complement hyper-activation and IFNγ production [48]. This phenomenon may be prominent in the SPMS subtype, due to the chronic inflammatory state. Notably, as previously discussed, this up-regulation may be countered by CST7. However, they usually do not colocalize [51], potentially limiting the inhibition’s effectiveness.
The CXCL8 gene encodes for a pro-inflammatory chemokine [52,53] mainly involved in recruiting immune cells from the blood and in their adhesion to endothelium [54]. Studies in the literature report an up-regulation of the CXCL8 receptor in immune cells at the chronic lesions [55], suggesting its potential for use as a biomarker, and, according to our results, it may be specific for SPMS. Notably, CXCL8 expression is regulated by the calcineurin–NFAT signaling pathway, which was found to be enriched in SPMS subjects [56].
The CXCR2 gene encodes for the CXCL8 receptor. CXCR2 is an important activator of the immune response and has a key role in immune cells recruitment [57]. This receptor acts in concert with its ligand in MS to promote the heightened inflammatory status [55]. As described before, CXCR2 appears to be up-regulated in many immune cells, including macrophages, astrocytes, microglia, and oligodendrocytes, in MS lesions [55]. Also, CXCR2 mRNA levels were found to be higher in brain autopsies from MS subjects [58]. For these reasons, this element may also be a potential marker of MS, especially in the later progressive phases, where a continuous up-regulation is expected.
The GBP5 gene is involved in cellular inflammatory responses and cytokine release [59,60]. While not directly linked to MS, the literature suggests that GBP5 has a role in selective NLRP3 inflammasome activation [61], a process potentially linked with MS. NLRP3 activation significantly increases neutrophil extracellular trap (NET) formation in the brain [62] with a concomitant increase in the expression of pro-inflammatory receptors such as CXCR2. NET has been implicated in the pathology of MS [63] and disease severity [62]. Thus, GBP5 may be implicated in MS through the activation of NLRP3, consequently acting together with pro-inflammatory elements like CXCL8 and CXCR2, to promote immune cell recruitment and NET formation. Elevated GBP5 expression may be indicative of this progression, suggesting its potential as a biomarker.
The H2BC11 gene encodes for a core component of the nucleosome, with no proven association with MS. Data from the literature report that its expression is enriched in immune cells, especially neutrophils [64], and its potential role as an indicator of immune infiltration in cancer [65]. According to these data, in MS patients, it may function as an indicator of immune cell accumulation, and could be linked with NET formation. However, to our knowledge, no data are available in the literature regarding more specific MS-related functions.
The HDC gene encodes a key protein for histamine production, influencing chronic inflammation, neurotransmission, and immune responses [66,67]. Elevated HDC expression may be indicative of active immune cell recruitment, a phenomenon more consistently observable in SPMS compared to RRMS [68]. Histamine’s regulatory role in MS models further supports this observation [69]. However, HDC overexpression’s significance should be carefully evaluated due to histamine’s complex effects on immune cells through various receptors [67,69]. Our results suggest that HDC overexpression is a potential marker for MS progression, but further studies are needed to precisely assess this finding given the diverse effects of histamine in MS.
The ITGB5 gene encodes a beta subunit of integrin, which can combine with several alpha chains to form multiple types of integrin heterodimers. While no specific studies have investigated ITGB5’s role in MS, data from the literature indicate a positive correlation of ITGB5 with immune infiltration in cancer [70]. We could hypothesize that immune infiltration may also occur in MS lesions; thus, ITGB5 could prove to be a useful indicator of the active progression of MS.
The LPAR5 gene encodes for a protein implicated in the mechanism of immune tolerance [71]. LPAR5 is an important regulator of T-cell activation [72]. Increased LPAR5 expression may serve as a feedback mechanism in activated T-cells, enhancing responsiveness to inhibitory signals. We can hypothesize that this up-regulation could be related to negative feedback due to decreased ligand (LPA) production. Interestingly, data from the literature evidence that LPA production is impaired/diminished in MS’s active phase and increased in symptom-free intervals [73], supporting this hypothesis. A chronic low concentration of LPAR5 may be one of the triggers for the shift of MS to its progressive form, the SPMS subtype, which does not have remitting intervals; thus, it may be a useful marker of the SPMS transition.
The MICB gene encodes for a protein that, through its association with the NKG2D receptor, can stimulate immune cells, potentially leading to autoreactive T-cell stimulation [74]. Several studies have investigated its possible correlation with MS and highlighted its significant association with the disease [75,76]. Interestingly, it has been observed that this protein reaches higher concentrations in MS, with the highest levels being observed during active relapses [77]. It can be hypothesized that in SPMS, where there are no relapse time frames, MICB expression is continuously stimulated, leading to the up-regulation we detected in our data.
The PTPRC gene encodes for a protein abundantly expressed in leukocytes, which is involved in the antigen–T-cell receptor/CD3/CD45 signal transduction [78]. Several investigations have been performed to evaluate its potential association with autoimmune diseases. According to these investigations, PTPRC alterations may increase the overall reactivity of the immune system and thus can predispose an individual to many different types of autoimmune diseases, including MS [79,80]. The prolonged immune activation promoted by PTPRC may be linked with the progressive phase of MS, thus nominating this gene as a potential biomarker.
The S100A6 gene is expressed in a wide range of cell types, and appears to mainly contribute to cellular Ca2+ signaling and play a role in stress responses in brain [81]. Although its biological activity has not been completely elucidated, S100A6 was found to be overexpressed in MS patients and has already been suggested as a potential biomarker of this disease [82,83]. Some studies suggest that S100A6’s increased expression may affect NFAT transcriptional activity, which has an established role in regulating the immune system [82]. Our results overall showed an up-regulation of this gene, and support the observations in the literature regarding its use as a biomarker. Additionally, our data suggest that its use may be more specific for the SPMS subtype compared to the RRMS subtype.
The SELP gene encodes for a protein that has a major role in myeloid cells’ adhesion to the endothelium and their infiltration into lesions [84]. Interestingly, data from the literature have associated mutations within this gene with MS [85]. Regarding our results, we found an up-regulation of SELP in SPMS patients. Additionally, SELP expression is up-regulated by histamine [86], linking its up-regulation to HDC, a previously discussed gene. This up-regulation may indicate an increased recruitment of autoreactive immune cells at lesion sites, exacerbating the inflammatory process and promoting MS progression. Constantly elevated SELP production could serve as an indicator of this process, suggesting it as a potential marker for SPMS.
The SLAMF8 gene is expressed in a variety of activated myeloid cells, and regulates a variety of immune responses [87]. While no studies directly link SLAMF8 to MS, its up-regulation has been reported in autoimmune inflammation states [88], suggesting a potential role of SLAMF8 in immune-related diseases [89]. Up-regulated SLAMF8 is associated with increased disease activity and inflammation in autoimmune diseases [90], and its involvement in the activation of macrophages during inflammation has been observed in cancer studies [89,91]. Our findings highlight SLAMF8’s overexpression in SPMS, potentially facilitating antigen presentation and local immune responses [89], thereby aggravating the autoimmune process and MS progression.
The TRIM10 gene encodes for a protein involved in the IFN/JAK/STAT signaling pathway, regulating the immune response [92,93]. Increasing evidence highlights its association with autoimmune diseases [94], including MS [95]. While the exact molecular mechanisms triggered by TRIM10 remain elusive [96], it likely regulates the IFN response. Our results support a potential implication of this gene in MS, with its up-regulation being linked with the SPMS subtype.
The WWOX gene encodes for a tumor suppressor, mainly correlating its function to cancer [97], but it is also associated with the CNS’s development and function [98], as well as with immune cell proliferation and maturation [99,100]. While the exact molecular cascades regulated by WWOX are still being investigated [100,101], the WWOX gene exhibits higher transcriptional levels in inflammatory conditions [100]. The literature suggests a potential association of WWOX with MS [98,102], consistent with our results. However, some studies report its down-regulation, rather than up-regulation, in chronic active MS lesions [103], warranting further investigation into WWOX’s specific involvement.
In summary, genes involved in the dysregulation of immune tolerance and activation of immune cells, coupled with the increased exposure of myelin to immune cells due to chemokine-guided recruitment, may be indicative of the transition from RRMS to SPMS. Our study also aimed to infer key processes involved in this transition. Enriched BPs specific to SPMS are reported in Table 1 and further details are given in the Supplementary Materials. Our three-layered comparison evidenced three processes: the negative regulation of the calcineurin–NFAT signaling cascade (GO:0070885), the negative regulation of calcineurin-mediated signaling (GO:0106057), and the regulation of the defense response to viruses by a host (GO:0050691). These ontologies, overall, implicate the potential role of Ca2+ signaling cascades in immunity. Indeed, Ca2+ is an essential signaling molecule that controls a wide range of biological functions. The immune system is not an exception: here, Ca2+ plays a central role in several functions in immune cells and inflammation [100,104]. In particular, through the calcineurin–NFAT pathway, it regulates the transcription of genes essential for innate and adaptive immunity [105]. The literature has evidenced how this pathway is dysregulated in autoimmune diseases [104]. Interestingly, Ca2+–calcineurin signaling may also facilitate immune cell recruitment in the brain lesions, since it may disrupt the blood–brain barrier [106]. This evidence is in line with our data. Moreover, our results suggest that dysregulation of this signaling pathway may be specifically involved with the progressive subtype of MS. However, to further elucidate the molecular mechanisms, further studies would be needed. Regarding the regulation of the defense response to viruses, it is known that abnormal functioning of the related processes may predispose an individual to autoimmunity [107]. The correlation with SPMS may be due to a more constant presence of inflammation in this condition, which elevates cytokine concentrations and results in the dysregulation of the defense response.
Some limitations are worth being mentioned. Our data were based on publicly available datasets that have little to no available clinical information data. As such, we cannot exclude the effect of possible confounders (including, but not limited to, comorbidities, previous therapies, or other concomitant treatments) in our analyses.

4. Materials and Methods

4.1. Flowchart of the Analysis

The present study is a multistep analysis with the aim of highlighting potential biomarkers informative of the SPMS transition. Below, in Figure 6, we report the flow chart of our analysis.

4.2. Dataset Selection

A systematic research process was undertaken across publicly accessible databases Gene Expression Omnibus (GEO) [108] and ArrayExpress [109]. The chosen datasets encompassed individuals diagnosed with MS alongside HC subjects, with detailed categorization based on MS subtype. A key criterion for dataset inclusion was the presence of samples specifically representing SPMS. These samples originated from blood or brain tissues. Furthermore, each selected dataset was required to exhibit a sufficiently robust sample size to bolster the statistical robustness of our analyses. The finalized datasets enlisted for the analyses performed on the brain were GSE126802 [16] and GSE131282 [17]. The datasets selected for the blood analyses were GSE17048 [18], E-MTAB-11415 [19], E-MTAB-4890 [20], and E-MTAB-5151 [21]. The above-reported datasets included a total of 116 SPMS samples (41 from brains and 75 from blood) and 175 HCs (23 from brains and 152 from blood). Additionally, we isolated all RRMS patients used for the analysis from the four blood datasets. The number of RRMS patients present in the aforementioned datasets was 162. All of the databases were accessed on 1 December 2023 to identify appropriate datasets.

4.3. Dataset Description

Details on the datasets are publicly available on the GEO database and ArrayExpress database, as well as in the original submitters’ publications. Table 2 reports the descriptives of the datasets analyzed and the original submitters’ publications.

4.4. Annotation of Probes and Genes

Due to the differences in terms of the dates of data collection and the instruments/technologies used between the databases, we performed two annotation steps to retrieve gene identifiers from the probes. The first step was based on the probes’ names according to the chip array used for each dataset. This step was performed automatically through a bioinformatics approach. In the second step, the results from the first step were manually checked to update the gene names. Any data displaying inconsistencies or deemed unreliable were eliminated in this step.

4.5. Bioinformatics Analysis

The workflow implemented in BioTEA v1.1.0 [111] was executed to acquire, preprocess, and conduct a DEA using microarray data from the selected datasets. Initially, the pipeline encompassed data retrieval from raw CEL files and data preprocessing stages. BioTEA performed the reading, parsing, background subtraction, quantile–quantile normalization, and quality checks of the raw expression data, ensuring robust computational reproducibility. DEA was conducted independently on each dataset to discover every DEG for each comparison. Rank Product (RankProd v3.28.0 package in R v4.3.3 environment) was applied for the DE analysis [112]. This selection was motivated by prior findings indicating the biological relevance of RankProd results. Moreover, RankProd is better suited for cross-dataset comparisons as it evaluates gene ranks rather than absolute expression values. In our analysis, we accepted as DEGs all genes with an adjusted p-value (q-value) < 0.05. The FDR method was applied to adjust the p-values to reduce the number of false positives. The regulation status of each DEG was determined using the original log2 fold change obtained from the analysis of each dataset.
The STRING database [113], integrated with Cytoscape software [114], was employed to construct interaction networks among the DEGs in our study. STRING provides a comprehensive resource for assessing protein–protein interactions, amalgamating both experimental and predicted data. The default confidence score cut-off (kappa = 0.4) was utilized for network construction, based on the STRING dataset version 12.0. In addition to a network analysis, the list of DEGs was subjected to gene ontology (GO) enrichment analysis to identify statistically significant alterations in the gene ontologies. The GSEAPY package v1.1.1 in the Python environment was utilized for the enrichment analysis.

4.6. Differential Expression Analysis Specifics

In the performed DEA, we considered as up-regulated all DEGs that assumed a statically confirmed increased expression in the SPMS group compared to the HC group for each dataset, while the down-regulated DEGs were those less expressed in the SPMS group compared to the HCs for each dataset. No filters based on fold changes were applied as we wanted to maintain the most comprehensive perspective possible.

5. Conclusions

We highlighted 21 genes possibly involved with MS and in particular with the RRMS-to-SPMS transition. According to their discussed functions, these genes may be directly involved with SPMS progression or may appear overexpressed as an attempt to counter the immune activation. These phenomena are likely more evident in the SPMS phase as the relapsing–remitting patients are still able to have free-of-symptoms windows, suggesting that the inhibitory mechanics still retain their ameliorating effect on immune activation. This balance is instead skewed towards immune activation in SPMS patients. Such observations may suggest that the primary trigger of the RRMS-to-SPMS transition is related to the disruption of the inhibitory cascades controlling immune cells’ activity and tolerance against antigen mechanisms. In this sense, a potential process involved may be related to Ca2+, more specifically, the calcineurin–NFAT pathway, which we found to be enriched specifically in SPMS patients. Its role in this condition, however, will need further investigations to be elucidated. Regarding their potential use in the MS clinical field, the selected genes may set up the groundwork for the definition of potential markers of the RRMS-to-SPMS transition, and could be useful for further studies and in developing new treatment designs to slow disease progression.

Supplementary Materials

The following supporting information can be downloaded at https://www.mdpi.com/article/10.3390/ijms25063374/s1.

Author Contributions

Conceptualization, E.M.; methodology, M.C., M.L. and S.D.; software, M.C. and M.L.; validation, M.C.; formal analysis, M.C.; investigation, M.C. and S.D.; data curation, M.C. and M.L.; writing—original draft preparation: M.C. and S.D.; writing—review and editing, M.C., E.M. and S.D.; visualization, M.C.; supervision, E.M.; project administration, E.M. All authors have read and agreed to the published version of the manuscript.

Funding

This study was supported by Current Research Funds 2024, Ministry of Health, Italy.

Institutional Review Board Statement

Not applicable.

Informed Consent Statement

Not applicable.

Data Availability Statement

The data presented in this study are openly available in the Gene Expression Omnibus (GEO) database (https://www.ncbi.nlm.nih.gov/gds; last accessed on 1 December 2023), under the accession numbers GSE126802, GSE131282, and GSE17048, respectively; as well as in the Expression Atlas database (https://www.ebi.ac.uk/gxa/home; last accessed on 1 December 2023) under the accession numbers E-MTAB-4890, E-MTAB-5151, and E-MTAB-11415, respectively.

Conflicts of Interest

The authors declare no conflicts of interest. The funders had no role in the design of this study; in the collection, analyses, or interpretation of data; in the writing of the manuscript; or in the decision to publish the results.

References

  1. Belbasis, L.; Bellou, V.; Evangelou, E.; Ioannidis, J.P.; Tzoulaki, I. Environmental risk factors and multiple sclerosis: An umbrella review of systematic reviews and meta-analyses. Lancet Neurol. 2015, 14, 263–273. [Google Scholar] [CrossRef]
  2. Sawcer, S.; Franklin, R.J.; Ban, M. Multiple sclerosis genetics. Lancet Neurol. 2014, 13, 700–709. [Google Scholar] [CrossRef]
  3. Trapp, B.D.; Peterson, J.; Ransohoff, R.M.; Rudick, R.; Mork, S.; Bo, L. Axonal transection in the lesions of multiple sclerosis. N. Engl. J. Med. 1998, 338, 278–285. [Google Scholar] [CrossRef]
  4. Confavreux, C.; Vukusic, S. Natural history of multiple sclerosis: A unifying concept. Brain A J. Neurol. 2006, 129, 606–616. [Google Scholar] [CrossRef]
  5. Pugliatti, M.; Rosati, G.; Carton, H.; Riise, T.; Drulovic, J.; Vecsei, L.; Milanov, I. The epidemiology of multiple sclerosis in Europe. Eur. J. Neurol. 2006, 13, 700–722. [Google Scholar] [CrossRef]
  6. Grytten Torkildsen, N.; Lie, S.A.; Aarseth, J.H.; Nyland, H.; Myhr, K.M. Survival and cause of death in multiple sclerosis: Results from a 50-year follow-up in Western Norway. Mult. Scler. 2008, 14, 1191–1198. [Google Scholar] [CrossRef] [PubMed]
  7. Howard, J.; Trevick, S.; Younger, D.S. Epidemiology of Multiple Sclerosis. Neurol. Clin. 2016, 34, 919–939. [Google Scholar] [CrossRef] [PubMed]
  8. Lublin, F.D.; Reingold, S.C. Defining the clinical course of multiple sclerosis: Results of an international survey. National Multiple Sclerosis Society (USA) Advisory Committee on Clinical Trials of New Agents in Multiple Sclerosis. Neurology 1996, 46, 907–911. [Google Scholar] [CrossRef] [PubMed]
  9. Correale, J.; Gaitan, M.I.; Ysrraelit, M.C.; Fiol, M.P. Progressive multiple sclerosis: From pathogenic mechanisms to treatment. Brain A J. Neurol. 2017, 140, 527–546. [Google Scholar] [CrossRef] [PubMed]
  10. Scalfari, A.; Neuhaus, A.; Degenhardt, A.; Rice, G.P.; Muraro, P.A.; Daumer, M.; Ebers, G.C. The natural history of multiple sclerosis: A geographically based study 10: Relapses and long-term disability. Brain A J. Neurol. 2010, 133, 1914–1929. [Google Scholar] [CrossRef]
  11. Katz Sand, I.; Krieger, S.; Farrell, C.; Miller, A.E. Diagnostic uncertainty during the transition to secondary progressive multiple sclerosis. Mult. Scler. 2014, 20, 1654–1657. [Google Scholar] [CrossRef]
  12. Miljkovic, D.; Spasojevic, I. Multiple sclerosis: Molecular mechanisms and therapeutic opportunities. Antioxid. Redox Signal. 2013, 19, 2286–2334. [Google Scholar] [CrossRef]
  13. Chiricosta, L.; Blando, S.; D’Angiolini, S.; Gugliandolo, A.; Mazzon, E. A Comprehensive Exploration of the Transcriptomic Landscape in Multiple Sclerosis: A Systematic Review. Int. J. Mol. Sci. 2023, 24, 1448. [Google Scholar] [CrossRef]
  14. Bielekova, B.; Martin, R. Development of biomarkers in multiple sclerosis. Brain A J. Neurol. 2004, 127, 1463–1478. [Google Scholar] [CrossRef]
  15. Anderson, N.L.; Polanski, M.; Pieper, R.; Gatlin, T.; Tirumalai, R.S.; Conrads, T.P.; Veenstra, T.D.; Adkins, J.N.; Pounds, J.G.; Fagan, R.; et al. The human plasma proteome: A nonredundant list developed by combination of four separate sources. Mol. Cell. Proteom. MCP 2004, 3, 311–326. [Google Scholar] [CrossRef]
  16. Melief, J.; Orre, M.; Bossers, K.; van Eden, C.G.; Schuurman, K.G.; Mason, M.R.J.; Verhaagen, J.; Hamann, J.; Huitinga, I. Transcriptome analysis of normal-appearing white matter reveals cortisol- and disease-associated gene expression profiles in multiple sclerosis. Acta Neuropathol. Commun. 2019, 7, 60. [Google Scholar] [CrossRef] [PubMed]
  17. Enz, L.S.; Zeis, T.; Schmid, D.; Geier, F.; van der Meer, F.; Steiner, G.; Certa, U.; Binder, T.M.C.; Stadelmann, C.; Martin, R.; et al. Increased HLA-DR expression and cortical demyelination in MS links with HLA-DR15. Neurol. Neuroimmunol. Neuroinflamm/ 2020, 7, e656. [Google Scholar] [CrossRef]
  18. Riveros, C.; Mellor, D.; Gandhi, K.S.; McKay, F.C.; Cox, M.B.; Berretta, R.; Vaezpour, S.Y.; Inostroza-Ponta, M.; Broadley, S.A.; Heard, R.N.; et al. A transcription factor map as revealed by a genome-wide gene expression analysis of whole-blood mRNA transcriptome in multiple sclerosis. PLoS ONE 2010, 5, e14176. [Google Scholar] [CrossRef] [PubMed]
  19. Colombo, E.; Di Dario, M.; Menon, R.; Valente, M.M.; Bassani, C.; Sarno, N.; Mazza, D.; Montini, F.; Moiola, L.; Comi, G.; et al. HNF4alpha, SP1 and c-myc are master regulators of CNS autoimmunity. J. Autoimmun. 2023, 138, 103053. [Google Scholar] [CrossRef] [PubMed]
  20. Srinivasan, S.; Di Dario, M.; Russo, A.; Menon, R.; Brini, E.; Romeo, M.; Sangalli, F.; Costa, G.D.; Rodegher, M.; Radaelli, M.; et al. Dysregulation of MS risk genes and pathways at distinct stages of disease. Neurol. Neuroimmunol. Neuroinflamm. 2017, 4, e337. [Google Scholar] [CrossRef] [PubMed]
  21. Srinivasan, S.; Severa, M.; Rizzo, F.; Menon, R.; Brini, E.; Mechelli, R.; Martinelli, V.; Hertzog, P.; Salvetti, M.; Furlan, R.; et al. Transcriptional dysregulation of Interferome in experimental and human Multiple Sclerosis. Sci. Rep. 2017, 7, 8981. [Google Scholar] [CrossRef] [PubMed]
  22. Ha, N.; Pham, D.H.; Shahsafaei, A.; Naruse, C.; Asano, M.; Thai, T.H. HP-1gamma Controls High-Affinity Antibody Response to T-Dependent Antigens. Front. Immunol. 2014, 5, 271. [Google Scholar] [CrossRef] [PubMed]
  23. Vinuesa, C.G.; Cyster, J.G. How T cells earn the follicular rite of passage. Immunity 2011, 35, 671–680. [Google Scholar] [CrossRef] [PubMed]
  24. Shulman, Z.; Gitlin, A.D.; Targ, S.; Jankovic, M.; Pasqual, G.; Nussenzweig, M.C.; Victora, G.D. T follicular helper cell dynamics in germinal centers. Science 2013, 341, 673–677. [Google Scholar] [CrossRef] [PubMed]
  25. Dai, J.; Huang, Y.J.; He, X.; Zhao, M.; Wang, X.; Liu, Z.S.; Xue, W.; Cai, H.; Zhan, X.Y.; Huang, S.Y.; et al. Acetylation Blocks cGAS Activity and Inhibits Self-DNA-Induced Autoimmunity. Cell 2019, 176, 1447–1460.e1414. [Google Scholar] [CrossRef] [PubMed]
  26. Skopelja-Gardner, S.; An, J.; Elkon, K.B. Role of the cGAS-STING pathway in systemic and organ-specific diseases. Nat. Rev. Nephrol. 2022, 18, 558–572. [Google Scholar] [CrossRef]
  27. Duarte, N.; Shafi, A.M.; Penha-Goncalves, C.; Pais, T.F. Endothelial type I interferon response and brain diseases: Identifying STING as a therapeutic target. Front. Cell Dev. Biol. 2023, 11, 1249235. [Google Scholar] [CrossRef]
  28. Cuadrado, E.; Vanderver, A.; Brown, K.J.; Sandza, A.; Takanohashi, A.; Jansen, M.H.; Anink, J.; Herron, B.; Orcesi, S.; Olivieri, I.; et al. Aicardi-Goutieres syndrome harbours abundant systemic and brain-reactive autoantibodies. Ann. Rheum. Dis. 2015, 74, 1931–1939. [Google Scholar] [CrossRef]
  29. Razia, R.; Majeed, F.; Amin, R.; Mukhtar, S.; Mehmood, K.; Baig, D.N. The analysis of dynamic gene expression patterns in peripheral blood of multiple sclerosis patients indicates possible diagnostic and prognostic biomarkers. Mol. Immunol. 2022, 147, 147–156. [Google Scholar] [CrossRef] [PubMed]
  30. Wilson, M.R.; Zoubeidi, A. Clusterin as a therapeutic target. Expert Opin. Ther. Targets 2017, 21, 201–213. [Google Scholar] [CrossRef] [PubMed]
  31. Zhang, H.; Kim, J.K.; Edwards, C.A.; Xu, Z.; Taichman, R.; Wang, C.Y. Clusterin inhibits apoptosis by interacting with activated Bax. Nat. Cell Biol. 2005, 7, 909–915. [Google Scholar] [CrossRef]
  32. Leskov, K.S.; Klokov, D.Y.; Li, J.; Kinsella, T.J.; Boothman, D.A. Synthesis and functional analyses of nuclear clusterin, a cell death protein. J. Biol. Chem. 2003, 278, 11590–11600. [Google Scholar] [CrossRef] [PubMed]
  33. Han, B.H.; DeMattos, R.B.; Dugan, L.L.; Kim-Han, J.S.; Brendza, R.P.; Fryer, J.D.; Kierson, M.; Cirrito, J.; Quick, K.; Harmony, J.A.; et al. Clusterin contributes to caspase-3-independent brain injury following neonatal hypoxia-ischemia. Nat. Med. 2001, 7, 338–343. [Google Scholar] [CrossRef] [PubMed]
  34. Girolamo, F.; Coppola, C.; Ribatti, D.; Trojano, M. Angiogenesis in multiple sclerosis and experimental autoimmune encephalomyelitis. Acta Neuropathol. Commun. 2014, 2, 84. [Google Scholar] [CrossRef] [PubMed]
  35. Puxeddu, I.; Capecchi, R.; Pratesi, F.; Cianchetti, S.; Tavoni, A.; Migliorini, P. Mediators of angiogenesis and fibrosis in IgG4-related disease. Clin. Exp. Med. 2018, 18, 245–249. [Google Scholar] [CrossRef] [PubMed]
  36. Bellocchi, C.; Assassi, S.; Lyons, M.; Marchini, M.; Mohan, C.; Santaniello, A.; Beretta, L. Proteomic aptamer analysis reveals serum markers that characterize preclinical systemic sclerosis (SSc) patients at risk for progression toward definite SSc. Arthritis Res. Ther. 2023, 25, 15. [Google Scholar] [CrossRef] [PubMed]
  37. MacMillan, C.J.; Furlong, S.J.; Doucette, C.D.; Chen, P.L.; Hoskin, D.W.; Easton, A.S. Bevacizumab diminishes experimental autoimmune encephalomyelitis by inhibiting spinal cord angiogenesis and reducing peripheral T-cell responses. J. Neuropathol. Exp. Neurol. 2012, 71, 983–999. [Google Scholar] [CrossRef] [PubMed]
  38. Argaw, A.T.; Asp, L.; Zhang, J.; Navrazhina, K.; Pham, T.; Mariani, J.N.; Mahase, S.; Dutta, D.J.; Seto, J.; Kramer, E.G.; et al. Astrocyte-derived VEGF-A drives blood-brain barrier disruption in CNS inflammatory disease. J. Clin. Investig. 2012, 122, 2454–2468. [Google Scholar] [CrossRef]
  39. Obata-Onai, A.; Hashimoto, S.; Onai, N.; Kurachi, M.; Nagai, S.; Shizuno, K.; Nagahata, T.; Matsushima, K. Comprehensive gene expression analysis of human NK cells and CD8(+) T lymphocytes. Int. Immunol. 2002, 14, 1085–1098. [Google Scholar] [CrossRef]
  40. Ma, J.; Tanaka, K.F.; Shimizu, T.; Bernard, C.C.; Kakita, A.; Takahashi, H.; Pfeiffer, S.E.; Ikenaka, K. Microglial cystatin F expression is a sensitive indicator for ongoing demyelination with concurrent remyelination. J. Neurosci. Res. 2011, 89, 639–649. [Google Scholar] [CrossRef]
  41. Nakagawa, T.; Roth, W.; Wong, P.; Nelson, A.; Farr, A.; Deussing, J.; Villadangos, J.A.; Ploegh, H.; Peters, C.; Rudensky, A.Y. Cathepsin L: Critical role in Ii degradation and CD4 T cell selection in the thymus. Science 1998, 280, 450–453. [Google Scholar] [CrossRef] [PubMed]
  42. Basile, M.S.; Bramanti, P.; Mazzon, E. The Role of Cytotoxic T-Lymphocyte Antigen 4 in the Pathogenesis of Multiple Sclerosis. Genes 2022, 13, 1319. [Google Scholar] [CrossRef] [PubMed]
  43. Kawakami, N.; Bartholomaus, I.; Pesic, M.; Mues, M. An autoimmunity odyssey: How autoreactive T cells infiltrate into the CNS. Immunol. Rev. 2012, 248, 140–155. [Google Scholar] [CrossRef] [PubMed]
  44. Oliveira, E.M.; Bar-Or, A.; Waliszewska, A.I.; Cai, G.; Anderson, D.E.; Krieger, J.I.; Hafler, D.A. CTLA-4 dysregulation in the activation of myelin basic protein reactive T cells may distinguish patients with multiple sclerosis from healthy controls. J. Autoimmun. 2003, 20, 71–81. [Google Scholar] [CrossRef]
  45. Takahashi, T.; Tagami, T.; Yamazaki, S.; Uede, T.; Shimizu, J.; Sakaguchi, N.; Mak, T.W.; Sakaguchi, S. Immunologic self-tolerance maintained by CD25(+)CD4(+) regulatory T cells constitutively expressing cytotoxic T lymphocyte-associated antigen 4. J. Exp. Med. 2000, 192, 303–310. [Google Scholar] [CrossRef] [PubMed]
  46. Scholz, C.; Patton, K.T.; Anderson, D.E.; Freeman, G.J.; Hafler, D.A. Expansion of autoreactive T cells in multiple sclerosis is independent of exogenous B7 costimulation. J. Immunol. 1998, 160, 1532–1538. [Google Scholar] [CrossRef]
  47. Mohammadzadeh, A.; Rad, I.A.; Ahmadi-Salmasi, B. CTLA-4, PD-1 and TIM-3 expression predominantly downregulated in MS patients. J. Neuroimmunol. 2018, 323, 105–108. [Google Scholar] [CrossRef]
  48. Liszewski, M.K.; Kolev, M.; Le Friec, G.; Leung, M.; Bertram, P.G.; Fara, A.F.; Subias, M.; Pickering, M.C.; Drouet, C.; Meri, S.; et al. Intracellular complement activation sustains T cell homeostasis and mediates effector differentiation. Immunity 2013, 39, 1143–1157. [Google Scholar] [CrossRef]
  49. Shibamura-Fujiogi, M.; Yuki, K.; Hou, L. Cathepsin L regulates pathogenicCD4 T cells in experimental autoimmune encephalomyelitis. Int. Immunopharmacol. 2021, 93, 107425. [Google Scholar] [CrossRef] [PubMed]
  50. Xiao, F.; Guo, J.; Tomlinson, S.; Yuan, G.; He, S. The role of the complosome in health and disease. Front. Immunol. 2023, 14, 1146167. [Google Scholar] [CrossRef]
  51. Langerholc, T.; Zavasnik-Bergant, V.; Turk, B.; Turk, V.; Abrahamson, M.; Kos, J. Inhibitory properties of cystatin F and its localization in U937 promonocyte cells. FEBS J. 2005, 272, 1535–1545. [Google Scholar] [CrossRef]
  52. Cui, L.Y.; Chu, S.F.; Chen, N.H. The role of chemokines and chemokine receptors in multiple sclerosis. Int. Immunopharmacol. 2020, 83, 106314. [Google Scholar] [CrossRef] [PubMed]
  53. Zhao, P.; Liu, X.; Wang, Y.; Zhang, X.; Wang, H.; Du, X.; Du, Z.; Yang, L.; Hou, J. Discovery of grey matter lesion-related immune genes for diagnostic prediction in multiple sclerosis. PeerJ 2023, 11, e15299. [Google Scholar] [CrossRef] [PubMed]
  54. Sampson, A.P. The role of eosinophils and neutrophils in inflammation. Clin. Exp. Allergy J. Br. Soc. Allergy Clin. Immunol. 2000, 30 (Suppl. S1), 22–27. [Google Scholar] [CrossRef]
  55. Nguyen, D.; Stangel, M. Expression of the chemokine receptors CXCR1 and CXCR2 in rat oligodendroglial cells. Dev. Brain Res. 2001, 128, 77–81. [Google Scholar] [CrossRef]
  56. Sales, K.J.; Maldonado-Perez, D.; Grant, V.; Catalano, R.D.; Wilson, M.R.; Brown, P.; Williams, A.R.; Anderson, R.A.; Thompson, E.A.; Jabbour, H.N. Prostaglandin F(2alpha)-F-prostanoid receptor regulates CXCL8 expression in endometrial adenocarcinoma cells via the calcium-calcineurin-NFAT pathway. Biochim. Biophys. Acta 2009, 1793, 1917–1928. [Google Scholar] [CrossRef]
  57. Lund, B.T.; Ashikian, N.; Ta, H.Q.; Chakryan, Y.; Manoukian, K.; Groshen, S.; Gilmore, W.; Cheema, G.S.; Stohl, W.; Burnett, M.E.; et al. Increased CXCL8 (IL-8) expression in Multiple Sclerosis. J. Neuroimmunol. 2004, 155, 161–171. [Google Scholar] [CrossRef]
  58. Baranzini, S.E.; Elfstrom, C.; Chang, S.Y.; Butunoi, C.; Murray, R.; Higuchi, R.; Oksenberg, J.R. Transcriptional analysis of multiple sclerosis brain lesions reveals a complex pattern of cytokine expression. J. Immunol. 2000, 165, 6576–6582. [Google Scholar] [CrossRef] [PubMed]
  59. Haque, M.; Siegel, R.J.; Fox, D.A.; Ahmed, S. Interferon-stimulated GTPases in autoimmune and inflammatory diseases: Promising role for the guanylate-binding protein (GBP) family. Rheumatology 2021, 60, 494–506. [Google Scholar] [CrossRef]
  60. Li, Y.; Lin, X.; Wang, W.; Wang, W.; Cheng, S.; Huang, Y.; Zou, Y.; Ke, J.; Zhu, L. The Proinflammatory Role of Guanylate-Binding Protein 5 in Inflammatory Bowel Diseases. Front. Microbiol. 2022, 13, 926915. [Google Scholar] [CrossRef]
  61. Shenoy, A.R.; Wellington, D.A.; Kumar, P.; Kassa, H.; Booth, C.J.; Cresswell, P.; MacMicking, J.D. GBP5 promotes NLRP3 inflammasome assembly and immunity in mammals. Science 2012, 336, 481–485. [Google Scholar] [CrossRef]
  62. Byun, D.J.; Lee, J.; Ko, K.; Hyun, Y.M. NLRP3 exacerbates EAE severity through ROS-dependent NET formation in the mouse brain. Cell Commun. Signal. CCS 2024, 22, 96. [Google Scholar] [CrossRef]
  63. Naegele, M.; Tillack, K.; Reinhardt, S.; Schippling, S.; Martin, R.; Sospedra, M. Neutrophils in multiple sclerosis are characterized by a primed phenotype. J. Neuroimmunol. 2012, 242, 60–71. [Google Scholar] [CrossRef]
  64. Karlsson, M.; Zhang, C.; Mear, L.; Zhong, W.; Digre, A.; Katona, B.; Sjostedt, E.; Butler, L.; Odeberg, J.; Dusart, P.; et al. A single-cell type transcriptomics map of human tissues. Sci. Adv. 2021, 7, eabh2169. [Google Scholar] [CrossRef]
  65. Jia, J.; Han, Z.; Wang, X.; Zheng, X.; Wang, S.; Cui, Y. H2B gene family: A prognostic biomarker and correlates with immune infiltration in glioma. Front. Oncol. 2022, 12, 966817. [Google Scholar] [CrossRef]
  66. Sandoval-Talamantes, A.K.; Gomez-Gonzalez, B.A.; Uriarte-Mayorga, D.F.; Martinez-Guzman, M.A.; Wheber-Hidalgo, K.A.; Alvarado-Navarro, A. Neurotransmitters, neuropeptides and their receptors interact with immune response in healthy and psoriatic skin. Neuropeptides 2020, 79, 102004. [Google Scholar] [CrossRef]
  67. Branco, A.; Yoshikawa, F.S.Y.; Pietrobon, A.J.; Sato, M.N. Role of Histamine in Modulating the Immune Response and Inflammation. Mediat. Inflamm. 2018, 2018, 9524075. [Google Scholar] [CrossRef]
  68. Rafiee Zadeh, A.; Falahatian, M.; Alsahebfosoul, F. Serum levels of histamine and diamine oxidase in multiple sclerosis. Am. J. Clin. Exp. Immunol. 2018, 7, 100–105. [Google Scholar] [PubMed]
  69. Saligrama, N.; Case, L.K.; del Rio, R.; Noubade, R.; Teuscher, C. Systemic lack of canonical histamine receptor signaling results in increased resistance to autoimmune encephalomyelitis. J. Immunol. 2013, 191, 614–622. [Google Scholar] [CrossRef] [PubMed]
  70. Yu, J.; Yang, K.; Zheng, J.; Sun, X.; Zhao, W. Establishment of a novel prognostic signature based on an identified expression profile of integrin superfamily to predict overall survival of patients with colorectal adenocarcinoma. Gene 2022, 808, 145990. [Google Scholar] [CrossRef] [PubMed]
  71. Mathew, D.; Torres, R.M. Lysophosphatidic Acid Is an Inflammatory Lipid Exploited by Cancers for Immune Evasion via Mechanisms Similar and Distinct from CTLA-4 and PD-1. Front. Immunol. 2020, 11, 531910. [Google Scholar] [CrossRef] [PubMed]
  72. Konen, J.M.; Rodriguez, B.L.; Wu, H.; Fradette, J.J.; Gibson, L.; Diao, L.; Wang, J.; Schmidt, S.; Wistuba, I.I.; Zhang, J.; et al. Autotaxin suppresses cytotoxic T cells via LPAR5 to promote anti-PD-1 resistance in non-small cell lung cancer. J. Clin. Investig. 2023, 133, e163128. [Google Scholar] [CrossRef] [PubMed]
  73. Schmitz, K.; Brunkhorst, R.; de Bruin, N.; Mayer, C.A.; Haussler, A.; Ferreiros, N.; Schiffmann, S.; Parnham, M.J.; Tunaru, S.; Chun, J.; et al. Dysregulation of lysophosphatidic acids in multiple sclerosis and autoimmune encephalomyelitis. Acta Neuropathol. Commun. 2017, 5, 42. [Google Scholar] [CrossRef] [PubMed]
  74. Bauer, S.; Groh, V.; Wu, J.; Steinle, A.; Phillips, J.H.; Lanier, L.L.; Spies, T. Pillars Article: Activation of NK Cells and T Cells by NKG2D, a Receptor for Stress-Inducible MICA. Science 1999, 285, 727–729, Erratum in J. Immunol. 2018, 200, 2231–2233. [Google Scholar] [CrossRef] [PubMed]
  75. Mo, X.B.; Lei, S.F.; Qian, Q.Y.; Guo, Y.F.; Zhang, Y.H.; Zhang, H. Integrative analysis revealed potential causal genetic and epigenetic factors for multiple sclerosis. J. Neurol. 2019, 266, 2699–2709. [Google Scholar] [CrossRef] [PubMed]
  76. Beecham, A.H.; Amezcua, L.; Chinea, A.; Manrique, C.P.; Gomez, L.; Martinez, A.; Beecham, G.W.; Patsopoulos, N.A.; Chitnis, T.; Weiner, H.L.; et al. Ancestral risk modification for multiple sclerosis susceptibility detected across the Major Histocompatibility Complex in a multi-ethnic population. PLoS ONE 2022, 17, e0279132. [Google Scholar] [CrossRef] [PubMed]
  77. Abediankenari, S.; Yousefzadeh, Y.; Majidi, M.; Ghasemi, M.; Nasehi, M.M.; Ghaffari, J.; Habibi Saravi, R.; Abedini, M.; Elyasi, M. MICB gene expression on peripheral blood mononuclear cells and susceptibility to multiple sclerosis in north of Iran. Iran. J. Allergy Asthma Immunol. 2011, 10, 261–265. [Google Scholar]
  78. Vyshkina, T.; Leist, T.P.; Shugart, Y.Y.; Kalman, B. CD45 (PTPRC) as a candidate gene in multiple sclerosis. Mult. Scler. 2004, 10, 614–617. [Google Scholar] [CrossRef]
  79. Vidmar, L.; Maver, A.; Drulovic, J.; Sepcic, J.; Novakovic, I.; Ristic, S.; Sega, S.; Peterlin, B. Multiple Sclerosis patients carry an increased burden of exceedingly rare genetic variants in the inflammasome regulatory genes. Sci. Rep. 2019, 9, 9171. [Google Scholar] [CrossRef]
  80. Hecker, M.; Ruge, A.; Putscher, E.; Boxberger, N.; Rommer, P.S.; Fitzner, B.; Zettl, U.K. Aberrant expression of alternative splicing variants in multiple sclerosis—A systematic review. Autoimmun. Rev. 2019, 18, 721–732. [Google Scholar] [CrossRef]
  81. Bartkowska, K.; Swiatek, I.; Aniszewska, A.; Jurewicz, E.; Turlejski, K.; Filipek, A.; Djavadian, R.L. Stress-Dependent Changes in the CacyBP/SIP Interacting Protein S100A6 in the Mouse Brain. PLoS ONE 2017, 12, e0169760. [Google Scholar] [CrossRef]
  82. Karimi, N.; Motovali-Bashi, M.; Ghaderi-Zefrehei, M. Gene network reveals LASP1, TUBA1C, and S100A6 are likely playing regulatory roles in multiple sclerosis. Front. Neurol. 2023, 14, 1090631. [Google Scholar] [CrossRef]
  83. Tsai, M.H.; Lin, C.H.; Tsai, K.W.; Lin, M.H.; Ho, C.J.; Lu, Y.T.; Weng, K.P.; Lin, Y.; Lin, P.H.; Li, S.C. S100A6 Promotes B Lymphocyte Penetration Through the Blood-Brain Barrier in Autoimmune Encephalitis. Front. Genet. 2019, 10, 1188. [Google Scholar] [CrossRef] [PubMed]
  84. McEver, R.P. Selectins: Initiators of leucocyte adhesion and signalling at the vascular wall. Cardiovasc. Res. 2015, 107, 331–339. [Google Scholar] [CrossRef] [PubMed]
  85. Zhou, Q.; Rammohan, K.; Lin, S.; Robinson, N.; Li, O.; Liu, X.; Bai, X.F.; Yin, L.; Scarberry, B.; Du, P.; et al. CD24 is a genetic modifier for risk and progression of multiple sclerosis. Proc. Natl. Acad. Sci. USA 2003, 100, 15041–15046. [Google Scholar] [CrossRef]
  86. Patel, K.D.; Cuvelier, S.L.; Wiehler, S. Selectins: Critical mediators of leukocyte recruitment. Semin. Immunol. 2002, 14, 73–81. [Google Scholar] [CrossRef]
  87. Romero, X.; Sintes, J.; Engel, P. Role of SLAM family receptors and specific adapter SAP in innate-like lymphocytes. Crit. Rev. Immunol. 2014, 34, 263–299. [Google Scholar] [CrossRef] [PubMed]
  88. de Lange, K.M.; Moutsianas, L.; Lee, J.C.; Lamb, C.A.; Luo, Y.; Kennedy, N.A.; Jostins, L.; Rice, D.L.; Gutierrez-Achury, J.; Ji, S.G.; et al. Genome-wide association study implicates immune activation of multiple integrin genes in inflammatory bowel disease. Nat. Genet. 2017, 49, 256–261. [Google Scholar] [CrossRef]
  89. Zou, C.Y.; Guan, G.F.; Zhu, C.; Liu, T.Q.; Guo, Q.; Cheng, W.; Wu, A.H. Costimulatory checkpoint SLAMF8 is an independent prognosis factor in glioma. CNS Neurosci. Ther. 2019, 25, 333–342. [Google Scholar] [CrossRef] [PubMed]
  90. Qin, W.; Rong, X.; Yu, C.; Jia, P.; Yang, J.; Zhou, G. Knockout of SLAMF8 attenuates collagen-induced rheumatoid arthritis in mice through inhibiting TLR4/NF-kappaB signaling pathway. Int. Immunopharmacol. 2022, 107, 108644. [Google Scholar] [CrossRef]
  91. Zhang, Q.; Cheng, L.; Qin, Y.; Kong, L.; Shi, X.; Hu, J.; Li, L.; Ding, Z.; Wang, T.; Shen, J.; et al. SLAMF8 expression predicts the efficacy of anti-PD1 immunotherapy in gastrointestinal cancers. Clin. Transl. Immunol. 2021, 10, e1347. [Google Scholar] [CrossRef]
  92. Guo, M.; Cao, W.; Chen, S.; Tian, R.; Wang, L.; Liu, Q.; Zhang, L.; Wang, Z.; Zhao, M.; Lu, Q.; et al. TRIM10 binds to IFN-alpha/beta receptor 1 to negatively regulate type I IFN signal transduction. Eur. J. Immunol. 2021, 51, 1762–1773. [Google Scholar] [CrossRef]
  93. Jia, X.; Zhao, C.; Zhao, W. Emerging Roles of MHC Class I Region-Encoded E3 Ubiquitin Ligases in Innate Immunity. Front. Immunol. 2021, 12, 687102. [Google Scholar] [CrossRef]
  94. Meyer, M.; Gaudieri, S.; Rhodes, D.A.; Trowsdale, J. Cluster of TRIM genes in the human MHC class I region sharing the B30.2 domain. Tissue Antigens 2003, 61, 63–71. [Google Scholar] [CrossRef] [PubMed]
  95. Simon-Sanchez, J.; Schulte, C.; Bras, J.M.; Sharma, M.; Gibbs, J.R.; Berg, D.; Paisan-Ruiz, C.; Lichtner, P.; Scholz, S.W.; Hernandez, D.G.; et al. Genome-wide association study reveals genetic risk underlying Parkinson’s disease. Nat. Genet. 2009, 41, 1308–1312. [Google Scholar] [CrossRef] [PubMed]
  96. Lanata, C.M.; Nititham, J.; Taylor, K.E.; Chung, S.A.; Torgerson, D.G.; Seldin, M.F.; Pons-Estel, B.A.; Tusie-Luna, T.; Tsao, B.P.; Morand, E.F.; et al. Genetic contributions to lupus nephritis in a multi-ethnic cohort of systemic lupus erythematous patients. PLoS ONE 2018, 13, e0199003. [Google Scholar] [CrossRef]
  97. Bednarek, A.K.; Keck-Waggoner, C.L.; Daniel, R.L.; Laflin, K.J.; Bergsagel, P.L.; Kiguchi, K.; Brenner, A.J.; Aldaz, C.M. WWOX, the FRA16D gene, behaves as a suppressor of tumor growth. Cancer Res. 2001, 61, 8068–8073. [Google Scholar]
  98. Aldaz, C.M.; Hussain, T. WWOX Loss of Function in Neurodevelopmental and Neurodegenerative Disorders. Int. J. Mol. Sci. 2020, 21, 8922. [Google Scholar] [CrossRef] [PubMed]
  99. Wang, C.; Yang, Y.; Zhou, C.; Mei, X.; Liu, J.; Luo, K.; Zhou, J.; Qin, C.; Zeng, Z. WWOX activates autophagy to alleviate lipopolysaccharide-induced acute lung injury by regulating mTOR. Int. Immunopharmacol. 2023, 115, 109671. [Google Scholar] [CrossRef]
  100. Shin, M.J.; Kim, H.S.; Lee, P.; Yang, N.G.; Kim, J.Y.; Eun, Y.S.; Lee, W.; Kim, D.; Lee, Y.; Jung, K.E.; et al. Mechanistic Investigation of WWOX Function in NF-kB-Induced Skin Inflammation in Psoriasis. Int. J. Mol. Sci. 2023, 25, 167. [Google Scholar] [CrossRef] [PubMed]
  101. Kaluzinska-Kolat, Z.; Kolat, D.; Kosla, K.; Pluciennik, E.; Bednarek, A.K. Molecular landscapes of glioblastoma cell lines revealed a group of patients that do not benefit from WWOX tumor suppressor expression. Front. Neurosci. 2023, 17, 1260409. [Google Scholar] [CrossRef]
  102. International Multiple Sclerosis Genetics, C.; Beecham, A.H.; Patsopoulos, N.A.; Xifara, D.K.; Davis, M.F.; Kemppinen, A.; Cotsapas, C.; Shah, T.S.; Spencer, C.; Booth, D.; et al. Analysis of immune-related loci identifies 48 new susceptibility variants for multiple sclerosis. Nat. Genet. 2013, 45, 1353–1360. [Google Scholar] [CrossRef] [PubMed]
  103. Jakel, S.; Agirre, E.; Mendanha Falcao, A.; van Bruggen, D.; Lee, K.W.; Knuesel, I.; Malhotra, D.; Ffrench-Constant, C.; Williams, A.; Castelo-Branco, G. Altered human oligodendrocyte heterogeneity in multiple sclerosis. Nature 2019, 566, 543–547. [Google Scholar] [CrossRef]
  104. Park, Y.J.; Yoo, S.A.; Kim, M.; Kim, W.U. The Role of Calcium-Calcineurin-NFAT Signaling Pathway in Health and Autoimmune Diseases. Front. Immunol. 2020, 11, 195. [Google Scholar] [CrossRef] [PubMed]
  105. Macian, F. NFAT proteins: Key regulators of T-cell development and function. Nat. Reviews. Immunol. 2005, 5, 472–484. [Google Scholar] [CrossRef] [PubMed]
  106. Kook, S.Y.; Hong, H.S.; Moon, M.; Ha, C.M.; Chang, S.; Mook-Jung, I. Abeta(1)(-)(4)(2)-RAGE interaction disrupts tight junctions of the blood-brain barrier via Ca(2)(+)-calcineurin signaling. J. Neurosci. Off. J. Soc. Neurosci. 2012, 32, 8845–8854. [Google Scholar] [CrossRef] [PubMed]
  107. Stergioti, E.M.; Manolakou, T.; Boumpas, D.T.; Banos, A. Antiviral Innate Immune Responses in Autoimmunity: Receptors, Pathways, and Therapeutic Targeting. Biomedicines 2022, 10, 2820. [Google Scholar] [CrossRef] [PubMed]
  108. Edgar, R.; Domrachev, M.; Lash, A.E. Gene Expression Omnibus: NCBI gene expression and hybridization array data repository. Nucleic Acids Res. 2002, 30, 207–210. [Google Scholar] [CrossRef] [PubMed]
  109. Parkinson, H.; Kapushesky, M.; Shojatalab, M.; Abeygunawardena, N.; Coulson, R.; Farne, A.; Holloway, E.; Kolesnykov, N.; Lilja, P.; Lukk, M.; et al. ArrayExpress--a public database of microarray experiments and gene expression profiles. Nucleic Acids Res. 2007, 35, D747–D750. [Google Scholar] [CrossRef]
  110. Gandhi, K.S.; McKay, F.C.; Cox, M.; Riveros, C.; Armstrong, N.; Heard, R.N.; Vucic, S.; Williams, D.W.; Stankovich, J.; Brown, M.; et al. The multiple sclerosis whole blood mRNA transcriptome and genetic associations indicate dysregulation of specific T cell pathways in pathogenesis. Hum. Mol. Genet. 2010, 19, 2134–2143. [Google Scholar] [CrossRef]
  111. Visentin, L.; Scarpellino, G.; Chinigo, G.; Munaron, L.; Ruffinatti, F.A. BioTEA: Containerized Methods of Analysis for Microarray-Based Transcriptomics Data. Biology 2022, 11, 1346. [Google Scholar] [CrossRef] [PubMed]
  112. Del Carratore, F.; Jankevics, A.; Eisinga, R.; Heskes, T.; Hong, F.; Breitling, R. RankProd 2.0: A refactored bioconductor package for detecting differentially expressed features in molecular profiling datasets. Bioinformatics 2017, 33, 2774–2775. [Google Scholar] [CrossRef]
  113. Szklarczyk, D.; Gable, A.L.; Nastou, K.C.; Lyon, D.; Kirsch, R.; Pyysalo, S.; Doncheva, N.T.; Legeay, M.; Fang, T.; Bork, P.; et al. The STRING database in 2021: Customizable protein-protein networks, and functional characterization of user-uploaded gene/measurement sets. Nucleic Acids Res. 2021, 49, D605–D612. [Google Scholar] [CrossRef] [PubMed]
  114. Shannon, P.; Markiel, A.; Ozier, O.; Baliga, N.S.; Wang, J.T.; Ramage, D.; Amin, N.; Schwikowski, B.; Ideker, T. Cytoscape: A software environment for integrated models of biomolecular interaction networks. Genome Res. 2003, 13, 2498–2504. [Google Scholar] [CrossRef] [PubMed]
Figure 1. In the dot plot, we report all of the genes explored in the DEA for each dataset. The line that intercepts the y-axis is related to our threshold of significance for the q-values (0.05); all of the genes above this line are considered to be differentially expressed. On the x-axis, we report the log2 fold change that discriminates up- and down-regulated DEGs. DEGs resulted significantly up-regulated are highlighted in red, while DEG significantly down-regulated are highlighted in green. Genes not differentially expressed are reported in gray. Labels reports the top 10 significant DEGs that survived the filtering step (please refer to Section 2.3).
Ijms 25 03374 g001
Figure 2. Network composed of the 100 DEGs related to RuLu. The subnetwork composed of the 38 CLUp DEGs is highlighted in red. All of these DEGs were found to be up-regulated in both brain and blood tissues of SPMS patients.
Ijms 25 03374 g002
Figure 3. This plot shows the enriched ontologies resulting from the ORA for the RuLu and CLUp DEGs, respectively. The size of the bubble represents the ratio of DEGs divided by the total number of genes composing each ontology term (in %). The hue represents the significance scores (−log10 FDR). The x-axis indicates the ontologies used: biological processes (BPs), cellular components (CCs), and molecular functions (MFs).
Ijms 25 03374 g003
Figure 4. This figure highlights the interactions between the enriched ontologies for the DEGs belonging to the RuLu group. The BP ontologies are outlined in blue, while the CC ontologies are outlined in green. The hue represents the significance of the nodes, with red being more significant. Ontologies with a high number of shared genes were automatically fused together.
Ijms 25 03374 g004
Figure 5. In this chord plot, we report the CLUp DEGs (left-hand side) and the phenotypic groups in which they were differentially expressed (right-hand side). On the left, the outer ring reports the expression status in SPMS patients, while the inner one reports the expression status in RRMS patients. Red genes are up-regulated and green are down-regulated, while gray represents no differential expression. DEGs belonging to the CLUp group are linked to the red sector on the right-hand side; DEGs belonging to the RuLu group are linked to the green sector; and genes found to also be differentially expressed in RRMS patients are linked to the blue sector. The 21 selected genes were up-regulated in SPMS (outer ring in red) and down-regulated or not DEGs in RRMS (inner ring in gray or green).
Ijms 25 03374 g005
Figure 6. The flowchart of our analysis. The filtering step was performed by applying the cut-off described in Section 2.3. A similar cut-off was also applied for the RRMS DEGs before the pruning step. Details of the DEGs obtained in the DEA are reported in the Supplementary Materials.
Ijms 25 03374 g006
Table 1. SPMS-specific biological processes based on the three-layered comparison.
TermOverlapp-Valueq-ValueGenes
Negative regulation of calcineurin–NFAT signaling cascade (GO:0070885)3/115.32 × 10−53.51 × 10−2HOMER2; FHL2;
HOMER3
Negative regulation of calcineurin-mediated signaling (GO:0106057)3/115.32 × 10−53.51 × 10−2HOMER2; FHL2;
HOMER3
Regulation of defense response to virus by host (GO:0050691)4/371.27 × 10−44.19 × 10−2DHX9; CGAS; TARBP2; MICB
In table, we report the biological processes (BPs) significantly enriched from the genes with different expression patterns observed in SPMS and RRMS. From the list of BPs, we filtered out the processes that were significantly enriched from the genes with the same expression patterns observed in SPMS and RRMS.
Table 2. Descriptives of the samples under investigation.
DatasetTissueSecondary Progressive
(SPMS)
Relapsing–Remitting
(RRMS)
Healthy Controls
(HCs)
References
n% FemalesMean Agen% FemalesMean Agen% FemalesMean Age
GSE126802Brain18100.0%61.3 ± 13.4---9100.0%61.7 ± 10.1[16]
GSE131282Brain2373.9%75.1 ± 14.8---1428.6%58.5 ± 14.5[17]
GSE17048Blood2075.0%57.5 ± 9.83680.6%48.5 ± 9.04564.4%48.5 ± 13.5[18,110]
E-MTAB-4890Blood2152.4%54.3 ± 11.15261.5%37.4 ± 10.24050.0%33.3 ± 10.4[20]
E-MTAB-5151Blood1369.2%41.8 ± 9.32157.1%41.2 ± 8.12748.2%42.4 ± 9.1[21]
E-MTAB-11415Blood2147.6%54.4 ± 11.15360.4%37.4 ± 10.14050.0%33.4 ± 10.5[19]
In table, we report for each dataset the number of subjects (n), the percentage of females, and the mean age for each group (SPMS, RRMS, and HCs) used in our investigation. The original submitters’ publications are also indicated in the References column.
Disclaimer/Publisher’s Note: The statements, opinions and data contained in all publications are solely those of the individual author(s) and contributor(s) and not of MDPI and/or the editor(s). MDPI and/or the editor(s) disclaim responsibility for any injury to people or property resulting from any ideas, methods, instructions or products referred to in the content.

