Article

Genome-Wide Association Analysis of Effective Tillers in Rice under Different Nitrogen Gradients

1
College of Agriculture, Shenyang Agricultural University, Shenyang 110866, China
2
College of Agriculture, Northeast Agricultural University, Harbin 150030, China
3
Shenzhen Branch, Guangdong Laboratory for Lingnan Modern Agriculture, Agricultural Genomics Institute at Shenzhen, Chinese Academy of Agricultural Sciences, Shenzhen 518120, China
*
Authors to whom correspondence should be addressed.
Int. J. Mol. Sci. 2024, 25(5), 2969; https://doi.org/10.3390/ijms25052969
Submission received: 14 January 2024 / Revised: 14 February 2024 / Accepted: 27 February 2024 / Published: 4 March 2024
(This article belongs to the Special Issue Molecular Research in Rice, 2nd Edition)

Abstract

:
Nitrogen is a crucial element that impacts rice yields, and effective tillering is a significant agronomic characteristic that can influence rice yields. The way that reduced nitrogen affects effective tillering is a complex quantitative trait that is controlled by multiple genes, and its genetic basis requires further exploration. In this study, 469 germplasm varieties were used for a genome-wide association analysis aiming to detect quantitative trait loci (QTL) associated with effective tillering at low (60 kg/hm2) and high (180 kg/hm2) nitrogen levels. QTLs detected over multiple years or under different treatments were scrutinized in this study, and candidate genes were identified through haplotype analysis and spatio-temporal expression patterns. A total of seven genes (NAL1, OsCKX9, Os01g0690800, Os02g0550300, Os02g0550700, Os04g0615700, and Os04g06163000) were pinpointed in these QTL regions, and were considered the most likely candidate genes. These results provide favorable information for the use of auxiliary marker selection in controlling effective tillering in rice for improved yields.

1. Introduction

Rice is one of the world’s most important food crops. For example, in 2018, it was the primary source of nutrition for more than 50% of the world’s population [1], and rice production accounted for 32.24% of China’s total grain production (http://www.stats.gov.cn/, accessed on 2 November 2022). As the world’s population continues to increase, the area of arable land is gradually decreasing. Thus, providing higher rice yields is a top priority in the context of meeting the food demands of an increasing population [2]. Ensuring high rice yields while reducing nitrogen fertilizer application is a crucial challenge for rice breeding researchers. In recent years, significant progress has been made in efficiently utilizing nitrogen in rice. Several genes, such as DEP1 [3], NRT1.1B [4,5], GRF4 [6], NGR5 [7], and Nhd1 [8], have been cloned and identified. These genes are expected to greatly enhance both yield and nitrogen utilization in rice. Thus, prioritizing higher rice yields is essential to meet the food demands of a growing population. Tiller production and development in rice are closely related to the presence of nitrogen. However, excessive nitrogen fertilizer application makes tillers compete with main branches for resources, leading to excessive tillering, which in turn reduces grain yield and lowers the nitrogen uptake rate [9]. The quantity of effective tillers directly influences the number of spikes per plant, subsequently affecting rice yield. Rice tillering is regulated by multiple genes. For instance, the first cloned rice tiller-related gene, MOC1 [10], stimulates tiller elongation while preventing tiller shoot formation and axillary meristem initiation. Solanum lactones (SLs) are a category of terpenoid phytohormones that inhibit the growth of tiller shoots in rice [11]. Mutations in HTD3 result in the upregulation of several solanum lactone and abscisic acid-related genes, leading to a moderate increase in rice tillering. Typical SL mutants exhibit dwarfism and increased tillering. The most critical factors for SL synthesis are HTD1/D17 [12], D10 [13], and D27) [14], which are responsible for SL synthesis, and HTD2/D14 [15] and D53 [16], which are responsible for SL signaling. Previous studies have shown increased tiller numbers and yields by increasing nitrogen uptake, while OsNLP4-OsNiR [17] increases tiller number and output by enhancing nitrogen assimilation and nitrogen use efficiency (NUE). Furthermore, nitrogen-induced OsmiR393 [18] attenuates the sensitivity of axillary buds to growth hormones while promoting rice tillering. Four significant low nitrogen-induced growth response agronomic traits have been investigated, including plant height, tiller number, chlorophyll content, and leaf length [19]. It has also been found that OsNR2 increased effective tiller number, seed yield, and NUE in japonica rice, while also enhancing its effect via interactions with additional infiltrated indica OsNRT1.1B alleles [20].
With the achievements of the Rice Genome Project, additional genes and quantitative trait loci (QTL) have been discovered [21]. Genome-wide association studies (GWAS) provide an effective method for identifying QTL associated with complex agronomic traits. GWAS has previously been successfully applied to many other plant species, including Arabidopsis [22,23], maize [24], and cotton [25]. For the genetic dissection of agronomic traits in rice, GWAS has identified genes controlling grain type, including the OsSNB gene [26], while OsSPL18 has been shown to control rice grain size [27]. Furthermore, D88/D14 [28] regulates branching and affects spike structure. There are many relevant reports on the response of rice to nitrogen. For example, the Ghd7 transcription factor represses ARE1 expression while improving nitrogen utilization and seed yield in rice [29]. However, genes involved in the response of rice tillers to low nitrogen remain relatively unexplored, and the genetic basis and molecular mechanism of the reaction of rice tillers to nitrogen have not yet been clarified.
In this study, 469 germplasm resources (including 267 japonica rice and 202 indica rice) from the Rice SNP-Seek Database (https://snp-seek.irri.org/, accessed on 4 May 2020) were used to determine the effective tillers of rice at different nitrogen levels in 2021 and 2022. Genome-wide association analysis was employed to identify the QTL associated with effective tillers of rice under different nitrogen levels. The candidate genes were then refined through haplotype analysis and gene function annotation. These results provide essential genomic resources for rice breeding and establish a solid foundation for investigating the genetic basis of achieving synergistic high yield and quality of rice with reduced nitrogen fertilizer application.

2. Results

2.1. Phenotypic Variation

To assess the phenotypic variation of 469 rice varieties under low and high nitrogen conditions, the frequency distribution statistics of effective tillers were determined over two years (2021 and 2022) for the whole, indica, and japonica populations. The phenotypes of each population exhibited continuous distribution, consistent with the genetic characteristics of quantitative traits controlled by multiple genes (Figure 1, Table S5).
Compared to that of the high nitrogen conditions, the rice ETN was observed to be decreased under low nitrogen conditions, and the indica subpopulation ETN was higher than that of the japonica subpopulation for both years under both nitrogen conditions. ETN had coefficients of variation ranging from 29.06% to 32.30% under low nitrogen conditions, compared to 29.00% to 35.15% under high nitrogen conditions (Table 1).

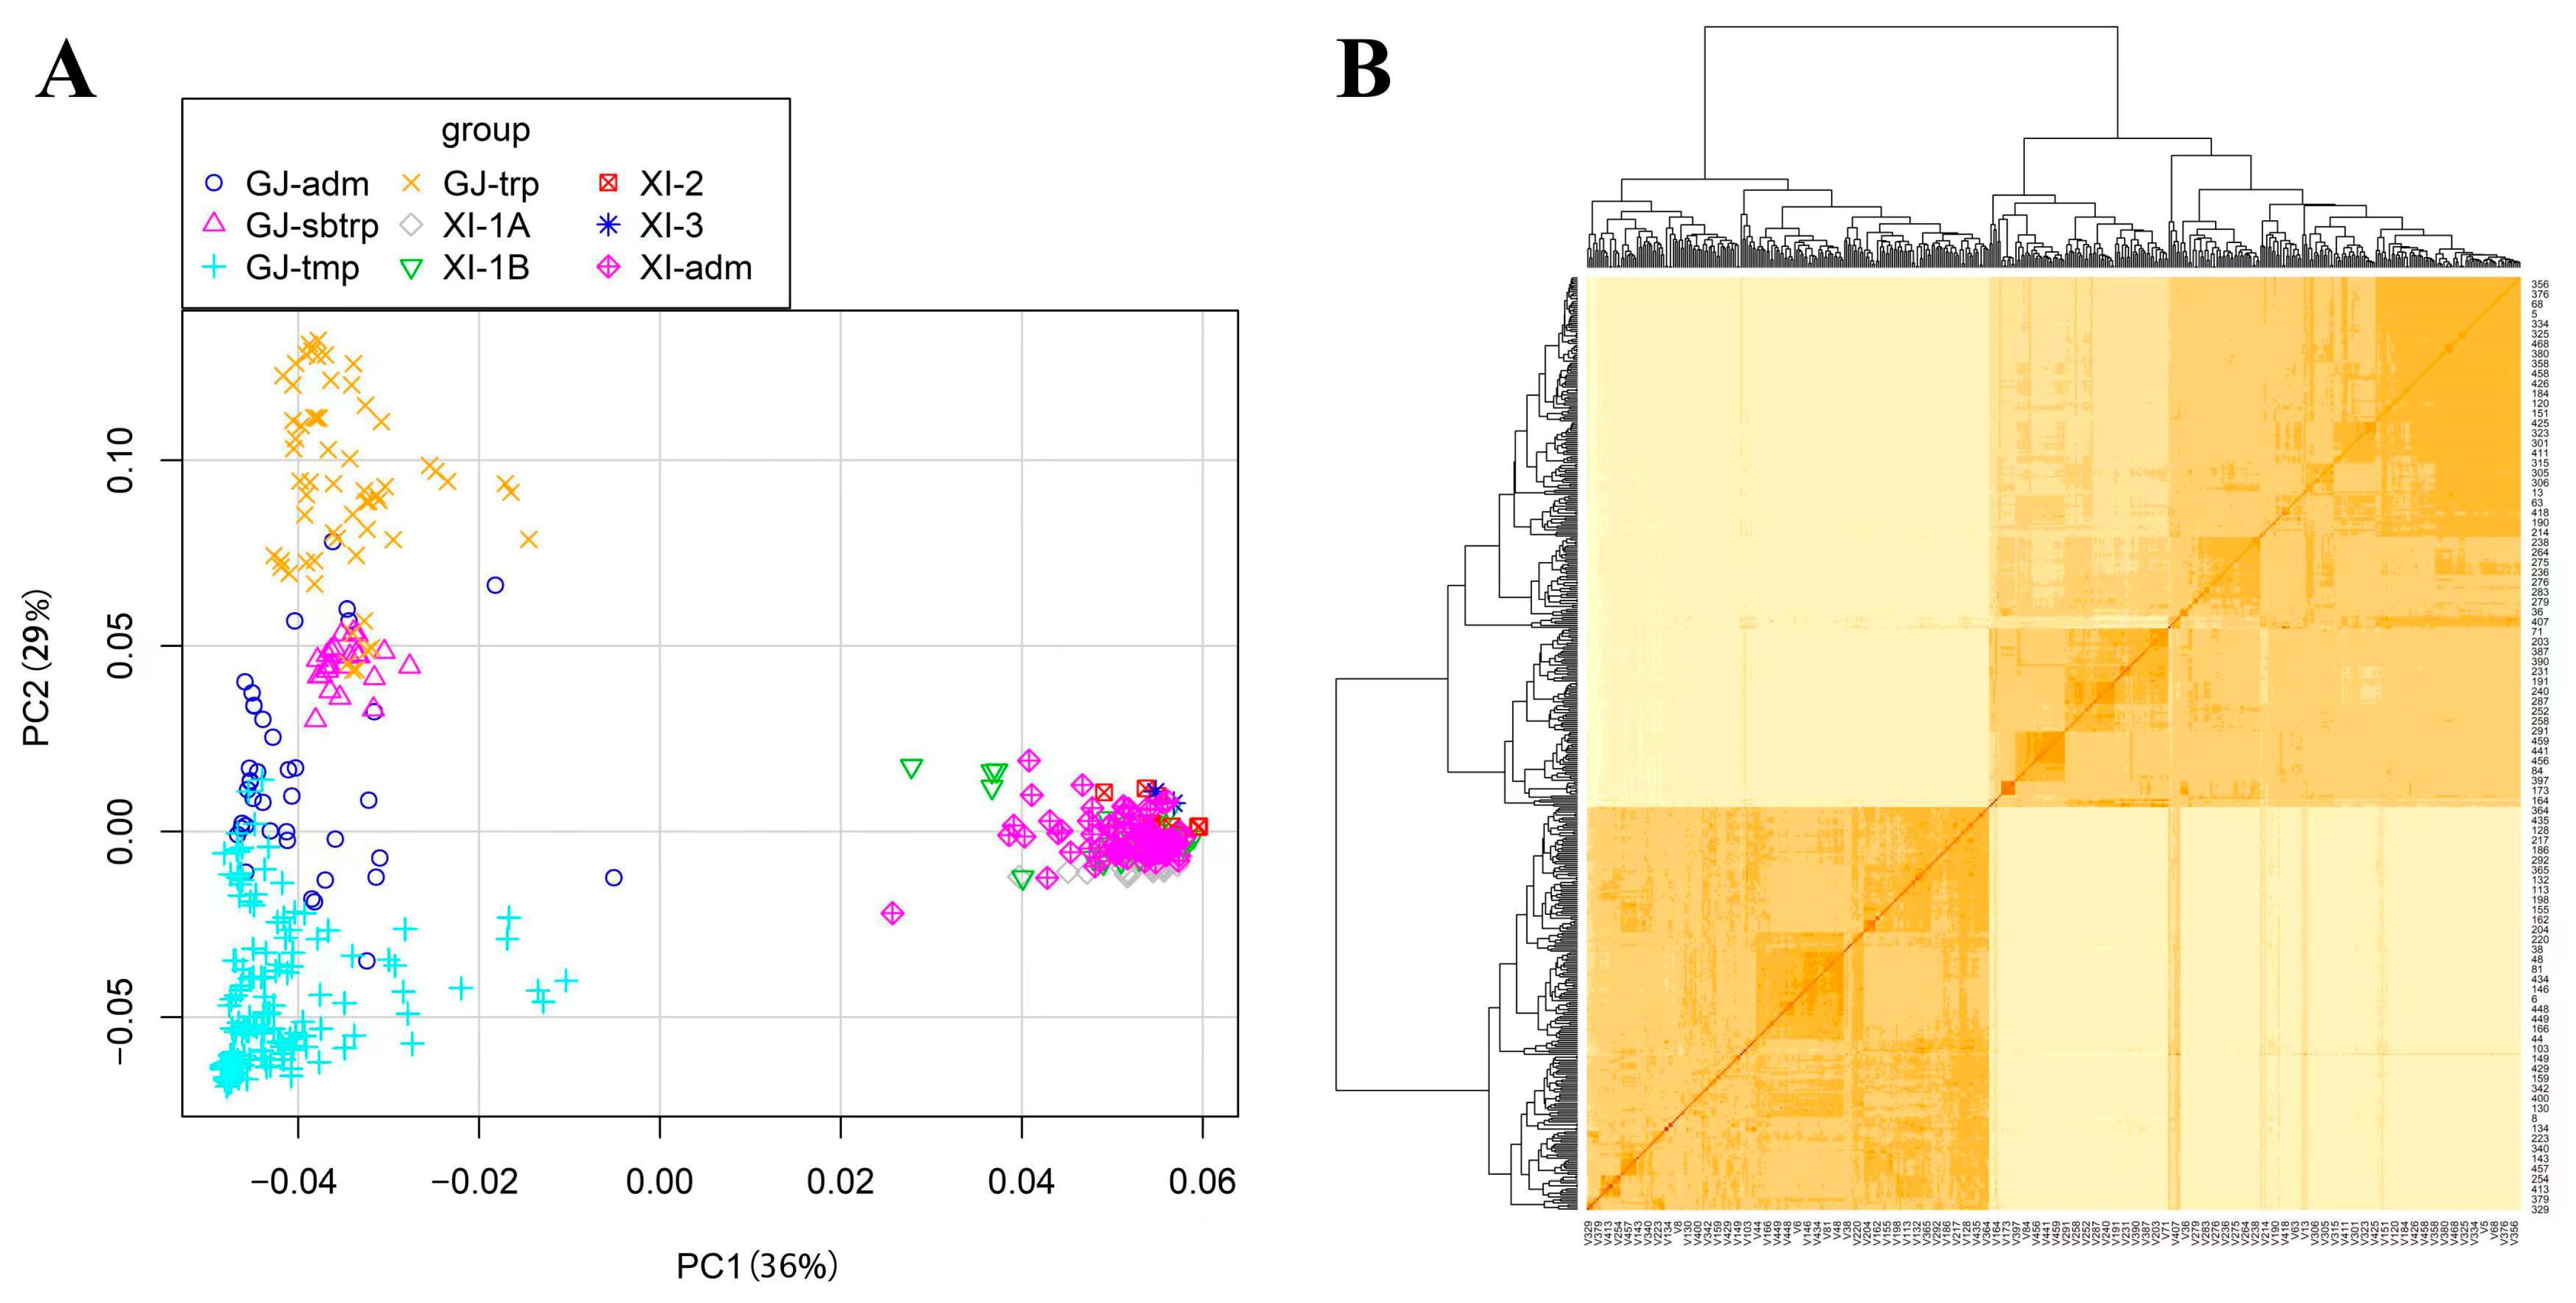
2.2. SNP Validation and Population Structure Analysis

A total of 2,801,841 high-quality SNPs were obtained, with a missing rate lower than 20% and a minor allele frequency (MAF) of >5%. An ultra-dense SNP genetic map was constructed based on the distribution of SNPs on chromosomes (Figure S1). These SNP markers were densely and evenly distributed across the rice genome, covering a total length of 373.05 Mb. The average distance between two adjacent SNPs on the 12 chromosomes was 133.96 bp. Among these, the average distance between SNPs on chromosome 5 was 162.75 bp, and on chromosome 10, it was 108.13 bp. Chromosome 1 had the longest length of 43.25 Mb, with 339,631 labeled SNPs, while chromosome 9 had the shortest length of 22.95 Mb and the least number of SNPs, with 162,135 SNPs (Table S2).
PCA and relatedness (KI) were used to quantify the population structure of the 469 germplasm varieties. PCA showed that the 469 germplasm varieties were distinguished into two populations, the indica subpopulation and the japonica subpopulation, which were refined to reduce false positives and divided further into nine populations, four japonica groups and five indica groups (Figure 2A). Kinship analysis showed convergence in two directions, with a distinct division into indica and japonica subpopulations, consistent with the PCA results (Figure 2B).

2.3. ETN-Related QTL Detected by GWAS

To detect genome-wide associated loci with ETNs, GWAS was performed utilizing 2,801,841 high-quality SNPs and phenotypic data. The GWAS was conducted using a mixed linear model in the EMMAX program. After applying the Bonferroni correction, the p-values were estimated to have suggestive and significant thresholds of 1 × 10⁻⁵ based on the independent markers (Table S3). A total of 50 ETN-related QTL intervals were obtained, distributed on chromosomes 1, 2, 3, 4, 5, 6, 7, 8, 10, 11 and 12. 24 QTLs were detected in 2021. 26 QTLs were detected in 2022, among them, 13 QTLs were detected under low nitrogen conditions, which were named qLETN2-1, qLETN2-4, qLETN2-5, qLETN2-6, qLETN2-7, qLETN3-1, qLETN4-1, qLETN4-3, qLETN5-1, qLETN5-1, qLETN6-1, qLETN7-1, and qLETN8-1. Six QTLs were detected under high nitrogen conditions, which were named qHETN1-2, qHETN1-3, qHETN2-8, qHETN8-2, qHETN10-1 and qHETN12-2. Seven QTLs were detected under NRI conditions, which were named qNRI2-4, qNRI2-5, qNRI2-6, NRI2-7, qNRI5-3, qNRI7-2 and qNRI9-1 (Figure 2B, Table S4). In this study, we screened QTLs that were co-detected under different treatments or co-detected over 2 years. A total of 28 QTLs were screened, and distributed on 10 chromosomes (Table 2).

2.4. ETN-Related QTL Co-Localized with Previously Reported Rice Tillering Genes

In this study, two genes co-localized with tillering-related genes from previous studies, including NAL1 and OsCKX9. OsCKX9 is a cytokinin oxidase/dehydrogenase (CKXs), which belongs to a group of enzymes that regulate oxidative cleavage to maintain cytokinin homeostasis. The OsCKX9 double mutant increased the number of tillers and the number of panicles per plant [32]. The LD of OsCKX9 is shown in Figure 3A. OsCKX9 was located 1.1 kb upstream of the peak SNP (rs5_18033587) of qLETN5-1. Additionally, three nonsynonymous SNPs were identified in the CDS region, which contained two haplotypes of OsCKX9. Most of the indica rice populations contained haplotype 2. Furthermore, the ETN of haplotype 2 were higher than those of haplotype 1 throughout the indica and whole populations (Figure 3B).
NAL1, which was initially cloned from a loss-of-function mutant showing narrow leaves and increased tiller number, was identified [33]. The LD of NAL1 is shown in Figure 4A. NAL1 was located approximately 21.06 kb upstream of the peak SNP (rs4_31224587) of qLETN4-3. Five SNPs located in the promoter region and coding sequence (CDS) region of NAL1 formed three haplotypes. Varieties containing haplotype 3 had a significantly higher ETN than those of haplotype 2 within the japonica rice population (Figure 4B).

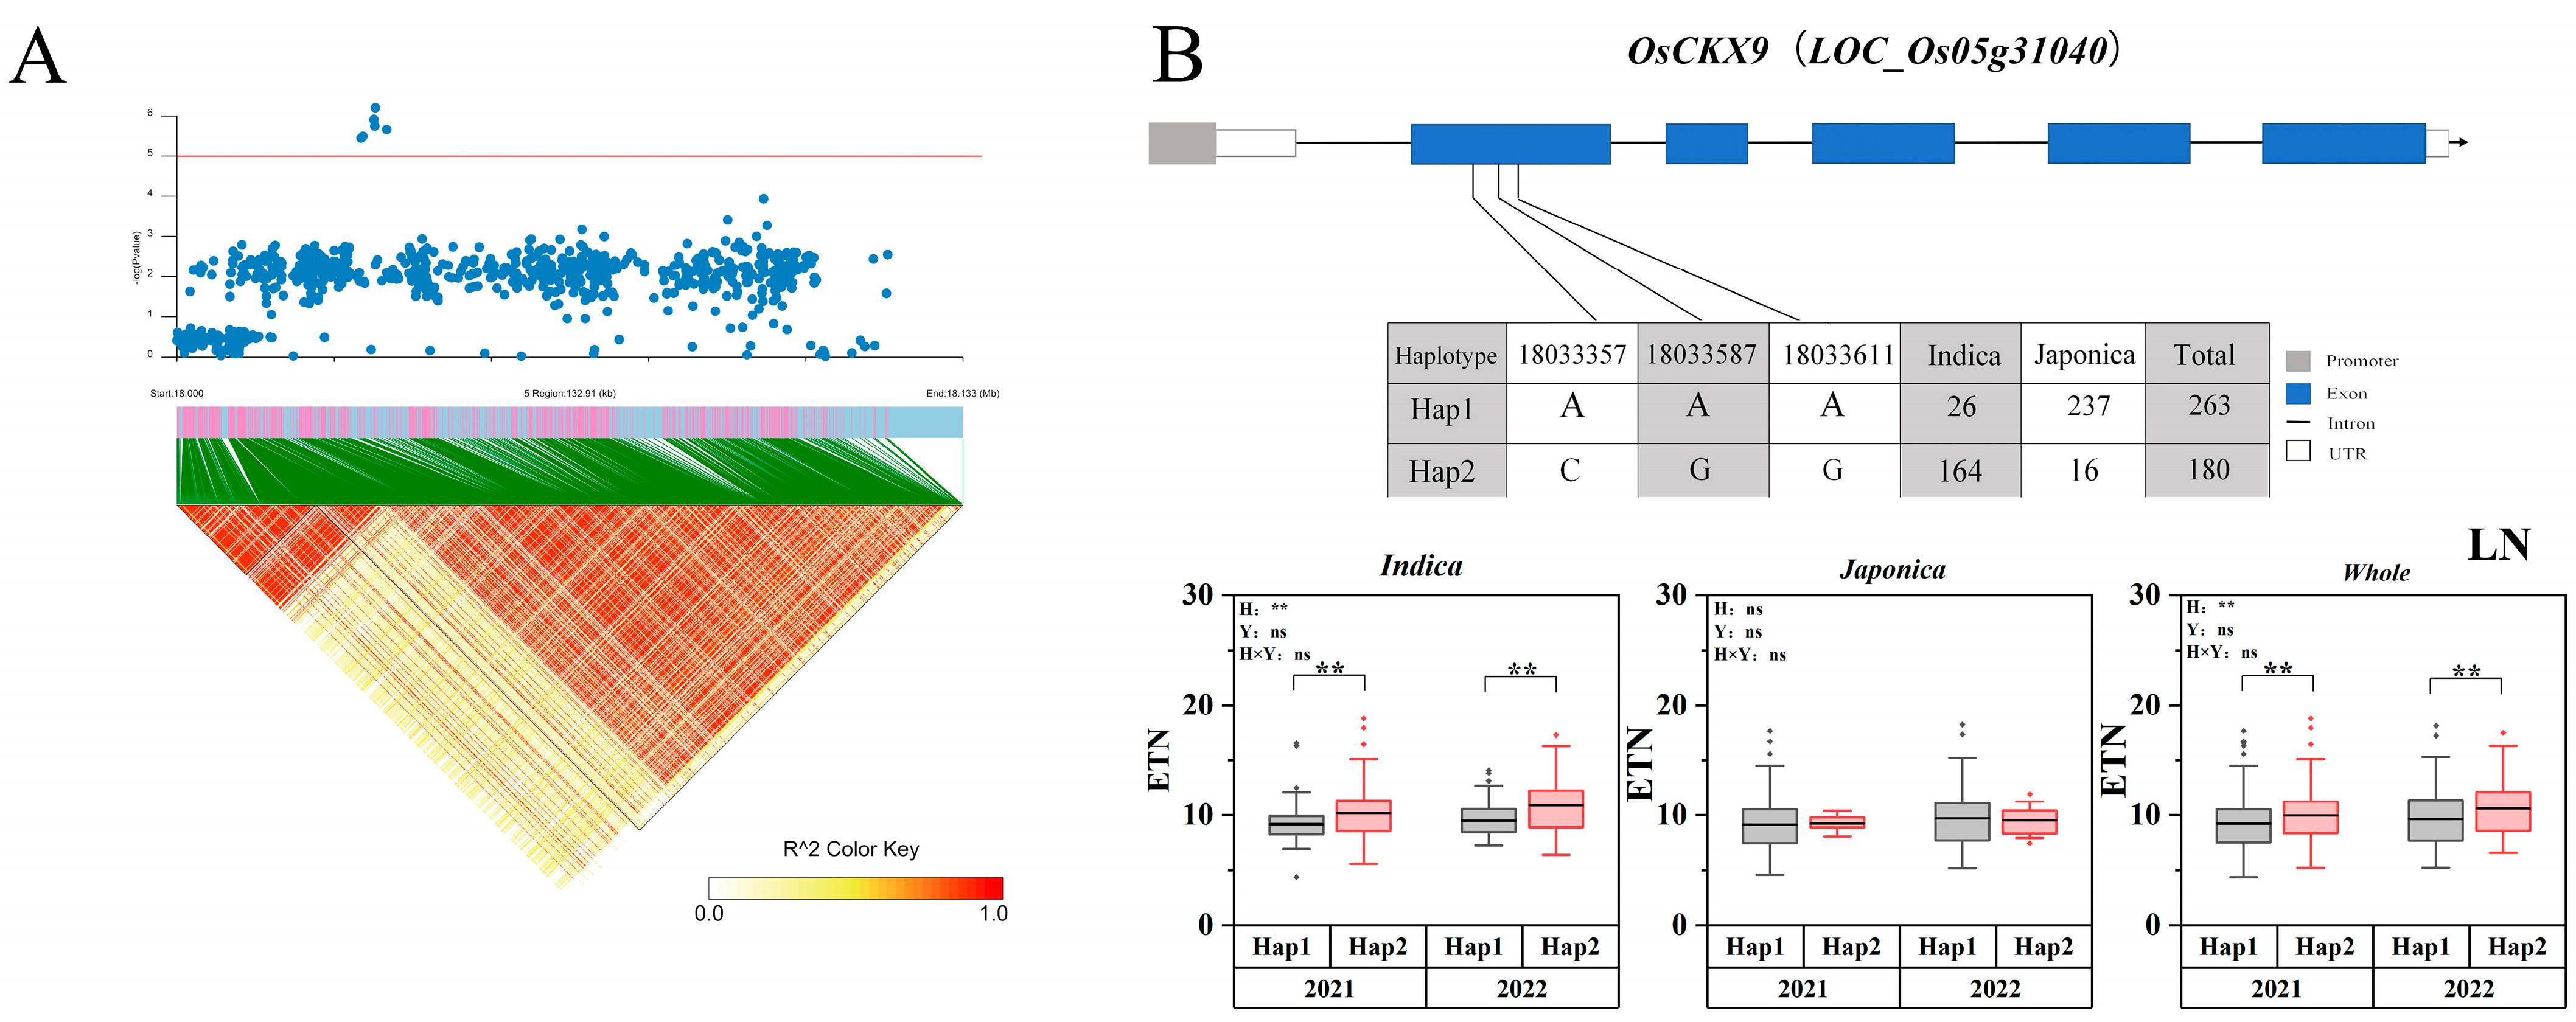
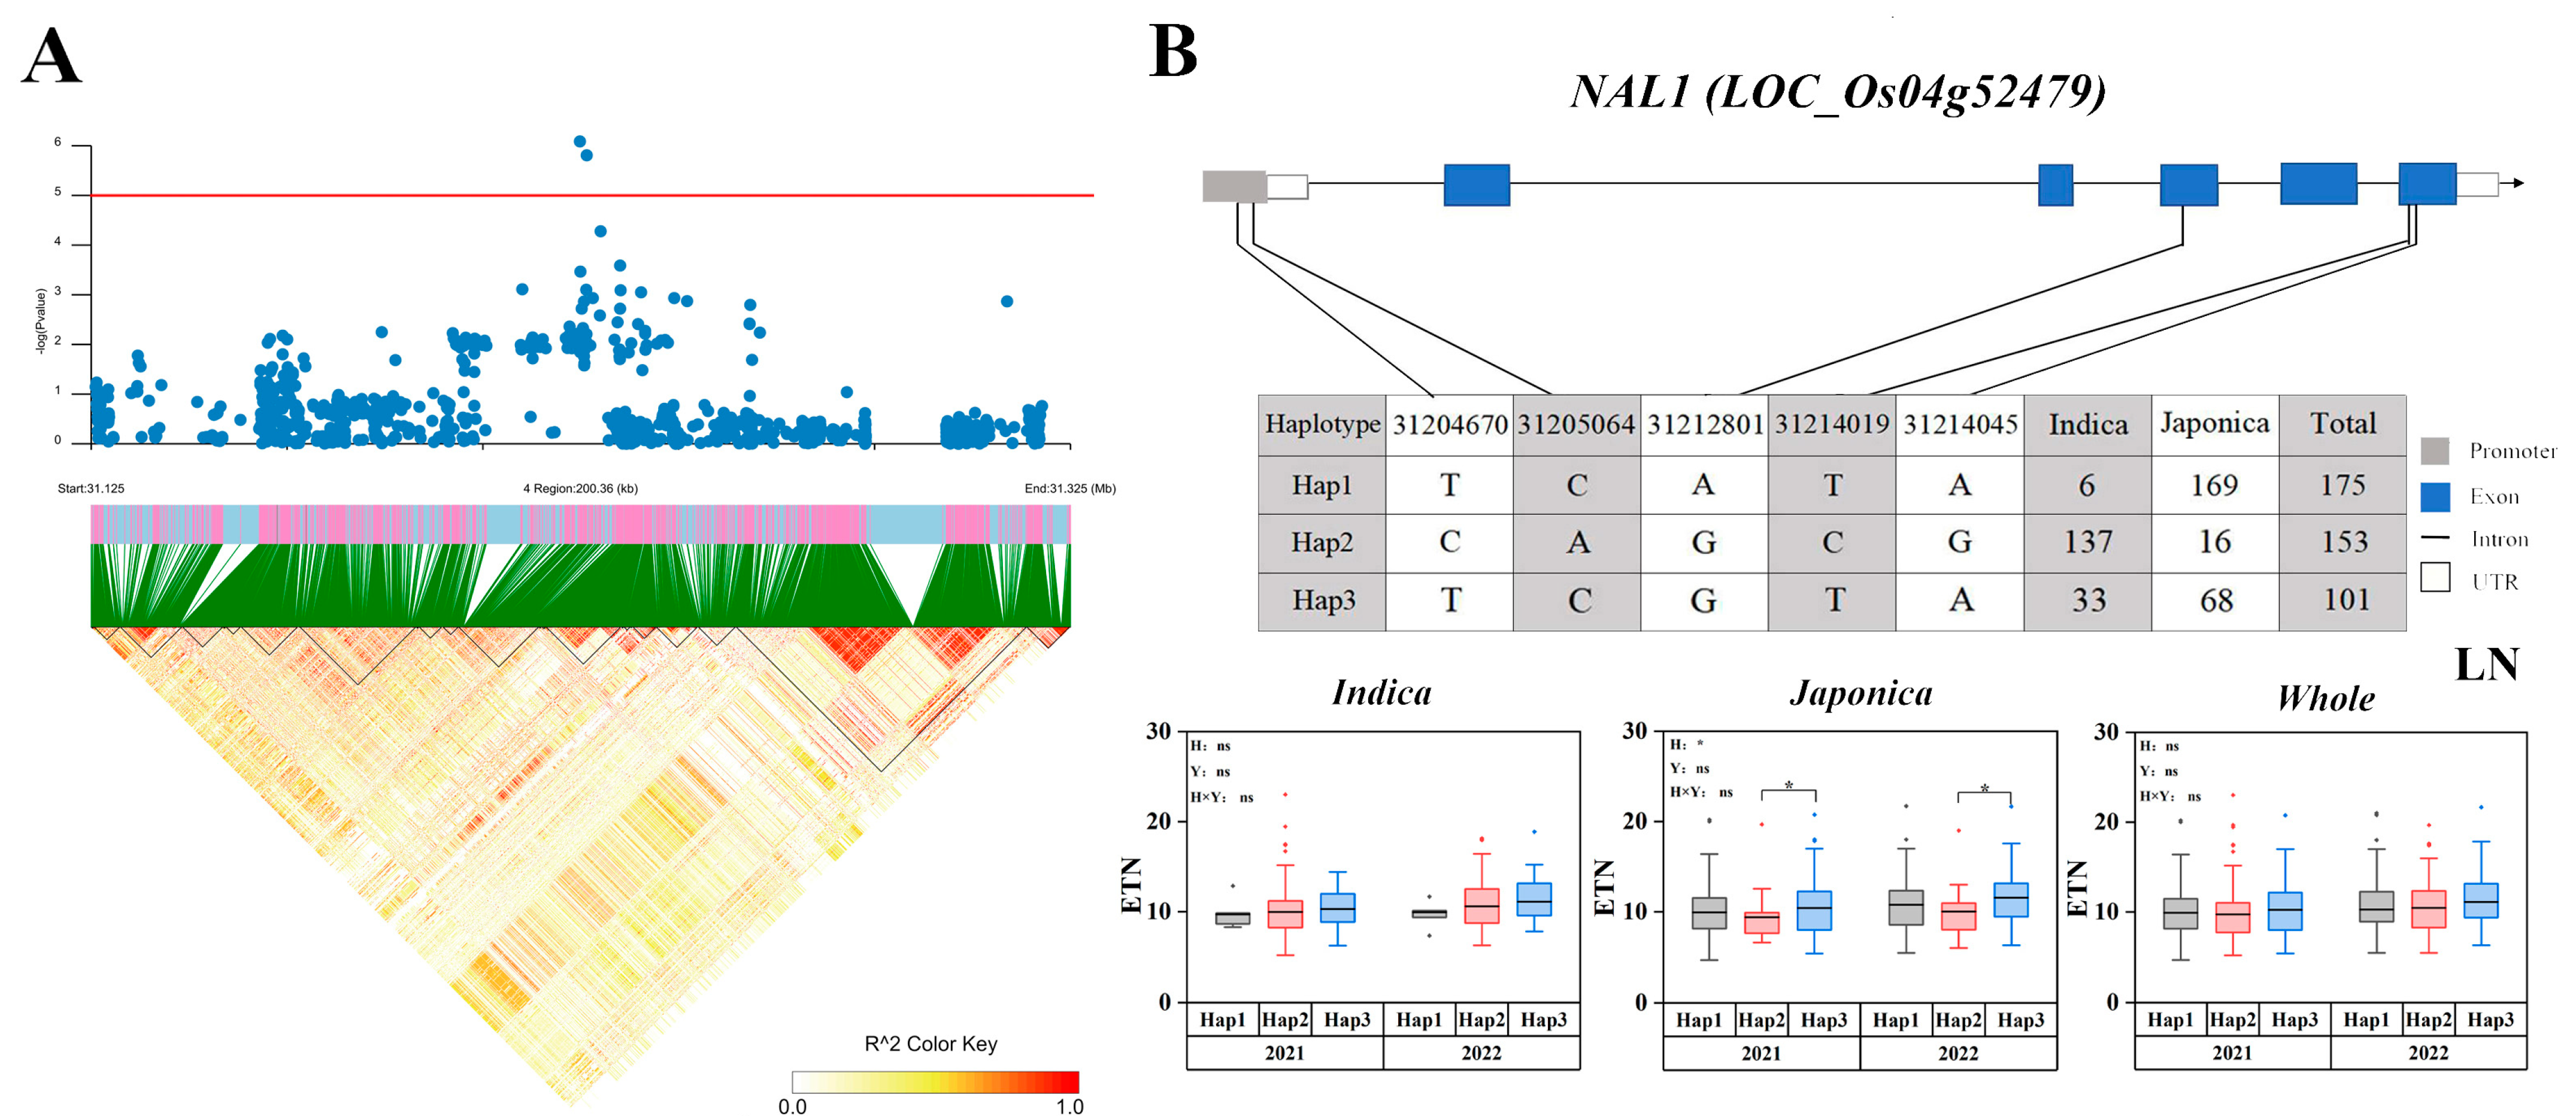
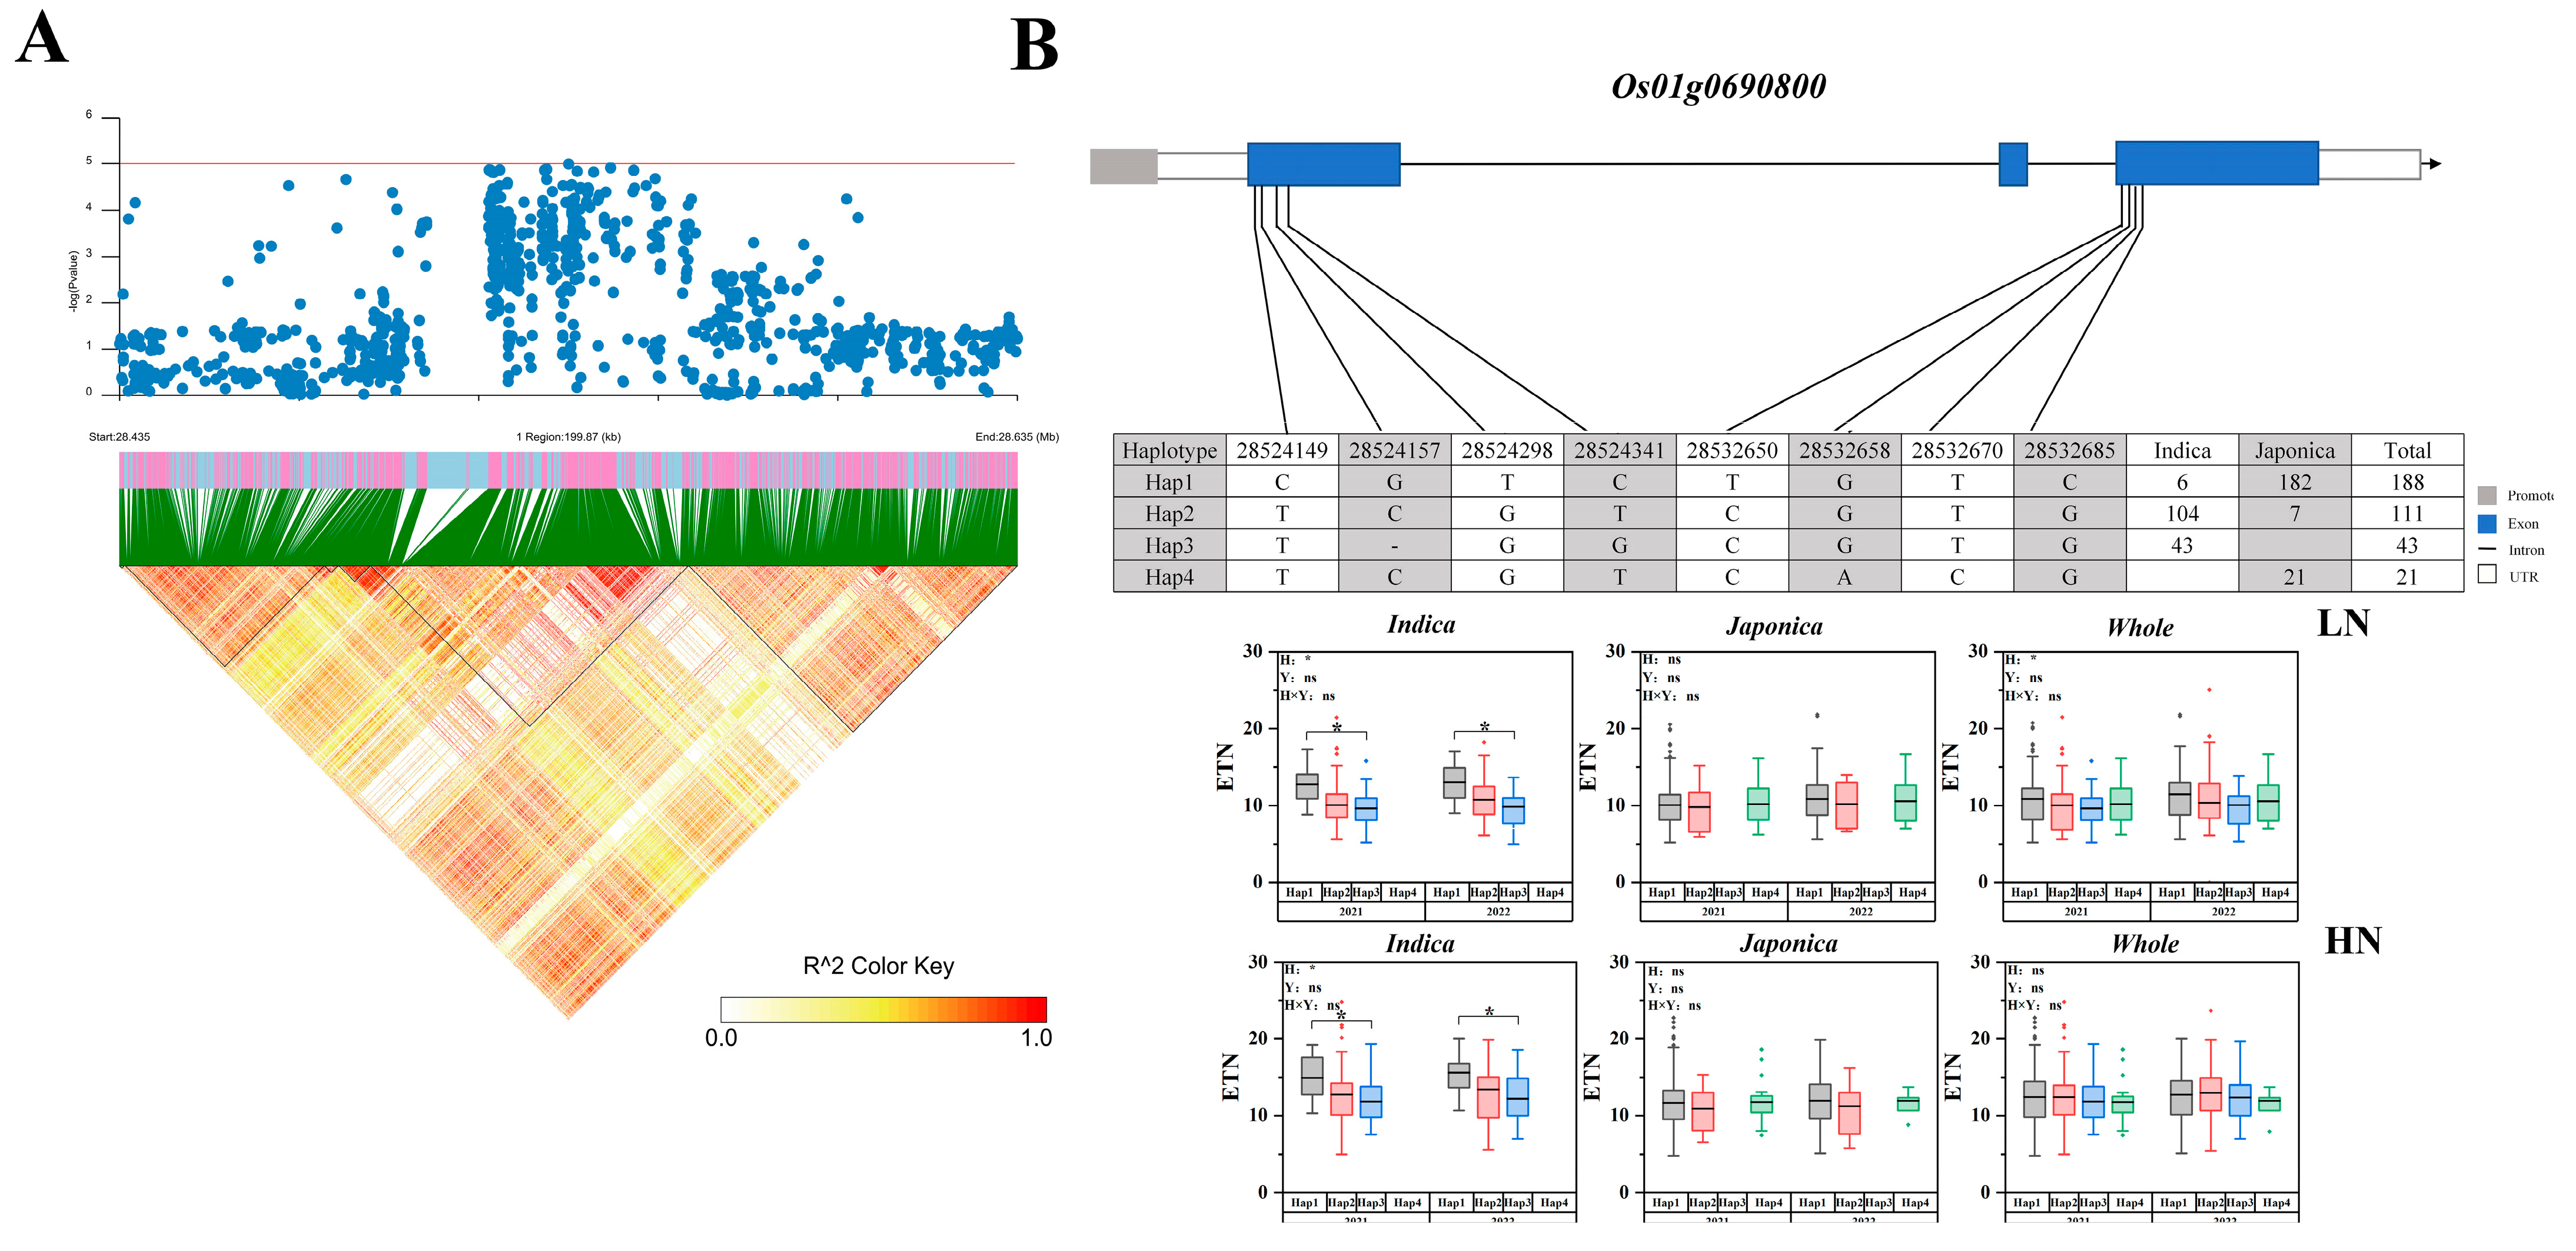
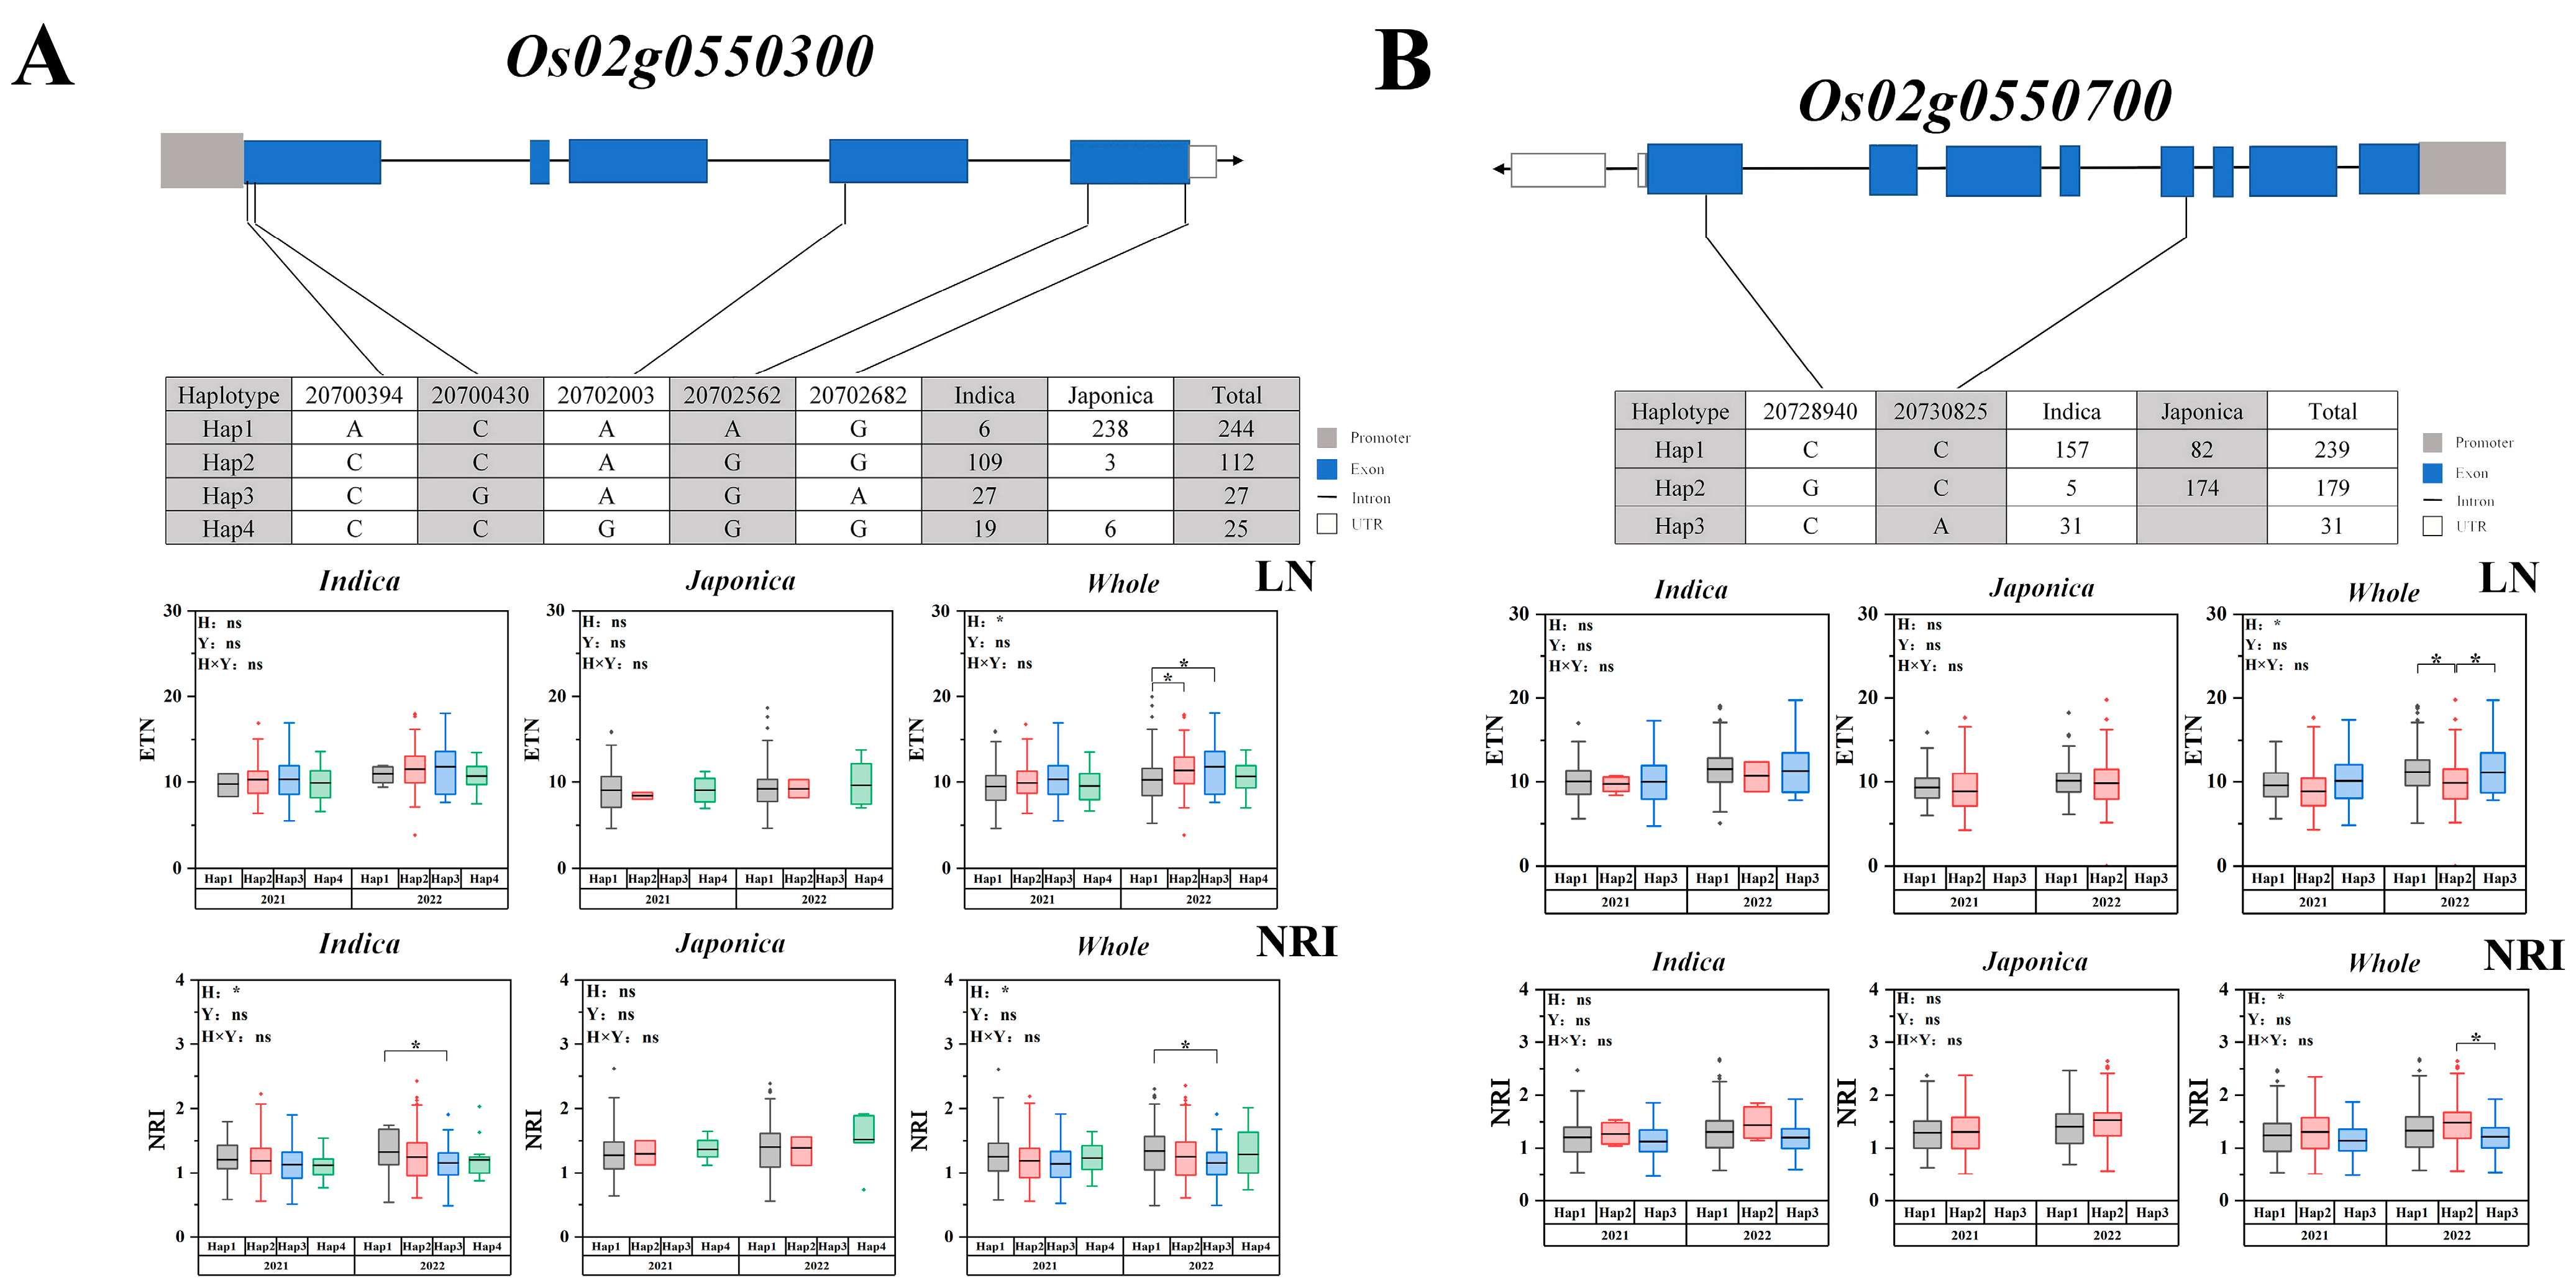
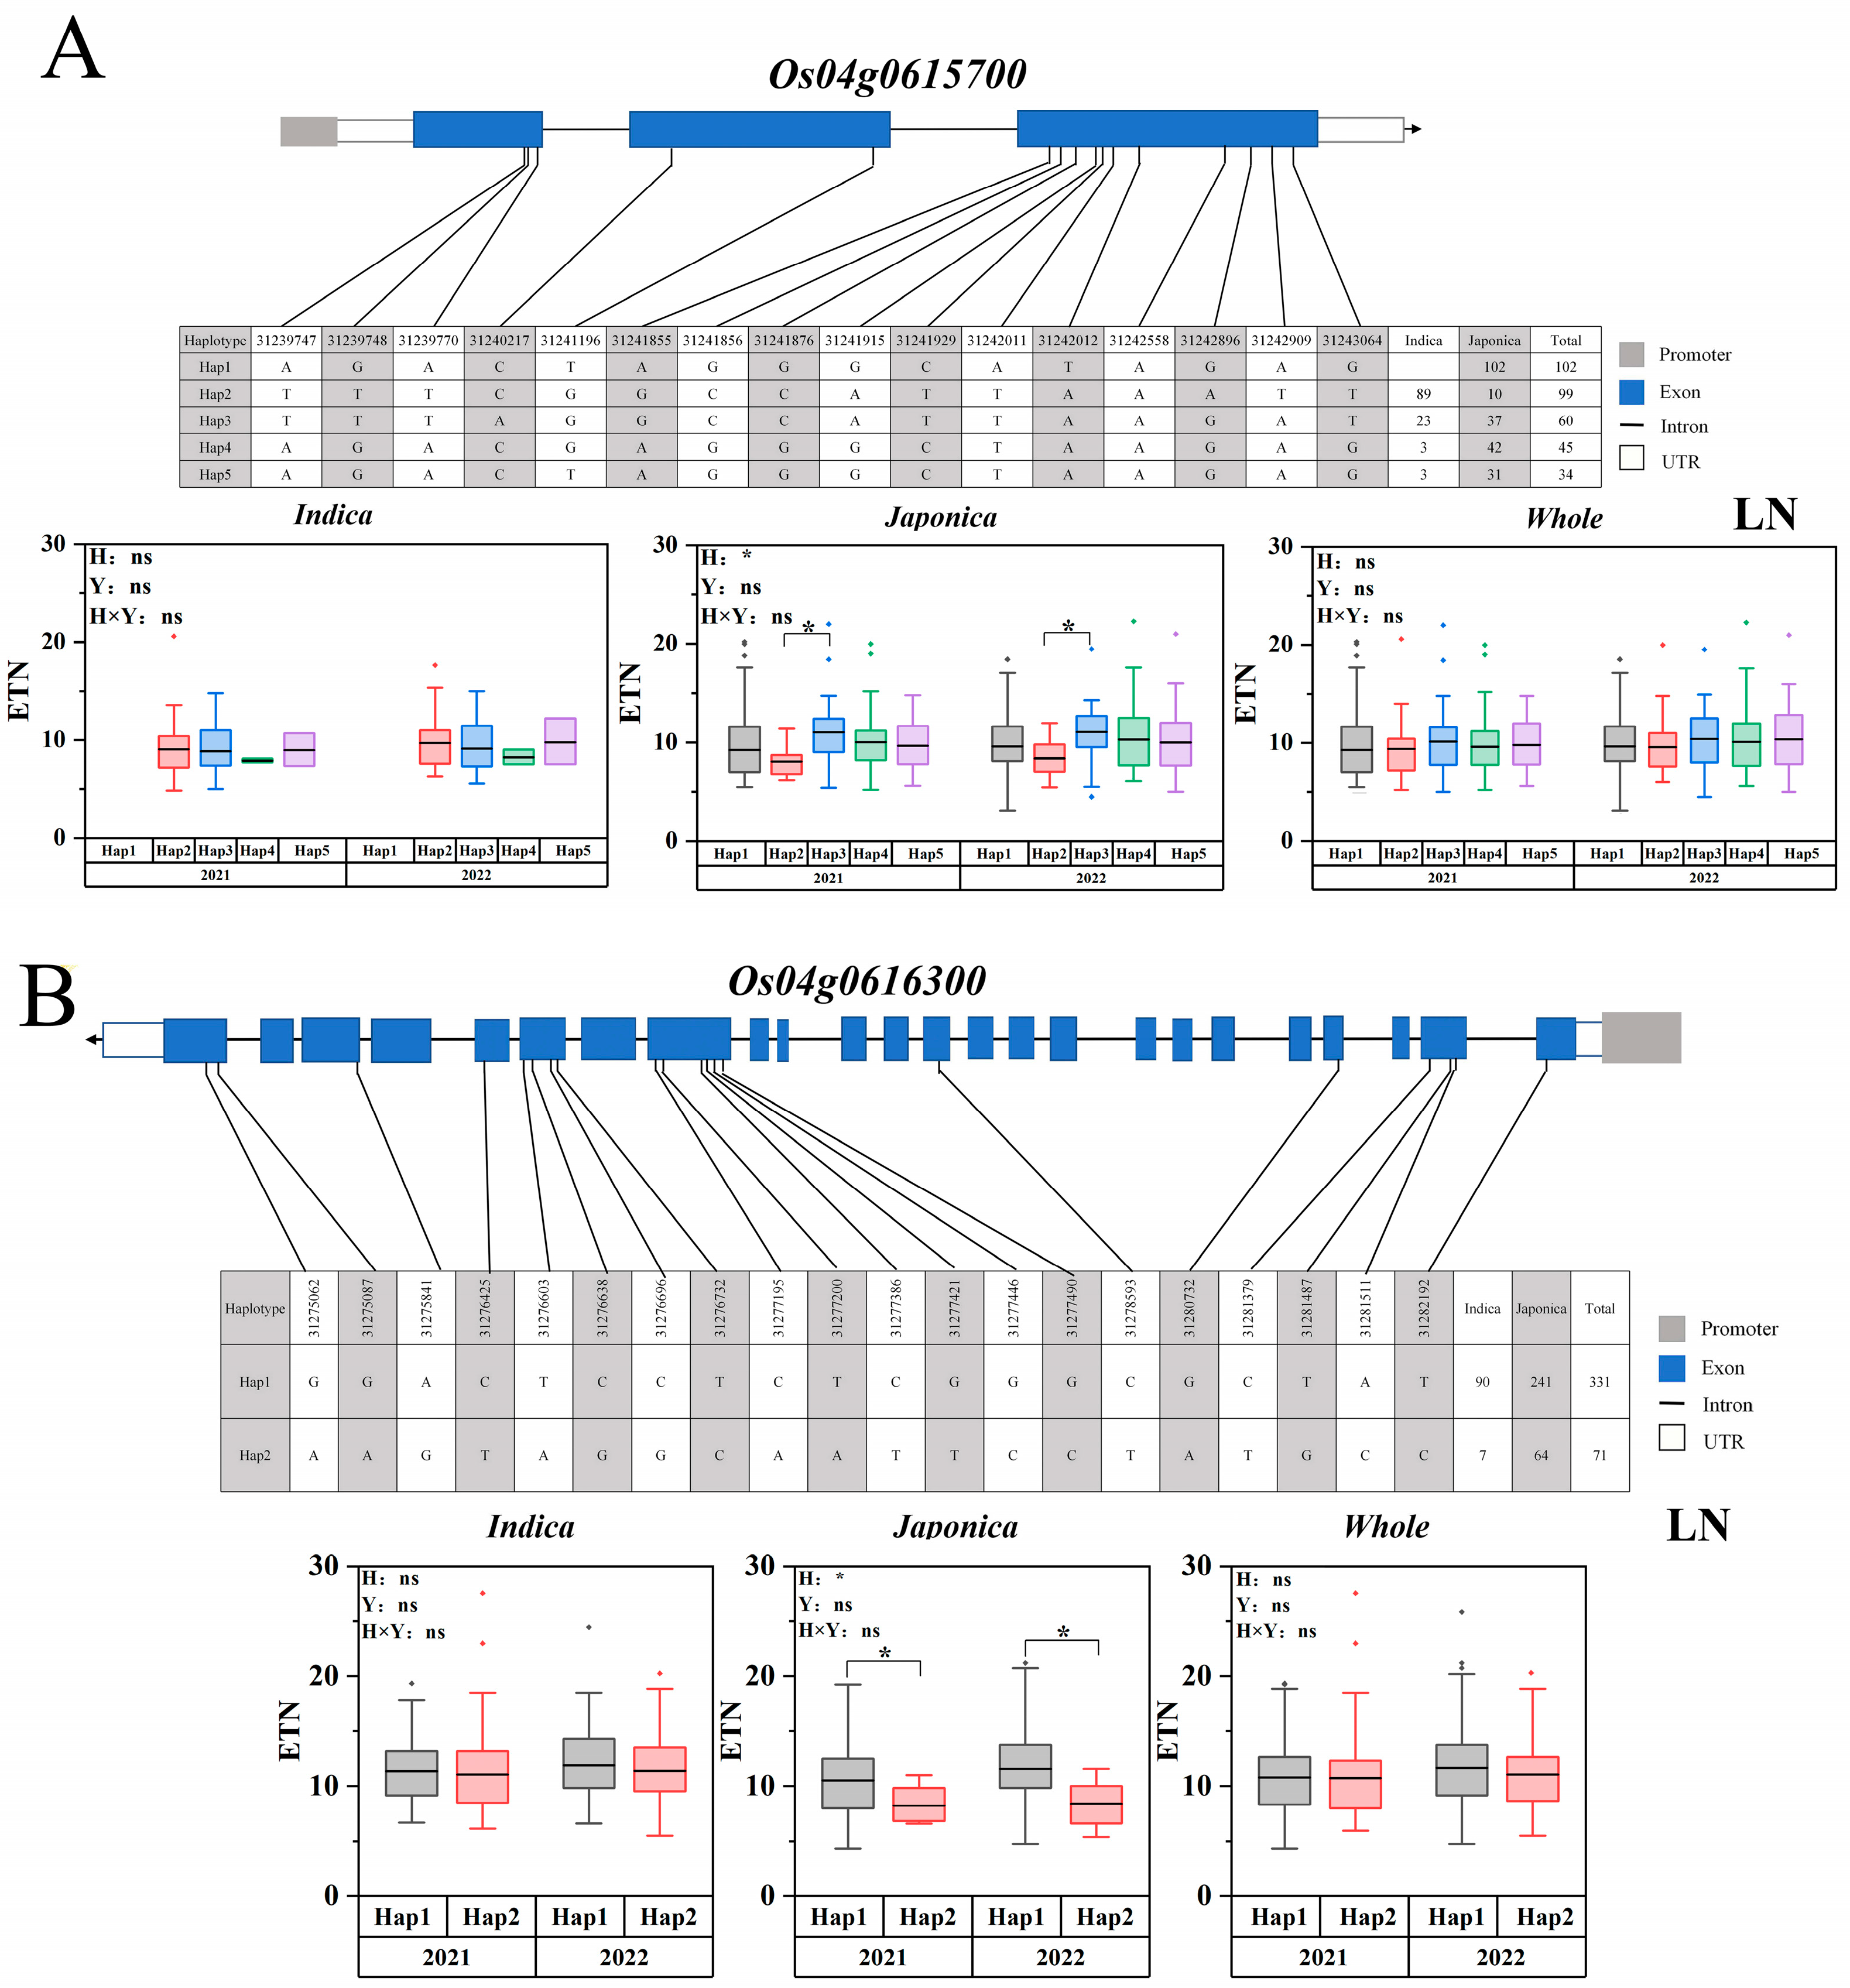
2.5. Candidate Gene Haplotype Analysis

qLETNL1-2, qHETNL1-2, qLETNL2-4, qNRI2-4, qLETNL2-5, qNRI2-5, qLETNL2-6, qNRI2-6, and qLETNL4-3 were detected under multiple conditions and years and were used as the main intervals for candidate gene mining. Haplotype analysis showed significant differences among the haplotypes of five genes. Haplotype analysis was performed on five candidate genes. Os01g0690800, a gene encoding a protein containing a protein kinase domain, was detected in low nitrogen qLETNL1-2 and high nitrogen qHETN1-2. The LD of Os01g0690800 is shown in Figure 5A. Eight nonsynonymous SNPs were identified in the CDS region, constituting four haplotypes of Os01g0690800. Under both low and high nitrogen conditions, the ETN of haplotype 1 was significantly higher than that of haplotype 3 in the indica subpopulation (Figure 5B).
In this study, the same area (chromosome 2 20316453-20806338) was localized under different conditions. There are haplotype differences in Os02g0550300 and Os02g0550700. The LD of Os02g0550300 and Os02g0550700, is shown in Figure S3. Five nonsynonymous SNPs were identified in the CDS region, resulting in four haplotypes of Os02g0550300. The ETN of haplotype 1 was lower than that of the other haplotypes in the whole population under low nitrogen conditions (Figure 6A). The NRI of haplotype 1 was higher than that of the others in the whole population. Os02g0550700 is similar to a nucleolar autoantigen-like protein. Two nonsynonymous SNPs were identified in the CDS region, consisting of three haplotypes of Os02g0550700. Haplotype 1 was the major haplotype of the indica population, haplotype 2 being the major haplotype of the japonica population, while haplotype 3 was only observed in the indica population. Under low nitrogen conditions, the ETN of haplotype 3 was significantly higher than that of haplotype 2 in the whole population, the NRI of haplotype 3 was less than that of haplotype 2 in the whole populations (Figure 6B). Thus, haplotype 3 was a favorable allele of Os02g0550700.
In this study, two candidate genes of Os04g0615700 and Os04g06163000 were identified on chromosome 4. The LD of Os04g0615700 and Os04g06163000 is shown in Figure S4. Within the five haplotypes of Os04g0615700, a total of 16 nonsynonymous SNPs were identified in the CDS region. Significant differences were identified between the ETN of haplotype 2 and the ETN of haplotype 3 in the japonica population (Figure 7A). Two haplotypes of Os04g06163000 included 20 nonsynonymous SNPs in the CDS region. The ETN of haplotype 1 was significantly higher than that of haplotype 2 in the japonica population (Figure 7B).

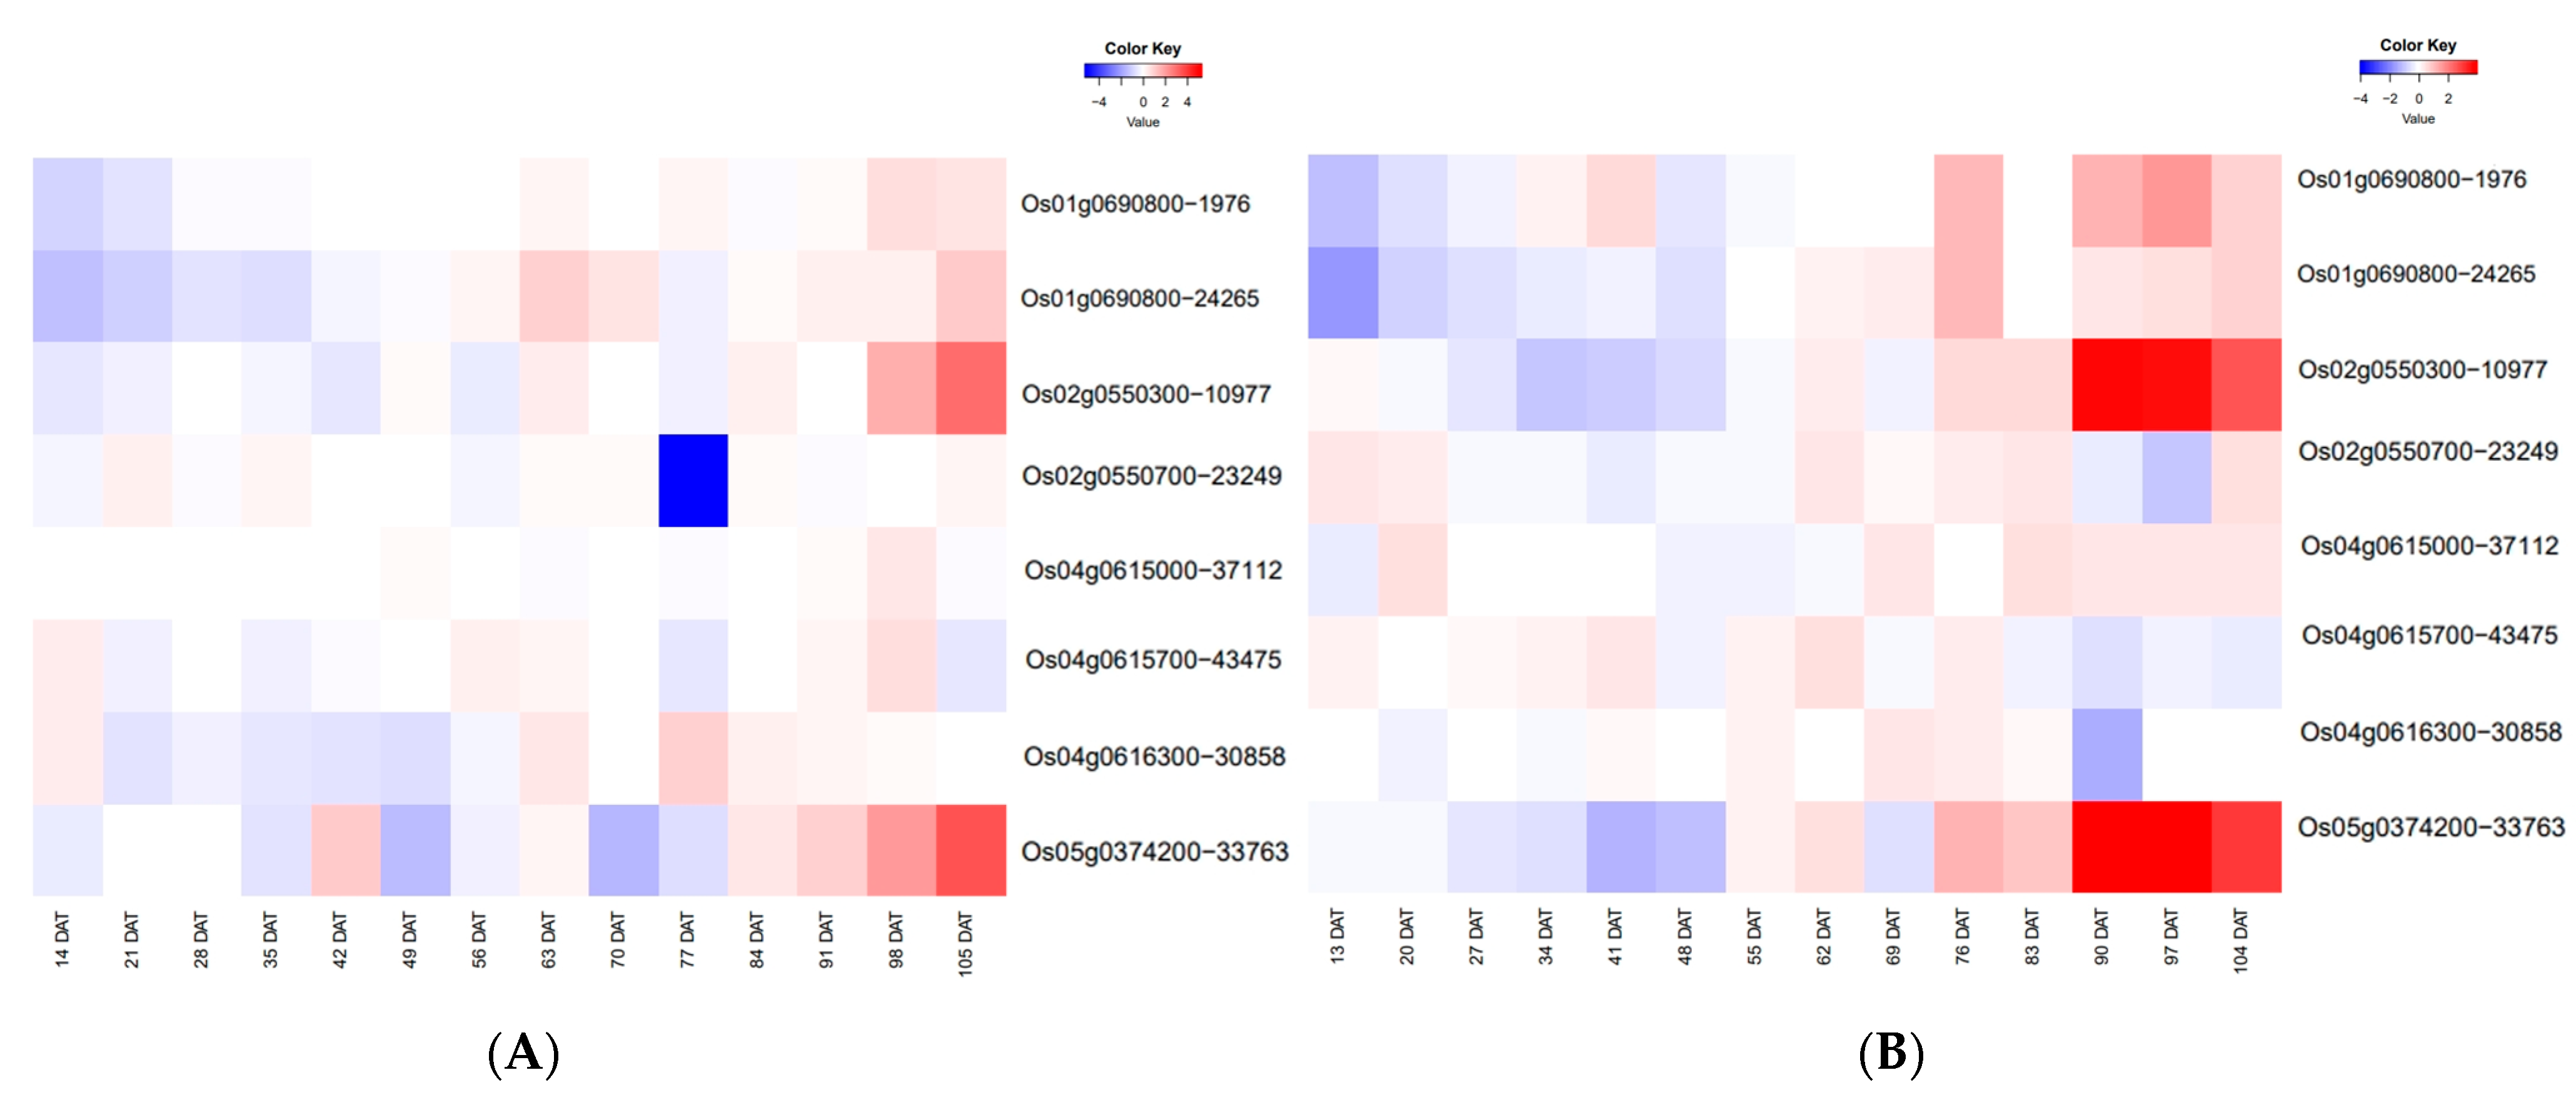
2.6. Temporal Expression Patterns of ETN-Related Genes

Tiller developmental regulation may exhibit specific spatio-temporal patterns whose expression in the root system at 00:00 (R0) and 12:00 (R12) is stable and high from 20 d after transplanting (DAT) to 48 DAT [34]. Temporal expression patterns of the above five genes and two reported genes were analyzed using gene expression data from the RiceXPro website (https://ricexpro.dna.affrc.go.jp/, accessed on 7 November 2022) (Figure 8). Os01g0690800, Os02g0550300, Os02g0550700, NAL1, Os04g0615700 and OsCKX9 in R0 and Os01g0690800, Os02g0550700, NAL1, Os04g0615700, and Os04g06163000 in R12 were found to have higher expression between 21 DAT and 49 DAT, which was consistent with the full fertility dynamic pattern of the rapid increase in tiller number starting from 21 DAT [35].

3. Discussion

3.1. Phenotypic Variation in ETN of Rice

In this study, the phenotypic analysis of 469 rice varieties showed that the frequency distribution of the phenotype was normally distributed (Table S5). Combining the two-year data, the ETN of each population under high nitrogen treatment was higher than that under low nitrogen treatment. Meanwhile, the ETN of the indica rice population was significantly higher than that of the japonica rice population, regardless of high or low nitrogen, which was similar to the results of Ren et al. [36]. The results of this study suggest that germplasm resources exhibit significant genetic variation in agronomic traits and dissect effective tiller genetic differences between the indica and japonica rice populations [37,38].

3.2. Comparisons of QTL Detected in This Study with Previously Reported Genes

Unlike previous mapping studies, which have mostly been based on classical QTL mapping [6,32,39], GWAS can successfully map a large number of potential loci. This study was conducted by GWAS using three effective tiller traits (low nitrogen, high nitrogen, and NRI) and 2,801,841 SNPs from a natural population of 469 rice varieties. In this study, qLETN3-1 was coincident with the mapping results of Zhao et al. [40], while qLETN4-1 and qLETN4-3 were coincident with the QTL associated with effective tillering identified by Lanceras et al. [41]. The genes associated with tillering number NAL1 were located in qLETN4-3. NAL1 contributes to leaf size and traits [42], transport of growth hormone [43], vascular bundle [44], rice yield traits [45]. This study also detected a known gene, OsCKX9, which is associated with an effective panicle number. As the main response gene of SL, the OsCKX9 mutant and overexpression transgenic plants have exhibited a significant increase in tiller number [32]. These results provide a reference for further study of gene verification and molecular marker-assisted selection.

3.3. Candidate Gene Identification for Important QTLs

Effective tillering is a complex trait controlled by many genes, while several recent studies have identified genes involved in the mechanism through which nitrogen affects rice tillering [46], including MH63 [47], OsAAP4 [48], and OsNPF7.3 [49]. The haplotypes of seven ETN-related genes were analyzed. These seven genes showed different haplotype patterns in indica, japonica, and the whole population. The haplotypes of some new genes identified in this study performed well under different treatments. Haplotype 1 of Os01g0690800 performed well in indica subsets under low nitrogen and NRI conditions, and haplotype 3 of Os02g0550300 performed well in total populations under low nitrogen and NRI conditions. Haplotype 2 of Os02g0550700 performed well in the total population. These candidate genes were combined with gene annotation to identify protein kinases similar to Os01g0690800. Studies have shown that protein kinases are able to regulate tillering. For example, the OsKAPP protein kinase regulates growth hormone levels and thus affects rice tillering [50]. To our knowledge, there are no reports on the breeding value of these five genes. These results have inspired the further exploration of favorable alleles in response to low-nitrogen ETN breeding using natural resources.
The prevailing spatio-temporal expression patterns of five candidate genes and two known genes in R0 and R12, namely NAL1, OsCKX9, Os01g0690800, Os02g0550300, Os02g0550700, Os04g0615700, and Os04g06163000, with relatively high expression from 21 DAT to 49 DAT. This expression pattern coincides with the dynamic pattern of tiller number during the entire growth period, where tiller number increased rapidly from 21 DAT and peaked at 49 DAT [35]. Using this expression pattern, convincing candidate genes were thereby identified.

4. Materials and Methods

4.1. Plant Materials

The materials used in this study were re-sequenced germplasm varieties from the 3K RGP (https://snp-seek.irri.org/, accessed on 4 May 2020). These rice varieties possess a rich phenotype with globally diverse genetic backgrounds. This experiment selected 469 varieties with similar heading stage, including 202 indica rice and 267 japonica rice. Detailed information of the 469 varieties, including their geographical origin, is described in Table S1.

4.2. Phenotype Determination

The field trial was carried out at Shenyang Agricultural University (41°48′ N, 123°34′ E). Two nitrogen levels were tested in the field trial: 60 kg/hm2 for low nitrogen conditions (LN) and 180 kg/hm2 for high nitrogen conditions (HN). Additionally, a water barrier was placed between the plots. The plant spacing was 13.3 cm × 30 cm, with two plants being planted per hole after transplanting, while one row of each variety was planted in a 1 m row length, with routine field management. An effective tiller survey was conducted at maturity stage. Border plants were removed, and six plants from the middle were randomly selected, evaluation of ETN with effective tiller being defined as the one bearing more than 10 seeds at maturity stage, and the mean value was used for further analyses.

4.3. Phenotypic Data Analysis

Using IBM SPSS Statistics 26.0 software SPSS, origin and R 4.2.1 language statistical analysis software, the phenotypic values of the measured traits were statistically analyzed: a. test the accuracy of the values, delete the abnormal values; b. statistical distribution of phenotypic values; c. The differences of phenotypic values of haplotypes of each gene in indica rice subgroup, japonica rice subgroup and total population were analyzed. Broad-sense heritability (H2) was calculated based on the following formular: H2 = VG/(VG + VE), where VG and VE are genetic and environmental variances (Table S6).

4.4. Genotyping Data Analysis

The raw genotype data of the 469 accessions were obtained from the 3K RGP Rice SNP-Seek Database website (https://snp-seek.irri.org/, accessed on 4 May 2020). Using the linkage disequilibrium (LD) pruning tool of PLINK 1.9, we obtained independent SNPs with a genotype missing rate ≤ 20% and minor allele frequency ≥1% according to the settings “indep-pairwise 50 10 0.5” [51]. The remaining high-quality SNPs were evenly distributed on chromosomes and these SNP markers were used for genome-wide association analysis.
Kinship matrix is a call to the IBS/IBD calculation. IBS scores are calculated based on whether two individuals have the same genotype data at the same locus, and the scores range from 0 to 2, with higher values indicating a greater degree of similarity between the two individuals. The IBS score between two individuals is calculated using the following formula: IBS = (2 × AA + AB)/(2 × n), where AA represents the number of two individuals with exactly the same genotype data at a certain point, AB represents the number of two individuals with only one genotype difference in genotype data at a certain point, and n represents the number of loci that two individuals consider when calculating the IBS score [52]. Principal component analysis (PCA) and kinship analysis were performed using PLINK and plotted with R 4.2.1 “ggplot2” package and “Cmplot” package.

4.5. Genome-Wide Association Analysis

To minimize the effect of false positives, 4.8M SNPs with the missing rate ≥ 20% and MAF ≤ 1% were removed by PLINK 1.9 software. Finally, a total of 2,801,841 SNPs in the 469 rice accessions and the average ETN of each accession were used to carry out GWAS. The Efficient Mixed-Model Association eXpedited (EMMAX) was used to perform GWAS based on the SNP genotypes and ETN on plants inoculated with low and high nitrogen levels using a mixed linear model linear (MLM), principal component analysis (PCA), and kinship. The threshold for genome-wide significance was determined by Bonferroni correction (that is, corrected p = 0.05/n, in which n is the number of independent SNPs across the genome [53]. The Manhattan and quantile–quantile (Q–Q)plots were generated using the R package “CMplot” (Supplementary Figure S2, Supplementary Figure S5), the chromosomal region where each QTL was located was determined when the linkage disequilibrium (LD) dropped to half its maximum.

4.6. Candidate Gene Haplotype Analysis

The linkage disequilibrium (LD) is calculated as follows: If there are two loci (A and B), and the alleles are A, a, B, and b, which correspond to frequencies f(A), f(a), f(B), and f(b) in the population. There are four haplotypes AB, Ab, aB, and ab at the two loci, corresponding to frequencies f(AB), f(Ab), f(aB), and f(ab). Calculation: Dab = f(AB) − f(A) × f(B), when Dab = 0, it is in the chain equilibrium state; When Dab ≠ 0, it is in a chain imbalance. LD metric: When Dab > 0, |D′| = (Dab)2/min(f(AB), f(ab)); When Dab < 0,|D′| = (Dab)2/min(f(Ab), f(aB)); r2 = (Dab)2/(f(A)f(a)f(B) × f(b)). D′ = 0, r2 = 0 is in complete chain equilibrium; D′ = 1, r2 = 1 is in a state of complete chain disequilibrium. The higher the scale from 0 to 1, the higher the LD, and if the two loci are linked, the degree of linkage is also stronger [54]. The LD heatmap around the peak in GWAS was constructed using “LD BlockShow”.
According to LD decay, the region 200 kb upstream and downstream of a significant SNP was classified as an LD block. An LD block containing more than two significant SNPs was defined as a QTL [55]. In each QTL, the SNP with minimum p-value was considered as the lead SNP [56]. Based on GWAS, QTLs with multi-year co-localization or different processing co-localization were screened, with candidate genes being mined for target traits responding to effective tillering in rice.
Haplotype analysis was performed on all genes in the QTL associated with effective tillering under different nitrogen levels during 2021 and 2022. The procedure was as follows: First, all gene numbers and annotation information in each important QTL interval were retrieved from the Rice Annotation Project Database (RAP-DB) (http://rapdb.dna.affrc.go.jp/, accessed on 28 June 2022), before all nonsynonymous mutation SNPs of all genes and SNPs in the promoter region were extracted from the Rice SNP-Seek Database website of 3K RGP. The above gene screening method was used to eliminate the lower quality SNPs, with the remaining high-quality SNPs being used for haplotype analysis. Haplotype analysis was performed on all genes using nonsynonymous mutant SNPs. Genes with no significant differences in phenotypic values between different haplotypes were detected before haplotype analysis was performed using SNPs in the promoter region. Haplotype analysis was then performed based on nonsynonymous mutations and SNPs in the promoter region (1 kb before the ATG). The SNP in the promoter region was used for haplotype analysis. Multiple comparisons of phenotypic values of different haplotypes (≥15 varieties) were performed to screen genes with significant differences between phenotypic values of different haplotypes and to predict possible candidate genes in combination with the gene annotation. Subsequently, the RiceXPro website (http://ricexpro.dna.affrc.go.jp/, accessed on 7 November 2022) was used to accurately identify candidate genes.

5. Conclusions

The study utilized phenotypic data from 469 effective tillers from natural populations and 2,801,841 SNPs for GWAS analysis. Among the 28 QTL intervals identified in this study, haplotype analysis was performed on genes that were repeatedly located within QTLs over multiple years or with different treatments. A total of seven genes (NAL1, OsCKX9, Os01g0690800, Os02g0550300, Os02g0550700, Os04g0615700, and Os04g06163000) were pinpointed in these QTL regions, and were considered the most likely candidate genes. Cluster analysis was employed to analyze the spatial and temporal expression patterns of these seven candidate genes, leading to the identification of convincing candidate genes. The results obtained provide favorable information for the use of marker selection to control effective tillering in rice for yield improvement. However, further research is needed to understand the regulatory mechanism of theses candidate genes that contribute to low nitrogen tolerance in rice.

Supplementary Materials

The supporting information can be downloaded at: https://www.mdpi.com/article/10.3390/ijms25052969/s1.

Author Contributions

Conceptualization, J.G.; Data curation, Y.L. (Yuzhuo Liu); Formal analysis, Y.L. (Yuzhuo Liu), L.C. and Y.L. (Yuqi Liu); Investigation, Y.L. (Yuzhuo Liu), L.C., Y.L. (Yuqi Liu), X.W., C.M. and Y.F.; Methodology, W.X.; Project administration, W.Z.; Resources, W.X.; Software, W.X. and L.Z.; Supervision, J.G. and W.Z.; Visualization, L.Z.; Writing—original draft, Y.L. (Yuzhuo Liu); Writing—review and editing, W.X., J.G. and W.Z. All authors have read and agreed to the published version of the manuscript.

Funding

This research was funded by LiaoNing Revitalization Talents Program (XLYC2002073, XLYC2007169).

Institutional Review Board Statement

Not applicable.

Informed Consent Statement

Not applicable.

Data Availability Statement

The data supporting the findings of this study are available within the article and its Supplementary Materials.

Conflicts of Interest

The authors declare no conflicts of interest.

References

  1. Cimini, A. Evolution of the Global Scientific Research on the Environmental Impact of Food Production from 1970 to 2020. Sustainability 2021, 13, 11633. [Google Scholar] [CrossRef]
  2. Lobell, D.B.; Schlenker, W.; Costa-Roberts, J. Climate Trends and Global Crop Production Since 1980. Science 2011, 333, 616–620. [Google Scholar] [CrossRef]
  3. Huang, L.; Li, X.-X.; Zhang, Y.-B.; Fahad, S.; Wang, F. dep1 improves rice grain yield and nitrogen use efficiency simultaneously by enhancing nitrogen and dry matter translocation. J. Integr. Agric. 2022, 21, 2021. [Google Scholar] [CrossRef]
  4. Feng, H.; Li, B.; Zhi, Y.; Chen, J.; Li, R.; Xia, X.; Xu, G.; Fan, X. Overexpression of the nitrate transporter, OsNRT2.3b, improves rice phosphorus uptake and translocation. Plant Cell Rep. 2017, 36, 1287–1296. [Google Scholar] [CrossRef] [PubMed]
  5. Hu, B.; Wang, W.; Ou, S.; Tang, J.; Li, H.; Che, R.; Zhang, Z.; Chai, X.; Wang, H.; Wang, Y.; et al. Variation in NRT1.1B contributes to nitrate-use divergence between rice subspecies. Nat. Genet. 2015, 47, 834–838. [Google Scholar] [CrossRef] [PubMed]
  6. Xu, X.; Wu, K.; Xu, R.; Yu, J.; Wang, J.; Zhao, Y.; Wang, Y.; Song, W.; Wang, S.; Gao, Z.; et al. Pyramiding of the dep1-1 and NAL1(NJ6) alleles achieves sustainable improvements in nitrogen-use efficiency and grain yield in japonica rice breeding. J. Genet. Genom. = Yi Chuan Xue Bao 2019, 46, 325–328. [Google Scholar] [CrossRef] [PubMed]
  7. Wu, K.; Wang, S.; Song, W.; Zhang, J.; Wang, Y.; Liu, Q.; Yu, J.; Ye, Y.; Li, S.; Chen, J.; et al. Enhanced sustainable green revolution yield via nitrogen-responsive chromatin modulation in rice. Science 2020, 367, eaaz2046. [Google Scholar] [CrossRef]
  8. Zhang, S.; Zhang, Y.; Li, K.; Yan, M.; Zhang, J.; Yu, M.; Tang, S.; Wang, L.; Qu, H.; Luo, L.; et al. Nitrogen Mediates Flowering Time and Nitrogen Use Efficiency via Floral Regulators in Rice. Curr. Biol. CB 2021, 31, 671–683.e5. [Google Scholar] [CrossRef]
  9. Liu, W.; Zhang, D.; Tang, M.; Li, D.; Zhu, Y.; Zhu, L.; Chen, C. THIS1 is a putative lipase that regulates tillering, plant height, and spikelet fertility in rice. J. Exp. Bot. 2013, 64, 4389–4402. [Google Scholar] [CrossRef]
  10. Lu, Z.; Shao, G.; Xiong, J.; Jiao, Y.; Wang, J.; Liu, G.; Meng, X.; Liang, Y.; Xiong, G.; Wang, Y.; et al. MONOCULM 3, an ortholog of WUSCHEL in rice, is required for tiller bud formation. J. Genet. Genom. = Yi Chuan Xue Bao 2015, 42, 71–78. [Google Scholar] [CrossRef]
  11. Luo, L.; Li, W.; Miura, K.; Ashikari, M.; Kyozuka, J. Control of tiller growth of rice by OsSPL14 and Strigolactones, which work in two independent pathways. Plant Cell Physiol. 2012, 53, 1793–1801. [Google Scholar] [CrossRef] [PubMed]
  12. Wang, Y.; Shang, L.; Yu, H.; Zeng, L.; Hu, J.; Ni, S.; Rao, Y.; Li, S.; Chu, J.; Meng, X.; et al. A Strigolactone Biosynthesis Gene Contributed to the Green Revolution in Rice. Mol. Plant 2020, 13, 923–932. [Google Scholar] [CrossRef]
  13. Arite, T.; Iwata, H.; Ohshima, K.; Maekawa, M.; Nakajima, M.; Kojima, M.; Sakakibara, H.; Kyozuka, J. DWARF10, an RMS1/MAX4/DAD1 ortholog, controls lateral bud outgrowth in rice. Plant J. Cell Mol. Biol. 2007, 51, 1019–1029. [Google Scholar] [CrossRef]
  14. Umehara, M.; Hanada, A.; Yoshida, S.; Akiyama, K.; Arite, T.; Takeda-Kamiya, N.; Magome, H.; Kamiya, Y.; Shirasu, K.; Yoneyama, K.; et al. Inhibition of shoot branching by new terpenoid plant hormones. Nature 2008, 455, 195–200. [Google Scholar] [CrossRef]
  15. Liu, W.; Wu, C.; Fu, Y.; Hu, G.; Si, H.; Zhu, L.; Luan, W.; He, Z.; Sun, Z. Identification and characterization of HTD2: A novel gene negatively regulating tiller bud outgrowth in rice. Planta 2009, 230, 649–658. [Google Scholar] [CrossRef] [PubMed]
  16. Bai, J.; Guo, H.; Xiong, H.; Xie, Y.; Gu, J.; Zhao, L.; Zhao, S.; Ding, Y.; Liu, L. Strigolactone and abscisic acid synthesis and signaling pathways are enhanced in the wheat oligo-tillering mutant ot1. Mol. Breed. New Strateg. Plant Improv. 2024, 44, 12. [Google Scholar] [CrossRef]
  17. Yu, J.; Xuan, W.; Tian, Y.; Fan, L.; Sun, J.; Tang, W.; Chen, G.; Wang, B.; Liu, Y.; Wu, W.; et al. Enhanced OsNLP4-OsNiR cascade confers nitrogen use efficiency by promoting tiller number in rice. Plant Biotechnol. J. 2021, 19, 167–176. [Google Scholar] [CrossRef] [PubMed]
  18. Li, X.; Xia, K.; Liang, Z.; Chen, K.; Gao, C.; Zhang, M. MicroRNA393 is involved in nitrogen-promoted rice tillering through regulation of auxin signal transduction in axillary buds. Sci. Rep. 2016, 6, 32158. [Google Scholar] [CrossRef]
  19. Lv, Y.; Ma, J.; Wang, Y.; Wang, Q.; Lu, X.; Hu, H.; Qian, Q.; Guo, L.; Shang, L. Loci and Natural Alleles for Low-Nitrogen-Induced Growth Response Revealed by the Genome-Wide Association Study Analysis in Rice (Oryza sativa L.). Front. Plant Sci. 2021, 12, 770736. [Google Scholar] [CrossRef]
  20. Gao, Z.; Wang, Y.; Chen, G.; Zhang, A.; Yang, S.; Shang, L.; Wang, D.; Ruan, B.; Liu, C.; Jiang, H.; et al. The indica nitrate reductase gene OsNR2 allele enhances rice yield potential and nitrogen use efficiency. Nat. Commun. 2019, 10, 5207. [Google Scholar] [CrossRef]
  21. McCouch, S.R.; Wright, M.H.; Tung, C.W.; Maron, L.G.; McNally, K.L.; Fitzgerald, M.; Singh, N.; DeClerck, G.; Agosto-Perez, F.; Korniliev, P.; et al. Open access resources for genome-wide association mapping in rice. Nat. Commun. 2016, 7, 10532. [Google Scholar] [CrossRef]
  22. Olsen, K.M.; Halldorsdottir, S.S.; Stinchcombe, J.R.; Weinig, C.; Schmitt, J.; Purugganan, M.D. Linkage disequilibrium mapping of Arabidopsis CRY2 flowering time alleles. Genetics 2004, 167, 1361–1369. [Google Scholar] [CrossRef]
  23. Sadhukhan, A.; Agrahari, R.K.; Wu, L.; Watanabe, T.; Nakano, Y.; Panda, S.K.; Koyama, H.; Kobayashi, Y. Expression genome-wide association study identifies that phosphatidylinositol-derived signalling regulates ALUMINIUM SENSITIVE3 expression under aluminium stress in the shoots of Arabidopsis thaliana. Plant Sci. Int. J. Exp. Plant Biol. 2021, 302, 110711. [Google Scholar] [CrossRef]
  24. Wang, X.; Wang, H.; Liu, S.; Ferjani, A.; Li, J.; Yan, J.; Yang, X.; Qin, F. Genetic variation in ZmVPP1 contributes to drought tolerance in maize seedlings. Nat. Genet. 2016, 48, 1233–1241. [Google Scholar] [CrossRef]
  25. Hinze, L.L.; Hulse-Kemp, A.M.; Wilson, I.W.; Zhu, Q.H.; Llewellyn, D.J.; Taylor, J.M.; Spriggs, A.; Fang, D.D.; Ulloa, M.; Burke, J.J.; et al. Diversity analysis of cotton (Gossypium hirsutum L.) germplasm using the CottonSNP63K Array. BMC Plant Biol. 2017, 17, 37. [Google Scholar] [CrossRef]
  26. Ma, X.; Feng, F.; Zhang, Y.; Elesawi, I.E.; Xu, K.; Li, T.; Mei, H.; Liu, H.; Gao, N.; Chen, C.; et al. A novel rice grain size gene OsSNB was identified by genome-wide association study in natural population. PLoS Genet. 2019, 15, e1008191. [Google Scholar] [CrossRef]
  27. Yuan, H.; Qin, P.; Hu, L.; Zhan, S.; Wang, S.; Gao, P.; Li, J.; Jin, M.; Xu, Z.; Gao, Q.; et al. OsSPL18 controls grain weight and grain number in rice. J. Genet. Genom. = Yi Chuan Xue Bao 2019, 46, 41–51. [Google Scholar] [CrossRef]
  28. Peng, Y.; Gao, Z.; Zhang, B.; Liu, C.; Xu, J.; Ruan, B.; Hu, J.; Dong, G.; Guo, L.; Liang, G.; et al. Fine mapping and candidate gene analysis of a major QTL for panicle structure in rice. Plant Cell Rep. 2014, 33, 1843–1850. [Google Scholar] [CrossRef]
  29. Wang, Q.; Su, Q.; Nian, J.; Zhang, J.; Guo, M.; Dong, G.; Hu, J.; Wang, R.; Wei, C.; Li, G.; et al. The Ghd7 transcription factor represses ARE1 expression to enhance nitrogen utilization and grain yield in rice. Mol. Plant 2021, 14, 1012–1023. [Google Scholar] [CrossRef]
  30. Fujita, D.; Trijatmiko, K.R.; Tagle, A.G.; Sapasap, M.V.; Koide, Y.; Sasaki, K.; Tsakirpaloglou, N.; Gannaban, R.B.; Nishimura, T.; Yanagihara, S.; et al. NAL1 allele from a rice landrace greatly increases yield in modern indica cultivars. Proc. Natl. Acad. Sci. USA 2013, 110, 20431–20436. [Google Scholar] [CrossRef]
  31. Zheng, X.; Zhang, S.; Liang, Y.; Zhang, R.; Liu, L.; Qin, P.; Zhang, Z.; Wang, Y.; Zhou, J.; Tang, X.; et al. Loss-function mutants of OsCKX gene family based on CRISPR-Cas systems revealed their diversified roles in rice. Plant Genome 2023, 16, e20283. [Google Scholar] [CrossRef]
  32. Duan, J.; Yu, H.; Yuan, K.; Liao, Z.; Meng, X.; Jing, Y.; Liu, G.; Chu, J.; Li, J. Strigolactone promotes cytokinin degradation through transcriptional activation of CYTOKININ OXIDASE/DEHYDROGENASE 9 in rice. Proc. Natl. Acad. Sci. USA 2019, 116, 14319–14324. [Google Scholar] [CrossRef]
  33. Takai, T.; Adachi, S.; Taguchi-Shiobara, F.; Sanoh-Arai, Y.; Iwasawa, N.; Yoshinaga, S.; Hirose, S.; Taniguchi, Y.; Yamanouchi, U.; Wu, J.; et al. A natural variant of NAL1, selected in high-yield rice breeding programs, pleiotropically increases photosynthesis rate. Sci. Rep. 2013, 3, 2149. [Google Scholar] [CrossRef]
  34. Ma, X.; Li, F.; Zhang, Q.; Wang, X.; Guo, H.; Xie, J.; Zhu, X.; Ullah Khan, N.; Zhang, Z.; Li, J.; et al. Genetic architecture to cause dynamic change in tiller and panicle numbers revealed by genome-wide association study and transcriptome profile in rice. Plant J. Cell Mol. Biol. 2020, 104, 1603–1616. [Google Scholar] [CrossRef] [PubMed]
  35. Liu, L.; Ren, M.; Peng, P.; Chun, Y.; Li, L.; Zhao, J.; Fang, J.; Peng, L.; Yan, J.; Chu, J.; et al. MIT1, encoding a 15-cis-ζ-carotene isomerase, regulates tiller number and stature in rice. J. Genet. Genom. = Yi Chuan Xue Bao 2021, 48, 88–91. [Google Scholar] [CrossRef]
  36. Ren, M.; Huang, M.; Qiu, H.; Chun, Y.; Li, L.; Kumar, A.; Fang, J.; Zhao, J.; He, H.; Li, X. Genome-Wide Association Study of the Genetic Basis of Effective Tiller Number in Rice. Rice 2021, 14, 56. [Google Scholar] [CrossRef]
  37. Huang, L.Y.; Sun, F.; Yuan, S.; Peng, S.B.; Wang, F. Different mechanisms underlying the yield advantage of ordinary hybrid and super hybrid rice over inbred rice under low and moderate N input conditions. Field Crops Res. 2018, 216, 150–157. [Google Scholar] [CrossRef]
  38. Sun, T.; Yang, X.; Tan, X.L.; Han, K.F.; Tang, S.; Tong, W.M.; Zhu, S.Y.; Hu, Z.P.; Wu, L.H. Comparison of Agronomic Performance between Japonica/Indica Hybrid and Japonica Cultivars of Rice Based on Different Nitrogen Rates. Agronomy 2020, 10, 171. [Google Scholar] [CrossRef]
  39. Deng, X.; Wang, J.; Liu, X.; Yang, J.; Zhou, M.; Kong, W.; Jiang, Y.; Ke, S.; Sun, T.; Li, Y. QTL Analysis and Heterosis Loci of Effective Tiller Using Three Genetic Populations Derived from Indica-Japonica Crosses in Rice. Agronomy 2022, 12, 2171. [Google Scholar] [CrossRef]
  40. Zhao, D.-D.; Park, J.-R.; Jang, Y.-H.; Kim, E.-G.; Du, X.-X.; Farooq, M.; Yun, B.-J.; Kim, K.-M. Identification of One Major QTL and a Novel Gene OsIAA17q5 Associated with Tiller Number in Rice Using QTL Analysis. Plants 2022, 11, 538. [Google Scholar] [CrossRef]
  41. Lanceras, J.C.; Pantuwan, G.; Jongdee, B.; Toojinda, T. Quantitative Trait Loci Associated with Drought Tolerance at Reproductive Stage in Rice. Plant Physiol. 2004, 135, 384–399. [Google Scholar] [CrossRef]
  42. Lin, L.; Zhao, Y.; Liu, F.; Chen, Q.; Qi, J. Narrow leaf 1 (NAL1) regulates leaf shape by affecting cell expansion in rice (Oryza sativa L.). Biochem. Biophys. Res. Commun. 2019, 516, 957–962. [Google Scholar] [CrossRef]
  43. Qi, J.; Qian, Q.; Bu, Q.; Li, S.; Chen, Q.; Sun, J.; Liang, W.; Zhou, Y.; Chu, C.; Li, X.; et al. Mutation of the Rice Narrow leaf1 Gene, Which Encodes a Novel Protein, Affects Vein Patterning and Polar Auxin Transport. Plant Physiol. 2008, 147, 1947–1959. [Google Scholar] [CrossRef]
  44. Zhai, L.; Zheng, T.; Wang, X.; Wang, Y.; Chen, K.; Wang, S.; Wang, Y.; Xu, J.; Li, Z. QTL mapping and candidate gene analysis of peduncle vascular bundle related traits in rice by genome-wide association study. Rice 2018, 11, 13. [Google Scholar] [CrossRef]
  45. Xu, J.L.; Wang, Y.; Zhang, F.; Wu, Y.; Zheng, T.Q.; Wang, Y.H.; Zhao, X.Q.; Cui, Y.R.; Chen, K.; Zhang, Q.; et al. SS1 (NAL1)- and SS2-Mediated Genetic Networks Underlying Source-Sink and Yield Traits in Rice (Oryza sativa L.). PLoS ONE 2015, 10, e0132060. [Google Scholar] [CrossRef] [PubMed]
  46. Liu, Y.Q.; Li, W.W.; Liu, X.Y.; Chu, C.C. Molecular mechanism of tillering response to nitrogen in rice. Yi Chuan = Hereditas 2023, 45, 367–378. [Google Scholar]
  47. Jiang, L.; Liu, X.; Xiong, G.; Liu, H.; Chen, F.; Wang, L.; Meng, X.; Liu, G.; Yu, H.; Yuan, Y.; et al. DWARF 53 acts as a repressor of strigolactone signalling in rice. Nature 2013, 504, 401–405. [Google Scholar] [CrossRef]
  48. Fang, Z.; Wu, B.; Ji, Y. The Amino Acid Transporter OsAAP4 Contributes to Rice Tillering and Grain Yield by Regulating Neutral Amino Acid Allocation through Two Splicing Variants. Rice 2021, 14, 2. [Google Scholar] [CrossRef] [PubMed]
  49. Fang, Z.; Bai, G.; Huang, W.; Wang, Z.; Wang, X.; Zhang, M. The Rice Peptide Transporter OsNPF7.3 Is Induced by Organic Nitrogen, and Contributes to Nitrogen Allocation and Grain Yield. Front. Plant Sci. 2017, 8, 1338. [Google Scholar] [CrossRef]
  50. van der Knaap, E.; Song, W.Y.; Ruan, D.L.; Sauter, M.; Ronald, P.C.; Kende, H. Expression of a gibberellin-induced leucine-rich repeat receptor-like protein kinase in deepwater rice and its interaction with kinase-associated protein phosphatase. Plant Physiol. 1999, 120, 559–570. [Google Scholar] [CrossRef]
  51. Tabangin, M.E.; Woo, J.G.; Martin, L.J. The effect of minor allele frequency on the likelihood of obtaining false positives. BMC Proc. 2009, 3 (Suppl. S7), S41. [Google Scholar] [CrossRef]
  52. Kang, H.M.; Sul, J.H.; Service, S.K.; Zaitlen, N.A.; Kong, S.-y.; Freimer, N.B.; Sabatti, C.; Eskin, E. Variance component model to account for sample structure in genome-wide association studies. Nat. Genet. 2010, 42, 348–354. [Google Scholar] [CrossRef]
  53. Lu, K.; Wei, L.; Li, X.; Wang, Y.; Wu, J.; Liu, M.; Zhang, C.; Chen, Z.; Xiao, Z.; Jian, H.; et al. Whole-genome resequencing reveals Brassica napus origin and genetic loci involved in its improvement. Nat. Commun. 2019, 10, 1154. [Google Scholar] [CrossRef]
  54. Slatkin, M. Linkage disequilibrium—Understanding the evolutionary past and mapping the medical future. Nat. Rev. Genet. 2008, 9, 477–485. [Google Scholar] [CrossRef]
  55. Kim, M.S.; Ko, S.R.; Le, V.T.; Jee, M.G.; Jung, Y.J.; Kang, K.K.; Cho, Y.G. Development of SNP Markers from GWAS for Selecting Seed Coat and Aleurone Layers in Brown Rice (Oryza sativa L.). Genes 2022, 13, 1805. [Google Scholar] [CrossRef] [PubMed]
  56. Hellenthal, G. Population Structure, Demography and Recent Admixture. In Handbook of Statistical Genomics; John Wiley & Sons Ltd.: Hoboken, NJ, USA, 2019; pp. 247–274. [Google Scholar]
Figure 1. ETN frequency distribution of 469 germplasm resources. Blue and green represent 2021 and 2022 respectively. LN-W: The whole population under low nitrogen; LN-I: The indica population under low nitrogen; LN-J: The japonica population under low nitrogen; HN-W: The whole population under high nitrogen; HN-I: The indica population under high nitrogen; HN-J: The japonica population under high nitrogen.
Ijms 25 02969 g001
Figure 2. The population structure and the kinship of 469 rice. (A) Principal component analysis (PCA) plots for the first two components of 469 rice accessions. Each color represents a different population: Four populations of japonica (GJ-adm, GJ-sbtrp, GJ-tmp, and GJ-trp) and five populations of indica (XI-1A, XI-1B, XI-2, XI-3, and XI-adm). (B) Kinship heat map of 469 rice. The indica subpopulation in the lower left corner and the japonica subpopulation in the upper right corner.
Ijms 25 02969 g002
Figure 3. Associated region and haplotype analysis of OsCKX9. (A) Regional Manhattan plots and linkage distribution (LD) heatmap of OsCKX9. (B) Gene structure and haplotype analysis of OsCKX9. LD blocks indicated ± 200 kb. LN: Low nitrogen; ETN: Effective tillering number. The box plot describes the ETN distribution of a subgroup with a haplotype. Significant differences in two-way ANOVA (** p < 0.01, ** indicates significant difference in average ETN among 469 accessions at p < 0.01, ns: no significant. H: Haplotypes, Y: Years, H × Y: Haplotypes × Years).
Ijms 25 02969 g003
Figure 4. Associated region and haplotype analysis of NAL1. (A) Regional Manhattan plots and linkage distribution (LD) heatmap of NAL1. (B) Gene structure and haplotype analysis of NAL1. LD blocks indicated ± 200 kb. LN: Low nitrogen; ETN: Effective tillering number. The box plot describes the ETN distribution of a subgroup with a haplotype. Significant differences in two-way ANOVA (* p < 0.05, * indicates significant difference in average ETN among 469 accessions at p < 0.05, ns: no significant. H: Haplotypes, Y: Years, H × Y: Haplotypes × Years).
Ijms 25 02969 g004
Figure 5. Associated region and haplotype analysis of Os01g0690800. (A) Regional Manhattan plots and linkage distribution (LD) heatmap of Os01g0690800. (B) Gene structure and haplotype analysis of Os01t0690800. LD blocks indicated ± 200 kb. LN: Low nitrogen; HN: High nitrogen; ETN: Effective tillering number. The box plot describes the ETN distribution of a subgroup with a haplotype. Significant differences in two-way ANOVA (* p < 0.05, * indicates significant difference in average ETN among 469 accessions at p < 0.05, ns: no significant. H: Haplotypes, Y: Years, H × Y: Haplotypes × Years).
Ijms 25 02969 g005
Figure 6. Associated region and haplotype analysis of Os02g0550300 and Os02g0550700 (A) Gene structure and haplotype analysis of Os02g0550300. (B) Gene structure and haplotype analysis of Os02g0550700. LD blocks indicated ± 200 kb. LN: Low nitrogen; NRI: Ratio of high to low nitrogen. The box plot describes the ETN distribution of a subgroup with a haplotype. Significant differences in two-way ANOVA (* p < 0.05, * indicates significant difference in average ETN among 469 accessions at p < 0.05, ns: no significant. H: Haplotypes, Y: Years, H × Y: Haplotypes × Years).
Ijms 25 02969 g006
Figure 7. Associated region and haplotype analysis of Os04g0615700 and Os04t06163000. (A) Gene structure and haplotype analysis of Os04g0615700. (B) Gene structure and haplotype analysis of Os04t06163000. LD blocks indicated ± 200 kb. LN: Low nitrogen. The box plot describes the ETN distribution of a subgroup with a haplotype. Significant differences in two-way ANOVA (* p < 0.05, * indicates significant difference in average ETN among 469 accessions at p < 0.05, ns: no significant. H: Haplotypes, Y: Years, H × Y: Haplotypes × Years).
Ijms 25 02969 g007
Figure 8. Temporal expression pattern of efficient total nitrogen (ETN)-associated genes during the whole growth period. Expression data in root (A) at 12:00 and (B) 00:00 have been downloaded from the RiceXPro website (https://ricexpro.dna.affrc.go.jp/, accessed on 7 November 2022). The heatmaps represent hierarchical clustering of relative expression levels of 12 candidate genes on different days after transplanting (DAT). The scale for relative expression levels (after normalization by z-score) is denoted by color bars, with red representing high expression levels, white representing medium expression, and blue representing low expression.
Ijms 25 02969 g008
Table 1. Descriptive statistics of effective tillers under different nitrogen levels in 2021 and 2022.
YearNitrogenSubpopulationAverageSDSkewnessKurtosisMinMaxCV%
2021LNIndica10.603.331.411.115.2022.0031.44
Japonica8.242.471.290.943.3318.4029.92
Whole9.352.420.740.783.0017.2529.07
HNIndica12.053.762.371.315.8026.8031.24
Japonica9.963.000.770.774.2520.0030.12
Whole11.143.602.391.204.2526.8032.30
2022LNIndica11.213.364.591.585.1727.5029.99
Japonica10.123.270.100.804.3319.2532.30
Whole10.633.352.461.154.3327.5031.52
HNIndica13.483.913.091.146.2033.0029.01
Japonica11.964.201.081.024.8326.6735.15
Whole12.704.131.720.984.8333.0032.53
Table 2. Genetic loci associated with effective tiller number were studied by genome-wide association.
ChrStartEndYearSubpopulationQTLp-ValueCandidate/Known Gene
128312507286352352021IndicaqLETN1-29.7639 × 10⁻⁶ Os01g0690800
2021IndicaqHETN1-24.96655 × 10⁻⁶
2022Indica, WholeqHETN1-23.05122 × 10⁻⁶
2192501722586542021IndicaqLETN2-13.77201 × 10⁻⁶
Indica, WholeqHETN2-1, qHETN2-38.0282 × 10⁻⁷
2022WholeqLETN2-17.92919 × 10⁻⁶
220316453208063382022Indica, WholeqLETN2-4, qLETN2-5, qLETN2-6, qLETN2-78.01316 × 10⁻⁷Os02t0550300
Os02t0550700
Indica, WholeqNRI2-4, qNRI2-5, qNRI2-65.38504 × 10⁻⁷
328202203284083322021IndicaqLETN3-11.25578 × 10⁻⁶
2022IndicaqLETN3-17.8412 × 10⁻⁶
431125957313259652021Japonica, WholeqLETN4-34.1416 × 10⁻⁶NAL1 [30]
Os04g0615700
Os04t0616300
2022Japonica, WholeqLETN4-33.52586 × 10⁻⁶
518033644182601062021IndicaqLETN5-13.84225 × 10⁻⁶OsCKX9 [31]
2022IndicaqLETN5-15.65649 × 10⁻⁷
520672878209562212021WholeqNRI5-38.01541 × 10⁻⁶
2022WholeqNRI5-38.29562 × 10⁻⁶
7916784493684392021JaponicaqLETN7-14.6369 × 10⁻⁶
2022JaponicaqLETN7-17.8421 × 10⁻⁶
727836562280485312021IndicaqNRI7-26.56564 × 10⁻⁶
2022IndicaqNRI7-25.6232 × 10⁻⁶
820505376207235652021WholeqLETN8-18.65652 × 10⁻⁶
2022WholeqLETN8-17.51026 × 10⁻⁶
Disclaimer/Publisher’s Note: The statements, opinions and data contained in all publications are solely those of the individual author(s) and contributor(s) and not of MDPI and/or the editor(s). MDPI and/or the editor(s) disclaim responsibility for any injury to people or property resulting from any ideas, methods, instructions or products referred to in the content.

