Article

Genome-Wide Identification of the GhANN Gene Family and Functional Validation of GhANN11 and GhANN4 under Abiotic Stress

1
State Key Laboratory of Aridland Crop Science, College of Life Science and Technology, Gansu Agricultural University, Lanzhou 730070, China
2
Institute of Cotton Research, State Key Laboratory of Cotton Biology, Chinese Academy of Agricultural Sciences (CAAS), Anyang 455000, China
*
Authors to whom correspondence should be addressed.
Int. J. Mol. Sci. 2024, 25(3), 1877; https://doi.org/10.3390/ijms25031877
Submission received: 8 December 2023 / Revised: 13 January 2024 / Accepted: 22 January 2024 / Published: 4 February 2024
(This article belongs to the Section Molecular Plant Sciences)

Abstract

:
Annexins (ANNs) are a structurally conserved protein family present in almost all plants. In the present study, 27 GhANNs were identified in cotton and were unevenly distributed across 14 chromosomes. Transcriptome data and RT-qPCR results revealed that multiple GhANNs respond to at least two abiotic stresses. Similarly, the expression levels of GhANN4 and GhANN11 were significantly upregulated under heat, cold, and drought stress. Using virus-induced gene silencing (VIGS), functional characterization of GhANN4 and GhANN11 revealed that, compared with those of the controls, the leaf wilting of GhANN4-silenced plants was more obvious, and the activities of catalase (CAT), peroxidase (POD), and superoxide dismutase (SOD) were lower under NaCl and PEG stress. Moreover, the expression of stress marker genes (GhCBL3, GhDREB2A, GhDREB2C, GhPP2C, GhRD20-2, GhCIPK6, GhNHX1, GhRD20-1, GhSOS1, GhSOS2 and GhSnRK2.6) was significantly downregulated in GhANN4-silenced plants after stress. Under cold stress, the growth of the GHANN11-silenced plants was significantly weaker than that of the control plants, and the activities of POD, SOD, and CAT were also lower. However, compared with those of the control, the elasticity and orthostatic activity of the GhANN11-silenced plants were greater; the POD, SOD, and CAT activities were higher; and the GhDREB2C, GhHSP, and GhSOS2 expression levels were greater under heat stress. These results suggest that different GhANN family members respond differently to different types of abiotic stress.

1. Introduction

A large family of proteins called annexins (ANNs), which bind to membrane phospholipids in a calcium-dependent manner, has been found in both animals and plants [1]. Since the initial cloning of ANNs from human cells [2], more than a thousand ANN members have been discovered. ANN protein family members are divided into five classes: vertebrate ANNs belong to class A; invertebrate ANNs are classified as class B; ANNs of fungi and some single-celled eukaryotes belong to class C; plant ANNs belong to class D; and prokaryotic ANNs are classified as class E [3]. Although plant ANNs were first studied earlier than animal ANNs were, many valuable advances have been made in plant ANNs in recent years. In 1989, plant annexin was first isolated from isolated tomato cells [4]. To date, accumulating scientific data indicate that plant annexins are broadly dispersed across various plant tissues, with distinct functions assigned to each subtype. It was found that annexins were significantly expressed in the root hairs and fibers of some plants. PvAnn1 is highly expressed at the site of symbiosis between root hairs and Rhizobium tropici, and a decrease in PvAnn1 expression leads to the shortening of root hairs in kidney beans [5]. On the other hand, AnnSp2, which was cloned from naturally drought-resistant plants (Solanum pennellii), was expressed in all organs of tomato plants but was expressed at lower levels in roots and more highly expressed in leaves and flowers [6]. Previous studies have shown that ANN protein levels increase in response to red light during the elongation stage and that p35 results in a greater level of staining in secretory cell types, such as outer root cap cells. p35 immunostaining is primarily found in secretory cells, such as outer root cap cells and root hair cells, in pea plants [7,8,9]. These results imply that tip-directed exocytosis processes, including secretion and the generation of new cell walls, are significantly influenced by ANN proteins. In addition, ANN genes play a potential role in the reproductive stage. Studies have shown that TaAnn10 is specifically expressed in anthers but is not expressed at low temperatures in heat-sensitive male sterile lines [10]. Similar results have been observed in Arabidopsis [11]. Subsequent studies revealed that increased AtAnn5 expression levels are specific to Arabidopsis anthers and that inhibition of AtAnn5 expression leads to decreased pollen grain size, increased pollen mortality, and delayed pollen tube growth [11]. On the other hand, abnormal developmental stages from the vegetative to the reproductive stage, as well as during embryogenesis, are also observed in AtAnn5 RNA interference plants [11]. Additionally, the expression levels of FaAnn5a and FaAnn8 are higher during strawberry fruit ripening, which is promoted by exogenous ABA and inhibited by IAA [12]. According to previous research, TtGS5, a serine carboxypeptidase-like protein found in Triticum timopheevii, interacts with TtAnnD1 to control the size and weight of premature grains [13]. Furthermore, the expression levels of annexins were much greater at night than during the day in Mimosa pulvinus, suggesting that MpANNs may play a unique role in circadian rhythm control [14].
In addition to its vital role in growth and development, Annexin is crucial for plant responses to biotic stress. Annexins promote signal transduction by perceiving signals on the membrane, enabling plants to defend themselves against biotic stress. Previous research has demonstrated that salicylic acid increases the expression level of AtAnn1, which is possibly related to the function of proteins related to biotic stress [15]. Additionally, it was discovered that the ann1ann2 double mutant was more susceptible to Botrytis cinerea [16]. AtANN8 inhibits cell death and reduces powdery mildew resistance mediated by RPW8.1 [17]. After infection with Pseudomonas syringae, the expression level of NtAnn12 was markedly elevated in tobacco [18]. Studies have also shown that ANN expression is induced by bacterial wilt, root-knot nematode, and thrips infestations in tomato and pepper plants [19]. Plants generate proteins known as pathogenesis-related (PR) proteins in response to pathogen invasion. Upon pathogen invasion, ANN induces the expression of several PR proteins [20,21,22]. CkANN can increase peroxidase activity, induce the expression of several PR protein genes, and further enhance resistance to Fusarium oxysporum in transgenic cotton lines [22]. AnnAt1 and AnnAt4 are targeted by MiMIF-2 in Arabidopsis thaliana (MiMIF-2 is an inhibitor of macrophage migration in root-knot nematodes). While plants with AnnAt1 and AnnAt4 knocked out become more susceptible to root-knot nematodes, plants that overexpress AnnAt1 and AnnAt4 exhibit increased resistance to these worms [23].
Annexins are crucial in plants for regulating abiotic stress, as they respond to biotic stress. Numerous studies have demonstrated that ANN proteins can protect plants against abiotic stress [20]. Elevated salinity is the most common abiotic stress on plants. Salt stress induces the cytoplasmic transport of AtAnn1 to membranes in A. thaliana, and annAt1/annAt4 double mutants exhibit hypersensitivity to ABA signaling and osmotic stress [24]. Studies have also shown that Ann1At and Ann4At interact to regulate salt and drought tolerance in a Ca2+-dependent manner [20,25]. An increasing number of taxa have recently demonstrated annexin responses to drought and salt stress. An increasing number of studies conducted in the past several years have demonstrated that ANN proteins play a role in how plants react to stressors such as drought and salt. Under salt and drought stress, the degree of growth inhibition in AnnSp2-overexpressing tomato plants was lower than that in wild-type plants [6]. Studies have shown that overexpressing PtAnnexin1 can enhance plant resilience to salt and drought stress in artificial poplar plants [26]. The ability of transgenic lines to withstand salt stress can be enhanced by overexpressing AnnBj2 in tobacco [27,28]. Studies have shown that GhANN1 can improve the drought and salt tolerance of upland cotton plants by controlling ion homeostasis, regulating the accumulation of ABA, and participating in the phenylpropanoid production pathway and that GhAnn8b can improve the salt tolerance of transgenic Arabidopsis lines by elevating Na2+ efflux [29,30,31]. OsAnn3 actively controls rice drought stress resistance in an ABA-dependent manner, while OsAnn10 may negatively regulate the osmotic stress response because OsAnn10-knockdown plants exhibit tolerance to osmotic stress [32,33]. Several studies have shown that cold stress can increase the accumulation of ANN in the wheat plasma membrane [34]. AtAnn1 mutants exhibit decreased freezing resistance during cold-induced [Ca2+]cyt elevation [35]. A further experiment supported this conclusion, showing that phytoannexin positively regulates cold stress [35]. On the other hand, the OsAnn3 loss-of-function mutant shows resistance to cold [36]. ZmANN33 and ZmANN35 were found to play active roles in plant recovery from cooling damage in maize experiments [37]. Earlier studies revealed that the expression of NnANN1 increased the heat resistance of Arabidopsis seeds [38]. Rapid elevation of [Ca2+]cyt in plants is considered an important step in response to heat stress [39]. The ann1/ann2 double mutants are more sensitive to heat shock treatment, and both ANNs redundantly control heat shock tolerance in Arabidopsis [39]. Additional research has shown that MYB30 depends on AtAnn1 and AtAnn4 to control the responses to heat stress and oxidative stress [40]. It has been hypothesized that the function of ANN in plant heat tolerance is related to peroxidation regulation [41]. By promoting catalase (CAT) and superoxide dismutase (SOD) activities, which regulate REDOX homeostasis and H2O2 concentration, the overexpression of OsANN1 improves the development of rice plants under abiotic stress [41].
Cotton is an important cash crop in addition to being a raw material used in the textile industry. The cotton annexin gene was shown to be significantly expressed during the cotton fiber differentiation extension phase, suggesting that annexin is involved in cell elongation [42,43]. Additional research has shown that GhAnn2 controls Ca2+ flow signaling, which in turn controls fiber formation [43]. Because abiotic stress significantly reduces cotton production and fiber quality, it is crucial to leverage key genes to increase the abiotic stress resistance of cotton varieties. The systematic study of ANNs in cotton is not only helpful for studying the resistance mechanism of ANN family genes but also has the potential to facilitate the use of ANN family genes to improve the stress resistance of cotton varieties. In this work, ANN gene family members were identified in four different Gossypium spp. using bioinformatics approaches. Evolutionary linkages, expression patterns, chromosomal locations, and gene structural characteristics were determined. To filter potential GhANNs, RNA-seq and qRT-PCR data were obtained. We discovered that at least three stress treatments increased the expression levels of GhANN4 and GhANN11. To investigate their impact on the abiotic stress response of upland cotton plants, GhANN4 and GhANN11 were silenced by VIGS to examine their roles in salt, drought, and low-temperature and high-temperature responses. In addition to providing good genetic resources for the production and use of GhANNs to produce resistant cotton varieties, this work will further our understanding of the importance of the ANN gene family in the cotton abiotic stress response.

2. Results

2.1. Identification and Physicochemical Properties of ANN Gene Family Members in Four Gossypium spp.

A total of 97 ANN candidate genes were extracted from Gossypium arboreum, Gossypium raimondii, Gossypium hirsutum, and Gossypium barbadense. Fourteen GaANNs, fourteen GrANNs, twenty-seven GhANNs, and twenty-nine GbANNs were identified after excluding candidate genes with significantly deficient ANN domains and those without ANN domains (Table 1 and Table S1), and they were named based on their chromosomal positions. More than 80% of the ANN proteins from the four Gossypium spp. contained 304 to 328 amino acids. The results of isoelectric point analysis showed that ANN proteins are either acidic or basic and that each type was present in roughly equal proportions in the four Gossypium spp. (G. hirsutum: thirteen acidic, fourteen basic; G. barbadense: thirteen acidic, sixteen basic; G. arboreum: seven acidic, seven basic; G. raimondii: seven acidic, seven basic). Among the four Gossypium spp., the instability indices of most GhANN proteins were less than 40, while those of the GbANN, GaANN, and GrANN proteins were all greater than 40. Only the GhANN proteins were relatively stable [44]. Approximately 67% of the ANN proteins were predicted to be present in the cytoplasm of the four Gossypium spp. (Table 1 and Table S1).

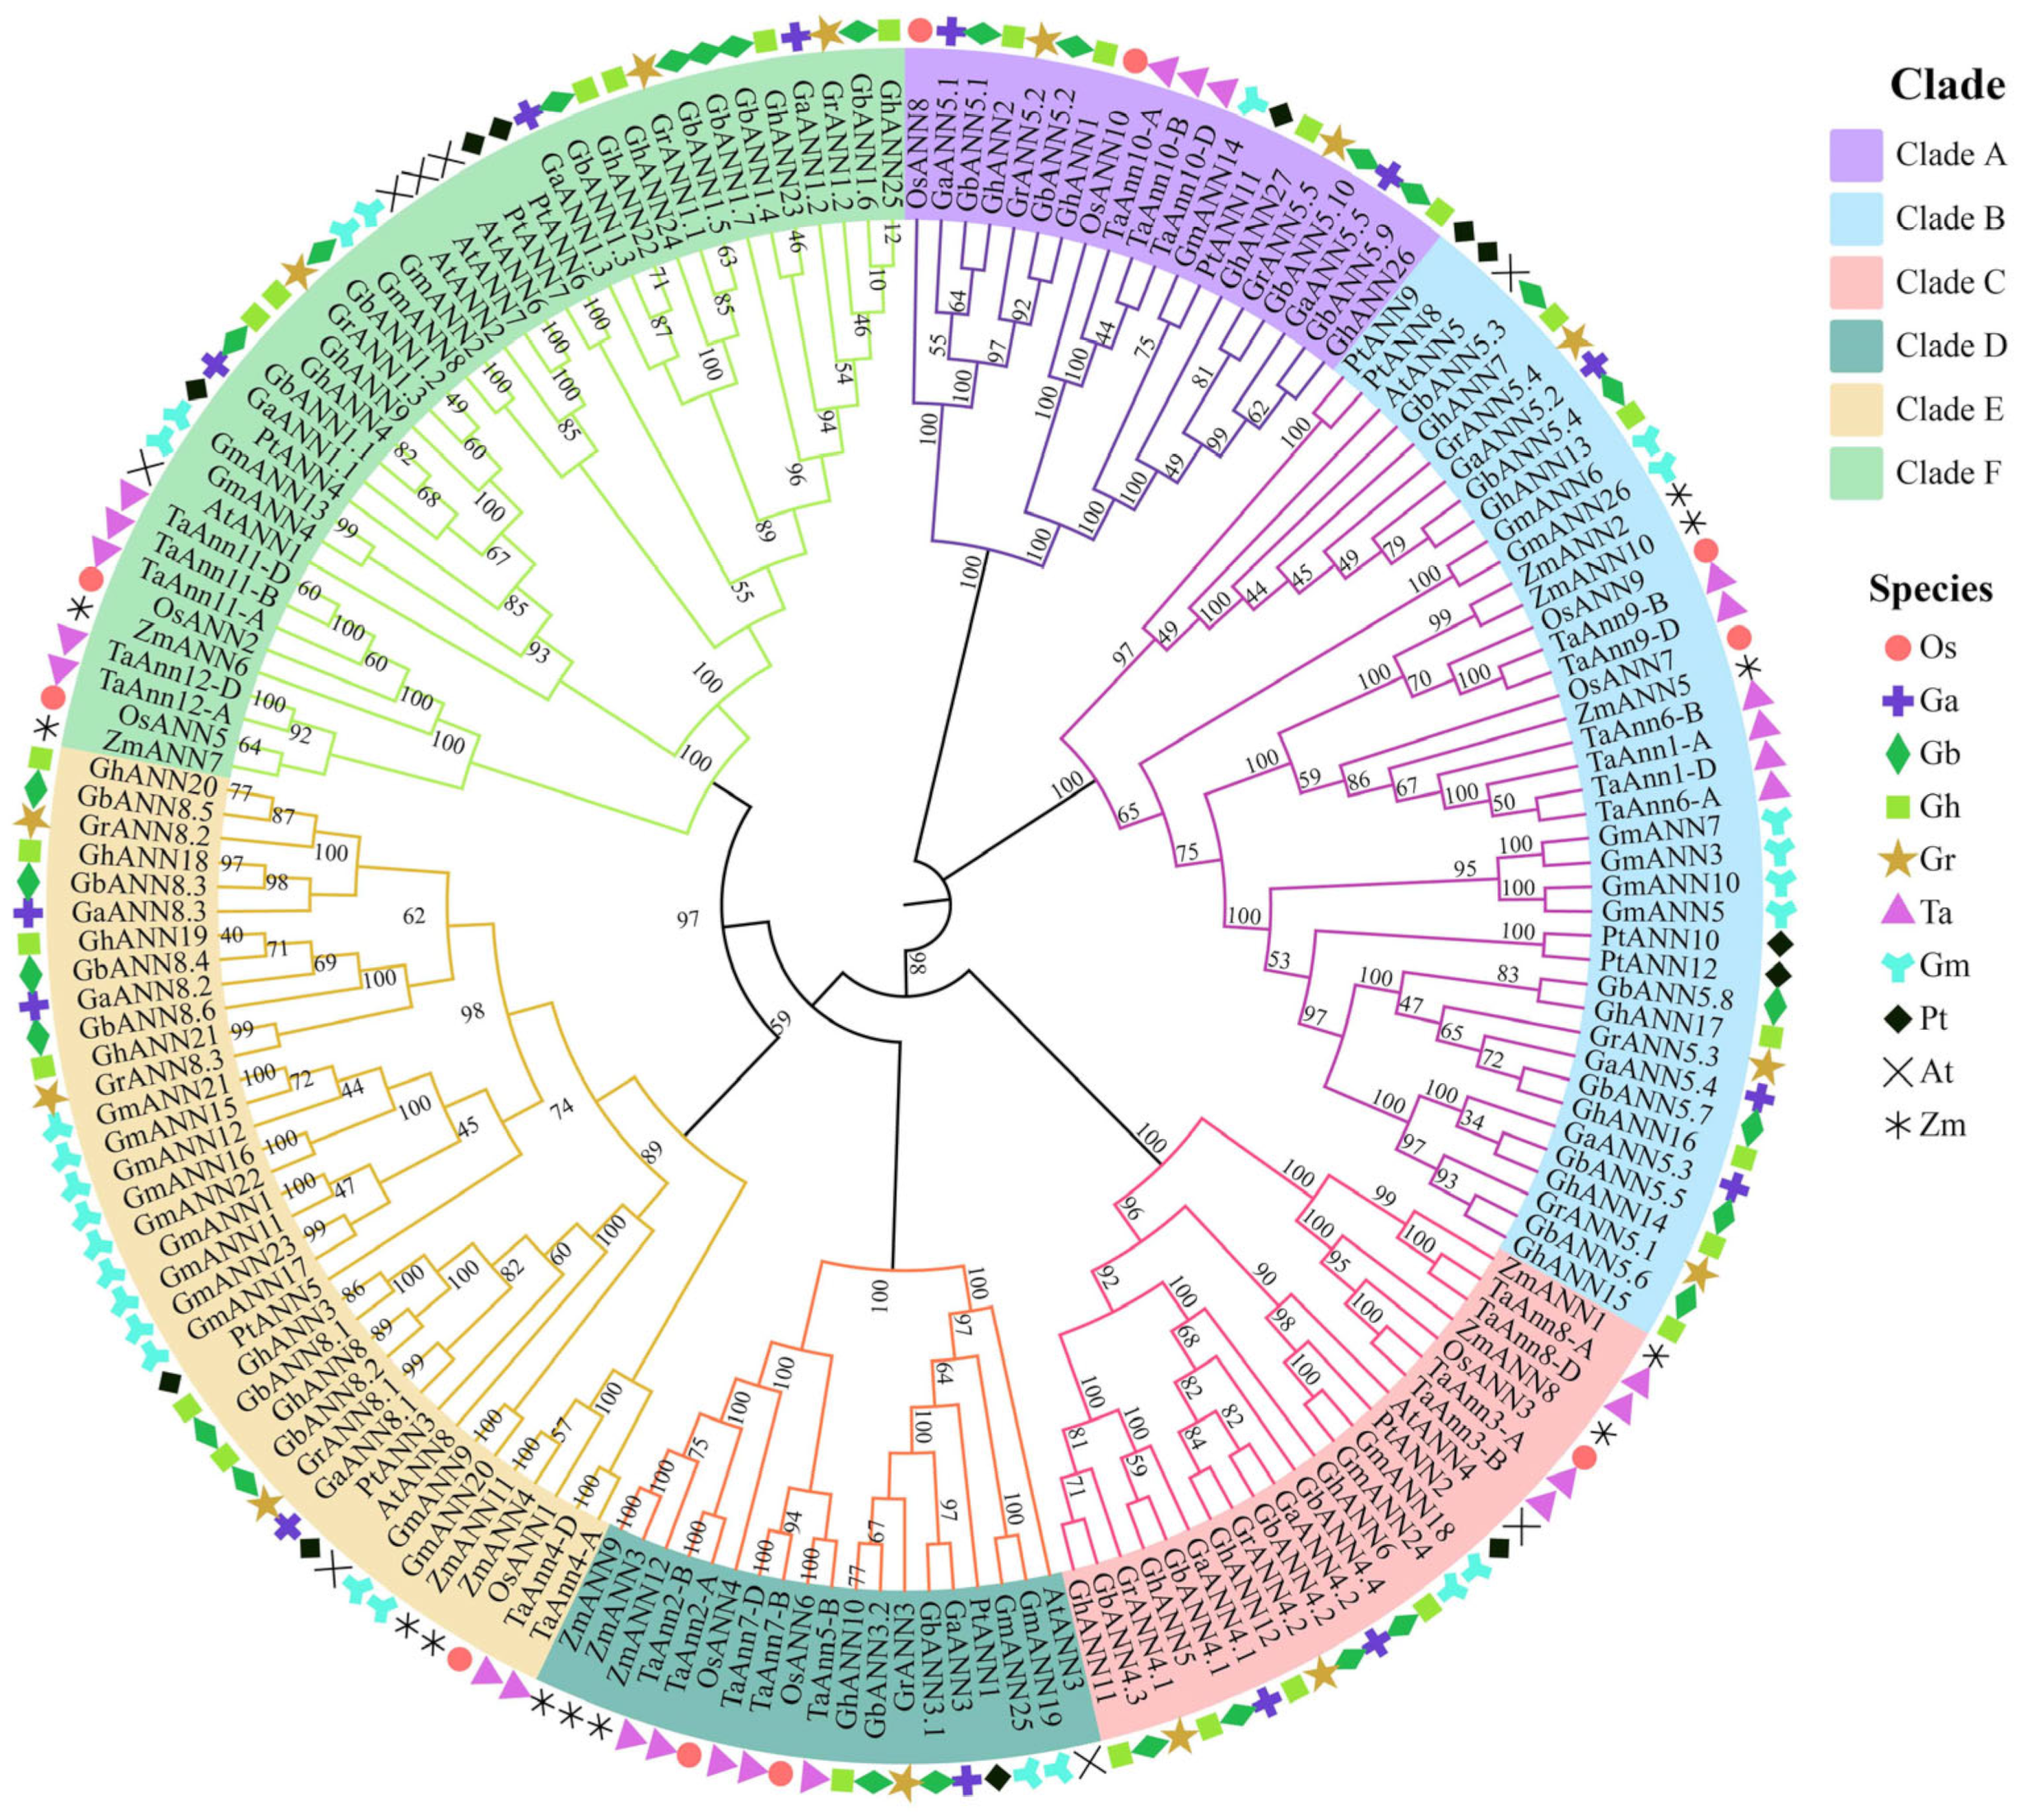
2.2. Phylogenetic Study of the ANN Gene Family Members

To thoroughly investigate the evolutionary link of ANNs in different species, one hundred and seventy-four ANN proteins from 10 species were concatenated to construct an evolutionary tree (fourteen GaANNs, fourteen GrANNs, twenty-seven GhANNs, twenty-nine GbANNs, ten OsANNs, twenty-five TaANNs, twelve PtANNs, twelve ZmANNs, twenty-three GmANNs, and eight AtANNs) in this study. Based on bootstrap values (=1000), the findings showed that six main clades (A–F) consisting of 174 ANNs were clustered together (Figure 1). Clade A had the lowest distribution (n = 19, 10.92%), while Clade B had the highest distribution (n = 40, 22.99%). The GhANNs were mainly clustered in clade B, clade E, and clade F. In addition, the ANNs from the four cotton species were more concentrated in each group.

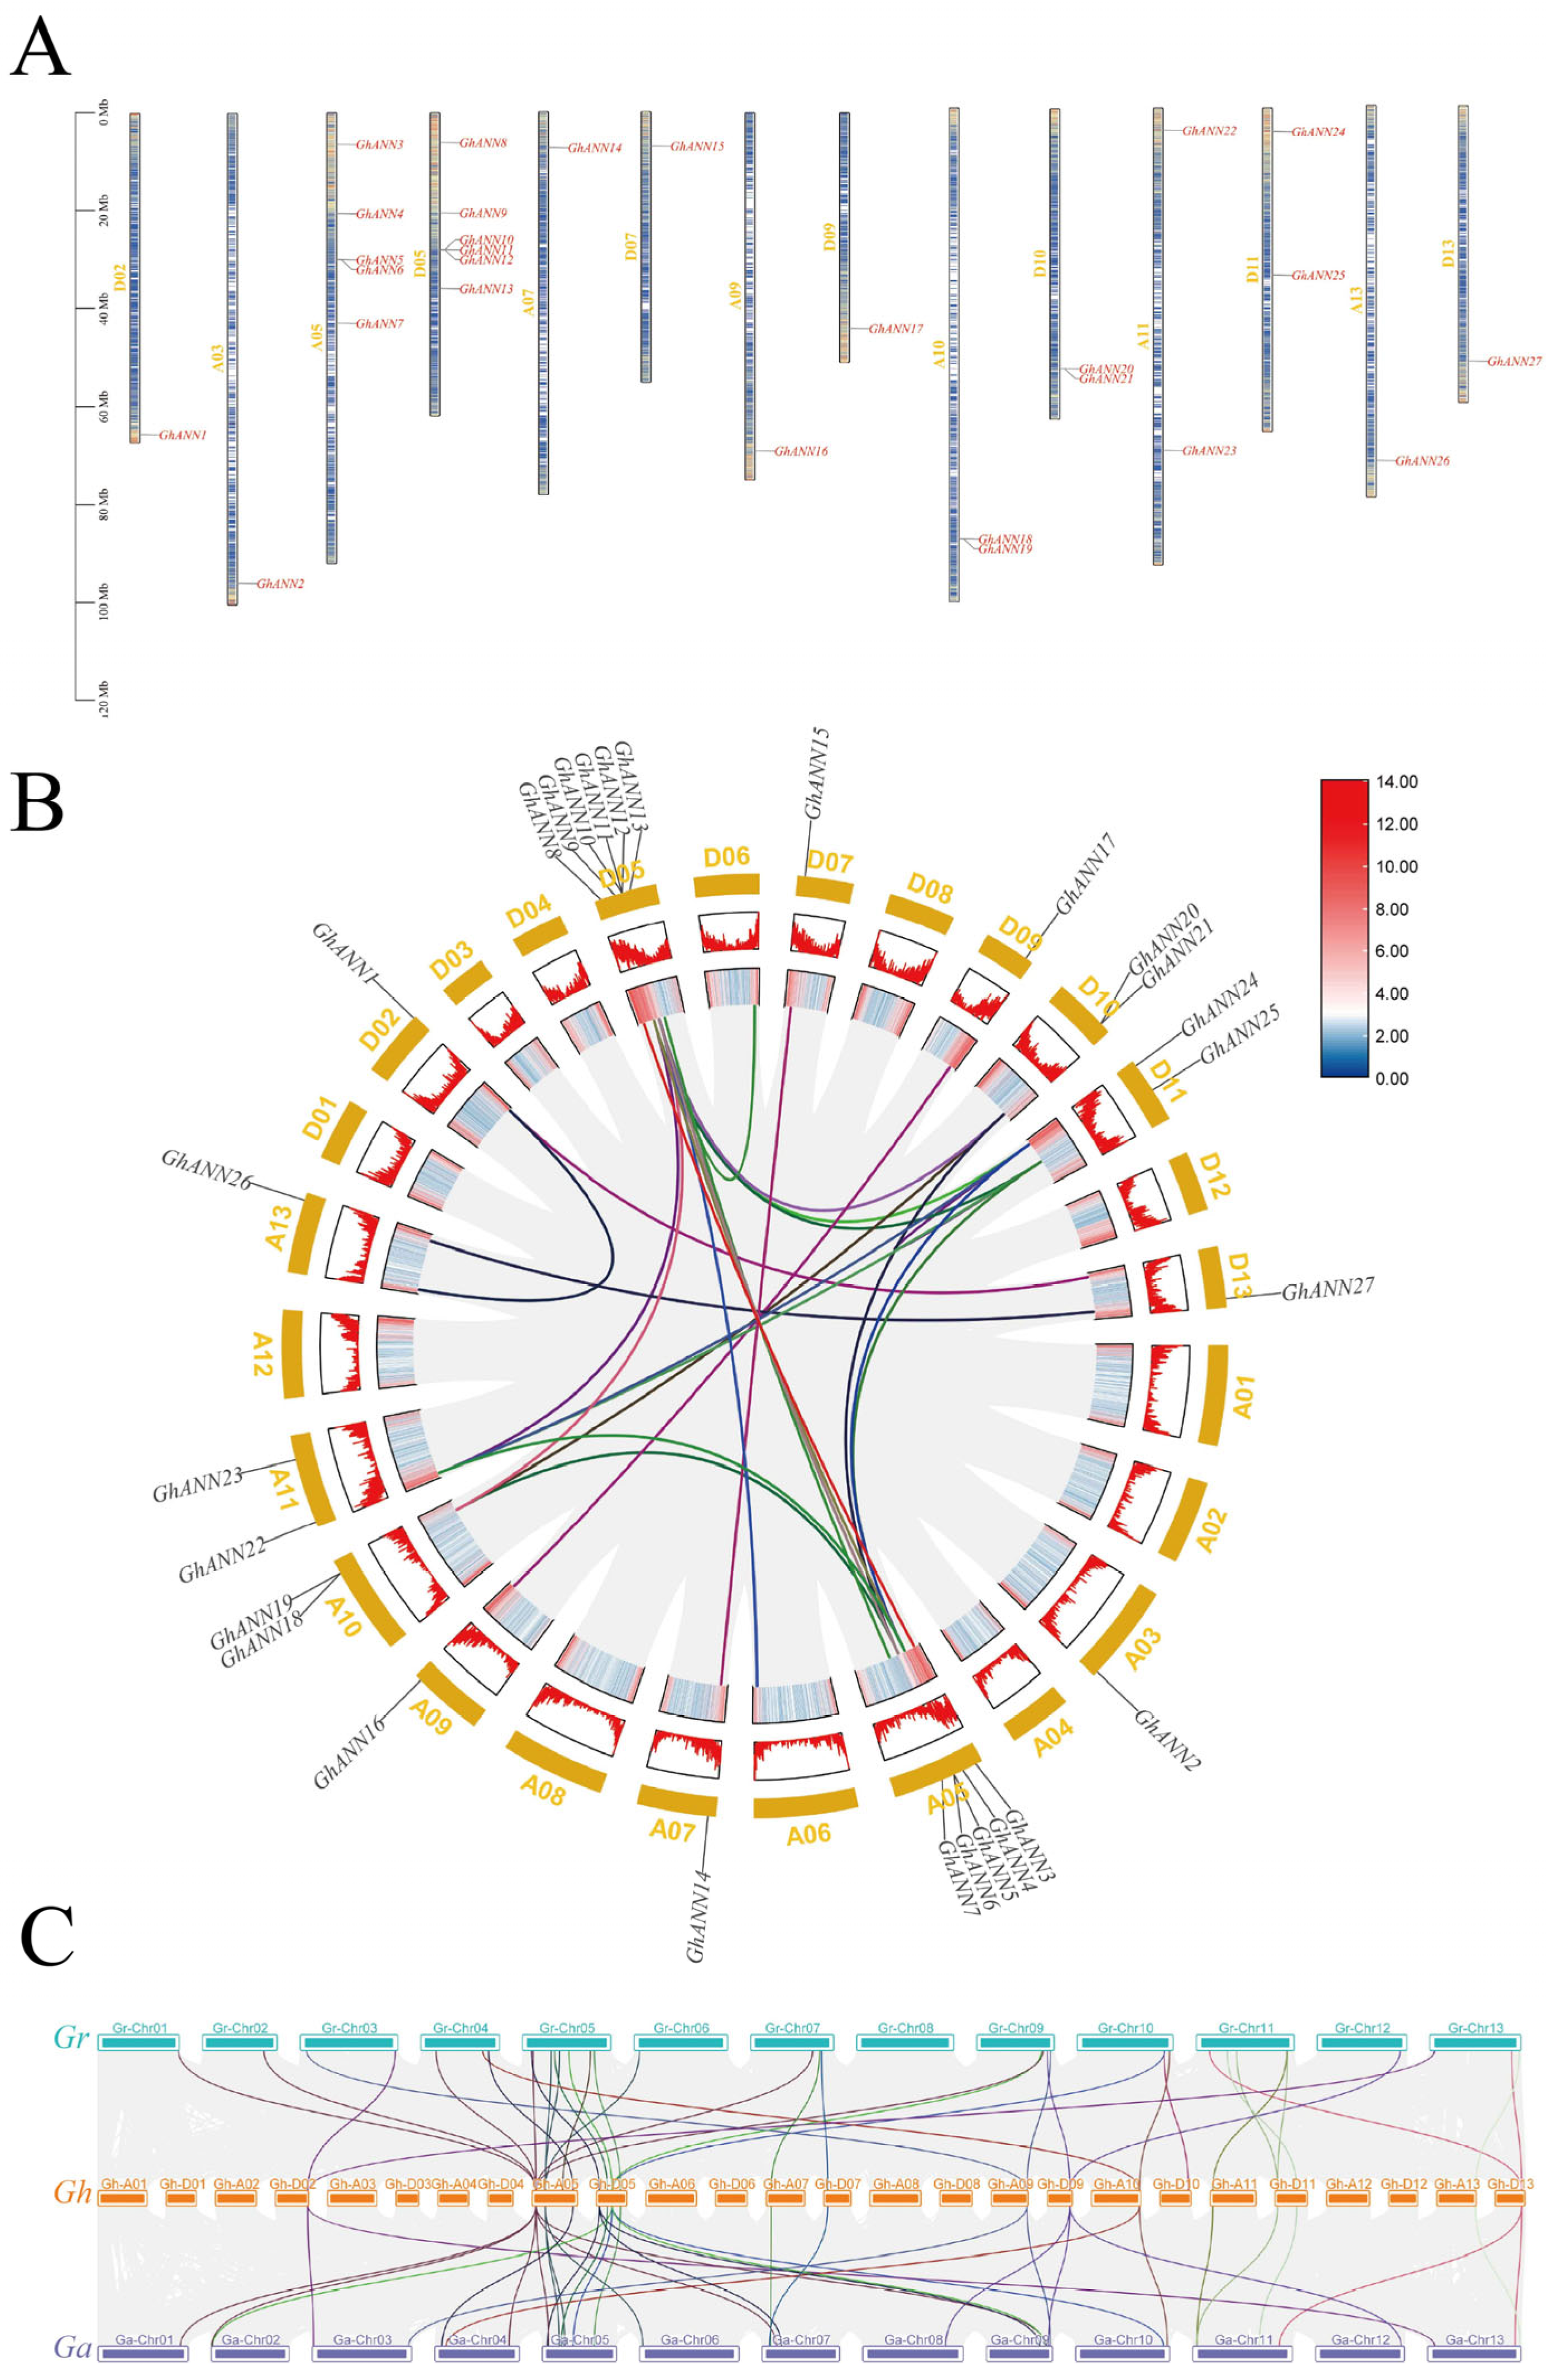
2.3. Distribution of Chromosomes, Intergenomic Interactions, and Collinear Relationships within the GhANN Family

Chromosome distribution analysis of the 27 GhANN genes revealed that they were scattered on 14 chromosomes with a certain distribution preference (Figure 2A). To investigate duplicates within the GhANN family, we performed a genomic collinearity analysis in MCScanX. Eight segmentally and two tandemly duplicated gene pairs were found throughout the upland cotton genome (Figure 2B). This finding suggests that segmental duplication events made a greater contribution than tandem duplication events in the GhANN family. The majority of the GhANNs were found to be homologous on the chromosomes of G. arboreum and G. raimondii, and certain GhANNs correlated with multiple homologous genes in both species (Figure 2C). Like those in G. arboreum and G. raimondii, these homologous genes in G. hirsutum species are likely expressed in comparable tissues or cell types and have comparable functions. The Ka:Ks ratios of the GhANN family members were lower than 0.82 (Table S2), which indicated that purifying selection was highly important for the evolution of GhANNs.

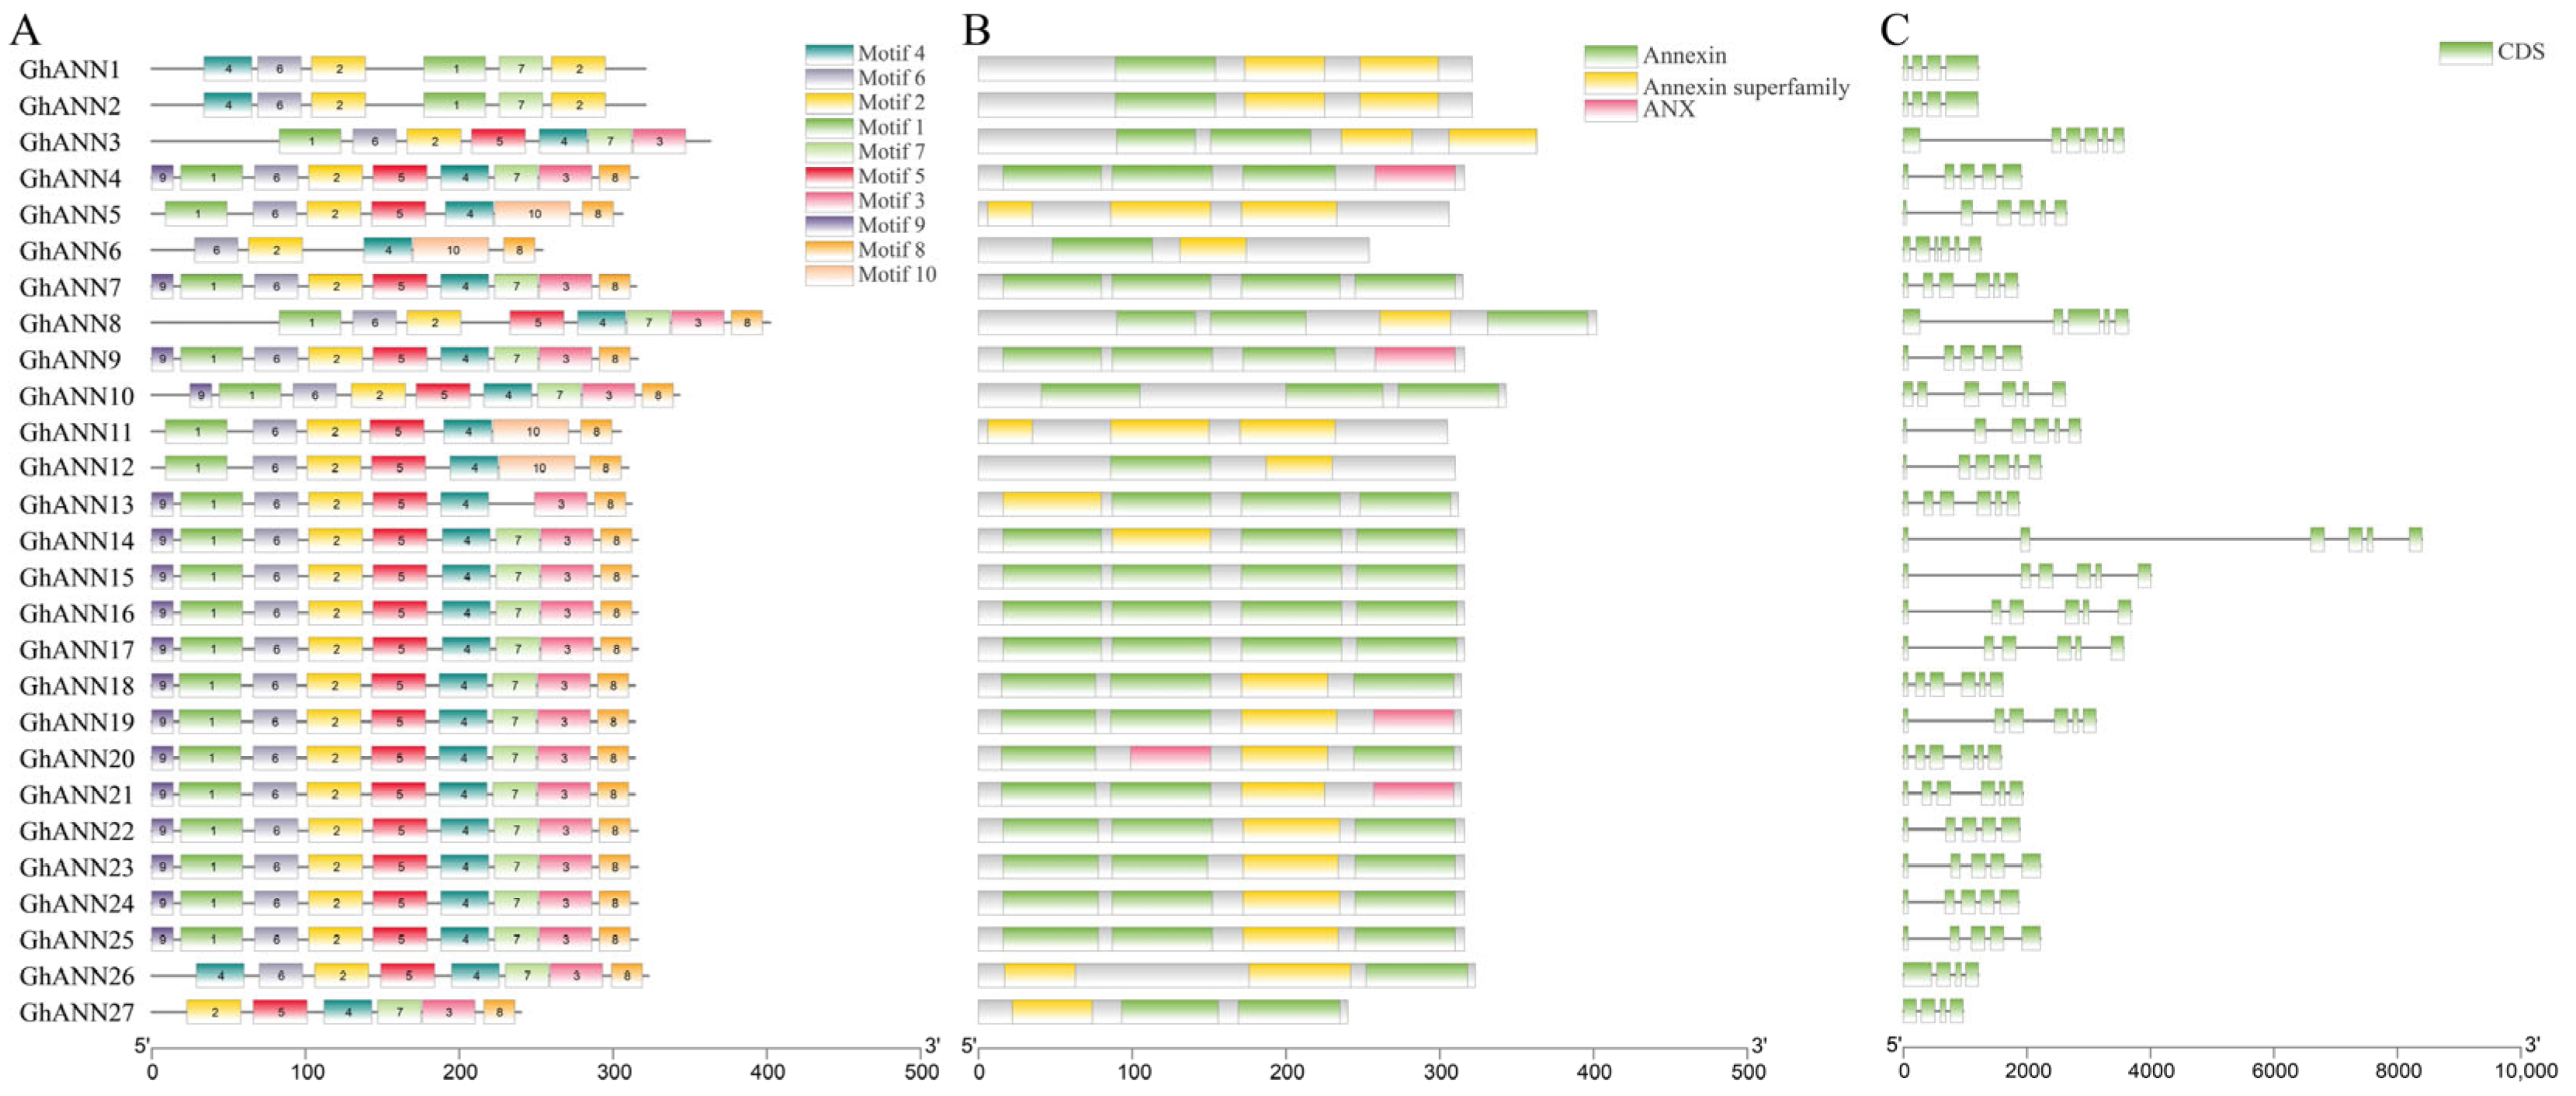
2.4. Conserved Polypeptide Motifs, Functional Domains, and Gene Structure of the ANN Family

The conserved polypeptide motifs of 27 GhANN proteins were assessed using MEME software (https://meme-suite.org/meme/, accessed on 30 April 2023) [45]. The results demonstrated that all the GhANNs had at least motifs 2 and 4, and GhANN13 had all the motifs (Figure 3A). Only GhANN5 and GhANN11 did not have annexin domains, while GhANN5 had only annexin superfamily domains, and ANX domains only existed in GhANN4, GhANN9, GhANN19, GhANN20, and GhANN21 (Figure 3B). We examined the genomic DNA sequences of GhANNs from G. hirsutum to determine the numbers of exons and introns and the arrangement of each gene. The exon counts ranged from four to six for the GhANNs (Figure 3C). Additionally, the evolutionary tree revealed that closely related GhANN family members had more conserved motifs and gene structures. We speculated that the functions of these GhANN family members with conserved motifs could be similar.

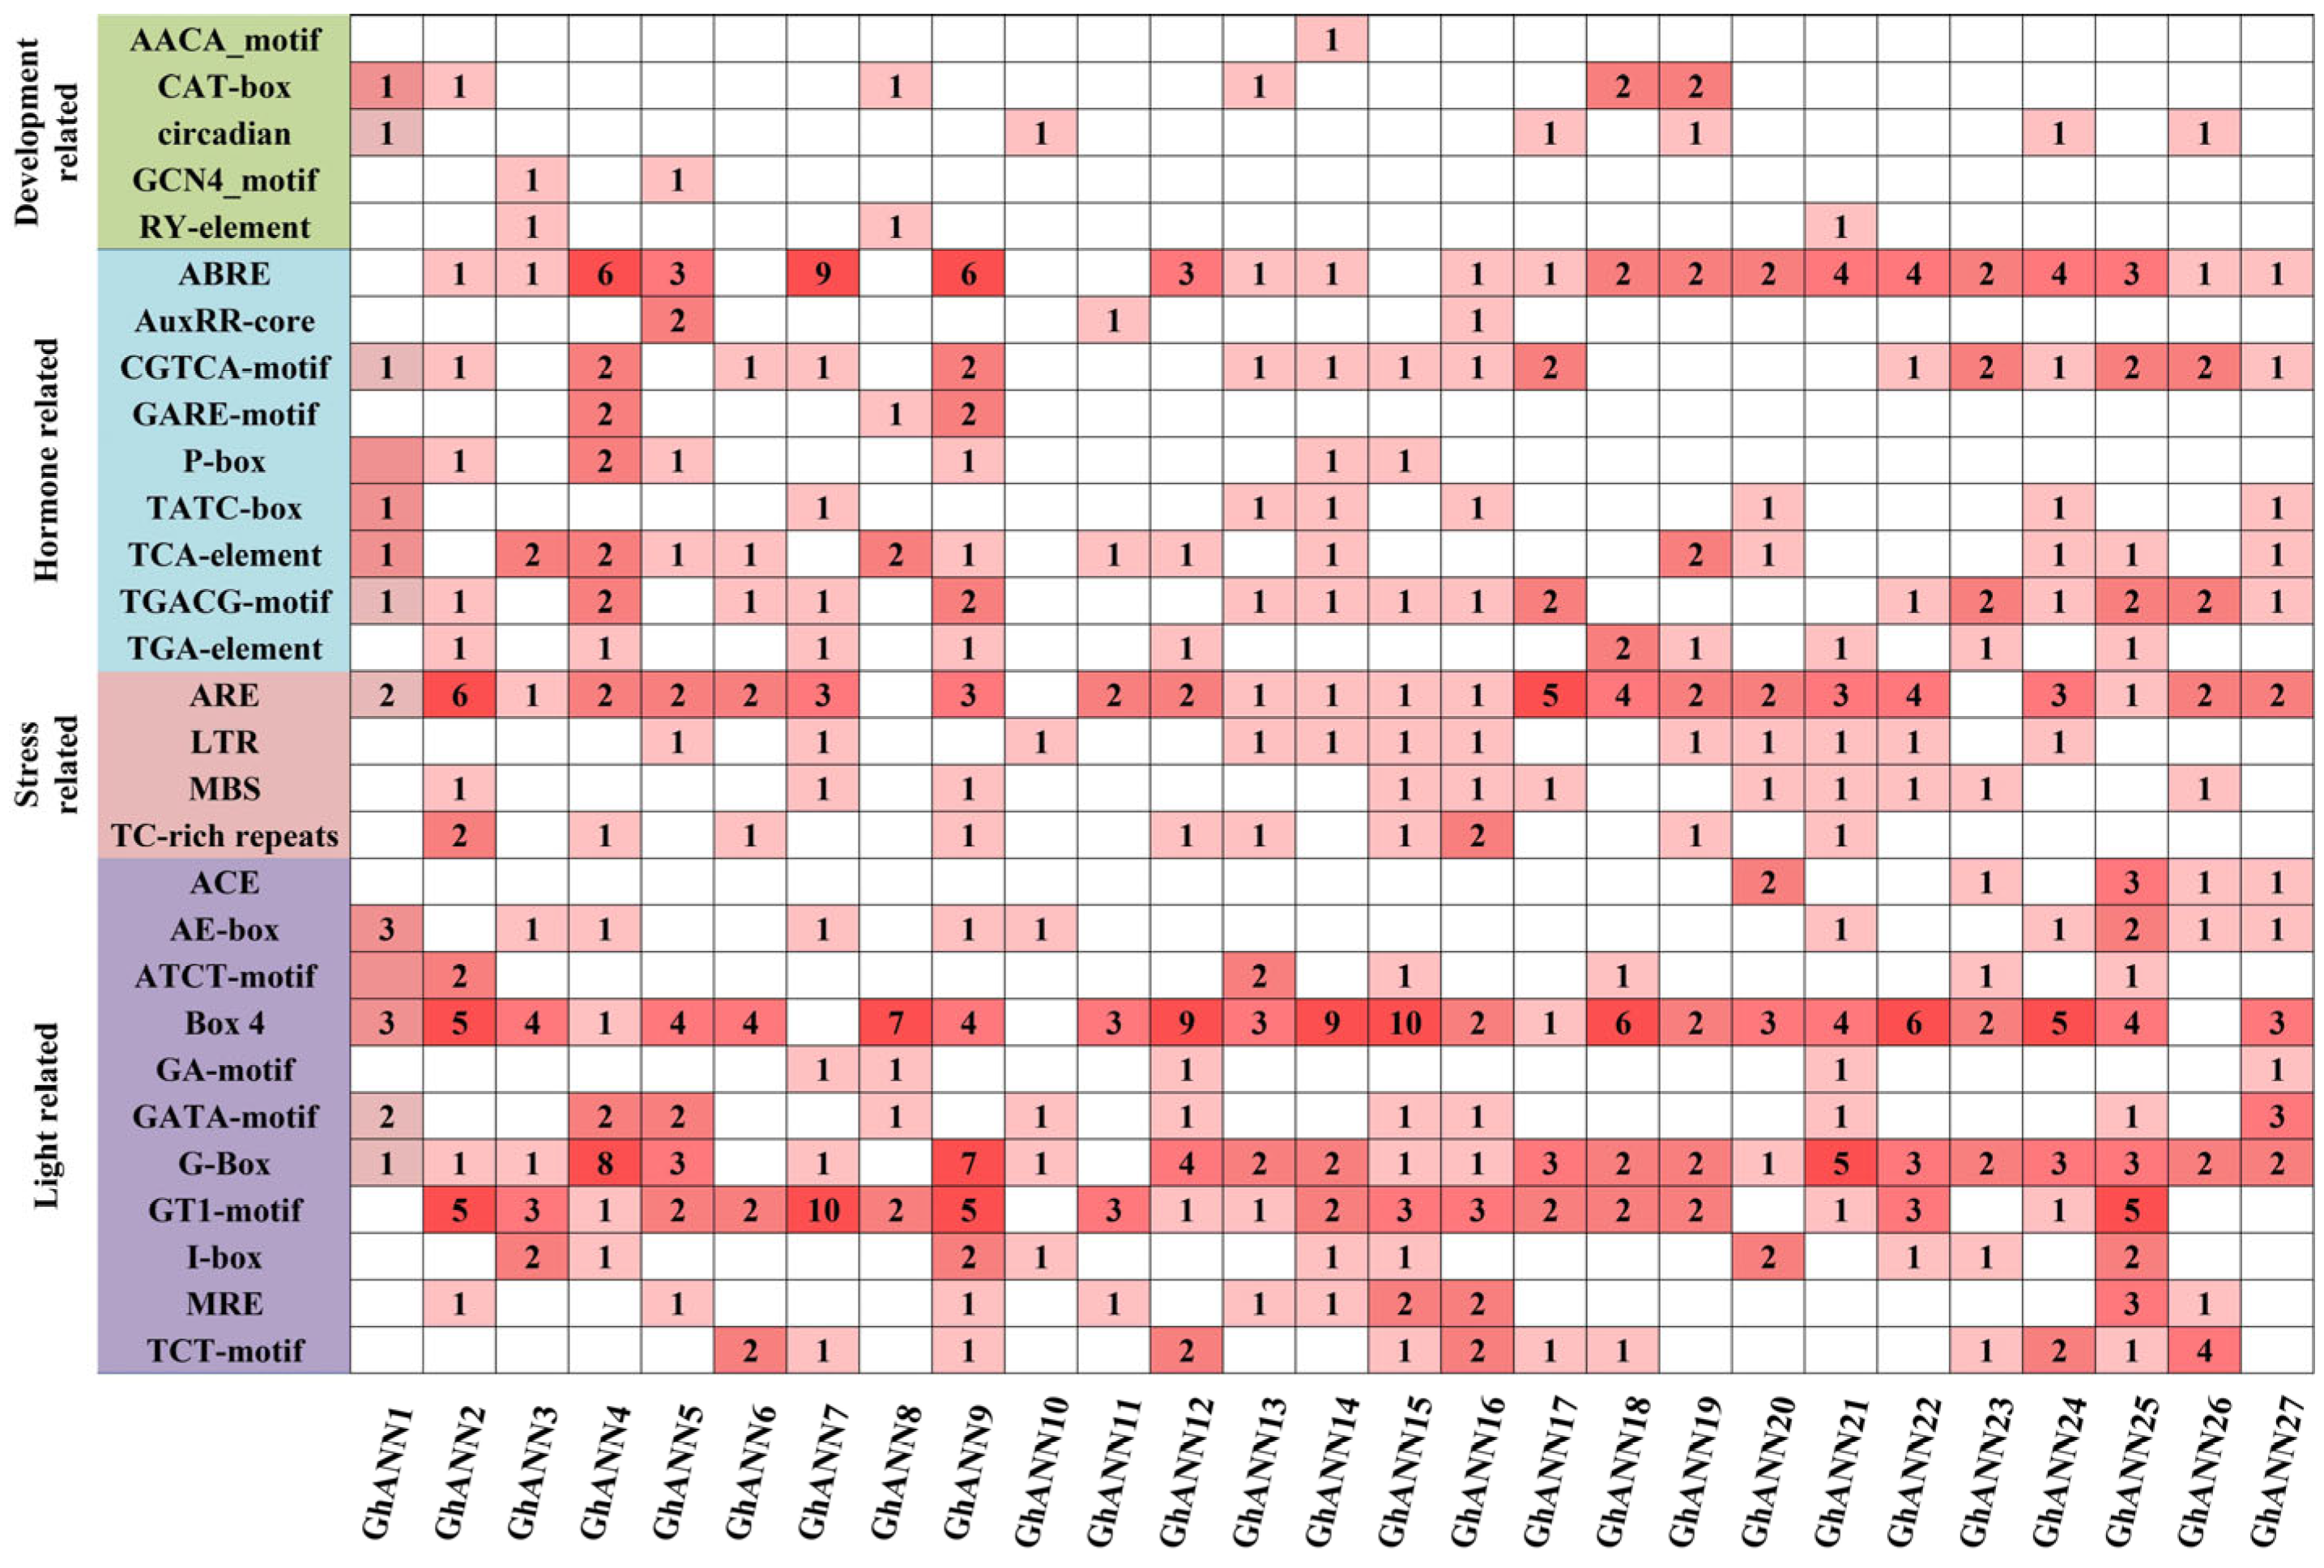
2.5. Examination of Cis-Acting Elements within the GhANN Gene Family

The findings demonstrated that the TATA-box and CAAT-box, two essential components that primarily guarantee the precision and effectiveness of gene transcription initiation, were present in the promoters of the 27 GhANN genes. Additionally, components related to growth and development, light response, stress response, and hormone response were found in the promoters of these genes (Figure 4). With eight components, the most prevalent cis-acting element associated with growth and development was the CAT-box. The GhANN promoters had hormone response elements, including those related to salicylic acid (TCA-element), jasmonic acid (CGTCA-motif, TGACG-motif), auxin (TGA-element), gibberellin (P-box, TATC-box), and ABRE. The most prevalent of these cis-acting elements were ABREs. Many stress response-related cis-acting elements, such as anaerobic induction elements (AREs), cold response elements (LTRs), defensive stress elements (TC-rich repeats), and drought response elements (MBS), were also found in the GhANN promoter region, among which the number of AREs was the greatest (57). Among the light response cis-acting elements, we identified many Box 4, G-box, and GT1-motif elements.

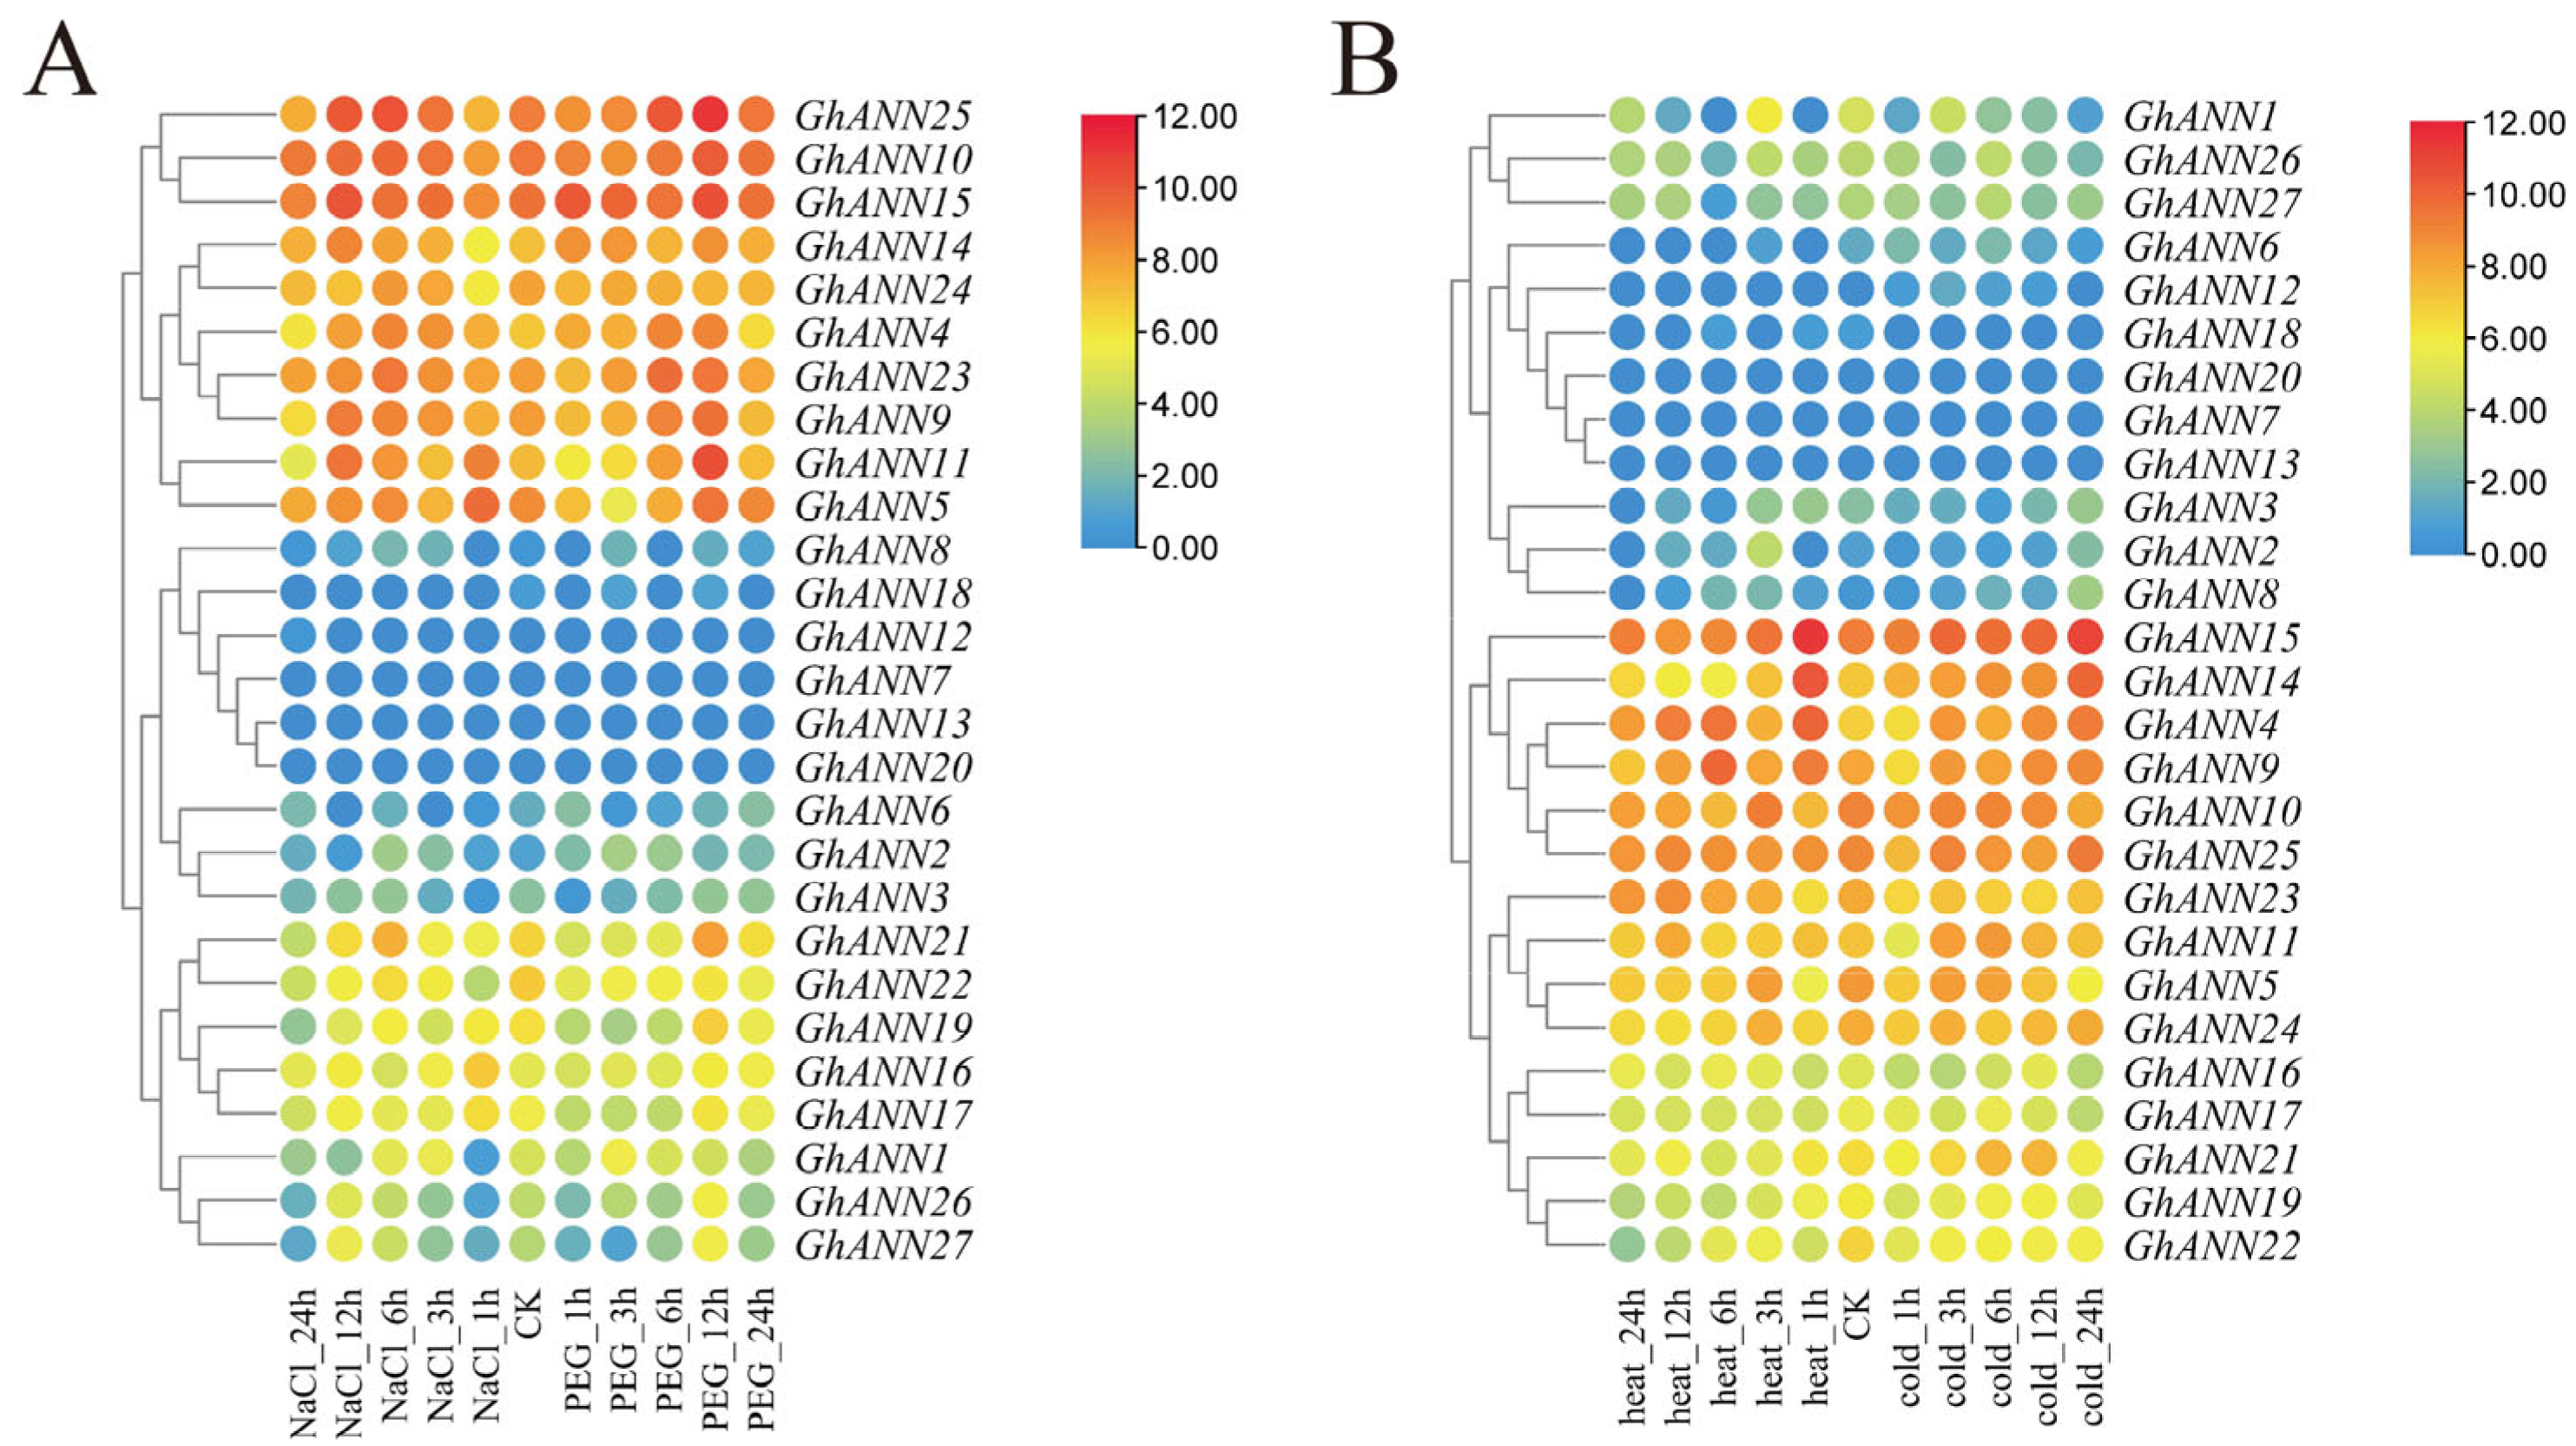
2.6. GhANN Gene Expression Patterns under Different Abiotic Stresses

To explore the expression profiles of the GhANN genes, the expression levels of the genes were characterized under different abiotic stresses using FPKM values to create heatmaps. Genes that showed a twofold difference in expression were classified as differentially expressed in comparison to controls (CK). Some GhANN genes were highly expressed after treatment with various tissues, NaCl and PEG, or cold and heat (Figure 5 and Figure S1). For example, the transcript levels of GhANN4, GhANN9, GhANN10, GhANN11, GhANN14, GhANN23, and GhANN25 were higher than those of CK (0 h) after NaCl and PEG treatment (Figure 5A), and the transcript levels of GhANN4, GhANN9, GhANN11, GhANN14, and GhANN23 were higher than those of CK (0 h) after cold and heat treatment (Figure 5B). The transcript levels of GhANN4, GhANN9, GhANN19, GhANN21, GhANN23, and GhANN25 were high in all tissues (Figure S1). Taken together, these results indicate that abiotic stress has a significant impact on the expression of several GhANNs in upland cotton.

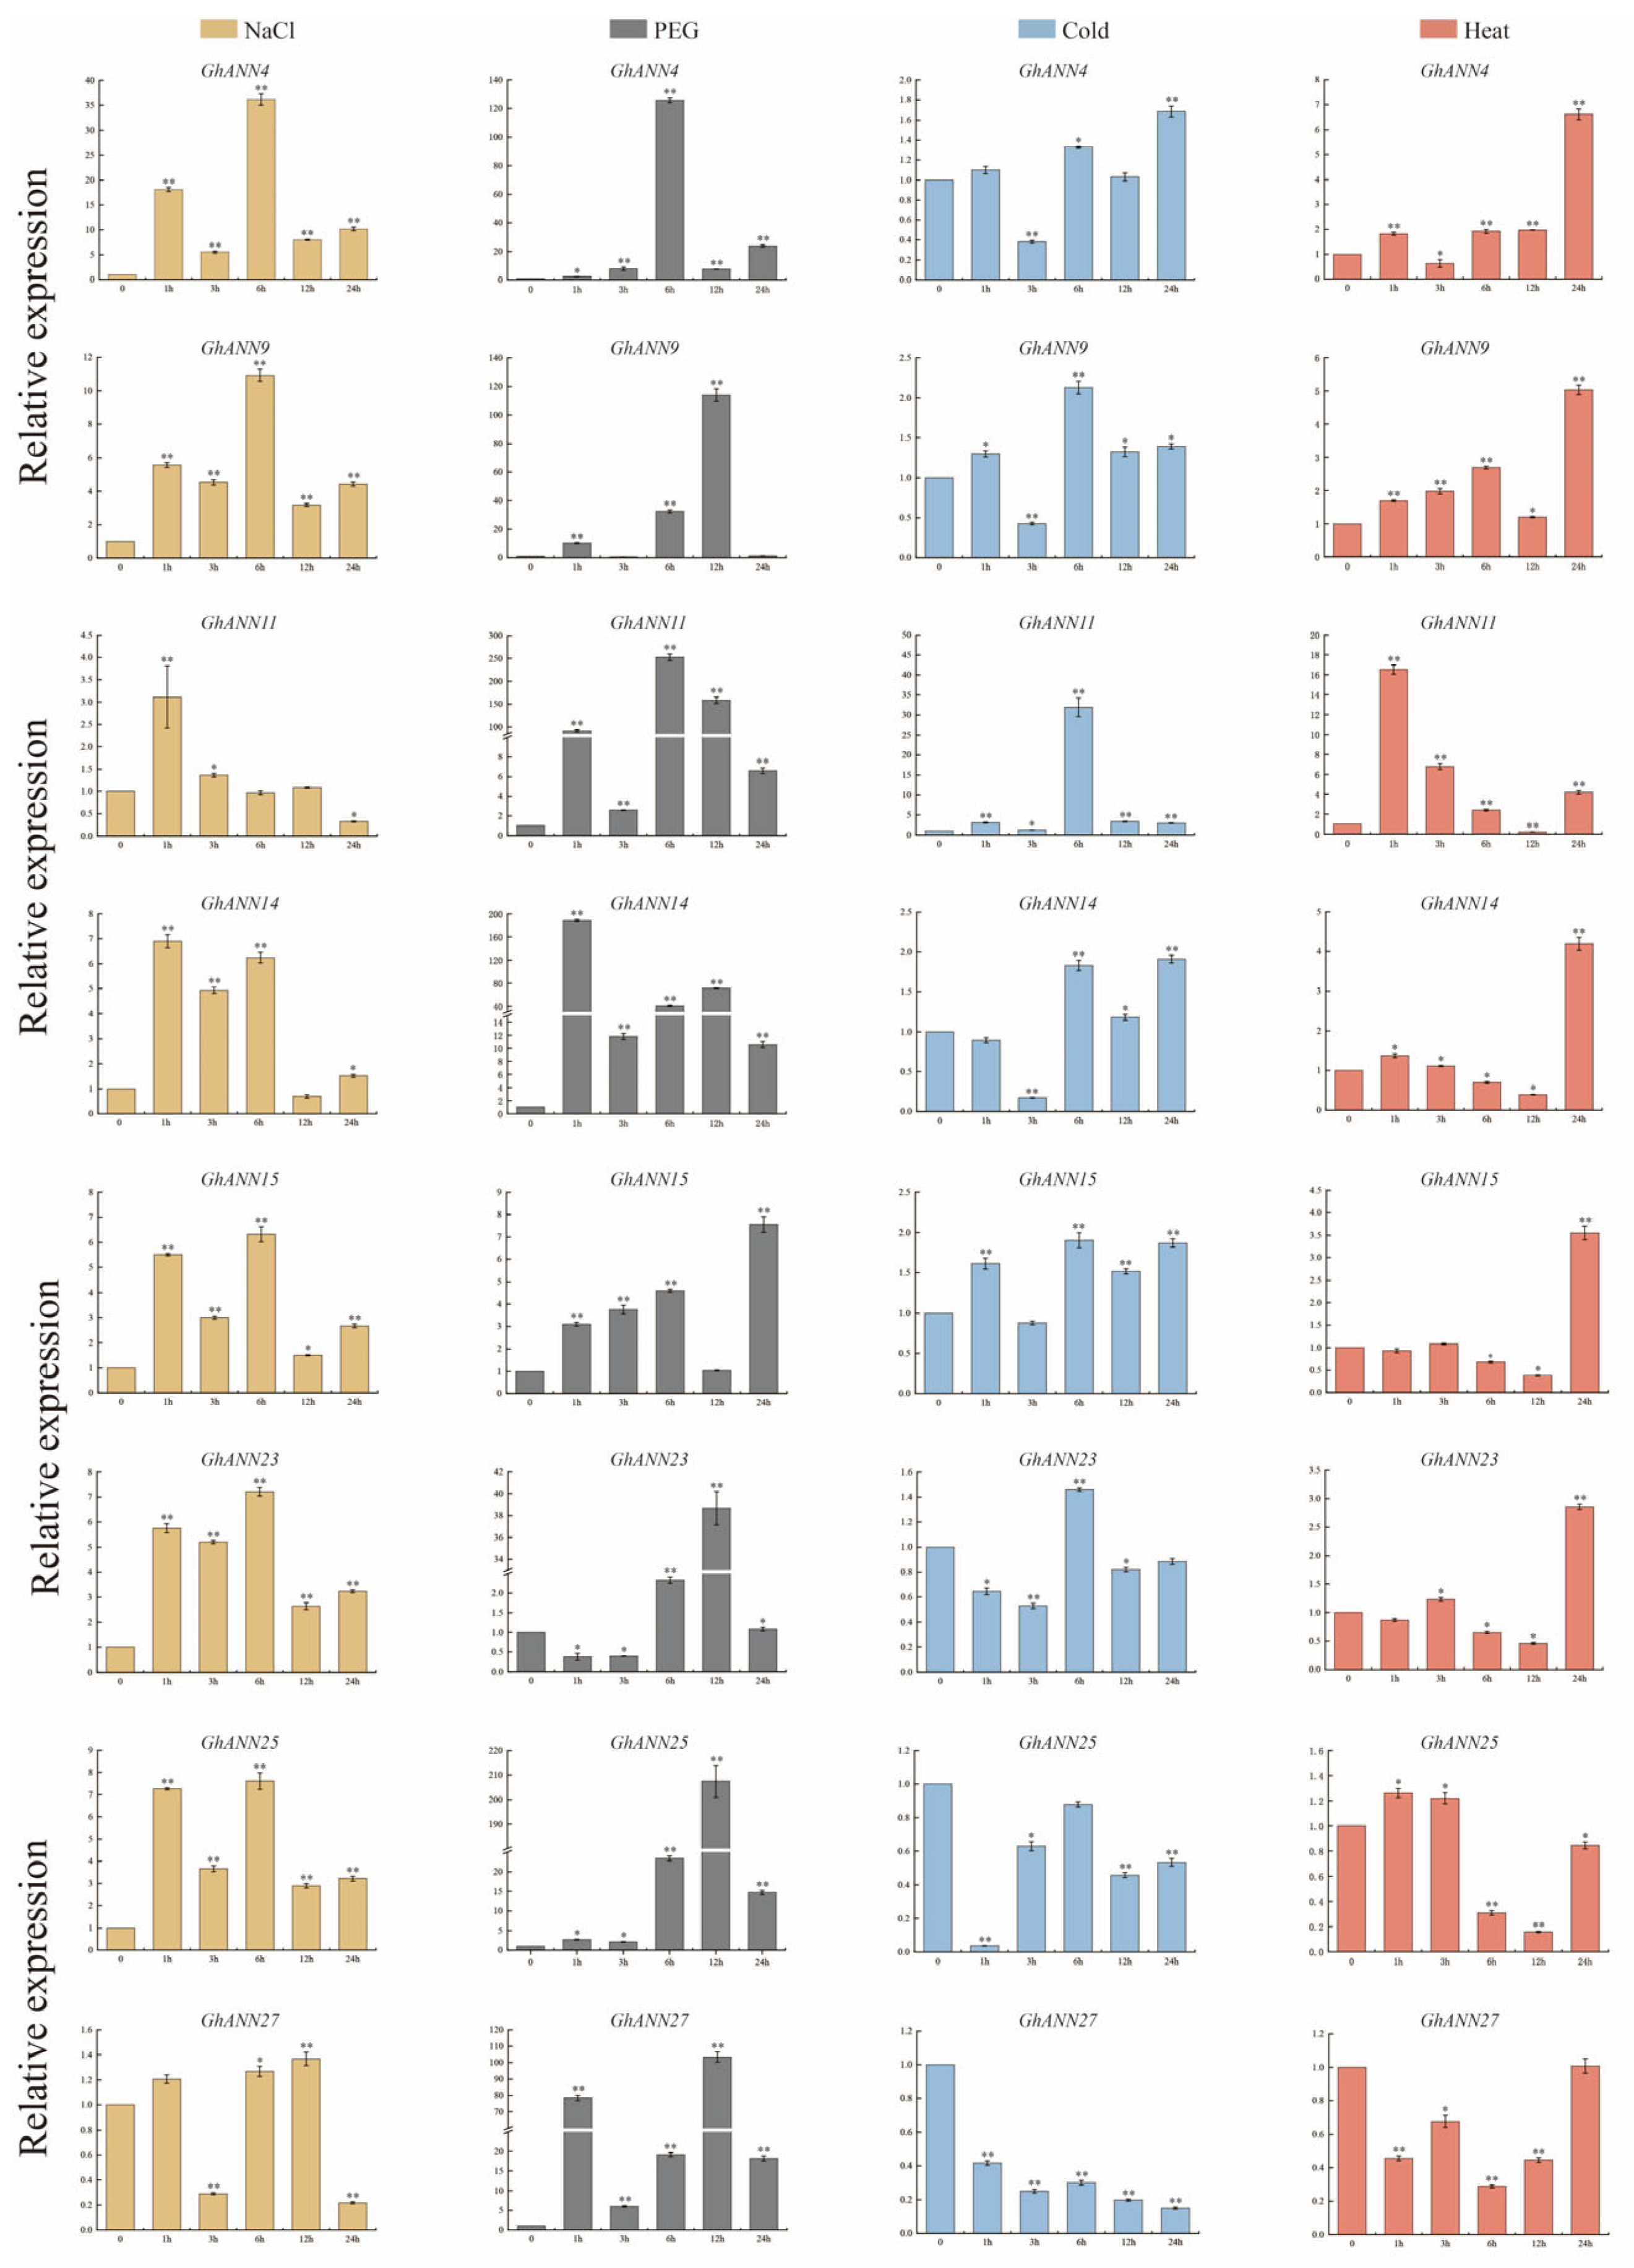
2.7. Validation of GhANN Gene Expression Patterns under Abiotic Stress

To further investigate the role of the ANN genes, eight GhANN genes were selected for qRT-PCR analysis. Overall, the eight candidate GhANN genes were more responsive to PEG than to NaCl, cold, or heat (Figure 6). Excluding GhANN11 and GhANN27, the other six GhANN genes responded strongly to NaCl stress, and the expression levels of these six genes exhibited a double hump-like trend, with two peaks occurring at 1 h and 6 h after NaCl stress (Figure 6). Under PEG stress, other than GhANN15, the expression levels of the other seven GhANNs tested after PEG stress were hundreds of times greater than those in the control (0 h) (Figure 6). All eight GhANNs tested responded slightly to cold stress, and the highest expression levels were found after 6 or 24 h of cold stress treatment (Figure 6). Under heat stress, the peak response of GhANN11 occurred within 1 h of stress, and the peak expression of the other genes, excluding GhANN23 and GhANN25, appeared after 24 h of stress (Figure 6). Taken together, these findings indicate that GhANNs might participate in cotton resistance to abiotic stresses.

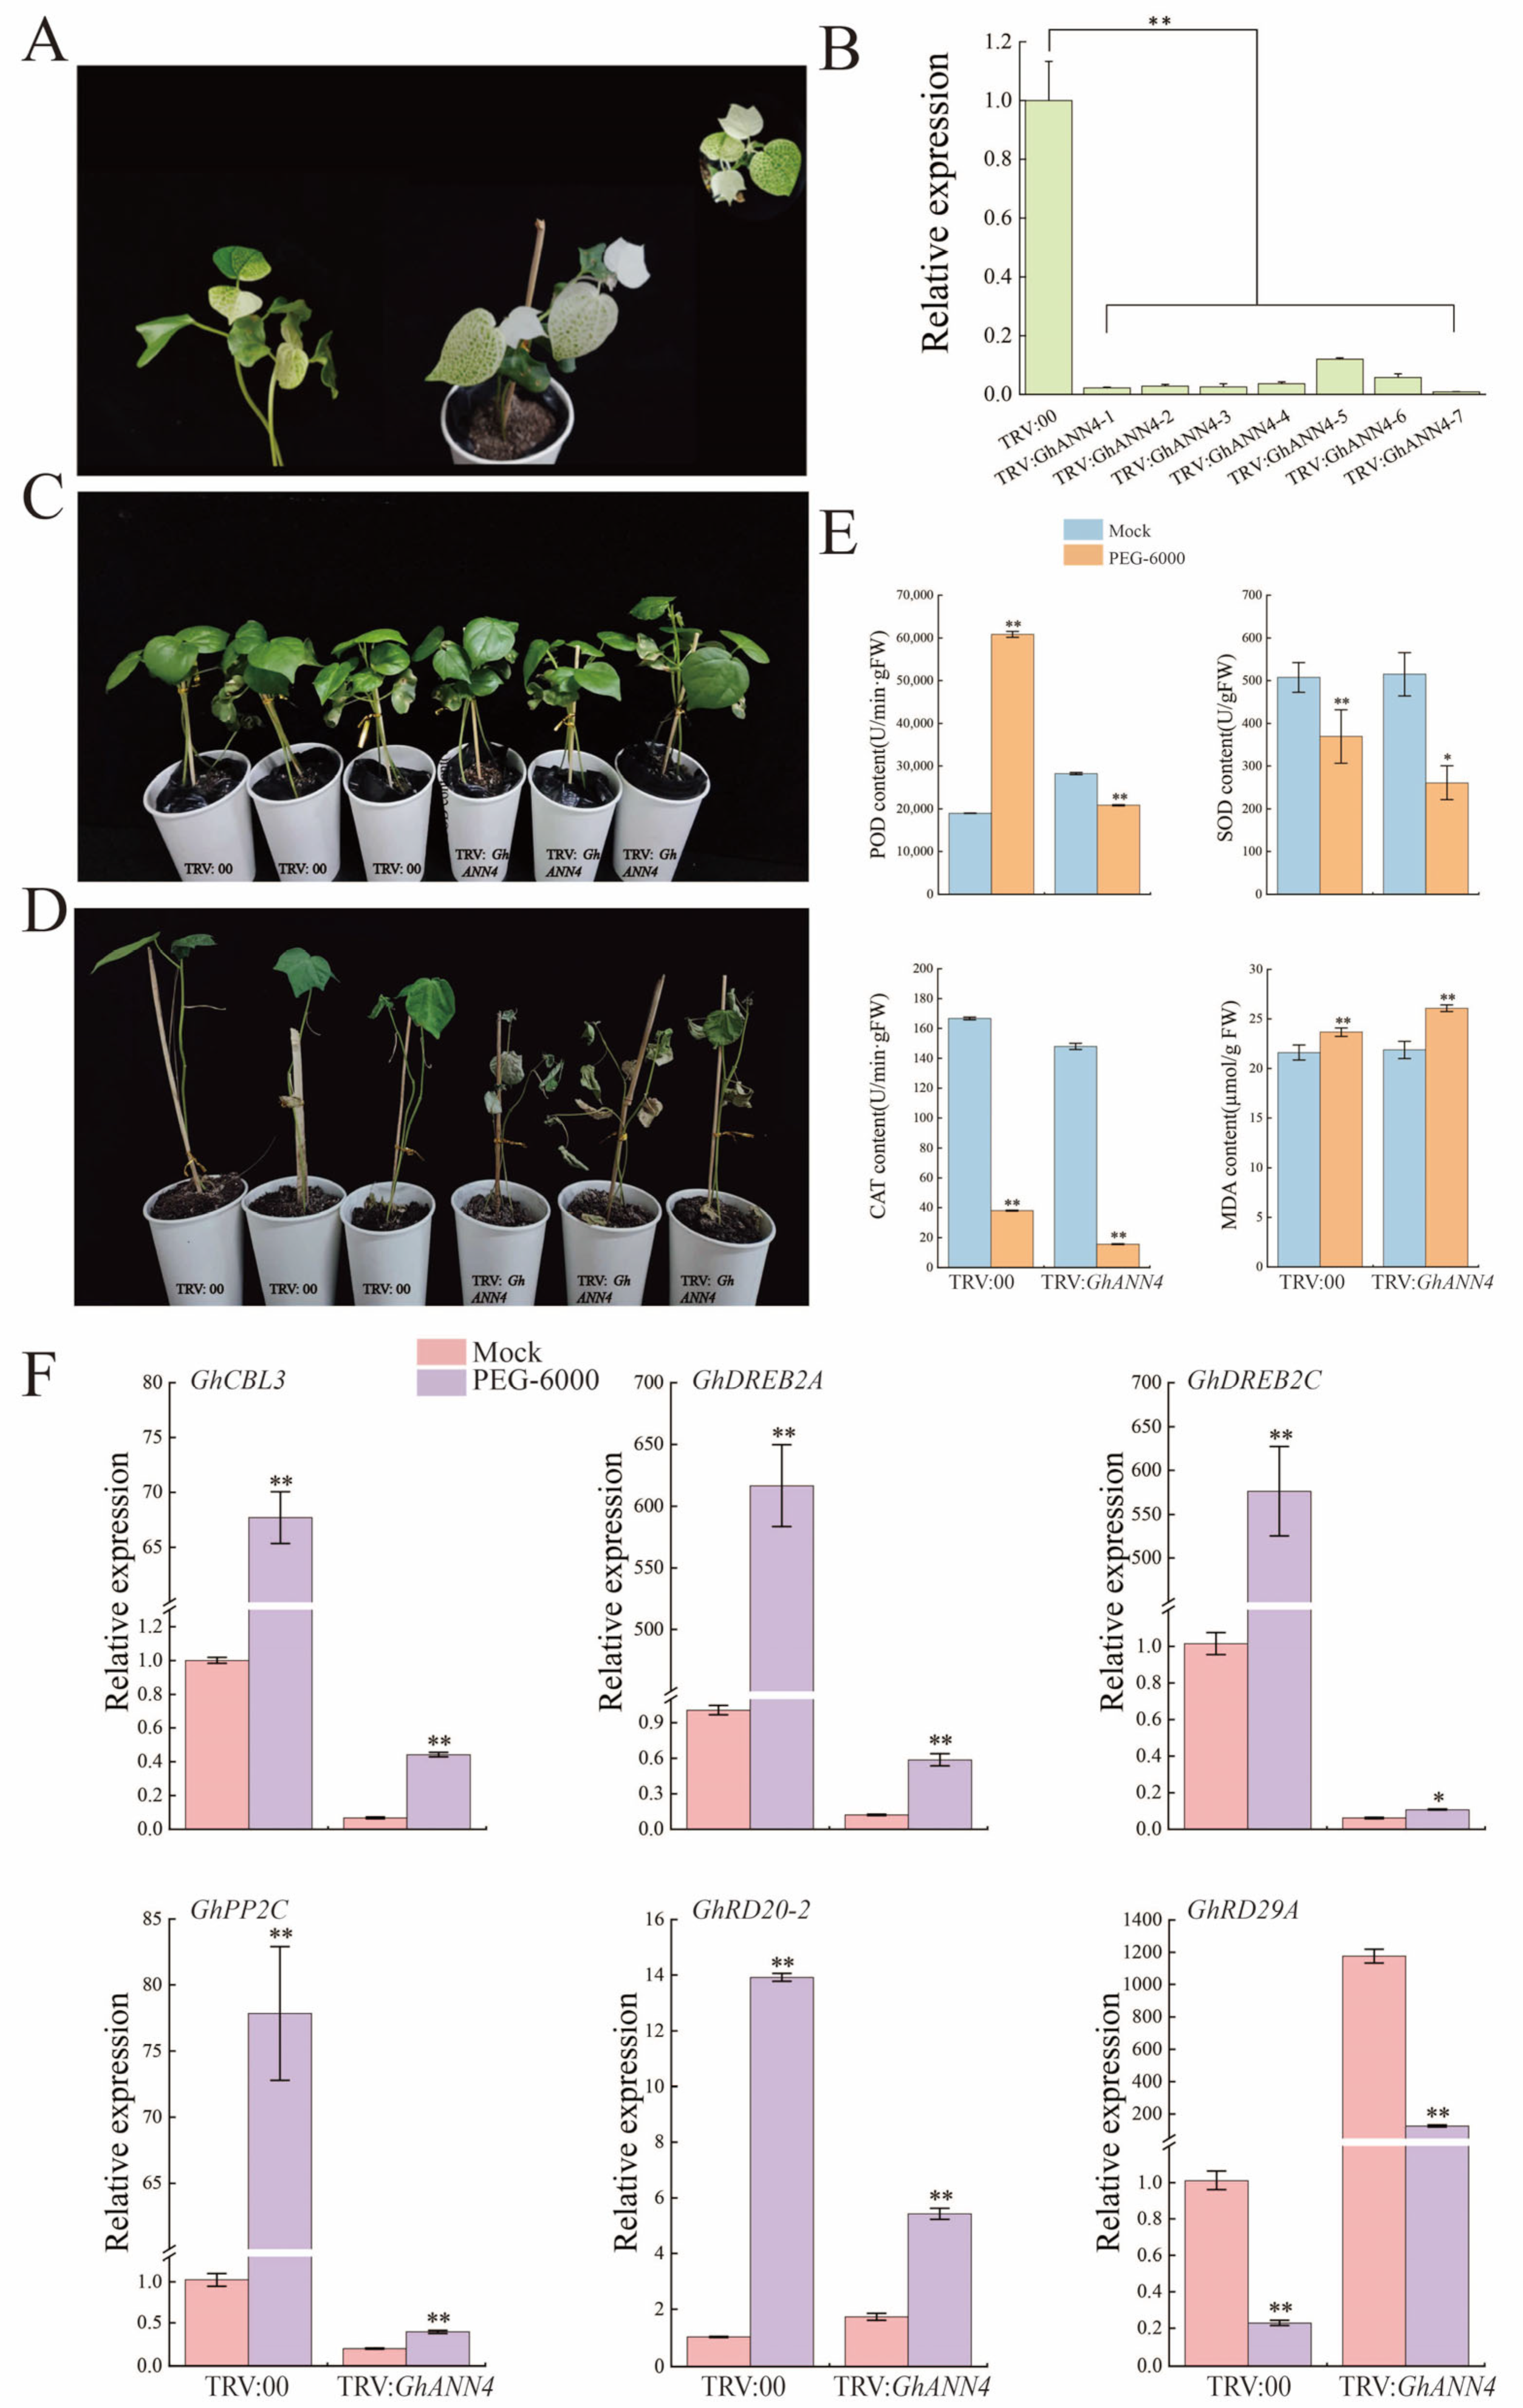
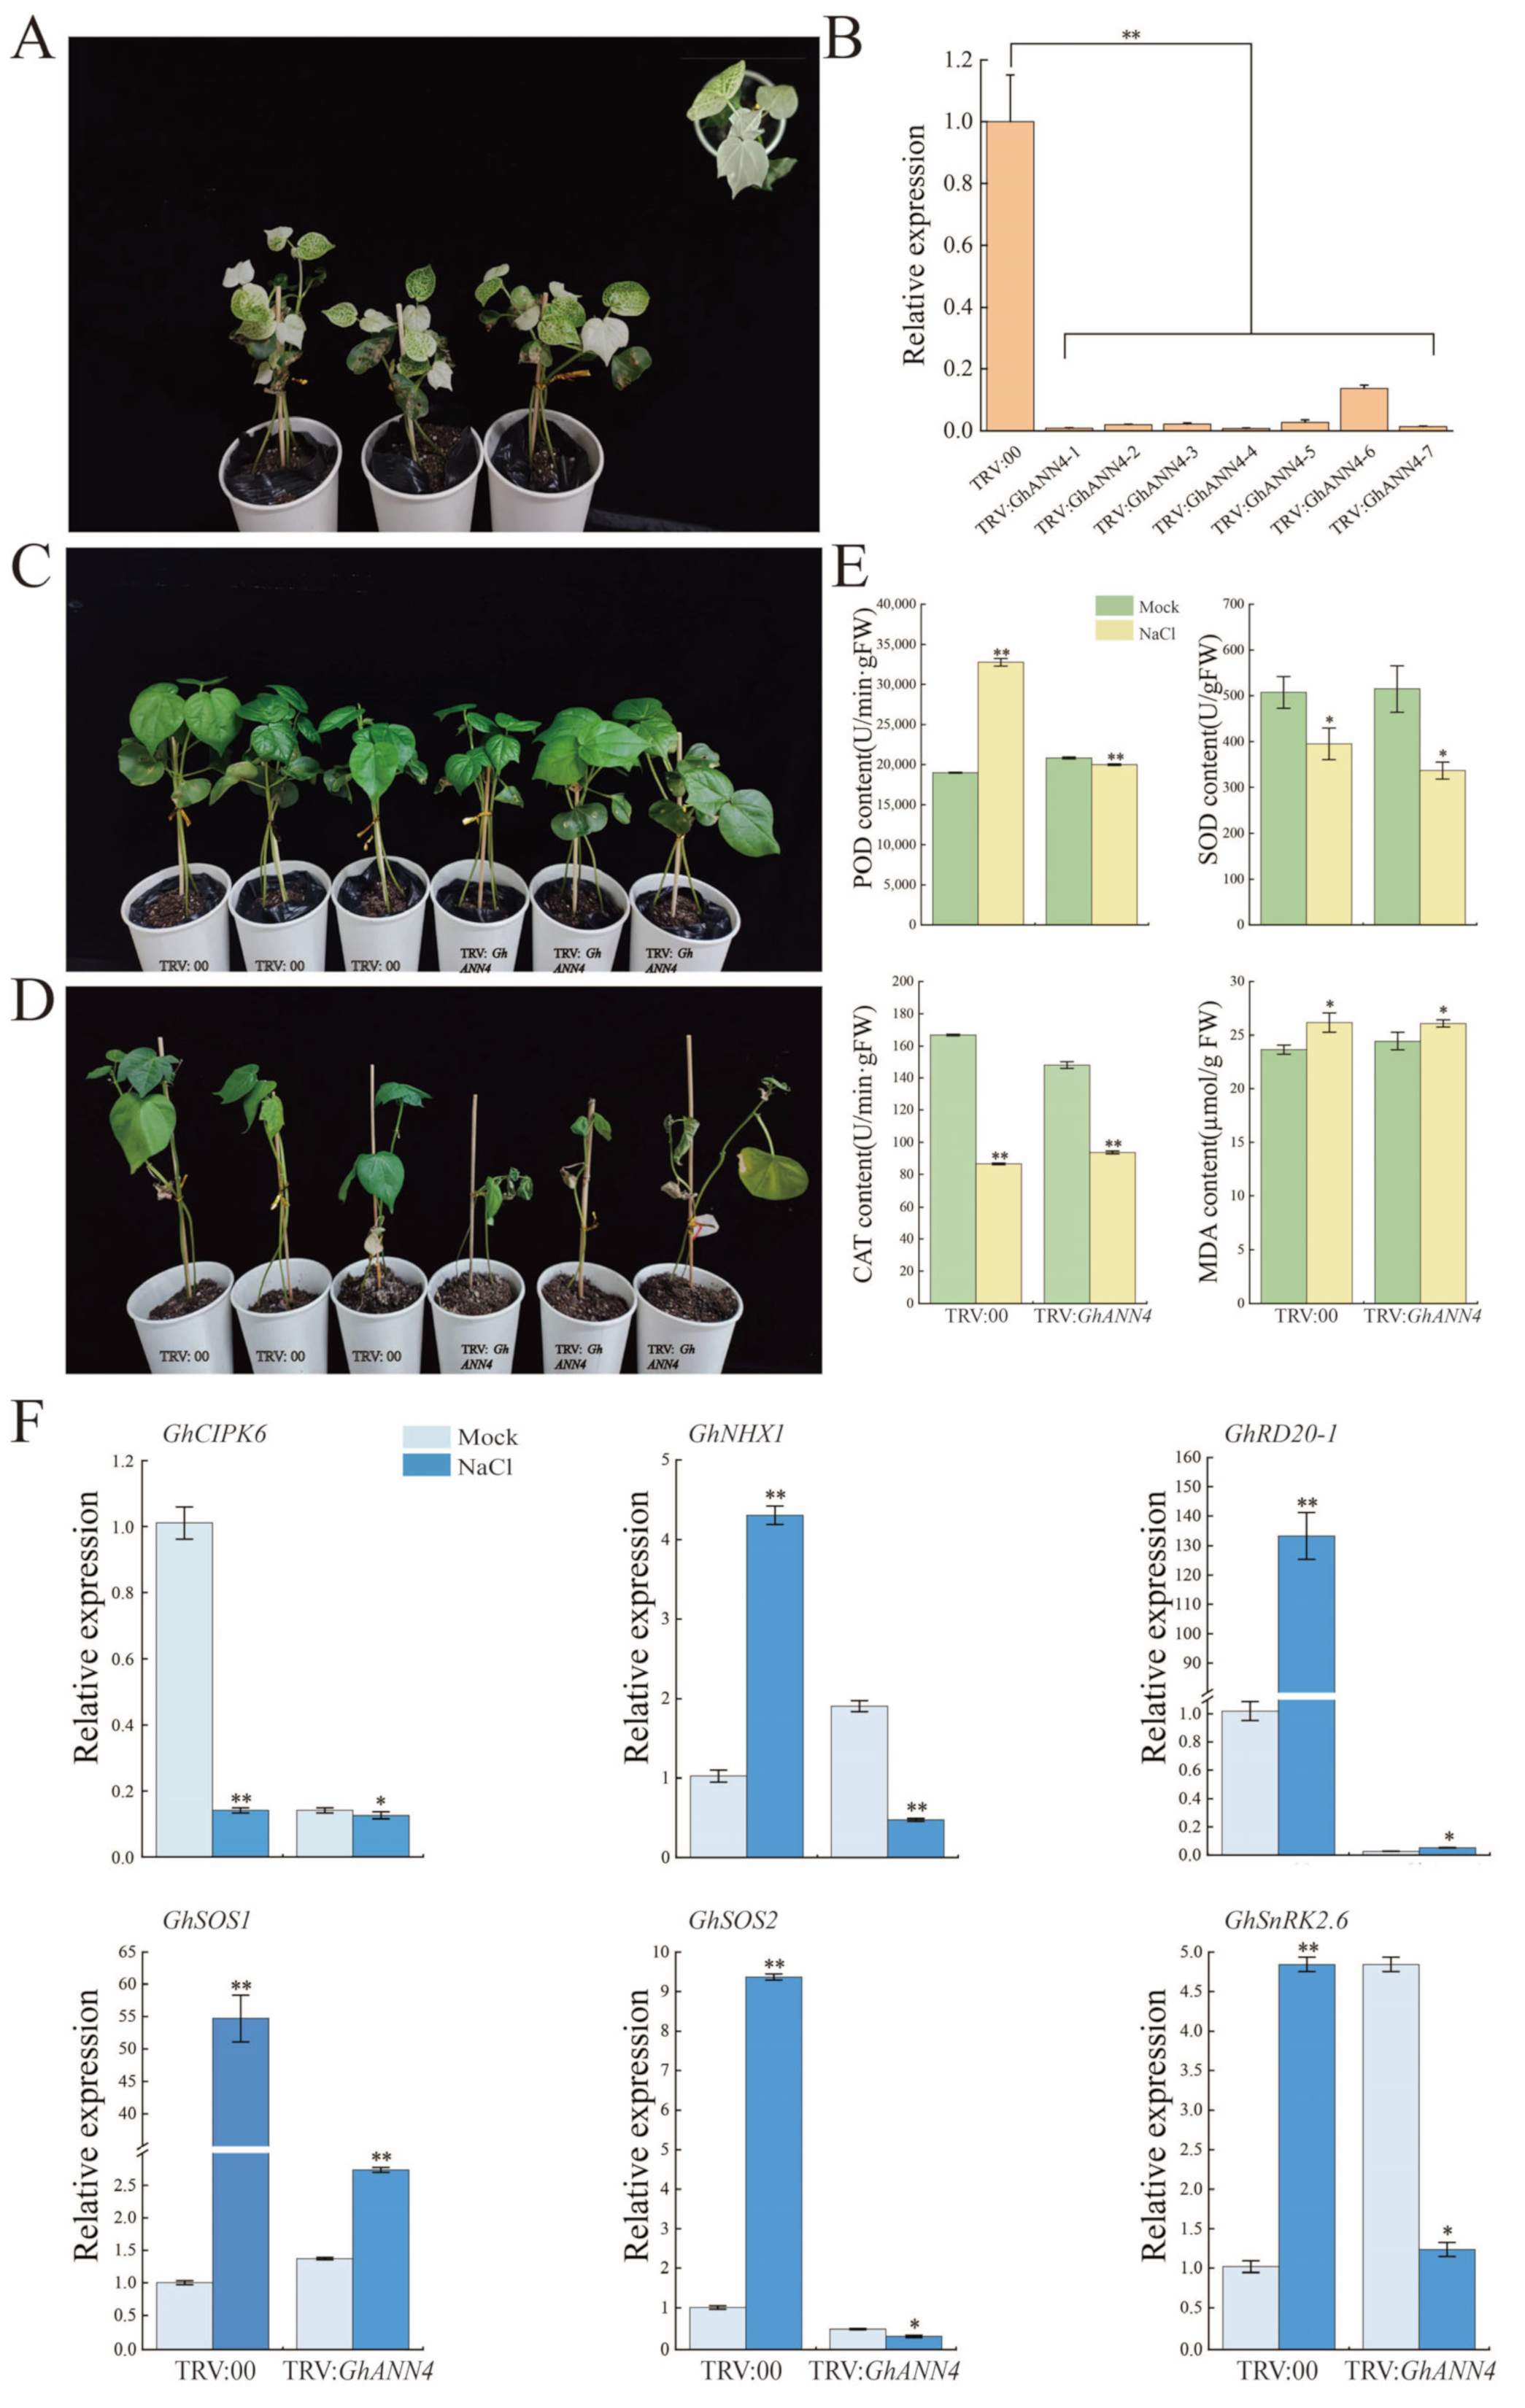
2.8. Silencing of GhANN4 Attenuated Drought and Salt Tolerance in Upland Cotton

We found that the expression of GhANN4 was induced by abiotic stress. We used virus-induced gene silencing (VIGS) to silence the GhANN4 gene in upland cotton to study the function of the gene in the response to salt and drought stress. After the photobleaching of leaves infected with TRV:GhCLA, the efficiency of GhANN4 silencing was determined via qRT-PCR analysis in the TRV:00 and TRV:GhANN4 plants (Figure 7A and Figure 8A). Compared to that in the control plants (TRV:00), the expression level of GhANN4 was 50% lower in the TRV:GhANN4 plants (Figure 7B and Figure 8B). At the two-true leaf stage, we treated control plants and GhANN4-silenced plants with 15% PEG and 400 mM NaCl (Figure 7C and Figure 8C). We discovered that the leaves of the GhANN4-silenced plants withered more than the leaves of the control plants and that the GhANN4-silenced plants also exhibited more leaf shrinkage after 35 days of PEG and NaCl stress (Figure 7D and Figure 8D).
POD, SOD, CAT, and MDA activity levels were determined in the leaves of TRV:00 and TRV:GhANN4 plants treated with PEG and NaCl stress (Figure 7E and Figure 8E). The results showed that the MDA activity in the TRV:GhANN4 plants was not significantly greater than that in the TRV:00 plants and that the POD, SOD, and CAT activities in the TRV:00 and TRV:GhANN4 plants decreased to varying degrees following PEG treatment (Figure 7E), with the TRV:00 plants exhibiting considerably greater POD activity than the TRV:GhANN4 plants under NaCl stress. When TRV:GhANN4 plants were subjected to NaCl stress, SOD activity and CAT activity decreased significantly, while MDA activity increased to varying degrees (Figure 8E).
The expression levels of six drought stress tolerance-related marker genes (GhCBL3, GhDREB2A, GhDREB2C, GhPP2C, GhRD20-2, and GhRD29A) were measured, and we discovered that the expression of these genes was greater in the TRV:GhANN4 plants than in the control plants without PEG treatment; on the other hand, the expression of these marker genes was lower in the TRV:GhANN4 plants than in the control plants after PEG treatment (Figure 7F). After measuring the expression levels of six marker genes associated with salt stress tolerance (GhCIPK6, GhNHX1, GhRD20-1, GhSOS1, GhSOS2, and GhSnRK2.6), we found that these genes had higher expression levels in TRV:GhANN4 plants than in control plants that did not receive NaCl treatment; on the other hand, the expression of these marker genes was lower in TRV:GhANN4 plants (Figure 8F).

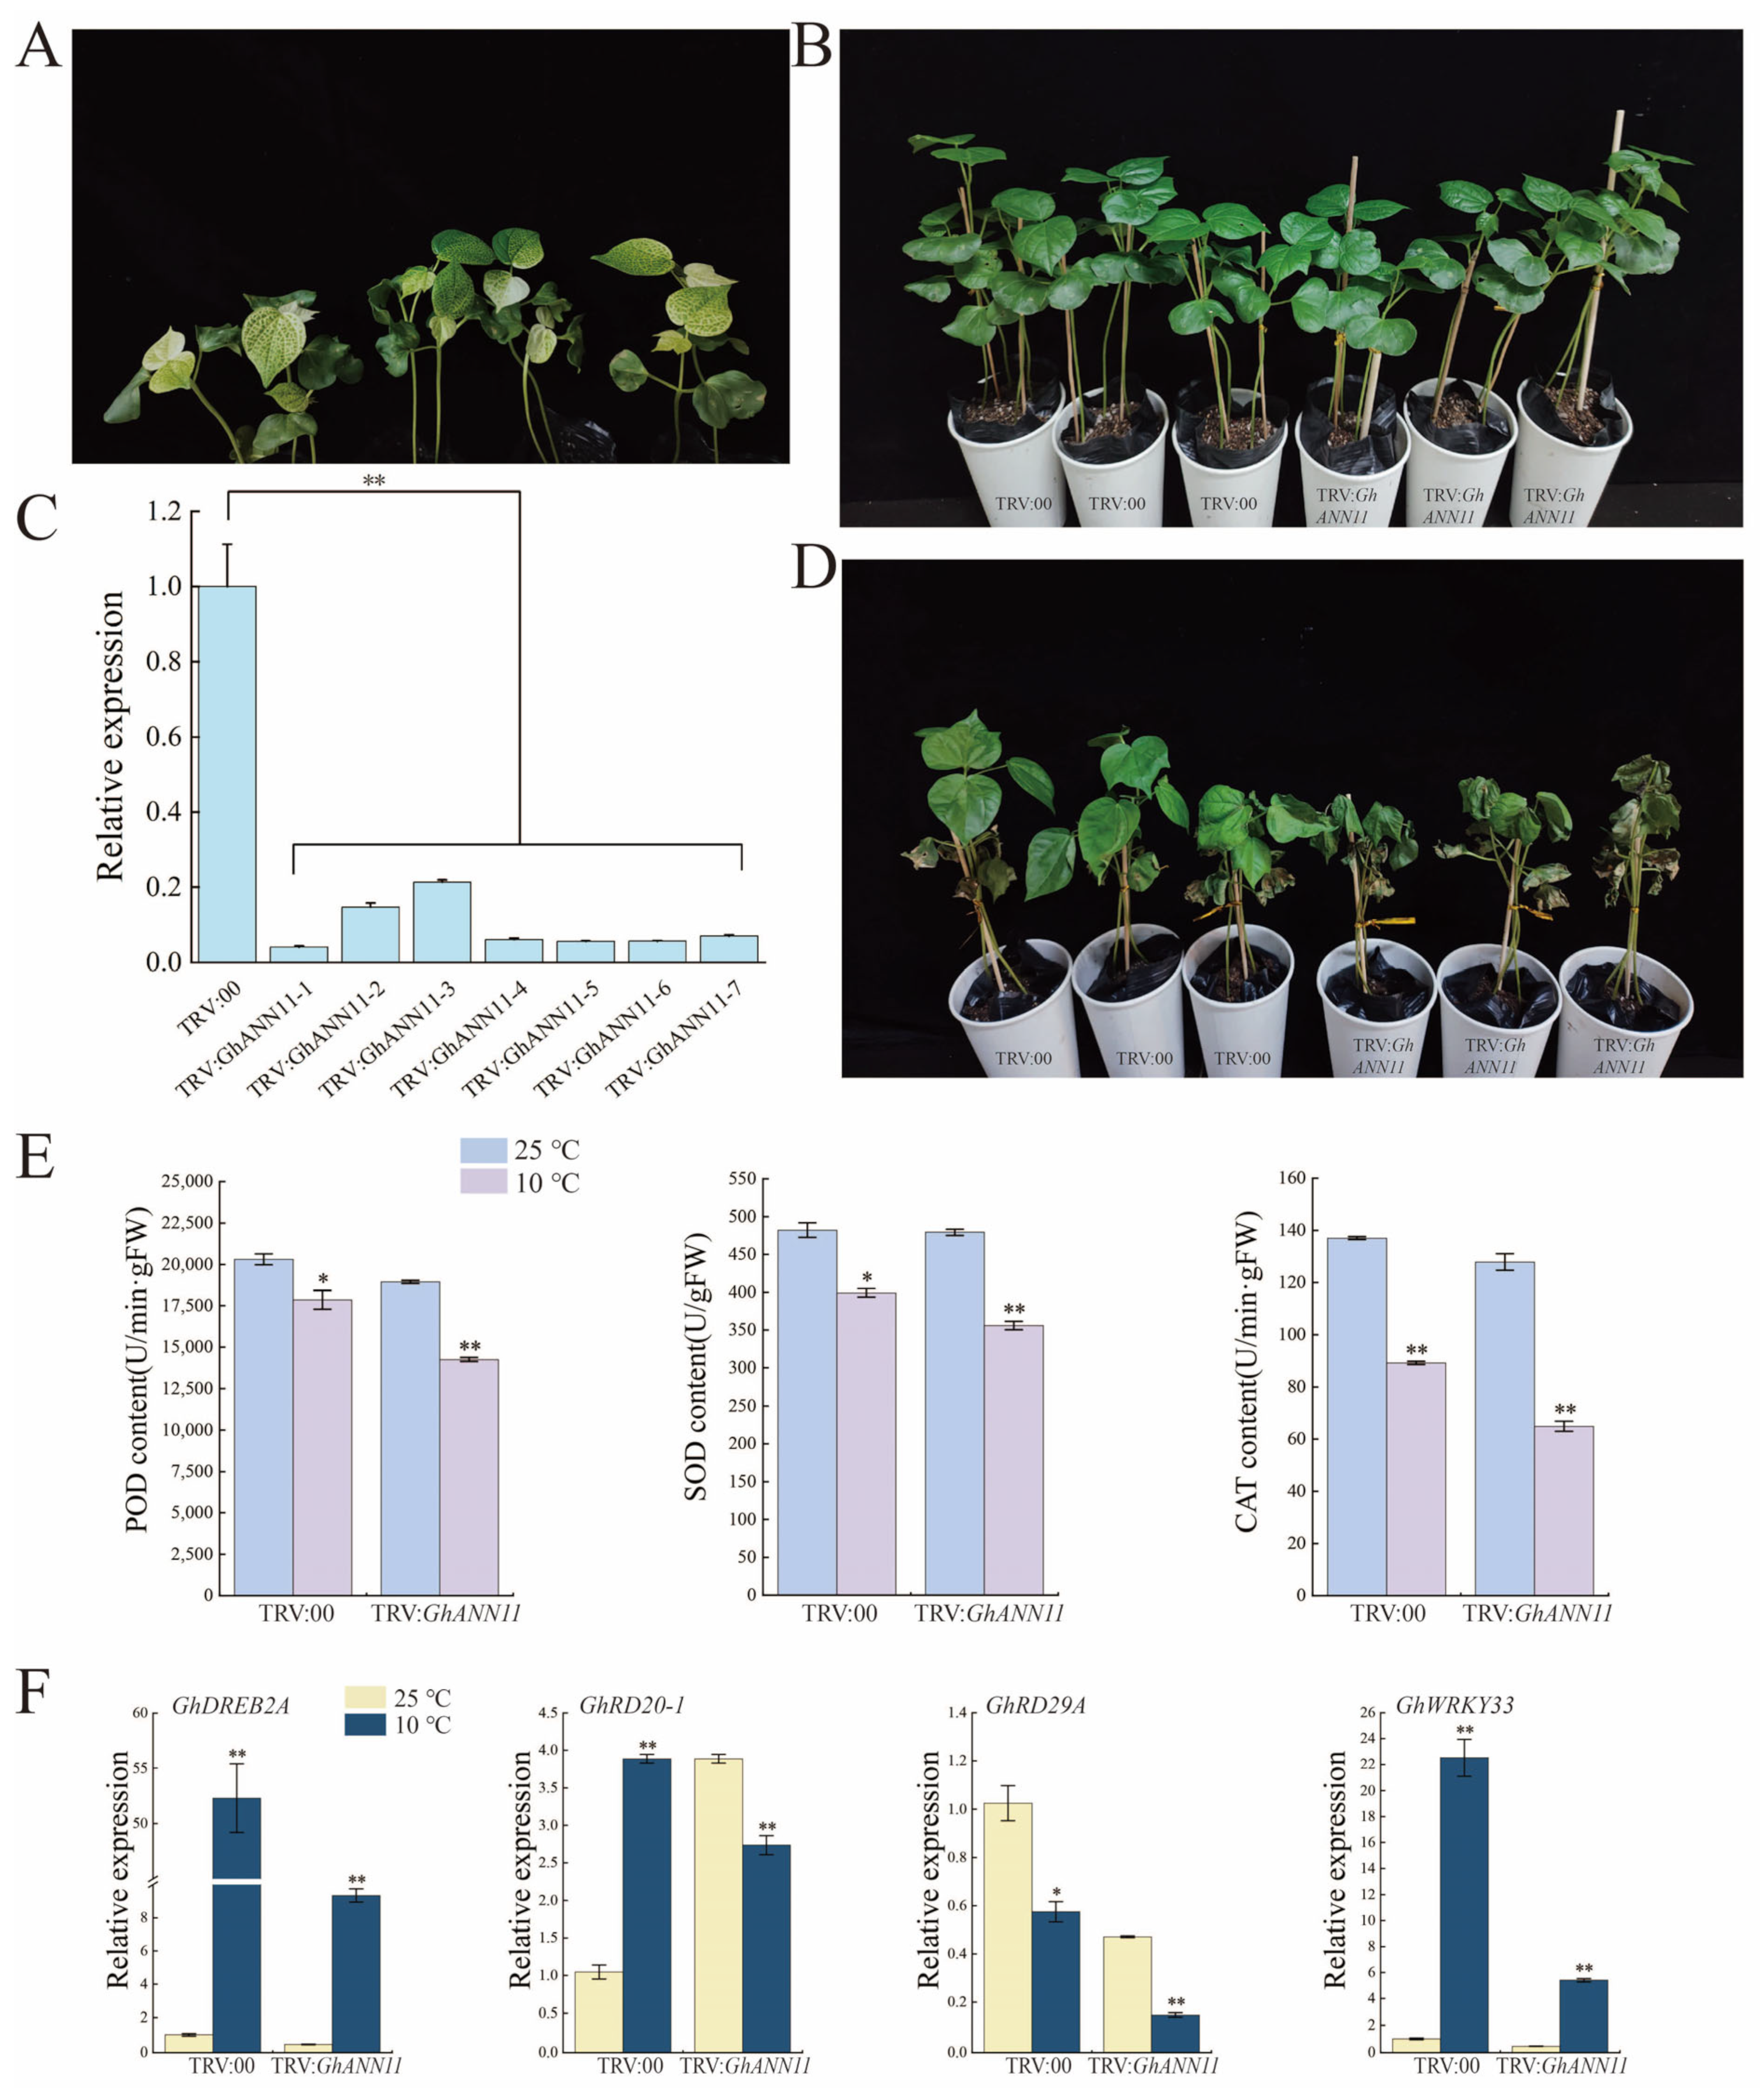
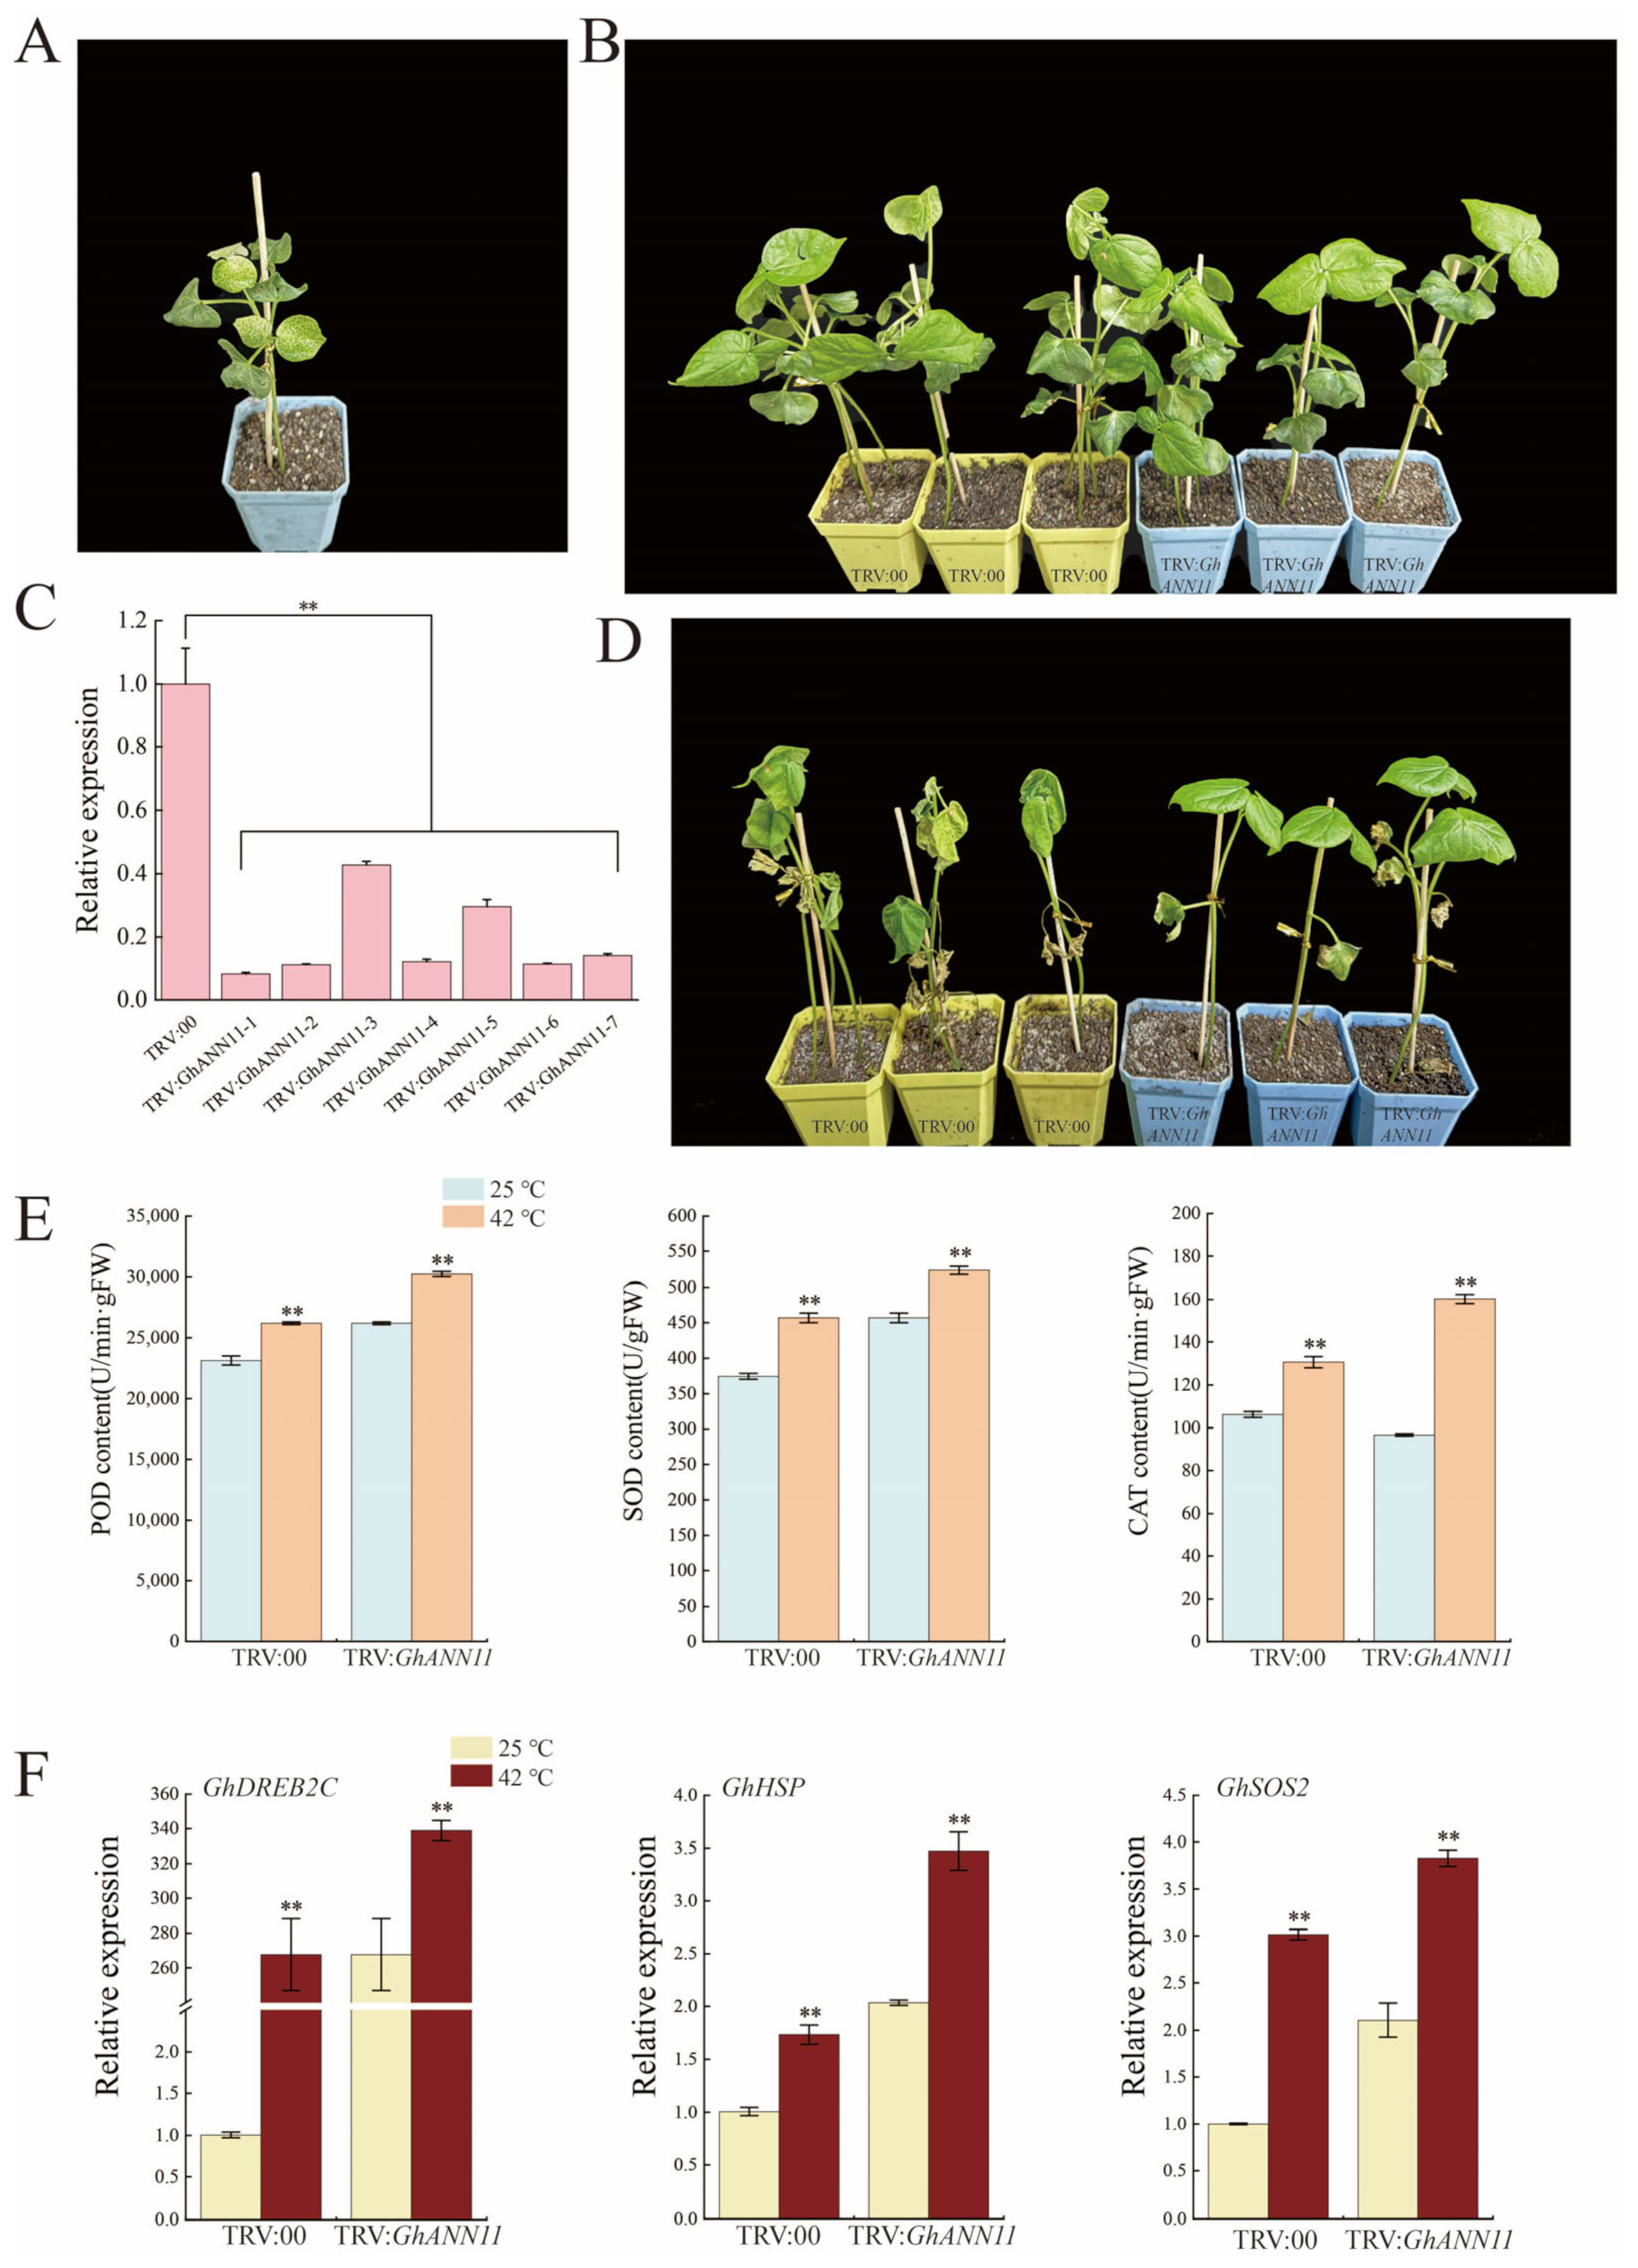
2.9. Effect of GhANN11 Gene Silencing on Cold Tolerance and Heat Resistance in Cotton

Based on transcriptome data and RT-qPCR data for GhANNs under abiotic stress, we found that cold and heat stress strongly induced GhANN11 expression. To study the effect of GhANN11 on cold and heat stress, we silenced GhANN11 in upland cotton plants via VIGS. After the leaves of TRV:GhCLA-infected plants were photobleached, the efficiency of GhANN11 silencing was determined in TRV:00 and TRV:GhANN11 plants via qRT-PCR analysis (Figure 9A and Figure 10A). Compared with that in the control plants (TRV:00), the transcript level of GhANN11 in the TRV:GhANN11 plants was reduced by 50% (Figure 9C and Figure 10C). At the two-true leaf stage, control plants and GhANN11-silenced plants were treated at 10 °C and 42 °C (Figure 9B and Figure 10B). We found that the leaves of the GhANN11-silenced plants were more withered than those of the control plants after 10 days of cold stress, while the leaves of the GhANN11-silenced plants exhibited greater elasticity and orthostatic properties than those of the control plants after 6 days of heat stress (Figure 9D and Figure 10D).
Under cold and heat stress, POD, SOD, and CAT activities were determined in the leaves of TRV:00 and TRV:GhANN11 plants (Figure 9E and Figure 10E). The findings demonstrated that, under cold stress, the POD, SOD, and CAT activities of the TRV:GhANN11 plants were significantly lower than those of the TRV:00 plants (Figure 9E), but under heat stress, the POD, SOD, and CAT activities of the TRV:GhANN11 plants were significantly greater than those of the TRV:00 plants (Figure 10E).
We determined the expression levels of four cold tolerance-related marker genes (GhDREB2A, GhRD20-1, GhRD29A, and GhWRKY33) and found that their expression levels were greater in TRV:GhANN11 plants than in control plants without cold stress. However, under cold stress, the expression levels of these marker genes were lower in the TRV:GhANN11 plants than in the control plants (Figure 9F). The expression levels of three marker genes associated with high-temperature stress resistance (GhDREB2C, GhHSP, and GhSOS2) were measured, and we discovered that the expression of these genes was greater in TRV:GhANN11 plants than in control plants that did not receive high-temperature treatment. On the other hand, the expression of these marker genes in the TRV:GhANN11 plants significantly increased after high-temperature stress (Figure 10F).

3. Discussion

When examining the role and development of a gene family, accurate and comprehensive identification is essential. Several plants, including Arabidopsis [46], wheat [10], rice [47], and Glycine max [48], have been shown to harbor ANN genes thus far. The family has eight to twenty-five members. Like in the majority of angiosperms, 27 GhANNs were found in Gossypium hirsutum. A total of 174 genes from 10 species were chosen for the construction of a phylogenetic tree to determine the evolutionary links between ANNs. The ANNs were then categorized into six clusters, or clades A–F. Monocot and eudicot ANN genes were present in all the clades, indicating that the six branches were differentiated before monocot and eudicot separation.
Gene duplication events, which produce new functional genes and promote species development, occurred in all the species. Upland cotton is a heterotetraploid cotton species composed of the At subgenome and Dt subgenome [49]. As expected, orthologs of almost all the GhANNs were found in G. arboreum and G. raimondii, which is consistent with the findings in closely related species. We identified 13 and 14 GhANN genes in the At subgenome and Dt subgenome, respectively, and most of the genes exhibited one-to-one collinear relationships. Only GhANN10 was found in the Dt genome but not in the At subgenome and may have been lost during evolution. Most of the genes originated from segmental duplication (eighteen pairs), and a few genes originated from tandem duplication (two pairs) (Table S3). These findings indicate that segmental duplication is the main driving force of GhANN expansion and that tandem duplication also plays a role in this process.
Numerous stress and development mechanisms have been linked to ANN genes. TdAnn6 can strengthen a plant’s defense against salt and drought stress [50]. The resilience of poplar plants to salt stress and drought can be enhanced by overexpressing PtAnnexin1 [26]. The germination rate of transgenic cotton plants overexpressing the GhAnn1 gene was much greater than that of wild-type plants, in which the former had a longer root system and more vigorous development under drought and salt stress [29]. These findings are in line with our discovery of cis-acting elements in the upstream promoter region of GhANNs that are connected to plant hormones, growth, and development. Transcriptome data from G. hirsutum showed that different GhANNs exhibited different expression patterns under different abiotic stresses, suggesting that the functions of these GhANNs may be different. For example, the expression of several GhANNs was not induced under salt and drought stress (GhANN7, GhANN12, GhANN13, GhANN20), and the expression of several GhANNs was not induced under high- or low-temperature stress (GhANN7, GhANN13, GhANN20). The expression patterns of eight genes (GhANN4, GhANN9, GhANN11, GhANN14, GhANN15, GhANN23, GhANN25, and GhANN27) were further confirmed by qRT-PCR, and the results were highly compatible with the RNA-seq data, demonstrating the validity of the expression data. We found that the expression level of GhANN4 changed significantly under salt stress and drought stress at different times, while the expression level of GhANN11 increased significantly under heat stress and cold stress at different times. These findings suggest that GhANN4 and GhANN11 may have important biological functions under these conditions. To better understand its function, we next investigated their biological functions’ response to salt, drought, heat, and cold stress, respectively.
A growing body of evidence suggests that the ability to withstand abiotic stress is influenced by antioxidant enzyme activity [51]. Reactive oxygen species (ROS) production may increase as a result of abiotic stress, which may reduce a plant’s ability to tolerate it. Plants have developed intricate ROS clearance mechanisms to evade the negative effects of ROS [52]. To further investigate the role of GhANN4 and GhANN11 in the cotton abiotic stress response, we constructed TRV:GhANN4- and TRV:GhANN11-silencing vectors. NaCl and PEG were applied to the TRV:00 and TRV:GhANN4-silenced plants, while high and low temperatures were used to treat the TRV:00 and TRV:GhANN11-silenced plants. The elimination of reactive oxygen species is facilitated by the antioxidant system, an essential defense mechanism. The main components of the system include CAT, POD, and SOD, and indicators of plant resistance can be better understood by examining their activities [53]. We discovered that when silenced plants were subjected to salt, drought, and low-temperature stress, their POD, SOD, and CAT activities greatly decreased; however, when they were subjected to high-temperature stress, their activities dramatically increased. Increased activity of antioxidant enzymes contributes to plants’ capacity to eliminate reactive oxygen species, which lowers membrane lipid peroxidation and preserves the integrity of the membrane structure. We found that the leaves of the target gene-silenced plants wilted significantly under salt, drought, and low-temperature stress, while the leaves of the control plants were not affected, and the leaves of the control plants wilted more significantly than those of the target gene-silenced plants under high-temperature treatment. This aligns with the findings of our earlier studies. An important indicator of the degree of damage to the plasma membrane and membrane lipid peroxidation is the MDA concentration. In the present study, under conditions of salt and drought stress, the MDA content of the silenced plants increased more considerably than that of the control plants, suggesting that the silenced plants suffered additional oxidative damage.
Previous research has demonstrated that the overexpression of TFs may control the expression of genes that respond to stress and improve plant resistance to a range of stressors. Overexpression of TdAnn6 in wheat enhanced tolerance to high salt by regulating stress-related genes [50]. The expression of the salt tolerance gene MsAnn2 in alfalfa was enhanced under salt stress [54]. To better understand the resistance of GhANN to abiotic stress, we examined the expression of marker genes associated with abiotic stress, including GhCBL3, GhDREB2A, GhDREB2C, GhRD20-2, GhSOS1, and GhNHX1 [55,56,57,58,59,60,61,62,63,64,65,66,67,68], in TRV:00 and TRV:GhANN4 plants. Our results showed that the expression levels of GhCBL3, GhDREB2A, GhDREB2C, GhPP2C, and GhRD20-2 in GhANN4-silenced plants were significantly downregulated under drought stress, and the expression levels of GhCIRK6, GhNHX1, GhRD20-1, GhSOS1, GhSOS2, and GhSNRK2.6 were also significantly downregulated under salt stress, suggesting that silencing GhANN4 may weaken the ROS clearance ability of G. hirsutum by reducing the expression of these genes, thus reducing drought and salt tolerance. Similarly, the expression levels of GhDREB2A, GhRD20-1, GhRD29A, and GhWRKY33 in GhANN11-silenced plants significantly decreased under low-temperature stress, while the expression levels of GhDREB2C, GhHSP, and GhSOS2 increased in the GhANN11-silenced plants under high-temperature stress. These findings suggested that GhANN11 protects against temperature extremes by upregulating the expression of GhDREB2A, GhRD20-1, GhRD29A, and GhWRKY33 and downregulating the expression of GhDREB2C, GhHSP, and GhSOS2. On the basis of the above results, we speculated that GhANN4 positively regulates the tolerance of upland cotton to salt and drought and that GhANN11 positively regulates the tolerance of upland cotton to low temperatures and negatively regulates the tolerance of upland cotton to high temperatures.

4. Materials and Methods

4.1. Identification and Analysis of ANN Gene Family Members

The ANN protein sequence from Arabidopsis was used as a seed sequence to construct a hidden Markov model from the Pfam database (http://pfam.xfam.org/, accessed on 18 April 2023). With the use of HMMER 3.0 software, the threshold was set to e < 1.0 × 10⁻⁵, and the HMM file was used to search the four Gossypium species protein databases from CottonFGD (http://www.cottonfgd.org, accessed on 18 April 2023) to obtain candidate protein sequences. Using the online software platforms PfamScan (https://www.ebi.ac.uk/Tools/pfa/pfamscan/, accessed on 18 April 2023) and SMART (http://smart.embl-heidelberg.de/, accessed on 18 April 2023), all the candidate gene sequences were assessed. Using the online tool ExPASy (https://web.expasy.org/, accessed on 19 April 2023), the physicochemical properties of the GhANN protein, including the number of amino acids, molecular weight, and isoelectric point (pI), were analyzed. Subcellular localization prediction analysis was performed on the WoLF PSORT (https://wolfpsort.hgc.jp/, accessed on 19 April 2023) subcellular localization website.

4.2. Phylogenetic Tree Construction, Chromosome Mapping, and Collinearity Analysis of GhANN Family Genes

We performed multiple sequence alignment of the GhANNs using the ClustalW tool. The phylogenetic tree was subsequently generated with MEGA 13 software using the neighbor method with 1000 bootstrap replicates and subsequently submitted to iTOL for visualization. Using MapInspect software (http://mapinspect.software.informer.com, accessed on 28 April 2023), the positions of the GhANN family genes were mapped on the chromosome. For collinearity analysis, the GhANN, GaANN, and GrANN protein sequences were aligned with each other using the Basic Local Alignment Search Tool (BLAST) with a cutoff E value (<10−5). The abovementioned BLASTP results were evaluated by the MCScanX (https://mybiosoftware.com/tag/mcscanx, accessed on 29 April 2023) tool of TBtools (v1.09876) to generate collinearity blocks covering the whole genome. Collinear pairs of GhANN, GaANN, and GrANN family proteins were extracted to construct a collinearity map using TBtools software. Subsequently, the Ka/Ks values of the GhANN genes were determined with TBtools software.

4.3. Examination of the GhANN Family Gene Structure and Conserved Motifs in Gossypium hirsutum

The online application MEME [69] was used to examine the conserved polypeptide motifs found in the ANN proteins of G. hirsutum. The settings were adjusted to a maximum motif number of 10 and ideal group widths between 6 and 50. The Pfam v33.1-18271 PSMM database was used to identify conserved functional domains via NCBI CDD software (https://www.ncbi.nlm.nih.gov/Structure/cdd/wrpsb.cgi, accessed on 30 April 2023), with the other settings remaining at the default values [69]. For the GhANN genes, the gene structures and intron counts were determined using the Gene Structure Display Server 2.0 program (http://gsds.cbi.pku.edu.cn/, accessed on 30 April 2023) [70]. The program TBtools was used to visualize the results [71].

4.4. Prediction of Cis-Acting Regulatory Elements within GhANN Promoters

Using the PlantCARE promoter analysis program, the 2 kb upstream sequences of the GhANN family members were obtained from the CottonFGD database and examined to identify cis-acting regulatory elements in the GhANN promoter regions [72].

4.5. Analysis of the Gene Expression Characteristics of the GhANN Family in Gossypium hirsutum

RNA-seq data from G. hirsutum plants were obtained from Zhejiang University (http://cotton.zju.edu.cn/, accessed on 1 May 2023) [73]. Transcriptome datasets derived from plants subjected to varying levels of heat, cold, drought, and salt stress were also obtained.

4.6. Real-time Fluorescence-Based Quantitative PCR (qRT-PCR) of Selected GhANNs

XinshiK25 seeds were soaked in sterile water for approximately 24 h, exposed to light, and subsequently placed in a homemade water culture box for germination. Cotton plants with similar growth were selected and transferred to an improved Hoagland nutrient solution for cultivation in a light culture room. When the plants reached the four-leaf stage, they were subjected to stress treatment with 200 mmol·L−1 NaCl and 15% PEG-6000 solution, with three biological replicates for each treatment. Some XinshiK25 plants were subjected to cold (12 °C) and heat (42 °C) stress. Leaves were sampled from all treatments at 0, 1, 3, 6, 12, and 24 h.
A polysaccharide polyphenol total RNA extraction kit (Tiangen Biochemical Technology Co., Ltd., Beijing, China) was used to extract total RNA from the collected samples, and the purity, content, and integrity were determined with an ultramicro concentration detector and agarose gel electrophoresis. Reverse transcription was performed using the FastKing gDNA Dispatching RT SuperMix Kit (Tiangen Biochemical Technology Co., Ltd.). qPCR primers were designed using the NCBI Primer BLAST tool (https://www.ncbi.nlm.nih.gov/tools/primer-blast/, accessed on 1 May 2023), with product fragment sizes ranging from 130 to 170 bp (Table S4), and synthesized by Shanghai Shenggong Biotechnology Service Co., Ltd. (Shanghai, China). The reaction system was prepared using a Talent qPCR PreMix (SYBR Green) fluorescence quantitative reagent kit (Tiangen Biochemical Technology Co., Ltd.): 10 µL Talent qPCR PreMix, 2 µL cDNA, 2.4 µL each of forward/reverse primers, and 3.2 µL RNase-free H2O. Using a Roche instrument for RT-PCR, the amplification program was performed at 95 °C for 180 s, 95 °C for 5 s, 60 °C for 15 s, and 40 cycles. Three technical replicates were performed for each sample. Using the 2−ΔΔCT method, the relative expression level of each gene was calculated. The gene expression maps were drawn using Origin software. (2022)

4.7. VIGS of GhANN4 and GhANN11 in G. hirsutum

To create the TRV:GhANN4 and TRV:GhANN11 constructs, segments of GhANN4 (312 bp) and GhANN11 (414 bp) were inserted into the EcoRI and KpnI restriction sites of the TRV-based (pYL156) vector. Table S5 displays all the primers used for vector construction. The Agrobacterium tumefaciens strain GV3101 was transfected with the helper vectors pYL192, TRV:GhANN4, TRV:GhANN11, TRV:00, and TRV:GhCLA1. The strains harboring pYL192 and TRV:00, TRV:GhCLA1, TRV:GhANN4, or TRV:GhANN11 were subsequently combined at a 1:1 ratio and incubated for three hours at 28 °C. After infiltrating the cotyledons of 8-day-old cotton plants, the mixed A. tumefaciens strain solution was administered to produce GhANN4- and GhANN11-silenced cotton plants (TRV:GhANN4 and TRV:GhANN11), as well as negative (TRV:00) and positive (TRV:GhCLA1) control plants. The target gene was expressed in both GhANN4- and GhANN11-silenced cotton plants and control plants when the TRV:GhCLA1 plants displayed an albino phenotype.

4.8. Salt, Drought, Cold, and Heat Resistance Stress Treatment

Silenced plants and negative control plants were subjected to salt, drought, cold, and heat stress. The roots of both control and target GhANN4-silenced plants were irrigated with 400 mM NaCl as salt stress up to 35 d. The roots of both control and target GhANN4-silenced plants were irrigated with 15% PEG6000 as drought stress up to 35 d. For cold tolerance evaluation, plants were placed at 10 °C for 10 d. For heat resistance evaluation, plants were placed at 42 °C for 6 d.

4.9. SOD, POD, and CAT Activity and MDA Content Determination

The leaves of untreated and treated control plants and the GhANN4- and GhANN11-silenced plants were ground in a mortar with liquid nitrogen into powder, and 3 mL of phosphate buffer (pH 7.8) was added to the mixture, which was subsequently ground for 2 min until homogenized. Afterward, 2 mL of buffer was used to rinse the mortar, and the homogenizing liquid was transferred to a centrifuge tube. After centrifugation for 20 min, the supernatant was collected and stored at 4 °C for the determination of antioxidant enzyme activity and MDA content. The nitroblue tetrazole photoreduction method was used to measure SOD activity, the guaiacol colorimetric approach was used to measure POD activity, and the colorimetric method was used to measure the MDA concentration in plant tissues [74]. The approach of [75,76] was used to assess CAT activity. Throughout the measurement period, three technical replicates were used for each sample.

5. Conclusions

Plant tolerance to stress is substantially influenced by the ANN gene family. In G. hirsutum, we found 27 ANN genes. Phylogenetic, gene structure, transcription pattern, protein motif, and subcellular localization analyses were performed. We discovered that following salt and drought treatment, GhANN4 expression was markedly upregulated. Additionally, silencing GhANN4 increased the sensitivity of upland cotton plants to PEG and salt stress. Under stress from high and low temperatures, GhANN11 expression changed in distinct ways. This research identified great candidate genes for genetic engineering to increase cotton stress resistance in addition to providing fundamental data for research on the GhANN genes in cotton.

Supplementary Materials

The following supporting information can be downloaded at https://www.mdpi.com/article/10.3390/ijms25031877/s1.

Author Contributions

Conceptualization, C.W., X.Z. and J.S.; Formal Analysis, J.L., M.L., J.J., X.Z. and W.W.; Funding Acquisition, C.W., X.Z. and J.S.; Investigation, J.L., H.H., X.Z. and P.L.; Resources, C.W. and J.S; Supervision, J.L., H.H. and D.L.; Writing—Original Draft Preparation, J.L; Writing—Review and Editing, C.W. and J.S. All authors have read and agreed to the published version of the manuscript.

Funding

This research was funded by State Key Laboratory of Aridland Crop Science, Gansu Agricultural University (GSCS-2019-10); the Natural Science Foundation of Xinjiang Uygur Autonomous Region (Project No: 2022D01E103 and 2023D01A015); the Project for Postdoctoral and High-level Flexible Talents of Xinjiang Uygur Autonomous Region (Grant. No: RSSQ00066509); the Changji Prefecture “Two Districts” Science and Technology Development Plan Project (No: 2023LQG04); the Major Science and Technology Program of Changji Hui Autonomous Prefecture (Grant. No: 2021Z01-01); and the Central Leading Local Science and Technology Development Fund Project of Xinjiang Uygur Autonomous Region (No: ZYYD2023C06).

Institutional Review Board Statement

Not applicable.

Informed Consent Statement

Not applicable.

Data Availability Statement

All the data generated or analyzed during this study are included in this article and its supplementary data files.

Acknowledgments

The author is especially thankful to Qifeng Ma, Institute of Cotton Research of CAAS, for the TRV vectors and Yonglin Yang, Shihezi Academy of Agricultural Sciences, for the cotton seeds of XinshiK25.

Conflicts of Interest

The authors declare no conflicts of interest.

References

  1. Zhang, N.; Shang, Z.L. Annexins in Plant Cells. Plant. Physiol. Commun. 2010, 46, 277–283. [Google Scholar] [CrossRef]
  2. Creutz, C.E.; Pazoles, C.J.; Pollard, H.B. Identification and purification of an adrenal medullary protein (synexin) that causes calcium-dependent aggregation of isolated chromaffin granules. J. Biol. Chem. 1978, 253, 2858–2866. [Google Scholar] [CrossRef] [PubMed]
  3. Qian, X.L.; Han, Z.Y.; Liu, R.Q.; Xue-Lei, Q.; Zhi-Ying, H.; Riu-Qi, L.; Chang-Long, Y.U.; Hai-Fang, Y.; Yu-Hua, L.I. Annexins:multi-functional complex in the process of plant growth. Guihaia 2013, 33, 703–709. [Google Scholar]
  4. Boustead, C.M.; Smallwood, M.; Small, H.; Bowles, D.J.; Walker, J.H. Identification of calcium-dependent phospholipid-binding proteins in higher plant cells. FEBS Lett. 1989, 244, 456–460. [Google Scholar] [CrossRef]
  5. Carrasco-Castilla, J.; Ortega-Ortega, Y.; Jauregui-Zuniga, D.; Juarez-Verdayes, M.A.; Arthikala. Down-regulation of a Phaseolus vulgaris annexin impairs rhizobial infection and nodulation. Environ. Exp. Bot. 2018, 153, 108–119. [Google Scholar] [CrossRef]
  6. Ijaz, R.; Ejaz, J.; Gao, S.; Liu, T.; Imtiaz, M.; Ye, Z.; Wang, T. Overexpression of annexin gene AnnSp2, enhances drought and salt tolerance through modulation of ABA synthesis and scavenging ROS in tomato. Sci. Rep. 2017, 7, 12087. [Google Scholar] [CrossRef]
  7. Clark, G.B.; Dauwalder, M.; Roux, S.J. Immunolocalization of an annexin-like protein in corn. Adv. Space Res. 1994, 14, 341–3466. [Google Scholar] [CrossRef]
  8. Clark, G.B.; Turnwald, S.; Tirlapur, U.K.; Haas, C.J.; von der Mark, K.; Roux, S.J.; Scheuerlein, R. Polar distribution of annexin-like proteins during phytochrome-mediated initiation and growth of rhizoids in the ferns Dryopteris and Anemia. Planta 1995, 197, 376–384. [Google Scholar] [CrossRef]
  9. Clark, G.B.; Lee, D.; Dauwalder, M.; Roux, S.J. Immunolocalization and histochemical evidence for the association of two different Arabidopsis annexins with secretion during early seedling growth and development. Planta 2005, 220, 621–631. [Google Scholar] [CrossRef]
  10. Xu, L.; Tang, Y.; Gao, S.; Su, S.; Hong, L.; Wang, W.; Fang, Z.; Li, X.; Ma, J.; Quan, W.; et al. Comprehensive analyses of the annexin gene family in wheat. BMC Genomics 2016, 17, 415. [Google Scholar] [CrossRef]
  11. Lichocka, M.; Rymaszewski, W.; Morgiewicz, K.; Barymow-Filoniuk, I.; Chlebowski, A.; Sobczak, M.; Samuel, M.A.; Schmelzer, E.; Krzymowska, M.; Hennig, J. Nucleus- and plastid-targeted annexin 5 promotes reproductive development in Arabidopsis and is essential for pollen and embryo formation. BMC Plant Biol. 2018, 18, 183–198. [Google Scholar] [CrossRef] [PubMed]
  12. Chen, J.; Mao, L.; Mi, H.; Lu, W.; Ying, T.; Luo, Z. Involvement of three annexin genes in the ripening of strawberry fruit regulated by phytohormone and calcium signal transduction. Plant Cell Rep. 2016, 35, 733–743. [Google Scholar] [CrossRef] [PubMed]
  13. Jiang, P.; Gao, J.; Mu, J.; Duan, L.; Gu, Y.; Han, S.; Chen, L.; Li, Y.; Yan, Y.; Li, X. Interaction between serine carboxypeptidase-like protein TtGS5 and Annexin D1 in developing seeds of Triticum timopheevi. J. Appl. Genet. 2020, 61, 151–162. [Google Scholar] [CrossRef] [PubMed]
  14. Hoshino, D.; Hayashi, A.; Temmei, Y.; Kanzawa, N.; Tsuchiya, T. Biochemical and immuno-histochemical characterization of Mimosa annexin. Planta 2004, 219, 867–875. [Google Scholar] [CrossRef] [PubMed]
  15. Gidrol, X.; Sabelli, P.A.; Fern, Y.S.; Kush, A.K. Annexin-like protein from Arabidopsis. thaliana rescues delta oxyR mutant of Escherichia coli from H2O2 stress. Proc. Natl. Acad. Sci. USA 1996, 93, 11268–11273. [Google Scholar] [CrossRef]
  16. He, B.; Cai, Q.; Qiao, L.; Huang, C.Y.; Wang, S.; Miao, W.; Ha, T.; Wang, Y.; Jin, H. RNA-binding proteins contribute to small RNA loading in plant extracellular vesicles. Nat. Plants 2021, 7, 342–352. [Google Scholar] [CrossRef] [PubMed]
  17. Zhao, Z.X.; Xu, Y.J.; Lei, Y.; Li, Q.; Zhao, J.Q.; Li, Y.; Fan, J.; Xiao, S.; Wang, W.M. ANNEXIN 8 negatively regulates RPW8.1-mediated cell death and disease resistance in Arabidopsis. J. Integr. Plant. Biol. 2021, 63, 378–392. [Google Scholar] [CrossRef] [PubMed]
  18. Vandeputte, O.; Lowe, Y.O.; Burssens, S.; Van Raemdonck, D.; Hutin, D.; Boniver, D.; Geelen, D.; El Jaziri, M.; Baucher, M. The tobacco Ntann12 gene, encoding an annexin, is induced upon Rhodoccocus fascians infection and during leafy gall development. Mol. Plant Pathol. 2007, 8, 185–194. [Google Scholar] [CrossRef]
  19. Deka, S.; Barthakur, S. Impact of biorational pesticides and response of annexin gene expression in tomato (Solanum lycopersicum) and capsicum (Capsicum annum L.) in biotic stress management under greenhouse condition. Ann. Agric. Res. New Ser. 2016, 36, 233–242. [Google Scholar]
  20. Yadav, D.; Boyidi, P.; Ahmed, I.; Kirti, P.B. Plant annexins and their involvement in stress responses. Environ. Exp. Bot. 2018, 155, 293–306. [Google Scholar] [CrossRef]
  21. Jami, S.K.; Clark, G.B.; Turlapati, S.A.; Handley, C.; Roux, S.J.; Kirti, P.B. Ectopic expression of an annexin from Brassica. juncea confers tolerance to abiotic and biotic stress treatments in transgenic tobacco. Plant Physiol. Biochem. 2008, 46, 1019–1030. [Google Scholar] [CrossRef] [PubMed]
  22. Zhang, Y.; Wang, Q.; Zhang, X.; Liu, X.; Wang, P.; Hou, Y. Cloning and Characterization of an Annexin Gene from Cynanchum komarovii that Enhances Tolerance to Drought and Fusarium oxysporum in Transgenic Cotton. J. Plant Biol. 2011, 54, 303–313. [Google Scholar] [CrossRef]
  23. Zhao, J.; Li, L.; Liu, Q.; Liu, P.; Li, S.; Yang, D.; Chen, Y.; Pagnotta, S.; Favery, B.; Abad, P.; et al. A MIF-like effector suppresses plant immunity and facilitates nematode parasitism by interacting with plant annexins. J. Exp. Bot. 2019, 70, 5943–5958. [Google Scholar] [CrossRef] [PubMed]
  24. Lee, S.; Lee, E.J.; Yang, E.J.; Lee, J.E.; Park, A.R.; Song, W.H.; Park, O.K. Proteomic identification of annexins, calcium-dependent membrane binding proteins that mediate osmotic stress and abscisic acid signal transduction in Arabidopsis. Plant Cell 2004, 16, 1378–1391. [Google Scholar] [PubMed]
  25. Huh, S.M.; Noh, E.K.; Kim, H.G.; Jeon, B.W.; Bae, K.; Hu, H.C.; Kwak, J.M.; Park, O.K. Arabidopsis annexins AnnAt1 and AnnAt4 interact with each other and regulate drought and salt stress responses. Plant Cell Physiol. 2010, 51, 1499–1514. [Google Scholar] [CrossRef]
  26. Wang, X.; Movahedi, A.; Wei, H.; Wu, X.; Zhuge, Q. Overexpression of PtAnnexin1 from Populus trichocarpa enhances salt and drought tolerance in transgenic poplars. Tree Genet. Genomes 2020, 16, 20–32. [Google Scholar] [CrossRef]
  27. Ahmed, I.; Yadav, D.; Shukla, P.; Vineeth, T.V.; Sharma, P.C.; Kirti, P.B. Constitutive expression of Brassica. juncea annexin, AnnBj2 confers salt tolerance and glucose and ABA insensitivity in mustard transgenic plants. Plant Sci. 2017, 265, 12–28. [Google Scholar] [CrossRef]
  28. Ahmed, I.; Yadav, D.; Shukla, P.; Kirti, P.B. Heterologous expression of Brassica juncea annexin, AnnBj2 confers salt tolerance and ABA insensitivity in transgenic tobacco seedlings. Funct. Integr. Genomics 2018, 18, 569–579. [Google Scholar] [CrossRef]
  29. Zhang, F.; Li, S.; Yang, S.; Wang, L.; Guo, W. Overexpression of a cotton annexin gene, GhAnn1, enhances drought and salt stress tolerance in transgenic cotton. Plant Mol. Biol. 2015, 87, 47–67. [Google Scholar] [CrossRef]
  30. Zhang, D.; Li, J.; Niu, X.; Deng, C.; Guo, W. GhANN1 modulates the salinity tolerance by regulating ABA biosynthesis, ion homeostasis and phenylpropanoid pathway in cotton. Environ. Exp. Bot. 2021, 185, 104427. [Google Scholar] [CrossRef]
  31. Mu, C.; Zhou, L.; Shan, L.; Li, F.; Li, Z. Phosphatase GhDsPTP3a interacts with annexin protein GhANN8b to reversely regulate salt tolerance in cotton (Gossypium spp.). New Phytol. 2019, 223, 1856–1872. [Google Scholar] [CrossRef] [PubMed]
  32. Li, X.; Zhang, Q.; Yang, X.; Han, J.; Zhu, Z. OsANN3, a calcium-dependent lipid binding annexin is a positive regulator of ABA-dependent stress tolerance in rice. Plant Sci. 2019, 284, 212–220. [Google Scholar] [CrossRef] [PubMed]
  33. Gao, S.; Song, T.; Han, J.; He, M.; Zhang, Q.; Zhu, Y.; Zhu, Z. A calcium-dependent lipid binding protein, OsANN10, is a negative regulator of osmotic stress tolerance in rice. Plant Sci. 2020, 293, 110420. [Google Scholar] [CrossRef] [PubMed]
  34. Breton, G.; Vazquez-Tello, A.; Danyluk, J.; Sarhan, F. Two novel intrinsic annexins accumulate in wheat membranes in response to low temperature. Plant Cell Physiol. 2000, 41, 177–184. [Google Scholar] [CrossRef] [PubMed]
  35. Liu, Q.; Ding, Y.; Shi, Y.; Ma, L.; Wang, Y.; Song, C.; Wilkins, K.A.; Davies, J.M.; Knight, H.; Knight, M.R.; et al. The calcium transporter ANNEXIN1 mediates cold-induced calcium signaling and freezing tolerance in plants. Embo J. 2021, 40, e104559. [Google Scholar] [CrossRef] [PubMed]
  36. Shen, C.; Que, Z.; Xia, Y.; Tang, N.; Li, D.; He, R.; Cao, M. Knock out of the annexin gene OsAnn3 via CRISPR/Cas9-mediated genome editing decreased cold tolerance in rice. J. Plant Biol. 2017, 60, 539–547. [Google Scholar] [CrossRef]
  37. He, F.; Gao, C.; Guo, G.; Liu, J.; Gao, Y.; Pan, R.; Guan, Y.; Hu, J. Maize annexin genes ZmANN33 and ZmANN35 encode proteins that function in cell membrane recovery during seed germination. J. Exp. Bot. 2019, 70, 1183–1195. [Google Scholar] [CrossRef]
  38. Chu, P.; Chen, H.; Zhou, Y.; Li, Y.; Ding, Y.; Jiang, L.; Tsang, E.W.; Wu, K.; Huang, S. Proteomic and functional analyses of Nelumbo nucifera annexins involved in seed thermotolerance and germination vigor. Planta 2012, 235, 1271–1288. [Google Scholar] [CrossRef]
  39. Wang, X.; Ma, X.; Wang, H.; Li, B.; Clark, G.; Guo, Y.; Roux, S.; Sun, D.; Tang, W. Proteomic study of microsomal proteins reveals a key role for Arabidopsis annexin 1 in mediating heat stress-induced increase in intracellular calcium levels. Mol. Cell Proteomics 2015, 14, 686–694. [Google Scholar] [CrossRef]
  40. Liao, C.; Zheng, Y.; Guo, Y. MYB30 transcription factor regulates oxidative and heat stress responses through ANNEXIN-mediated cytosolic calcium signaling in Arabidopsis. New Phytol. 2017, 216, 163–177. [Google Scholar] [CrossRef]
  41. Qiao, B.; Zhang, Q.; Liu, D.; Wang, H.; Yin, J.; Wang, R.; He, M.; Cui, M.; Shang, Z.; Wang, D.; et al. A calcium-binding protein, rice annexin OsANN1, enhances heat stress tolerance by modulating the production of H2O2. J. Exp. Bot. 2015, 66, 5853–5866. [Google Scholar] [CrossRef] [PubMed]
  42. Shin, H.; Brown, R.M., Jr. GTPase activity and biochemical characterization of a recombinant cotton fiber annexin. Plant Physiol. 1999, 119, 925–934. [Google Scholar] [CrossRef] [PubMed]
  43. Tang, W.; He, Y.; Tu, L.; Wang, M.; Li, Y.; Ruan, Y.L.; Zhang, X. Down-regulating annexin gene GhAnn2 inhibits cotton fiber elongation and decreases Ca2+ influx at the cell apex. Plant Mol. Biol. 2014, 85, 613–625. [Google Scholar] [CrossRef]
  44. Guruprasad, K.; Reddy, B.V.; Pandit, M.W. Correlation between stability of a protein and its dipeptide composition: A novel approach for predicting in vivo stability of a protein from its primary sequence. Protein Eng. 1990, 4, 155–161. [Google Scholar] [CrossRef] [PubMed]
  45. Bailey, T.L.; Johnson, J.; Grant, C.E.; Noble, W.S. The MEME Suite. Nucleic Acids Res. 2015, 43, W39–W49. [Google Scholar] [CrossRef]
  46. Clark, G.B.; Sessions, A.; Eastburn, D.J.; Roux, S.J. Differential expression of members of the annexin multigene family in Arabidopsis. Plant Physiol. 2001, 126, 1072–1084. [Google Scholar] [CrossRef]
  47. Jami, S.K.; Clark, G.B.; Ayele, B.T.; Roux, S.J.; Kirti, P.B. Identification and characterization of annexin gene family in rice. Plant Cell Rep. 2012, 31, 813–825. [Google Scholar] [CrossRef]
  48. Feng, Y.M.; Wei, X.K.; Liao, W.X.; Huang, L.H.; Zhang, H.; Liang, S.C.; Peng, H. Molecular analysis of the annexin gene family in soybean. Biologia Plantarum 2013, 57, 655–662. [Google Scholar] [CrossRef]
  49. Chang, X.; He, X.; Li, J.; Liu, Z.; Pi, R.; Luo, X.; Wang, R.; Hu, X.; Lu, S.; Zhang, X.; et al. High-quality Gossypium hirsutum and Gossypium barbadense genome assemblies reveal the landscape and evolution of centromeres. Plant Commun. 2023, 22, 100722. [Google Scholar] [CrossRef]
  50. Harbaoui, M.; Ben Romdhane, W.; Ben Hsouna, A.; Brini, F.; Ben Saad, R. The durum wheat annexin, TdAnn6, improves salt and osmotic stress tolerance in Arabidopsis via modulation of antioxidant machinery. Protoplasma 2021, 258, 1047–1059. [Google Scholar] [CrossRef]
  51. Mushtaq, N.; Wang, Y.; Fan, J.; Li, Y.; Ding, J. Down-Regulation of Cytokinin Receptor Gene SlHK2 Improves Plant Tolerance to Drought, Heat, and Combined Stresses in Tomato. Plants 2022, 11, 154. [Google Scholar] [CrossRef] [PubMed]
  52. Mittler, R. Oxidative stress, antioxidants and stress tolerance [Review]. Trends Plant Sci. 2002, 7, 405–410. [Google Scholar] [CrossRef] [PubMed]
  53. Bowler, C.; Montagu, M.V.; Inze, D. Superoxide Dismutase and Stress Tolerance. Annu. Rev. Plant Physiol. Plant Mol. Biol. 1992, 43, 83–116. [Google Scholar] [CrossRef]
  54. Kovács, I.; Ayaydin, F.; Oberschall, A.; Ipacs, I.; Bottka, S.; Pongor, S.; Dudits, D.; Tóth, E.C. Immunolocalization of a novel annexin-like protein encoded by a stress and abscisic acid responsive gene in alfalfa. Plant J. 1998, 15, 185–197. [Google Scholar] [CrossRef]
  55. Nakashima, K.; Shinwari, Z.K.; Sakuma, Y.; Seki, M.; Miura, S.; Shinozaki, K.; Yamaguchi-Shinozaki, K. Organization and expression of two Arabidopsis DREB2 genes encoding DRE-binding proteins involved in dehydration- and high-salinity-responsive gene expression. Plant Mol. Biol. 2000, 42, 657–665. [Google Scholar] [CrossRef] [PubMed]
  56. Sakuma, Y.; Maruyama, K.; Osakabe, Y.; Qin, F.; Seki, M.; Shinozaki, K.; Yamaguchi-Shinozaki, K. Functional analysis of an Arabidopsis transcription factor, DREB2A, involved in drought-responsive gene expression. Plant Cell 2006, 18, 1292–1309. [Google Scholar] [CrossRef] [PubMed]
  57. Xiu, Y.; Iqbal, A.; Zhu, C.; Wu, G.; Chang, Y.; Li, N.; Cao, Y.; Zhang, W.; Zeng, H.; Chen, S.; et al. Improvement and transcriptome analysis of root architecture by overexpression of Fraxinus pennsylvanica DREB2A transcription factor in Robinia pseudoacacia L. ‘Idaho’. Plant Biotechnol. J. 2016, 14, 1456–1469. [Google Scholar] [CrossRef]
  58. Je, J.; Chen, H.; Song, C.; Lim, C.O. Arabidopsis DREB2C modulates ABA biosynthesis during germination. Biochem. Biophys. Res. Commun. 2014, 452, 91–98. [Google Scholar] [CrossRef]
  59. Zhao, K.; Shen, X.; Yuan, H.; Liu, Y.; Liao, X.; Wang, Q.; Liu, L.; Li, F.; Li, T. Isolation and characterization of dehydration-responsive element-binding factor 2C (MsDREB2C) from Malus sieversii. Roem Plant Cell Physiol. 2013, 54, 1415–1430. [Google Scholar] [CrossRef]
  60. Aubert, Y.; Vile, D.; Pervent, M.; Aldon, D.; Ranty, B.; Simonneau, T.; Vavasseur, A.; Galaud, J.P. RD20, a stress-inducible caleosin, participates in stomatal control, transpiration and drought tolerance in Arabidopsis thaliana. Plant Cell Physiol. 2010, 51, 1975–1987. [Google Scholar] [CrossRef]
  61. Liu, J.; Ishitani, M.; Halfter, U.; Kim, C.S.; Zhu, J.K. The Arabidopsis thaliana SOS2 gene encodes a protein kinase that is required for salt tolerance. Proc. Natl. Acad. Sci. USA 2000, 97, 3730–3734. [Google Scholar] [CrossRef] [PubMed]
  62. Basso, M.F.; Costa, J.A.; Ribeiro, T.P.; Arraes, F.B.M.; Lourenço-Tessutti, I.T.; Macedo, A.F.; Neves, M.R.D.; Nardeli, S.M.; Arge, L.W.; Perez, C.E.A.; et al. Overexpression of the CaHB12 transcription factor in cotton (Gossypium hirsutum) improves drought tolerance. Plant Physiol. Biochem. 2021, 165, 80–93. [Google Scholar] [CrossRef]
  63. Shazadee, H.; Khan, N.; Wang, J.; Wang, C.; Zeng, J.; Huang, Z.; Wang, X. Identification and Expression Profiling of Protein Phosphatases (PP2C) Gene Family in Gossypium hirsutum L. Int. J. Mol. Sci. 2019, 20, 1395. [Google Scholar] [CrossRef] [PubMed]
  64. Lu, T.; Zhang, G.; Sun, L.; Wang, J.; Hao, F. Genome-wide identification of CBL family and expression analysis of CBLs in response to potassium deficiency in cotton. PeerJ 2017, 5, e3653. [Google Scholar] [CrossRef] [PubMed]
  65. Long, L.; Zhao, J.R.; Guo, D.D.; Ma, X.N.; Xu, F.C.; Yang, W.W.; Gao, W. Identification of NHXs in Gossypium species and the positive role of GhNHX1 in salt tolerance. BMC Plant Biol. 2020, 20, 147. [Google Scholar] [CrossRef] [PubMed]
  66. Wu, C.A.; Yang, G.D.; Meng, Q.W.; Zheng, C.C. The cotton GhNHX1 gene encoding a novel putative tonoplast Na(+)/H(+) antiporter plays an important role in salt stress. Plant Cell Physiol. 2004, 45, 600–607. [Google Scholar] [CrossRef]
  67. Chen, X.; Lu, X.; Shu, N.; Wang, D.; Wang, S.; Wang, J.; Guo, L.; Guo, X.; Fan, W.; Lin, Z.; et al. GhSOS1, a plasma membrane Na+/H+ antiporter gene from upland cotton, enhances salt tolerance in transgenic Arabidopsis thaliana. PLoS ONE 2017, 12, e0181450. [Google Scholar] [CrossRef]
  68. Che, B.; Cheng, C.; Fang, J.; Liu, Y.; Jiang, L.; Yu, B. The Recretohalophyte Tamarix TrSOS1 Gene Confers Enhanced Salt Tolerance to Transgenic Hairy Root Composite Cotton Seedlings Exhibiting Virus-Induced Gene Silencing of GhSOS1. Int. J. Mol. Sci. 2019, 20, 2930. [Google Scholar] [CrossRef]
  69. Lu, S.; Wang, J.; Chitsaz, F.; Derbyshire, M.K.; Geer, R.C.; Gonzales, N.R.; Gwadz, M.; Hurwitz, D.I.; Marchler, G.H.; Song, J.S.; et al. Marchler-Bauer, A., CDD/SPARCLE: The conserved domain database in 2020. Nucleic Acids Res. 2020, 48, D265–D268. [Google Scholar] [CrossRef]
  70. Hu, B.; Jin, J.; Guo, A.Y.; Zhang, H.; Luo, J.; Gao, G. GSDS 2.0: An upgraded gene feature visualization server. Bioinformatics 2015, 31, 1296–1297. [Google Scholar] [CrossRef]
  71. Chen, C.; Chen, H.; Zhang, Y.; Thomas, H.R.; Frank, M.H.; He, Y.; Xia, R. TBtools: An Integrative Toolkit Developed for Interactive Analyses of Big Biological Data. Mol. Plant 2020, 13, 1194–1202. [Google Scholar] [CrossRef] [PubMed]
  72. Lescot, M.; Déhais, P.; Thijs, G.; Marchal, K.; Moreau, Y.; Van de Peer, Y.; Rouzé, P.; Rombauts, S. PlantCARE, a database of plant cis-acting regulatory elements and a portal to tools for in silico analysis of promoter sequences. Nucleic Acids Res. 2002, 30, 325–327. [Google Scholar] [CrossRef] [PubMed]
  73. Cheng, X.; Wang, H.; Wei, H.; Gu, L.; Hao, P.; Sun, H.; Wu, A.; Cheng, S.; Yu, S. The MADS transcription factor GhAP1.7 coordinates the flowering regulatory pathway in upland cotton (Gossypium hirsutum L.). Gene 2021, 769, 145235. [Google Scholar] [CrossRef] [PubMed]
  74. Ullah, A.; Sun, H.; Hakim; Yang, X.; Zhang, X. A novel cotton WRKY gene, GhWRKY6-like, improves salt tolerance by activating the ABA signaling pathway and scavenging of reactive oxygen species. Physiol. Plant 2018, 162, 439–454. [Google Scholar] [CrossRef]
  75. Aebi, H. Catalase in vitro. Methods Enzymol. 1984, 105, 121–126. [Google Scholar]
  76. Bharwana, S.A.; Ali, S.; Farooq, M.A.; Ali, B.; Iqbal, N.; Abbas, F.; Ahmad, M.S. Hydrogen sulfide ameliorates lead-induced morphological, photosynthetic, oxidative damages and biochemical changes in cotton. Environ. Sci. Pollut. Res. Int. 2014, 21, 717–731. [Google Scholar] [CrossRef]
Figure 1. Phylogenetic tree of ANN orthologs from G. hirsutum, G. raimondii, G. arboretum, Triticum aestivum, Oryza sativa, Populus, Zea mays, Glycine max, and A. thaliana. Using 1000 bootstrap replicates, the neighbor method of MEGA 13 software was used to create the tree. The red dot represents Os, the purple cross represents Ga, the dark green rhombus represents Gb, the pale green square represents Gh, the khaki five-pointed star represents Gr, the lilac triangle represents Ta, the cyan tri-point shape represents Gm, the black diamond represents Pt, the black cross represents At, and the black asterisk represents Zm.
Ijms 25 01877 g001
Figure 2. Chromosomal distribution, intergenomic relationships, and collinear relationships of the GhANN family. (A) The distribution of the 27 GhANN genes on the Gossypium hirsutum chromosomes. (B) Patterns of GhANN gene duplication in the genome of Gossypium hirsutum. (C) The genome-scale collinear link between the 27 GhANN genes and the ANN families of Gossypium arboreum and Gossypium raimondii.
Ijms 25 01877 g002
Figure 3. Structural analysis of the GhANNs. (A) Distribution of motifs in the 27 GhANNs. (B) Distribution of conserved functional domains in the 27 GhANNs. (C) Exon/intron structure of the GhANN genes.
Ijms 25 01877 g003
Figure 4. Cis-regulatory elements in the promoter regions of GhANN gene family members. The number in each cell represents the number of cis-acting elements present in each GhANN promoter region.
Ijms 25 01877 g004
Figure 5. The GhANN gene expression profiles under different stresses. (A) GhANN gene expression patterns during PEG and NaCl stress. (B) GhANN gene expression patterns in response to heat and cold stress. High and low expression levels are represented by red and blue, respectively.
Ijms 25 01877 g005
Figure 6. The expression levels of eight GhANNs under NaCl, PEG, cold, and heat stress. The data for three biological replicates are represented by error bars, which show the standard deviations. Yellow, gray, blue, and pink represent PEG, NaCl, cold, and heat stress, respectively. The asterisks indicate significant differences according to Student’s t test. *, p < 0.05; **, p < 0.01.
Ijms 25 01877 g006
Figure 7. Silencing of GhANN4 compromised cotton tolerance to PEG stress. (A) Positive control plants. (B) Quantitative RT-PCR analysis of GhANN4 expression in TRV:00 plants and TRV:GhANN4 plants. For the silenced plants, the expression of the target genes was half that of the control plants, and these plants were selected for stress treatment. GhActin (AY305733) was used as an internal control. SD denotes the standard deviation calculated from three independent experiments. (C) Cotton phenotypes of the control (TRV:00) and GhANN4-silenced (TRV:GhANN4) plants without stress treatment. (D) Cotton plant phenotypes under drought stress were controlled (TRV:00) or silenced by GhANN4 (TRV:GhANN4). Photos were taken after 35 days of PEG treatment. (E) SOD activity, POD activity, CAT activity, and MDA content of GhANN4-silenced and control plants under normal conditions and PEG treatment. (F) Quantitative RT-PCR analysis of marker genes related to drought stress tolerance in silenced and control plants before and after PEG treatment. The asterisks indicate significant differences according to Student’s t test. *, p < 0.05; **, p < 0.01.
Ijms 25 01877 g007
Figure 8. Silencing of GhANN4 compromised cotton tolerance to NaCl stress. (A) Positive control plants. (B) Quantitative RT-PCR analysis of GhANN4 expression in TRV:00 plants and TRV:GhANN4 plants. Silenced plants in which the expression of the target genes was half that in the control plants were selected for stress treatment. GhActin (AY305733) was used as an internal control. SD denotes the standard deviation calculated from three independent experiments. (C) Cotton plant phenotypes were silenced by the control (TRV:00) or GhANN4 (TRV:GhANN4) without stress treatment. (D) Cotton plant phenotypes under NaCl stress were controlled (TRV:00) or silenced by GhANN4 (TRV:GhANN4). Photos were taken after 35 days of NaCl treatment. (E) SOD activity, POD activity, CAT activity, and MDA content of GhANN4-silenced cotton plants and controls under normal conditions and NaCl treatments. (F) Quantitative RT-PCR analysis of marker genes related to NaCl stress tolerance in silenced and control plants before and after NaCl treatment. The asterisks indicate significant differences according to Student’s t test. *, p < 0.05; **, p < 0.01.
Ijms 25 01877 g008
Figure 9. Silencing of GhANN11 compromised cotton tolerance to cold stress. (A) Positive control plants. (B) Quantitative RT-PCR analysis of GhANN11 expression in TRV:00 plants and TRV:GhANN11 plants. For the silenced plants, the expression of the target genes was half that of the control plants, and these plants were selected for stress treatment. GhActin (AY305733) was used as an internal control. SD denotes the standard deviation calculated from three independent experiments. (C) Cotton plant phenotypes were silenced by the control (TRV:00) or GhANN11 (TRV:GhANN11) without stress treatment. (D) Cotton plant phenotypes under cold stress in the control (TRV:00) or silenced by GhANN11 (TRV:GhANN11). Photos were taken after 10 days of cold treatment. (E) SOD activity, POD activity, and CAT activity of GhANN11-silenced and control plants under normal conditions and cold treatments. (F) Quantitative RT-PCR analysis of marker genes related to cold stress tolerance in silenced and control plants before and after cold treatment. The asterisks indicate significant differences according to Student’s t test. *, p < 0.05; **, p < 0.01.
Ijms 25 01877 g009
Figure 10. Silencing of GhANN11 impairs cotton tolerance to heat stress. (A) Positive control plants. (B) Quantitative RT-PCR analysis of GhANN11 expression in TRV:00 plants and TRV:GhANN11 plants. Silenced plants in which the expression of target genes was half that in control plants were selected for stress treatment. GhActin (AY305733) was used as an internal control. SD denotes the standard deviation calculated from three independent experiments. (C) Cotton plant phenotypes were silenced by control (TRV:00) and GhANN11 (TRV:GhANN11) without stress treatment. (D) Cotton plant phenotypes under heat stress were controlled (TRV:00) and silenced by GhANN11 (TRV:GhANN11). Photos were taken after 6 days of heat treatment. (E) SOD activity, POD activity, and CAT activity of GhANN11-silenced cotton plants and controls under normal conditions and heat treatments. (F) Quantitative RT-PCR analysis of marker genes related to heat stress tolerance in silenced and control plants before and after heat treatment. The asterisks indicate significant differences according to Student’s t test. **, p < 0.01.
Ijms 25 01877 g010
Table 1. Basic information on the ANN gene family in cotton.
Genes NameGenes IDNumber of Amino Acids
(aa)
Molecular Weight
(kDa)
Theoretical pIThe
Instability
Index
Grand
Average of
Hydropathicity (GRAVY)
Subcellular Localization
GhANN1GH_D02G2140.132136.539.7142.78−0.307nucleus
GhANN2GH_A03G1973.132136.379.7542.37−0.312nucleus
GhANN3GH_A05G0751.136341.146.6542.58−0.425Golgi apparatus
GhANN4GH_A05G2275.131635.976.3935.10−0.474cytoplasm
GhANN5GH_A05G2824.130634.706.8845.71−0.395cytoskeleton
GhANN6GH_A05G2825.125429.378.6631.04−0.558cytoplasm
GhANN7GH_A05G3169.131535.569.2336.60−0.422cytoplasm
GhANN8GH_D05G0748.140245.626.4741.72−0.31plasma membrane
GhANN9GH_D05G2295.131636.006.3433.42−0.487cytoplasm
GhANN10GH_D05G2841.134338.476.2836.16−0.33peroxisome
GhANN11GH_D05G2842.130534.606.3344.93−0.372cytoskeleton
GhANN12GH_D05G2843.131035.248.8232.27−0.496cytoplasm
GhANN13GH_D05G3187.131235.229.138.53−0.416cytoplasm
GhANN14GH_A07G0681.131635.579.0837.04−0.324cytoplasm
GhANN15GH_D07G0672.131635.459.136.77−0.273cytoplasm
GhANN16GH_A09G1894.131635.499.1137.07−0.304chloroplast
GhANN17GH_D09G1846.131635.579.1237.39−0.327chloroplast
GhANN18GH_A10G2000.131436.028.4550.23−0.624cytoplasm
GhANN19GH_A10G2002.131435.836.7838.79−0.557cytoplasm
GhANN20GH_D10G2102.131436.088.7951.66−0.615cytoplasm
GhANN21GH_D10G2103.131435.846.7440.63−0.525cytoplasm
GhANN22GH_A11G0554.131635.776.2329.41−0.429cytoplasm
GhANN23GH_A11G2122.131636.016.1936.18−0.467cytoplasm
GhANN24GH_D11G0581.131635.856.3931.13−0.451cytoplasm
GhANN25GH_D11G2320.131636.066.1936.66−0.453cytoplasm
GhANN26GH_A13G1903.132336.628.0547.01−0.373cytoplasm
GhANN27GH_D13G1859.124027.197.1735.31−0.387cytoskeleton
Disclaimer/Publisher’s Note: The statements, opinions and data contained in all publications are solely those of the individual author(s) and contributor(s) and not of MDPI and/or the editor(s). MDPI and/or the editor(s) disclaim responsibility for any injury to people or property resulting from any ideas, methods, instructions or products referred to in the content.

