
Potentiation of Collagen Deposition by the Combination of Substance P with Transforming Growth Factor Beta in Rat Skin Fibroblasts


Abstract
:1. Introduction
2. Results
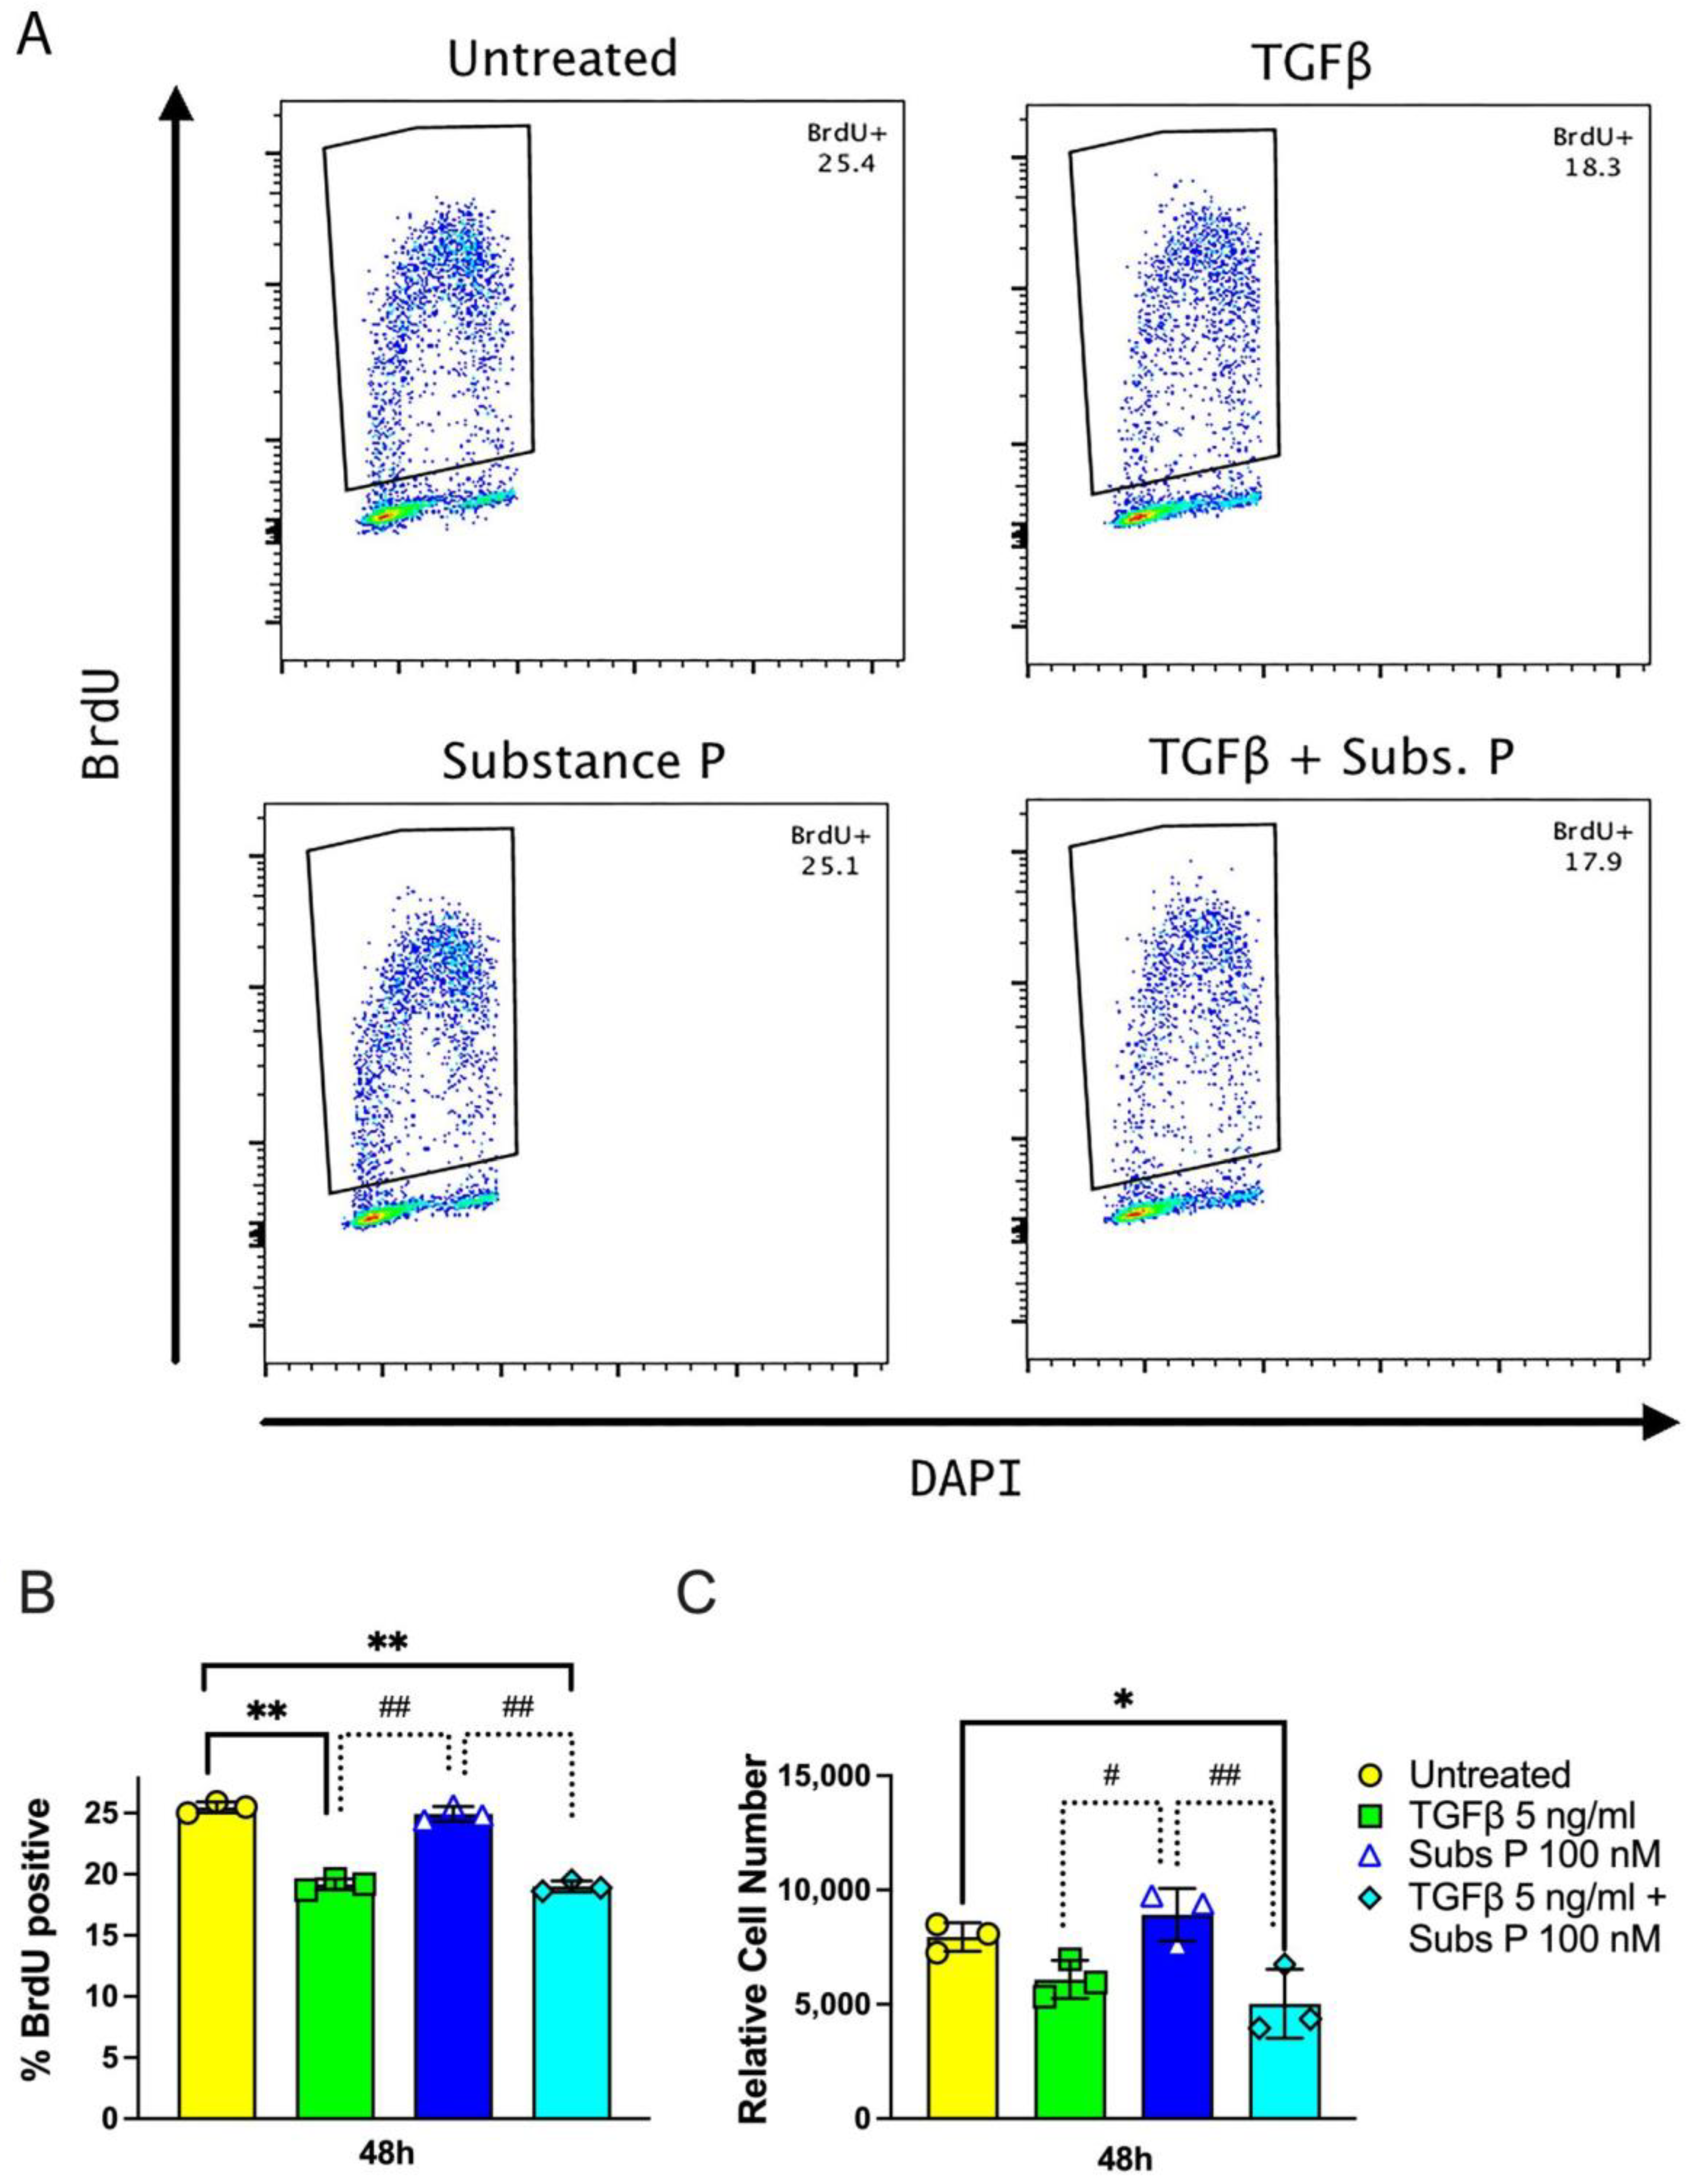
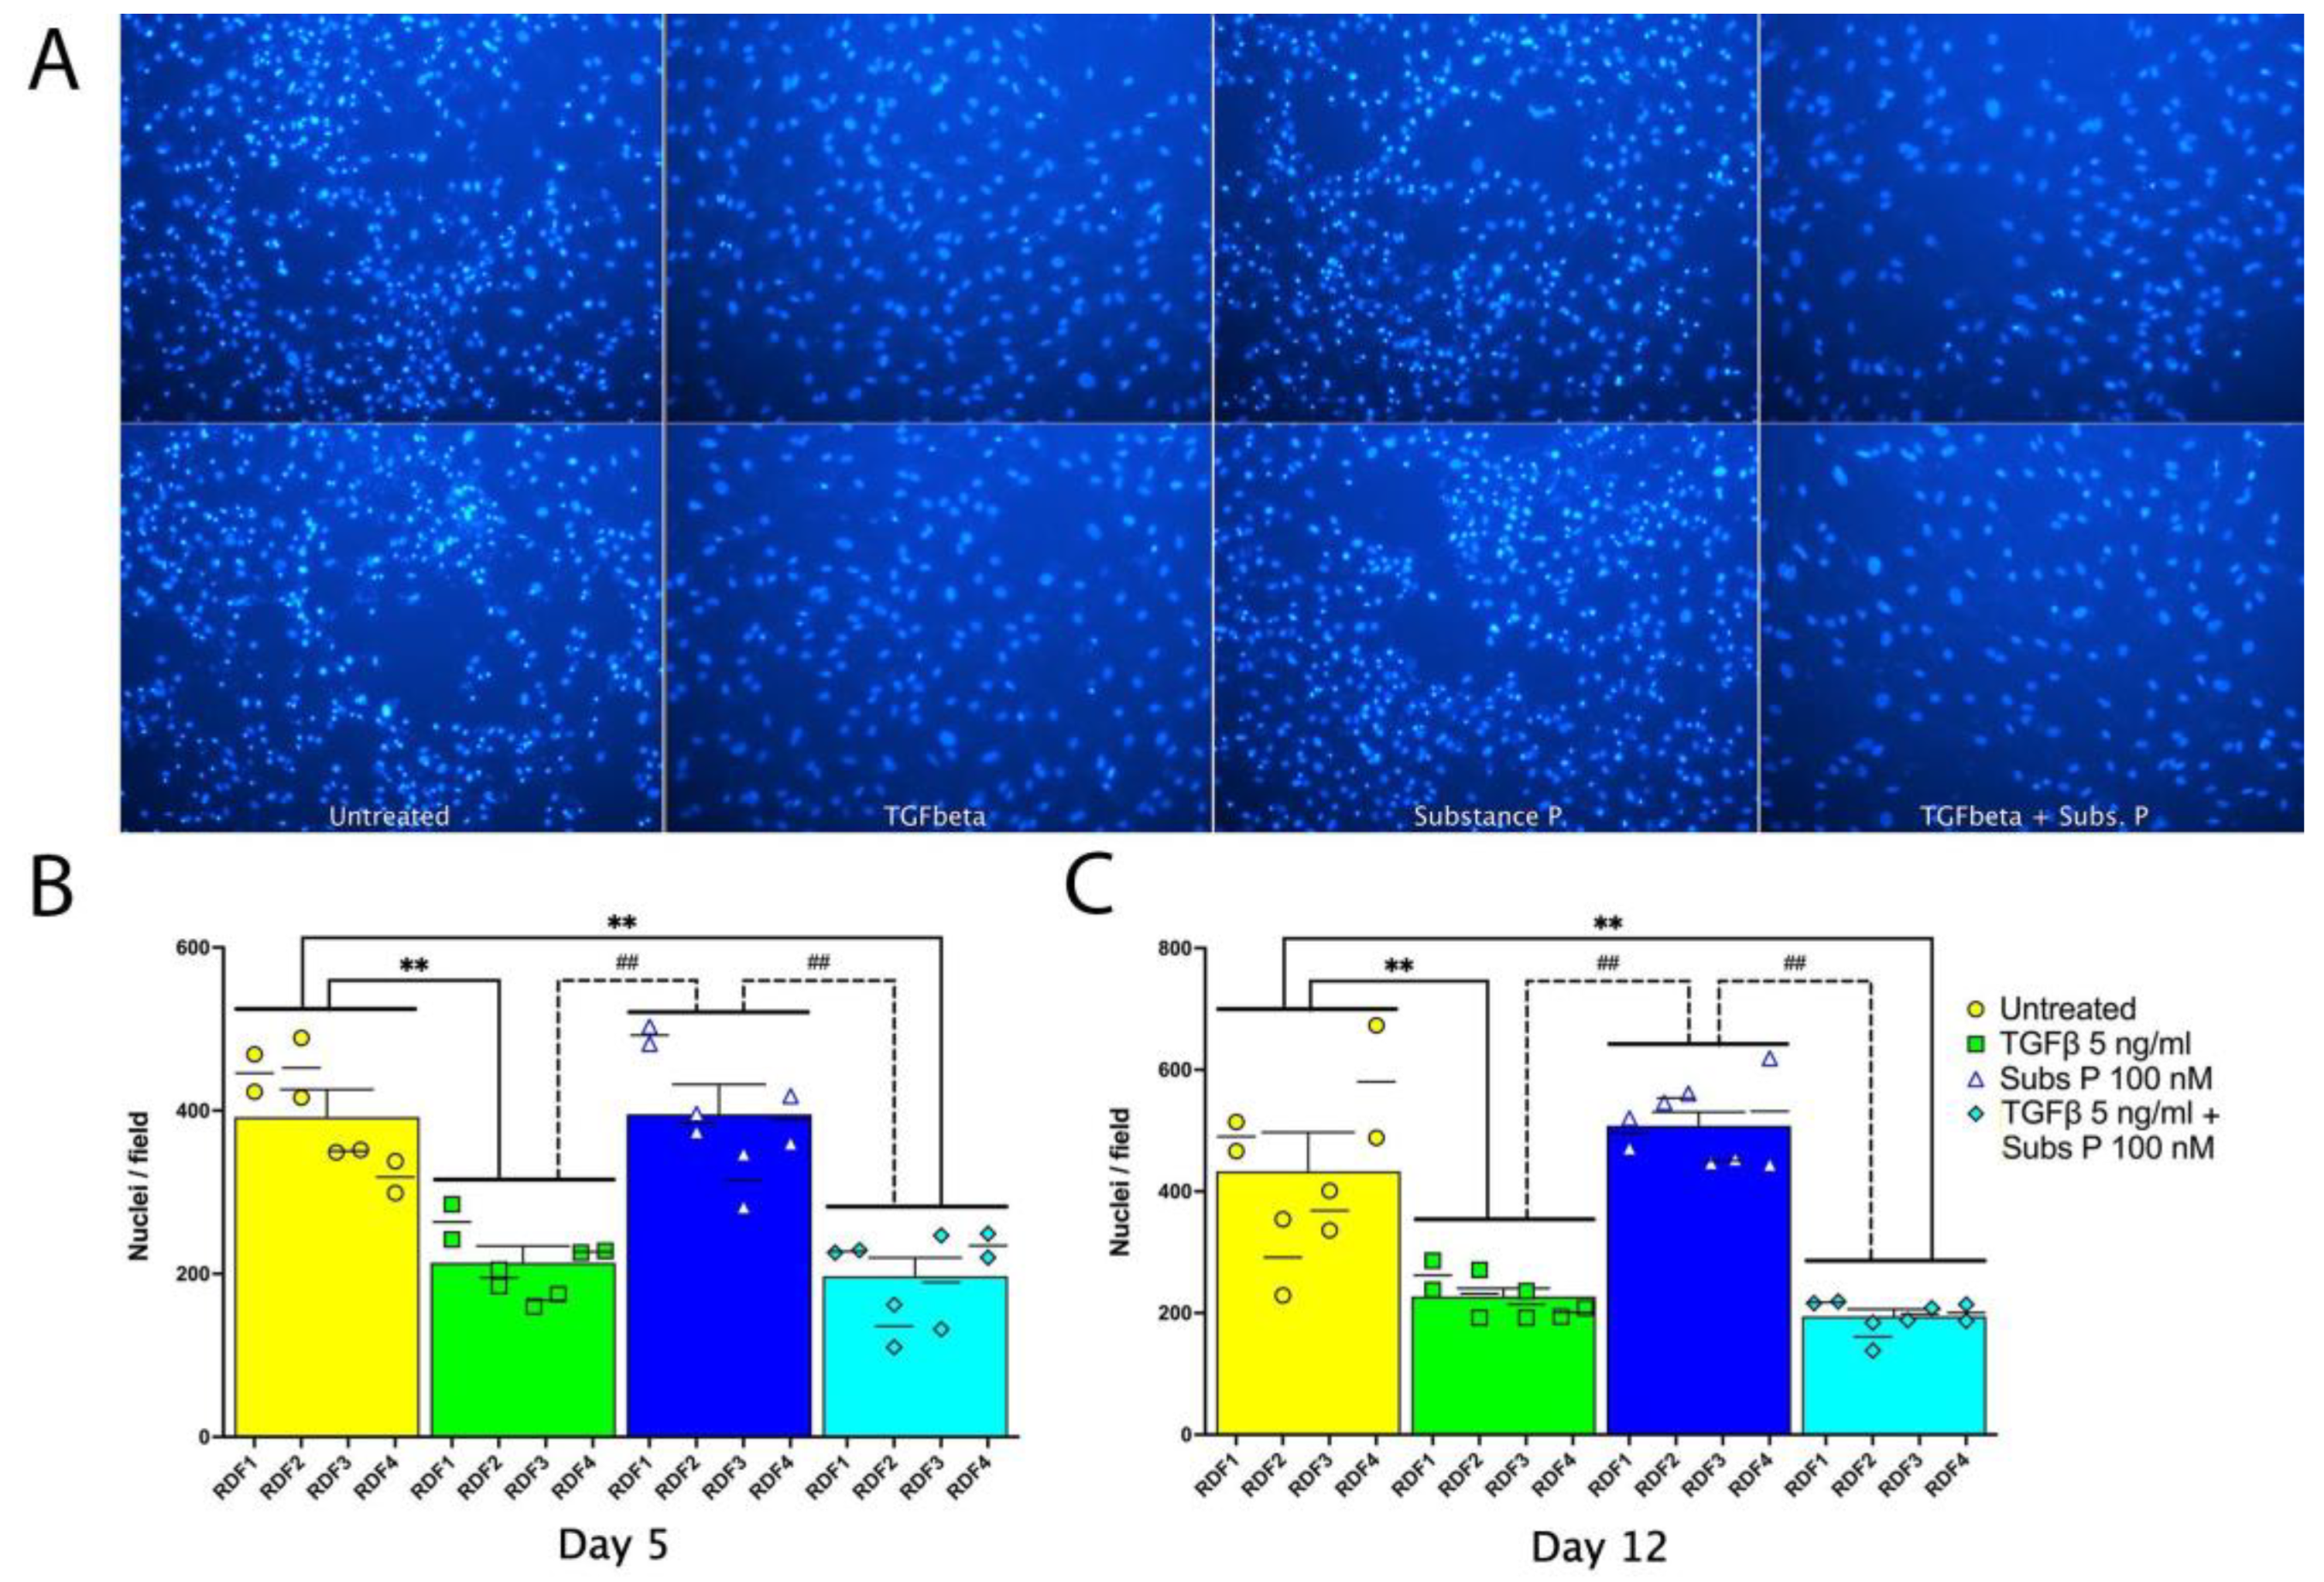
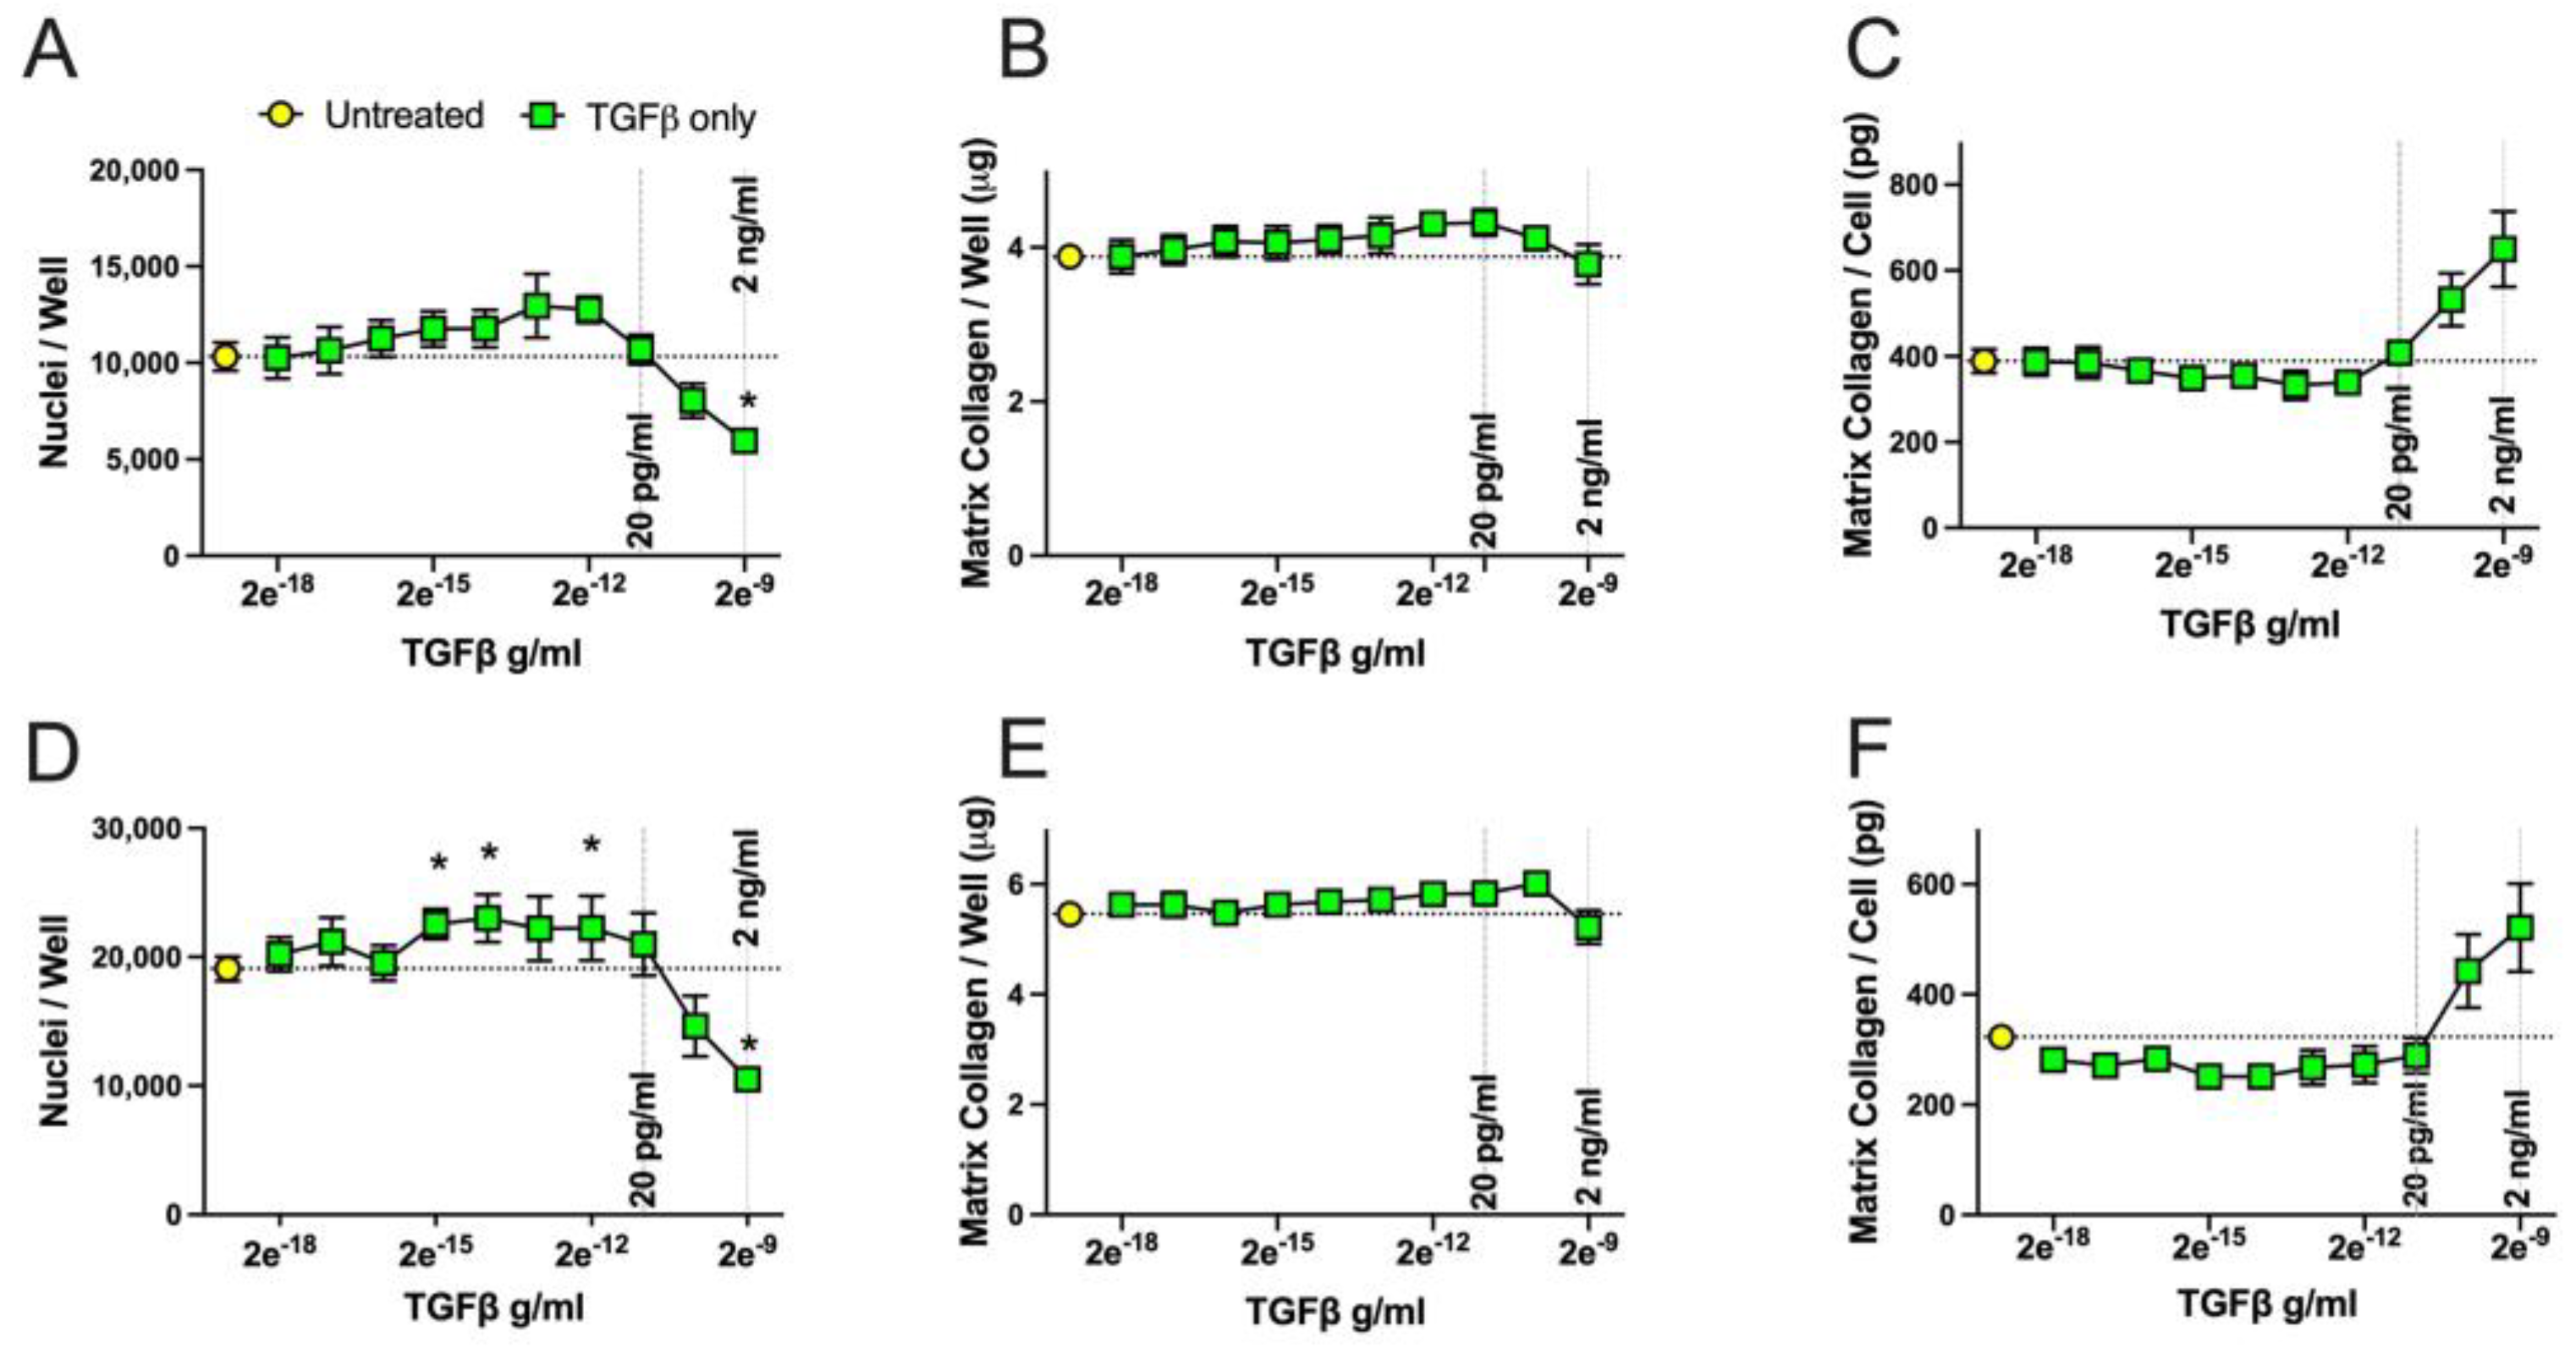
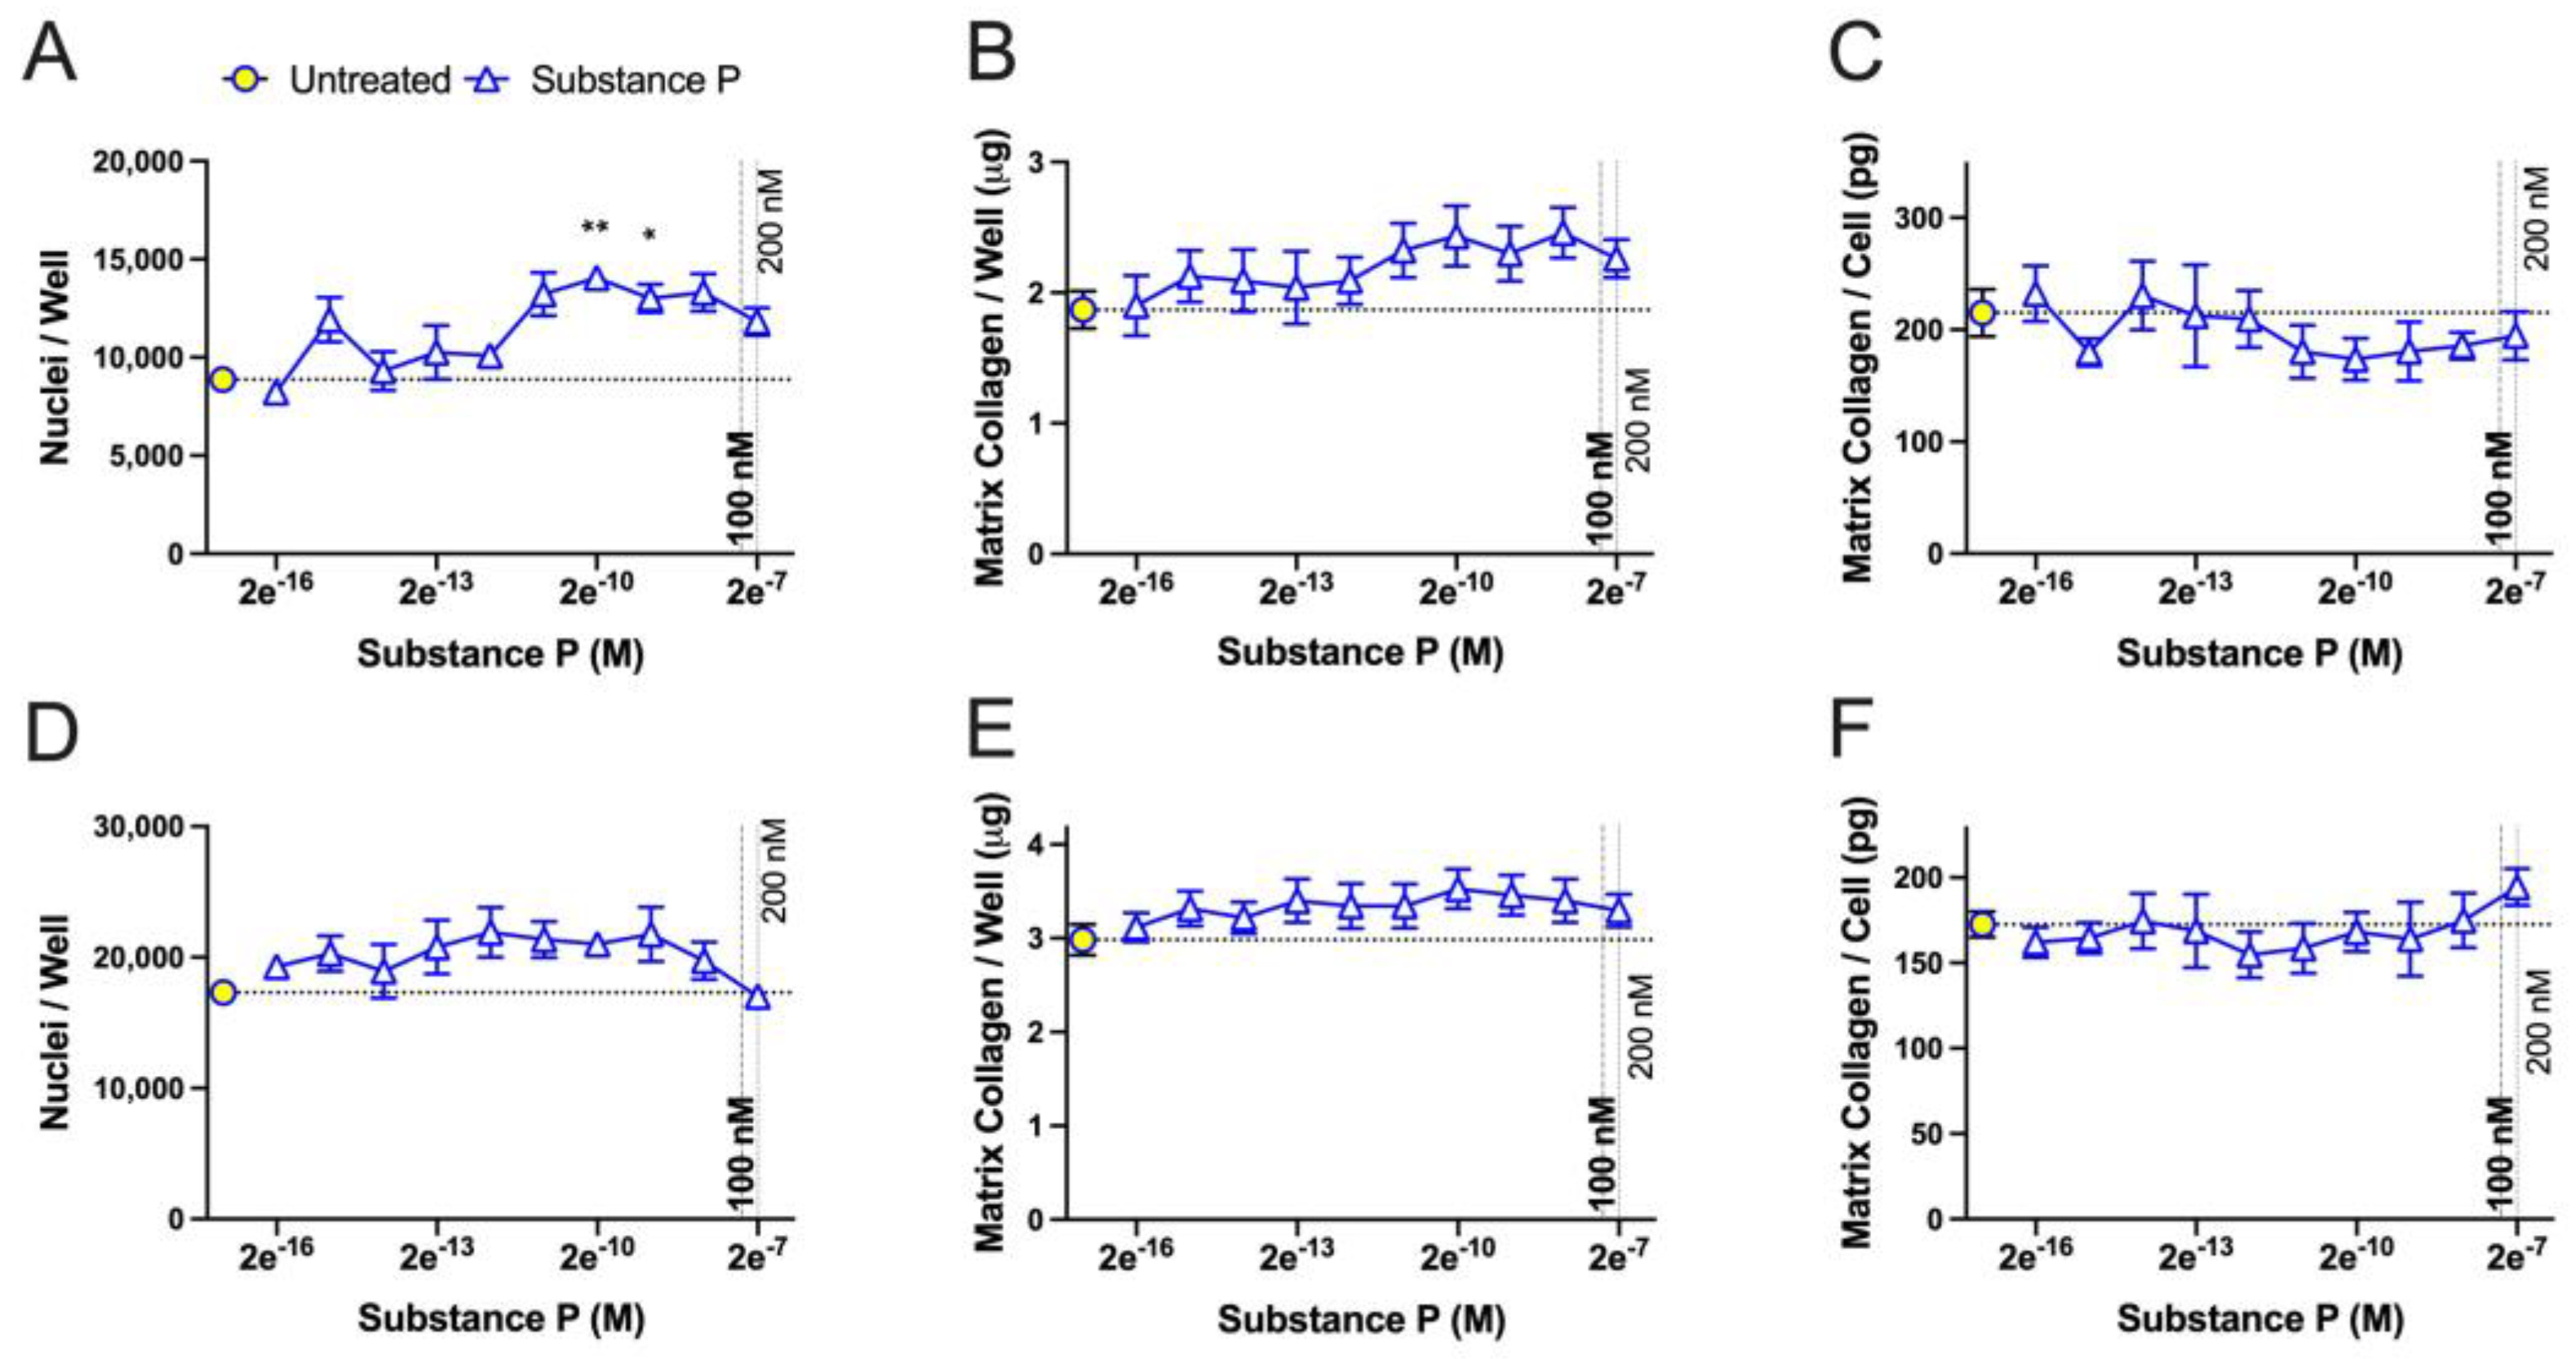
2.1. Proliferation
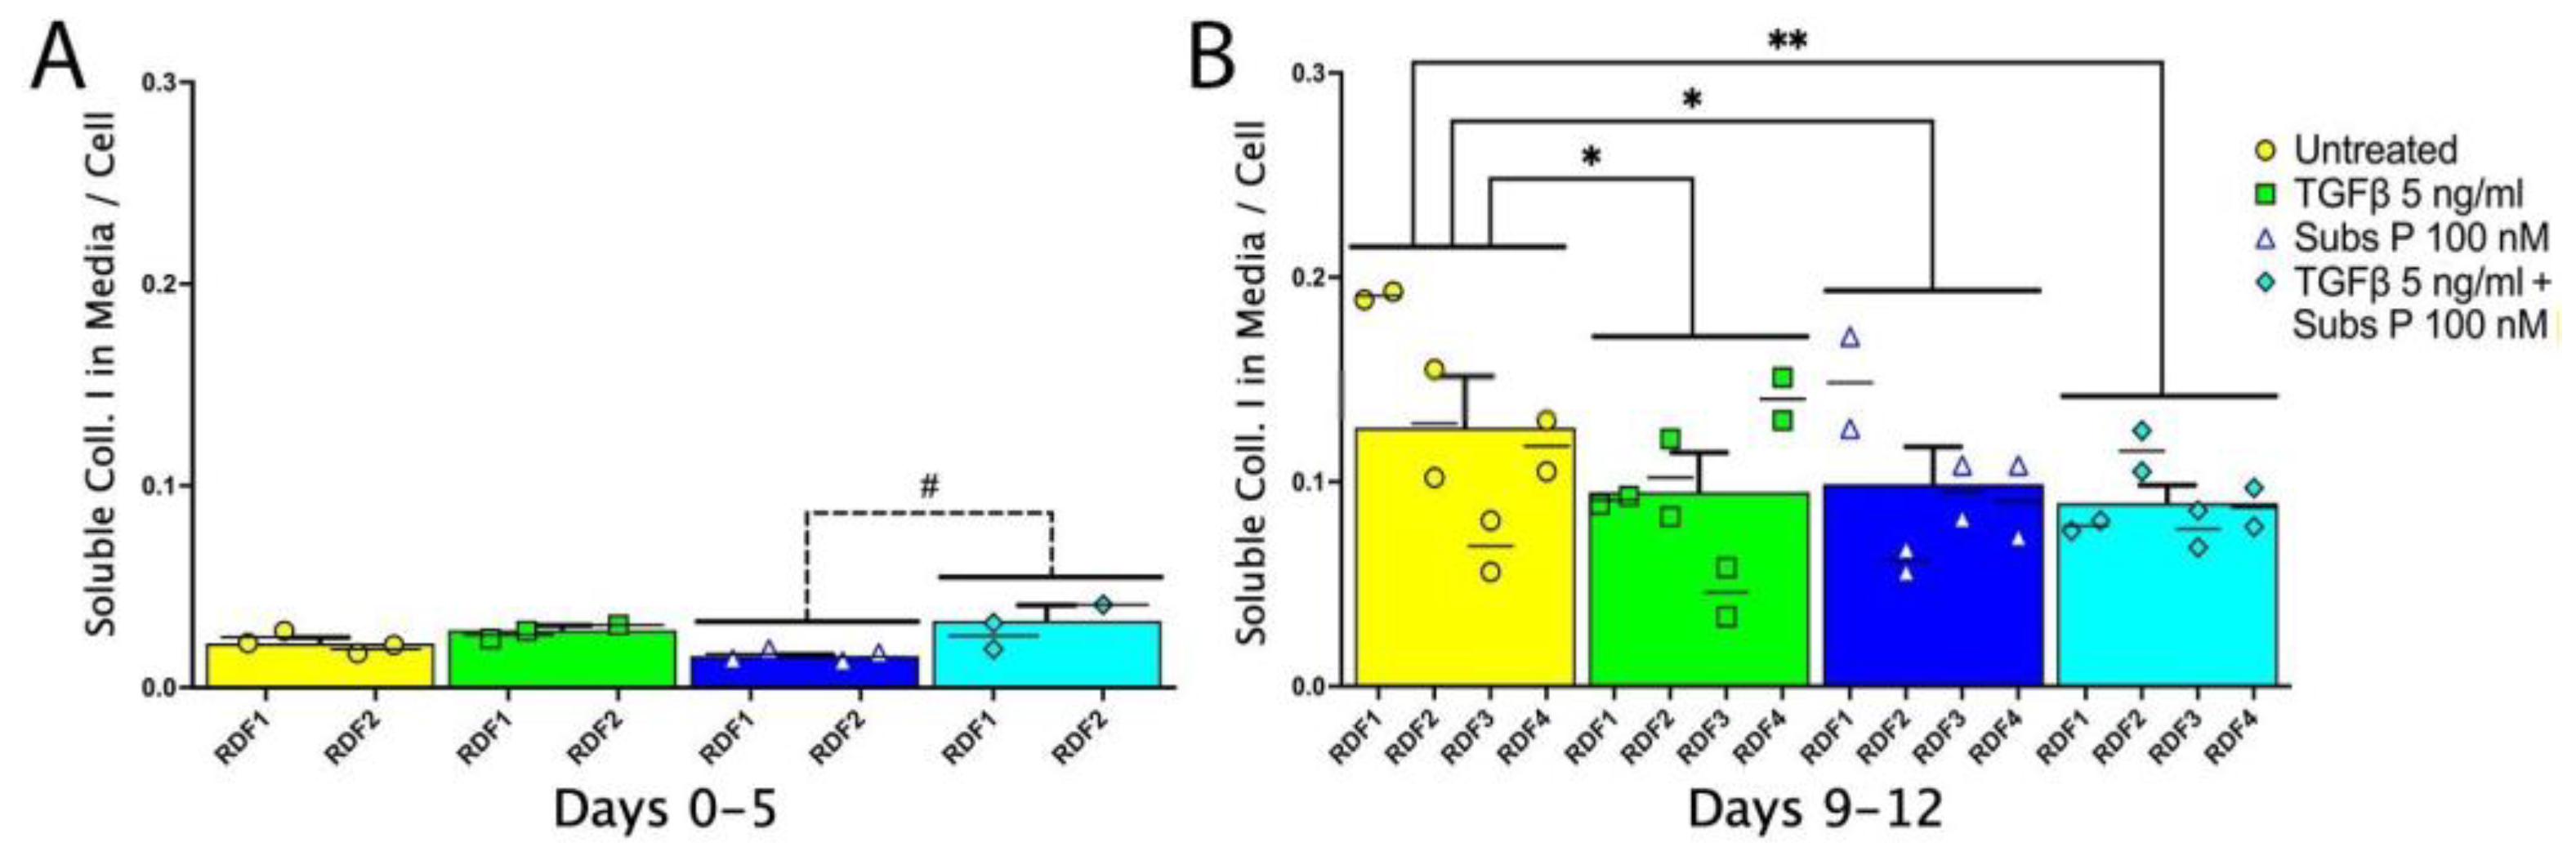
2.2. Soluble Collagen I in Conditioned Medium
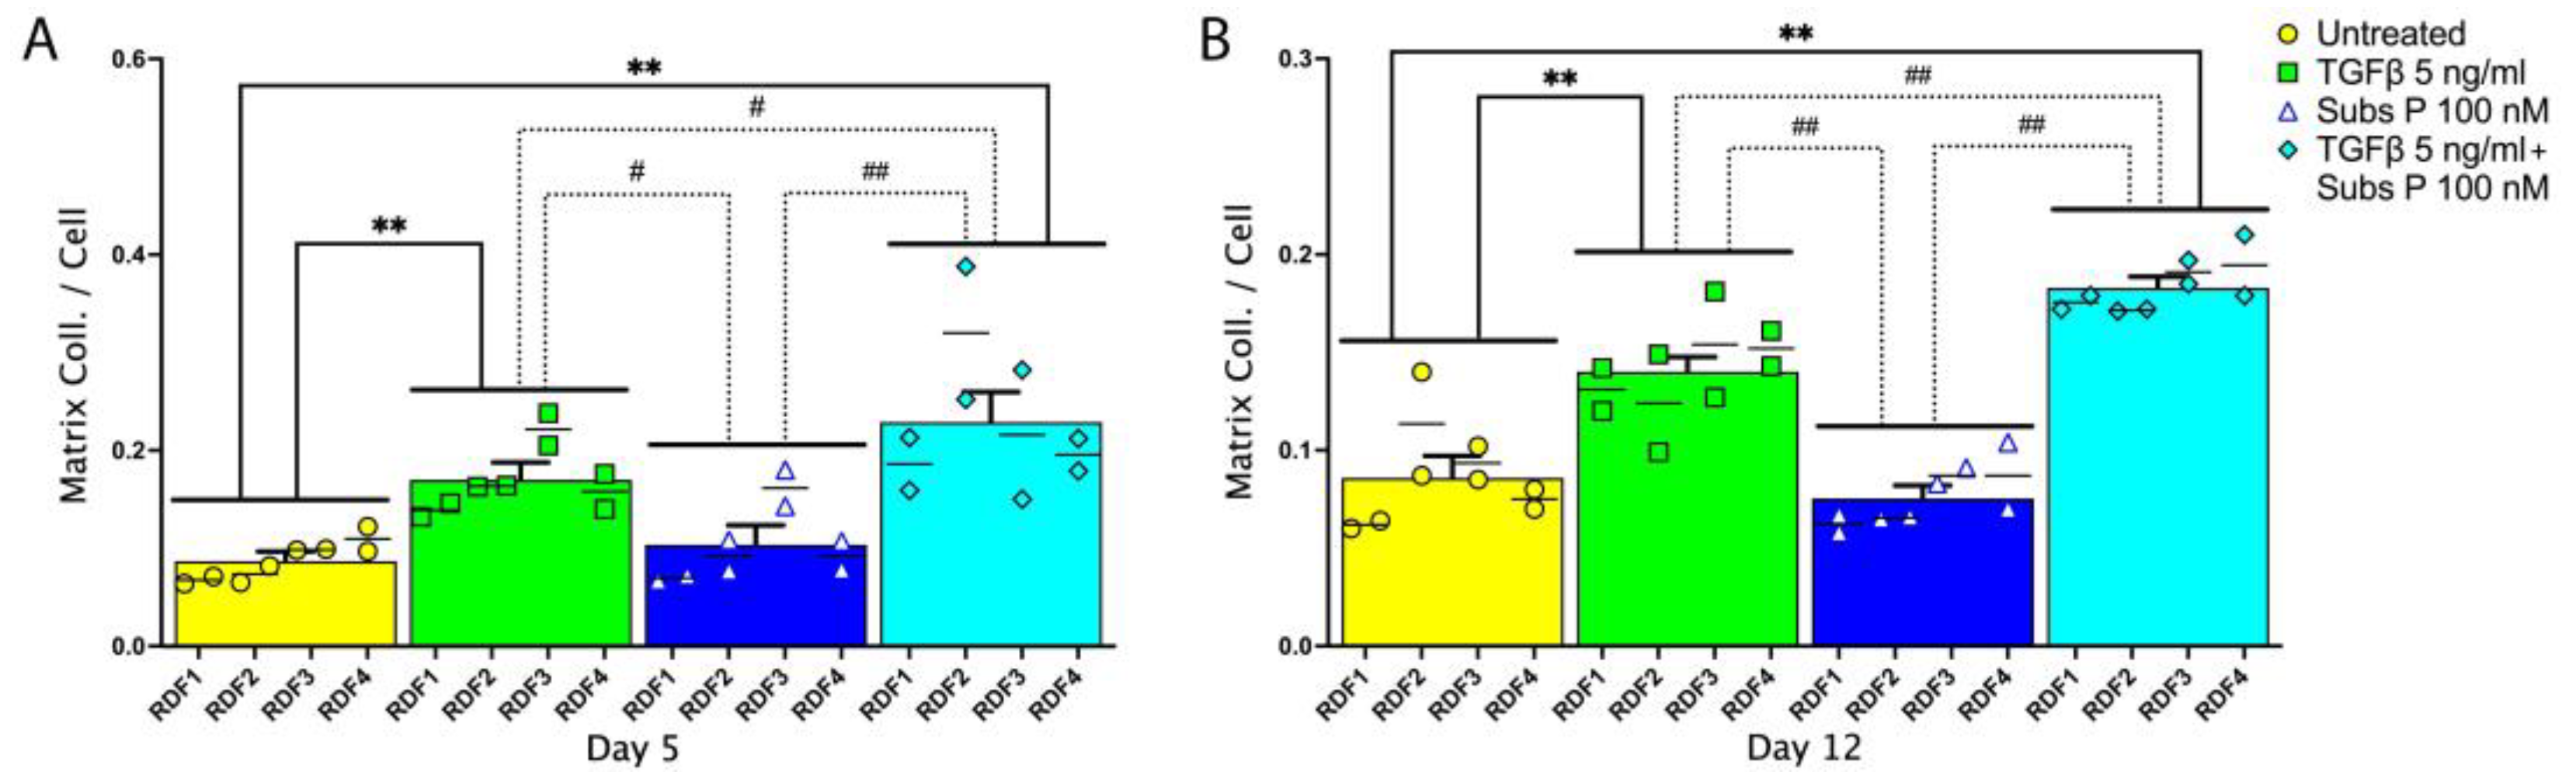
2.3. Matrix Collagen Deposition
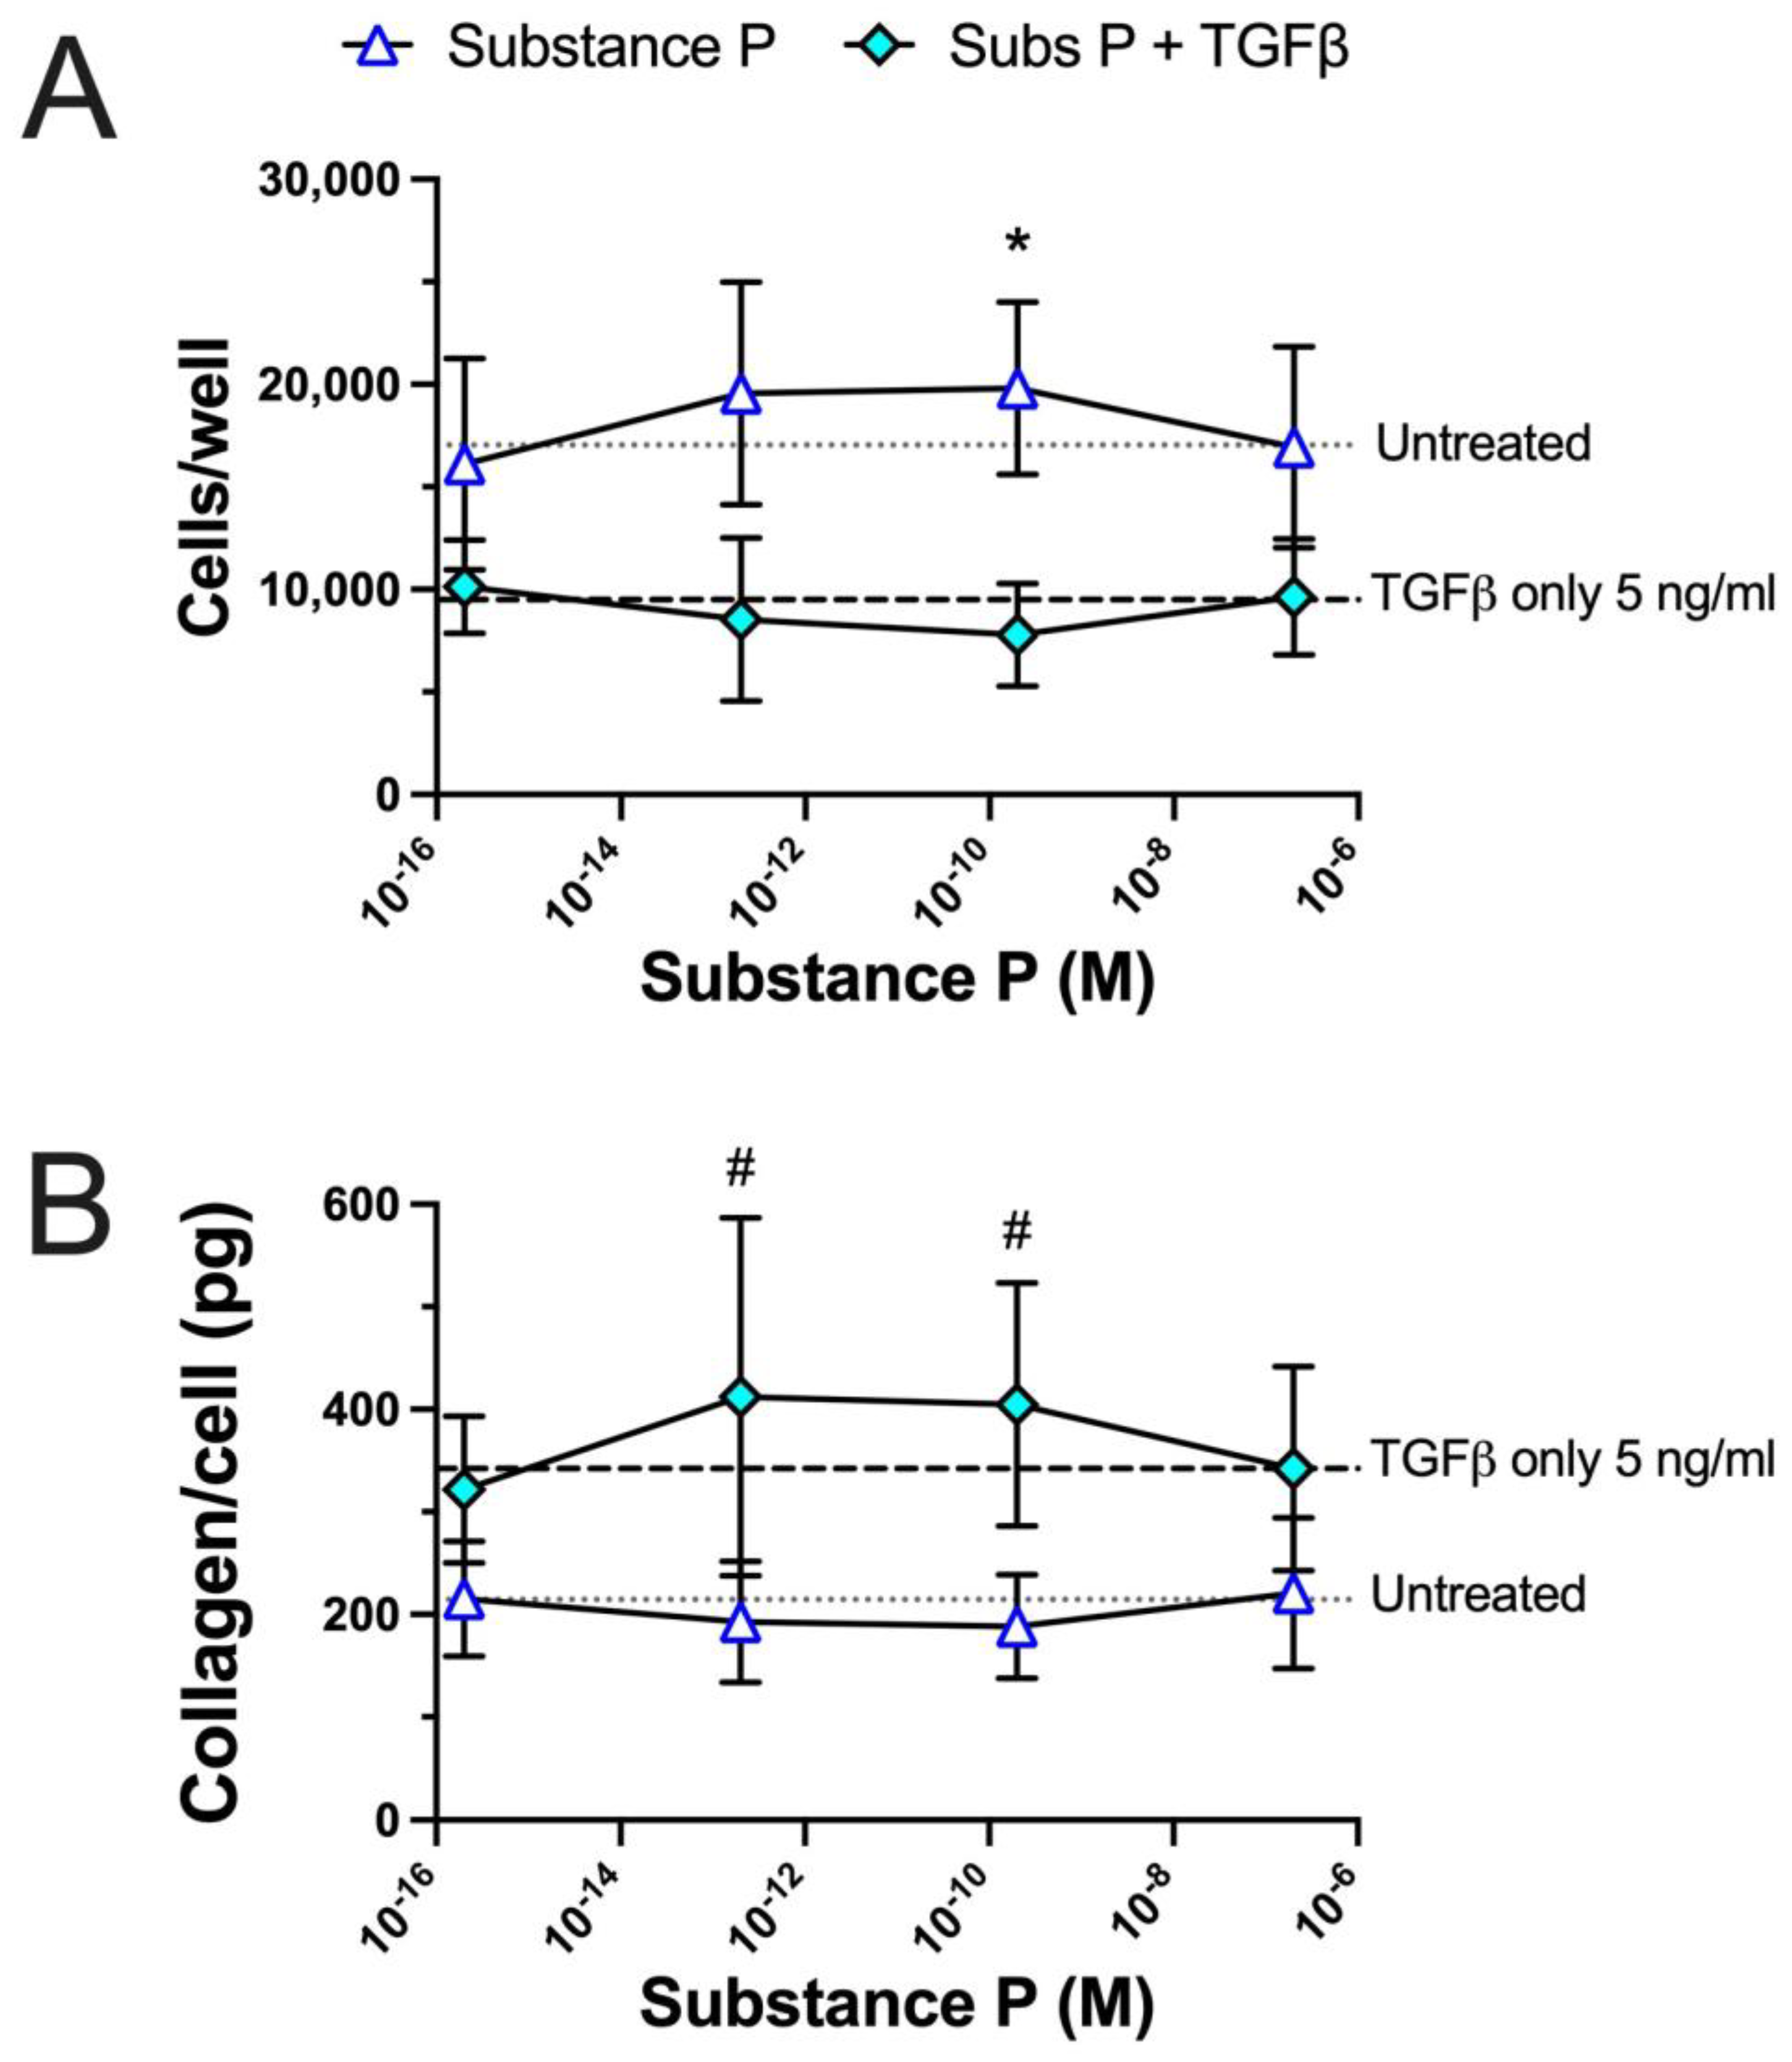
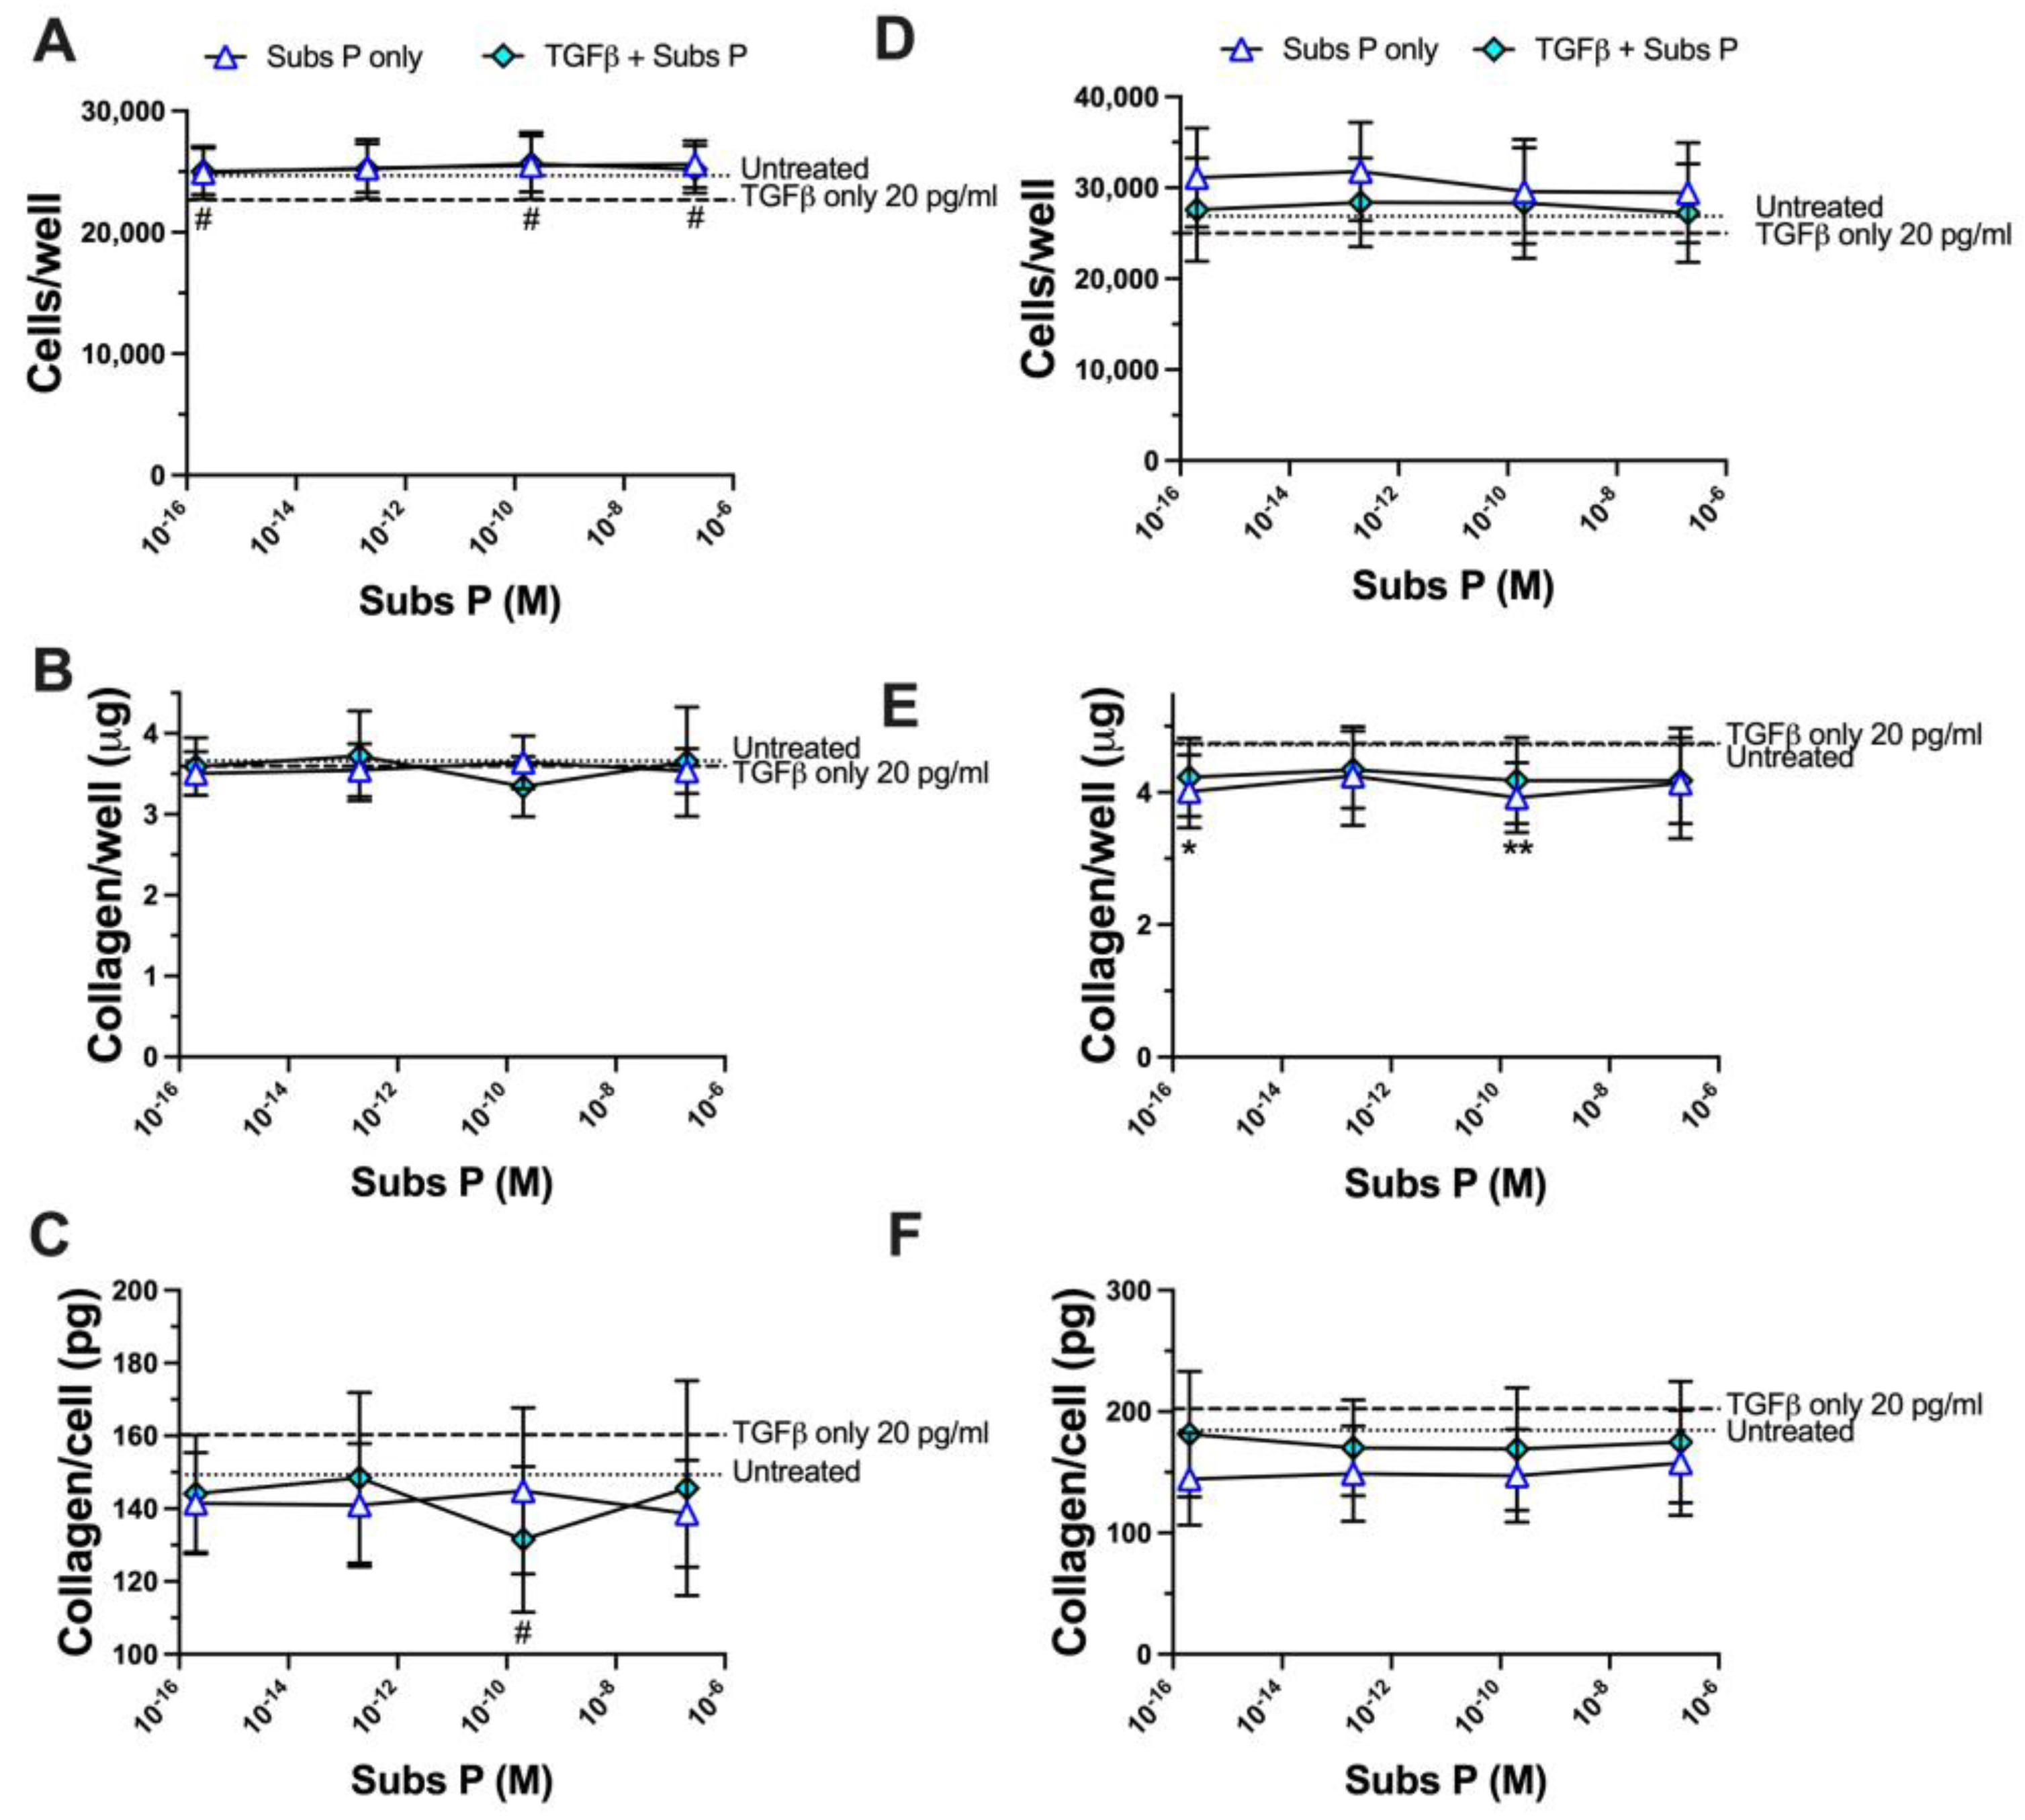
2.4. Concentration-Dependent Effects of TGFβ and Substance P on Fibroblast Cell Numbers
2.5. Substance P Enhances TGFβ-Induced Matrix Collagen Deposition in a Concentration-Dependent Manner
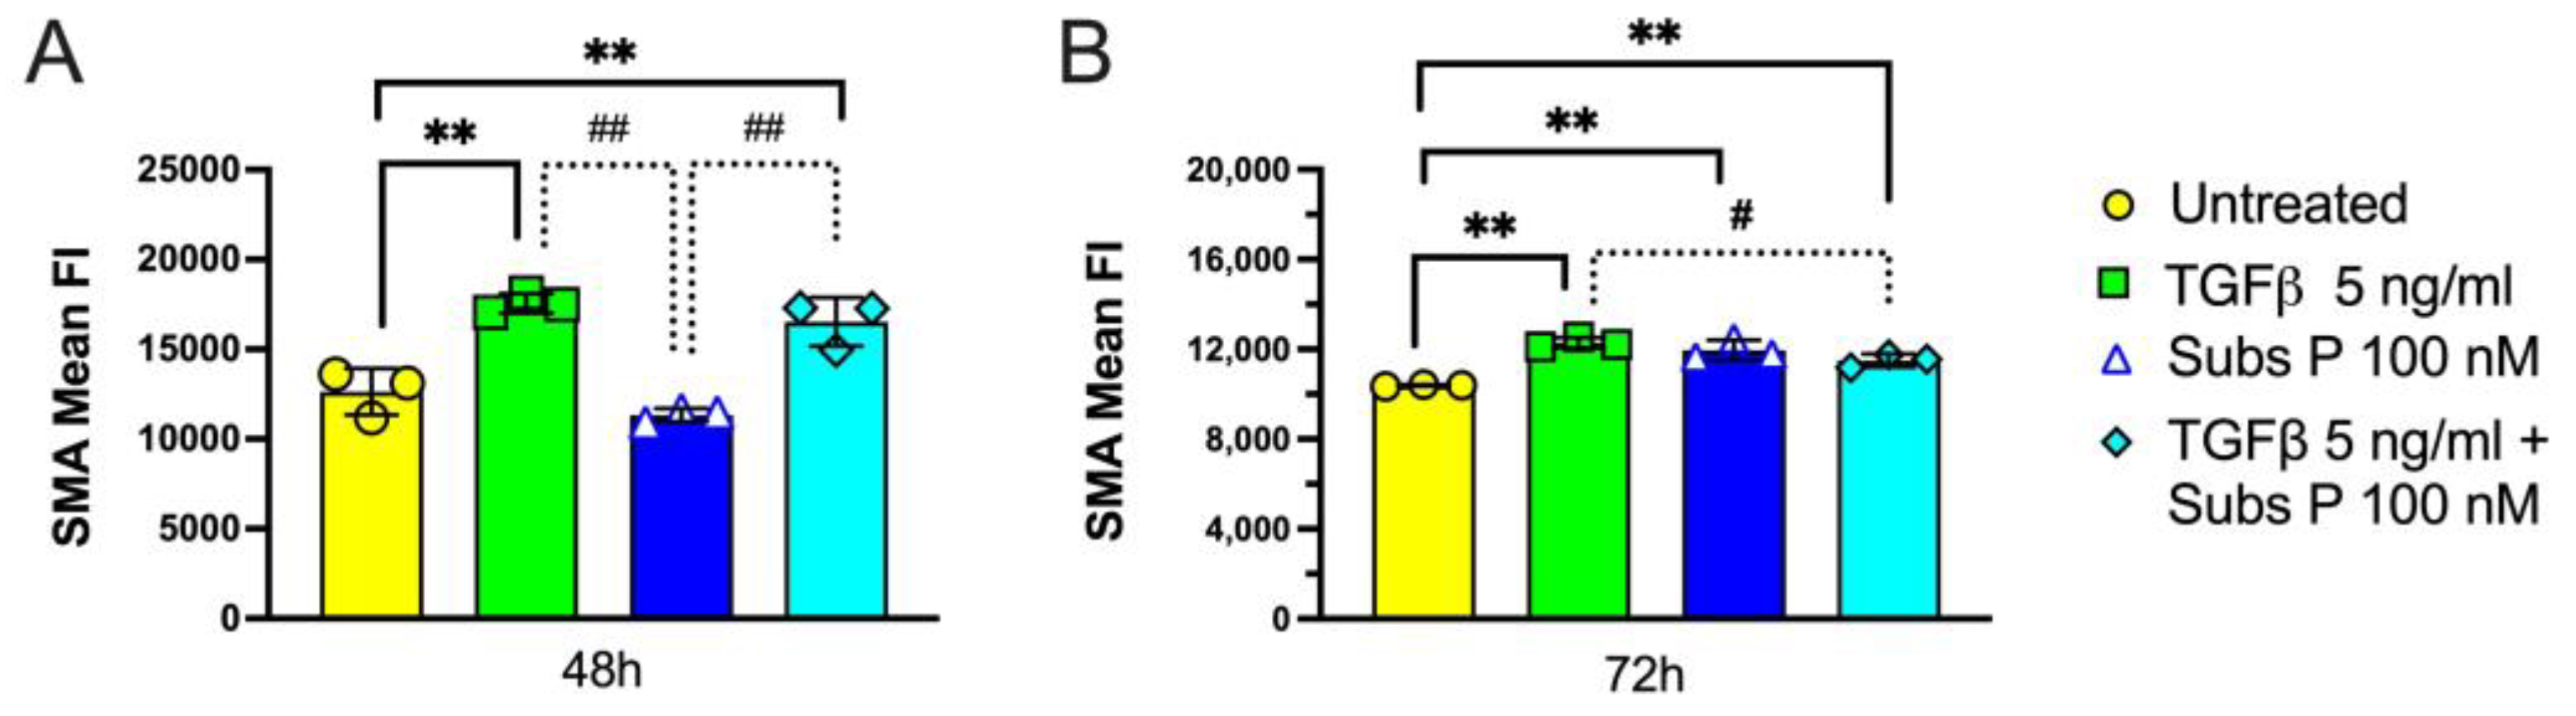
2.6. α-Smooth Muscle Actin Expression
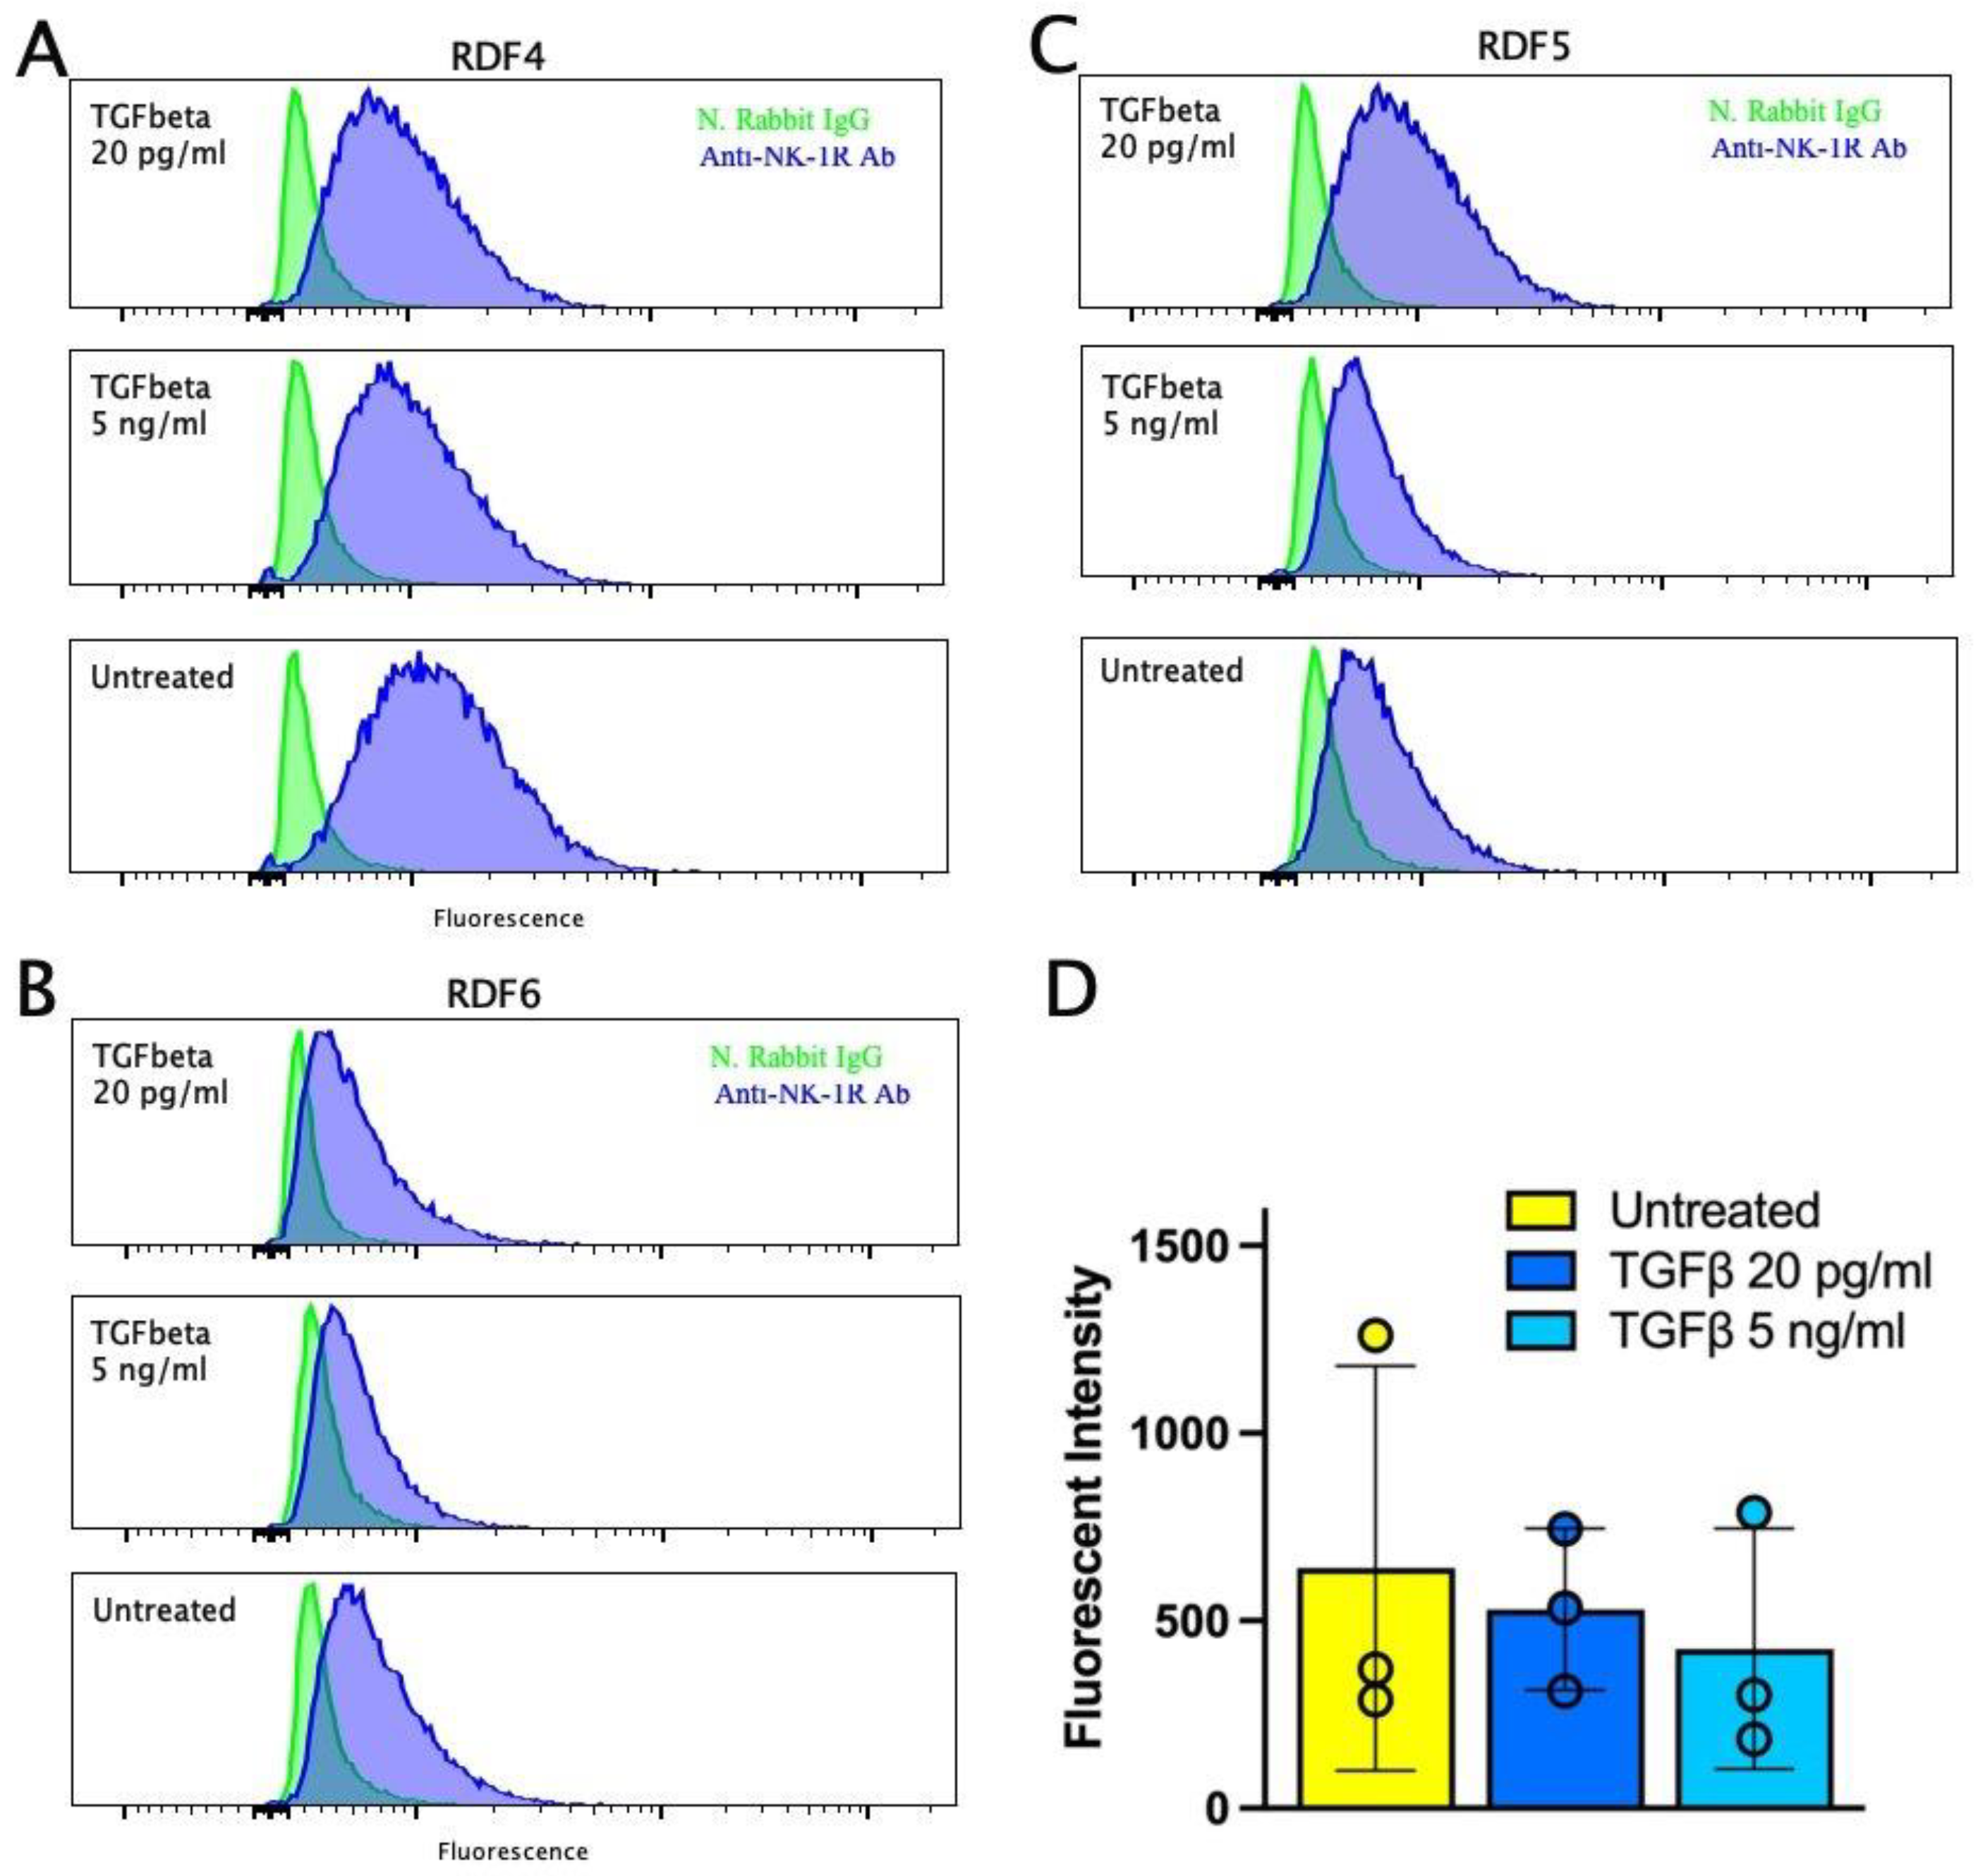
2.7. Expression of Neurokinin-1R in Dermal Fibroblasts
3. Discussion
4. Materials and Methods
4.1. Animals
4.2. Primary Fibroblast Cultures
4.3. Fibroblast Proliferation
4.3.1. Hoechst Live Cell Staining
4.3.2. DAPI Fixed Cell Staining
4.4. Alpha-Smooth Muscle Actin (αSMA) Flow Cytometry
4.5. Collagen I ELISA
4.6. Picrosirius Red Staining and Quantification
4.6.1. Microscopic Quantification
4.6.2. Solubilization of Sirius Red Plate Reader Quantification
4.7. Immunofluorescent Detection of Neurokinin-1R in RDF Cultures
4.7.1. Microscopy
4.7.2. Flow Cytometry
5. Statistics
Supplementary Materials
Author Contributions
Funding
Institutional Review Board Statement
Informed Consent Statement
Data Availability Statement
Conflicts of Interest
References
- Erspamer, V. Biogenic Amines and Active Polypeptides of the Amphibian Skin. Annu. Rev. Pharmacol. 1971, 11, 327–350. [Google Scholar] [CrossRef]
- Carter, M.S.; Krause, J.E. Structure, expression, and some regulatory mechanisms of the rat preprotachykinin gene encoding substance P, neurokinin A, neuropeptide K, and neuropeptide gamma. J. Neurosci. 1990, 10, 2203–2214. [Google Scholar] [CrossRef]
- Steinhoff, M.S.; von Mentzer, B.; Geppetti, P.; Pothoulakis, C.; Bunnett, N.W. Tachykinins and their receptors: Contributions to physiological control and the mechanisms of disease. Physiol. Rev. 2014, 94, 265–301. [Google Scholar] [CrossRef] [PubMed]
- Melendez, G.C.; Kavanagh, K.; Gharraee, N.; Lacy, J.L.; Goslen, K.H.; Block, M.; Whitfield, J.; Widiapradja, A.; Levick, S.P. Replacement substance P reduces cardiac fibrosis in monkeys with type 2 diabetes. Biomed. Pharmacother. 2023, 160, 114365. [Google Scholar] [CrossRef] [PubMed]
- Koon, H.W.; Shih, D.; Karagiannides, I.; Zhao, D.; Fazelbhoy, Z.; Hing, T.; Xu, H.; Lu, B.; Gerard, N.; Pothoulakis, C. Substance P modulates colitis-associated fibrosis. Am. J. Pathol. 2010, 177, 2300–2309. [Google Scholar] [CrossRef] [PubMed]
- Peng, L.; Agogo, G.O.; Guo, J.; Yan, M. Substance P and fibrotic diseases. Neuropeptides 2019, 76, 101941. [Google Scholar] [CrossRef] [PubMed]
- Hua, F.; Wang, H.R.; Bai, Y.F.; Sun, J.P.; Wang, W.S.; Xu, Y.; Zhang, M.S.; Liu, J. Substance P promotes epidural fibrosis via induction of type 2 macrophages. Neural Regen. Res. 2023, 18, 2252–2259. [Google Scholar] [CrossRef] [PubMed]
- Clark, B.D.; Al-Shatti, T.A.; Barr, A.E.; Amin, M.; Barbe, M.F. Performance of a high-repetition, high-force task induces carpal tunnel syndrome in rats. J. Orthop. Sports Phys. Ther. 2004, 34, 244–253. [Google Scholar] [CrossRef]
- Chikenji, T.; Gingery, A.; Zhao, C.; Vanhees, M.; Moriya, T.; Reisdorf, R.; An, K.N.; Amadio, P.C. Transforming growth factor-beta (TGF-beta) expression is increased in the subsynovial connective tissue in a rabbit model of carpal tunnel syndrome. PLoS ONE 2014, 9, e108312. [Google Scholar] [CrossRef]
- Elliott, M.B.; Barr, A.E.; Barbe, M.F. Spinal substance P and neurokinin-1 increase with high repetition reaching. Neurosci. Lett. 2009, 454, 33–37. [Google Scholar] [CrossRef]
- Elliott, M.B.; Barr, A.E.; Kietrys, D.M.; Al-Shatti, T.; Amin, M.; Barbe, M.F. Peripheral neuritis and increased spinal cord neurochemicals are induced in a model of repetitive motion injury with low force and repetition exposure. Brain Res. 2008, 1218, 103–113. [Google Scholar] [CrossRef]
- Fong, G.; Backman, L.J.; Hart, D.A.; Danielson, P.; McCormack, B.; Scott, A. Substance P enhances collagen remodeling and MMP-3 expression by human tenocytes. J. Orthop. Res. 2013, 31, 91–98. [Google Scholar] [CrossRef] [PubMed]
- Backman, L.J.; Fong, G.; Andersson, G.; Scott, A.; Danielson, P. Substance P is a mechanoresponsive, autocrine regulator of human tenocyte proliferation. PLoS ONE 2011, 6, e27209. [Google Scholar] [CrossRef] [PubMed]
- Backman, L.J.; Andersson, G.; Wennstig, G.; Forsgren, S.; Danielson, P. Endogenous substance P production in the Achilles tendon increases with loading in an in vivo model of tendinopathy-peptidergic elevation preceding tendinosis-like tissue changes. J. Musculoskelet. Neuronal Interact. 2011, 11, 133–140. [Google Scholar]
- Andersson, G.; Backman, L.J.; Scott, A.; Lorentzon, R.; Forsgren, S.; Danielson, P. Substance P accelerates hypercellularity and angiogenesis in tendon tissue and enhances paratendinitis in response to Achilles tendon overuse in a tendinopathy model. Br. J. Sports Med. 2011, 45, 1017–1022. [Google Scholar] [CrossRef]
- Fedorczyk, J.M.; Barr, A.E.; Rani, S.; Gao, H.G.; Amin, M.; Amin, S.; Litvin, J.; Barbe, M.F. Exposure-dependent increases in IL-1beta, substance P, CTGF, and tendinosis in flexor digitorum tendons with upper extremity repetitive strain injury. J. Orthop. Res. 2010, 28, 298–307. [Google Scholar] [CrossRef]
- Fisher, P.W.; Zhao, Y.; Rico, M.C.; Massicotte, V.S.; Wade, C.K.; Litvin, J.; Bove, G.M.; Popoff, S.N.; Barbe, M.F. Increased CCN2, substance P and tissue fibrosis are associated with sensorimotor declines in a rat model of repetitive overuse injury. J. Cell Commun. Signal 2015, 9, 37–54. [Google Scholar] [CrossRef] [PubMed]
- Andersson, G.; Danielson, P.; Alfredson, H.; Forsgren, S. Presence of substance P and the neurokinin-1 receptor in tenocytes of the human Achilles tendon. Regul. Pept. 2008, 150, 81–87. [Google Scholar] [CrossRef]
- Frara, N.; Fisher, P.W.; Zhao, Y.; Tarr, J.T.; Amin, M.; Popoff, S.N.; Barbe, M.F. Substance P increases CCN2 dependent on TGF-beta yet Collagen Type I via TGF-beta1 dependent and independent pathways in tenocytes. Connect. Tissue Res. 2018, 59, 30–44. [Google Scholar] [CrossRef]
- Han, S.H.; Choi, W.; Song, J.; Kim, J.; Lee, S.; Choi, Y.; Byun, S.E.; Ahn, T.; Ahn, H.; Ding, C.; et al. The Implication of Substance P in the Development of Tendinopathy: A Case Control Study. Int. J. Mol. Sci. 2017, 18, 1241. [Google Scholar] [CrossRef]
- Ackermann, P.W.; Li, J.; Lundeberg, T.; Kreicbergs, A. Neuronal plasticity in relation to nociception and healing of rat achilles tendon. J. Orthop. Res. 2003, 21, 432–441. [Google Scholar] [CrossRef] [PubMed]
- Burssens, P.; Steyaert, A.; Forsyth, R.; van Ovost, E.J.; Depaepe, Y.; Verdonk, R. Exogenously administered substance P and neutral endopeptidase inhibitors stimulate fibroblast proliferation, angiogenesis and collagen organization during Achilles tendon healing. Foot Ankle Int. 2005, 26, 832–839. [Google Scholar] [CrossRef] [PubMed]
- Steyaert, A.; Burssens, P.; Forsyth, R.; Vanderstraeten, G. Qualitative analysis of substance P, NK1-receptor and nerve ingrowth in substance P-treated ruptured rat Achilles tendon. Acta Orthop. Belg. 2010, 76, 387–395. [Google Scholar] [PubMed]
- Ko, K.R.; Lee, H.; Han, S.H.; Ahn, W.; Kim, D.K.; Kim, I.S.; Jung, B.S.; Lee, S. Substance P, A Promising Therapeutic Target in Musculoskeletal Disorders. Int. J. Mol. Sci. 2022, 23, 2583. [Google Scholar] [CrossRef] [PubMed]
- Barbe, M.F.; Hilliard, B.A.; Fisher, P.W.; White, A.R.; Delany, S.P.; Iannarone, V.J.; Harris, M.Y.; Amin, M.; Cruz, G.E.; Popoff, S.N. Blocking substance P signaling reduces musculotendinous and dermal fibrosis and sensorimotor declines in a rat model of overuse injury. Connect. Tissue Res. 2020, 61, 604–619. [Google Scholar] [CrossRef] [PubMed]
- Liu, J.Y.; Hu, J.H.; Zhu, Q.G.; Li, F.Q.; Sun, H.J. Substance P receptor expression in human skin keratinocytes and fibroblasts. Br. J. Dermatol. 2006, 155, 657–662. [Google Scholar] [CrossRef] [PubMed]
- Bae, S.J.; Matsunaga, Y.; Takenaka, M.; Tanaka, Y.; Hamazaki, Y.; Shimizu, K.; Katayama, I. Substance P induced preprotachykinin-a mRNA, neutral endopeptidase mRNA and substance P in cultured normal fibroblasts. Int. Arch. Allergy Immunol. 2002, 127, 316–321. [Google Scholar] [CrossRef]
- Parenti, A.; Amerini, S.; Ledda, F.; Maggi, C.A.; Ziche, M. The tachykinin NK1 receptor mediates the migration-promoting effect of substance P on human skin fibroblasts in culture. Naunyn-Schmiedeberg’s Arch. Pharmacol. 1996, 353, 475–481. [Google Scholar] [CrossRef]
- Hu, D.; Chen, B.; Zhu, X.; Tao, K.; Tang, C.; Wang, J. Substance P up-regulates the TGF-beta 1 mRNA expression of human dermal fibroblasts in vitro. Zhonghua Zheng Xing Wai Ke Za Zhi 2002, 18, 234–236. [Google Scholar]
- Roberts, A.B.; Sporn, M.B.; Assoian, R.K.; Smith, J.M.; Roche, N.S.; Wakefield, L.M.; Heine, U.I.; Liotta, L.A.; Falanga, V.; Kehrl, J.H. Transforming growth factor type beta: Rapid induction of fibrosis and angiogenesis in vivo and stimulation of collagen formation in vitro. Proc. Natl. Acad. Sci. USA 1986, 83, 4167–4171. [Google Scholar] [CrossRef]
- Schneider, C.A.; Rasband, W.S.; Eliceiri, K.W. NIH Image to ImageJ: 25 years of image analysis. Nat. Methods 2012, 9, 671–675. [Google Scholar] [CrossRef]
- Ignotz, R.A.; Endo, T.; Massague, J. Regulation of fibronectin and type I collagen mRNA levels by transforming growth factor-beta. J. Biol. Chem. 1987, 262, 6443–6446. [Google Scholar] [CrossRef]
- Ismaeel, A.; Kim, J.S.; Kirk, J.S.; Smith, R.S.; Bohannon, W.T.; Koutakis, P. Role of Transforming Growth Factor-β in Skeletal Muscle Fibrosis: A Review. Int. J. Mol. Sci. 2019, 20, 2446. [Google Scholar] [CrossRef] [PubMed]
- Varga, J.; Rosenbloom, J.; Jimenez, S.A. Transforming growth factor beta (TGF beta) causes a persistent increase in steady-state amounts of type I and type III collagen and fibronectin mRNAs in normal human dermal fibroblasts. Biochem. J. 1987, 247, 597–604. [Google Scholar] [CrossRef] [PubMed]
- Junquiera, L.C.; Junqueira, L.C.; Brentani, R.R. A simple and sensitive method for the quantitative estimation of collagen. Anal. Biochem. 1979, 94, 96–99. [Google Scholar] [CrossRef] [PubMed]
- Tomasek, J.J.; Gabbiani, G.; Hinz, B.; Chaponnier, C.; Brown, R.A. Myofibroblasts and mechano-regulation of connective tissue remodelling. Nat. Rev. Mol. Cell Biol. 2002, 3, 349–363. [Google Scholar] [CrossRef] [PubMed]
- Battegay, E.J.; Raines, E.W.; Seifert, R.A.; Bowen-Pope, D.F.; Ross, R. TGF-beta induces bimodal proliferation of connective tissue cells via complex control of an autocrine PDGF loop. Cell 1990, 63, 515–524. [Google Scholar] [CrossRef] [PubMed]
- de Larco, J.E.; Todaro, G.J. Growth factors from murine sarcoma virus-transformed cells. Proc. Natl. Acad. Sci. USA 1978, 75, 4001–4005. [Google Scholar] [CrossRef] [PubMed]
- Roberts, A.B.; Lamb, L.C.; Newton, D.L.; Sporn, M.B.; De Larco, J.E.; Todaro, G.J. Transforming growth factors: Isolation of polypeptides from virally and chemically transformed cells by acid/ethanol extraction. Proc. Natl. Acad. Sci. USA 1980, 77, 3494–3498. [Google Scholar] [CrossRef]
- Roberts, A.B.; Anzano, M.A.; Lamb, L.C.; Smith, J.M.; Sporn, M.B. New class of transforming growth factors potentiated by epidermal growth factor: Isolation from non-neoplastic tissues. Proc. Natl. Acad. Sci. USA 1981, 78, 5339–5343. [Google Scholar] [CrossRef]
- Tucker, R.F.; Shipley, G.D.; Moses, H.L.; Holley, R.W. Growth inhibitor from BSC-1 cells closely related to platelet type beta transforming growth factor. Science 1984, 226, 705–707. [Google Scholar] [CrossRef] [PubMed]
- Thornton, S.C.; Por, S.B.; Walsh, B.J.; Penny, R.; Breit, S.N. Interaction of immune and connective tissue cells: I. The effect of lymphokines and monokines on fibroblast growth. J. Leukoc. Biol. 1990, 47, 312–320. [Google Scholar] [CrossRef] [PubMed]
- Desmoulière, A.; Geinoz, A.; Gabbiani, F.; Gabbiani, G. Transforming growth factor-beta 1 induces alpha-smooth muscle actin expression in granulation tissue myofibroblasts and in quiescent and growing cultured fibroblasts. J. Cell Biol. 1993, 122, 103–111. [Google Scholar] [CrossRef] [PubMed]
- Ignotz, R.A.; Massague, J. Transforming growth factor-beta stimulates the expression of fibronectin and collagen and their incorporation into the extracellular matrix. J. Biol. Chem. 1986, 261, 4337–4345. [Google Scholar] [CrossRef] [PubMed]
- Raghow, R.; Lurie, S.; Seyer, J.M.; Kang, A.H. Profiles of steady state levels of messenger RNAs coding for type I procollagen, elastin, and fibronectin in hamster lungs undergoing bleomycin-induced interstitial pulmonary fibrosis. J. Clin. Invest. 1985, 76, 1733–1739. [Google Scholar] [CrossRef] [PubMed]
- Hoyt, D.G.; Lazo, J.S. Alterations in pulmonary mRNA encoding procollagens, fibronectin and transforming growth factor-beta precede bleomycin-induced pulmonary fibrosis in mice. J. Pharmacol. Exp. Ther. 1988, 246, 765–771. [Google Scholar]
- Sanderson, N.; Factor, V.; Nagy, P.; Kopp, J.; Kondaiah, P.; Wakefield, L.; Roberts, A.B.; Sporn, M.B.; Thorgeirsson, S.S. Hepatic expression of mature transforming growth factor beta 1 in transgenic mice results in multiple tissue lesions. Proc. Natl. Acad. Sci. USA 1995, 92, 2572–2576. [Google Scholar] [CrossRef]
- Mizuno, S.; Matsumoto, K.; Kurosawa, T.; Mizuno-Horikawa, Y.; Nakamura, T. Reciprocal balance of hepatocyte growth factor and transforming growth factor-beta 1 in renal fibrosis in mice. Kidney Int. 2000, 57, 937–948. [Google Scholar] [CrossRef]
- Powell, D.W.; Mifflin, R.C.; Valentich, J.D.; Crowe, S.E.; Saada, J.I.; West, A.B. Myofibroblasts. I. Paracrine cells important in health and disease. Am. J. Physiol. 1999, 277, C1–C19. [Google Scholar] [CrossRef]
- Tarbit, E.; Singh, I.; Peart, J.N.; Rose’Meyer, R.B. Biomarkers for the identification of cardiac fibroblast and myofibroblast cells. Heart Fail. Rev. 2019, 24, 1–15. [Google Scholar] [CrossRef] [PubMed]
- Rubbia-Brandt, L.; Sappino, A.P.; Gabbiani, G. Locally applied GM-CSF induces the accumulation of alpha-smooth muscle actin containing myofibroblasts. Virchows Arch. B Cell Pathol. Incl. Mol. Pathol. 1991, 60, 73–82. [Google Scholar] [CrossRef] [PubMed]
- Seluanov, A.; Vaidya, A.; Gorbunova, V. Establishing primary adult fibroblast cultures from rodents. J. Vis. Exp. 2010, 44, e2033. [Google Scholar] [CrossRef]
- Gasparri, F.; Mariani, M.; Sola, F.; Galvani, A. Quantification of the proliferation index of human dermal fibroblast cultures with the ArrayScan high-content screening reader. J. Biomol. Screen. 2004, 9, 232–243. [Google Scholar] [CrossRef]
- Puchtler, H.; Waldrop, F.S.; Valentine, L.S. Polarization microscopic studies of connective tissue stained with picro-sirius red FBA. Beitr. Pathol. 1973, 150, 174–187. [Google Scholar] [CrossRef]
- Junqueira, L.C.; Bignolas, G.; Brentani, R.R. Picrosirius staining plus polarization microscopy, a specific method for collagen detection in tissue sections. Histochem. J. 1979, 11, 447–455. [Google Scholar] [CrossRef] [PubMed]


| Source of Variation | % of Total Variation | p Value | p Value Summary | ||
|---|---|---|---|---|---|
| Cell Cultures | 4.512 | 0.0430 | * | ||
| Substance P (100 nM) | 0.4827 | 0.3106 | ns | ||
| TGFβ (5 ng/mL) | 73.23 | <0.0001 | ** | ||
| Cell Cultures × Substance P (100 nM) | 2.573 | 0.1626 | ns | ||
| Cell Cultures × TGFβ (5 ng/mL) | 3.666 | 0.0751 | ns | ||
| Substance P (100 nM) × TGFβ (5 ng/mL) | 3.165 | 0.0164 | * | ||
| Cell Cultures x Substance P (100 nM) × TGFβ (5 ng/mL) | 5.329 | 0.0259 | * | ||
| ANOVA table | SS | DF | MS | F (DFn, DFd) | p value |
| Cell Cultures | 33,177 | 3 | 11,059 | F (3, 16) = 3.416 | p = 0.0430 |
| Substance P (100 nM) | 3549 | 1 | 3549 | F (1, 16) = 1.096 | p = 0.3106 |
| TGFβ (5 ng/mL) | 538,463 | 1 | 538,463 | F (1, 16) = 166.3 | p < 0.0001 |
| Cell Cultures × Substance P (100 nM) | 18,918 | 3 | 6306 | F (3, 16) = 1.948 | p = 0.1626 |
| Cell Cultures × TGFβ (5 ng/mL) | 26,960 | 3 | 8987 | F (3, 16) = 2.776 | p = 0.0751 |
| Substance P (100 nM) × TGFβ (5 ng/mL) | 23,274 | 1 | 23,274 | F (1, 16) = 7.189 | p = 0.0164 |
| Cell Cultures x Substance P (100 nM) × TGFβ (5 ng/mL) | 39,183 | 3 | 13,061 | F (3, 16) = 4.034 | p = 0.0259 |
| Residual | 51,799 | 16 | 3237 |
Disclaimer/Publisher’s Note: The statements, opinions and data contained in all publications are solely those of the individual author(s) and contributor(s) and not of MDPI and/or the editor(s). MDPI and/or the editor(s) disclaim responsibility for any injury to people or property resulting from any ideas, methods, instructions or products referred to in the content. |
© 2024 by the authors. Licensee MDPI, Basel, Switzerland. This article is an open access article distributed under the terms and conditions of the Creative Commons Attribution (CC BY) license (https://creativecommons.org/licenses/by/4.0/).
Share and Cite
Hilliard, B.A.; Amin, M.; Popoff, S.N.; Barbe, M.F. Potentiation of Collagen Deposition by the Combination of Substance P with Transforming Growth Factor Beta in Rat Skin Fibroblasts. Int. J. Mol. Sci. 2024, 25, 1862. https://doi.org/10.3390/ijms25031862
Hilliard BA, Amin M, Popoff SN, Barbe MF. Potentiation of Collagen Deposition by the Combination of Substance P with Transforming Growth Factor Beta in Rat Skin Fibroblasts. International Journal of Molecular Sciences. 2024; 25(3):1862. https://doi.org/10.3390/ijms25031862
Chicago/Turabian StyleHilliard, Brendan A., Mamta Amin, Steven N. Popoff, and Mary F. Barbe. 2024. "Potentiation of Collagen Deposition by the Combination of Substance P with Transforming Growth Factor Beta in Rat Skin Fibroblasts" International Journal of Molecular Sciences 25, no. 3: 1862. https://doi.org/10.3390/ijms25031862