Article

Genomic Scan for Runs of Homozygosity and Selective Signature Analysis to Identify Candidate Genes in Large White Pigs

1
Department of Animal Genetics and Breeding, College of Animal Science and Technology, Nanjing Agricultural University, Nanjing 210095, China
2
College of Animal Science and Technology, Anhui Agricultural University, Hefei 230036, China
*
Author to whom correspondence should be addressed.
Int. J. Mol. Sci. 2023, 24(16), 12914; https://doi.org/10.3390/ijms241612914
Submission received: 28 June 2023 / Revised: 9 August 2023 / Accepted: 16 August 2023 / Published: 18 August 2023
(This article belongs to the Special Issue Molecular Genetics and Breeding Mechanisms in Domestics Animals)

Abstract

:
Large White pigs are extensively utilized in China for their remarkable characteristics of rapid growth and the high proportion of lean meat. The economic traits of pigs, comprising reproductive and meat quality traits, play a vital role in swine production. In this study, 2295 individuals, representing three different genetic backgrounds Large White pig populations were used: 500 from the Canadian line, 295 from the Danish line, and 1500 from the American line. The GeneSeek 50K GGP porcine HD array was employed to genotype the three pig populations. Firstly, genomic selective signature regions were identified using the pairwise fixation index (FST) and locus-specific branch length (LSBL). By applying a top 1% threshold for both parameters, a total of 888 candidate selective windows were identified, harbouring 1571 genes. Secondly, the investigation of regions of homozygosity (ROH) was performed utilizing the PLINK software. In total, 25 genomic regions exhibiting a high frequency of ROHs were detected, leading to the identification of 1216 genes. Finally, the identified potential functional genes from candidate genomic regions were annotated, and several important candidate genes associated with reproductive traits (ADCYAP1, U2, U6, CETN1, Thoc1, Usp14, GREB1L, FGF12) and meat quality traits (MiR-133, PLEKHO1, LPIN2, SHANK2, FLVCR1, MYL4, SFRP1, miR-486, MYH3, STYX) were identified. The findings of this study provide valuable insights into the genetic basis of economic traits in Large White pigs and may have potential use in future pig breeding programs.

1. Introduction

Large White pig breeds have gained recognition for their exceptional performance, characterized by rapid growth, efficient feed conversion, and high-carcass yield [1]. Through a combination of natural and artificial selection, these pigs have not undergone a lot of different and significant evolutionary changes, with the recent emphasis on strong and directional positive selection, aligning their characteristics more closely with human requirements. The advent of cost-effective, high-throughput sequencing techniques has facilitated comprehensive genome-wide analyses of genetic structure and relationships within animal populations. Notably, the application of the fixation index (FST) and locus-specific branch length (LSBL) methodologies have emerged as a valuable approach for discerning selection signatures and distinguishing traits across diverse breeds and geographic regions [2,3,4].
In addition to SNP and gene expression data, runs of homozygosity (ROH) have emerged as valuable components of omics data available in biological databases, serving as powerful tools for gene discovery and diversity assessment in livestock. ROH refers to contiguous segments of the genome where an individual inherits identical haplotypes from both parents [5,6]. Long haplotype fragments are derived from a closer common ancestor, whereas short haplotype fragments are derived from a distantly related common ancestor [7]. Several factors can influence the development of ROH patterns on the genome, such as inbreeding, genetic drift, the mating system, selection intensity, effective population size, population structure, and genetic linkage [8]. In 1999, early studies revealed that the length of homozygous fragments is associated with human diseases, underscoring their importance [9]. Today, the advent of high-throughput sequencing techniques enables convenient access to genomic information. The use of high-density SNP markers for scanning the genome were proposed to identify regions with reduced heterozygosity, thus enabling ROH detection [10]. The widespread adoption of SNP chips and whole-genome resequencing offers excellent opportunities to investigate ROH in livestock. Recent studies in pigs have employed ROH to explore signatures of selection. Wu et al. [11] found some candidate selection signatures within the DSE pig population were detected through the ROH islands. Wang et al. [12] used Duroc (American origin) and Duroc (Canadian origin) pigs to investigate the harmful ROH regions on five economic traits. Xu et al. [13] described the occurrence and distribution of ROH in the genome of Jinhua pigs and found several genes within ROH.
In this study, we utilized the GeneSeek 50K GGP porcine HD array to characterize Canadian, American, and Danish Large White pigs. FST and LSBL were employed as methods to select signatures associated with specific traits. Additionally, homozygosity analysis was conducted to further investigate the genetic characteristics of the three pig populations. The findings of this research contribute novel and valuable insights into the population history and genetic structure of Large White pigs with diverse genetic backgrounds.

2. Results

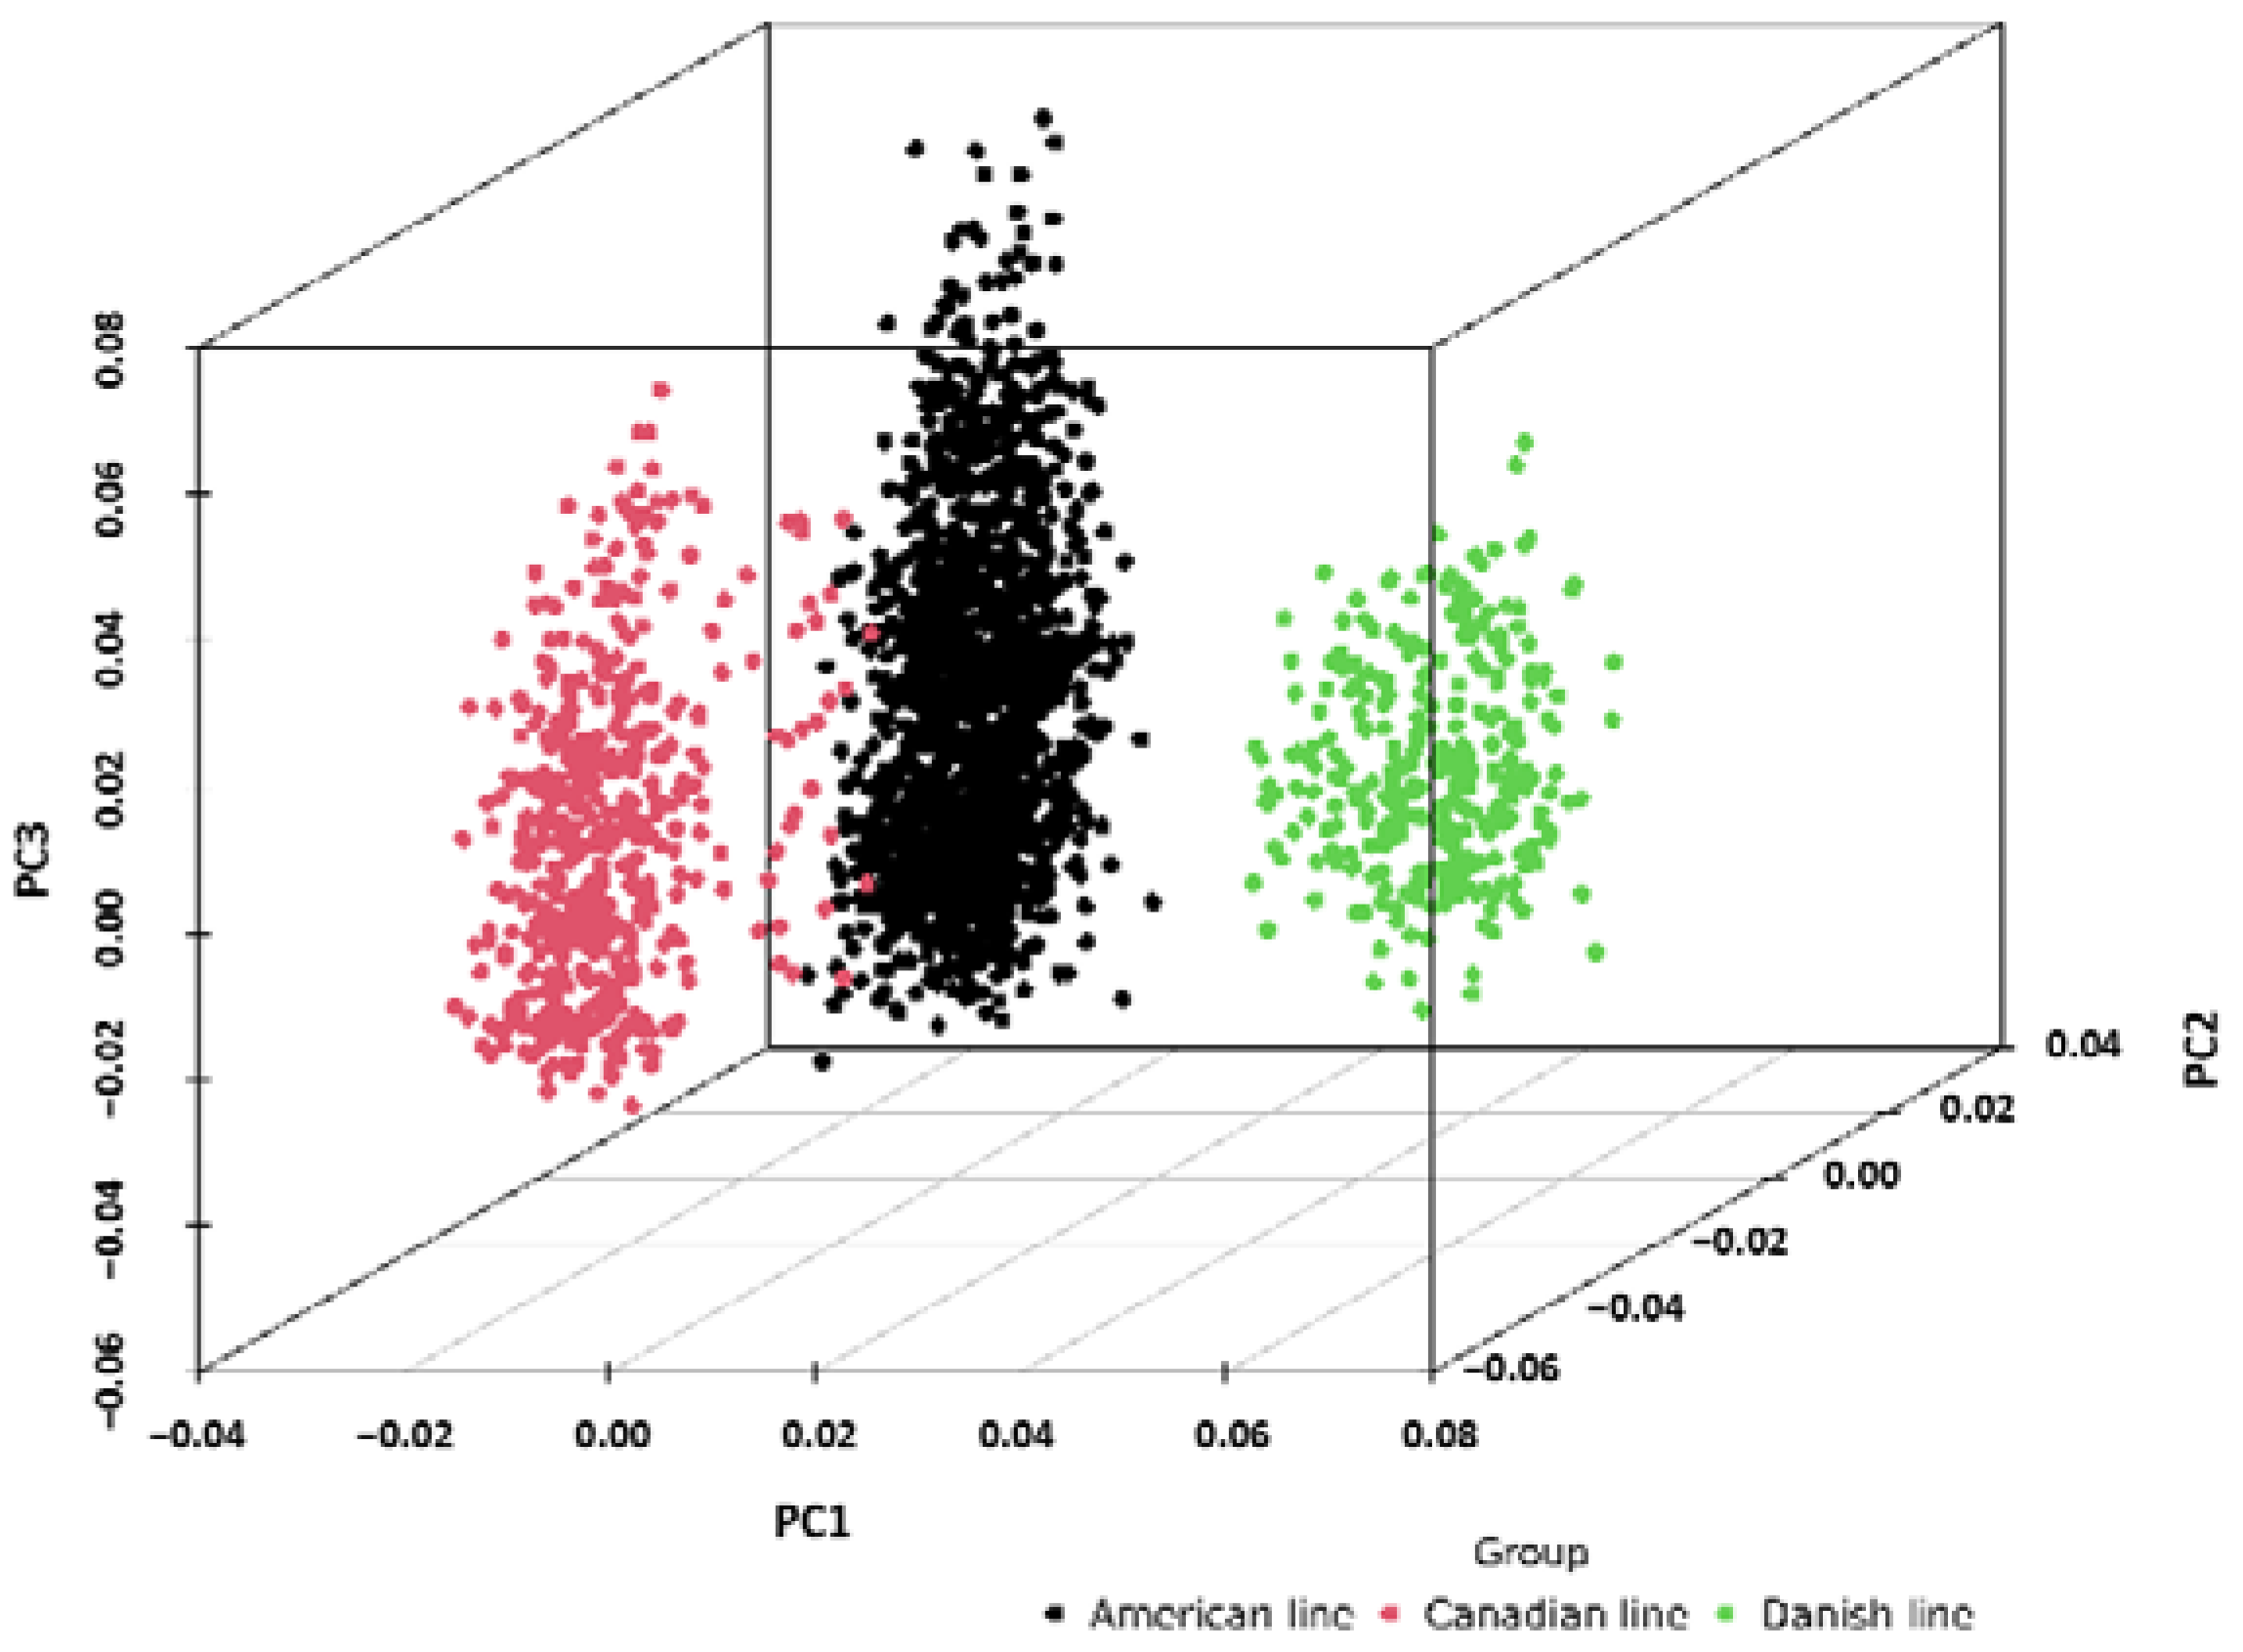
2.1. Population Stratification Assessment

Principal component analysis was conducted to assess the genetic variation indices of the three pig populations. The results demonstrated significant differences in the genetic backgrounds of the American, Canadian, and Danish line Large White pigs, with PC1 effectively separating the three populations (Figure 1).

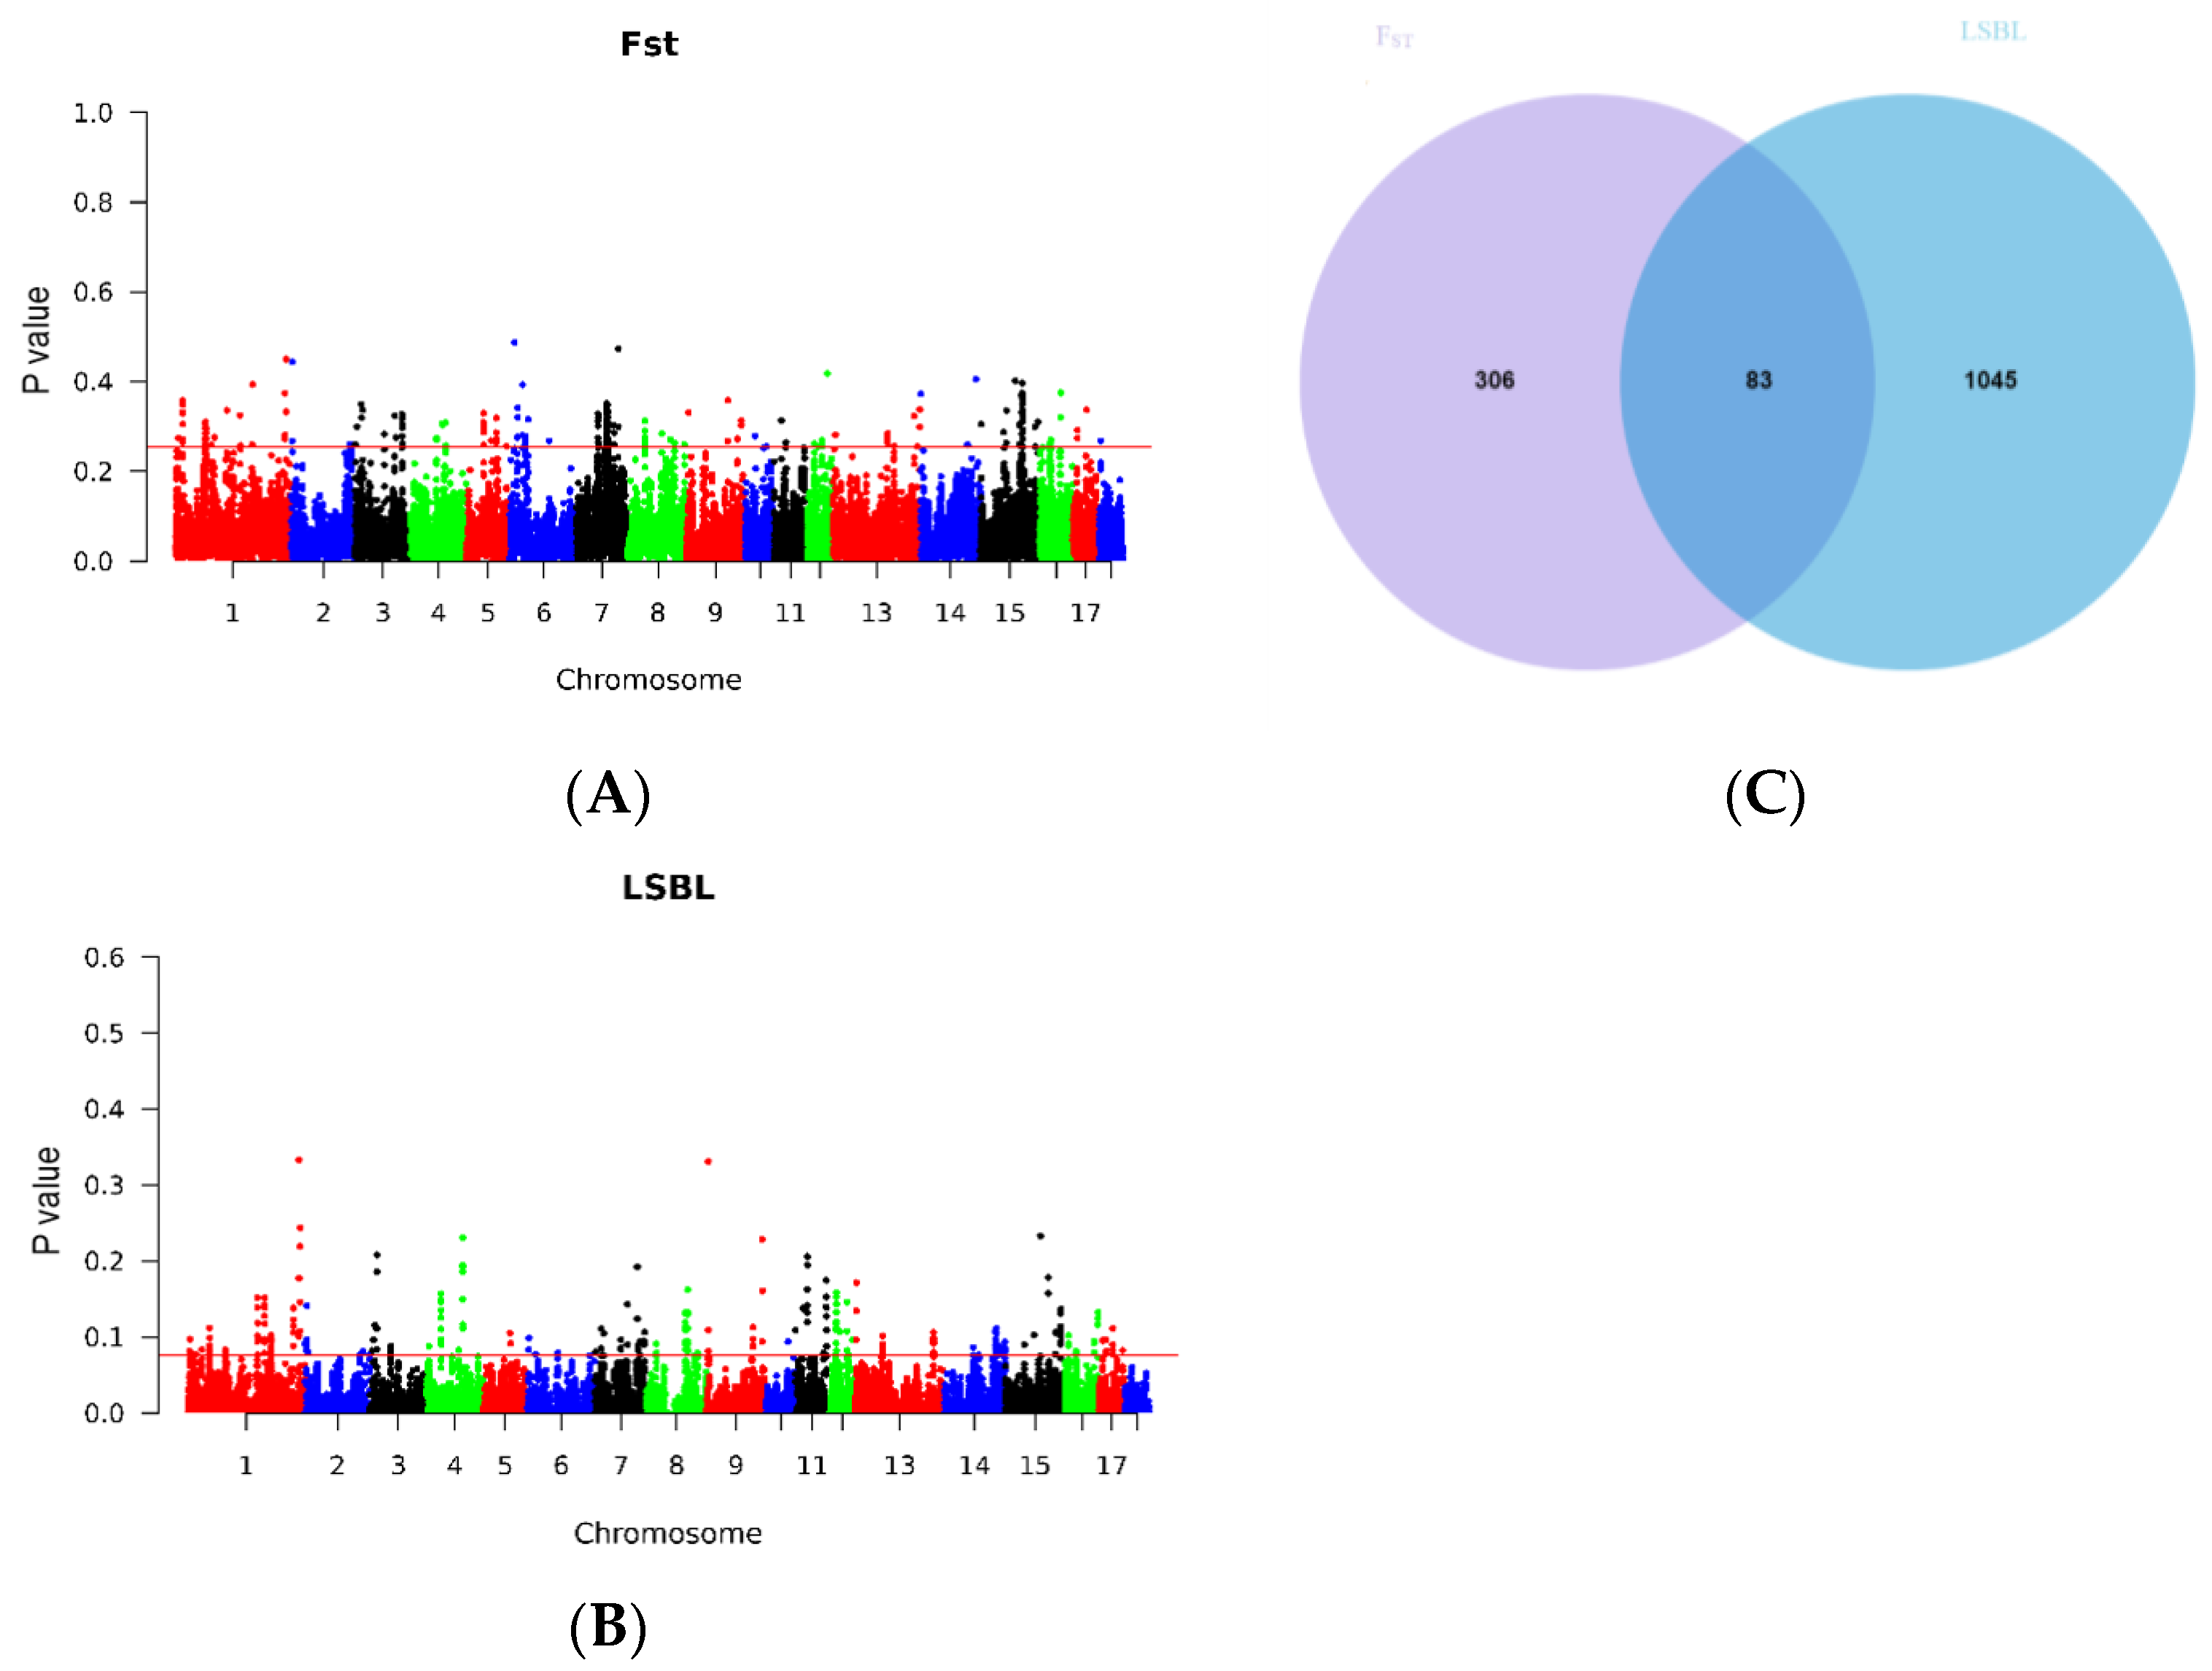
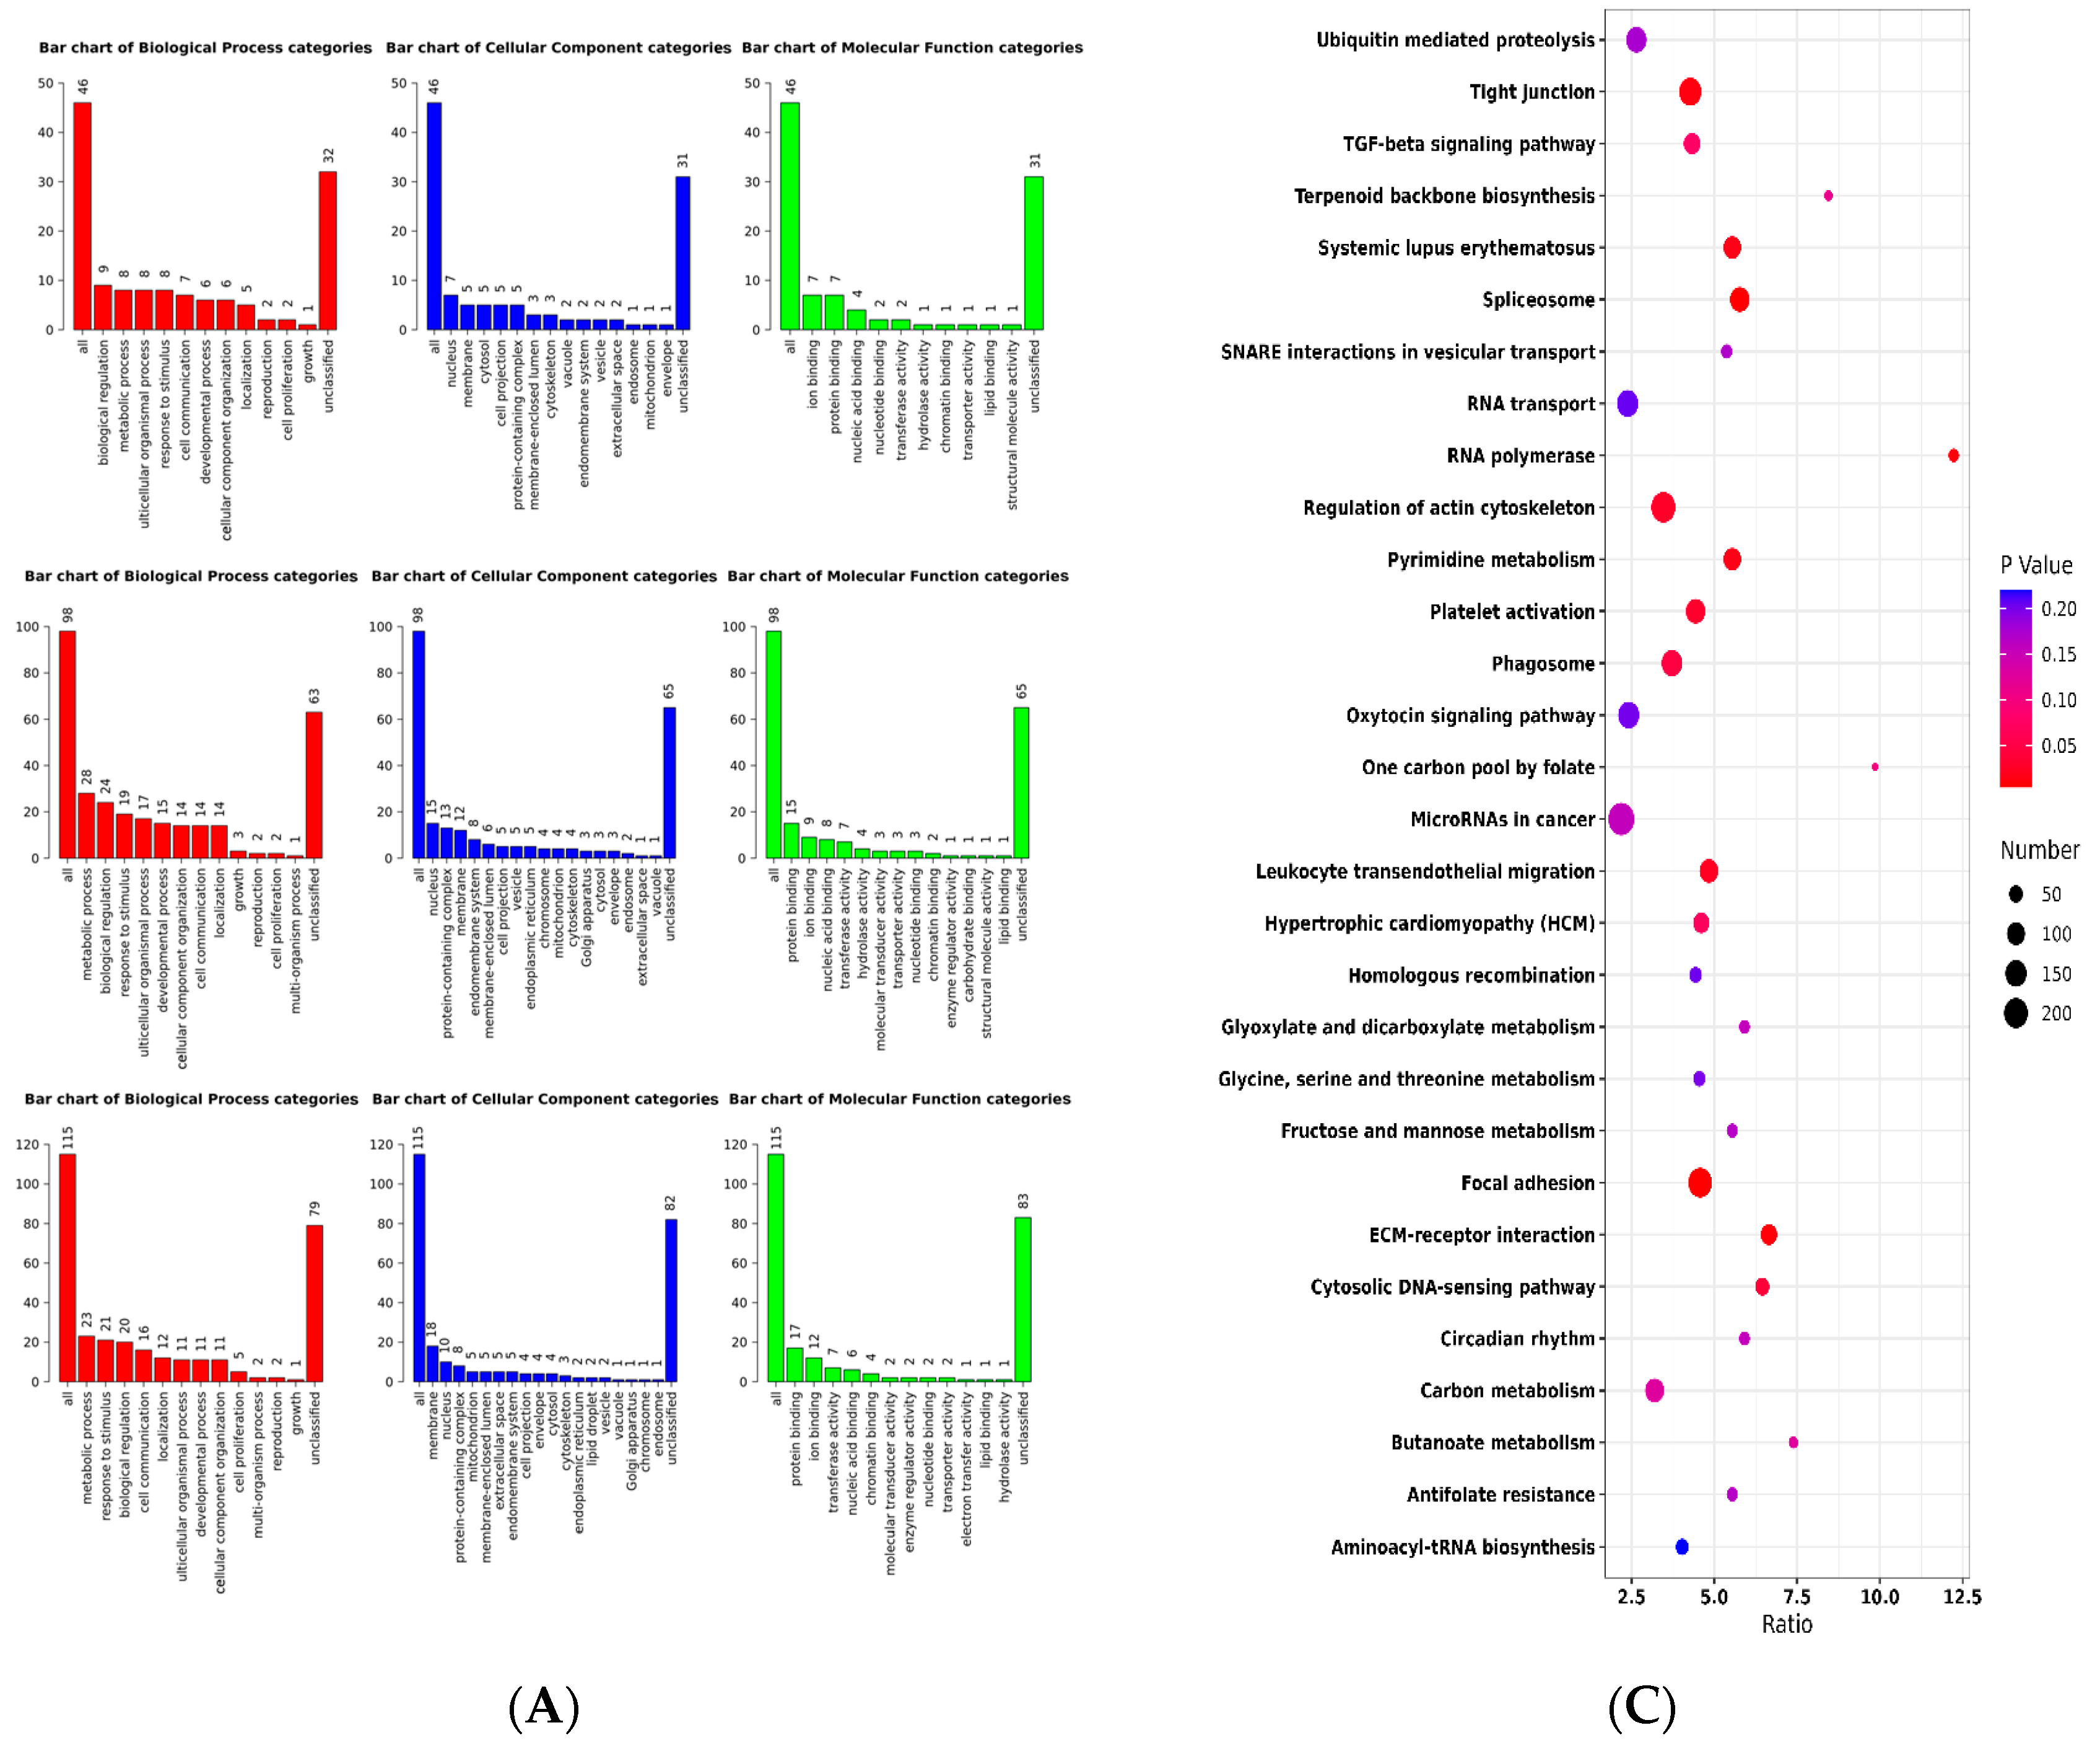
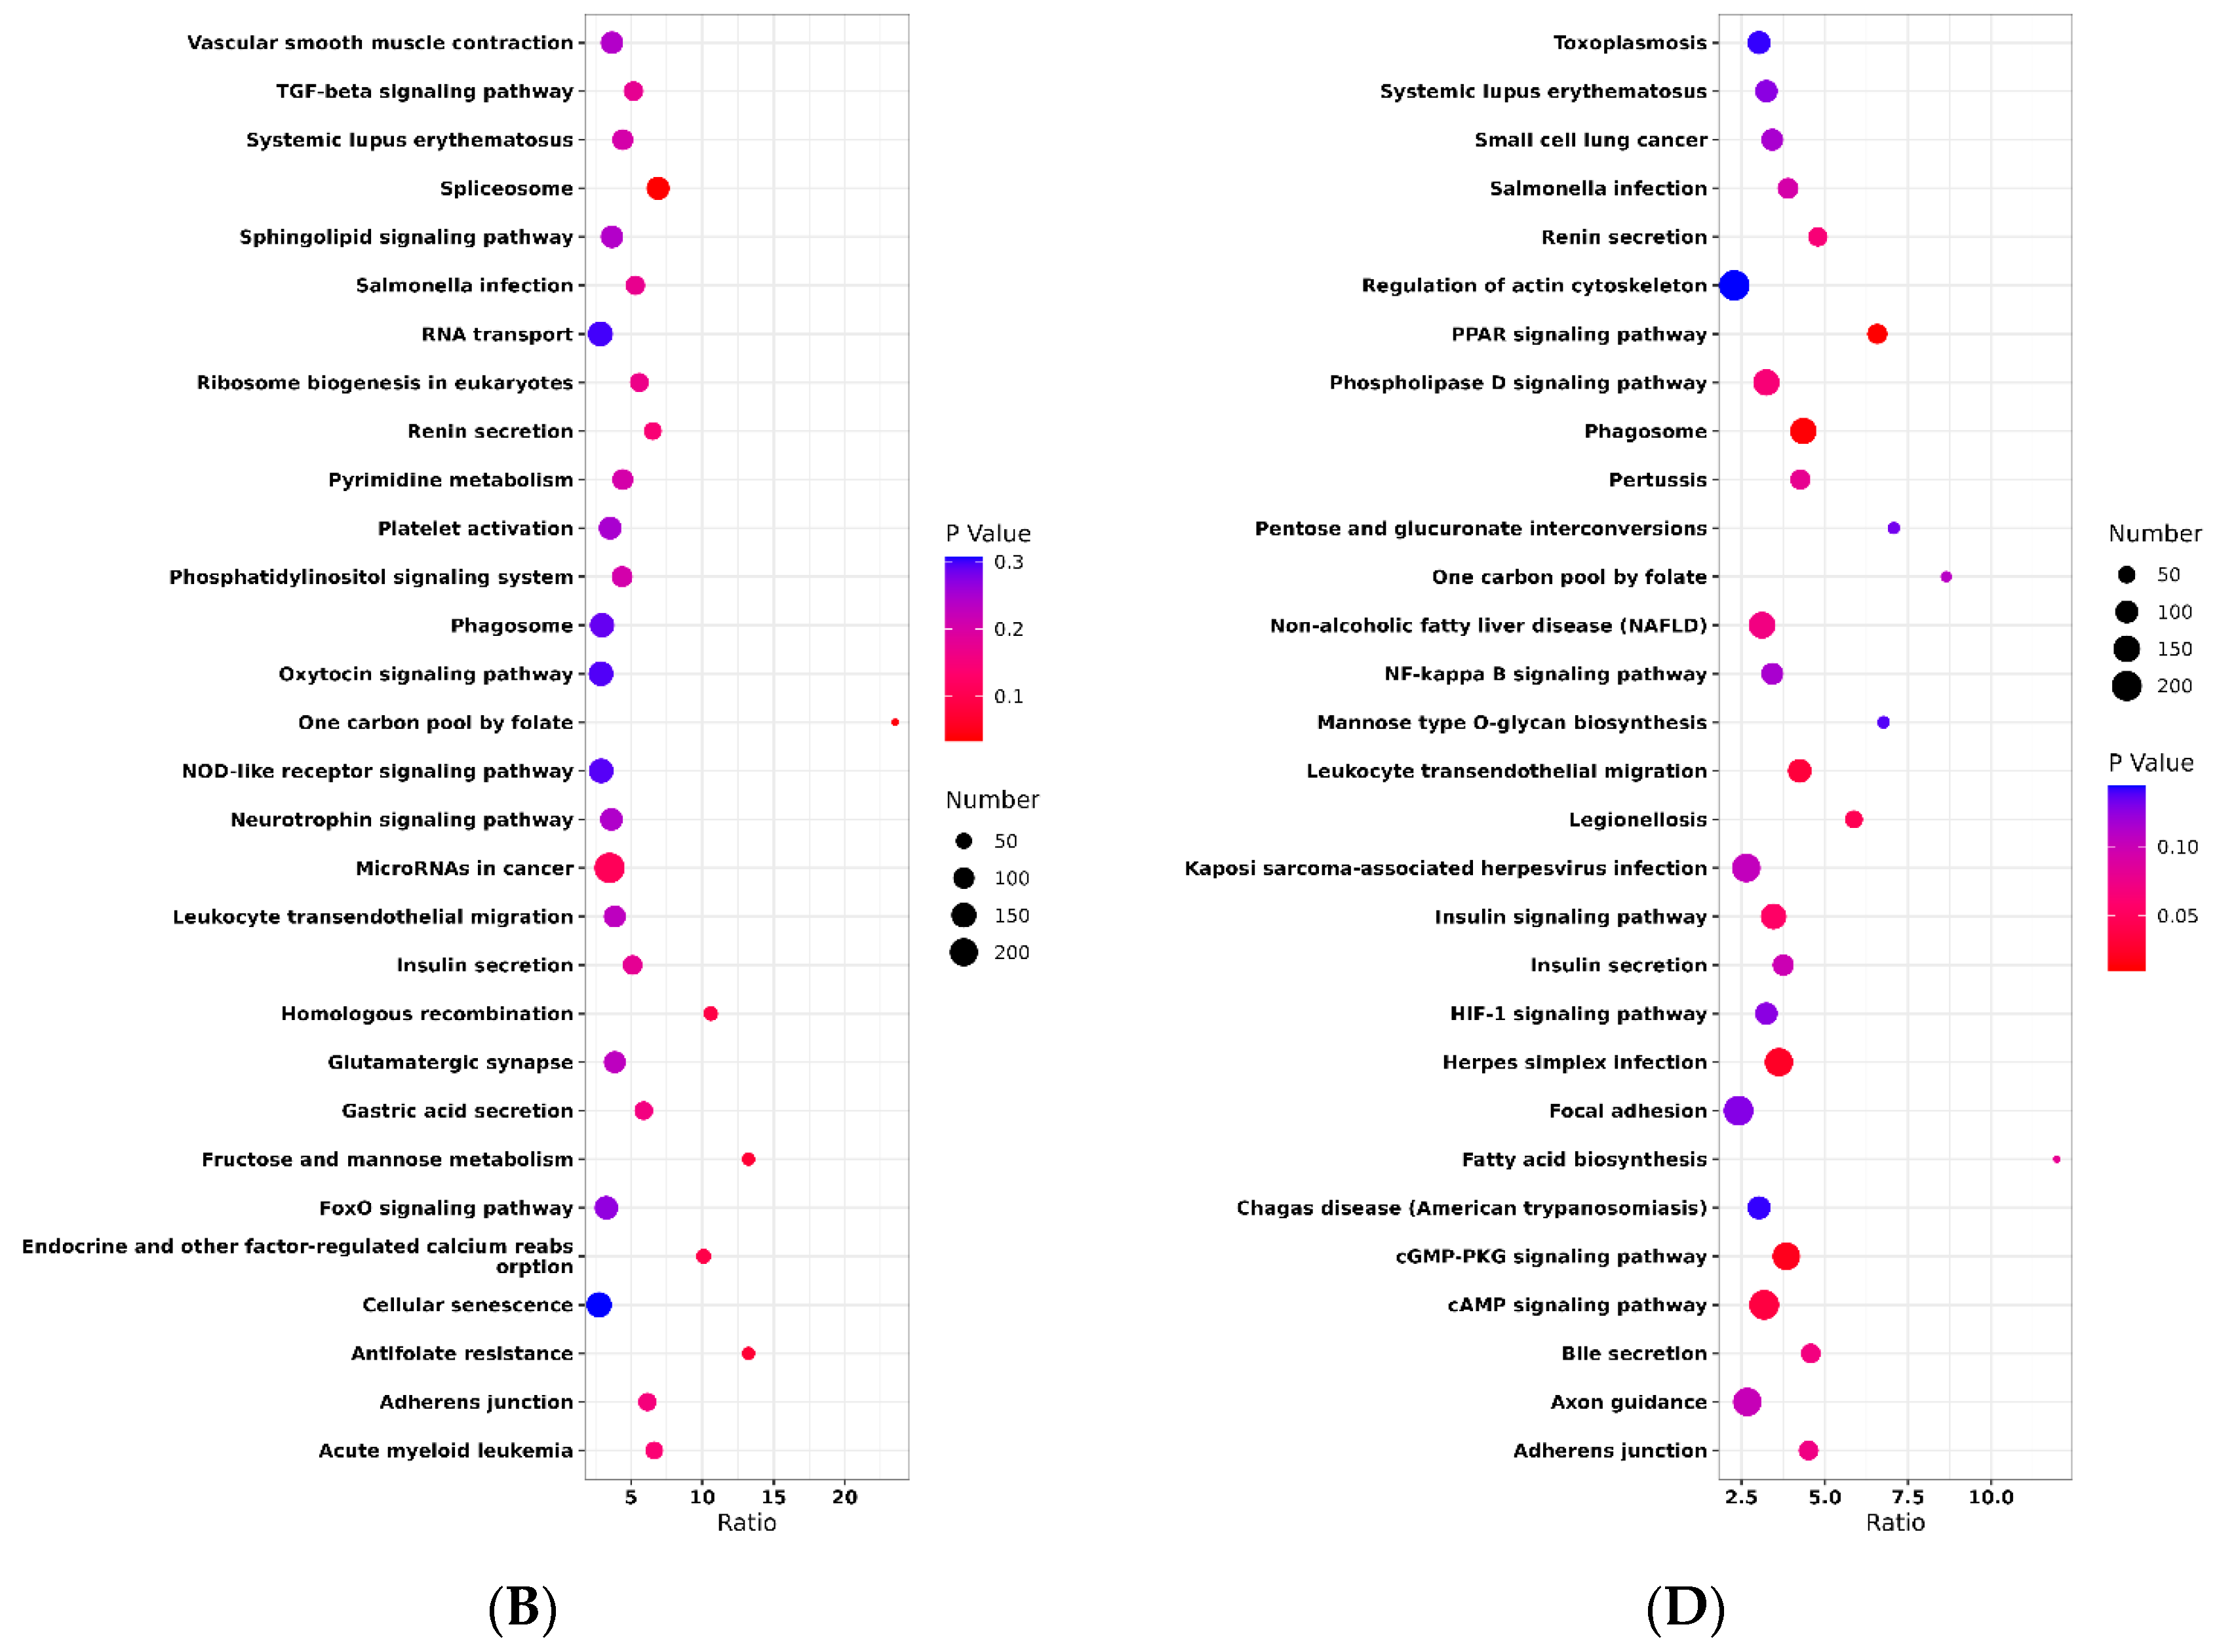
2.2. Selective Signature Analysis

To minimize the risk of false positive selection signals, it has become common practice to employ multiple detection methods, allowing for cross-validation and strengthening the reliability of the findings. In this study, we utilized two such methods, namely FST and LSBL, for selection signature detection. Through a comprehensive genome-wide selective sweep analysis, we identified a total of 1434 enriched genes after filtering the intersection of the top 1% windows obtained from FST (Figure 2A) and LSBL (Figure 2B). Furthermore, we observed that 83 loci overlapped between these two methods (Figure 2C), indicating a mutual validation of the results. Candidate genes located within genomic regions with high frequencies of FST and LSBL are shown in Table 1.
In each selection signature analysis, the top 20% of genomic regions were identified and subjected to further investigation. Functional annotation of all genes residing within these selected genomic regions was performed using the WebGestaltR package [14]. Subsequently, significant enrichment was observed in specific functional categories within each method. In the LSBL analysis (Figure 3B), the genes exhibited significant enrichment in processes related to morphogenesis of an epithelium, plasma membrane protein complex, transcription factor complex, oxidoreductase activity involving the CH-OH group of donors with NAD or NADP as acceptors, and cytoskeletal protein binding. Conversely, in the FST analysis (Figure 3A), the genes displayed significant enrichment in peptide metabolic processes, vesicle-mediated transport, catalytic complex, and protein-containing complex binding.
Finally, the results of the KEGG pathway analysis showed that MAPK signalling pathways were significantly enriched in FST and LSBL (Figure 3C,D). The MAPK signal pathway is involved in skeletal muscle regeneration [15]).

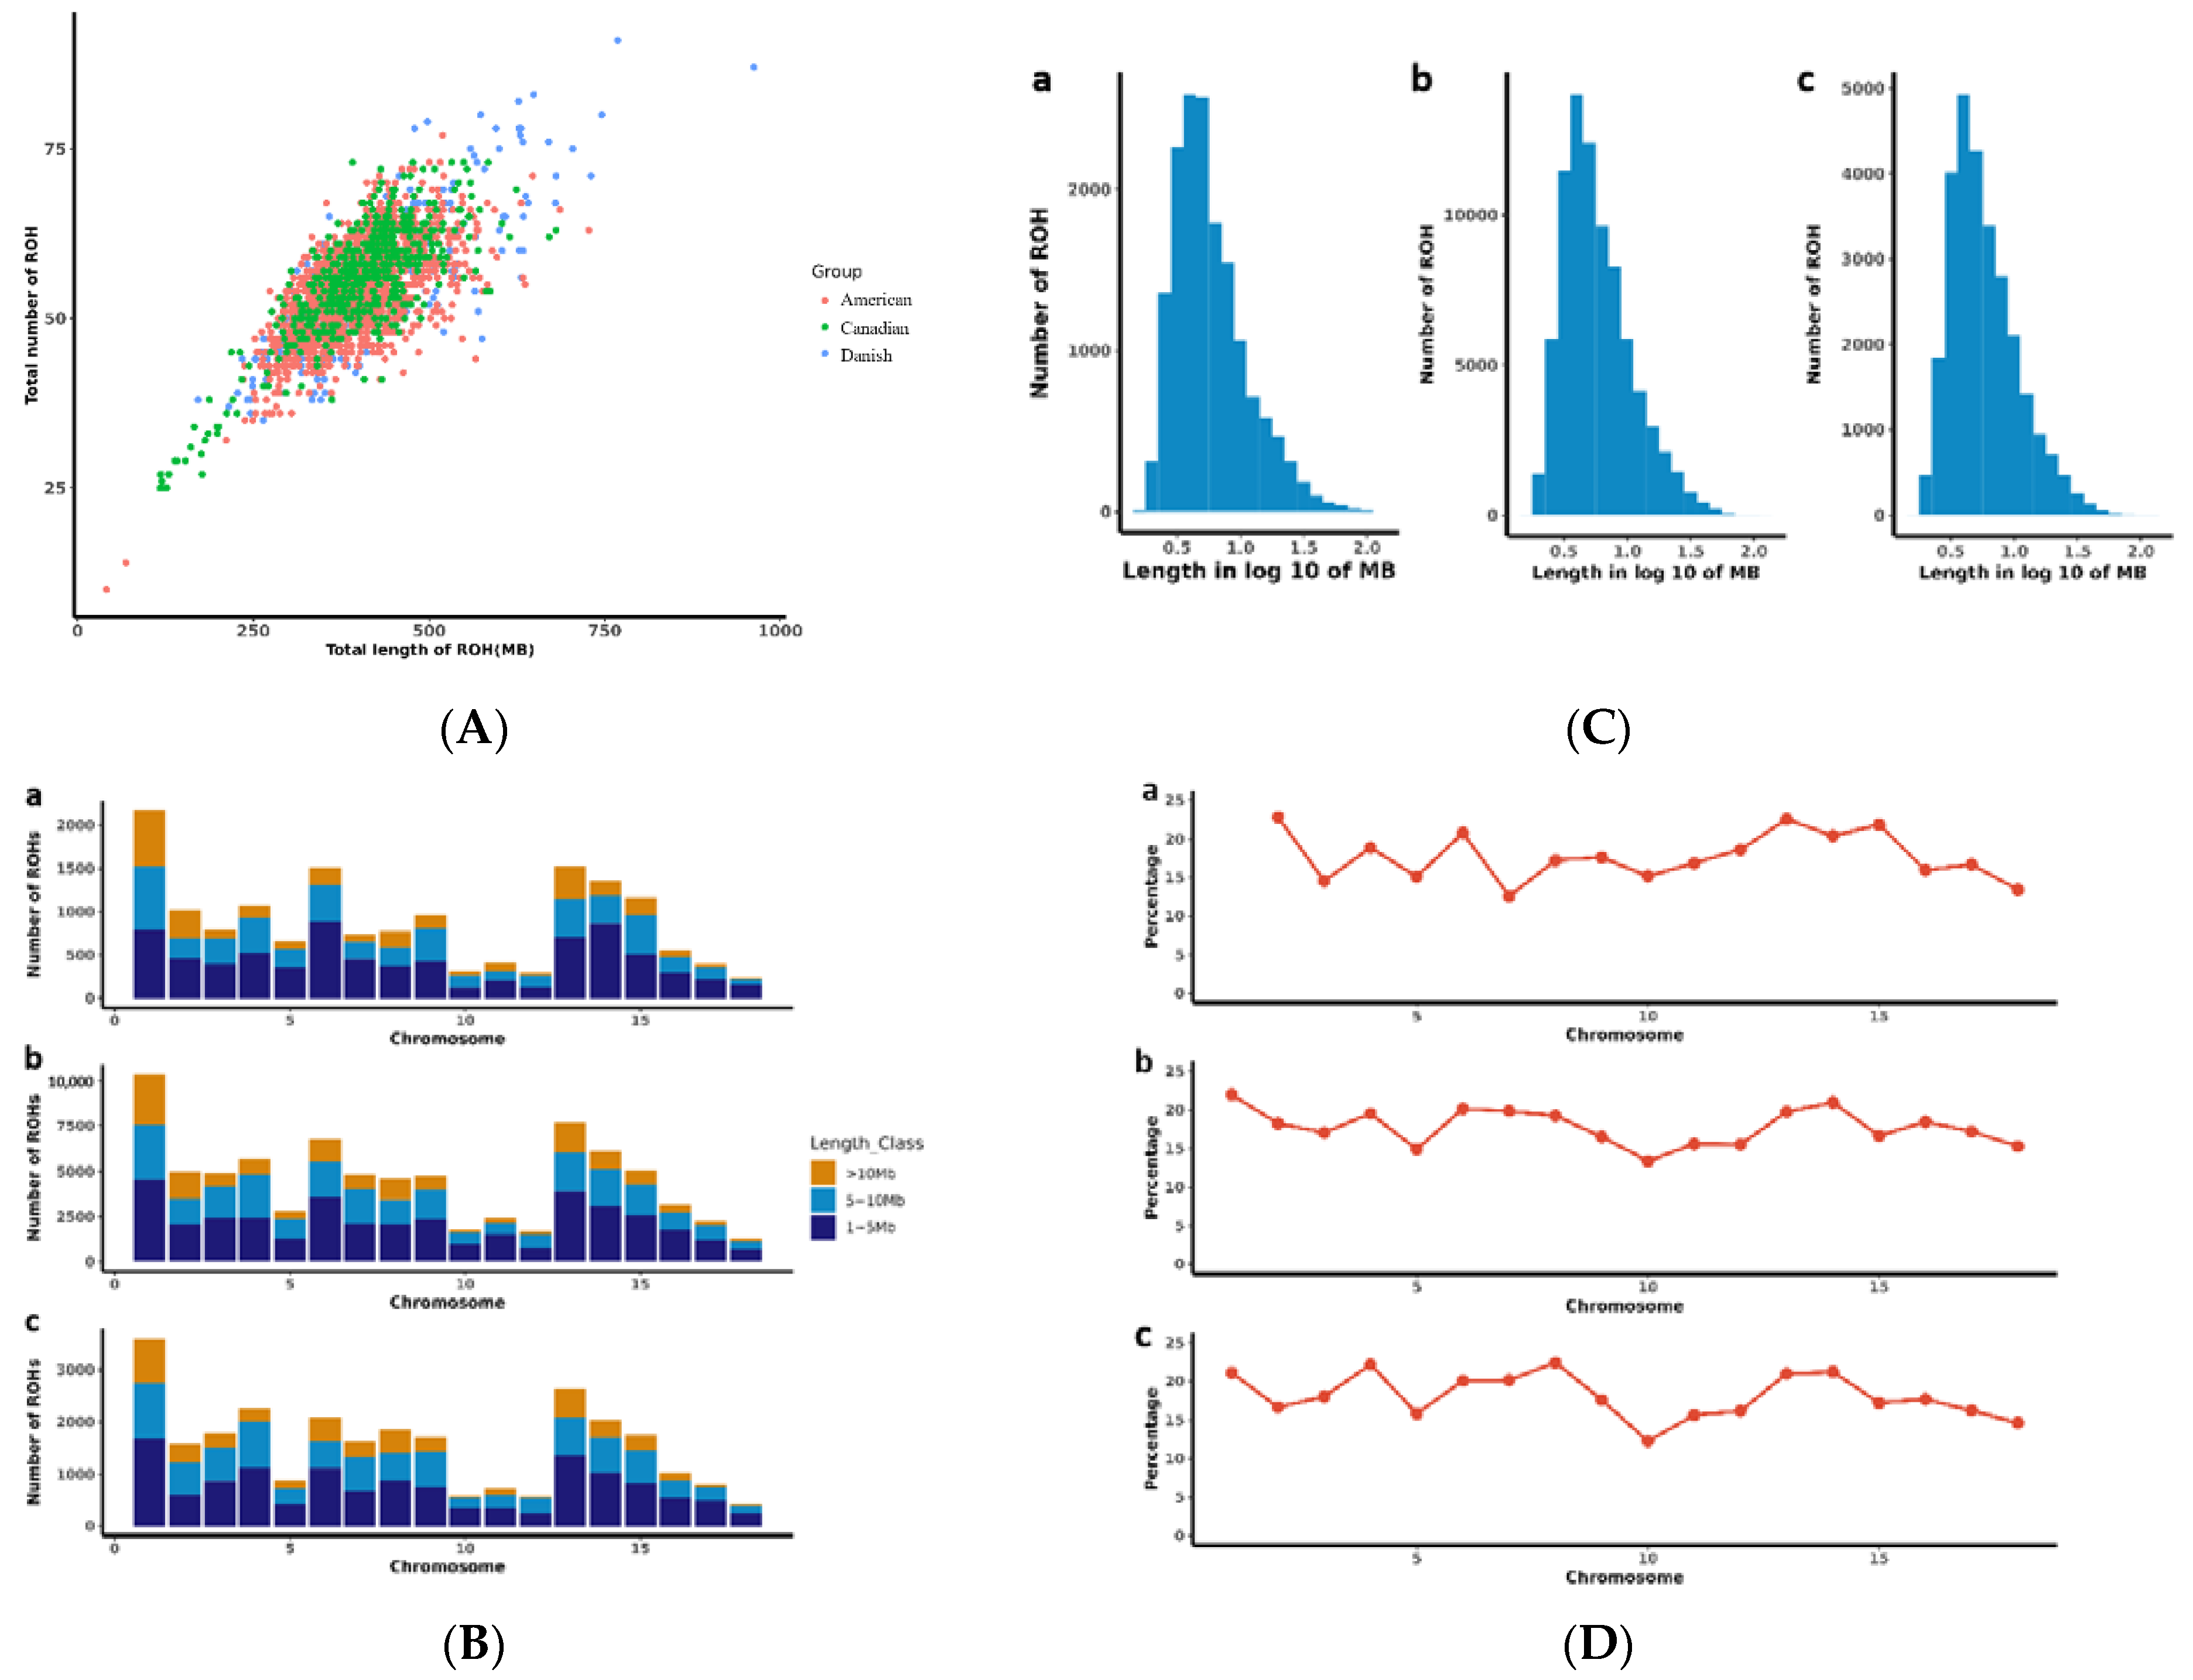
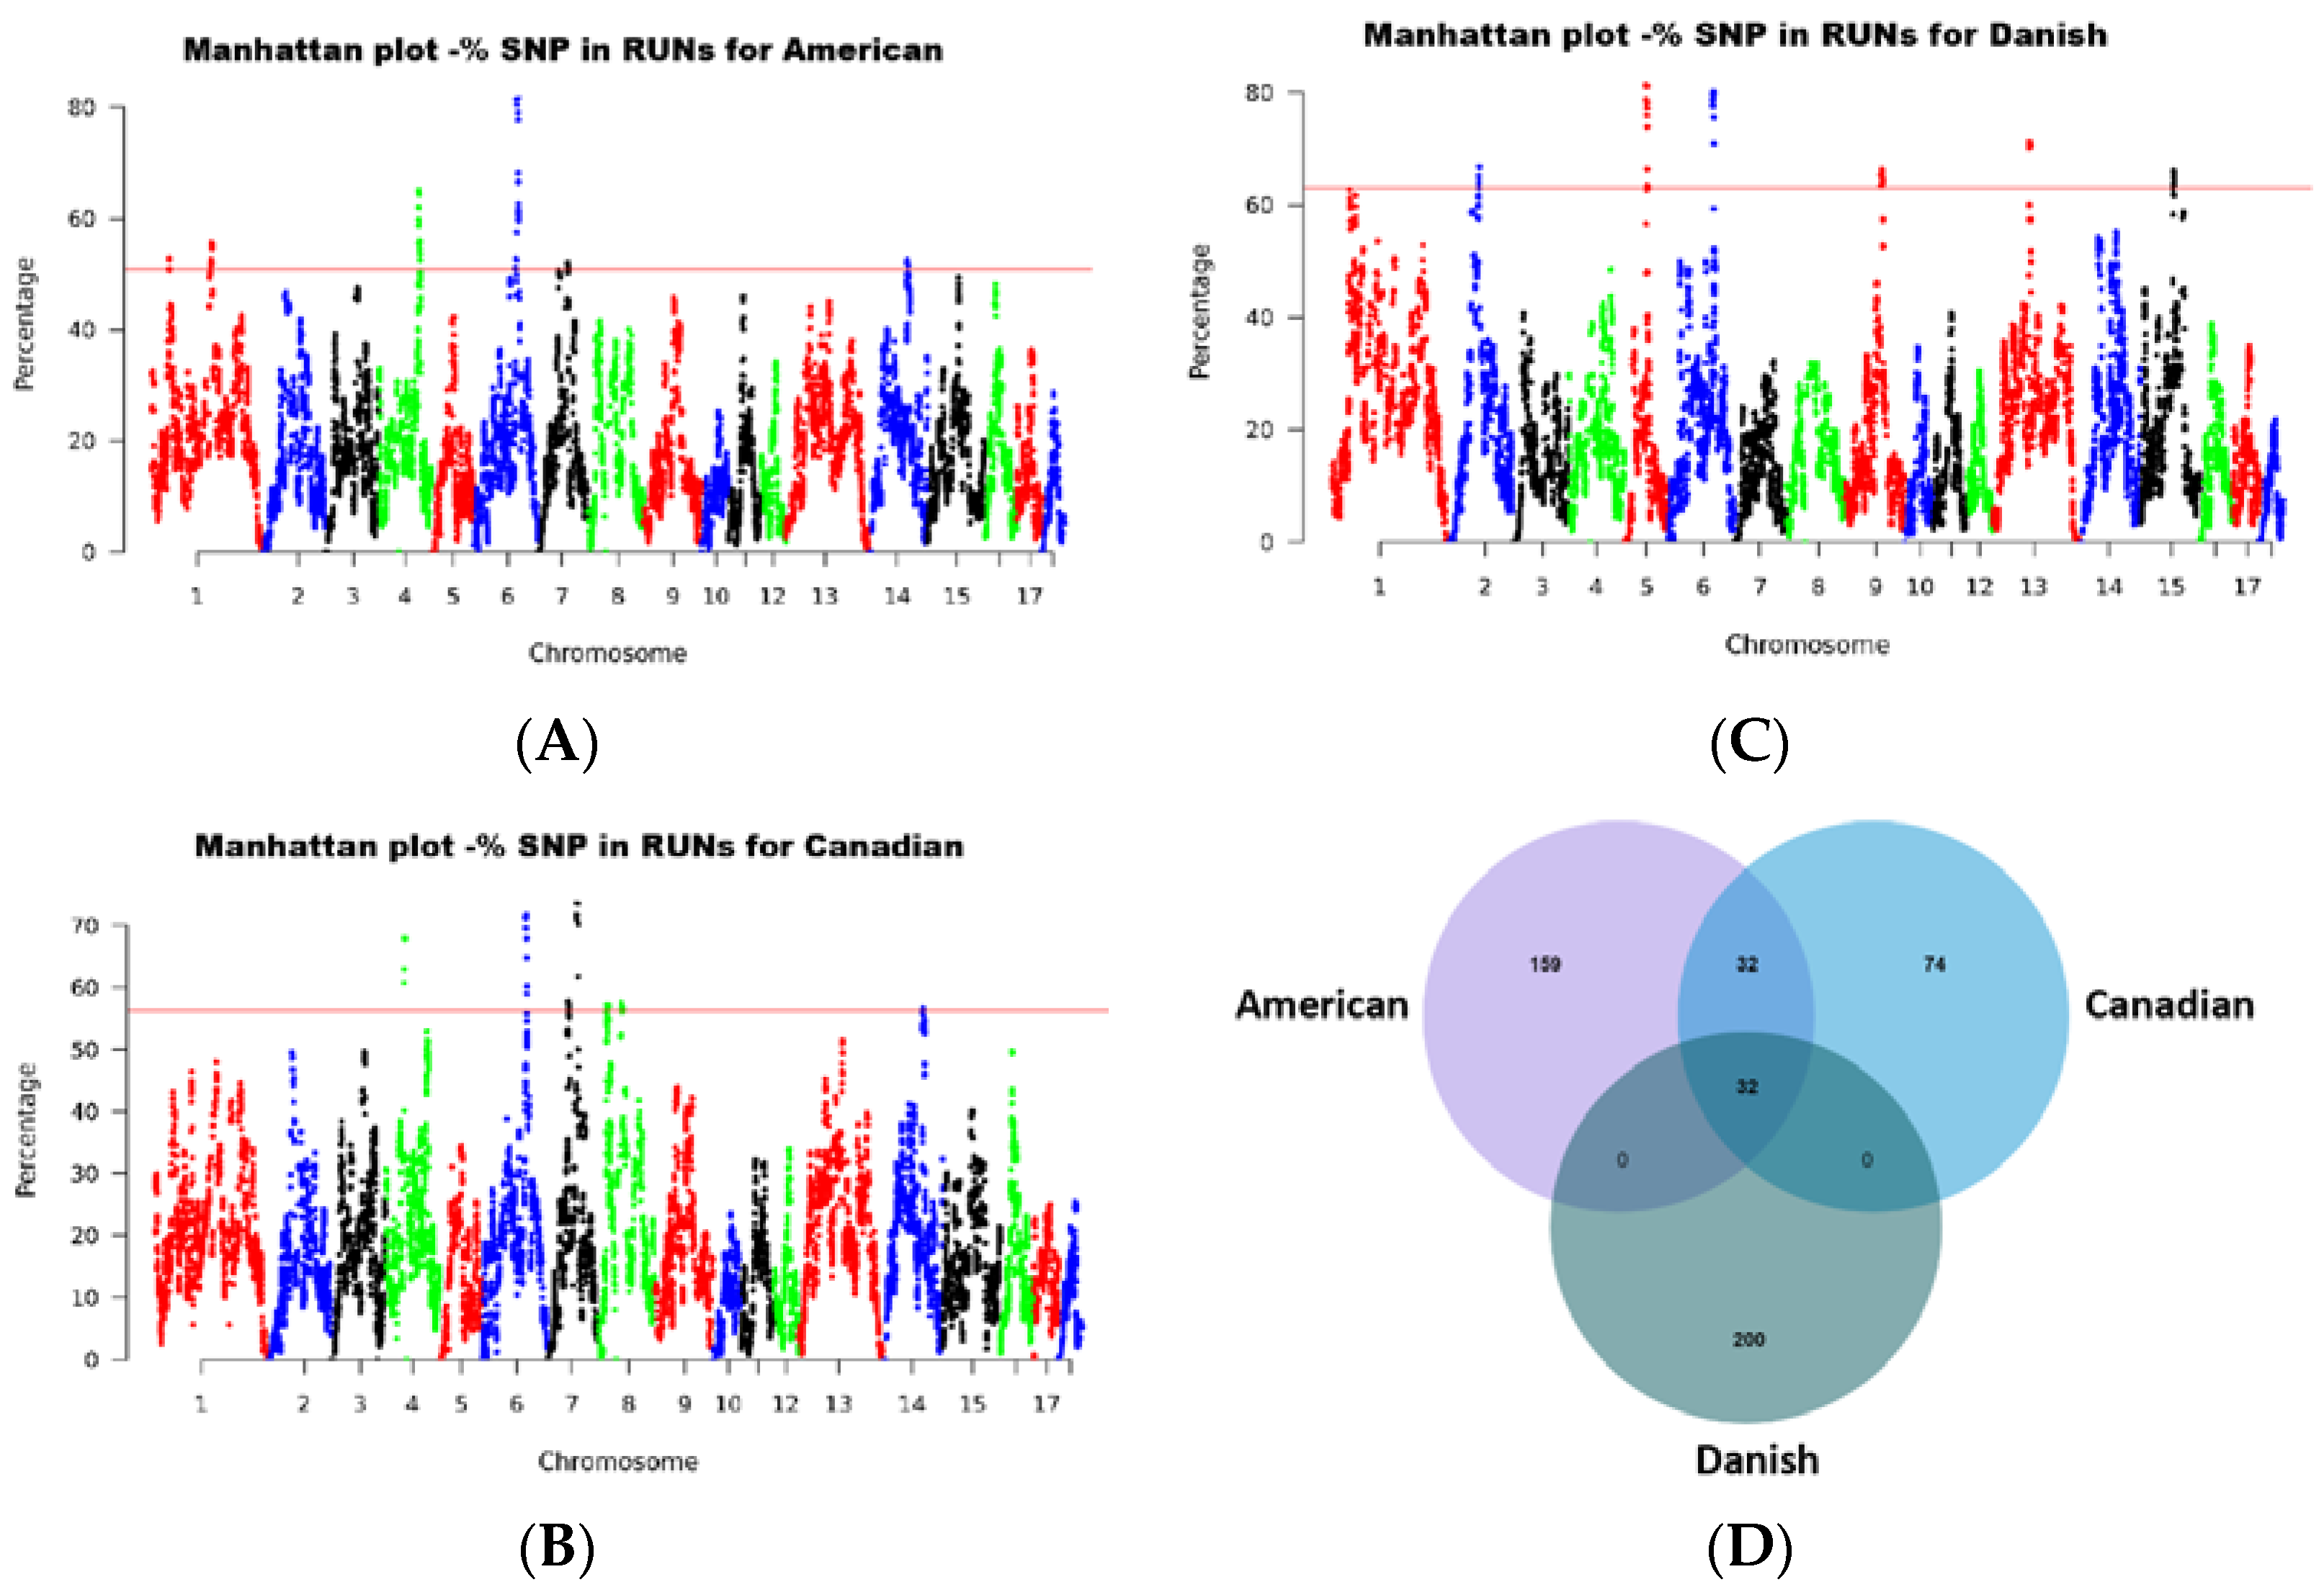
2.3. Runs of Homozygosity Analysis

The genome-wide ROHs were assessed on 18 autosomes of all tested individuals. After the read filtering procedures, 34,150, 34,543 and 34,497 SNPs and 500, 295 and 1500 individuals were retained from the Canadian line, Danish line and American line, respectively. These SNPs were retained for subsequent ROH analysis.
The association between the total genomic length covered by runs of homozygosity (ROH) per individual and the total number of ROH per individual was examined and presented in Figure 4A. The Danish line displayed a higher number of ROH compared to the Canadian and American lines. Furthermore, within the Danish line, certain individuals exhibited exceptionally long ROH segments covering more than 750 Mb. Analysis of autosomes (Figure 4B) revealed variations in the number of ROHs across the three populations, indicating an uneven distribution of ROHs. Interestingly, all three groups exhibited the fewest ROHs per chromosome on SSC 18, while the highest number of ROHs was observed on SSC 1. The distribution of ROH according to length is shown in Figure 4C. To further assess the distribution of ROHs on autosomes, we estimated the coverage of ROHs for each autosome. Notably, SSC10 displayed the lowest coverage of ROH segments (Figure 4D).
To identify the genomic regions most associated with ROH in the three pig populations, we calculated the frequency of SNP occurrence within the ROH segments. From these calculations, we selected the top 1% of SNPs with the highest frequency and plotted their positions along the respective chromosomes (Figure 5A–C). Our analysis revealed a total of 25 genomic regions exhibiting a high frequency of ROH, encompassing a range of lengths from 7.9 kb on SSC6 to 5.12 Mb on SSC6, as presented in Table 2. On chromosome 6, from position 105,105,811 to 107,369,304, there is only a shared overlap in the ROH of these three populations. Furthermore, 12% of the total ROH length was discovered in the American lines; 11% in the Canadian lines; and 14% in the Danish lines. The longest ROH segment was identified on SSC6, spanning 121 SNPs. In Table 2, a comparison between the identified QTLs in this study and those catalogued in pigQTLdb reveals noteworthy associations. Specifically, in the Danish line, a genomic segment spanning 54.09 Mb to 54.25 Mb on SSC5 is linked to reproductive traits. In the American line, the chromosomal region from 14.60 Mb to 14.90 Mb onSSC1 is associated with average daily weight, while the region between 72.34 Mb and 74.40 Mb on SSC7 is correlated with fat area percentage in the carcass. In the Canadian line, the genomic region ranging from 44.73 Mb to 448.38 Mb on SSC4 is implicated in ham weight, and the span from 70.70 Mb to 74.26 Mb on SSC7 is tied to the teat numbers. These findings indicate that the selection emphasis within the Canadian line is centred on reproductive traits and growth performance. Moreover, we identified 1216 genes within these ROH regions. Intriguingly, our analysis uncovered 32 overlapping genes across all three populations of ROH (Figure 5D). These findings further enhance our understanding of the genetic architecture and potential selective pressures acting upon these regions. Candidate genes located in genomic regions with high frequencies of ROH are shown in Table 3.
The 1216 candidate genes identified within ROH in pigs were subjected to functional enrichment analyses. Gene Ontology (GO) analysis revealed significant enrichment of specific biological processes (Figure 6A). Kyoto Encyclopedia of Genes and Genomes (KEGG) enrichment analysis was performed to further elucidate the pathways associated with these genes, as depicted in Figure 6B–D. In the American line, the candidate genes were significantly enriched in processes related to muscle cell differentiation, muscle system function, U12-type spliceosomal complex, as well as oxidoreductase activity involving the CH-OH group of donors with NAD or NADP as acceptor. In the Canadian line, significant enrichment was observed in processes related to muscle hypertrophy, regulation of G protein-coupled receptor signalling pathway, muscle adaptation, zinc ion binding, and oxidoreductase activity involving the CH-CH group of donors with NAD or NADP as acceptor. In the Danish line, significant enrichment was observed in processes related to tumour necrosis factor receptor binding, lipid droplets, and negative regulation of gliogenesis.
The KEGG pathway analysis demonstrated the enrichment of specific pathways associated with the candidate genes identified in each pig population. In the Danish line, candidate genes were significantly enriched in the PPAR signalling pathway and the cGMP-PKG signalling pathway (Figure 6D). In the Canadian line, candidate genes showed significant enrichment in the Spliceosome pathway and the one-carbon pool by the folate pathway (Figure 6B). In the American line, candidate genes were notably enriched in the Regulation of the actin cytoskeleton pathway and the Focal adhesion pathway (Figure 6C).

3. Discussion

The identification of numerous candidate genes associated with economic traits in this study contributes to our understanding of the genetic factors influencing these traits in pigs (Table 1). Among the identified genes, MYL4 was found to exhibit differential expression in the longest muscle tissue of the pig’s back, which correlated with variations in the number of muscle fibres within the tissue [16]. Other genes of interest include FGFR2, which has been recognized as a crucial regulator of myogenesis during skeletal muscle development and regeneration [17], and SFRP1, predicted to be targeted by miRNA-1/206, and implicated in muscle cell proliferation and prenatal skeletal muscle development [18]. SHANK2, a member of the Shank protein family, was found to be associated with childhood obesity, and to influence oestradiol blood concentration [19,20]. Induction of miR-486 takes place during the differentiation of myoblasts, whereby they directly target the 3′ untranslated region (UTR) of Pax7 leading to its downregulation. This downregulation mechanism promotes the differentiation of muscle cells [21]. The MYH3 gene, encoding myosin heavy chain 3, was identified as a regulator of myofiber-type specification and adipogenesis in skeletal muscle [22]. In a study by Lin et al. [23], the SHANK2 gene was identified as likely to affect the backfat thickness in pigs. FLVCR1 deficiency results in Diamond–Blackfan anaemia, often associated with skeletal malformations [24]. STYX, the main signalling regulator in the ERK1/2 MAPK signalling pathway, increased pre-adipocyte adipogenesis by promoting pre-adipocyte proliferation [23]. Knockout LRRK2 displayed lipid accumulation in the liver and kidney of rodents. LRRK2 was identified as an important gene for Intramuscular fat content (IFC) using GWAS in Suhuai pigs [25]. FGF12 exhibits significant and localized expression in midgestation mouse embryos and plays a crucial role in inducing the differentiation of mouse embryonic stem cells [26]. The protein encoded by CD247 is T-cell receptor zeta, which has an important role in antigen recognition and signal transduction [27].
In this study, the GeneSeek 50K GGP porcine HD array was utilized to investigate the frequency and distribution of ROH in the genome of three distinct pig breeds. The formation of ROH patterns is primarily influenced by various factors, including population bottlenecks, inbreeding, genetic drift, and selective pressures arising from both natural and artificial selection [28]. Our findings revealed variations in the number and coverage of ROHs among chromosomes, with a general trend of increasing ROH numbers along with the length of the chromosome. Interestingly, shared ROHs among individuals in livestock populations may not solely be attributed to demographic history but could also reflect selection pressures [8]. Therefore, exploring ROH islands can provide valuable insights into potential selection signatures and shed light on different selection events, the direction of selection, and adaptations to diverse production systems [29]. Regarding our results, the ROH lengths observed in the three populations were approximately 500 Mb, and no significant differences were found among the three populations in terms of ROH characteristics. These findings contribute to our understanding of the genomic landscape of ROH and provide important implications for the genetic selection and adaptation of pig populations in various production contexts.
The present study identified distinct sets of candidate genes from both selection signature analysis and ROH analysis. In pigs, inbreeding represents a combination of natural and artificial events, and our results demonstrate the complementary nature of different methods in investigating complex traits. There is some difference in the focus of artificial selection in these three distinct Large White Pigs discussed in this study. The Danish line focuses on reproductive performance, such as litter size; the American line focuses on growth performance, such as growth rate and meat ratio; and the Canadian line is similar to the American line in that it also focuses on growth performance. In order to improve the populations, all three populations were subjected to accurate phenotypic data collection and were regularly monitored, and data were analysed to identify the best-performing breeding individuals. The identification of candidate genes associated with economic traits was based on genomic regions exhibiting a high frequency of ROH. Functional analysis and previous studies support the association of most candidate genes with economic traits (Table 3). Several candidate genes relating to reproduction traits were identified: ADCYAP1 global knockout has decreased fertility and affects spermatogenesis [30,31]. U2 and U6 play an important role in snRNP assembly and pre-mRNA splicing in oocytes. An essential role for CETN1 is in the late steps of spermiogenesis and spermatid maturation, and this gene plays a role in the reproductive capacity of the Danish line [32]. Loss of spermatocyte viability is a consequence of defects in the expression of genes regulation by THOC1 required, which means that this gene also has an effect on the ability of the Danish line to reproduce [33]. USP14 is required for spermatid differentiation during spermiogenesis [34]. The knockdown of GATA6 resulted in a loss of the normal steroidogenic testis function [35]. GREB1L plays a major role in genital development [36]. In addition, Niu et al. [37] claim that GREB1L were potential candidate genes for controlling the expression of the rib number. Some genes associated with specific traits related to meat quality were detected: MiR-133 repressed ERK1/2 activity by targeting FGFR1 and PP2AC to repress myoblast proliferation and promote its differentiation [38]. PLEKHO1 depletion drastically impairs C2C12 myoblast fusion in vitro and in vivo during zebrafish muscle development [39]. LPIN2 is one member of the lipid gene family associated with backfat thickness in pigs [40]. This gene is located in the genomic region of the high frequency ROH gene in the American line in this study, suggesting that it is related to the growth performance related to backfat thickness.

4. Materials and Methods

4.1. Ethics Statement

The Animal Welfare Committee of Nanjing Agricultural University conducted a review of all animal testing and sample collection techniques used in this research. This review process included a careful examination of the ethical considerations of the research, as well as the methods and procedures used to ensure the safety and welfare of the animals involved. The Committee approved the animal testing and sample collection techniques in this research, ensuring that the animals were treated humanely, and that the data collected were accurate and reliable. (Permit number: DK652).

4.2. DNA Sampling and Sequencing of DNA

This study utilized three distinct populations of Large White pigs, including 500 Canadian (CLW, which were from Chongming county in Shanghai), 295 Danish (DLW, which were from Huaibei city in Anhui), and 1500 American (ALW, which were from Lixin county in Anhui) Large White pigs, as experimental materials. Genomic DNA was extracted from ear tissue and genotyped with the GeneSeek 50K GGP porcine HD array. The software PLINK (V1.90) (http://www.cog-genomics.org/; accessed on 16 March 2023) [41] was used for quality control of the data and the following standards were set: (i) removal of SNP loci with a call rate of less than 0.95 and unknown positions; (ii) removal of SNP loci with a minor allele frequency (MAF) of less than 0.05; and (iii) discarding of individuals with a call rate of less than 0.95. SNP genome coordinates were obtained from the Sus scrofa 11.1 porcine genome reference assembly.

4.3. Population Structure

Principal component analysis (PCA) was performed using PLINK1.9 [41], and the results of structure and PCA were visualized using the R package “barplot” and “ggplot2”, respectively [42].

4.4. Partitioning Heritabilities of Complex Traits Based on Selection Signatures

The FST method based on population differentiation was used to analyse the selection signature of the data of the three pig populations. The FST was calculated with VCFtools [43] (—fst-window-size 50,000—fst-window-step 10,000). LSBL (LCLW, LDLW, LALW) were calculated from single locus pairwise FST distances, where LCLW = (CLW-DLW FST + CLW-ALW FST − DLW-ALW FST)/2, LDLW = (CLW-DLW FST + DLW-ALW FST − CLW-ALW FST)/2 and LALW = (CLW-ALW FST + DLW-ALW FST − CLW-DLW FST)/2 [44]. Based on the annotation file of the reference genome, the top 1% of the selected loci were screened.

4.5. Runs of Homozygosity Detection

ROH were detected with the detect RUNS package of R software version 4.0.5; we defined ROH according to the following criteria: (i) the minimum number of SNPs in a sliding window was 50; (ii) one heterozygous genotype and no more than two missing SNPs were allowed per window; (iii) the minimum ROH length was set to 1 Mb to eliminate the impact of strong linkage disequilibrium (LD); (iv) the minimum SNP density was 1 SNP every 500 kb and the maximum gap between consecutive SNPs was set to 1 Mb to avoid affecting the length of ROH with a low SNP density; and (v) to minimize the number of the false-positive ROH, the minimum number of SNPs that constituted the ROH (l) was calculated with the method proposed by [45], I = l n α / n s × n i l n 1 h e t , where α is the percentage of false-positive ROH, n s is the number of SNPs per individual, n i is the number of individuals and h e t is the proportion of heterozygosity across all SNPs.
In this study, the detected ROHs were divided into three categories for further analysis: 1–5, 5–10, and >10 Mb. We computed the frequency of ROH numbers and the average length of an ROH per breed.

4.6. Detection of Common Runs of Homozygosity

We calculated the frequency of occurrences within the ROH regions of each SNP across the individuals and made a Manhattan figure by plotting these values in conformity with the position of each SNP on chromosomes. The SNPs in the top 1% of the frequency of occurrence were selected as a hint of a potential ROH.

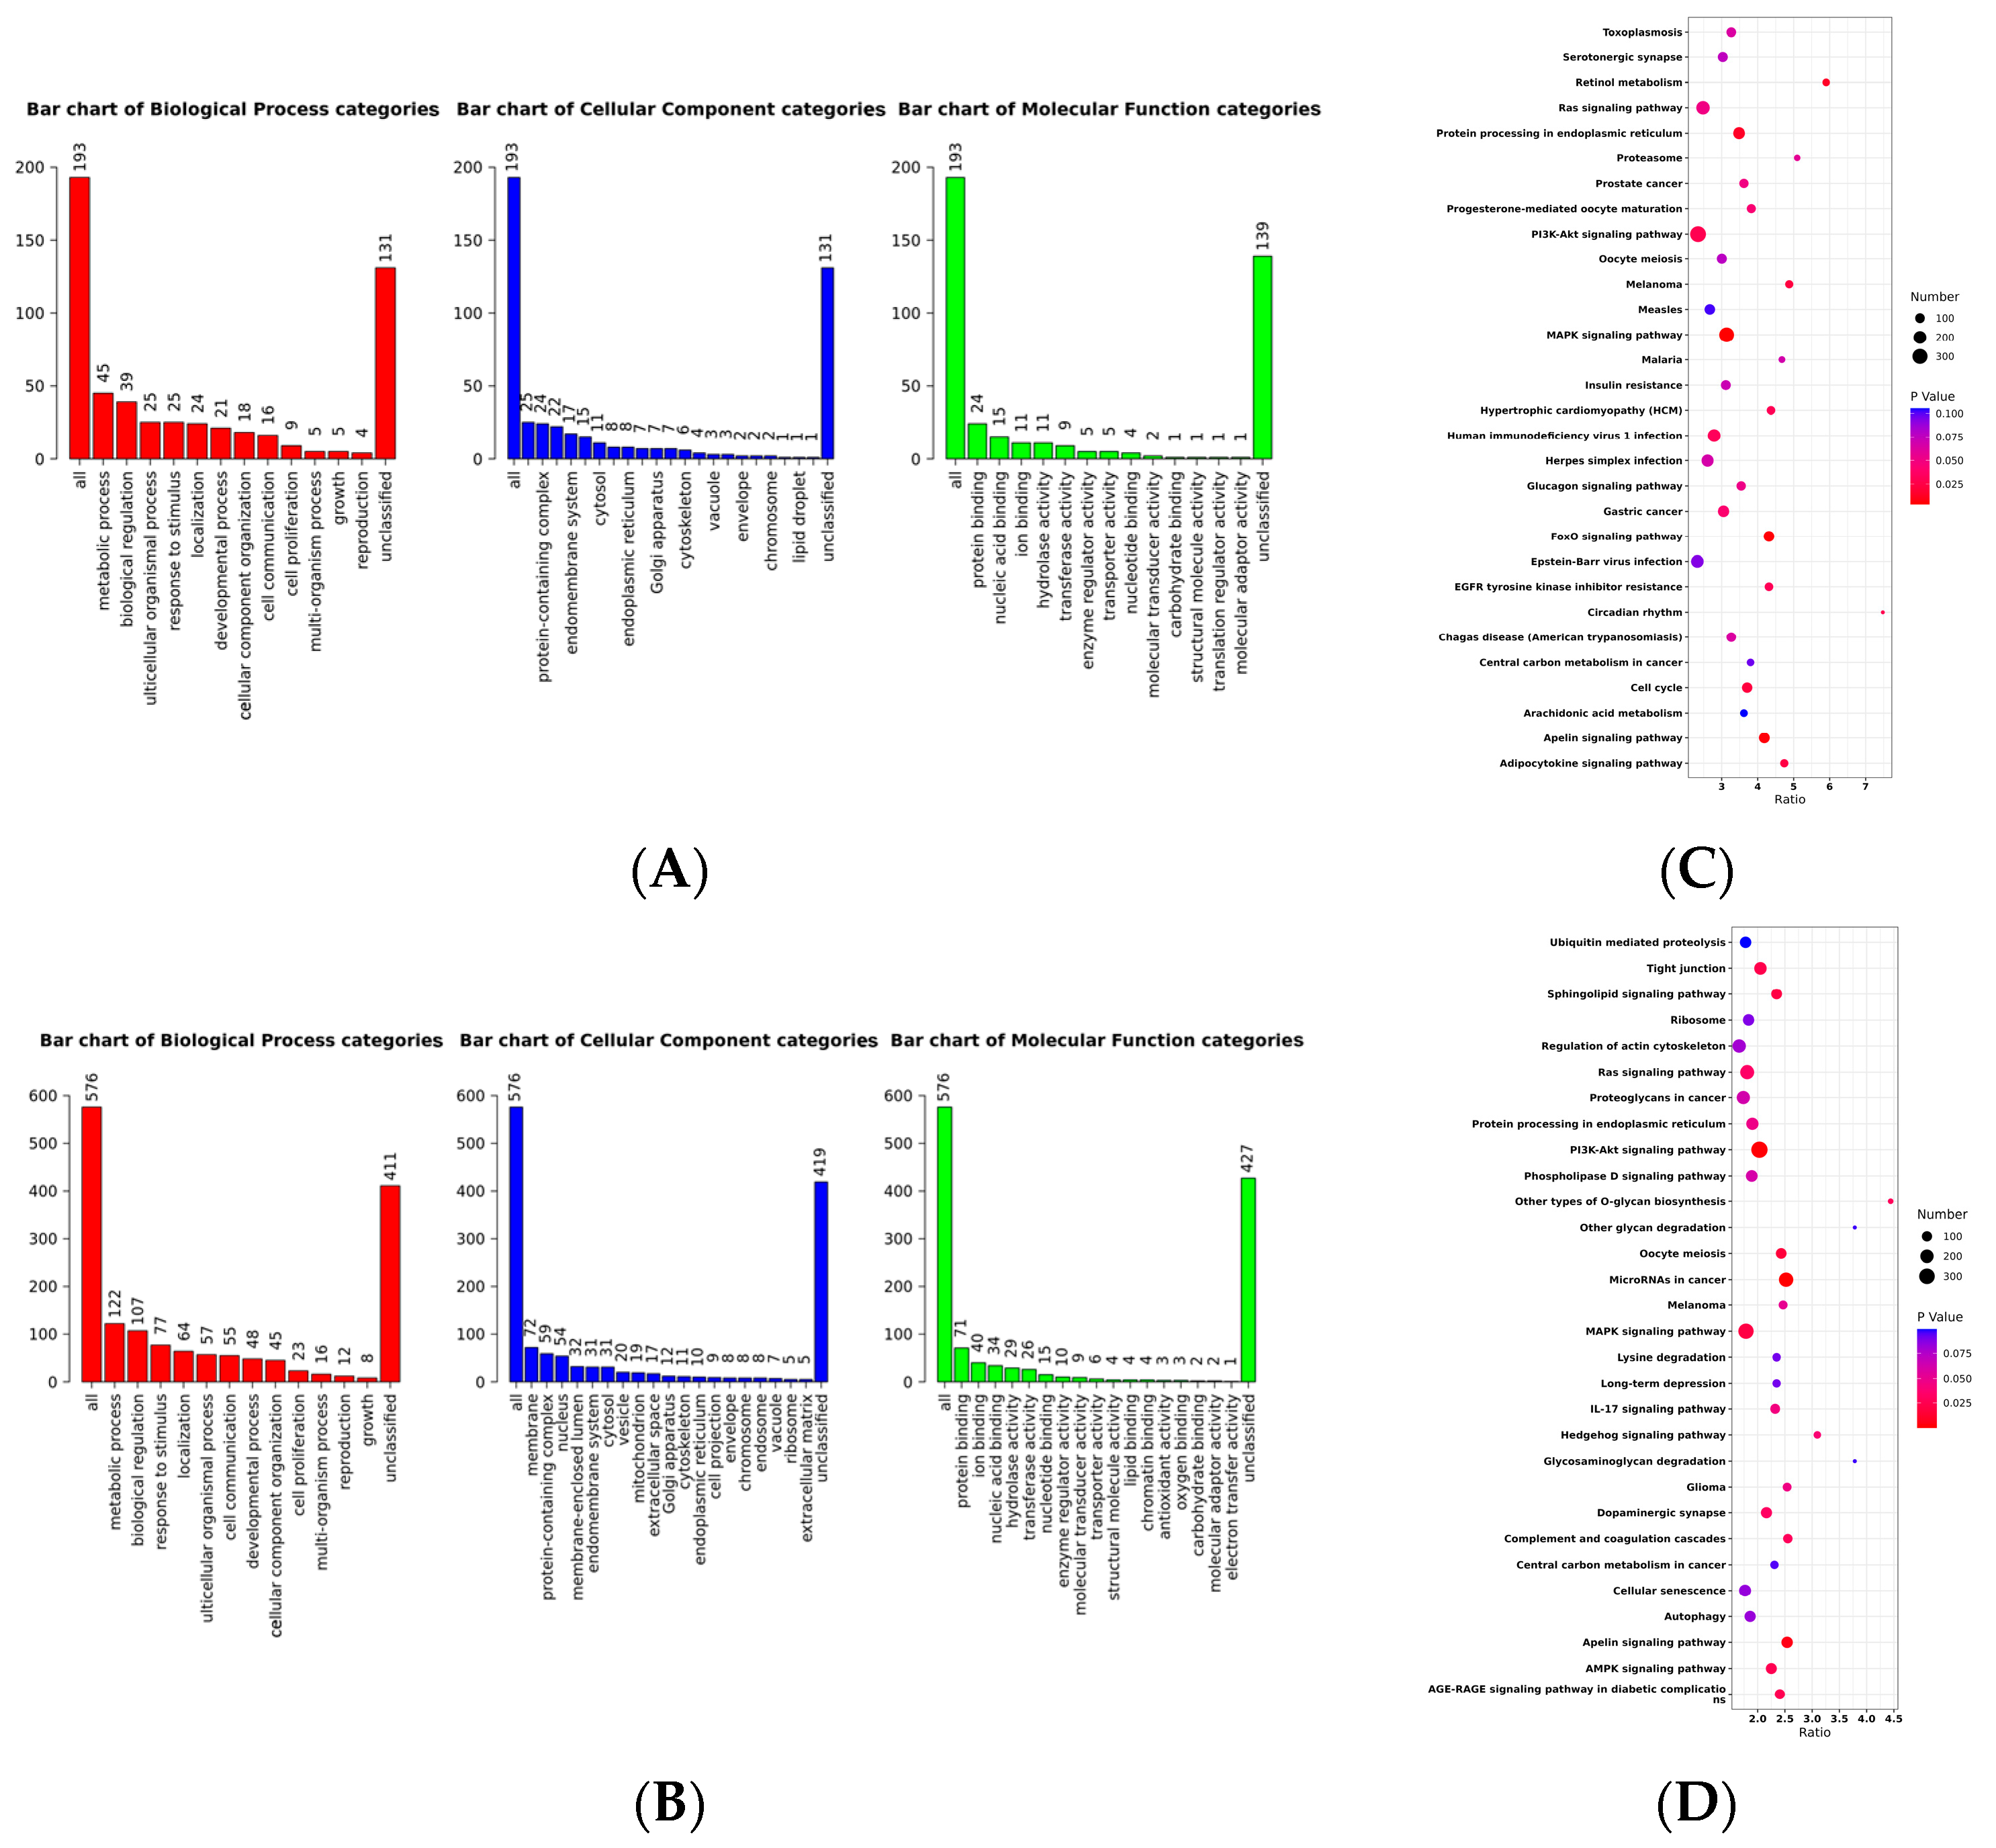
4.7. Pathway and Functional Analysis

Candidate genes were annotated via the Ensembl database (Sus scrofa 11.1, http://www.ensemble.org/; accessed on 16 March 2023) at 100-kb regions (upstream 50 kb and downstream 50 kb) flanking the SNPs of ROH hotspots. The Gene Ontology (GO) terms and Kyoto Encyclopedia of Genes and Genomes (KEGG) pathways were analysed for all candidate genes by the Metascape database (https://metascape.org/; accessed on 16 March 2023).

4.8. Gene Annotation

To determine positional candidate genes, we utilized the BioMart database (http://www.ensembl.org/) for annotating significant SNPs loci. In our study, candidate genes were identified within a 500-kb genomic region upstream and downstream of the significant SNPs. Furthermore, functional annotation of genes within the regions of interest was conducted using the R package WebGestaltR [14]. Additionally, an extensive literature review was performed to gather pertinent information on gene functions for exploratory investigations.

5. Conclusions

In this study, we investigated the selection signatures and runs of homozygosity (ROH) in three Large White pig populations (Canadian, Danish and American) from the porcine 50 K SNPs chip. Our analysis revealed several candidate genes associated with reproductive traits (ADCYAP1, U2, U6, CETN1, Thoc1, Usp14, GREB1L, FGF12) and meat quality traits (MiR-133, PLEKHO1, LPIN2, SHANK2, FLVCR1, MYL4, SFRP1, miR-486, MYH3, STYX) located within genomic regions exhibiting a high frequency of ROH and selection signatures. Our findings suggest that GREB1L may play a role in controlling the expression of rib numbers. These results provide valuable insights into the genetic basis of reproductive and meat quality traits in Large White pigs and contribute to our understanding of the molecular mechanisms underlying these economically important traits.

Author Contributions

C.Y. and Y.W. performed the analyses and wrote the manuscript; P.Z., H.S. and X.M. significantly contributed to the analysis and preparation of the manuscript; Z.Y. assisted with the analysis through constructive discussions; and Y.L. conceived and designed the experiments. All authors have read and agreed to the published version of the manuscript.

Funding

This research was supported by the Project of the Open Competition Mechanism to Select the Best for Revitalizing Seed Industry in Jiangsu Province (JBGS (2021)026), the Joint Research Project of Excellent Livestock Breeds in Anhui Province (340000211260001000431).

Institutional Review Board Statement

The animal study protocol was approved by the Institutional Review Board of The Animal Welfare Committee of Nanjing Agricultural University (protocol code: DK652; 16 April 2022).

Informed Consent Statement

No applicable.

Data Availability Statement

No applicable.

Conflicts of Interest

The authors declare no conflict of interest.

References

  1. Zhang, S.; Zhang, K.; Peng, X.; Zhan, H.; Lu, J.; Xie, S.; Zhao, S.; Li, X.; Ma, Y. Selective sweep analysis reveals extensive parallel selection traits between large white and Duroc pigs. Evol. Appl. 2020, 13, 2807–2820. [Google Scholar] [CrossRef] [PubMed]
  2. Ai, H.; Yang, B.; Li, J.; Xie, X.; Chen, H.; Ren, J. Population history and genomic signatures for high-altitude adaptation in Tibetan pigs. BMC Genom. 2014, 15, 834. [Google Scholar] [CrossRef] [PubMed]
  3. Li, X.; Yang, S.; Tang, Z.; Li, K.; Rothschild, M.F.; Liu, B.; Fan, B. Genome-wide scans to detect positive selection in Large White and Tongcheng pigs. Anim. Genet. 2014, 45, 329–339. [Google Scholar] [CrossRef] [PubMed]
  4. Liu, C.; Li, P.; Zhou, W.; Ma, X.; Wang, X.; Xu, Y.; Jiang, N.; Zhao, M.; Zhou, T.; Yin, Y.J.; et al. Genome data uncover conservation status, historical relatedness and candidate genes under selection in Chinese indigenous pigs in the Taihu Lake region. Front. Genet. 2020, 11, 591. [Google Scholar] [CrossRef]
  5. Gibson, J.; Morton, N.E.; Collins, A. Extended tracts of homozygosity in outbred human populations. Hum. Mol. Genet. 2006, 15, 789–795. [Google Scholar] [CrossRef]
  6. Ceballos, F.C.; Joshi, P.K.; Clark, D.W.; Ramsay, M.; Wilson, J.F. Runs of homozygosity: Windows into population history and trait architecture. Nat. Rev. Genet. 2018, 19, 220–234. [Google Scholar] [CrossRef]
  7. Robinson, J.A.; Räikkönen, J.; Vucetich, L.M.; Vucetich, J.A.; Peterson, R.O.; Lohmueller, K.E.; Wayne, R.K. Genomic signatures of extensive inbreeding in Isle Royale wolves, a population on the threshold of extinction. Sci. Adv. 2019, 5, eaau0757. [Google Scholar] [CrossRef]
  8. Peripolli, E.; Munari, D.; Silva, M.; Lima, A.; Irgang, R.; Baldi, F. Runs of homozygosity: Current knowledge and applications in livestock. Anim. Genet. 2017, 48, 255–271. [Google Scholar] [CrossRef]
  9. Broman, K.W.; Weber, J.L. Long homozygous chromosomal segments in reference families from the centre d’Etude du polymorphisme humain. Am. J. Hum. Genet. 1999, 65, 1493–1500. [Google Scholar] [CrossRef]
  10. Howie, B.N.; Donnelly, P.; Marchini, J. A flexible and accurate genotype imputation method for the next generation of genome-wide association studies. PLoS Genet. 2009, 5, e1000529. [Google Scholar] [CrossRef]
  11. Wu, F.; Sun, H.; Lu, S.; Gou, X.; Yan, D.; Xu, Z.; Zhang, Z.; Qadri, Q.R.; Zhang, Z.; Wang, Z. Genetic diversity and selection signatures within Diannan small-ear pigs revealed by next-generation sequencing. Front. Genet. 2020, 11, 733. [Google Scholar] [CrossRef] [PubMed]
  12. Wang, S.; Yang, J.; Li, G.; Ding, R.; Zhuang, Z.; Ruan, D.; Wu, J.; Yang, H.; Zheng, E.; Cai, G.; et al. Identification of homozygous regions with adverse effects on the five economic traits of Duroc pigs. Front. Vet. Sci. 2022, 9, 855933. [Google Scholar] [CrossRef] [PubMed]
  13. Xu, Z.; Sun, H.; Zhang, Z.; Zhao, Q.; Olasege, B.S.; Li, Q.; Yue, Y.; Ma, P.; Zhang, X.; Wang, Q.; et al. Assessment of autozygosity derived from runs of homozygosity in Jinhua pigs disclosed by sequencing data. Front. Genet. 2019, 10, 274. [Google Scholar] [CrossRef] [PubMed]
  14. Liao, Y.; Wang, J.; Jaehnig, E.J.; Shi, Z.; Zhang, B. WebGestalt 2019: Gene set analysis toolkit with revamped UIs and APIs. Nucleic Acids Res. 2019, 47, W199–W205. [Google Scholar] [CrossRef]
  15. Ge, J.; Liu, K.; Niu, W.; Chen, M.; Wang, M.; Xue, Y.; Gao, C.; Ma, P.X.; Lei, B. Gold and gold-silver alloy nanoparticles enhance the myogenic differentiation of myoblasts through p38 MAPK signaling pathway and promote in vivo skeletal muscle regeneration. Biomaterials 2018, 175, 19–29. [Google Scholar] [CrossRef]
  16. Dong, S.; Han, Y.; Zhang, J.; Ye, Y.; Duan, M.; Wang, K.; Wei, M.; Chamba, Y.; Shang, P. Haplotypes within the regulatory region of MYL4 are associated with pig muscle fiber size. Gene 2023, 850, 146934. [Google Scholar] [CrossRef] [PubMed]
  17. Yan, J.; Yang, Y.; Fan, X.; Liang, G.; Wang, Z.; Li, J.; Wang, L.; Chen, Y.; Adetula, A.A.; Tang, Y.; et al. circRNAome profiling reveals circFgfr2 regulates myogenesis and muscle regeneration via a feedback loop. J. Cachex-Sarcopenia Muscle 2022, 13, 696–712. [Google Scholar] [CrossRef]
  18. Yang, Y.; Sun, W.; Wang, R.; Lei, C.; Zhou, R.; Tang, Z.; Li, K. Wnt antagonist, secreted frizzled-related protein 1, is involved in prenatal skeletal muscle development and is a target of miRNA-1/206 in pigs. BMC Mol. Biol. 2015, 16, 4. [Google Scholar] [CrossRef]
  19. Comuzzie, A.G.; Cole, S.A.; Laston, S.L.; Voruganti, V.S.; Haack, K.; Gibbs, R.A.; Butte, N.F. Novel genetic loci identified for the pathophysiology of childhood obesity in the Hispanic population. PLoS ONE 2012, 7, e51954. [Google Scholar] [CrossRef]
  20. Li, J.; Wu, J.; Jian, Y.; Zhuang, Z.; Qiu, Y.; Huang, R.; Lu, P.; Guan, X.; Huang, X.; Li, S.; et al. Genome-Wide Association Studies Revealed Significant QTLs and Candidate Genes Associated with Backfat and Loin Muscle Area in Pigs Using Imputation-Based Whole Genome Sequencing Data. Animals 2022, 12, 2911. [Google Scholar] [CrossRef]
  21. Dey, B.K.; Gagan, J.; Dutta, A. miR-206 and -486 Induce Myoblast Differentiation by Downregulating Pax7. Mol. Cell. Biol. 2011, 31, 203–214. [Google Scholar] [CrossRef]
  22. Cho, I.-C.; Park, H.-B.; Ahn, J.S.; Han, S.-H.; Lee, J.-B.; Lim, H.-T.; Yoo, C.-K.; Jung, E.-J.; Kim, D.-H.; Sun, W.-S. A functional regulatory variant of MYH3 influences muscle fiber-type composition and intramuscular fat content in pigs. PLoS Genet. 2019, 15, e1008279. [Google Scholar] [CrossRef] [PubMed]
  23. Lin, W.; Chen, L.; Meng, W.; Yang, K.; Wei, S.; Wei, W.; Chen, J.; Zhang, L. C/EBPα promotes porcine pre-adipocyte proliferation and differentiation via mediating MSTRG. 12568.2/FOXO3 trans-activation for STYX. Biochim. Biophys. Acta (BBA)-Mol. Cell Biol. Lipids 2022, 1867, 159206. [Google Scholar] [CrossRef] [PubMed]
  24. Mercurio, S.; Aspesi, A.; Silengo, L.; Altruda, F.; Dianzani, I.; Chiabrando, D. Alteration of heme metabolism in a cellular model of Diamond–Blackfan anemia. Eur. J. Haematol. 2016, 96, 367–374. [Google Scholar] [CrossRef]
  25. Wang, B.; Hou, L.; Zhou, W.; Liu, H.; Tao, W.; Wu, W.; Niu, P.; Zhang, Z.; Zhou, J.; Li, Q.; et al. Genome-wide association study reveals a quantitative trait locus and two candidate genes on Sus scrofa chromosome 5 affecting intramuscular fat content in Suhuai pigs. Animal 2021, 15, 100341. [Google Scholar] [CrossRef] [PubMed]
  26. Song, S.-H.; Kim, K.; Jo, E.-K.; Kim, Y.-W.; Kwon, J.-S.; Bae, S.S.; Sung, J.-H.; Park, S.G.; Kim, J.T.; Suh, W.; et al. Fibroblast growth factor 12 is a novel regulator of vascular smooth muscle cell plasticity and fate. Arter. Thromb. Vasc. Biol. 2016, 36, 1928–1936. [Google Scholar] [CrossRef] [PubMed]
  27. Lundholm, M.; Mayans, S.; Motta, V.; Löfgren-Burström, A.; Danska, J.; Holmberg, D. Variation in the CD3ζ (Cd247) gene correlates with altered T cell activation and is associated with autoimmune diabetes. J. Immunol. 2010, 184, 5537–5544. [Google Scholar] [CrossRef]
  28. Ceballos, F.C.; Hazelhurst, S.; Ramsay, M. Assessing runs of Homozygosity: A comparison of SNP Array and whole genome sequence low coverage data. BMC Genom. 2018, 19, 106. [Google Scholar] [CrossRef]
  29. Schiavo, G.; Bovo, S.; Bertolini, F.; Dall’Olio, S.; Costa, L.N.; Tinarelli, S.; Gallo, M.; Fontanesi, L. Runs of homozygosity islands in Italian cosmopolitan and autochthonous pig breeds identify selection signatures in the porcine genome. Livest. Sci. 2020, 240, 104219. [Google Scholar] [CrossRef]
  30. Reglődi, D.; Cseh, S.; Somoskői, B.; Fülöp, B.D.; Szentléleky, E.; Szegeczki, V.; Kovacs, A.; Varga, A.; Kiss, P.; Hashimoto, H.; et al. Disturbed spermatogenic signaling in pituitary adenylate cyclase activating polypeptide-deficient mice. Reproduction 2018, 155, 129–139. [Google Scholar] [CrossRef] [PubMed]
  31. Ross, R.A.; Leon, S.; Madara, J.C.; Schafer, D.; Fergani, C.; Maguire, C.A.; Verstegen, A.M.; Brengle, E.; Kong, D.; Herbison, A.E.; et al. PACAP neurons in the ventral premammillary nucleus regulate reproductive function in the female mouse. eLife 2018, 7, e35960. [Google Scholar] [CrossRef]
  32. Avasthi, P.; Scheel, J.F.; Ying, G.; Frederick, J.M.; Baehr, W.; Wolfrum, U. Germline deletion of Cetn1 causes infertility in male mice. J. Cell Sci. 2013, 126, 3204–3213. [Google Scholar] [CrossRef]
  33. Wang, X.; Chinnam, M.; Wang, J.; Wang, Y.; Zhang, X.; Marcon, E.; Moens, P.; Goodrich, D.W. Thoc1 deficiency compromises gene expression necessary for normal testis development in the mouse. Mol. Cell. Biol. 2009, 29, 2794–2803. [Google Scholar] [CrossRef] [PubMed]
  34. Crimmins, S.; Sutovsky, M.; Chen, P.-C.; Huffman, A.; Wheeler, C.; Swing, D.A.; Roth, K.; Wilson, J.; Sutovsky, P.; Wilson, S. Transgenic rescue of ataxia mice reveals a male-specific sterility defect. Dev. Biol. 2009, 325, 33–42. [Google Scholar] [CrossRef] [PubMed]
  35. Padua, M.B.; Jiang, T.; Morse, D.A.; Fox, S.C.; Hatch, H.M.; Tevosian, S.G. Combined loss of the GATA4 and GATA6 transcription factors in male mice disrupts testicular development and confers adrenal-like function in the testes. Endocrinology 2015, 156, 1873–1886. [Google Scholar] [CrossRef] [PubMed]
  36. De Tomasi, L.; David, P.; Humbert, C.; Silbermann, F.; Arrondel, C.; Tores, F.; Fouquet, S.; Desgrange, A.; Niel, O.; Bole-Feysot, C.; et al. Mutations in GREB1L cause bilateral kidney agenesis in humans and mice. Am. J. Hum. Genet. 2017, 101, 803–814. [Google Scholar] [CrossRef]
  37. Niu, N.; Liu, Q.; Hou, X.; Liu, X.; Wang, L.; Zhao, F.; Gao, H.; Shi, L.; Wang, L.; Zhang, L. Genome-wide association study revealed ABCD4 on SSC7 and GREB1L and MIB1 on SSC6 as crucial candidate genes for rib number in Beijing Black pigs. Anim. Genet. 2022, 53, 690–695. [Google Scholar] [CrossRef]
  38. Feng, Y.; Niu, L.; Wei, W.; Zhang, W.; Li, X.; Cao, J.; Zhao, S. A feedback circuit between miR-133 and the ERK1/2 pathway involving an exquisite mechanism for regulating myoblast proliferation and differentiation. Cell Death Dis. 2013, 4, e934. [Google Scholar] [CrossRef]
  39. Baas, D.; Caussanel-Boude, S.; Guiraud, A.; Calhabeu, F.; Delaune, E.; Pilot, F.; Chopin, E.; Machuca-Gayet, I.; Vernay, A.; Bertrand, S.; et al. CKIP-1 regulates mammalian and zebrafish myoblast fusion. J. Cell Sci. 2012, 125, 3790–3800. [Google Scholar] [CrossRef]
  40. Chen, Y.; Rui, B.-B.; Tang, L.-Y.; Hu, C.-M. Lipin family proteins-key regulators in lipid metabolism. Ann. Nutr. Metab. 2015, 66, 10–18. [Google Scholar] [CrossRef]
  41. Chang, C.C.; Chow, C.C.; Tellier, L.C.; Vattikuti, S.; Purcell, S.M.; Lee, J.J. Second-generation PLINK: Rising to the challenge of larger and richer datasets. Gigascience 2015, 4, 7. [Google Scholar] [CrossRef] [PubMed]
  42. Waskom, M.L. Seaborn: Statistical data visualization. J. Open Source Softw. 2021, 6, 3021. [Google Scholar] [CrossRef]
  43. Danecek, P.; Auton, A.; Abecasis, G.; Albers, C.A.; Banks, E.; DePristo, M.A.; Handsaker, R.E.; Lunter, G.; Marth, G.T.; Sherry, S.T.; et al. The variant call format and VCFtools. Bioinformatics 2011, 27, 2156–2158. [Google Scholar] [CrossRef] [PubMed]
  44. Shriver, M.D.; Kennedy, G.C.; Parra, E.J.; Lawson, H.A.; Sonpar, V.; Huang, J.; Akey, J.M.; Jones, K.W. The genomic distribution of population substructure in four populations using 8525 autosomal SNPs. Hum. Genom. 2004, 1, 274–286. [Google Scholar] [CrossRef] [PubMed]
  45. Lencz, T.; Lambert, C.; DeRosse, P.; Burdick, K.E.; Morgan, T.V.; Kane, J.M.; Kucherlapati, R.; Malhotra, A.K. Runs of homozygosity reveal highly penetrant recessive loci in schizophrenia. Proc. Natl. Acad. Sci. USA 2007, 104, 19942–19947. [Google Scholar] [CrossRef] [PubMed]
Figure 1. Principal component analysis (PCA) of three Large White pig populations.
Ijms 24 12914 g001
Figure 2. Genome-wide selective signature analysis. (A) Manhattan plots of the distribution of FST on the autosomal chromosomes calculated; (B) Manhattan plots of the distribution of LSBL on the autosomal chromosomes calculated; (C) Venn diagrams of the Top 1% of genes in FST and LSBL.
Ijms 24 12914 g002
Figure 3. Kyoto Encyclopedia of Genes and Genomes enrichment analysis. (A) GO analysis of FST; (B) GO analysis of LSBL; (C) KEGG pathway analysis of FST; (D) KEGG pathway analysis of LSBL. In graphs (A,B), the abscissa represents the GO terms that were the most enriched; the ordinate represents the number of genes that were enriched in this classification. The size of the circles represents the number of genes contained in the particular class in the graph (C,D), the larger the circle is, the more genes there are. Differently coloured circles represent the enrichment degree of false positives, the redder the circle is, the lower the false positive rate.
Ijms 24 12914 g003
Figure 4. Distribution of runs of homozygosity. (A) Total genomic length (Mb) covered by ROH; (B) The number of ROH on each chromosome; (C) Distribution of ROH in different lengths (Mb). The values of length in Mb were transformed in log 10, a presents as the American line, b presents as the Canadian line, c presents as the Danish line; (D) The ROH coverage on each chromosome.
Ijms 24 12914 g004
Figure 5. Frequency of occurrences of each SNP within ROH regions among all of the individuals. (A) American line; (B) Canadian line; (C) Danish line; (D) Venn diagrams of the top 1% of genes in three Large White pig populations.
Ijms 24 12914 g005
Figure 6. Kyoto Encyclopedia of Genes and Genomes enrichment analysis. (A) GO analysis of three Large White pig populations; (B) KEGG pathway analysis of the Canadian line; (C) KEGG pathway analysis of the American line; (D) KEGG pathway analysis of the Danish line. In Graph (A), the abscissa represents the GO terms that were the most enriched; the ordinate represents the number of genes that were enriched in this classification. The size of the circles represents the number of genes contained in the particular class in the graph (BD), the larger the circle is, the more genes there are. Differently coloured circles represent the enrichment degree of false positives, the redder the circle is, the lower the false positive rate.
Ijms 24 12914 g006aIjms 24 12914 g006b
Table 1. Candidate genes are located in genomic regions based on selection signatures detection.
SSC (Sus Scrofa Chromosome)Position (Mb)Distance (bp) *Genes
1182.24–182.36Upstream 117,606STYX
22.79–2.91Upstream 74,339SHANK2
483.49–83.61Upstream 4395CD247
571.79–71.91Upstream 10,224LRRK2
9130.54–130.66Upstream 1660FLVCR1
1216.79–16.91Downstream 14,536MYL4
54.85–55.35Upstream 49,706MYH3
13129.24–129.36Upstream 83FGF12
14131.14–131.216Upstream 41,712FGFR2
1710.44–10.56Downstream 3575SFRP1
10.64–10.76Upstream 118,817miR-486
* The distance was calculated as follows: The starting coordinate of the gene minus the starting coordinate of the selective signature region; candidate genes are a part of sequences located in the region.
Table 2. List of the top 1% runs of homozygosity was detected in three Large White pig populations and the overlapping QTL in pigQTLdb (https://www.animalgenome.org/cgi-bin/QTLdb/SS/index/; accessed on 16 March 2023).
GroupsChromosomeStart (bp)End (bp)Length (bp)Number of SNPspigQTLdb
American143,045,54243,357,270311,7285-
146,085,059148,974,1022,889,04342S: 145,869,313 E: 173,242,773 Average daily gain
498,912,988102,212,6963,299,70851-
6102,107,540102,337,903230,3634-
102,717,110102,796,13679,0262-
102,917,556104,370,9151,453,35923-
104,981,850110,109,3055,127,455121-
772,338,89674,402,0732,063,17742S: 72,215,870 E: 87,765,126 Fat area percentage in carcass
1498,912,988102,212,6963,299,70843-
Canadian444,727,46348,379,8163,652,35354S: 44,723,094 E: 91,039,884 Ham weight
6105,047,268107,701,4192,654,15164-
750,032,12152,080,9182,048,79731-
70,691,78674,260,5343,568,74866S: 70,292,251 E: 83,677,435 Teat number
822,032,46523,585,0361,552,57129-
24,568,71825,096,226527,5082S: 24,414,300 E: 25,683,843 Umbilical hernia
57,175,68258,758,0321,582,35035S: 56,966,700 E: 67,491,976 Hematocrit
1492,778,82194,149,7121,370,89139-
Danish271,619,09174,328,6492,709,55833S: 71,416,758 E: 128,795,277 Leaf fat weight
551,535,64154,004,9772,469,33652-
54,091,88154,253,706161,8255S: 54,354,525 E: 54,411,945 uterine horn length
6105,105,811107,369,3042,263,49357-
983,483,92188,168,1524,684,231111S: 80,796,751 E: 97,479,874 Immunoglobulin G level
1386,541,18388,583,2842,042,10148S: 86,471,446 E: 118,227,339 Lean meat percentage
1576,452,93776,592,155139,2185S: 76,167,178 E: 76,761,699 Intramuscular fat content
77,669,77279,049,1301,379,35826S: 77,173,290 E: 90,664,324 Drip loss
Table 3. Candidate genes related to the economic traits located in genomic regions with a high frequency of ROH.
SSC (Sus Scrofa Chromosome)Start (bp)End (bp)Distance(bp) *Genes
American line
498,912,988102,212,696Upstream 11,008PLEKHO1
6102,917,556104,370,915Upstream 770,187LPIN2
Meta-analysis
6105,105,811107,369,304Upstream 308,820ADCYAP1
Upstream 634,739CETN1
Upstream 934,231THOC1
Upstream 982,113USP14
Upstream 1,314,132GREB1L
Upstream 1,893,085miR-133
Upstream 2,177,038GATA6
* The distance was calculated as follows: The starting coordinate of the gene minus the starting coordinate of the selective signature region; candidate genes are a part of sequences located in the region.
Disclaimer/Publisher’s Note: The statements, opinions and data contained in all publications are solely those of the individual author(s) and contributor(s) and not of MDPI and/or the editor(s). MDPI and/or the editor(s) disclaim responsibility for any injury to people or property resulting from any ideas, methods, instructions or products referred to in the content.

