
Transcriptome Sequencing Analysis of Root in Soybean Responding to Mn Poisoning
by
Ying Liu
1,*,
Yuhu Pan
1,
Jianyu Li
1,
Jingye Chen
1,
Shaoxia Yang
1,
Min Zhao
1 and
Yingbin Xue
2,* 1
Department of Biotechnology, College of Coastal Agricultural Sciences, Guangdong Ocean University, Zhanjiang 524088, China
2
Department of Agronomy, College of Coastal Agricultural Sciences, Guangdong Ocean University, Zhanjiang 524088, China
*
Authors to whom correspondence should be addressed.
Int. J. Mol. Sci. 2023, 24(16), 12727; https://doi.org/10.3390/ijms241612727
Submission received: 8 July 2023
/
Revised: 8 August 2023
/
Accepted: 9 August 2023
/
Published: 12 August 2023
(This article belongs to the Special Issue Plant Responses to Heavy Metals: From Deficiency to Excess)
Abstract
:Manganese (Mn) is among one of the essential trace elements for normal plant development; however, excessive Mn can cause plant growth and development to be hindered. Nevertheless, the regulatory mechanisms of plant root response to Mn poisoning remain unclear. In the present study, results revealed that the root growth was inhibited when exposed to Mn poisoning. Physiological results showed that the antioxidase enzyme activities (peroxidase, superoxide dismutase, ascorbate peroxidase, and catalase) and the proline, malondialdehyde, and soluble sugar contents increased significantly under Mn toxicity stress (100 μM Mn), whereas the soluble protein and four hormones’ (indolebutyric acid, abscisic acid, indoleacetic acid, and gibberellic acid 3) contents decreased significantly. In addition, the Mn, Fe, Na, Al, and Se contents in the roots increased significantly, whereas those of Mg, Zn, and K decreased significantly. Furthermore, RNA sequencing (RNA-seq) analysis was used to test the differentially expressed genes (DEGs) of soybean root under Mn poisoning. The results found 45,274 genes in soybean root and 1430 DEGs under Mn concentrations of 5 (normal) and 100 (toxicity) μM. Among these DEGs, 572 were upregulated and 858 were downregulated, indicating that soybean roots may initiate complex molecular regulatory mechanisms on Mn poisoning stress. The results of quantitative RT-PCR indicated that many DEGs were upregulated or downregulated markedly in the roots, suggesting that the regulation of DEGs may be complex. Therefore, the regulatory mechanism of soybean root on Mn toxicity stress is complicated. Present results lay the foundation for further study on the molecular regulation mechanism of function genes involved in regulating Mn tolerance traits in soybean roots.
1. Introduction
Manganese (Mn) is regarded as the vibrant central element of nearly thirty-five different enzymes, such as Mn superoxide dismutase (SOD) and catalase (CAT) [1,2]. These enzymes play key roles in respiratory action, photosynthesis, and protein and hormone synthesis in plants [1]. Although Mn is one of the important trace elements for plant development, excessive Mn may be harmful to plants [3]. In general, plants just need from 20 to 40 mg/kg Mn (dry weight) to maintain normal nutritional requirements, but the content is usually from 30 to 500 mg/kg in most plants [4]. As a result, many plants have higher levels of Mn than required, and excessive Mn may restrain their growth [5]. Mn poisoning has evolved into a serious trouble in the world, resulting in limiting the growth of crops and reducing crop yield in acid soil regions [3,4].
In recent years, plants suffer from Mn poisoning stress more seriously than before due to pollution and acidification of soil. The amount of Mn accumulated in most of the plants has far exceeded their life requirements [6]. Excess accumulation of Mn in plants has a toxic effect on them; for instance, when plants are stressed by Mn toxicity, their growth rate is slowed down, the lateral roots number is reduced, root vitality is decreased, and the activities of various enzymes are inhibited [7,8], thus affecting the formation of multiple hormones [9]. In addition, excessive accumulation of Mn in food crops could threaten human health through the food chain [10], leading to Parkinson’s disease, and influence the regular function of the liver, blood vascular, immunity, and genital systems [11]. Therefore, the damage resulting from Mn poisoning in crops is straightforward and serious, thus restraining their normal growth.
Plants have produced a couple of ways to adapt to Mn poisoning, such as regulating ion absorption, different separation of Mn at the subcellular level, changing the activity of antioxidant enzymes, and promoting generation and excretion of organic acid to transform Mn into its inactive condition [1,2,12]. For example, Mn toxicity increases peroxidase (POD) activity, promotes Mn separation in the extracellular body of pea (Vigna sinensis), and causes excessive Mn oxidization [13,14]. Isolation of excessive Mn into the vacuole may play an important role in crops’ response to Mn toxicity [15]. In addition, a number of Mn transport proteins that transfer Mn to the vacuole have been authenticated, such as Arabidopsis MTP11, rice MTP8.1, and cucumber MTP8, suggesting that Mn resistance in plants can be adjusted by Mn transport proteins [15,16,17]. Promoted organic acid secretion in roots can promote resistance to excessive Mn via the chelation of excess Mn [18]. In addition, oxalic acid and citric acid secretions in Lolium perenne can restrict the absorbing of Mn, thereby enhancing resistance to Mn poisoning stress [19]. However, increased root malic acid secretion had a considerable effect on the tolerance of Stylosanthes guianensias to Mn [18]. In addition, roots can promote resistance to Mn poisoning stress by adjusting the absorption of metallic elements, such as Ca, Fe, and Mg [20,21,22].
Soybean (Glycine max) is a plant of the genus Glycine in the Fabaceae family, and it is one of the most important legumes in the world [23]. As a crop, soybean frequently suffers diverse metal ion stresses throughout its life cycle, not merely limiting the production but threatening people’s health because of accumulating harmful heavy metallic elements [24,25]. Soybeans are highly susceptible to Mn poisoning. When the soluble Mn2+ concentration exceeded 50 μM, soybean seedling development was inhibited [11]. Mn stress can affect the absorption and transport of plant ions and lead to the inhibition of root growth, the accumulation of ROS (reactive oxygen species), and the destruction of plant hormone homeostasis in vivo [26,27,28]. Therefore, Mn toxicity is one of the main factors influencing soybean root growth and restricting soybean production. How to improve soybean’s adaptability to Mn poisoning stress has evolved into a main problem that urgently needs to be solved.
For the past few years, RNA sequencing (RNA-seq) has been widely used to explore the mechanism of plants, including the response of Citrus sinensis, Citrus grandis, Manihot esculenta, and Cucumis melo to toxicity stress of Al, Cu, Fe, Ca, and other heavy metals [29,30,31,32]. Nevertheless, few studies have been reported on Mn poisoning in soybean, and the molecular regulation mechanism of Mn stress in soybean remains unclear. In the present study, high-throughput deep sequencing was used to conduct whole-genome transcriptome analysis of soybean roots and comparative analysis of Mn toxicity response genes in roots. In addition, the physiological response indices and the contents of various metal ions in roots treated with different concentrations of Mn were studied. The findings revealed further information about regulating specific signaling pathways that participate in adjusting the root resistance to Mn poisoning. They may offer a preliminary foundation for the further study of genes’ functions of resistance to Mn poisoning. Through the above research methods, this study will explore the molecular mechanism of soybean root response to Mn poisoning, further discover some key genes playing regulatory roles in Mn toxicity stress, and lay a foundation for cultivating high-quality soybean varieties with Mn toxicity tolerance traits.
2. Results
2.1. Effects of Growth of Soybean Root Suffering Mn Poisoning
Soybean was cultured in a nutrient solution with different exogenous Mn concentrations (5, 50, 100, 150, 200, and 300 µM) for 15 days. The data of root area index, total root length, root mean diameter, total root volume, and root tips number of soybean were determined to probe the effect of Mn poisoning on root phenotype. The results revealed that with the improvement in exogenous Mn concentrations, Mn toxicity stress had a significant inhibitory effect on soybean root growth (Figure 1A–F and Figure 2A–E). Compared with the soybean roots with normal Mn concentration (5 μM) in the environment, those with high Mn concentrations (50, 100, 150, 200, and 300 µM) were significantly inhibited in terms of soybean root growth (Figure 1A–F). The total root length was significantly reduced by 25.5, 40.4, 55.3, 57.3, and 59.7%, respectively (Figure 2A). The root surface area was also significantly reduced by 28.4, 42.6, 59.0, 58.6, and 65.7%, respectively (Figure 2B). On the contrary, the root volume was decreased significantly by 23.9, 39.3, 57.8, 55.4, and 67.7%, respectively (Figure 2C). The root tips number was also decreased markedly by 24.2%, 37.1, 51.2, 53.6, and 59.7%, respectively (Figure 2E). Meanwhile, the root diameter did not change significantly (Figure 2D). As shown in Figure 1, when the Mn concentration of the treated soybean roots exceeded 50 µM, the root growth was inhibited, and when the treatment concentration was 100 µM, the inhibitory effect was further aggravated.
2.2. Influences of Various Exogenous Mn Concentrations on Soybean Root Biomass
The indices of dry and fresh weights of soybean roots were determined under different levels of Mn concentration. The results showed that the fresh root weight and dry root weight were decreased with improvement in the concentrations of exogenous Mn (Figure 3). Compared with the 5 µM treatment, the 50, 100, 150, 200, and 300 µM treatments had significantly decreased root fresh weight by 20.9, 40.0, 49.3, 52.7, and 59.4%, respectively (Figure 3A), and the dry root weight by 23.6, 42.4, 48.5, 59.1, and 60.2%, respectively (Figure 3B). As shown in Figure 3, when the Mn concentration of the treated soybean roots exceeded 50 µM, the root biomass was decreased, and when the treatment concentration was 100 µM, the decreased amount of root biomass was pretty obvious.
2.3. Influences of Different Concentrations of Exogenous Mn on the Physiological Response Indices of Soybean Roots
The antioxidant enzymes were subjected to the stress response of Mn poisoning. The reaction trend of these four physiological indices in the root system was basically the same as that of Mn poisoning, and each physiological index increased with the increase in exogenous Mn concentration (Figure 4). Compared with the 5 µM treatment, the 50, 100, 150, 200, and 300 µM treatments significantly increased the POD activity of roots by 54.8, 75.4, 132.9, 174.7, and 177.1%, respectively (Figure 4A); the SOD activity by 268.4, 364.9, 470.2, 700.0, and 836.8%, respectively (Figure 4B); and the APX activity by 60.3, 84.5, 119.0, 136.2, and 208.6%, respectively (Figure 4D).
With the increase in Mn concentrations from 5 μM to 100, 150, 200, and 300 μM, the proline (Pro) content in the roots was significantly increased by 61.7, 85.6, 110.5%, and 104.5%, respectively (Figure 4E); and the CAT activity was significantly increased by 200.0, 342.7, 771.4, and 871.4%, respectively (Figure 4C). Compared with the 5 µM treatment, the 50, 100, 150, 200, and 300 µM treatments decreased the soluble protein content by 4.1, 9.1, 16.3, 18.0 and 20.0%, respectively (Figure 4G), but significantly increased the soluble sugar content by 13.3, 35.5, 42.7, 49.3, and 52.7%, respectively (Figure 4H). The malondialdehyde (MDA) content was significantly increased by 14.1, 25.6, and 45.9% with the increase in Mn concentrations from 5 μM to 150, 200, and 300 μM, respectively (Figure 4F).
2.4. Effects of Different Concentrations of Exogenous Mn on Ion Accumulation in Root of Soybean
After the soybean roots were separately cultured in nutrient solution with 5 and 100 µM Mn for 15 days, the content of Mn, Zn, Ca, Fe, Na, K, Se, Mg, Al, and Cu was determined to explore the influence of Mn poisoning on the amassing of ions in the roots of soybean. The experimental results revealed that with the improvement in exogenous Mn concentration, Mn toxicity stress had an effect on the accumulated content of ions in soybean root (Figure 5A–J). Compared with the content of Mn, Fe, Na, Se, and Al in the roots of soybean under normal Mn concentration (5 μM), those under high Mn concentration (100 μM) were significantly increased by 744.1, 97.5, 84.0, 502.3, and 32.2%, respectively (Figure 5A,C,E,H,I). Furthermore, the contents of Ca and Cu were increased by 5.7 and 1.2%, respectively (Figure 5D,J), whereas those of Zn, K, and Mg were decreased significantly by 14.6, 6.4, and 17.1%, respectively (Figure 5B,F,G).
2.5. Influences of Various Concentrations of Exogenous Mn on Plant Hormone Homeostasis in Roots of Soybean
After the roots of soybean were cultured for 15 days in a nutrient solution with different exogenous Mn concentrations (5 and 100 µM), the hormone content indices were determined to verify the effect of Mn poisoning on root hormones. The experimental results indicated that with the improvement in exogenous Mn concentration, Mn toxicity stress had remarkable effects on the content of hormones in soybean roots (Figure 6). Compared with soybean roots under normal Mn concentration (5 μM), soybean root hormone content was significantly decreased under high Mn concentration treatment (100 µM), and the indole butyric acid (IBA), indoleacetic acid (IAA), gibberellic acid 3 (GA3), and abscisic acid (ABA) contents were significantly reduced by 18.4, 21.6, 57.5, and 15.9%, respectively (Figure 6A–D).
2.6. RNA-Seq Analysis of Soybean Roots Treated with Mn Poisoning
The transcription levels of soybean roots treated with 5 and 100 μM Mn for 15 days were analyzed by genome-wide RNA sequencing to explore the molecular-level response of roots to Mn poisoning. Six libraries were established from the transcriptome sequencing data of soybean roots treated with the two Mn concentrations. These libraries produced about 40.8–51.5 million base reads, from which about 40.8–51.4 million clean base reads were obtained. Among them, the rate of mass value greater than 30 (Q30) basis was 92.9–94.7% (Tables S1 and S2). Finally, 45,274 genes were found in soybean roots, among which 1430 differential expression genes (DEGs) were authenticated in the roots of soybean treated with the two Mn concentrations (Figure 7 and Table S3). Among these DEGs, 572 were upregulation genes and 858 were downregulation genes (Figure 7 and Table S3).
2.7. Functional DEGs Enrichment Analysis
The gene ontology (GO) concentration of DEGs in soybean roots was analyzed in accordance with biological process (BP), cell composition (CC), and molecular function (MF). For each GO classification, the most remarkable enrichment was surveyed and presented, as shown in Figure 8 and Table S4. The results indicated that the DEGs in soybean root were mainly concentrated on MF, followed by BP and CC.
The Kyoto Encyclopedia of Genes and Genomes (KEGG) enrichment site map of DEGs was a visual exhibition of KEGG enrichment analysis results (Figure 9 and Table S5). In this study, the top 20 pathways with marked enrichment were chosen to be exhibited. If less than 20 pathway entries were enriched, all pathway entries were displayed. The KEGG enrichment was evaluated by Rich factor (RF), FDR, and the quantity of genes gathered in this passageway. RF means the percentage between the amount of DEGs situated in the passageway entry and the total quantity of genes situated in the passageway entry among all of the interpreted genes. The higher the RF is, the higher the gathering level. In general, the value scope of FDR is 0–1, and the more it approaches zero, the more remarkable the enrichment is. In soybean roots, enrichment was mainly manifested in the biosynthesis of secondary metabolites (194 genes, containing 44 upregulation and 150 downregulation genes), isoflavone biological synthesis (31 genes, containing 2 upregulation and 29 downregulation genes), and flavonoid biological synthesis. Furthermore, enrichment was mainly manifested in ubiquinone and other terpenoid–quinone biosynthesis (30 genes, including 1 upregulated and 29 downregulated); cytochrome P450 metabolizes allobiotin (36 genes, containing 2 upregulation and 34 downregulation genes); drug metabolism—cytochrome P450 (35 genes, containing 1 upregulated and 34 downregulated genes); drug metabolism—other enzymes (35 genes, containing 2 upregulation and 33 downregulation genes); metabolic pathway (236 genes, containing 60 upregulation and 176 downregulation genes); glutathione metabolism (35 genes, including 2 upregulated and 33 downregulated genes); biosynthesis of phenylpropanes (36 genes, containing 10 upregulation and 26 downregulation genes); and circadian rhythm—plants (35 genes in total, including 1 upregulated and 34 downregulated genes).
2.8. Identification of Hormone DEGs
Among all DEGs, 22 genes relevant to the synthesis of hormones were found in soybean roots (Table 1). Nine genes relevant to synthesis of auxin were found, containing Glyma.08g010400, Glyma.06G134000, Glyma.02g142600, Glyma.03g029600, Glyma.05g101300, Glyma.09g011200, Glyma.19G258800, Glyma.17G046000, and Glyma.13G361200. Moreover, two genes related to ABA synthesis (Glyma.07G268400 and Glyma.09G014700) and one gene related to SA synthesis (Glyma.16G145100) were identified. All the DEGs related to hormone synthesis were downregulated in soybean roots. In addition, 10 DEGs related to GA3 synthesis were found. Among them, four (Glyma.12G216100, Glyma.12G137700, Glyma.02G010100, and Glyma.13G285400) were downregulated, whereas the other six DEGs (Glyma.08G208500, Glyma.13G259500, Glyma.19G133600, Glyma.16G200800, Glyma.19G022500, and Glyma.09G149200) were upregulated.
2.9. Identification of Antioxidant DEGs
A total of 14 antioxidant-related DEGs were found in soybean roots treated with normal and high Mn concentrations (Table 2). All of the 14 DEGs were associated with POD. Among them, 2 (Glyma.18G055500 and Glyma.17G198700) were upregulated, whereas the other 12 (Glyma.03G038200, Glyma.20G169200, Glyma.16G055900, Glyma.20G001400, Glyma.01G130800, Glyma.03G038700, Glyma.01G130500, Glyma.10G191700, Glyma.09G022800, Glyma.09G284400, Glyma.02G234200, and Glyma.14G104400) were downregulated.
2.10. Identification of Transporter DEGs
A total of 27 transport-associated DEGs were identified, including 1 metal tolerance protein (Glyma.09G122600), 1 sulfate transporter gene (Glyma.18G168900), 5 vacuolar iron transporter genes (Glyma.02G082500, Glyma.08G076000, Glyma.08G075900, Glyma.05G121300, and Glyma.11G083300), 1 boron transporter gene (Glyma.09G031400), 1 magnesium transporter gene (Glyma.05G153000), 1 calcium ion transporter gene (Glyma.19G038600), 2 ammonium ion transporter genes (Glyma.07G153800 and Glyma.20G082450), 1 aluminum-activated malate transporter gene (Glyma.19G199900), 1 metal transporter Nramp5 (Glyma.06G115800), 1 molybdate ion transporter (Glyma.06G074100), 11 calcium-ion-binding protein genes, and 1 phosphate transporter gene (Table 3). These DEG families showed different expressing patterns in the roots of soybean. For example, the DEGs of the metal tolerance protein, sulfate transporter, vacuolated iron transporter, boron transporter, magnesium transporter, aluminum-activated malic acid transporter, metal transporter Nramp5, and molybdate ion transporter showed upregulated expression. By contrast, the DEGs encoding calcium ion transporters, ammonium ion transporters, calcium-ion-binding proteins, and phosphate transporters were downregulated.
2.11. Identification of DEGs of Transcription Factors
A total of 94 DEGs of transcription factors were identified in all DEGs of soybean root (Table 4), including 37 WRKY transcription factors, 10 bHLH transcription factors, 17 MYB transcription factors, 16 ethylene transcription factors, 2 GATA transcription factors, 2 heat-stress transcription factors, 1 ORG transcription factor, 2 NAC transcription factors, 1 iron-deficiency-inducible transcription factor, 1 TGA transcription factor, 1 E2FE transcription factor, 1 WER transcription factor, 1 JUNGBRUNNEN transcription factor, and 2 RAX transcription factors. The DEGs of these transcription factor families showed different expression patterns in soybean roots. For example, the DEGs that identified WRKY transcription factors were downregulated. Among the 10 bHLH transcription factors, 4 transcription factor genes (Glyma.11G043700, Glyma.15G170500, Glyma.09G064200, and Glyma.01G197900) were downregulated, whereas the other 6 genes were upregulated. The expression of 17 MYB transcription factor DEGs were downregulated except for Glyma.15G259400. Furthermore, 3 (Glyma.02G067600, Glyma.11G014200, and Glyma.10G119100) of the 16 ethylene transcription factor DEGs were upregulated, whereas the other 13 genes were downregulated. The DEGs of other transcription factors, including one GATA gene (Glyma.11G068700), one ORG gene (Glyma.19G132500), one iron-deficiency induction gene (Glyma.12G178500), one E2FE gene (Glyma.17G093600), and one RAX gene (Glyma.07G126900), were upregulated, whereas the other transcription factor genes were downregulated.
2.12. Analysis of Expression of Genes by Quantitative Reverse Transcription-PCR (qRT-PCR)
Quantitative reverse transcription-PCR (qRT-PCR) was implemented for 30 DEGs from the 5 µM (normal group) and 100 µM Mn (treatment group) groups, including 14 genes associated with ion transporters, 4 genes associated with hormones, 3 genes associated with antioxidant enzymes, and 9 genes that act as transcription factors, to confirm the results of transcriptome sequencing (Figure 10).
On the basis of the qRT-PCR analysis, among the gene transcripts evaluated, 30 genes were significantly upregulated or downregulated in the root resistance to Mn poisoning, whereas 10 genes were not (Figure 10). Moreover, two genes related to ion transporters were significantly upregulated, including metal transporter (Nramp5) and vacuolar iron transporter homolog 4 (VIT4c). Meanwhile, six genes were significantly downregulated, including calcium-binding proteins (CML19, CML18, CAST, and KIC), ammonium transporter (AMT2.1), and calcium-transporting ATPase 13 (CTATP13, Figure 10). Six genes related to ion transporters were upregulated, but not significantly, in response to Mn poisoning, including boron transporter 2 isoform D (BT2D), magnesium transporter (NIPA2), metal tolerance protein 10 (MTP10), sulfate transporter 2.1 (SUT2.1), and calcium-binding proteins (CBE and CML23, Figure 10). Moreover, four hormone-related genes were significantly downregulated in response to Mn poisoning, including auxin reactive proteins (SAUR36 and SAUR71), gibberellin-responsive protein 1 (GRP1), and ABA synthesis-related protein (ABA11E) (Figure 10). Peroxidase 46 (POD46) was significantly downregulated, but POD4 and POD16A were not significantly upregulated or downregulated (Figure 10). Six transcription factor genes were significantly downregulated in response to Mn poisoning, including bHLH transcription factor (bHLH25), ethylene reaction transcription factors (ERF017a and ERF017b), WER transcription factors (WER-X2), MYB transcription factor (MYB14), and heat stress transcription factor (HS6); and only FER transcription factor (FER) was significantly upregulated (Figure 10). These results supported the consequences of the RNA-seq (Table S3).
3. Discussion
Mn poisoning harms crops and restricts agricultural development, especially in acidic soils [1,8]. In general, different crops have different endurance capacity levels on Mn toxicity. For example, soybeans are more vulnerable to excess Mn stress than Arachis hypogaea and Stylosanthes guianensis [8,33]. Excess Mn inhibited the normal growth of A. hypogaea and Cucumis sativus, resulting in significantly reduced root dry weight [8,34]. The biomass of A. hypogaea root decreased seriously, and the development of the roots was obviously hindered when suffering Mn poisoning [8]. In the present study, the root growth of soybeans was restrained (Figure 1 and Figure 2), and the root biomass decreased significantly after suffering from Mn toxicity (Figure 3). Excess Mn accumulation in plants appears to cause serious cell damage [8], eventually affecting the proper growth of soybean root.
Plants respond to metal ion stress via refraining from excessive metal-ion absorption and restricting metal-ion transport to shoots [35,36]. In certain plant species, the roots retain a high quantity of Mn, whereas only a slight amount is transported to the shoots [37,38]. Another method is linked to the toleration of plant tissue, with excessive metallic elements compartmentalized in saccules or complexed with organic substances [39,40]. In the present study, the Mn concentrations of soybean roots increased when suffering Mn poisoning (Figure 5). Such an increase can be attributed to one of the tactics of the root to fight Mn poisoning via active absorption and storing extra Mn in roots to promote a stress response in soybean.
In this work, excessive Mn was found in the water culture, and the findings revealed that the Mn concentration in roots exceeded sevenfold, which may be the source of Mn poisoning in the roots of soybean (Figure 5). Analogous findings were obtained by Chen in 2016, where two times the Mn content in roots greatly affected the biomass and root growth of the soybean roots [33]. Though it is a necessity, Mn is a kind of metallic element that will be harmful to plants when occurring in high quantities [1]. Mn toxicity can develop once the Mn level in plant shoots exceeds the concentration of 150 mg/kg dry biomass, particularly in acid soil [34,41]. Furthermore, high Mn can block auxin production, limit meristematic cell growth in roots [42], and increase the production of oxidization Mn and phenols in the plant apoplast [14]. These phenomena could further impede root development and dramatically diminish growth quantity [43]. In this research, Mn poisoning of soybean roots was induced as a result of the considerable increase in accumulated Mn content (Figure 5).
Excessive Mn supply significantly increased the Al level in plant roots, and the added Al, in turn, prevented the further absorption of Mn, thus leading to alleviated Mn toxicity [44,45]. Furthermore, Al reduced the contents of Mn in wheat (Triticum aestivum) [46], cowpea (Vigna unguiculata) [47], and rice (O. sativa) [48]. Al may reduce Mn toxicity in rice by lowering symplastic transport of roots in terms of Mn absorption and the effective Mn reserved in roots and shoots [48]. Present results showed that when the soybean root was subjected to Mn poisoning, the concentration of Al in the root could also increase significantly (Figure 5), which may be because of the root symplastic Mn and Al uptake. However, when Al accumulated to a certain amount, it could prevent further accumulation of Mn, thus alleviating Mn poisoning in soybean roots.
In addition, increasing Fe accumulation and improving Fe absorption are beneficial to plant adaptation to Mn toxicity stress [1]. For example, Mn-resistant cotton (Gossypium hirsutum) varieties have higher Fe content than Mn intolerant cotton varieties [49]. After being poisoned by Mn, the content of Fe in the soybean root obviously changed and maintained a high content (Figure 5). Therefore, the root system of soybean maintains a high Fe content to alleviate the influence of Mn poisoning, and it may be a physiological response mechanism for soybean to adapt to Mn poisoning.
Differing from the change rule of Mn accumulation content in plants, the content of Mg in soybean roots decreased with the increase in concentration of Mn (Figure 5), indicating that the absorption of Mn and Mg may be antagonistic. Results have displayed that Mn poisoning can inhibit root absorption of Mg in Sorghum bicolor, Solanum lycopersicum, S. guianensis, and other vegetation, causing a noticeable reduction in the concentration of Mg in plants [50]. In this research, Mn poisoning observably decreased the concentration of Mg in roots (Figure 5), suggesting that Mn poisoning mainly hindered the accumulation of Mg by the roots of soybean. Reducing the Mg content in roots may have an important effect in alleviating Mn toxicity and maintaining root function normally, and it may be one of the soybean adaptation processes to Mn poisoning. Studies have shown that excessive Mn in plants can affect the absorption of other important metal nutrients [51,52]. Present studies indicated that the exposure of roots to Mn poisoning seriously affected ion accumulation in the roots of soybean. The molecular regulation mechanism involved is very complex, and it may involve many different types of proteins or genes.
As a secondary metabolite from cell metabolic activity in plants, ROS play a positive role in a plant’s ability to tolerate external stress, which depends on the subtle balance between the production of ROS and removal [53]. APX, POD, and SOD are the antioxidant enzymes taking charge of removing plant ROS [54,55]. By increasing the vitality of oxidation resistance enzymes to decrease the production of intracellular ROS, plants can enhance their tolerance to adversity stress [54,55]. For example, Broussonetia papyrifera can effectively alleviate oxidative stress and reduce ROS accumulation by increasing the activity of antioxidases, such as POD, CAT, and SOD [43]. Under the experimental conditions of this study, the enzymatic activities of POD, SOD, CAT, and APX in the soybean root were enhanced significantly when responding to Mn poisoning (Figure 4). Hence, the defense system of oxidation resistance in soybean roots was promptly activated, and the vitalities of various types of antioxidant enzymes in the roots were significantly different. SOD, POD, CAT, and APX may be mainly responsible for scavenging ROS in soybean roots, thus reducing the damage of ROS to soybean roots.
In addition, MDA content is an important reference index to fully reflect the lipid peroxidation level of plant cell membranes [56]. In the present study, the level of peroxidation of the membrane lipid in the roots of soybean suffering Mn poisoning markedly exceeded the normal group (Figure 4). Mn poisoning may destroy the ROS metabolite homeostasis between cells, resulting in an evident increase in the MDA content of roots. Pro plays an important role in regulating osmotic pressure, keeping cell strength, and retaining cytoplasmic stabilization, thereby contributing to holding the cell stability [57]. Pro can also act as one of the ROS removers, working in concert with antioxidase to decrease plant ROS [58]. In the present study, the Pro content in the soybean root exposed to Mn toxicity significantly increased, indicating that soybean roots require more Pro to maintain normal osmotic pressure and remove excessive ROS. Soluble protein can participate in osmoregulation as an osmoregulatory factor, reflecting the degree of plant organ damage [59]. The biosynthesis of soluble protein in plants is influenced by abiotic stress responses [60]. In the present study, the soluble protein content of soybean roots decreased markedly when suffering Mn poisoning, and such a decrease may be a response of soluble protein to Mn poisoning. Moreover, with a view that the degradation of soluble proteins could produce plenty of free amino acids, Pro is a kind of amino acid that increases rapidly in many plants, and its increase may be concerned with the decomposition of soluble proteins [61]. In addition, the contents of soluble sugar showed a significantly increasing trend under Mn poisoning stress in the present study. This finding may be caused by the increase in soluble sugar to regulate cell osmotic pressure and organic small molecule solutes to reduce intracellular water potential to achieve the purpose of absorbing water from the surrounding cells [43]. Furthermore, soluble sugar can stabilize the colloidal properties and protect plant cells from harm [62].
Phytohormones have the important function of controlling the growth of plants and reacting to various abiotic and biotic stressors [9]. Furthermore, growth hormones have an important effect in controlling the growth of roots and reacting to environmental changes; genes from the families of AUX1/LAX (AUXIN1/LIKE AUX1) and PIN (PINFORMED) participate in regulating polarity transport in growth hormones and optimize hormone distribution in root tips, which is vital for adjusting root development [42,63]. When Arabidopsis seedlings are treated with Cd, the expression of IAA17 and PIN1/3/7 is affected distinctly, resulting in the transportation of plant hormones being inhibited in roots and decreasing the hormone contents in the root tip [64]. As a result, the primary root elongation in Arabidopsis was inhibited. Aux/IAA proteins are growth hormone signaling regulators, and their stability indicates the plant’s response strategy to environmental changes [65,66]. Superabundant Mn inhibited the development of primary roots in A. thaliana [67,68], possibly due to decreased biological synthesis of IAA, and reduced the expression of hormone transporter genes (PIN4 and PIN7) when suffering Mn poisoning; ultimately, this affected the concentration of hormones in the root tips and root development [42]. In this study, the growth hormone levels in soybean roots were less with Mn poisoning than at a normal Mn level (Figure 6), limiting the root development of soybean (Figure 1, Figure 2 and Figure 3).
Gibberellic acid 3 (GA3) is a kind of tetracyclic diterpenoid which contributes to plant growth, development, and response to abiotic stressors [69]. GA3 increases germination of seeds, elongation of the stem, promotes flowering, expansion of leaf, and the development of fruit [70]. Many genes are involved in controlling GA3 production and degradation, including the three main oxidizing enzyme genes in the GA family, namely, GA20-oxidase, GA3-oxidase, and GA2-oxidase, all of which contribute to GA3 catabolism and biosynthesis [71]. Root elongation is dependent on the action of GA3, which facilitates root cell division and elongation [72]. Furthermore, the GA3 content of Arabidopsis can influence drought tolerance [73]. GA3 can improve Arabidopsis salt tolerance by modulating SA levels [74]. Moreover, GA3 may reduce Cd poisoning via decreasing the expression of IRT1 (Cd absorption-related gene) in A. thaliana [75]. When the roots of soybean suffered from Mn poisoning, the concentration of GA3 in the roots decreased (Figure 6), restraining root elongation (Figure 1–3). This finding could be attributed to Mn poisoning affecting the expression of genes in connection with GA3 production, whereafter influencing the concentration of GA3 and the growth of root cells.
Abscisic acid (ABA) is a kind of critical hormone which causes plants to tolerate metal poisoning [76]. ABA acts primarily in the meristem and elongation area of roots, and at a certain concentration, ABA stimulates growth of primary roots while inhibiting lateral root development, hence changing the root system conformation [77,78]. Under abiotic stress, plants may adjust the concentration of ABA by modulating the expression of numerous genes involved in the production of ABA [76]. In response to environmental stress, genes such as abscisic aldehyde oxidase, alcohol dehydrogenase (ABA2), and 9-cis-epoxycarotenoid dioxygenase affect ABA production [76,79,80]. Heavy metal element stressors from Zn, Ni, Al, and Cd can reduce plant ABA concentration [80]. Furthermore, ABA has an important role in dealing with various abiotic stimuli, including metal-ion toxicity, high- or low-temperature stress, drought stress, and saline–alkali stress [80]. In response to the harmful effects of excessive metal ions, ABA may function as a trigger to promote the amassing of Pro and oxidation resistance enzymes [81]. In this research, as the roots of soybean were suffering from Mn poisoning, the genetic expression in connection with ABA biosynthesis in the system of roots was altered (Table 1). Such alteration affected the ABA content (Figure 6) and root development (Figure 1, Figure 2 and Figure 3), most likely on account of the cell development of the meristem and elongation region in the roots of soybean influenced by the concentration of ABA. As a result, the formation of the root structure was altered.
Although RNA-seq has been used to identify the response of some plants to heavy-metal ion stress, only the responses of grape (Vitis vinifera) roots and peanut roots to Mn toxicity stress have been reported [8,82,83,84]. A total of 2629 and 3278 DEGs were found in the roots of Combier and Jinshou cultivars, respectively, indicating that these two cultivates may have a different tolerance to Mn toxicity [85]. Transcriptomic profiling studies revealed 731 DEGs in peanut roots suffering Mn poisoning, showing the response of peanut roots to Mn poisoning [8]. At present, genome-wide studies mainly focus on the response of soybean leaves to Mn poisoning [2,86]. However, no reports are available on the response of roots to Mn poisoning in soybean. In the present work, a genome-wide study of the DEGs responding to Mn poisoning in the roots of soybean was conducted using RNA-seq technology. A total number of 1430 DEGs were found in the soybean roots. Among them, 572 and 858 genes were upregulated and downregulated, respectively (Figure 7). Therefore, soybean roots may have unique molecular regulatory pathways to cope with Mn toxicity stress.
Excessive Mn transfer in many plants is a response mechanism to Mn toxicity stress, and this process is mainly regulated by metal-ion transporters [22,87]. For example, the expression of Prunus persica PpNramp5 was considerably enhanced under Mn poisoning stress, and the heterologous expression of PpNramp5 in the Saccharomyces cerevisiae verified the function of transporting Mn [88]. Wheat (Triticum aestivum) vacuolar iron transport protein TaVIT2 is involved in the transportation of Mn; and the study shows that by promoting iron transport in the endosperm vacuole, this indispensable trace element accumulates in the tissue [89]. In the present work, metal-ion transporter genes GmNramp5 (Glyma.06G115800) and GmVIT4c (Glyma.08G076000) were significantly upregulated in the soybean roots suffering Mn poisoning (Table 3), indicating that they were responsive to Mn toxicity. Therefore, altering excessive Mn transport in soybean roots by altering the transcription of metal-ion transporters may be crucial to Mn tolerance in soybean.
Subcellular localization of Mn has an important effect in plants’ tolerance to Mn toxicity [34]. Studies have suggested that A. thaliana AtECA3 and AtECA1 are located in the Golgi apparatus and ER (endoplasmic reticulum), respectively, belonging to Ca-transporting ATPase and directly regulating the transport of excessive Mn to these two locations [90,91]. Furthermore, in a Mn-toxic environment, AtECA1 or AtECA3 mutation can hinder development of roots and chlorophyll synthesis of A. thaliana [90,91]. In the current study, the expression of calcium transport ATPase (Glyma.19G038600) in the roots of soybean was downregulated to adapt to Mn poisoning (Table 3), suggesting that the calcium transport ATPase gene in soybean root may be involved in the detoxification of Mn. It may also be located in the endoplasmic reticulum or Golgi apparatus and be involved in adjusting the division and regionalization of excess Mn in these two locations.
In addition, the family of MTP is a kind of crucial Mn transporter protein that controls the absorption and transport of Mn in plants [92,93]. Research shows that Camellia sinensis CsMTP8.2 acts as a Mn specific transporter protein, promoting excess Mn2+ outflow from vegetable cells [93]. Moreover, O. sativa OsMTP11 is involved in Mn activization in cytoplasmic and vacuolar membranes, and it may play vital effects in transporting Mn and other metallic elements [92]. In the present study, GmMTP (MTP10) was found in the roots in response to Mn poisoning, which caused its expression (Glyma.09G122600) to be upregulated (Table 3). The finding suggested that GmMTP10 may participate in the adaptability of soybeans to Mn poisoning by regulating the accumulation and redistribution of Mn, possibly providing molecular-level evidence for the apparent Mn symptoms found in soybean roots.
Maintaining the dynamic balance of ions in plants, possibly by regulating the absorption and transport of metal elements, such as Fe and Mg, is a critical method to deal with Mn poisoning stress [2,8]. This study indicates that 100 µM of Mn treatment increased the expression of the magnesium transporter gene (Glyma.05G153000) in soybean roots (Table 3). Such an increase may promote a large amount of Mg in the roots to be transported from the roots to other tissue sites of the plant, thus resulting in a substantial decrease in Mg content in the roots. This finding indicated that Mn poisoning stress may affect the gene expression of the Mg transporter. Therefore, the accumulation of Mg in soybean roots was affected. In addition, the elevation of Fe can ameliorate Mn toxicity, to some extent, in barley (Hordeum vulgar) [94]. Fe also helps improve the tolerance of Triticum aestivum to excess Mn stress [8,95]. In this research, excess Mn stress improved the content of Fe in soybean roots. The increased Fe may have a positive effect on the adaptation of soybean roots to excess Mn stress.
Because excess Mn may bring about oxidative responses of stress, adjusting the antioxidant enzyme activity is generally considered as a basic method of excess Mn tolerance [96,97]. Mn poisoning stress increased the activity of POD and genetic expression of pea (Pisum sativum) and S. guianensis, both of which had a vital effect on plant acclimation to Mn toxicity [96,98]. In the present study, 2 PODs (Glyma.18G055500 and Glyma.17G198700) were upregulated, whereas the other 12 PODs were downregulated in soybean roots (Table 2). Therefore, the upregulation or downregulation of the 14 PODs may be conducive to improving the tolerance of soybean roots to Mn poisoning.
Aux/IAA proteins are the negative regulation factors in the auxin signal transduction pathway [99]. The regulation of Aux/IAA homeostasis is regarded as the response of plants to external environment signals [64]. Mn poisoning decreases the content of auxin in plant roots by decreasing the biosynthesis of auxin and restraining the transport of auxin by reducing the gene expression of PIN4 and PIN7 belonging to the auxin efflux carrier family, and the findings of the qRT-PCR revealed that four auxin biological synthesis genes (ASA1, SUR1, YUC2, and YUC3) had observably reduced expression in responding to Mn poisoning [42]. In this research, the genetic expression of nine genes (Glyma.08G010400, Glyma.06G134000, Glyma.02G142600, Glyma.03G029600, Glyma.05G101300, Glyma.09G011200, Glyma.19G258800, Glyma.17G046000, and Glyma.13G361200) related to auxin synthesis was significantly downregulated (Table 1). The results implied that Mn poisoning stress could affect the genetic expression of genes in connection with auxin synthesis and thus affect the generation of growth in soybean roots.
Evidence showed that a gene belonging to the bHLH family of transcription factors, AtNAI1, affects the expression of AtMEB1/2 and controls the tolerance of Arabidopsis to Mn poisoning [100]. In the present study, 94 transcription factors in soybean roots were found to have different responses to Mn toxicity. Of the 10 bHLH transcription factors, 6 (Glyma.04G090100, Glyma.02G025500, Glyma.13G098000, Glyma.07G185300, Glyma.19G222000, and Glyma.18G039200) were upregulated, whereas the other 4 (Glyma.11G043700, Glyma.15G170500, Glyma.09G064200, and Glyma.01G197900) were downregulated to adapt to Mn poisoning (Table 4). However, the mechanisms of the bHLH transcription factor family in the roots of soybean responding to Mn poisoning remain unclear. Hence, complicated adjusting mechanisms in soybean roots may be involved in responding to Mn toxicity, and these mechanisms need further exploration.
The finding of the experiment demonstrated that after the soybean root system suffered high Mn poisoning, Mn toxicity could lead to increased oxidative stress and membrane damage by increasing the activities of superoxide free radicals and malondialdehyde (MDA), inducing downregulation of the expression levels of different DEGs, such as metal transport genes, hormone synthesis-related genes, and some transcription factors. The accumulation of metal ions, hormone synthesis, and the physiological and biochemical changes influenced the growth and metabolism of roots. In response to the toxicity stress of high Mn, the root cells activated the antioxidant oxidase system. Although the improvement in activity of antioxidant enzymes could relatively reduce the content of ROS, it could not reverse the trend of high ROS content in root cells under the toxicity stress of high Mn, resulting in irreversible cell damage. In conclusion, the toxicity stress of high Mn levels affected the cell integrity, nutrient uptake, hormone regulation, and resistance of soybean root growth. It resulted in inhibited root growth and development and then led to the decrease in root biological yield. The regulatory process of roots suffering Mn poisoning in soybean is shown in Figure 11. The results demonstrated that soybean roots may have complicated regulating mechanisms in responding to Mn poisoning stress, thus demanding further study.
4. Materials and Methods
4.1. Source of Plant Materials
The soybean variety used in this study is named YC03-3 (Yuechun 03-3), cultivated by the RBC (Root Biology Center in South China Agricultural University) and grown in the experimental base belonging to CCAS (College of Coastal Agricultural Sciences in Guangdong Ocean University) (eastern longitude: 110.300832, northern latitude: 21.151215). The seeds were germinated in sand and cultured for 8 days before being treated with Mn. As previously described, soybean seedlings with consistent growth were transported to a plastic box with a volume of 15 L for hydroponics, and improved Hoagland nutrient solution was added [2]. The nutrient solution used contained 400 µM NH4NO3, 25 µM MgCl2, 1500 µM KNO3, 1.5 µM ZnSO4·7H2O, 500 µM MgSO4·7H2O, 40 µM Fe-EDTA(Na), 300 µM K2SO4, 1200 µM Ca(NO3)2·4H2O, 300 µM (NH4)2SO4, 0.5 µM CuSO4·5H2O, 500 µM KH2PO4, 2.5 µM NaB4O7·10H2O, and 0.16 µM (NH4)5MoO24·4H2O. All of the chemical reagents used in this study were analytical grade (Solarbio corporation, Beijing, China). Meanwhile, 5, 50, 100, 150, 200, and 300 µM MnSO4 (Guangzhou Reagent, Guangzhou, China) was added into the nutrient solution for Mn treatment. The control group was treated with 5 µM Mn. The experiments were carried out in four biological replicates for every Mn concentration. A temperature range at 25–30 °C/18–22 °C was adopted to adjust the growth of the plant. The light cycle was about 12 h/day, and the culture solution was updated every 5 days. The pH value of the culture solution was regulated to 5.0 by 1 M potassium hydroxide or sulfuric acid every 2 days (Solarbio corporation, China). After the soybeans were treated with 5, 50, 100, 150, 200, and 300 µM Mn for 15 days, the roots were harvested to test their fresh weight, dry weight, growth indices, and various ion contents.
4.2. Surveying Dry and Fresh Biomass of Roots in Soybean
The fresh biomass of roots in soybean was measured immediately after harvest. The soybean roots were put in a constant-temperature oven (Shanghai Yiheng Corporation, Shanghai, China) and thoroughly dried at the temperature of 105 °C for 30 min. Therewith, the samples were then kept in an oven at 65 °C for 8 days. Afterwards, the dry weight was calculated [11]. There were four biological replicates for each treatment.
4.3. Assessment of Root Phenotype Data
The WinRHIZO technique was adopted to assess the root phenotype data of soybean seedlings as reported earlier [101]. Soybean roots from various experimental groups were acquired and fully spread on the image scanner (Epson, Tokyo, Japan). Test materials were assessed with the assistance of the software of WinRHIZO (WinRHIZO 2013e Professional Edition, WinRhizo Pro, Quebec, QC, Canada).
4.4. Determination of Content of MDA
After soybean was treated with 5 (normal level of Mn) and 100 (Mn poisoning concentration) µM MnSO4 for 15 days, the physiological indexes of the roots were determined. The MDA content was measured by applying the improved technologies of TBA (thiobarbituric acid) [102]. In short, 0.1 g of the root was triturated and homogenized in 10 mL phosphate buffer solution (Guangzhou Reagent, Guangzhou, China, 0.05 M) and then isolated with 2 mL of 0.6% TBA (Guangzhou Reagent, Guangzhou, China). The extraction substance was put in a 100 °C constant-temperature water bath (Lichen corporation, Shanghai, China) for 15 min and then quickly cooled down with ice. After centrifugation was performed at the speed of 4200 rpm in a supercentrifuge (Eppendorf 5415D, Hamburg, Germany) for 20 min, an ultraviolet spectrophotometer (Yuanxi UV-5100B, Shanghai, China) was used. The absorbance of the liquid supernatant was determined at wavelengths of 450, 532, and 600 nm separately. The TBA compounds in MDA were quantified with the extinction coefficient.
4.5. Determination of concentration of soluble protein
The Coomassie brilliant blue (CBB) method was accepted to test the content of soluble protein [103]. Root tissue homogenates (0.1 g) were extracted in 10 mL PBS (phosphatic buffer solution) (0.05 M, pH = 7.8), followed by 2.9 mL mixed solution including 0.1 g CBB G-250 (Guangzhou Reagent, Guangzhou, China). After the reaction for 2 min, the absorbency of the liquid supernatant was tested at a wavelength of 595 nm to compute soluble protein contents in samples by adopting the BSA (bovine serum albumin) standard curve (Guangzhou Reagent, Guangzhou, China).
4.6. Determination of Soluble Sugar Content
The anthrone method was used to determine the content of soluble sugar [104]. First, 0.2 g of fresh soybean root samples was weighed and mixed, placed in a test tube with a plug, and 15 mL distilled water was added. The compound was heated to boiling for 20 min, and the samples were removed, cooled, and filtered through a bottle with a capacity of 100 mL. Next, 1.0 mL of the extraction liquid to be measured was mixed with 5 mL anthrone reagent (Solarbio corporation, China) for extraction. The absorbency was determined at a wavelength of 620 nm. The standard curve of glucose (analysis of pure anhydrous glucose) was accepted to compute the concentration of sugar in samples.
4.7. Assaying the Content of Pro
Root materials (0.1 g) were blended with 3% sulfosalicylic acid (10 mL) (Guangzhou Reagent, Guangzhou, China) and then filtered to assess the Pro concentration of soybean roots [105]. The reaction mixed solution consisted of 2 mL liquid supernatant, 2 mL glacial acetic acid (Solarbio corporation, China), and 3 mL acidic indole solution (Guangzhou Reagent, Guangzhou, China). The mixture was transferred to a glass tube, reacted at the temperature of 100 °C for 60 min, and cooled with an ice block. The product was isolated with 5 mL methylbenzene (Ghtech, Shantou, China) and rotated for 30 s. The color change was determined by an ultraviolet spectrophotometer at a wavelength of 520 nm, with methylbenzene as the blank control group. The calibration curve on account of the Pro standard was established to determine the Pro content in roots.
4.8. Enzyme Activity Measurement
Root tissues (0.1 g) treated with different concentrations of Mn were adequately crushed and blended with precooled phosphate buffers (0.05 M, pH = 7.8). And then, centrifugation was conducted at the temperature of 4 °C and velocity of 10,000 rpm for 20 min. The enzyme activity was measured in a supernatant solution. The vitality of SOD was surveyed by application of the means reported earlier [106]. The analysis system consisted of 0.5 mL botanical extracts and 1 mL 125 mM natrium carbonicum (Solarbio corporation, China), 0.4 mL 25 µM NBT (Nitro blue tetrazolium) (Solarbio corporation, Shanghai, China), and 0.2 mL 0.1 mM ethylenediamine tetraacetic acid (Ghtech, Shantou, China). Then, 0.4 mL 1 mM oxammonium hydrochloride (Guangzhou Reagent, Guangzhou, China) was supplemented to activate chemical reactions, and the light absorption value was surveyed at the wavelength of 560 nm. The SOD unit was represented by the quantity of enzyme requested to prevent a 50% drop in NBT.
The activity of POD was surveyed as previously reported [107]. The mixture consisted of 30% hydrogen peroxide (Guangzhou Chemical, China) and 1% methyl catechol (Solarbio corporation, China), with a total volume of 3 mL. In reactions, 40 µL of the enzyme extract was supplemented into the compound. The absorbance variation due to oxidation of methyl catechol was surveyed at a wavelength of 470 nm. The activity of the POD unit was represented as a 0.01 decrease in OD470 nm within 1 min.
The CAT activity was determined using the reported technique [108]. The mixed substance contained 2.9 mL of 30% hydrogen peroxide, 0.1 mL enzyme extracted material, and 0.15 M PBS (pH = 7.0). The activity of CAT was evaluated by supervisory controlling the attenuation level of the absorbance value of hydrogen peroxide in OD240 nm.
The vitality of APX was measured via inspecting the absorbance of the oxygenization rate of ascorbate in OD290 nm [109]. The mixed solvent of the reaction was composed of 0.1 mL extract, 2.6 mM EDTA, 0.15 mM H2O2, and 0.15 mM ascorbic acid (Ghtech, China). The APX activity unit was expressed by the amount of enzymes requested to oxidize 1 µM of ascorbic acid.
4.9. Determination of Ion Content in Soybean Roots
Under different conditions of Mn treatment, soybean roots were taken on day 15 to determine their ion concentration. After the roots were dried and crushed, 0.2 g of samples was weighed, moved to a digestion tank (Changyi, KH-15, Beijing, China), and soaked overnight with 5 mL 98% sulfuric acid (Kermel, Tianjin, China). The digestion tank was placed in a constant-temperature oven (Beijing Yiheng BGP9050AH, Beijing, China) at a temperature of 80 °C for 2 h, at a temperature of 120 °C for 2 h, and at a temperature of 160 °C for 4 h, when the root materials were digested in transparent liquid. After the root materials were cooled down to 25 °C, the inner tank and lid of the digestion tank were cleaned three times with 1% sulfuric acid. The eluant was then moved to a measuring bottle with capacity of 50 mL (Robinde, Nanchang, China), and 1% sulfuric acid solution was added into the bottle until the scale line. The concentrations of Mg, Fe, and Mn in the roots of soybean were measured with an ICP-AES (inductively-coupled plasma atomic emission spectrometer) (Hitachi PS7800, Tokyo, Japan), with vacant digestive juices as the control group [110]. Elements were measured four times. The unique spectral wavelength of the elements was used to identify the types of metal elements, and the element contents were quantitatively analyzed by comparing the intensity of the mass spectrometry signal with the concentration of these elements.
4.10. Identification of the Presence of Four Different Hormones in the Roots of Soybean
Phytohormones were acquired from the roots of soybean that dealt with various concentrations of Mn (5 and 100 μM MnSO4), and the hormone contents, such as indole butyric acid (IBA), indoleacetic acid (IAA), GA3, and ABA, in the soybean roots was determined using HPLC (high-performance liquid chromatography) (AGLIENT1290, Santa Clara, CA, USA) combined with series MS/MS (mass spectrometry) (AB SCIEX-6500Qtrap, San Diego, CA, USA); the internal standard substances were added into the extracts to correct the assay results [111,112]. External standards (ABA, IAA, IBA, and GA3) were pure chromatographic products (Sigma, Waltham, MA, USA). Deuterated IBA, IAA, GA3, and ABA (Sigma, USA) were used as internal standards. C18 QuECherS (Shanghai Amperex, China) was utilized to pack the chromatographic columns, and the acetonitrile and methyl alcohol were chromatographically pure (Merck, Darmstadt, Germany). The methods of hormone extraction and content measurement refer to those previously reported [111,112].
The produced standard curve working solution may be utilized to construct the standard curve for further hormone content computation. First, 988 μL of methanol solution (Kermel, China) was placed into 1.5 mL centrifuge tubes, and 2 L of each 500 g/mL of the corresponding hormone external standard stock solution was added, shaken well, and configured as the external standard master solution with an eventual concentration of 1 μg/mL. Then, 990 μL methyl alcohol solution was supplemented in a 1.5 mL centrifugal tube, and 2 L of each 500 μg/mL of the appropriate hormone internal standard stock solution was added and agitated vigorously to make the master batch of internal standard at a final concentration of 1 μg/mL. Finally, methanolic solutions were used to make standard curves with final concentrations of 0.1, 0.2, 0.5, 2, 5, 20, 50, and 200 ng/mL, with each concentration point containing 20 ng/mL of the appropriate hormone internal standard. On the basis of the results of the HPLC–MS/MS measurements, the standard curve can be plotted, where the horizontal coordinate X is the concentration of the external standard divided by the corresponding internal standard, and the vertical coordinate Y is the peak area of the external standard divided by the corresponding internal standard.
Four hormones were extracted from soybean roots by crushing samples to be analyzed in liquid nitrogen and carefully weighing 1 g of the samples in glass test tubes. Each hormone test was performed four times. A 10-fold amount of acetonitrile solution was added, as well as 8 μL of the 20 ng/mL master solution of the matching internal standard. The root samples were carefully extracted overnight at a temperature of 4 °C and centrifuged for 5 min at a speed of 12,000× g rpm. After the liquid supernatant was obtained, the deposit was treated with a fivefold amount of acetonitrile solution, extracted two times, and combined with the supernatants. The sample received about 35 mg of C18 packing before being shocked severely for 30 s and centrifuged at a speed of 10,000 rpm for 5 min. The liquid supernatant was then removed. The sample was blow-dried with nitrogen, redissolved in 400 μL methyl alcohol, filtered through a 0.22 μm millipore plastic membrane filter, and reserved at −20 °C in a refrigerator (Ronshen, China) for HPLC–MS/MS. Supplemental Data Tables S6–S8 show the gradient parameters of HPLC and MS and the monitoring settings of the screening reaction for protonated or deprotonated plant hormones.
4.11. Library Preparation and Transcriptome Sequencing Analysis
Root samples were obtained for total RNA extraction and mRNA library formation of soybean seedlings cultured in hydroponic nutrient solution supplemented with 5 (control group) or 100 (Mn toxicity stress group) µM Mn for 15 days. Transcription sequencing was performed in accordance with a previously reported method [8]. Three biological replications were implemented for each sample. The ultrapure RNA kit (CWBIO, Jiangsu, China) was adopted for RNA extraction. Then, fragments and inverse transcription were performed by using random primers. Meanwhile, the entire library was amplified by PCR. The library was sequenced by application of the Illumina platform. Raw sequencing results were filtered to generate quality advanced data (clean data). Then, the advanced data were compared with the referenced gene sequence of soybean (NCBI) via tophat version 2.0.12 [113,114].
In order to quantify the expression of genes, HTSeq version 0.6.0 and transcription snippets per thousand bases per million readings were used. DESeq1.16 was used for the determination of differentially expressed genes, and Qlog2Ratio was used for calculating gene expression level [115]. The data were supplemented with the integrated gene expression database, with entry number PRJNA946643 (https://dataview.ncbi.nlm.nih.gov/object/PRJNA946643?reviewer=oh3htrv4ofv91c6e4jhe3t4poc (accessed on 20 March 2023). DAVID was adopted to implement GO function enrichment studies [116,117].
4.12. qRT-PCR Detection
Ribonucleic acid (RNA) was isolated from soybean roots using the ultrapure RNA kit (CWBIO, China). After genome DNA was removed, cDNA was produced using the reverse transcription kit (Takara, Maebashi, Japan). A real-time qPCR (Bio-rad Company, Hercules, CA, USA) was used to carry out qRT-PCR analysis, according to an early report [8]. In brief, the sample was diluted 30 times as a template, and the reaction procedure was as shown below: 95 °C for 30 s, 95 °C for 5 s, 60 °C for 15 s, and then 72 °C for 30 s. As the control group, the reference gene named GmEF (Glyma.17G186600) was used to calculate the relative transcription levels on the basis of the rate of the selected gene to the internal control gene, as previously reported [118]. Table S9 lists the primers adopted for qRT-PCR.
4.13. Data Analysis
5. Conclusions
The effects of Mn poisoning on soybean roots were examined at both the physiological and molecular levels in this study. Mn poisoning altered the internal and external osmotic equilibrium of the soybean root system, resulting in a substantial accumulation of Mn in the root. Furthermore, excessive Mn accumulation increased the activity of antioxidant enzymes in soybean roots, interfered with metal ion uptake and transport, as well as hormone synthesis, and disrupted root morphology, all of which suppressed soybean root growth and development. In addition, transcriptome sequencing revealed 1430 DEGs in soybean roots under Mn poisoning, of which 572 DEGs were upregulated and 858 DEGs were downregulated; and further, qRT-PCR was performed to test 30 of these DEGs (including related genes of ion-transporting proteins, hormones, antioxidant enzymes, and transcription factors), and the validation results were consistent with the transcriptome sequencing results. These findings deepen the cognition of the response of soybean roots to Mn poisoning and lay the foundation for further exploration of specific molecular regulatory mechanisms.
Supplementary Materials
The supporting information can be downloaded at: https://www.mdpi.com/article/10.3390/ijms241612727/s1.
Author Contributions
Y.L. and Y.X. conceived and designed the experiments. Y.L., Y.P., J.L., J.C., S.Y. and Y.X. performed the experiments. Y.L., Y.P., J.L., J.C., S.Y., M.Z. and Y.X. analyzed the data. Y.L., Y.P., J.L. and Y.X. wrote the manuscript. All authors have read and agreed to the published version of the manuscript.
Funding
This research was funded by the Project of Marine Young Talent Innovation of Zhanjiang City (210818004542097), the Project of Rural Science and Technology Team “One-to-One” Service to Help the Town Full Coverage of Action Funding in Zhanjiang City (A23081), the Postgraduate Education Innovation Project of Guangdong Ocean University-Excellent Dissertation Cultivation Project (040502052101), the Project of Social Services of Rural Science and Technology Specialists of Guangdong Ocean University (080503052212), the National Natural Science Foundation of China (32002131), the Project of Guangdong Graduate Academic Forum (040504052301), and Maintenance Expenses of Key Construction Disciplines in High-level University of Crop Science (080508052201).
Institutional Review Board Statement
Not applicable.
Informed Consent Statement
Not applicable.
Data Availability Statement
Sequencing data generated in the study are available in the NCBI Sequence Read Archive (SRA) under BioProject accession PRJNA946643.
Conflicts of Interest
The authors declare no conflict of interest.
References
- Li, J.F.; Jia, Y.D.; Dong, R.S.; Huang, R.; Liu, P.D.; Li, X.Y.; Wang, Z.Y.; Liu, G.D.; Chen, Z.J. Advances in the mechanisms of plant tolerance to manganese toxicity. Int. J. Mol. Sci. 2019, 20, 5096. [Google Scholar] [CrossRef] [Green Version]
- Liu, Y.; Xue, Y.B.; Xie, B.X.; Zhu, S.N.; Lu, X.; Liang, C.Y.; Tian, J. Complex gene regulation between young and old soybean leaves in responses to manganese toxicity. Plant Physiol. Bioch. 2020, 155, 231–242. [Google Scholar] [CrossRef]
- Yang, S.; Yi, K.; Chang, M.M.; Ling, G.Z.; Zhao, Z.K.; Li, X.F. Sequestration of Mn into the cell wall contributes to Mn tolerance in sugarcane (Saccharum officinarum L.). Plant Soil 2019, 436, 475–487. [Google Scholar] [CrossRef]
- Shao, J.F.; Yamaji, N.; Shen, R.F.; Ma, J.F. The key to Mn homeostasis in plants: Regulation of Mn transporters. Trends Plant Sci. 2017, 22, 215–224. [Google Scholar] [CrossRef]
- Pan, G.; Zhang, H.P.; Liu, P.; Xiao, Z.H.; Li, X.H.; Liu, W.S. Effects of manganese stress on phenology and biomass allocation in Xanthium strumarium from metalliferous and non-metalliferous sites. Ecotox. Environ. Saf. 2019, 172, 308–316. [Google Scholar] [CrossRef]
- Santos, E.F.; Santini, J.M.K.; Paixão, A.P.; Júnior, E.F.; Lavres, J.; Campos, M.; Reis, A.R. Physiological highlights of manganese symptoms in soybean plants: Mn toxicity responses. Plant Physiol. Bioch. 2017, 113, 6–19. [Google Scholar] [CrossRef] [PubMed] [Green Version]
- Jumrani, K.; Bhatia, V.S. Interactive effect of temperature and water stress on physiological and biochemical processes in soybean. Physiol. Mol. Biol. Pla. 2019, 25, 667–681. [Google Scholar] [CrossRef]
- Liu, Y.; Zhao, M.; Chen, J.Y.; Yang, S.X.; Chen, J.P.; Xue, Y.B. Comparative transcriptome analysis reveals complex physiological response and gene regulation in peanut roots and leaves under Mn toxicity stress. Int. J. Mol. Sci. 2023, 24, 1161. [Google Scholar] [CrossRef] [PubMed]
- Takeuchi, J.; Fukui, K.; Seto, Y.; Takaoka, Y.; Okamoto, M. Ligand–receptor interactions in plant hormone signaling. Plant J. 2021, 105, 290–306. [Google Scholar] [CrossRef]
- Aprile, A.; De Bellis, L. Editorial for Special Issue “Heavy metals accumulation, toxicity, and detoxification in plants”. Int. J. Mol. Sci. 2020, 21, 4103. [Google Scholar] [CrossRef]
- Liu, Y.; Chen, J.Y.; Li, X.H.; Yang, S.X.; Hu, H.Q.; Xue, Y.B. Effects of manganese toxicity on the growth and gene expression at the seedling stage of soybean. Phyton. Int. J. Exp. Bot. 2022, 91, 975–987. [Google Scholar] [CrossRef]
- Tang, T.; Tao, F.; Li, W. Characterisation of manganese toxicity tolerance in Arabis paniculata. Plant Divers. 2021, 43, 163–172. [Google Scholar] [CrossRef] [PubMed]
- Horst, W.J.; Maier, P.; Fecht, M.; Naumann, A.; Wissemeier, A.H. The physiology of manganese toxicity and tolerance in Vigna unguiculata (L.) Walp. J. Plant Nutr. Soil Sci. 1999, 162, 263–274. [Google Scholar] [CrossRef]
- Fecht-Christoffers, M.M.; Führs, H.; Braun, H.P.; Horst, W.J. The role of hydrogen peroxide-producing and hydrogen peroxide consuming peroxidases in the leaf apoplast of cowpea in manganese tolerance. Plant Physiol. 2006, 140, 1451–1463. [Google Scholar] [CrossRef] [Green Version]
- Delhaize, E.; Gruber, B.D.; Pittman, J.K.; White, R.G.; Leung, H.; Miao, Y.; Jiang, L.; Ryan, P.R.; Richardson, A.E. A role for the AtMTP11 gene of Arabidopsis in manganese transport and tolerance. Plant J. 2007, 51, 198–210. [Google Scholar] [CrossRef]
- Chen, Z.; Fujii, Y.; Yamaji, N.; Masuda, S.; Takemoto, Y.; Kamiya, T.; Yusuyin, Y.; Iwasaki, K.; Kato, S.; Maeshima, M.; et al. Mn tolerance in rice is mediated by MTP8.1, a member of the cation diffusion facilitator family. J. Exp. Bot. 2013, 64, 4375–4387. [Google Scholar] [CrossRef] [Green Version]
- Migocka, M.; Papierniak, A.; Maciaszczyk-Dziubinska, E.; Po´zdzik, P.; Posyniak, E.; Garbiec, A.; Filleur, S. Cucumber metal transport protein MTP8 confers increased tolerance to manganese when expressed in yeast and Arabidopsis thaliana. J. Exp. Bot. 2014, 65, 5367–5384. [Google Scholar] [CrossRef] [Green Version]
- Chen, Z.J.; Sun, L.L.; Liu, P.D.; Liu, G.D.; Tian, J.; Liao, H. Malate synthesis and secretion mediated by a manganese-enhanced malate dehydrogenase confers superior manganese tolerance in Stylosanthes guianensis. Plant Physiol. 2015, 167, 176–188. [Google Scholar] [CrossRef] [Green Version]
- De la Luz Mora, M.; Rosas, A.; Ribera, A.; Rengel, Z. Differential tolerance to Mn toxicity in perennial ryegrass genotypes: Involvement of antioxidative enzymes and root exudation of carboxylates. Plant Soil 2009, 320, 79–89. [Google Scholar] [CrossRef]
- Hauck, M.; Paul, A.; Gross, S.; Raubuch, M. Manganese toxicity in epiphytic lichens: Chlorophyll degradation and interaction with iron and phosphorus. Environ. Exp. Bot. 2003, 49, 181–191. [Google Scholar] [CrossRef]
- Dou, C.; Fu, X.; Chen, X.; Shi, J.; Chen, Y. Accumulation and interaction of calcium and manganese in Phytolacca americana. Plant Sci. 2009, 177, 601–606. [Google Scholar] [CrossRef]
- Alejandro, S.; Höller, S.; Meier, B.; Peiter, E. Manganese in plants: From acquisition to subcellular allocation. Front. Plant Sci. 2020, 11, 300. [Google Scholar] [CrossRef] [Green Version]
- Mangena, P. Impact of polyploidy induction for salinity stress mitigation in soybean (Glycine max L. Merrill). Plants 2023, 12, 1356. [Google Scholar] [CrossRef]
- Javaid, M.H.; Khan, A.R.; Salam, A.; Neelam, A.; Azhar, W.; Ulhassan, Z.; Gan, Y.B. Exploring the adaptive responses of plants to abiotic stresses using transcriptome data. Agric 2022, 12, 211. [Google Scholar] [CrossRef]
- Ikhajiagbe, B.; Ogwu, M.C.; Lato, N.F. Growth and yield responses of soybean (Glycine max L. Merr.) accessions after exposure to cadmium. Vegetos 2021, 34, 107–118. [Google Scholar] [CrossRef]
- Huang, H.M.; Zhao, Y.L.; Fan, L.; Jin, Q.; Yang, G.Y.; Xu, Z.G. Improvement of manganese phytoremediation by Broussonetia papyrifera with two plant growth promoting (PGP) Bacillus species. Chemosphere 2020, 260, 127614. [Google Scholar] [CrossRef]
- Gao, H.H.; Huang, L.Z.; Gong, Z.J.; Wang, X.T.; Qiao, X.Q.; Fang, X.; Yang, Y.T.; Yu, B.H.; Guo, X.T.; Yu, C.Y.; et al. Exogenous melatonin application improves resistance to high manganese stress through regulating reactive oxygen species scavenging and ion homeostasis in tobacco. Plant Growth Regul. 2022, 98, 219–233. [Google Scholar] [CrossRef]
- Szechyńska-Hebda, M.; Ghalami, R.Z.; Kamran, M.; Breusegem, F.V.; Karpiński, S. To be or not to be? Are reactive oxygen species, antioxidants, and stress signalling universal determinants of life or death? Cells 2022, 11, 4105. [Google Scholar] [CrossRef] [PubMed]
- Wu, F.L.; Huang, H.Y.; Peng, M.Y.; Lai, Y.H.; Ren, Q.Q.; Zhang, J.; Huang, Z.G.; Yang, L.T.; Rensing, C.; Chen, L.S. Adaptive responses of Citrus grandis leaves to copper toxicity revealed by RNA-Seq and physiology. Int. J. Mol. Sci. 2021, 22, 12023. [Google Scholar] [CrossRef] [PubMed]
- Wu, B.S.; Zhang, J.; Huang, W.L.; Yang, L.T.; Huang, Z.R.; Guo, J.X.; Wu, J.C.; Chen, L.S. Molecular mechanisms for pH-mediated amelioration of aluminum-toxicity revealed by conjoint analysis of transcriptome and metabolome in Citrus sinensis roots. Chemosphere 2022, 299, 134335. [Google Scholar] [CrossRef] [PubMed]
- Tang, F.L.; Li, R.M.; Zhou, Y.J.; Wang, S.J.; Zhou, Q.; Ding, Z.P.; Yao, Y.; Liu, J.; Wang, Y.J.; Hu, X.W.; et al. Genome-wide identification of Cassava glyoxalase I genes and the potential function of MeGLYⅠ-13 in iron toxicity tolerance. Int. J. Mol. Sci. 2022, 23, 5212. [Google Scholar] [CrossRef] [PubMed]
- Cheng, Y.X.; Qiu, L.Z.; Shen, P.K.; Wang, Y.Q.; Li, J.L.; Dai, Z.Y.; Qi, M.F.; Zhou, Y.; Zou, Z.K. Transcriptome studies on cadmium tolerance and biochar mitigating cadmium stress in muskmelon. Plant Physiol. Bioch. 2023, 197, 107661. [Google Scholar] [CrossRef]
- Chen, Z.J.; Wei, Y.; Sun, L.; Tian, J.; Liao, H. Proteomic analysis reveals growth inhibition of soybean roots by manganese toxicity is associated with alteration of cell wall structure and lignification. J. Proteom. 2016, 143, 151–160. [Google Scholar] [CrossRef] [PubMed]
- Millaleo, R.; Reyes-Díaz, M.; Ivanov, A.; Mora, M.; Alberdi, M. Manganese as essential and toxic element for plants: Transport, accumulation and resistance mechanism. J. Soil Sci. Plant Nutr. 2010, 10, 470–481. [Google Scholar] [CrossRef] [Green Version]
- Peng, K.J.; Luo, C.L.; You, W.X.; Lian, C.L.; Li, X.D.; Shen, Z.G. Mn uptake and interactions with cadmium in the hyperaccumulator-Phytolacca americana L. J. Hazard. Mater. 2008, 154, 674–681. [Google Scholar] [CrossRef] [PubMed]
- Noor, I.; Sohail, H.; Sun, J.X.; Nawaz, M.A.; Li, G.H.; Hasanuzzaman, M.; Liu, J.W. Heavy metal and metalloid toxicity in horticultural plants: Tolerance mechanism and remediation strategies. Chemosphere 2022, 303, 135196. [Google Scholar] [CrossRef] [PubMed]
- Gherardi, M.J.; Rengel, Z. Genotypes of lucerne (Medicago sativa L.) show differential tolerance to Mn deficiency and toxicity when grown in bauxite residue sand. Plant Soil 2003, 249, 287–296. [Google Scholar] [CrossRef]
- Saleem, K.; Asghar, M.A.; Saleem, M.H.; Raza, A.; Kocsy, G.; Iqba, N.; Ali, B.; Albeshr, M.F.; Bhat, E.A. Chrysotile-asbestos-induced damage in Panicum virgatum and Phleum pretense species and its alleviation by organic-soil amendment. Sustainability 2022, 14, 10824. [Google Scholar] [CrossRef]
- Sharma, S.S.; Dietz, K.J.; Mimura, T. Vacuolar compartmentalization as indispensable component of heavy metal detoxification in plants. Plant Cell Environ. 2016, 39, 1112–1126. [Google Scholar] [CrossRef] [Green Version]
- Gavrilescu, M. Enhancing phytoremediation of soils polluted with heavy metals. Curr. Opin. Biotechnol. 2022, 74, 21–31. [Google Scholar] [CrossRef]
- Madhumita, J.M.; Sharma, A. Manganese in cell metabolism of higher plants. Bot. Rev. 1991, 57, 117–149. [Google Scholar]
- Zhao, J.J.; Wang, W.Y.; Zhou, H.K.; Wang, R.L.; Zhang, P.; Wang, H.C.; Pan, X.L.; Xu, J. Mn toxicity inhibited root growth by disrupting auxin biosynthesis and transport in Arabidopsis. Front. Plant Sci. 2017, 8, 272. [Google Scholar] [CrossRef] [PubMed] [Green Version]
- Huang, H.M.; Zhao, Y.L.; Xu, Z.G.; Zhang, W.; Jiang, K.K. Physiological responses of Broussonetia papyrifera to manganese stress, a candidate plant for phytoremediation. Ecotox. Environ. Saf. 2019, 181, 18–25. [Google Scholar] [CrossRef] [PubMed]
- Yang, Z.B.; You, J.F.; Xu, M.Y.; Yang, Z.M. Interaction between aluminum toxicity and manganese toxicity in soybean (Glycine max). Plant Soil 2009, 319, 277–289. [Google Scholar] [CrossRef]
- Muhammad, N.; Zvobgo, G.; Fu, L.B.; Wa Lwalaba, J.L.; Zhang, G.P. Physiological mechanisms for antagonistic interaction of manganese and aluminum in barley. J. Plant Nutr. 2019, 42, 466–476. [Google Scholar] [CrossRef]
- Blair, L.M.; Taylor, G.J. The nature of interaction between aluminum and manganese on growth and metal accumulation in Triticum aestivum. Environ. Exp. Bot. 1997, 37, 25–37. [Google Scholar] [CrossRef]
- Taylor, G.J.; Blarney, F.P.C.; Edwards, D. Antagonistic and synergistic interactions between aluminum and manganese on growth of Vigna unguiculata at low ionic strength. Physiol. Plantarum 1998, 104, 183–194. [Google Scholar] [CrossRef]
- Wang, W.; Zhao, X.Q.; Hu, Z.M.; Shao, J.F.; Che, J.; Chen, R.F.; Xiao, Y.D.; Shen, R.F. Aluminium alleviates manganese toxicity to rice by decreasing root symplastic Mn uptake and reducing availability to shoots of Mn stored in roots. Ann. Bot. 2015, 116, 237–246. [Google Scholar] [CrossRef] [Green Version]
- Foy, C.D.; Webb, H.W.; Coradetti, C.A. Differential manganese tolerances of cotton genotypes in nutrient solution. J. Plant Nutr. 1995, 18, 685–706. [Google Scholar] [CrossRef]
- Bot, J.L.; Kirkby, E.A.; Beusicchem, M.L.V. Manganese toxicity in tomato plants: Effects on cation uptake and distribution. J. Plant Nutr. 1990, 13, 513–525. [Google Scholar] [CrossRef]
- Pittman, J.K.; Shigaki, T.; Marshall, J.L.; Morris, J.L.; Cheng, N.H.; Hirschi, K.D. Functional and regulatory analysis of the Arabidopsis thaliana CAX2 cation transporter. Plant Mol. Biol. 2004, 56, 959–971. [Google Scholar] [CrossRef] [PubMed]
- Pittman, J.K. Managing the manganese: Molecular mechanisms of manganese transport and homeostasis. New Phytol. 2005, 167, 733–742. [Google Scholar] [CrossRef]
- Raja, V.; Majeed, U.; Kang, H.; Andrabi, K.I.; John, R. Abiotic stress: Interplay between ROS, hormones and MAPKs. Environ. Exp. Bot. 2017, 137, 142–157. [Google Scholar] [CrossRef]
- Che, Y.; Zhang, N.; Zhu, X.; Li, S.; Wang, S.; Si, H. Enhanced tolerance of the transgenic potato plants overexpressing Cu/Zn superoxide dismutase to low temperature. Sci. Hortic. 2020, 261, 108949. [Google Scholar] [CrossRef]
- Wang, D.; Li, W.X.; Li, D.; Li, L.; Luo, Z.S. Effect of high carbon dioxide treatment on reactive oxygen species accumulation and antioxidant capacity in fresh-cut pear fruit during storage. Sci. Hortic. 2021, 281, 109925. [Google Scholar] [CrossRef]
- Killi, D.; Raschi, A.; Bussotti, F. Lipid peroxidation and chlorophyll fluorescence of photosystem II performance during drought and heat stress is associated with the antioxidant capacities of C3 sunflower and C4 maize varieties. Int. J. Mol. Sci. 2020, 21, 4846. [Google Scholar] [CrossRef]
- Gill, S.S.; Tuteja, N. Reactive oxygen species and antioxidant machinery in abiotic stress tolerance in crop plants. Plant Physiol. Biochem. 2010, 48, 909–930. [Google Scholar] [CrossRef]
- Wu, Y.; Gao, H.C.; Zhang, B.X.; Zhang, H.L.; Wang, Q.W.; Liu, X.L.; Luan, X.Y.; Ma, Y.S. Effects of 24-epioleucin lactones on fertility, physiology and cellular ultrastructure of soybean under salinity stress. Chin. Agr. Sci. 2017, 50, 811–821. [Google Scholar]
- Bai, Y.D.; Xiao, S.; Zhang, Z.C.; Zhang, Y.J.; Sun, H.C.; Zhang, K.; Wang, X.D.; Bai, Z.Y.; Li, C.D.; Liu, L.T. Melatonin improves the germination rate of cotton seeds under drought stress by opening pores in the seed coat. Peer J. 2020, 8, e9450. [Google Scholar] [CrossRef]
- Alisofi, S.; Einali, A.; Sangtarash, M.H. Jasmonic acid-induced metabolic responses in bitter melon (Momordica charantia) seedlings under salt stress. J. Hortic. Sci. Biotechnol. 2020, 95, 247–259. [Google Scholar] [CrossRef]
- Yoon, J.Y.; Hamayun, M.; Lee, S.K.; Lee, I.J. Methyl jasmonate alleviated salinity stress in soybean. J. Crop. Sci. Biotech. 2009, 12, 63–68. [Google Scholar] [CrossRef]
- Zhang, N.D.; Zhang, C.Y.; Xiao, X.; Zhang, Q.Y.; Huang, B.K. New cytotoxic compounds of endophytic fungus Alternaria sp. isolated from Broussonetia papyrifera (L.) Vent. Fitoterapia 2016, 110, 173–180. [Google Scholar] [CrossRef] [PubMed]
- Li, X.X.; Zhao, J.; Tan, Z.Y.; Zeng, R.S.; Liao, H. GmEXPB2, a cell wall β-expansin, affects soybean nodulation through modifying root architecture and promoting nodule formation and development. Plant Physiol. 2015, 169, 2640–2653. [Google Scholar] [CrossRef] [Green Version]
- Yuan, H.M.; Huang, X. Inhibition of root meristem growth by cadmium involves nitric oxide-mediated repression of auxin accumulation and signalling in Arabidopsis. Plant Cell Environ. 2016, 39, 120–135. [Google Scholar] [CrossRef] [PubMed] [Green Version]
- De Figueiredo, M.R.A.; Strader, L.C. Intrinsic and extrinsic regulators of Aux/IAA protein degradation dynamics. Trends Biochem. Sci. 2022, 47, 865–874. [Google Scholar] [CrossRef]
- Hu, J.; Su, H.L.; Cao, H.; Wei, H.B.; Fu, X.K.; Jiang, X.M.; Song, Q.; He, X.H.; Xu, C.Z.; Luo, K.M. AUXIN RESPONSE FACTOR7 integrates gibberellin and auxin signaling via interactions between DELLA and AUX/IAA proteins to regulate cambial activity in poplar. Plant Cell 2022, 34, 2688–2707. [Google Scholar] [CrossRef]
- Eroglu, S.; Meier, B.; Wirén, N.V.; Peiter, E. The vacuolar Mn transporter MTP8 determines tolerance to iron deficiency-induced chlorosis in Arabidopsis. Plant Physiol. 2016, 170, 1030–1045. [Google Scholar] [CrossRef] [Green Version]
- Zahra, N.; Hafeez, M.B.; Shaukat, K.; Wahid, A.; Hasanuzzaman, M. Fe toxicity in plants: Impacts and remediation. Physiol. Plant 2021, 173, 201–222. [Google Scholar] [CrossRef] [PubMed]
- Ma, M.M.; Li, L.; Wang, X.H.; Zhang, C.Y.; Pak, S.; Li, C.H. Comprehensive analysis of GRAS gene family and their expression under GA3, drought stress and ABA treatment in Larix kaempferi. Forests 2022, 13, 1424. [Google Scholar] [CrossRef]
- Bagale, P.; Pandey, S.; Regmi, P.; Bhusal, S. Role of plant growth regulator “Gibberellins” in vegetable production: An overview. Int. J. Hortic. Sci. Technol. 2022, 9, 291–299. [Google Scholar]
- Teshome, S.; Kebede, M. Analysis of regulatory elements in GA2ox, GA3ox and GA20ox gene families in Arabidopsis thaliana: An important trait. Biotechnol. Biotechnol. Equip. 2021, 35, 1603–1612. [Google Scholar] [CrossRef]
- Barker, R.; Garcia, F.M.N.; Powers, S.J.; Vaughan, S.; Bennett, M.J.; Phillips, A.L.; Thomas, S.G.; Hedden, P. Mapping sites of gibberellin biosynthesis in the Arabidopsis root tip. New Phytol. 2021, 229, 1521–1534. [Google Scholar] [CrossRef]
- Wang, Z.J.; Liu, L.; Cheng, C.H.; Ren, Z.Y.; Xu, S.M.; Li, X. GAI functions in the plant response to dehydration stress in Arabidopsis thaliana. Int. J. Mol. Sci. 2020, 21, 819. [Google Scholar] [CrossRef] [Green Version]
- Alonso-Ramírez, A.; Rodríguez, D.; Reyes, D.; Jiménez, J.A.; Nicolás, G.; López-Climent, M.; Gómez-Cadenas, A.; Nicolás, C. Evidence for a role of gibberellins in salicylic acid-modulated early plant responses to abiotic stress in Arabidopsis seeds. Plant Physiol. 2009, 150, 1335–1344. [Google Scholar] [CrossRef] [PubMed]
- Zhu, X.F.; Jiang, T.; Wang, Z.W.; Lei, G.J.; Shi, Y.Z.; Li, G.X.; Zheng, S.J. Gibberellic acid alleviates cadmium toxicity by reducing nitric oxide accumulation and expression of IRT1 in Arabidopsis thaliana. J. Hazard. Mater. 2012, 239, 302–307. [Google Scholar] [CrossRef]
- Tao, Q.; Jupa, R.; Liu, Y.K.; Luo, J.P.; Li, J.X.; Kováč, J.; Li, T.Q. Abscisic acid-mediated modifications of radial apoplastic transport pathway play a key role in cadmium uptake in hyperaccumulator Sedum alfredii. Plant Cell Environ. 2019, 42, 1425–1440. [Google Scholar] [CrossRef]
- Boursiac, Y.; Léran, S.; Corratgé-Faillie, C.; Gojon, A.; Krouk, G.; Lacombe, B. ABA transport and transporters. Trends Plant Sci. 2013, 18, 325–333. [Google Scholar] [CrossRef]
- Zhang, Q.; Yuan, W.; Wang, Q.W.; Cao, Y.Y.; Xu, F.Y.; Dodd, I.C.; Xu, W.F. ABA regulation of root growth during soil drying and recovery can involve auxin response. Plant Cell Environ. 2022, 45, 871–883. [Google Scholar] [CrossRef]
- Sussmilch, F.C.; Atallah, N.M.; Brodribb, T.J.; Banks, J.A. Abscisic acid (ABA) and key proteins in its perception and signaling pathways are ancient, but their roles have changed through time. Plant Signal. Behav. 2017, 12, e1365210. [Google Scholar] [CrossRef] [PubMed] [Green Version]
- Vishwakarma, K.; Upadhyay, N.; Kumar, N.; Yadav, G.; Singh, J.; Mishra, R.K.; Kumar, V.; Verma, R.; Upadhyay, R.G.; Pandey, M.; et al. Abscisic acid signaling and abiotic stress tolerance in plants: A review on current knowledge and future prospects. Front. Plant Sci. 2017, 8, 161. [Google Scholar] [CrossRef] [PubMed] [Green Version]
- Li, X.S.; Song, L.L. The role of ABA in the responses of wild-type and abscisic acid mutants of Arabidopsis thaliana to excess zinc. Acta Physiol. Plant 2020, 42, 74. [Google Scholar] [CrossRef]
- Zhu, Q.Y.; Xu, P.X.; Lei, L.L.; Jing, Y.X. Transcriptome analysis reveals decreased accumulation and toxicity of Cd in upland rice inoculated with arbuscular mycorrhizal fungi. Appl. Soil Ecol. 2022, 177, 104501. [Google Scholar] [CrossRef]
- Ren, Q.Q.; Huang, Z.R.; Huang, W.L.; Huang, W.T.; Chen, H.H.; Yang, L.T.; Ye, X.; Chen, L.S. Physiological and molecular adaptations of Citrus grandis roots to long-term copper excess revealed by physiology, metabolome and transcriptome. Environ. Exp. Bot. 2022, 203, 105049. [Google Scholar] [CrossRef]
- Chen, S.S.; Qi, X.Y.; Feng, J.; Chen, H.J.; Qin, Z.Y.; Wang, H.D.; Deng, Y.M. Biochemistry and transcriptome analyses reveal key genes and pathways involved in high-aluminum stress response and tolerance in hydrangea sepals. Plant Physiol. Bioch. 2022, 185, 268–278. [Google Scholar] [CrossRef]
- Yao, Y.; Xiao, X.; Ou, Y.; Wu, X.; Xu, G. Root transcriptome analysis on the grape genotypes with contrast translocation pattern of excess manganese from root to shoot. Plant Soil 2015, 387, 49–67. [Google Scholar] [CrossRef]
- Xue, Y.B.; Chen, J.Y.; Li, X.H.; Liu, Y. Transcriptome analysis of soybean leaves response to manganese toxicity. Biotechnol. Biotechnol. Equip. 2021, 35, 1043–1051. [Google Scholar] [CrossRef]
- Ishimaru, Y.; Masuda, H.; Bashir, K.; Inoue, H.; Tsukamoto, T.; Takahashi, M.; Nakanishi, H.; Aoki, N.; Hirose, T.; Ohsugi, R.; et al. Rice metal-nicotianamine transporter, OsYSL2, is required for the long-distance transport of iron and manganese. Plant J. 2010, 62, 379–390. [Google Scholar] [CrossRef] [PubMed]
- Noor, I.; Sohail, H.; Zhang, D.M.; Zhu, K.J.; Shen, W.Q.; Pan, J.J.; Hasanuzzaman, M.; Li, G.H.; Liu, J.W. Silencing of PpNRAMP5 improves manganese toxicity tolerance in peach (Prunus persica) seedlings. J. Hazard. Mater. 2023, 454, 131442. [Google Scholar] [CrossRef] [PubMed]
- Connorton, J.M.; Jones, E.R.; Rodríguez-Ramiro, I.; Fairweather-Tait, S.; Uauy, C.; Balk, J. Wheat vacuolar iron transporter TaVIT2 transports Fe and Mn and is effective for biofortification. Plant Physiol. 2017, 174, 2434–2444. [Google Scholar] [CrossRef] [Green Version]
- Wu, Z.; Liang, F.; Hong, B.; Young, J.C.; Sussman, M.R.; Harper, J.F.; Sze, H. An endoplasmic reticulum-bound Ca2+/Mn2+ pump, ECA1, supports plant growth and confers tolerance to Mn2+ stress. Plant Physiol. 2002, 130, 128–137. [Google Scholar] [CrossRef] [Green Version]
- Mills, R.F.; Doherty, M.L.; Lopez-Marques, R.L.; Weimar, T.; Dupree, P.; Palmgren, M.G.; Pittman, J.K.; Williams, L.E. ECA3, a Golgi-localized P2A-type ATPase, plays a crucial role in manganese nutrition in Arabidopsis. Plant Physiol. 2008, 146, 116–128. [Google Scholar] [CrossRef] [PubMed] [Green Version]
- Zhang, M.; Liu, B. Identification of a rice metal tolerance protein OsMTP11 as a manganese transporter. PLoS ONE 2017, 12, e0174987. [Google Scholar] [CrossRef] [PubMed] [Green Version]
- Zhang, X.Y.; Li, Q.H.; Xu, W.L.; Zhao, H.; Guo, F.; Wang, P.; Wang, Y.; Ni, D.; Wang, M.; Wei, C. Identification of MTP gene family in tea plant (Camellia sinensis L.) and characterization of CsMTP8.2 in manganese toxicity. Ecotox. Environ. Saf. 2020, 202, 110904. [Google Scholar] [CrossRef] [PubMed]
- Alam, S.; Kamei, S.; Kawai, S. Amelioration of manganese toxicity in barley with iron. J. Plant Nutr. 2006, 24, 1421–1433. [Google Scholar] [CrossRef]
- Goss, M.J.; Carvalho, M.J.G.P.R. Manganese toxicity: The significance of magnesium for the sensitivity of wheat plants. Plant Soil 1992, 139, 91–98. [Google Scholar] [CrossRef]
- Liu, P.D.; Huang, R.; Hu, X.; Jia, Y.D.; Ki, J.F.; Luo, J.J.; Liu, Q.; Luo, L.J.; Liu, G.D.; Chen, Z.J. Physiological responses and proteomic changes reveal insights into Stylosanthes response to manganese toxicity. BMC Plant Biol. 2019, 19, 212. [Google Scholar] [CrossRef]
- Ribera-Fonseca, A.; Inostroza-Blancheteau, C.; Cartes, P.; Rengel, Z.; Mora, M.L. Early induction of Fe-SOD gene expression is involved in tolerance to Mn toxicity in perennial ryegrass. Plant Physiol. Biochem. 2013, 73, 77–82. [Google Scholar] [CrossRef]
- Fecht-Christoffers, M.M.; Braun, H.P.; Lemaitre-Guillier, C.; Van-Dorsselaer, A.; Horst, W.J. Effect of manganese toxicity on the proteome of the leaf apoplast in cowpea. Plant Physiol. 2003, 133, 1935–1946. [Google Scholar] [CrossRef] [Green Version]
- Ouellet, F.; Overvoorde, P.J.; Theologis, A. IAA17/AXR3: Biochemical insight into an auxin mutant phenotype. Plant Cell 2001, 13, 829–841. [Google Scholar] [CrossRef] [Green Version]
- Yamada, K.; Nagano, A.J.; Nishina, M.; Hara-Nishimura, I.; Nishimura, M. Identification of two novel endoplasmic reticulum body-specific integral membrane proteins. Plant Physiol. 2013, 161, 108–120. [Google Scholar] [CrossRef] [Green Version]
- Pornaro, C.; Macolino, S.; Menegon, A.; Richardson, M. Winrhizo technology for measuring morphological traits of bermudagrass stolons. Agron. J. 2017, 109, 3007–3010. [Google Scholar] [CrossRef] [Green Version]
- Chen, G.J.; Zheng, D.F.; Feng, N.J.; Zhou, H.; Mu, D.W.; Liu, L.; Zhao, L.M.; Shen, X.F.; Rao, G.H.; Li, T.Z. Effects of exogenous salicylic acid and abscisic acid on growth, photosynthesis and antioxidant system of rice. Chil. J. Agr. Res. 2022, 82, 21–32. [Google Scholar] [CrossRef]
- De Araújo Silva, M.M.; Ferreira, L.T.; De Vasconcelos, F.M.T.; Willadino, L.; Camara, T.R.; Dos Santos, D.Y.A.C.; De Oliveira, A.F.M. Water stress-induced responses in the growth, cuticular wax composition, chloroplast pigments and soluble protein content, and redox metabolism of two genotypes of Ricinus communis L. J. Plant Growth Regul. 2021, 40, 342–352. [Google Scholar] [CrossRef]
- Caverzan, A.; Passaia, G.; Rosa, S.B.; Ribeiro, C.W.; Lazzarotto, F.; Margis-Pinheiro, M. Plant responses to stresses: Role of ascorbate peroxidase in the antioxidant protection. Genet. Mol. Biol. 2012, 35, 1011–1019. [Google Scholar] [CrossRef] [Green Version]
- Ghaffari, H.; Tadayon, M.R.; Nadeem, M.; Cheema, M.; Razmjoo, J. Proline-mediated changes in antioxidant enzymatic activities and the physiology of sugar beet under drought stress. Acta Physiol. Plant. 2019, 41, 23. [Google Scholar] [CrossRef]
- Sadak, M.S.; Abdalla, A.M.; Abd Elhamid, E.M.; Ezzo, M.I. Role of melatonin in improving growth, yield quantity and quality of Moringa oleifera L. plant under drought stress. Bull. Nat. Res. Cent. 2020, 44, 18. [Google Scholar] [CrossRef] [Green Version]
- Rácz, A.; Hideg, É.; Czégény, G. Selective responses of class III plant peroxidase isoforms to environmentally relevant UV-B doses. J. Plant Physiol. 2018, 221, 101–106. [Google Scholar] [CrossRef]
- Ekinci, M.; Ors, S.; Yildirim, E.; Turan, M.; Sahin, U.; Dursun, A.; Kul, R. Determination of physiological indices and some antioxidant enzymes of chard exposed to nitric oxide under drought stress. Russ. J. Plant Physiol. 2020, 67, 740–749. [Google Scholar]
- Li, C.G.; Li, J.X.; Du, X.H.; Zhang, J.X.; Zou, Y.R.; Liu, Y.D.; Li, Y.; Lin, H.Y.; Li, H.; Liu, D.; et al. Chloroplast thylakoidal ascorbate peroxidase, PtotAPX, has enhanced resistance to oxidative stress in Populus tomentosa. Int. J. Mol. Sci. 2022, 23, 3340. [Google Scholar] [CrossRef]
- Kalogiouri, N.P.; Manousi, N.; Zachariadis, G.A. Determination of the toxic and nutrient element content of almonds, walnuts, hazelnuts and pistachios by ICP-AES. Separations 2021, 8, 28. [Google Scholar] [CrossRef]
- Pan, X.; Welti, R.; Wang, X. Quantitative analysis of major plant hormones in crude plant extracts by high-performance liquid chromatography–mass spectrometry. Nat. Protoc. 2010, 5, 986–992. [Google Scholar] [CrossRef]
- Khew, C.Y.; Mori, I.C.; Matsuura, T.; Hirayama, T.; Harikrishna, J.A.; Lau, E.T.; Mercer, Z.J.A.; Hwang, S.S. Hormonal and transcriptional analyses of fruit development and ripening in different varieties of black pepper (Piper nigrum). J. Plant Res. 2020, 133, 73–94. [Google Scholar] [CrossRef]
- Trapnell, C.; Roberts, A.; Goff, L.; Pertea, G.; Kim, D.; Kelley, D.R.; Pimentel, H.; Salzberg, S.L.; Rinn, J.L.; Pachter, L. Differential gene and transcript expression analysis of RNA-seq experiments with TopHat and Cufflinks. Nat. Protoc. 2012, 7, 562–578. [Google Scholar] [CrossRef] [PubMed] [Green Version]
- Zhuang, W.J.; Chen, H.; Yang, M.; Wang, J.P.; Pandey, M.K.; Zhang, C.; Chang, W.C.; Zhang, L.S.; Zhang, X.T.; Tang, R.H.; et al. The genome of cultivated peanut provides insight into legume karyotypes, polyploid evolution and crop domestication. Nat. Genet. 2019, 51, 865–876. [Google Scholar] [CrossRef] [Green Version]
- Wang, L.; Feng, Z.; Wang, X.; Zhang, X. DEGseq: An R package for identifying differentially expressed genes from RNA-seq data. Bioinform 2010, 26, 136–138. [Google Scholar] [CrossRef] [PubMed] [Green Version]
- Thimm, O.; Bläsing, O.; Gibon, Y.; Nagel, A.; Meyer, S.; Krüger, P.; Selbig, J.; Müller, L.A.; Rhee, S.Y.; Stitt, M. MapMan: A user-driven tool to display genomic data sets onto diagrams of metabolic pathways and other biological processes. Plant J. 2004, 37, 914–939. [Google Scholar] [CrossRef] [PubMed]
- Huang, D.W.; Sherman, B.T.; Lempicki, R.A. Systematic and integrative analysis of large gene lists using DAVID bioinformatics resources. Nat. Protoc. 2009, 4, 44–57. [Google Scholar] [CrossRef]
- Xue, Y.B.; Zhuang, Q.L.; Zhu, S.N.; Xiao, B.X.; Liang, C.Y.; Liao, H.; Tian, J. Genome wide transcriptome analysis reveals complex regulatory mechanisms underlying phosphate homeostasis in soybean nodules. Int. J. Mol. Sci. 2018, 19, 2924. [Google Scholar] [CrossRef] [PubMed] [Green Version]
Figure 1.
Influences of various concentrations of Mn on soybean root morphology. Root phenotypes of soybean with different Mn concentrations (from left to right: (A–F): 5, 50, 100, 150, 200, and 300 µM) after 15 days of treatment (bar = 3 cm).
Figure 1.
Influences of various concentrations of Mn on soybean root morphology. Root phenotypes of soybean with different Mn concentrations (from left to right: (A–F): 5, 50, 100, 150, 200, and 300 µM) after 15 days of treatment (bar = 3 cm).

Figure 2.
Results of various concentrations of Mn on growth of soybean root. (A) Total root length; (B) root area index; (C) root volume; (D) root mean diameter; and (E) root tips number. The data were represented by the mean value and standard deviation (n = 4). Duncan’s multiple comparison test was adopted for significant analysis of the differences in root growth between the normal group and the treatment group, and different letters on the bar chart indicated significant differences (p < 0.05).

Figure 3.
Results of various Mn concentrations on root weight of soybean. (A) Fresh and (B) dry weights of roots. The data are represented by the mean value and standard deviation (n = 4). Duncan’s multiple comparison test was adopted for significance analysis of the differences in root growth between the normal group and the treatment group, and different letters on the bar chart indicate significant differences (p < 0.05).

Figure 4.
Results of various concentrations of exogenous Mn on activities of POD, SOD, CAT, and APX and contents of soluble protein, soluble sugar, Pro, and MDA in soybean root. Activity of (A) POD, (B) SOD, (C) CAT, and (D) APX; (E) content of Pro, (F) MDA, (G) soluble protein, and (H) soluble sugar. The data are represented by the mean value and standard deviation (n = 4). Duncan’s multiple comparison test was adopted for significance analysis of the differences in root growth between the normal group and the treatment group, and different letters on the bar chart indicate significant differences (p < 0.05).

Figure 5.
Results of various concentrations of Mn on ion accumulation in the roots of soybean. Content of (A) Mn, (B) Zn, (C) Fe, (D) Ca, (E) Na, (F) K, (G) Mg, (H) Se, (I) Al, and (J) Cu in soybean roots. The data are represented by the mean value and standard deviation (n = 4). The significance test of difference between normal group and Mn treatment group was implemented with Student’s t test at * p < 0.05 or ** p < 0.01.

Figure 6.
The content of hormones in the roots of soybean suffering Mn toxicity. Content of (A) indole butyric acid (IBA), (B) indoleacetic acid (IAA), (C) gibberellic acid 3 (GA3), and (D) abscisic acid (ABA) in soybean roots with 5 μM and 100 μM MnSO4 treatment. The data are represented by the mean value and standard deviation (n = 4). The significance test of difference between normal group and Mn treatment group was implemented with Student’s t test at * p < 0.05.

Figure 7.
Statistical histogram of DEGs. Red represents the quantity of upregulation genes (572), green indicates the quantity of downregulation genes (858), and blue displays the total quantity of DEGs (1430).
Figure 7.
Statistical histogram of DEGs. Red represents the quantity of upregulation genes (572), green indicates the quantity of downregulation genes (858), and blue displays the total quantity of DEGs (1430).

Figure 8.
GO enrichment column of differential genes. MF: molecular function; BP: biological process; CC: cell composition. A maximum of ten GO entries with the smallest p value were selected for display.
Figure 8.
GO enrichment column of differential genes. MF: molecular function; BP: biological process; CC: cell composition. A maximum of ten GO entries with the smallest p value were selected for display.

Figure 9.
KEGG enrichment bubble map of DEGs. RF (Rich factor) means the percentage between the amount of DEGs situated in the passageway entry and the total quantity of genes situated in the passageway entry among all of the interpreted genes. The higher the RF is, the higher the gathering level. In general, the value scope of FDR is 0–1, and the nearer it is to zero, the more remarkable the enrichment is.

Figure 10.
qRT-PCR results of 30 DEGs in the roots of soybean at 5 and 100 µM Mn concentrations. The relative expression level of DEGs in the roots of soybean. The data are represented by the mean value and standard deviation (n = 4). The significance test of difference between normal group and Mn treatment group was implemented with Student’s t test at * p < 0.05 or ** p < 0.01. Nramp5: metal transporter; VIT4c: vacuolar iron transporter homolog 4; CBE, CML, CAST, and KIC: calcium-binding proteins; BT2D: boron transporter; NIPA2: magnesium transporter; MTP10: metal tolerance protein 10; SUT2.1: sulfate transporter 2.1; AMT2.1: ammonium transporter; CTATP13: calcium-transporting ATPase 13; ABA11E: ABA synthesis-related protein; SAUR: auxin reactive protein; GRP: gibberellin-responsive protein; POD: peroxidase; bHLH: bHLH transcription factor; ERF: ethylene response transcription factor; WRKY30: WRKY transcription factor; HS6: heat stress transcription factor; FER: FER transcription factor; MYB14: MYB transcription factor; WER-X2: WER transcription factor.

Figure 11.
Regulatory pathway map of roots suffering Mn poisoning in soybean. I: ion transporter-related genes; II: transcription factors; III: hormone-related genes; IV: antioxidant enzymes; V: hormones; and VI: metal ions. Small red arrows express upregulated expression of genes, increased substance content, or increased enzyme activity. Small green arrows express downregulated expression of genes or reduced content of substances.


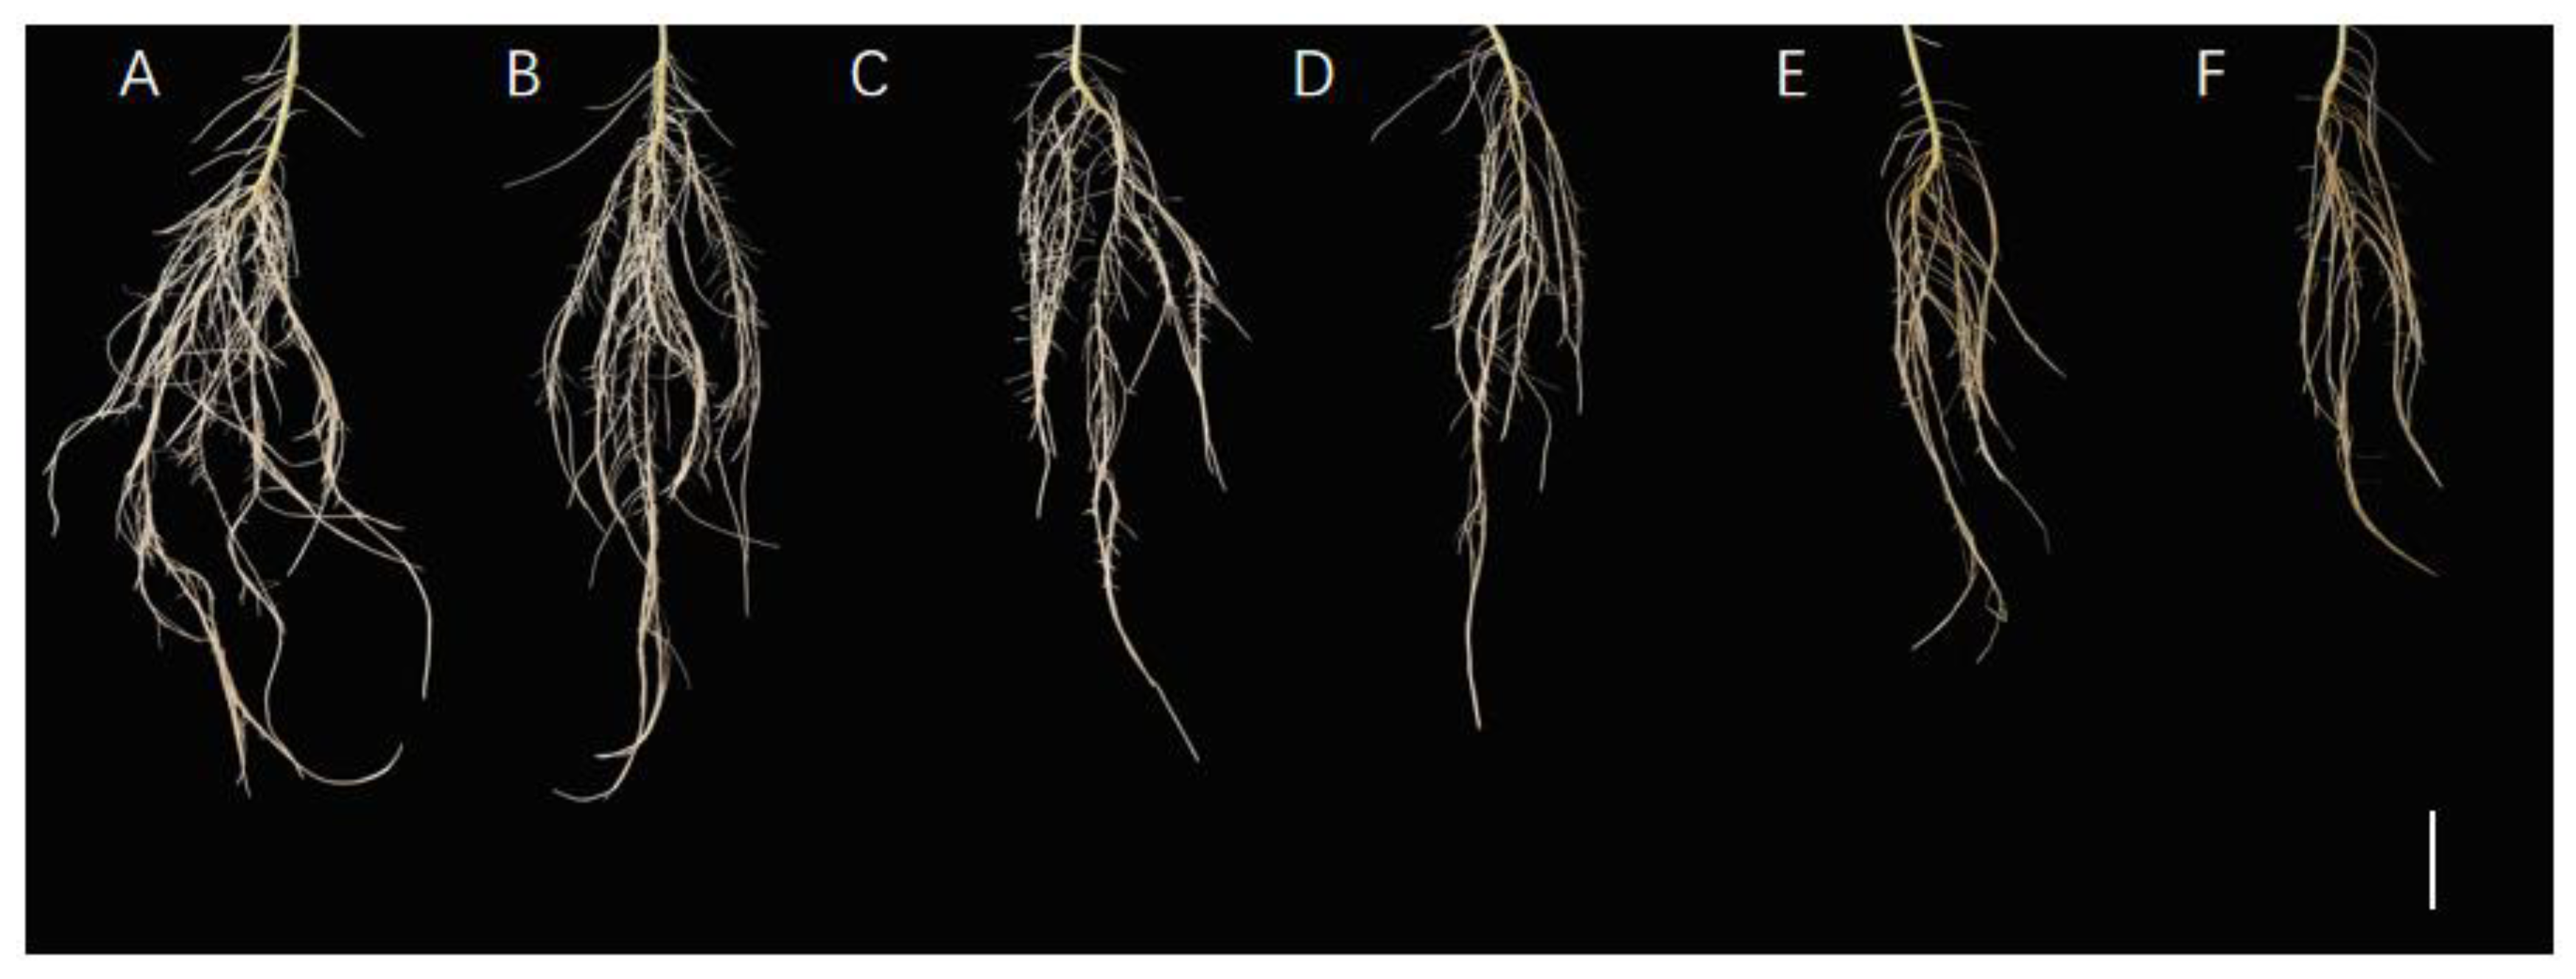
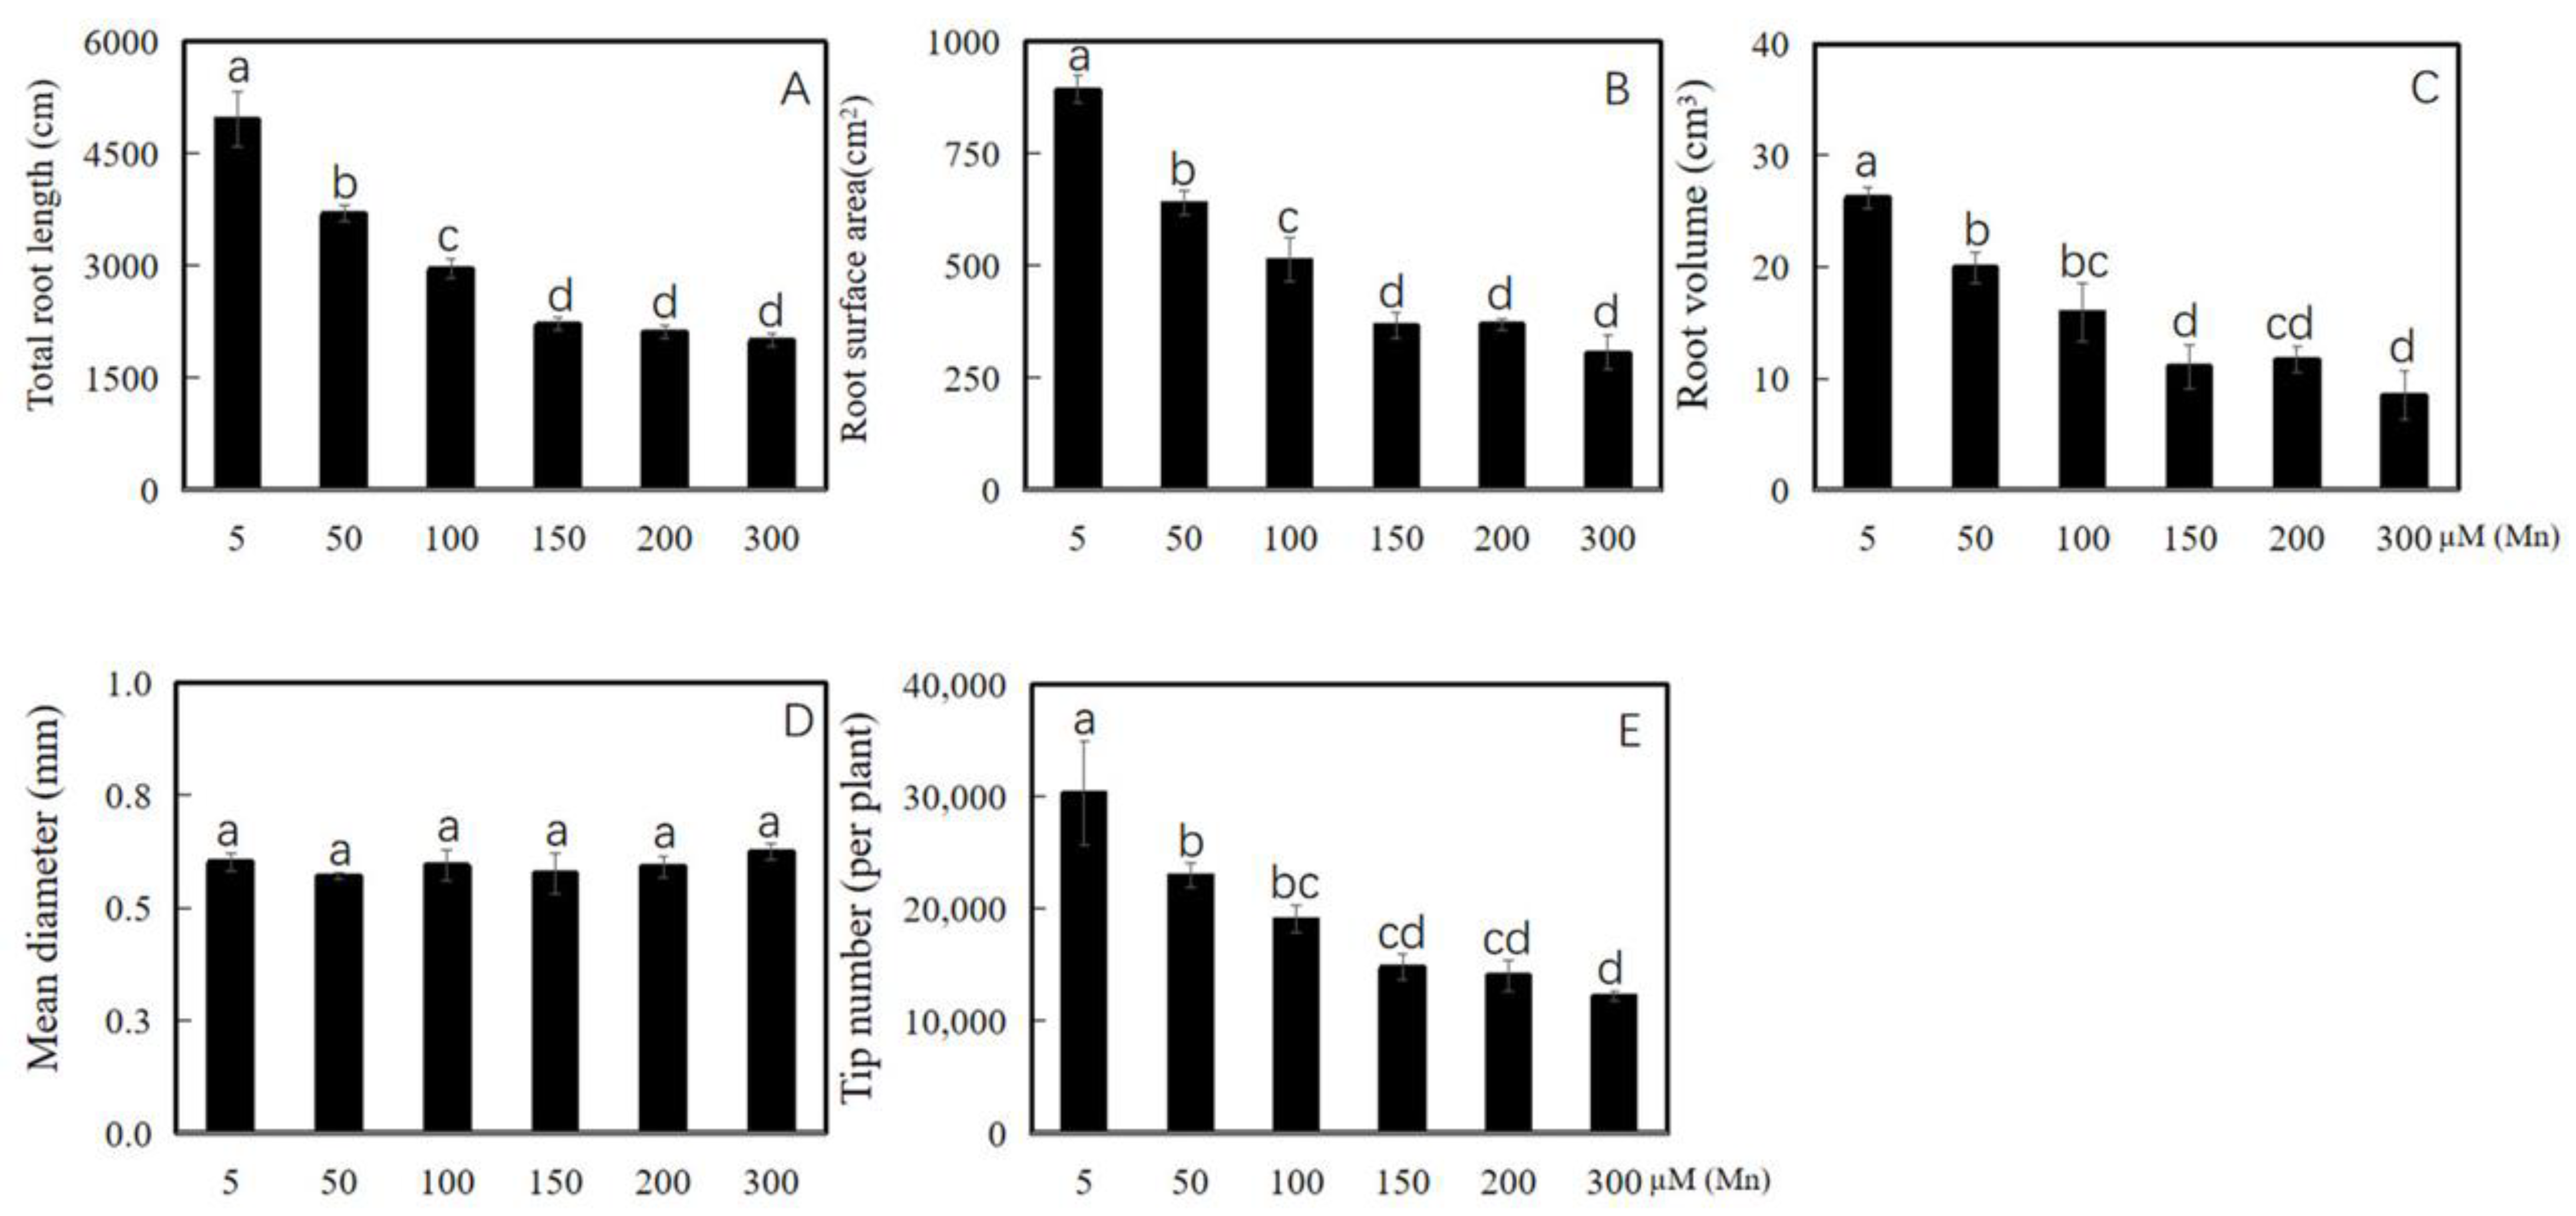
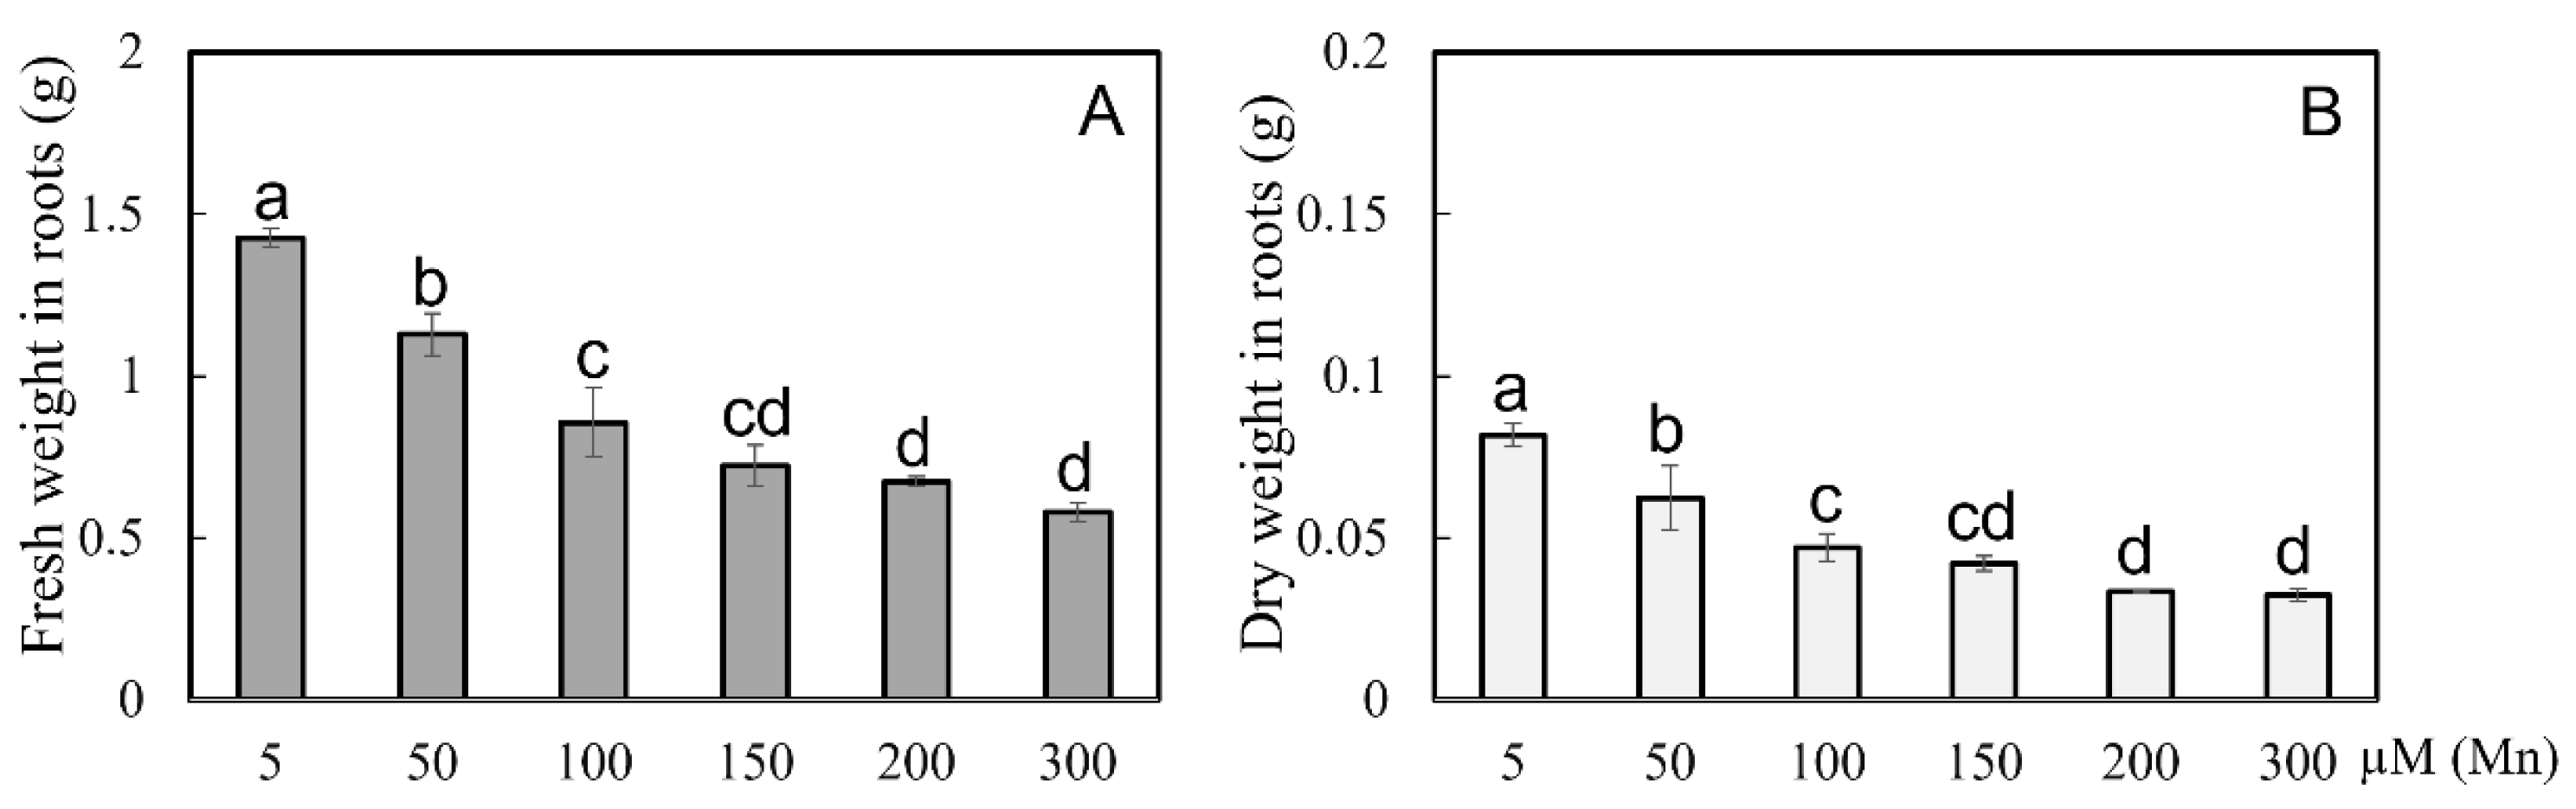
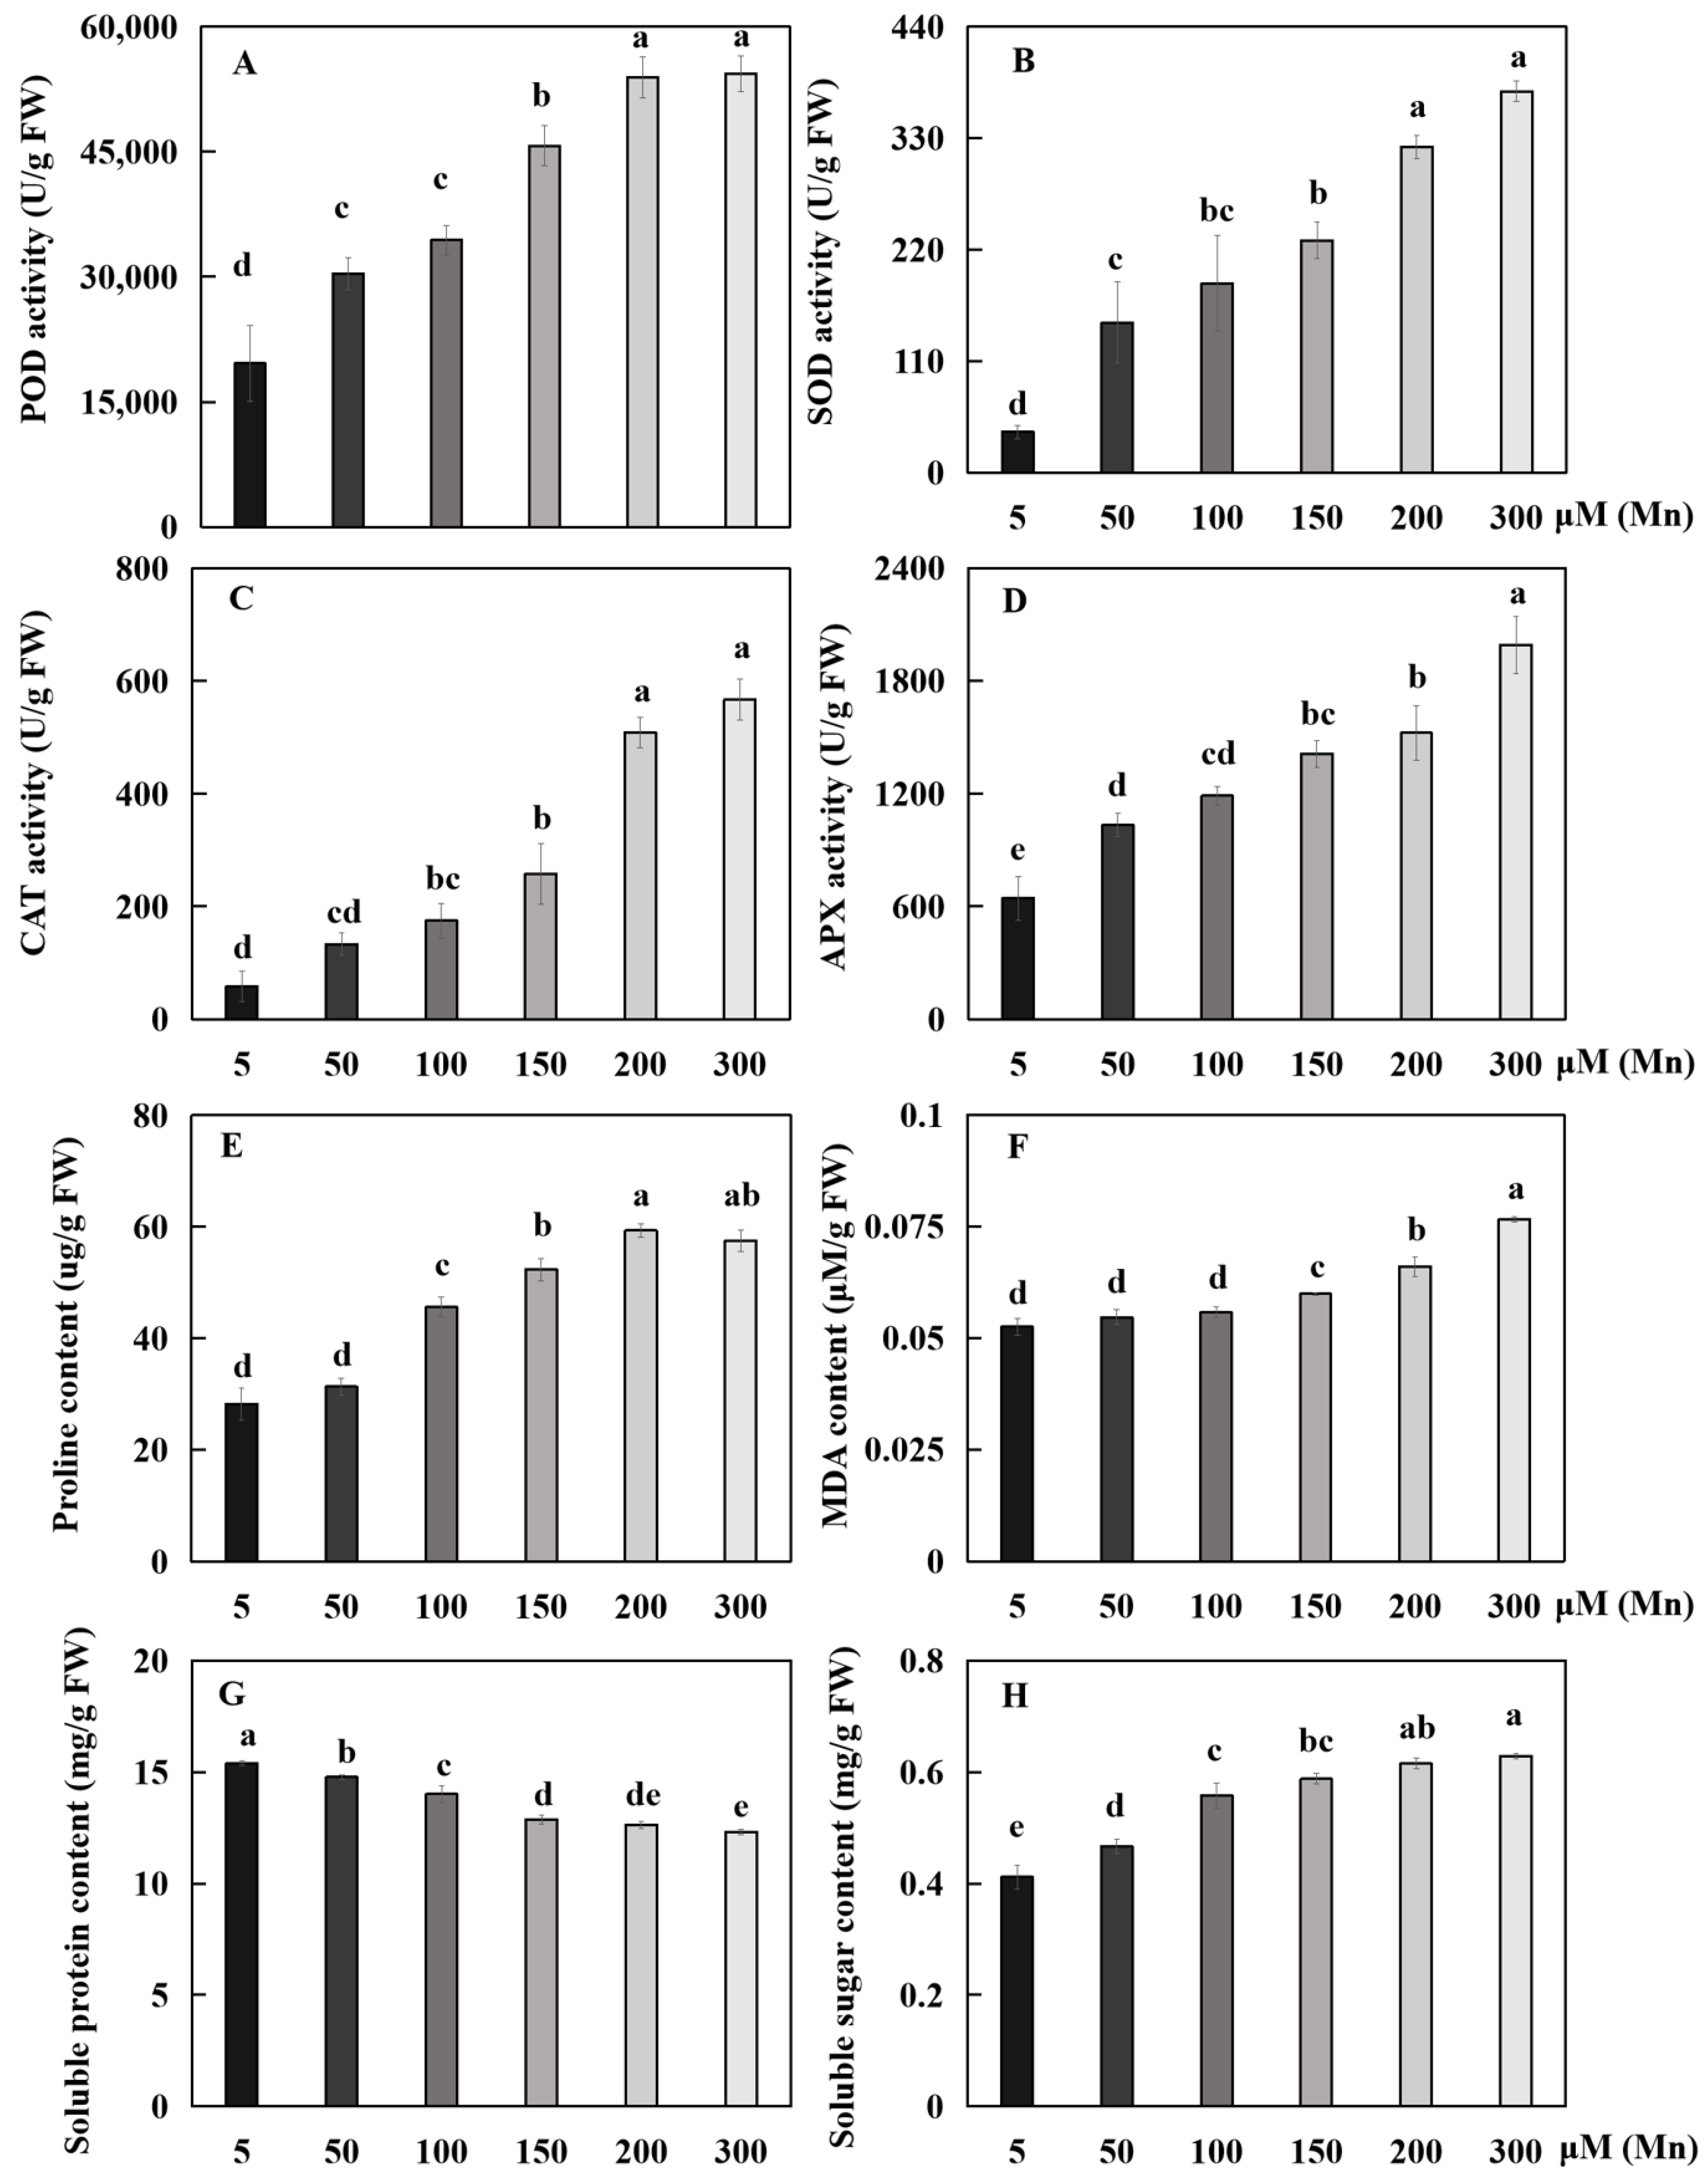
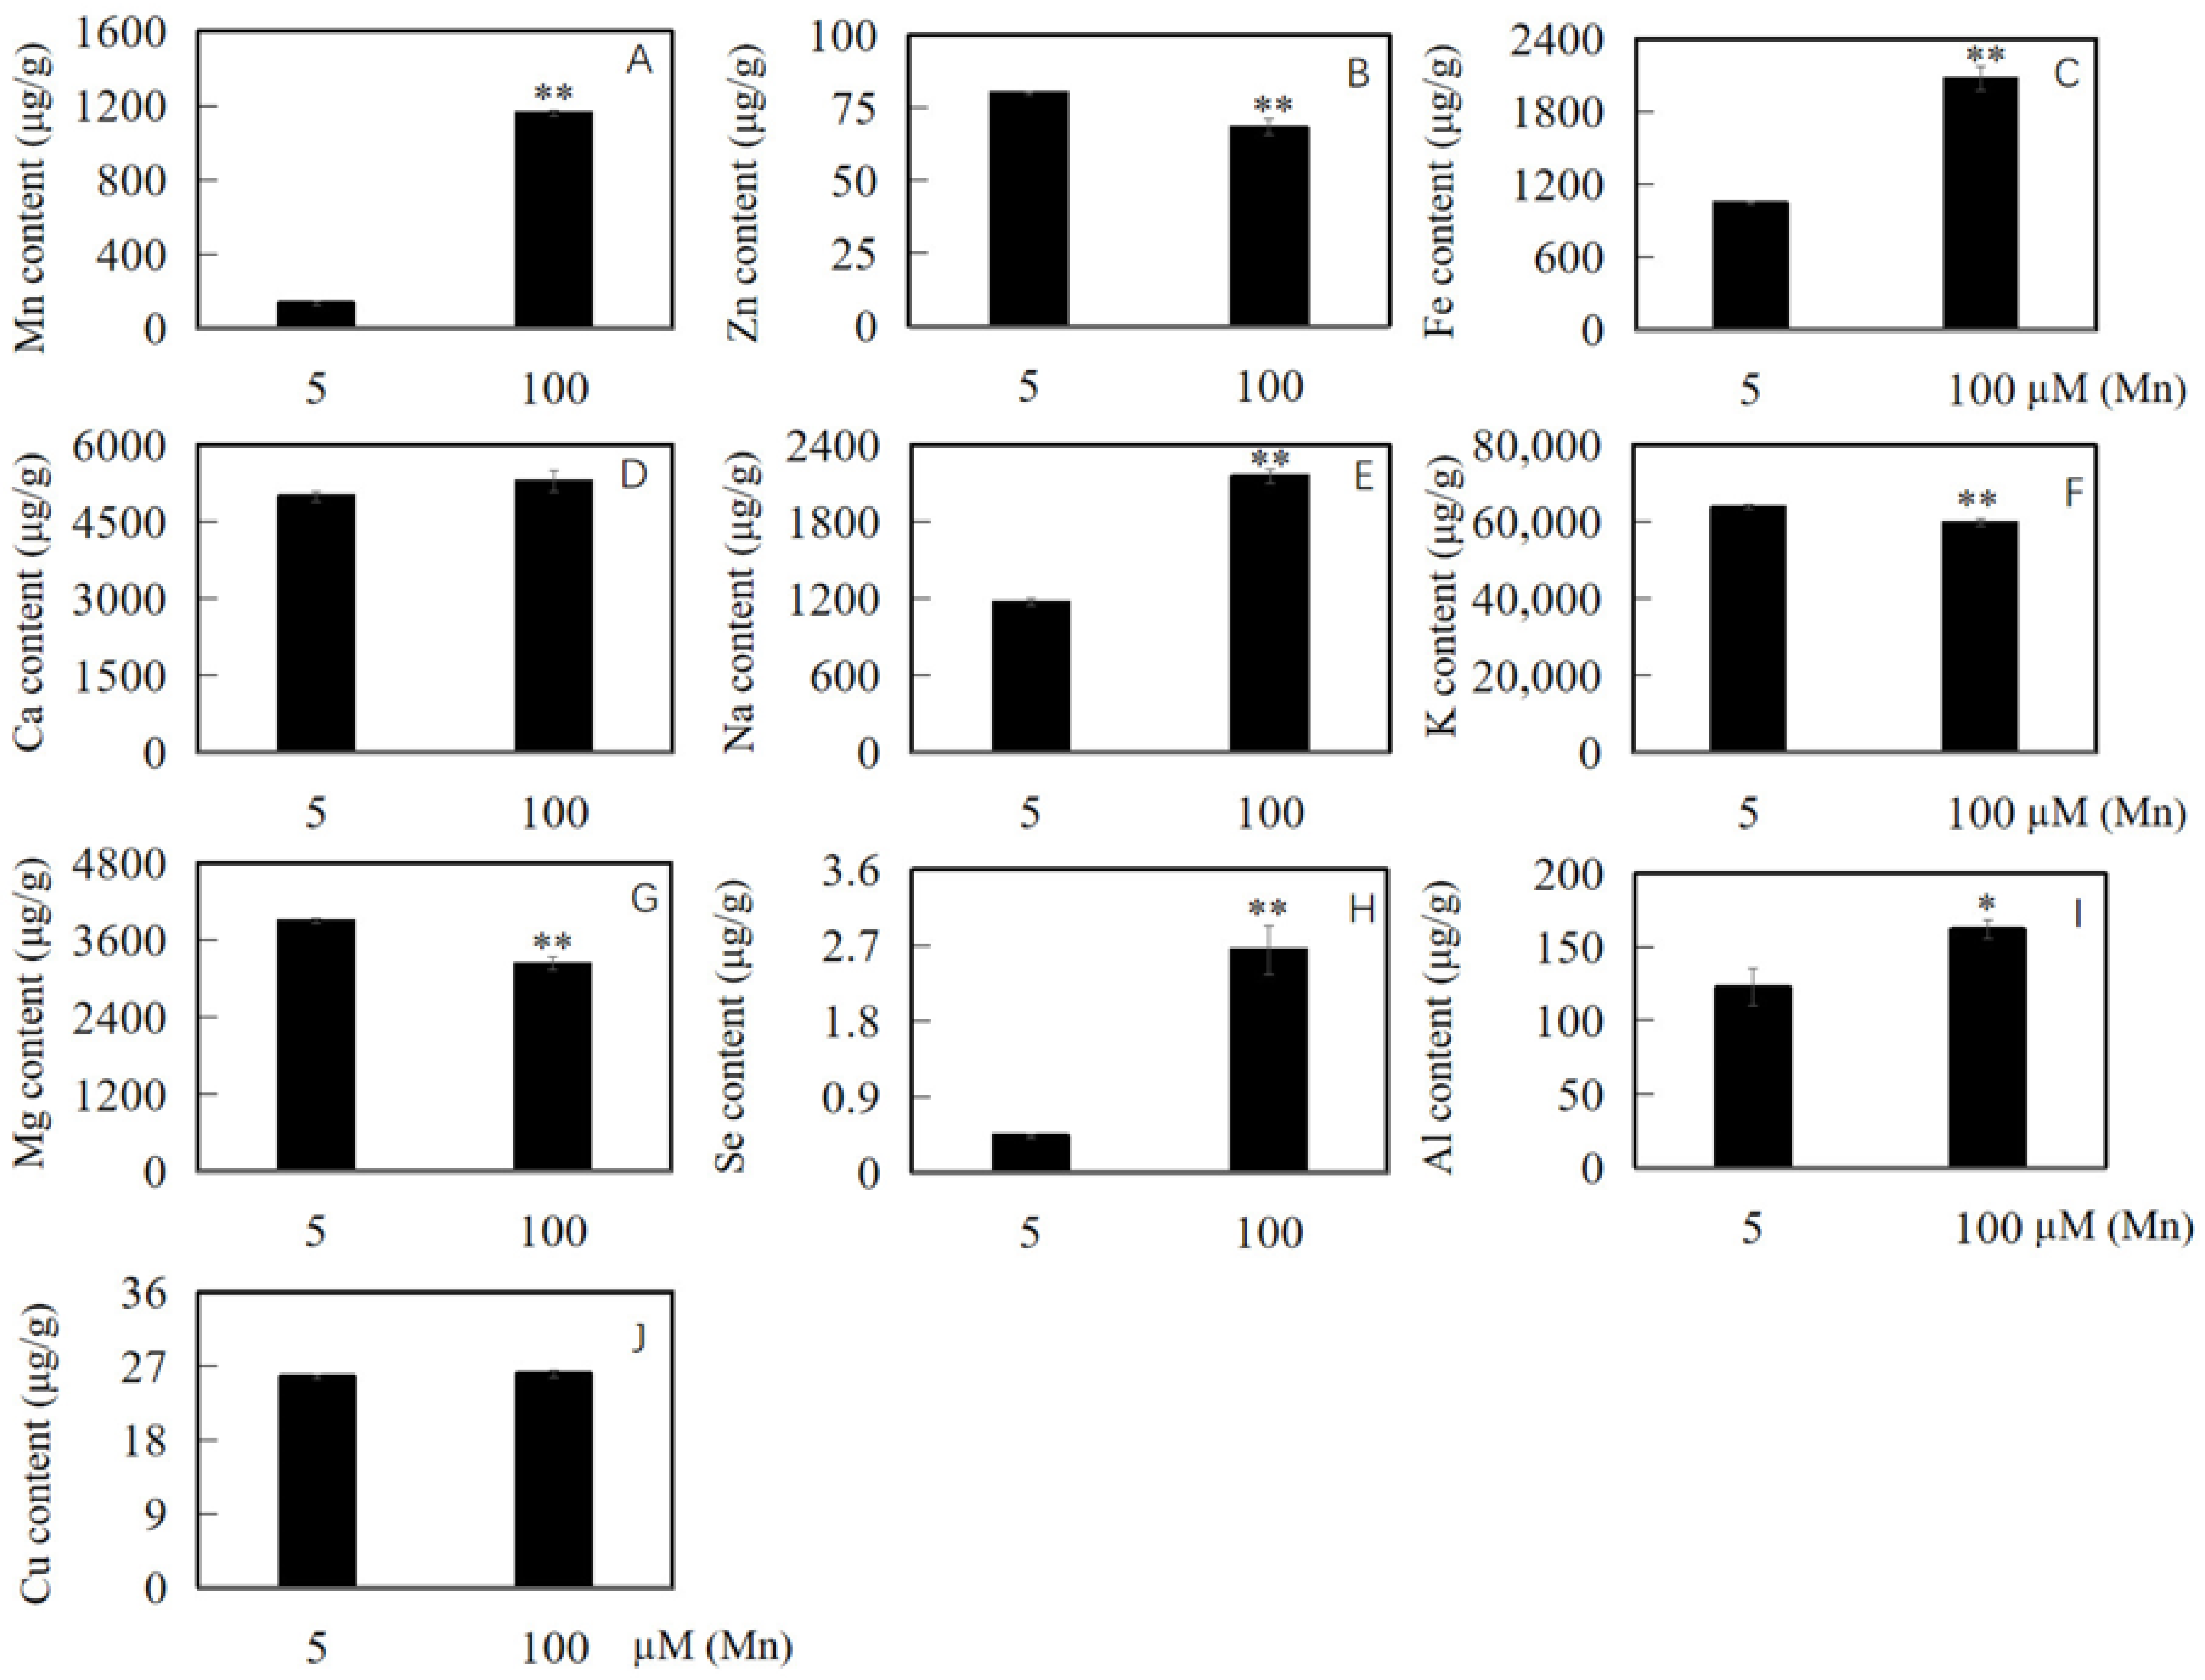
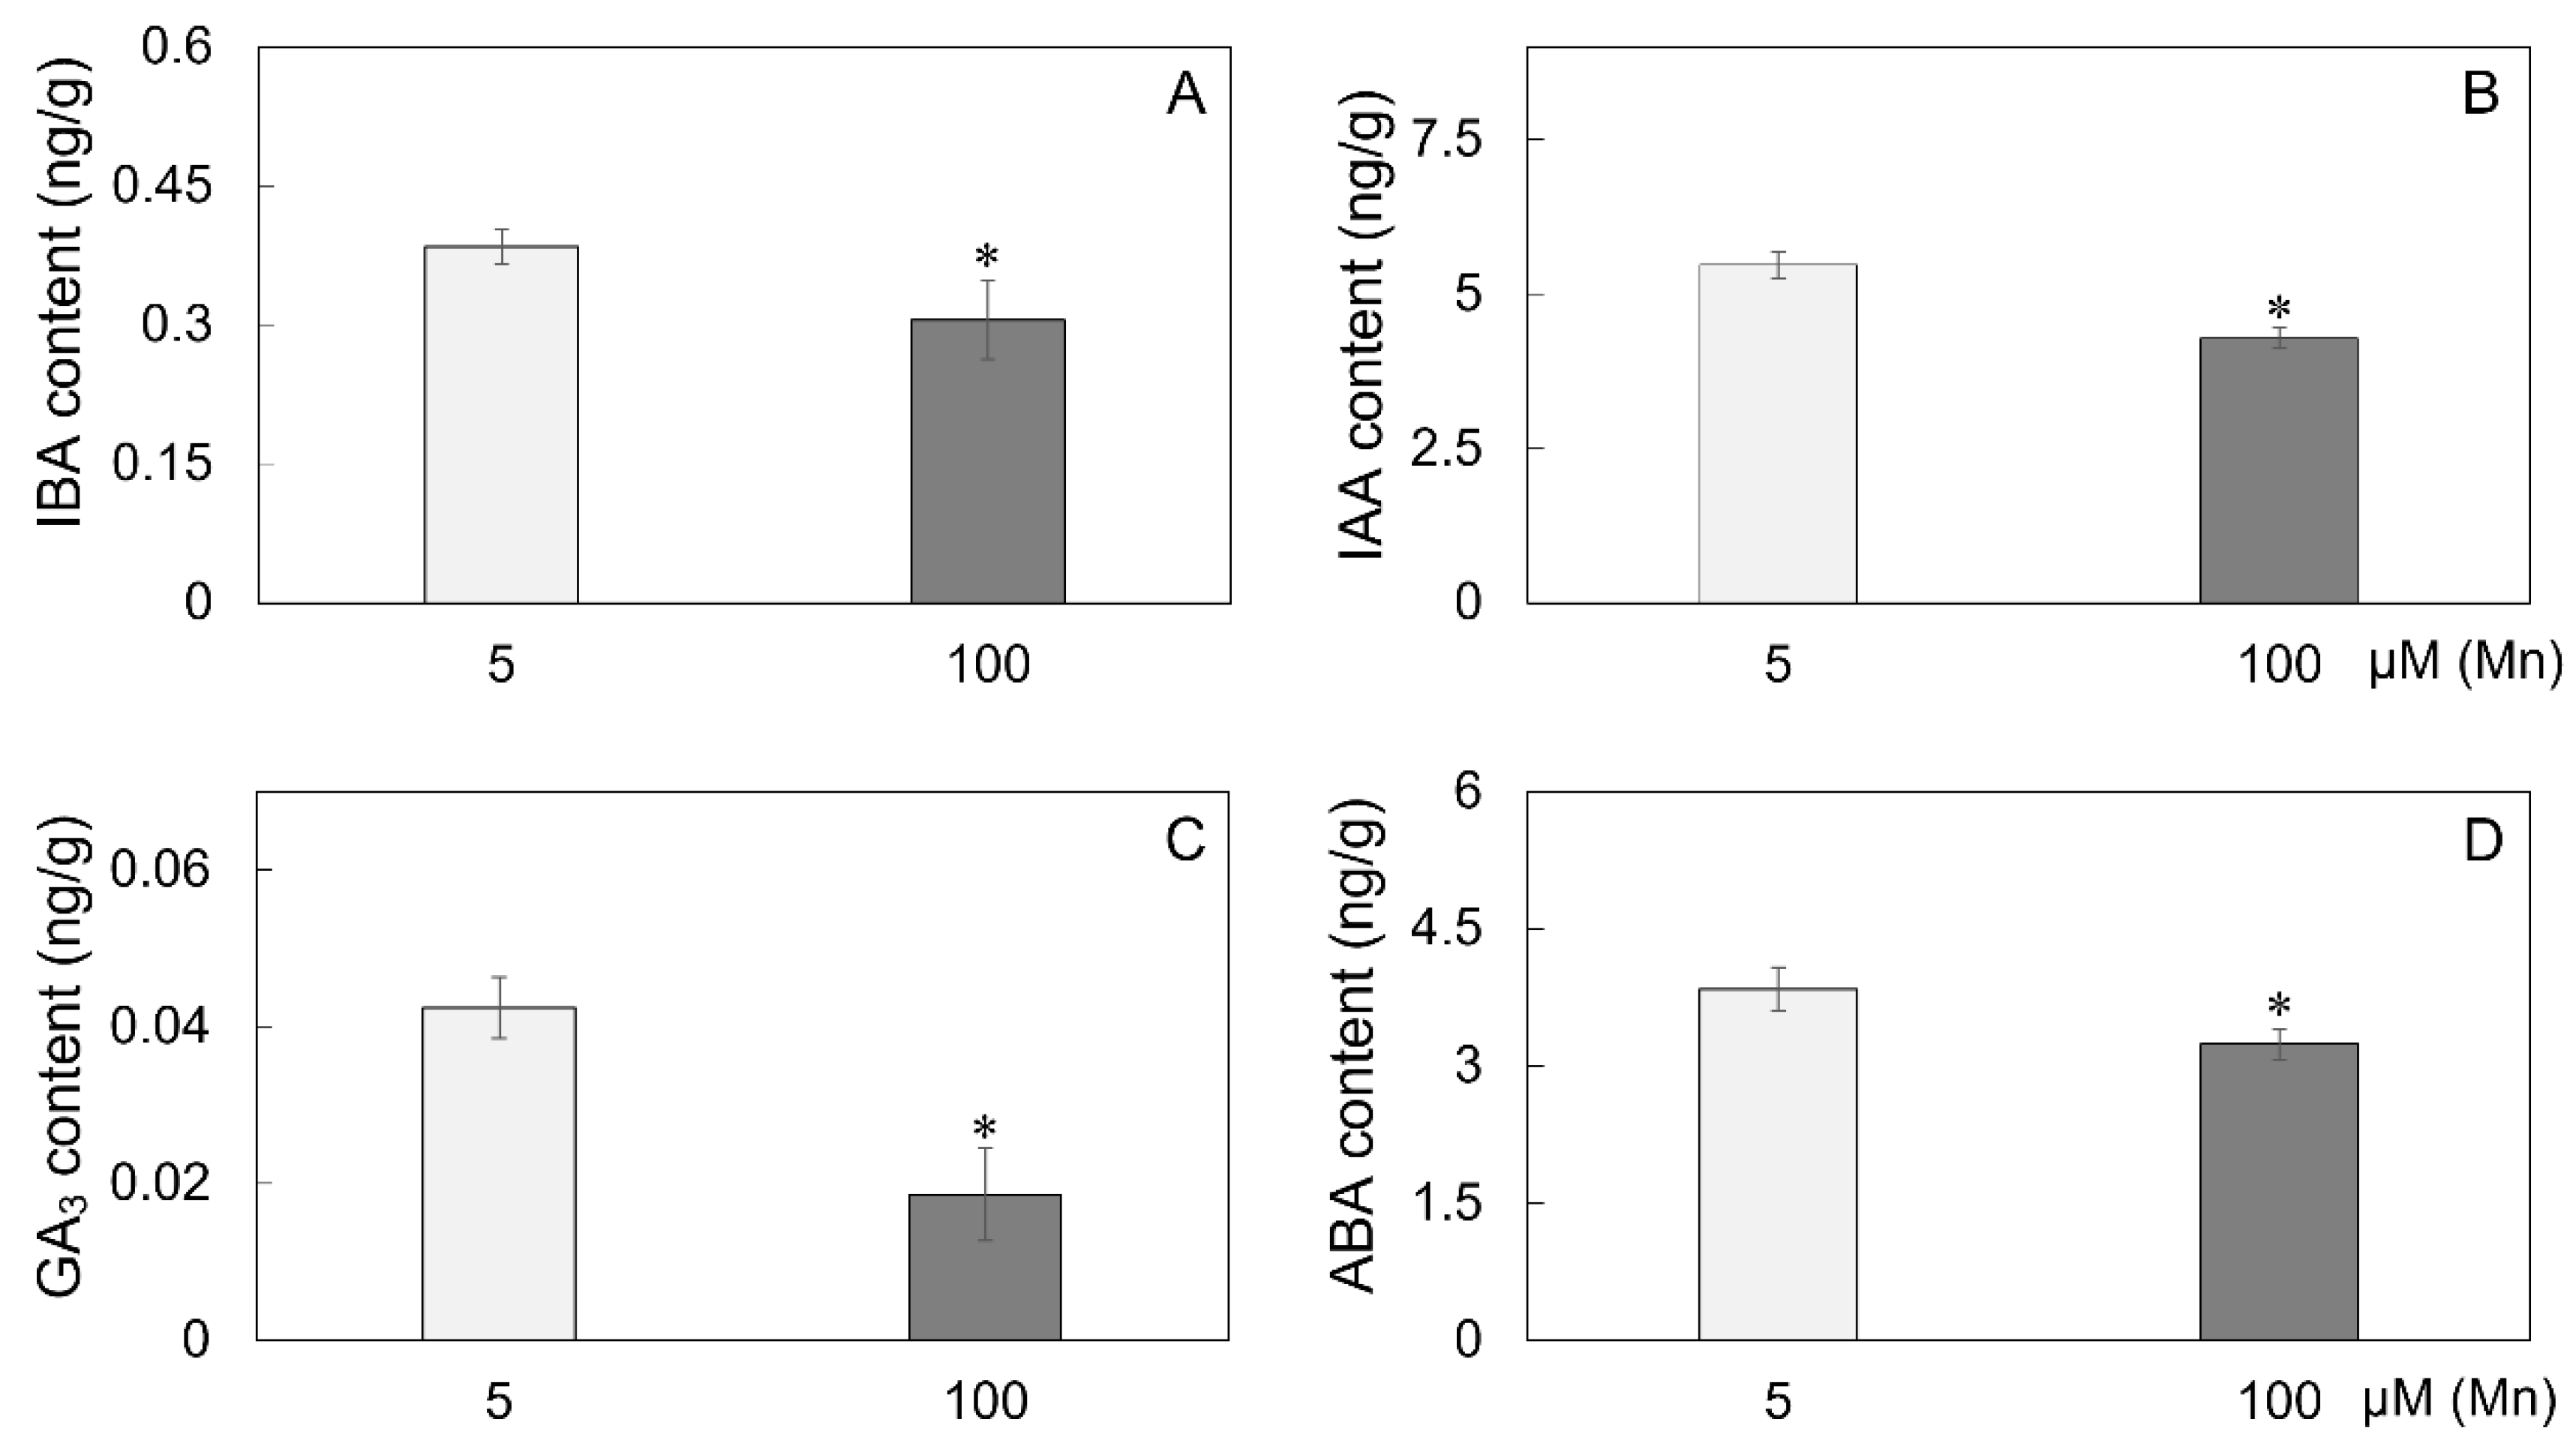
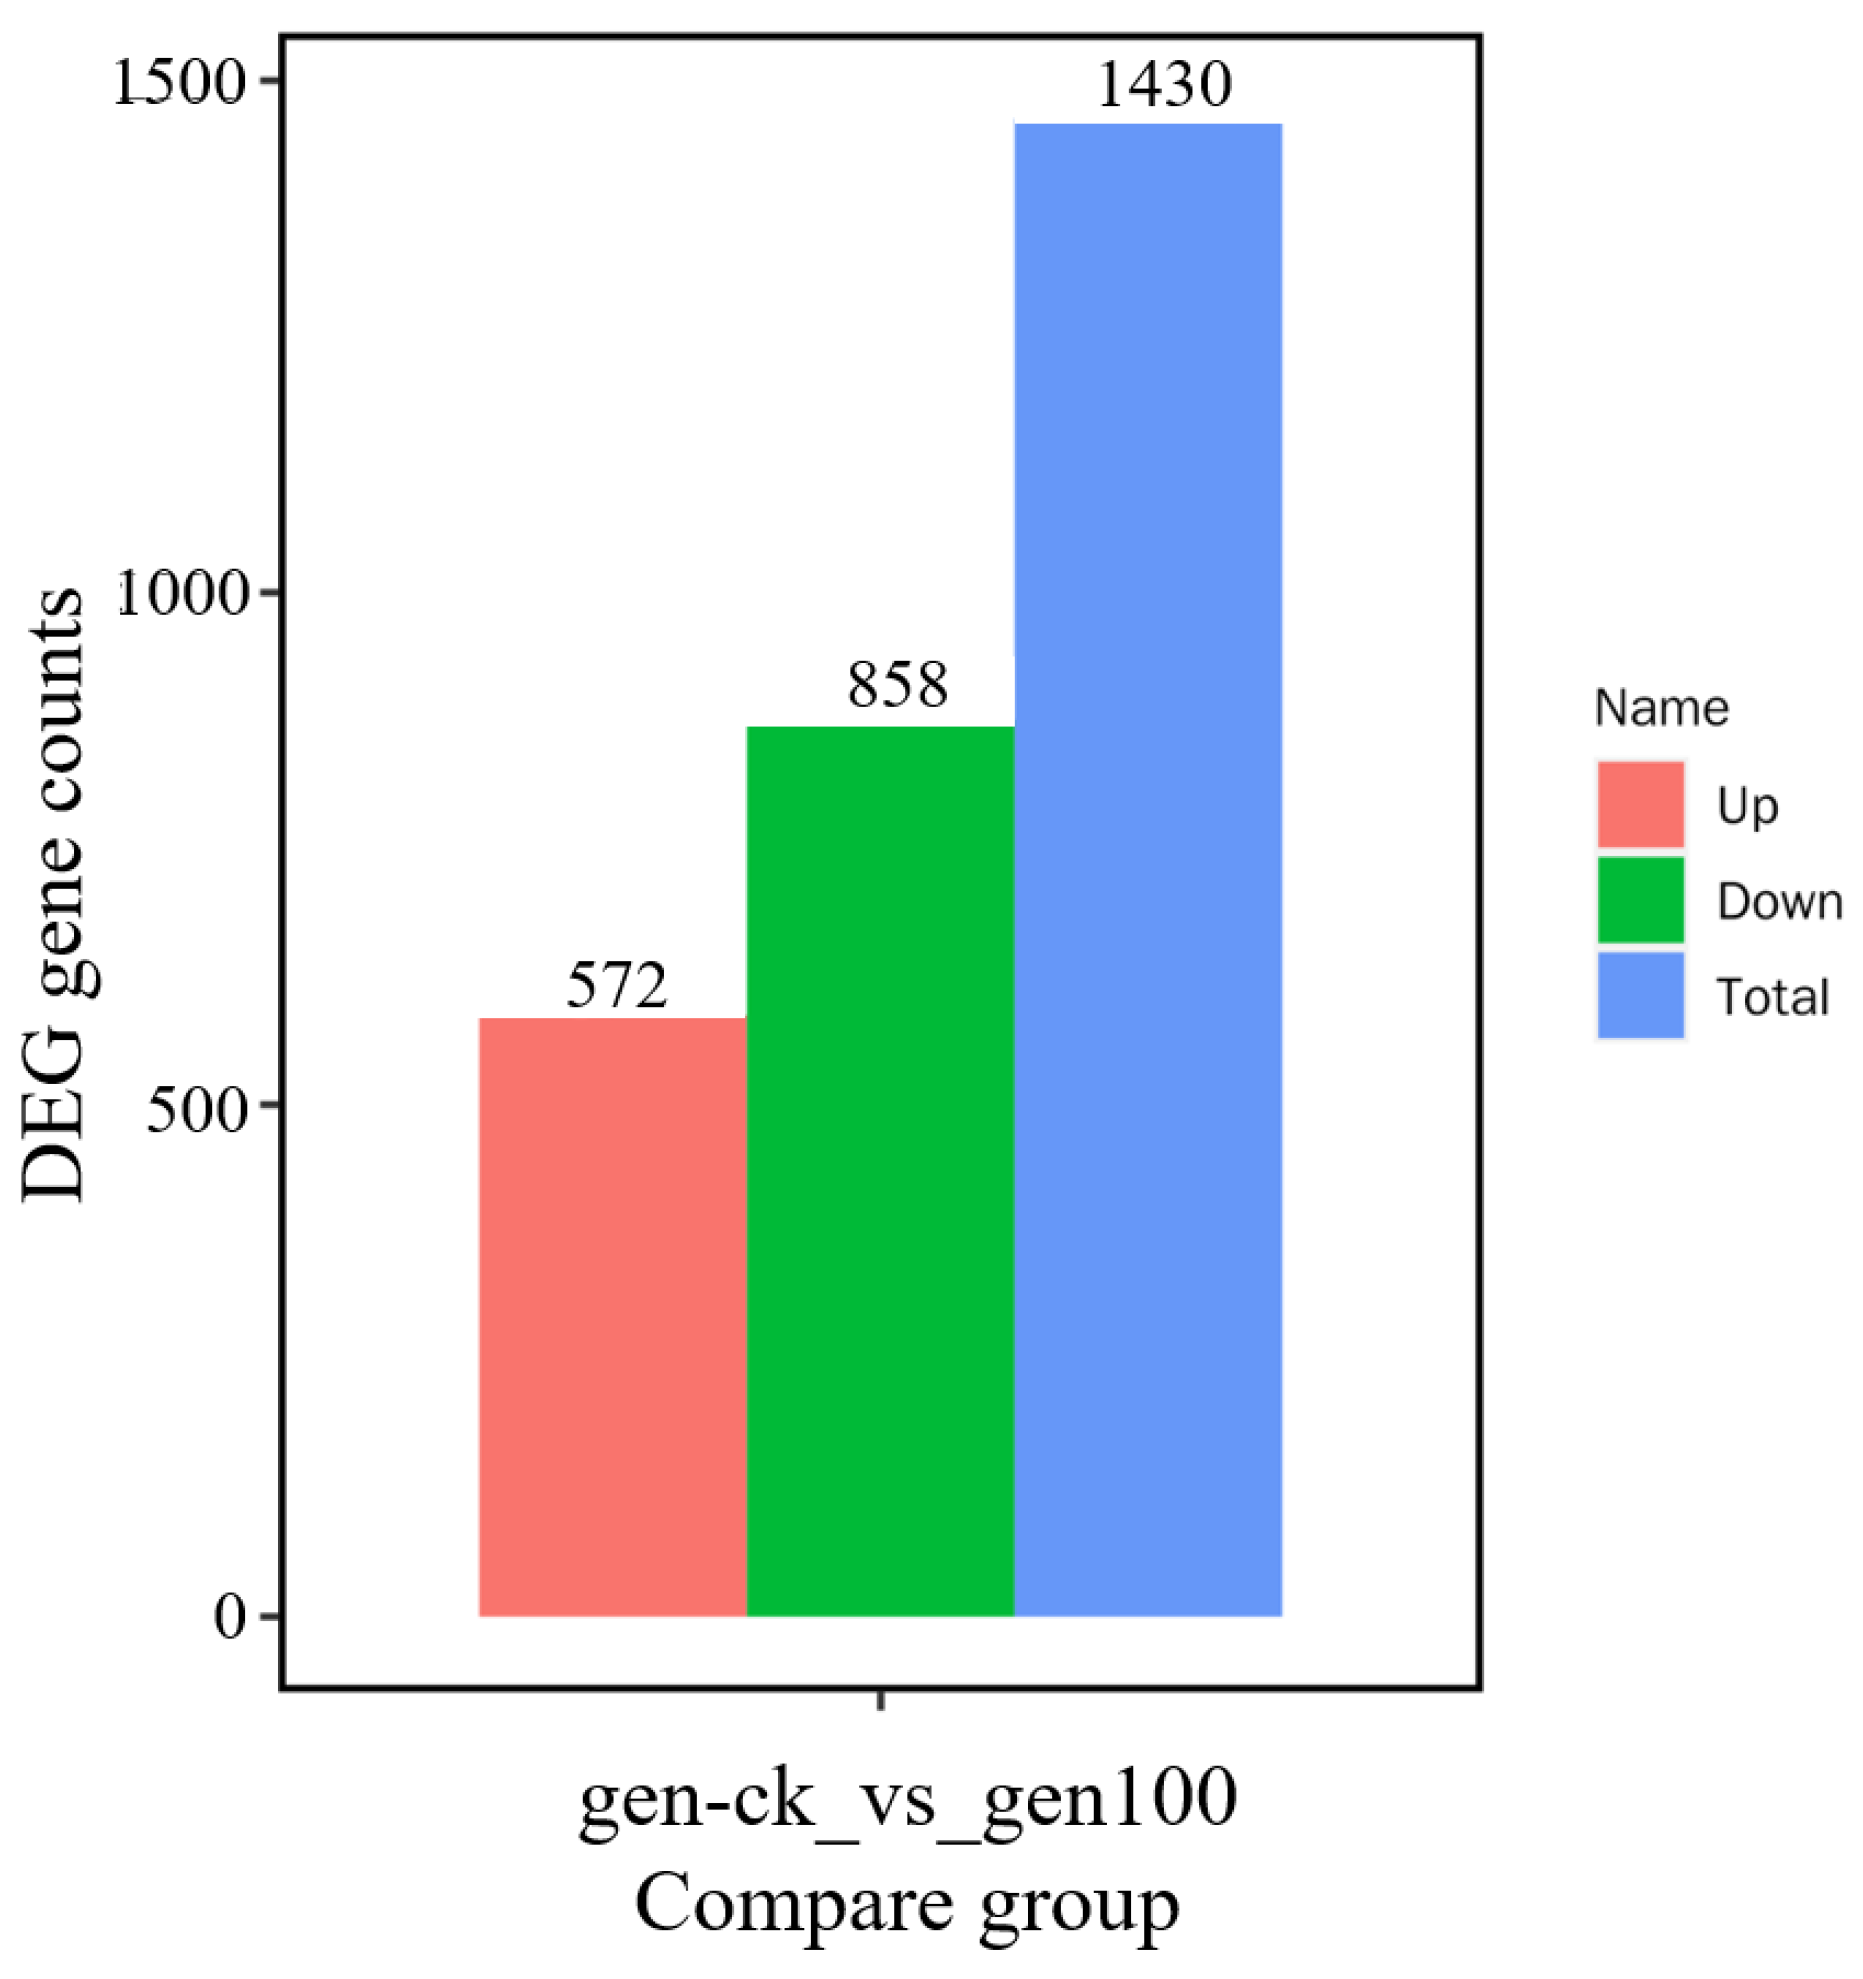
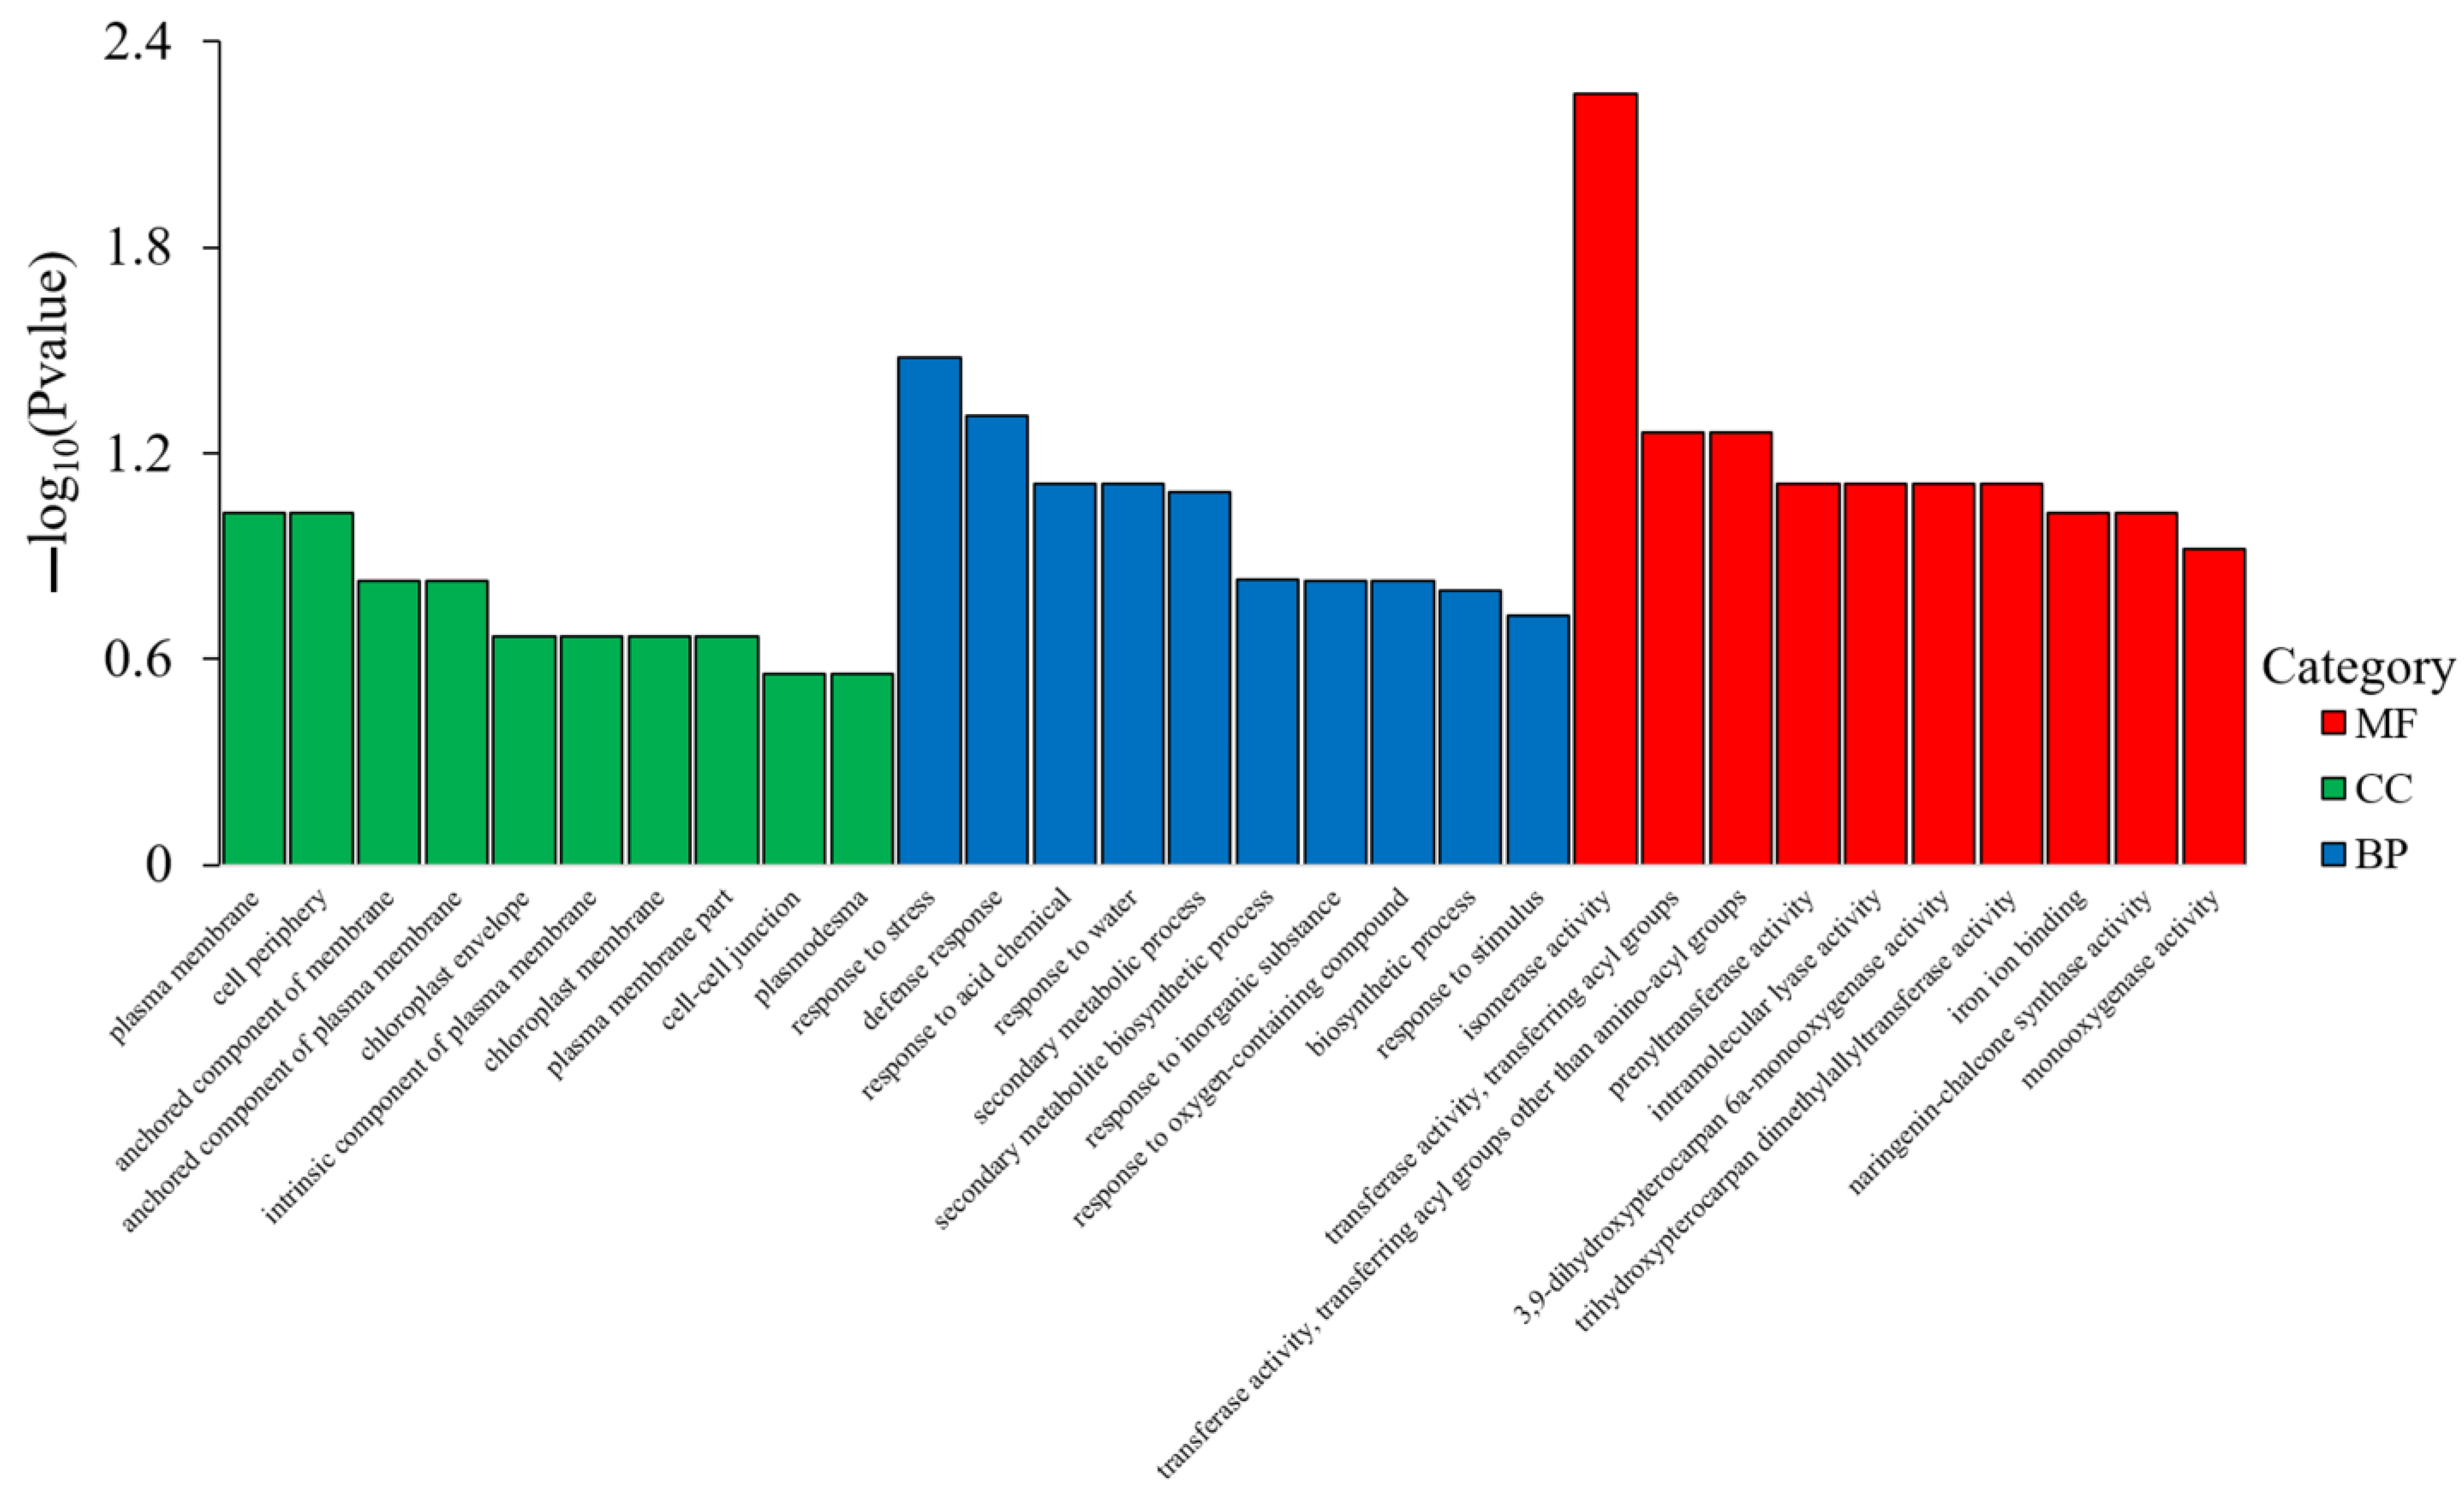
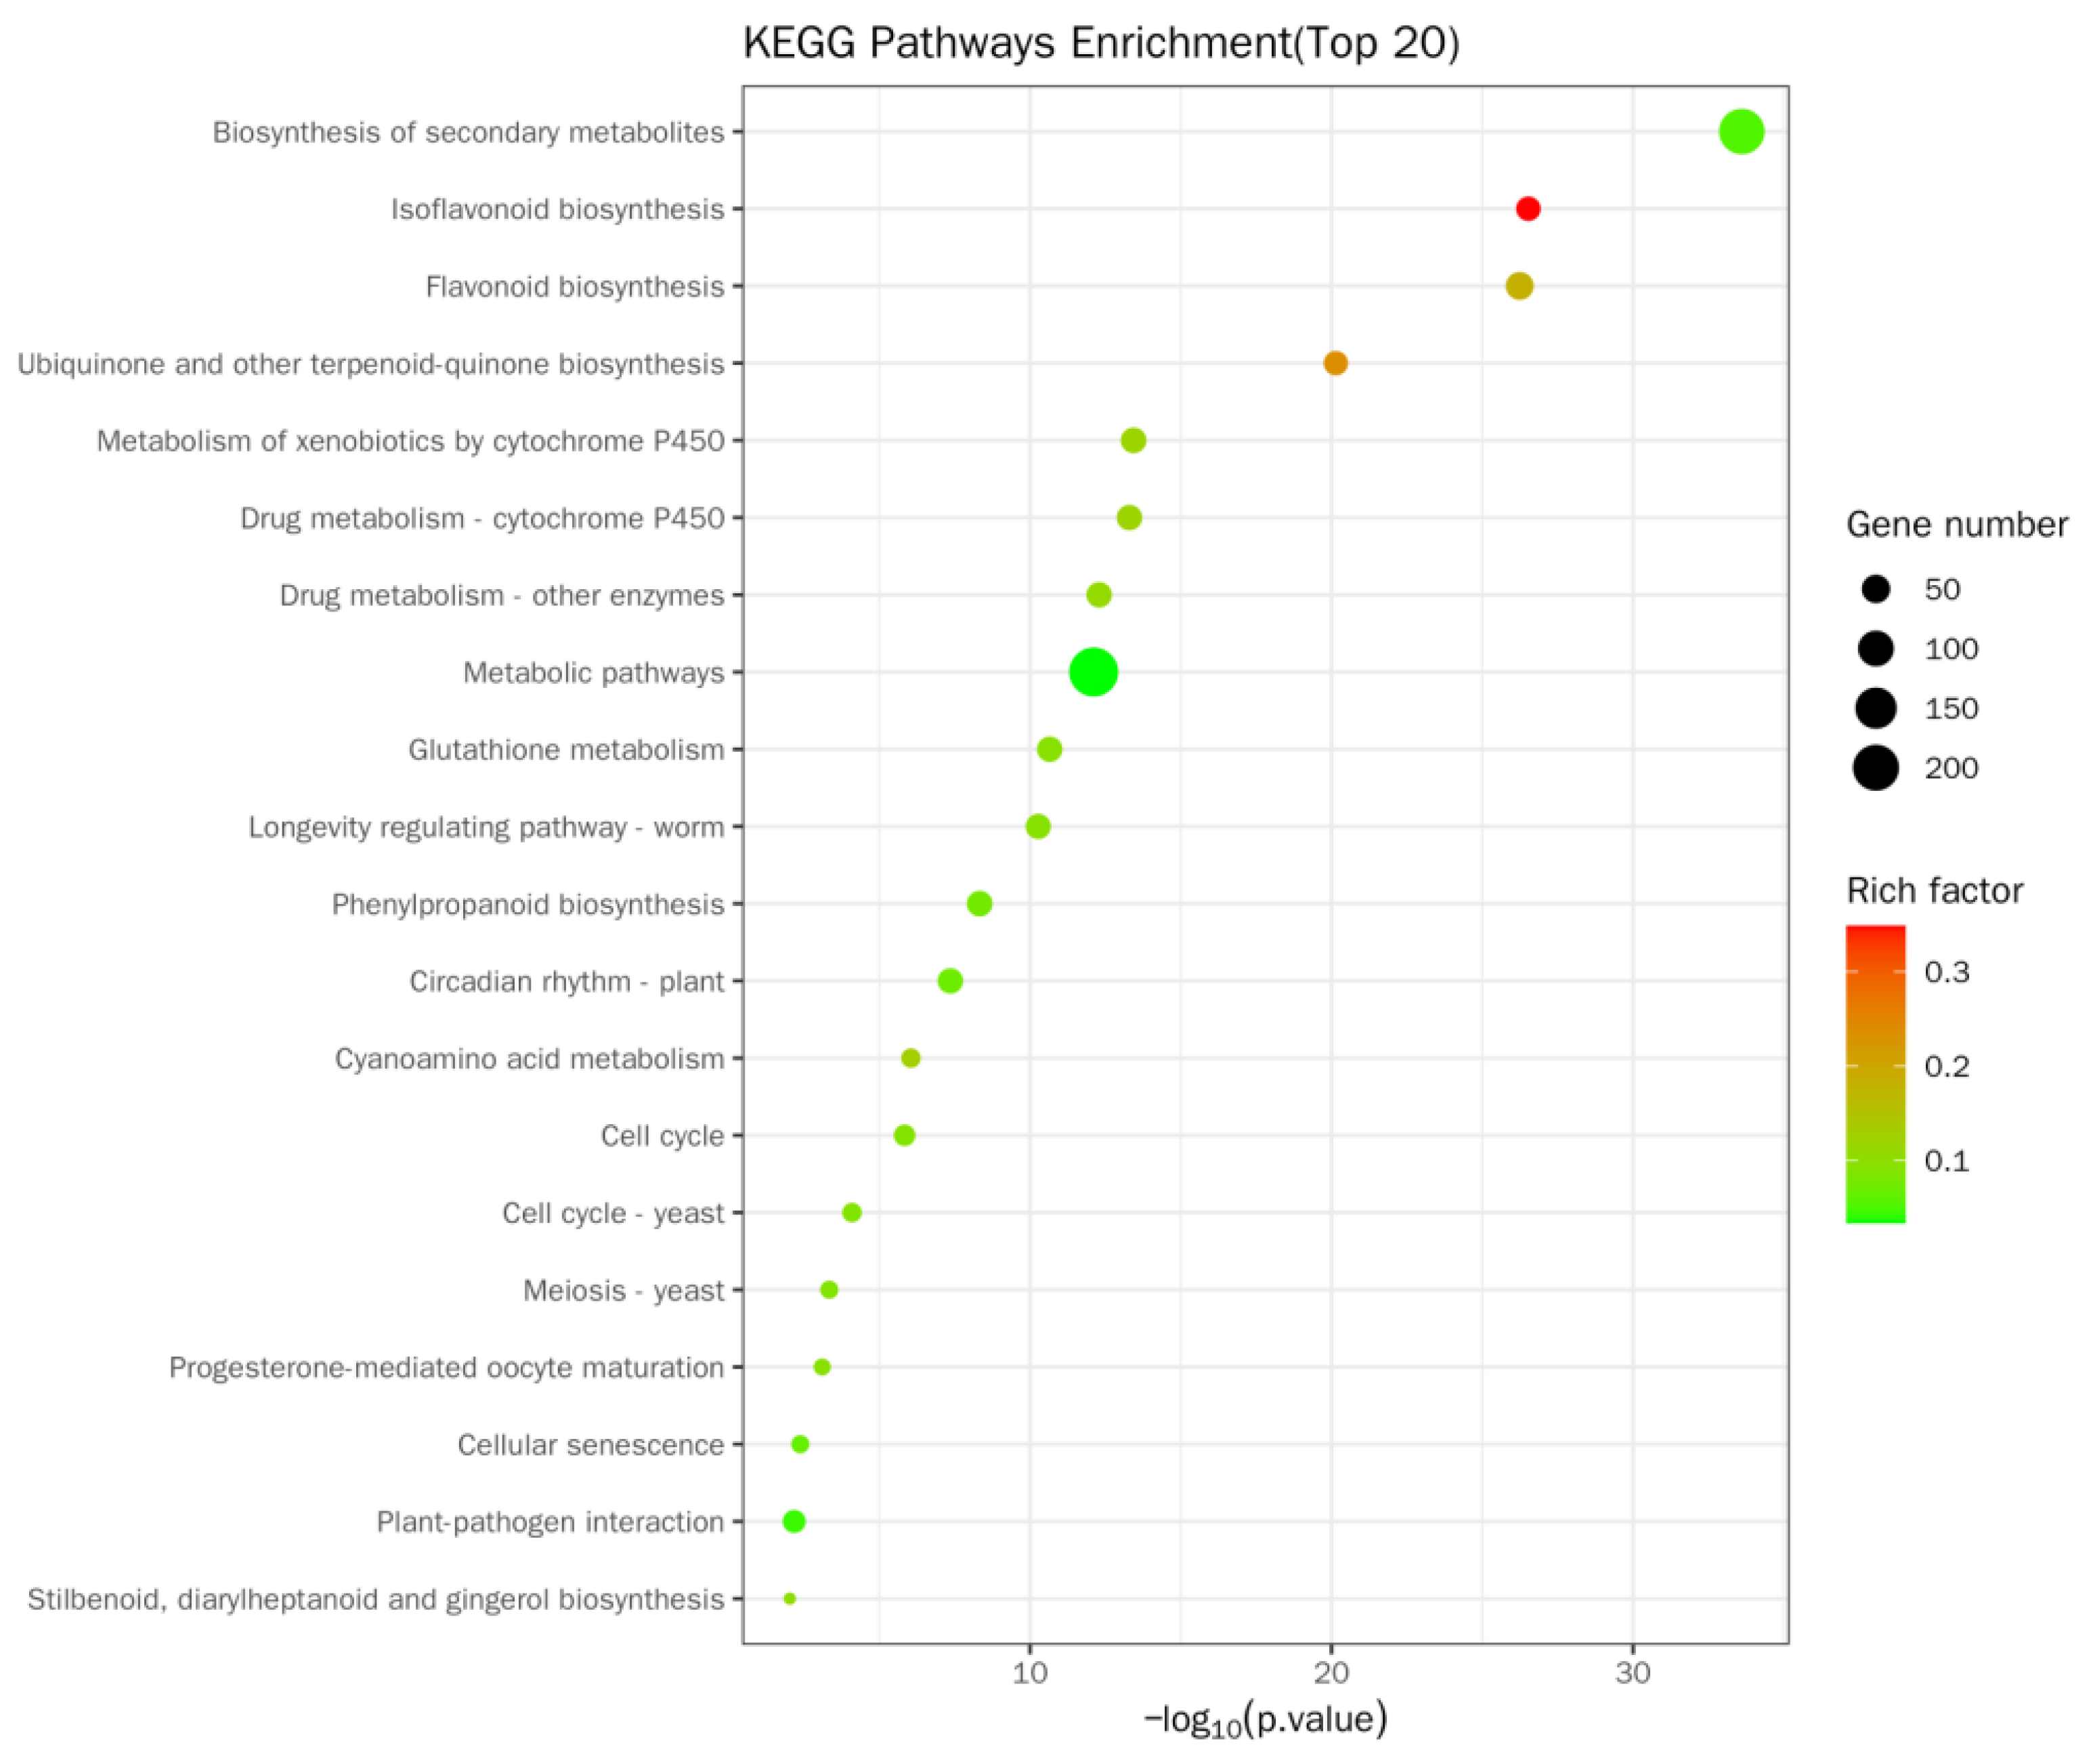
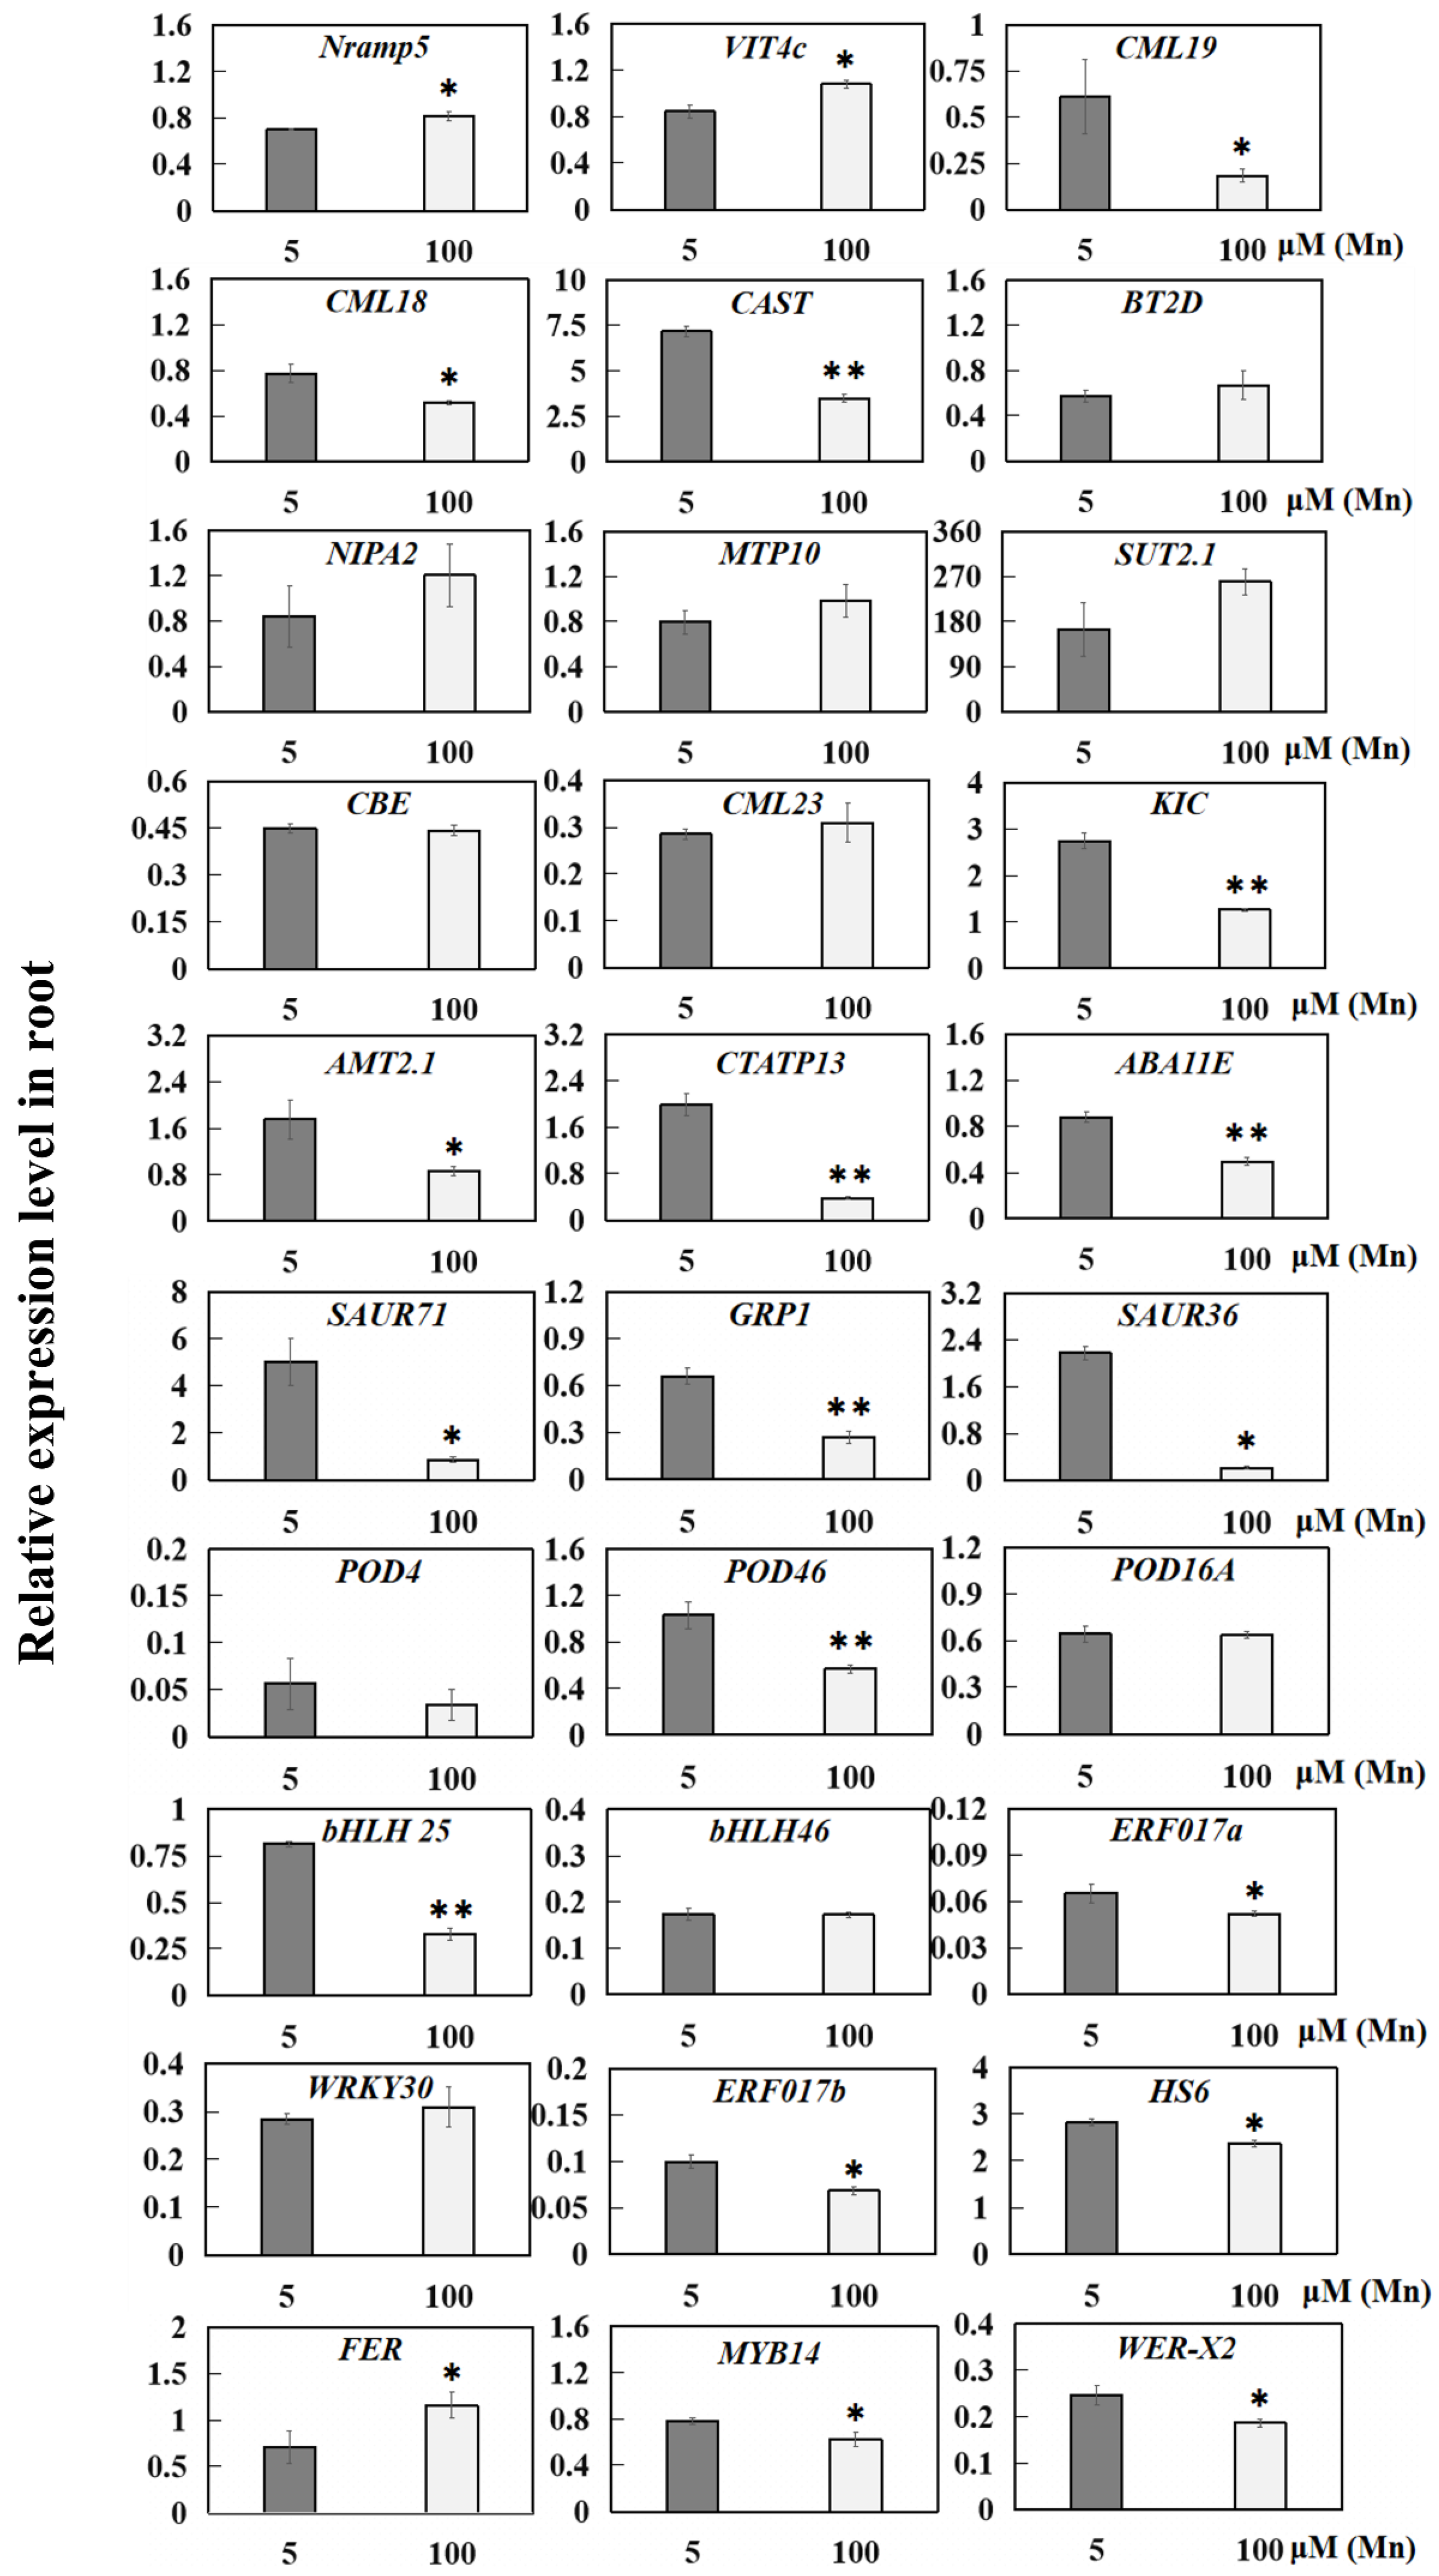
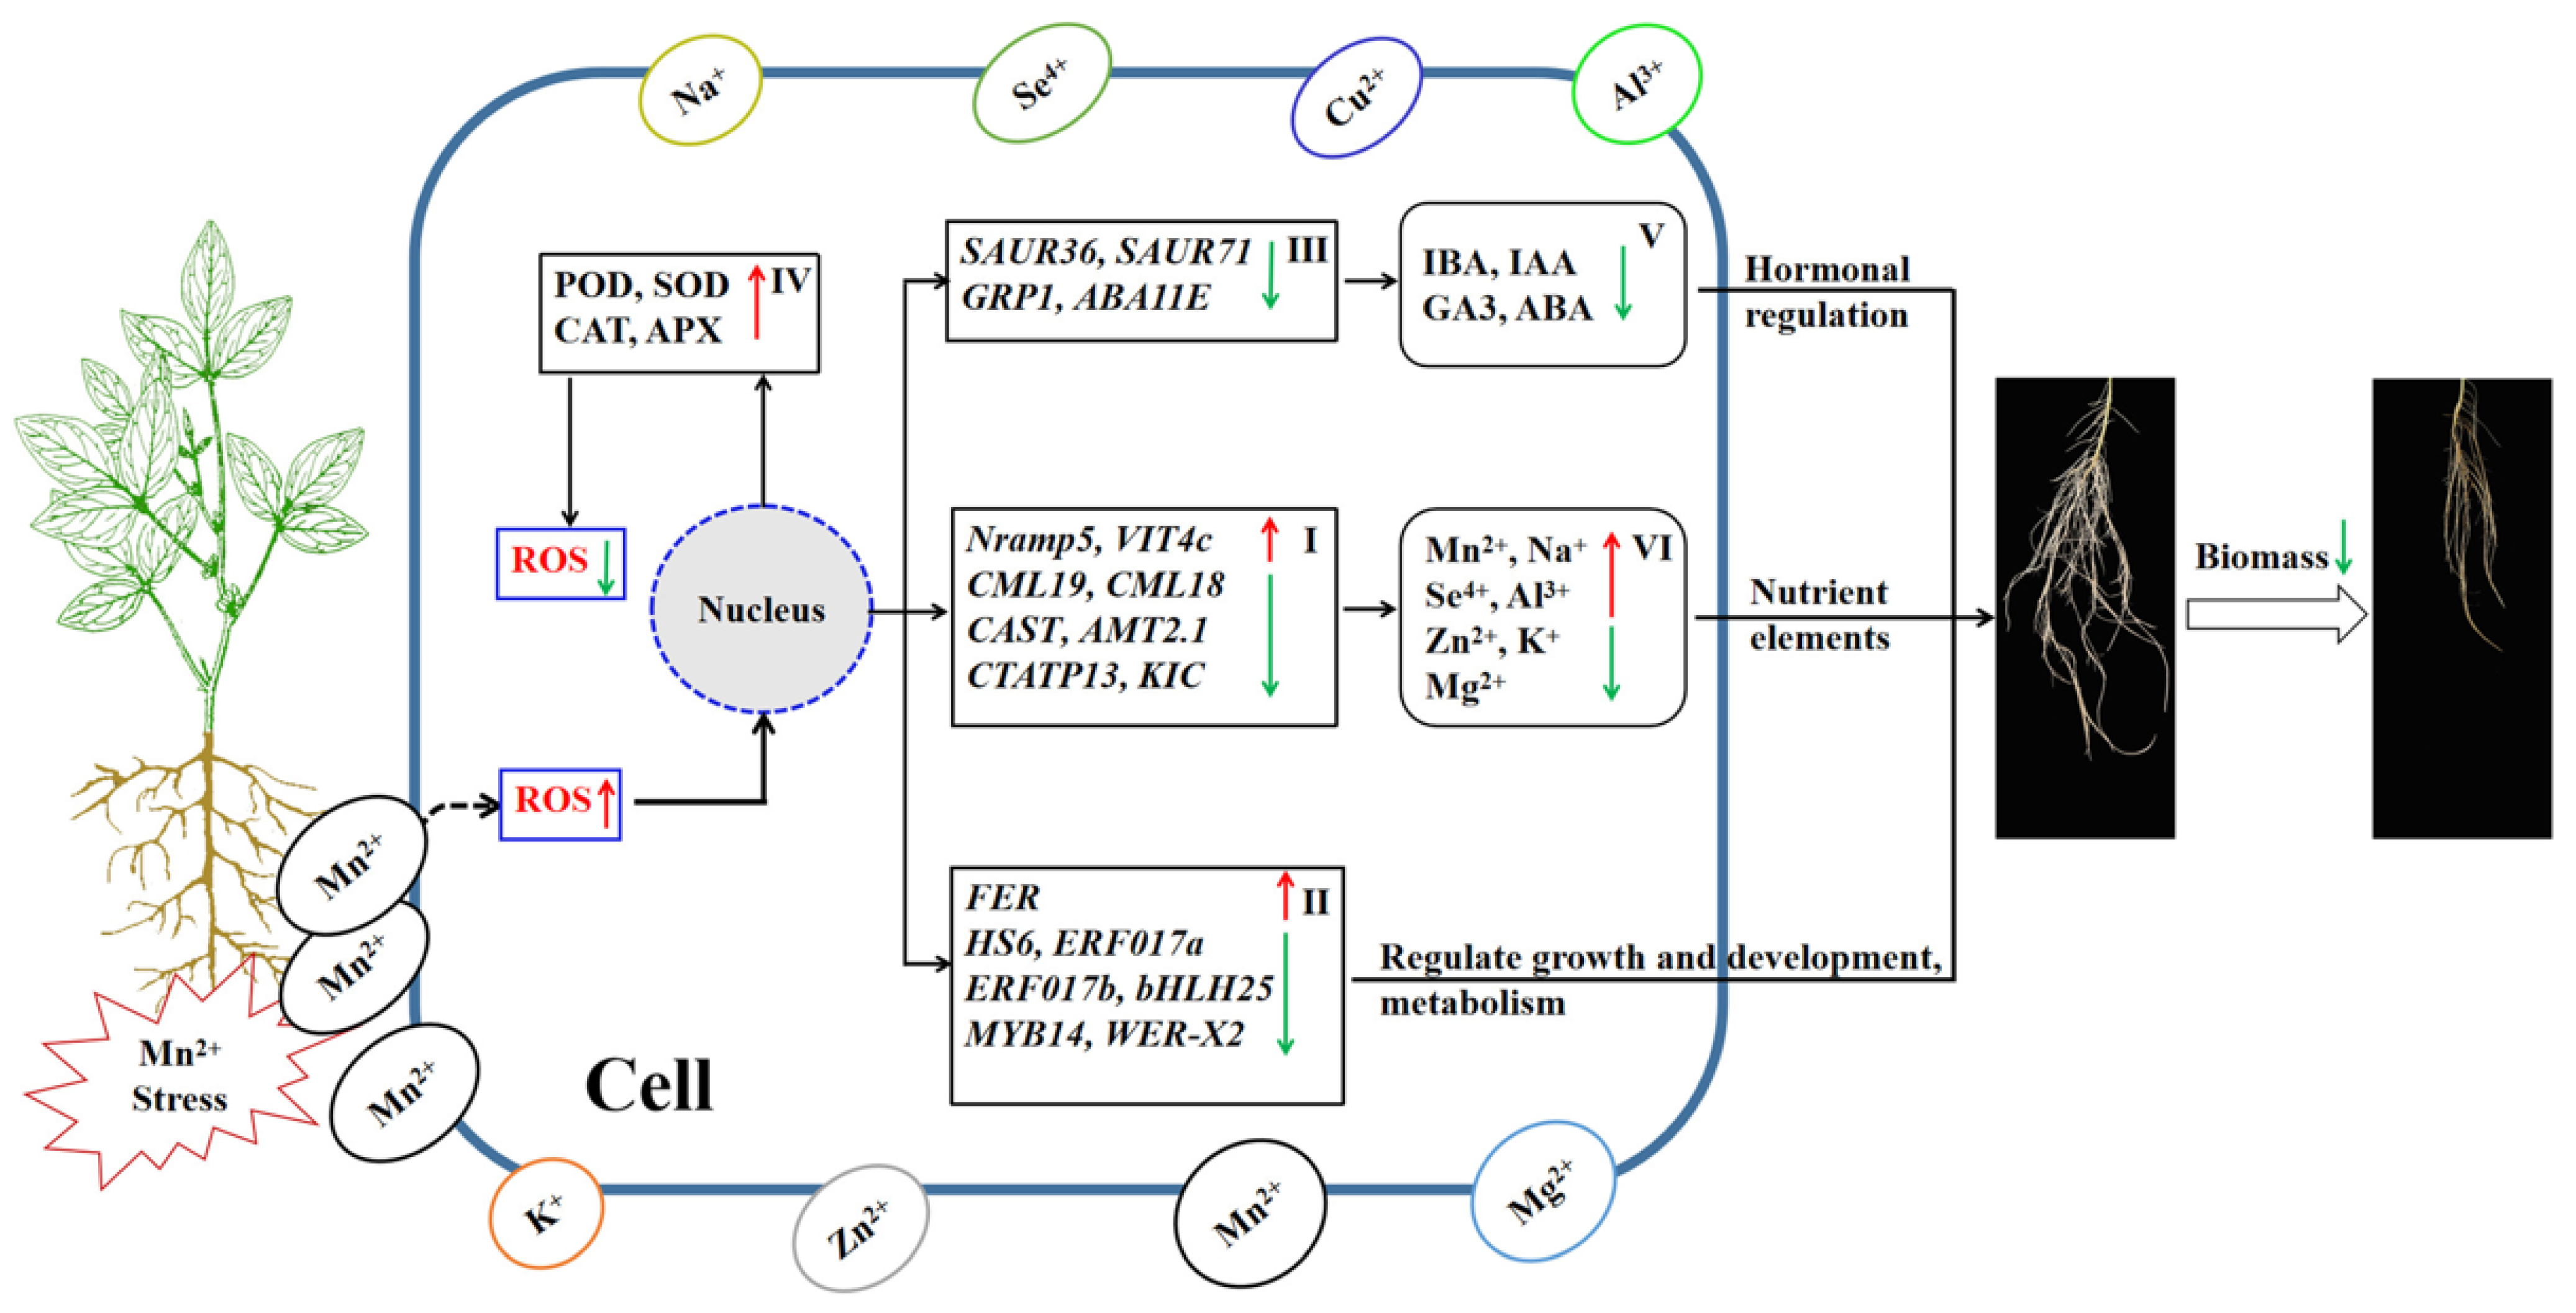
Table 1.
DEGs identified as hormones.
| Gene ID | log2FoldChange | Description |
|---|---|---|
| Glyma.08G010400 | −5.2353 | Auxin |
| Glyma.06G134000 | −1.161 | Auxin |
| Glyma.02G142600 | −1.5184 | Auxin |
| Glyma.03G029600 | −2.5301 | Auxin |
| Glyma.05G101300 | −1.482 | Auxin |
| Glyma.09G011200 | −1.34 | Auxin |
| Glyma.19G258800 | −1.1334 | Auxin |
| Glyma.17G046000 | −1.5222 | Auxin |
| Glyma.13G361200 | −1.6535 | Auxin |
| Glyma.07G268400 | −3.3847 | ABA |
| Glyma.09G014700 | −1.4534 | ABA |
| Glyma.08G208500 | 3.2515 | Gibberellin (GA3) |
| Glyma.12G216100 | −1.6498 | Gibberellin (GA3) |
| Glyma.13G259500 | 3.4365 | Gibberellin (GA3) |
| Glyma.19G133600 | 3.8827 | Gibberellin (GA3) |
| Glyma.16G200800 | 2.2778 | Gibberellin (GA3) |
| Glyma.19G022500 | 1.0633 | Gibberellin (GA3) |
| Glyma.12G137700 | −1.8625 | Gibberellin (GA3) |
| Glyma.09G149200 | 1.2522 | Gibberellin (GA3) |
| Glyma.02G010100 | −1.2806 | Gibberellin (GA3) |
| Glyma.13G285400 | −2.3356 | Gibberellin (GA3) |
| Glyma.16G145100 | −1.6728 | Salicylic acid (SA) |
Table 2.
DEGs identified as antioxidant enzymes.
| Gene ID | log2FoldChange | Description |
|---|---|---|
| Glyma.18G055500 | 2.7191 | Peroxidase |
| Glyma.03G038200 | −3.4 | Peroxidase |
| Glyma.20G169200 | −1.7151 | Peroxidase |
| Glyma.16G055900 | −1.0025 | Peroxidase |
| Glyma.20G001400 | −1.2568 | Peroxidase |
| Glyma.01G130800 | −2.0236 | Peroxidase |
| Glyma.03G038700 | −1.2567 | Peroxidase |
| Glyma.01G130500 | −1.0805 | Peroxidase |
| Glyma.10G191700 | −3.9194 | Peroxidase |
| Glyma.09G022800 | −1.6039 | Peroxidase |
| Glyma.09G284400 | −1.7185 | Peroxidase |
| Glyma.02G234200 | −1.9256 | Peroxidase |
| Glyma.17G198700 | 1.159 | Peroxidase |
| Glyma.14G104400 | −3.2773 | Peroxidase |
Table 3.
DEGs identified as ion transporters.
| Gene ID | log2FoldChange | Description |
|---|---|---|
| Glyma.09G122600 | 1.5918 | Metal tolerance protein |
| Glyma.18G168900 | 1.8991 | Sulfate transporter |
| Glyma.02G082500 | 1.301 | Vacuolar iron transporter |
| Glyma.08G076000 | 1.5034 | Vacuolar iron transporter |
| Glyma.08G075900 | 1.9643 | Vacuolar iron transporter |
| Glyma.05G121300 | 1.7505 | Vacuolar iron transporter |
| Glyma.11G083300 | 2.1146 | Vacuolar iron transporter |
| Glyma.09G031400 | 1.335 | Boron transporter |
| Glyma.05G153000 | 4.1071 | Magnesium transporter |
| Glyma.19G038600 | −1.4041 | Calcium-transporting ATPase |
| Glyma.07G153800 | −2.9733 | Ammonium transporter |
| Glyma.20G082450 | −1.0318 | Ammonium transporter |
| Glyma.19G199900 | 2.257 | Aluminum-activated malate transporter |
| Glyma.06G115800 | 2.2447 | Metal transporter Nramp5 |
| Glyma.06G074100 | 2.0172 | Molybdate transporter |
| Glyma.09G270900 | −2.1497 | Calcium-binding protein |
| Glyma.18G039500 | −1.2755 | Calcium-binding protein |
| Glyma.12G089800 | −1.6159 | Calcium-binding protein |
| Glyma.11G217200 | −1.4206 | Calcium-binding protein |
| Glyma.14G215800 | −1.1839 | Calcium-binding protein |
| Glyma.06G034700 | −1.2927 | Calcium-binding protein |
| Glyma.02G265900 | −1.4369 | Calcium-binding protein |
| Glyma.04G136600 | −2.9988 | Calcium-binding protein |
| Glyma.12G197900 | −1.8754 | Calcium-binding protein |
| Glyma.16G059300 | −1.6615 | Calcium-binding protein |
| Glyma.04G078400 | −1.0643 | Calcium-binding protein |
| Glyma.20G032500 | −2.3907 | Phosphate transporter |
Table 4.
DEGs identified as transcription factors.
| Gene ID | log2FoldChange | Description |
|---|---|---|
| Glyma.13G267700 | −1.103 | WRKY transcription factor |
| Glyma.13G267600 | −2.0811 | WRKY transcription factor |
| Glyma.13G267500 | −1.1482 | WRKY transcription factor |
| Glyma.06G307700 | −1.314 | WRKY transcription factor |
| Glyma.03G002300 | −1.7427 | WRKY transcription factor |
| Glyma.08G320200 | −1.167 | WRKY transcription factor |
| Glyma.17G222300 | −2.2559 | WRKY transcription factor |
| Glyma.07G262700 | −1.8103 | WRKY transcription factor |
| Glyma.06G142100 | −2.6582 | WRKY transcription factor |
| Glyma.04G238300 | −3.1185 | WRKY transcription factor |
| Glyma.03G256700 | −1.8202 | WRKY transcription factor |
| Glyma.10G230200 | −1.2325 | WRKY transcription factor |
| Glyma.13G117600 | −1.4937 | WRKY transcription factor |
| Glyma.19G254800 | −2.9872 | WRKY transcription factor |
| Glyma.09G240000 | −1.3167 | WRKY transcription factor |
| Glyma.18G208800 | −1.1169 | WRKY transcription factor |
| Glyma.14G103100 | −2.5033 | WRKY transcription factor |
| Glyma.13G370100 | −2.2557 | WRKY transcription factor |
| Glyma.08G021900 | −2.9632 | WRKY transcription factor |
| Glyma.06G147100 | −1.0236 | WRKY transcription factor |
| Glyma.01G128100 | −2.4649 | WRKY transcription factor |
| Glyma.05G215900 | −2.6836 | WRKY transcription factor |
| Glyma.03G042700 | −2.4868 | WRKY transcription factor |
| Glyma.01G224800 | −2.7566 | WRKY transcription factor |
| Glyma.09G005700 | −1.0228 | WRKY transcription factor |
| Glyma.15G110300 | −1.0264 | WRKY transcription factor |
| Glyma.05G211900 | −1.2824 | WRKY transcription factor |
| Glyma.18G213200 | −1.7942 | WRKY transcription factor |
| Glyma.09G274000 | −1.832 | WRKY transcription factor |
| Glyma.06G142000 | −1.1276 | WRKY transcription factor |
| Glyma.16G026400 | −2.4819 | WRKY transcription factor |
| Glyma.06G125600 | −2.3697 | WRKY transcription factor |
| Glyma.17G224800 | −3.7504 | WRKY transcription factor |
| Glyma.07G057400 | −2.1102 | WRKY transcription factor |
| Glyma.18G238200 | −1.0434 | WRKY transcription factor |
| Glyma.04G223300 | −1.5064 | WRKY transcription factor |
| Glyma.06G061900 | −2.2066 | WRKY transcription factor |
| Glyma.11G043700 | −3.1903 | bHLH transcription factor |
| Glyma.15G170500 | −1.3616 | bHLH transcription factor |
| Glyma.04G090100 | 1.9891 | bHLH transcription factor |
| Glyma.02G025500 | 1.0493 | bHLH transcription factor |
| Glyma.13G098000 | 1.8284 | bHLH transcription factor |
| Glyma.09G064200 | −1.4571 | bHLH transcription factor |
| Glyma.01G197900 | −2.2723 | bHLH transcription factor |
| Glyma.07G185300 | 1.4333 | bHLH transcription factor |
| Glyma.19G222000 | 1.1226 | bHLH transcription factor |
| Glyma.18G039200 | 2.2407 | bHLH transcription factor |
| Glyma.10G010400 | −4.0787 | MYB transcription factor |
| Glyma.06G300000 | −2.5385 | MYB transcription factor |
| Glyma.05G234600 | −1.7641 | MYB transcription factor |
| Glyma.10G180800 | −1.3551 | MYB transcription factor |
| Glyma.12G104600 | −2.8527 | MYB transcription factor |
| Glyma.06G300200 | −3.1265 | MYB transcription factor |
| Glyma.19G218800 | −2.8762 | MYB transcription factor |
| Glyma.07G178500 | −1.0826 | MYB transcription factor |
| Glyma.20G209700 | −1.3008 | MYB transcription factor |
| Glyma.02G005600 | −1.2669 | MYB transcription factor |
| Glyma.03G221700 | −2.3185 | MYB transcription factor |
| Glyma.01G016600 | −1.0816 | MYB transcription factor |
| Glyma.13G228900 | −1.0593 | MYB transcription factor |
| Glyma.15G259400 | 1.1537 | MYB transcription factor |
| Glyma.06G178600 | −1.8058 | MYB transcription factor |
| Glyma.06G300400 | −3.4385 | MYB transcription factor |
| Glyma.01G224900 | −1.4078 | MYB transcription factor/CPC transcription factor |
| Glyma.19G104201 | −1.8765 | Ethylene-responsive transcription factor |
| Glyma.02G067600 | 2.3504 | Ethylene-responsive transcription factor |
| Glyma.13G227066 | −1.5663 | Ethylene-responsive transcription factor |
| Glyma.17G047300 | −3.9674 | Ethylene-responsive transcription factor |
| Glyma.10G016500 | −1.1183 | Ethylene-responsive transcription factor |
| Glyma.07G212400 | −3.0852 | Ethylene-responsive transcription factor |
| Glyma.14G020100 | −1.1127 | Ethylene-responsive transcription factor |
| Glyma.13G112400 | −3.563 | Ethylene-responsive transcription factor |
| Glyma.02G132500 | −3.2647 | Ethylene-responsive transcription factor |
| Glyma.16G047600 | −1.6488 | Ethylene-responsive transcription factor |
| Glyma.13G122766 | −4.1664 | Ethylene-responsive transcription factor |
| Glyma.13G088100 | −1.0779 | Ethylene-responsive transcription factor |
| Glyma.11G014200 | 1.1517 | Ethylene-responsive transcription factor |
| Glyma.19G026000 | −1.8527 | Ethylene-responsive transcription factor |
| Glyma.10G119100 | 1.2716 | Ethylene-responsive transcription factor |
| Glyma.15G077100 | −2.0076 | Ethylene-responsive transcription factor |
| Glyma.11G068700 | 1.4964 | GATA transcription factor |
| Glyma.04G008900 | −1.0814 | GATA transcription factor |
| Glyma.03G135800 | −1.9691 | Heat stress transcription factor |
| Glyma.19G137800 | −1.1508 | Heat stress transcription factor |
| Glyma.19G132500 | 1.5119 | ORG transcription factor |
| Glyma.06G114000 | −1.0913 | NAC transcription factor |
| Glyma.05G195000 | −1.1467 | NAC transcription factor |
| Glyma.12G178500 | 2.7368 | Iron deficiency induces transcription factors |
| Glyma.06G090900 | −2.3686 | TGA transcription factor |
| Glyma.17G093600 | 1.1858 | E2FE transcription factor |
| Glyma.12G104800 | −2.7972 | WER transcription factor |
| Glyma.08G169451 | −1.949 | JUNGBRUNNEN transcription factor |
| Glyma.17G231900 | −1.6796 | RAX transcription factor |
| Glyma.07G126900 | 2.8666 | RAX transcription factor |
Disclaimer/Publisher’s Note: The statements, opinions and data contained in all publications are solely those of the individual author(s) and contributor(s) and not of MDPI and/or the editor(s). MDPI and/or the editor(s) disclaim responsibility for any injury to people or property resulting from any ideas, methods, instructions or products referred to in the content. |
© 2023 by the authors. Licensee MDPI, Basel, Switzerland. This article is an open access article distributed under the terms and conditions of the Creative Commons Attribution (CC BY) license (https://creativecommons.org/licenses/by/4.0/).
Share and Cite
MDPI and ACS Style
Liu, Y.; Pan, Y.; Li, J.; Chen, J.; Yang, S.; Zhao, M.; Xue, Y. Transcriptome Sequencing Analysis of Root in Soybean Responding to Mn Poisoning. Int. J. Mol. Sci. 2023, 24, 12727. https://doi.org/10.3390/ijms241612727
AMA Style
Liu Y, Pan Y, Li J, Chen J, Yang S, Zhao M, Xue Y. Transcriptome Sequencing Analysis of Root in Soybean Responding to Mn Poisoning. International Journal of Molecular Sciences. 2023; 24(16):12727. https://doi.org/10.3390/ijms241612727
Chicago/Turabian StyleLiu, Ying, Yuhu Pan, Jianyu Li, Jingye Chen, Shaoxia Yang, Min Zhao, and Yingbin Xue. 2023. "Transcriptome Sequencing Analysis of Root in Soybean Responding to Mn Poisoning" International Journal of Molecular Sciences 24, no. 16: 12727. https://doi.org/10.3390/ijms241612727
Note that from the first issue of 2016, this journal uses article numbers instead of page numbers. See further details here.