
Salivary Oxytocin and Antioxidative Response to Robotic Touch in Adults with Autism Spectrum Disorder
 , ,
, ,
Abstract
:
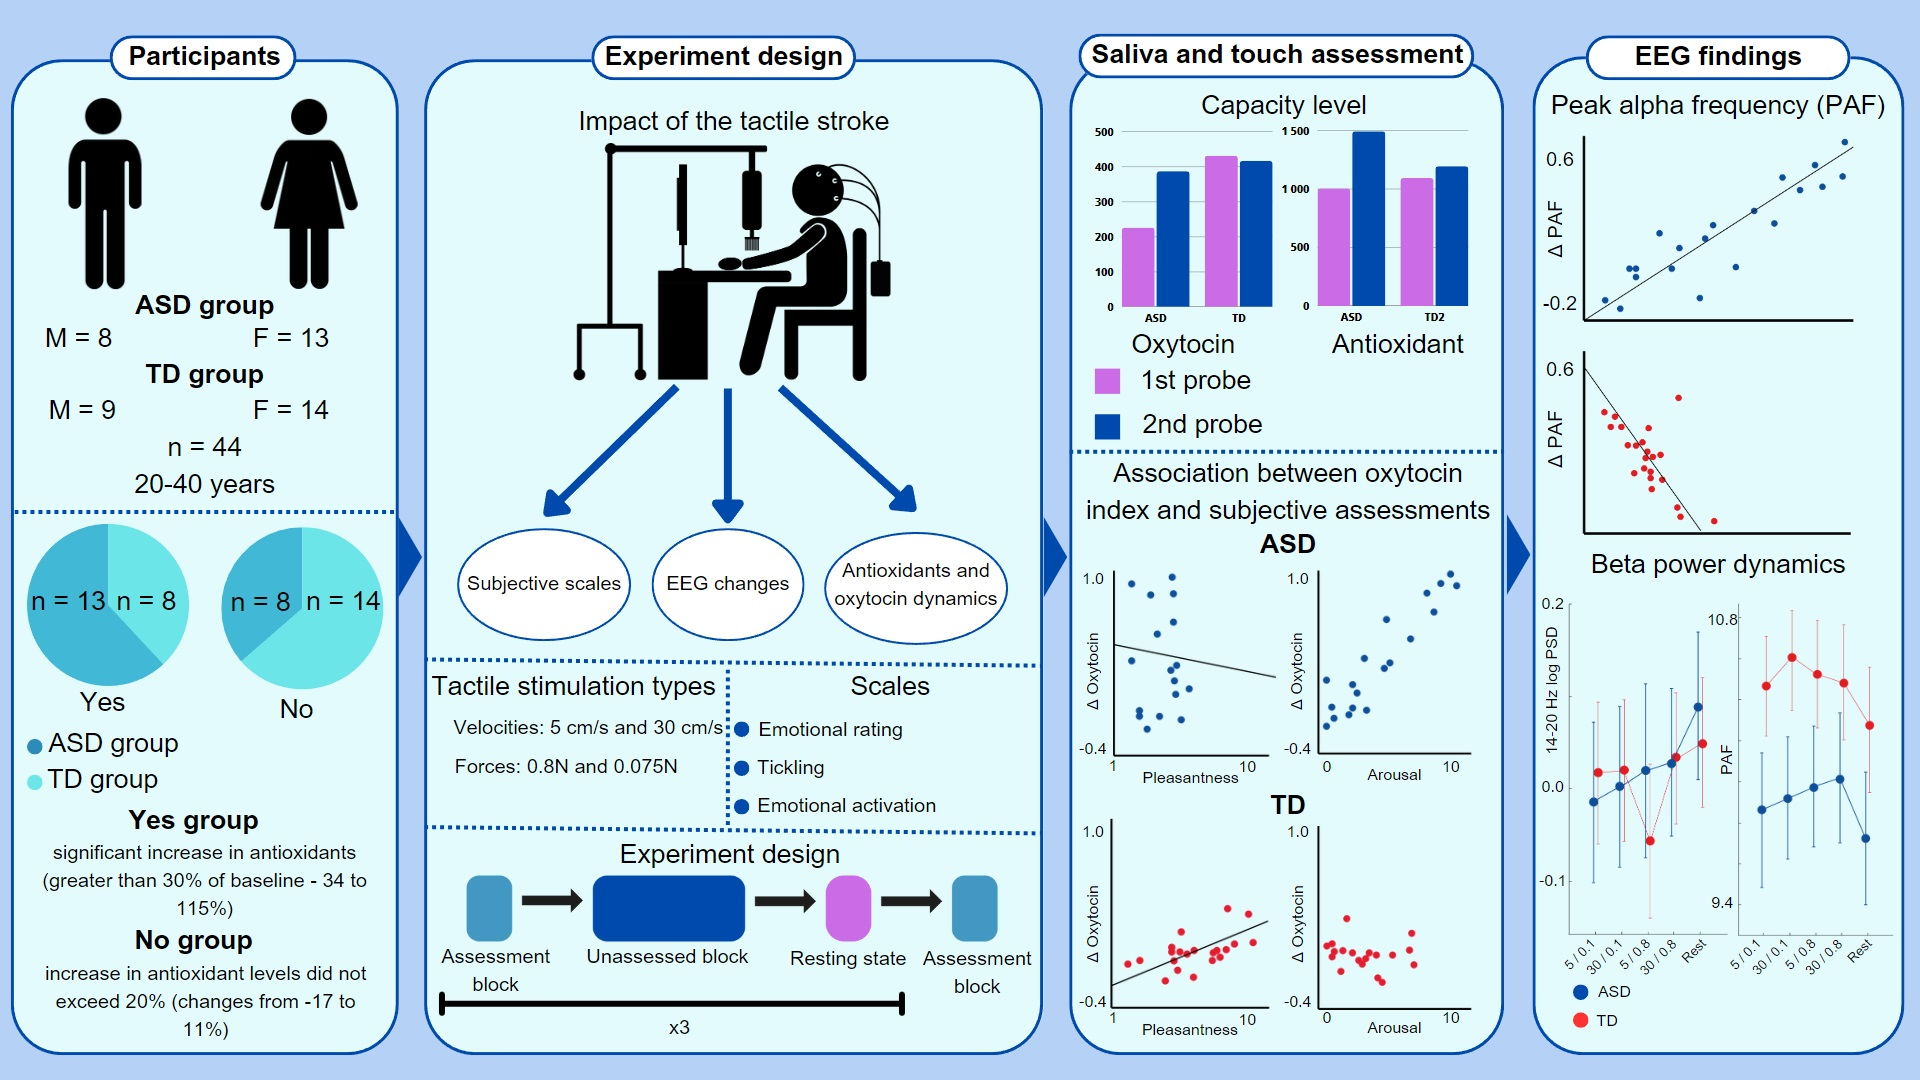
1. Introduction
2. Results
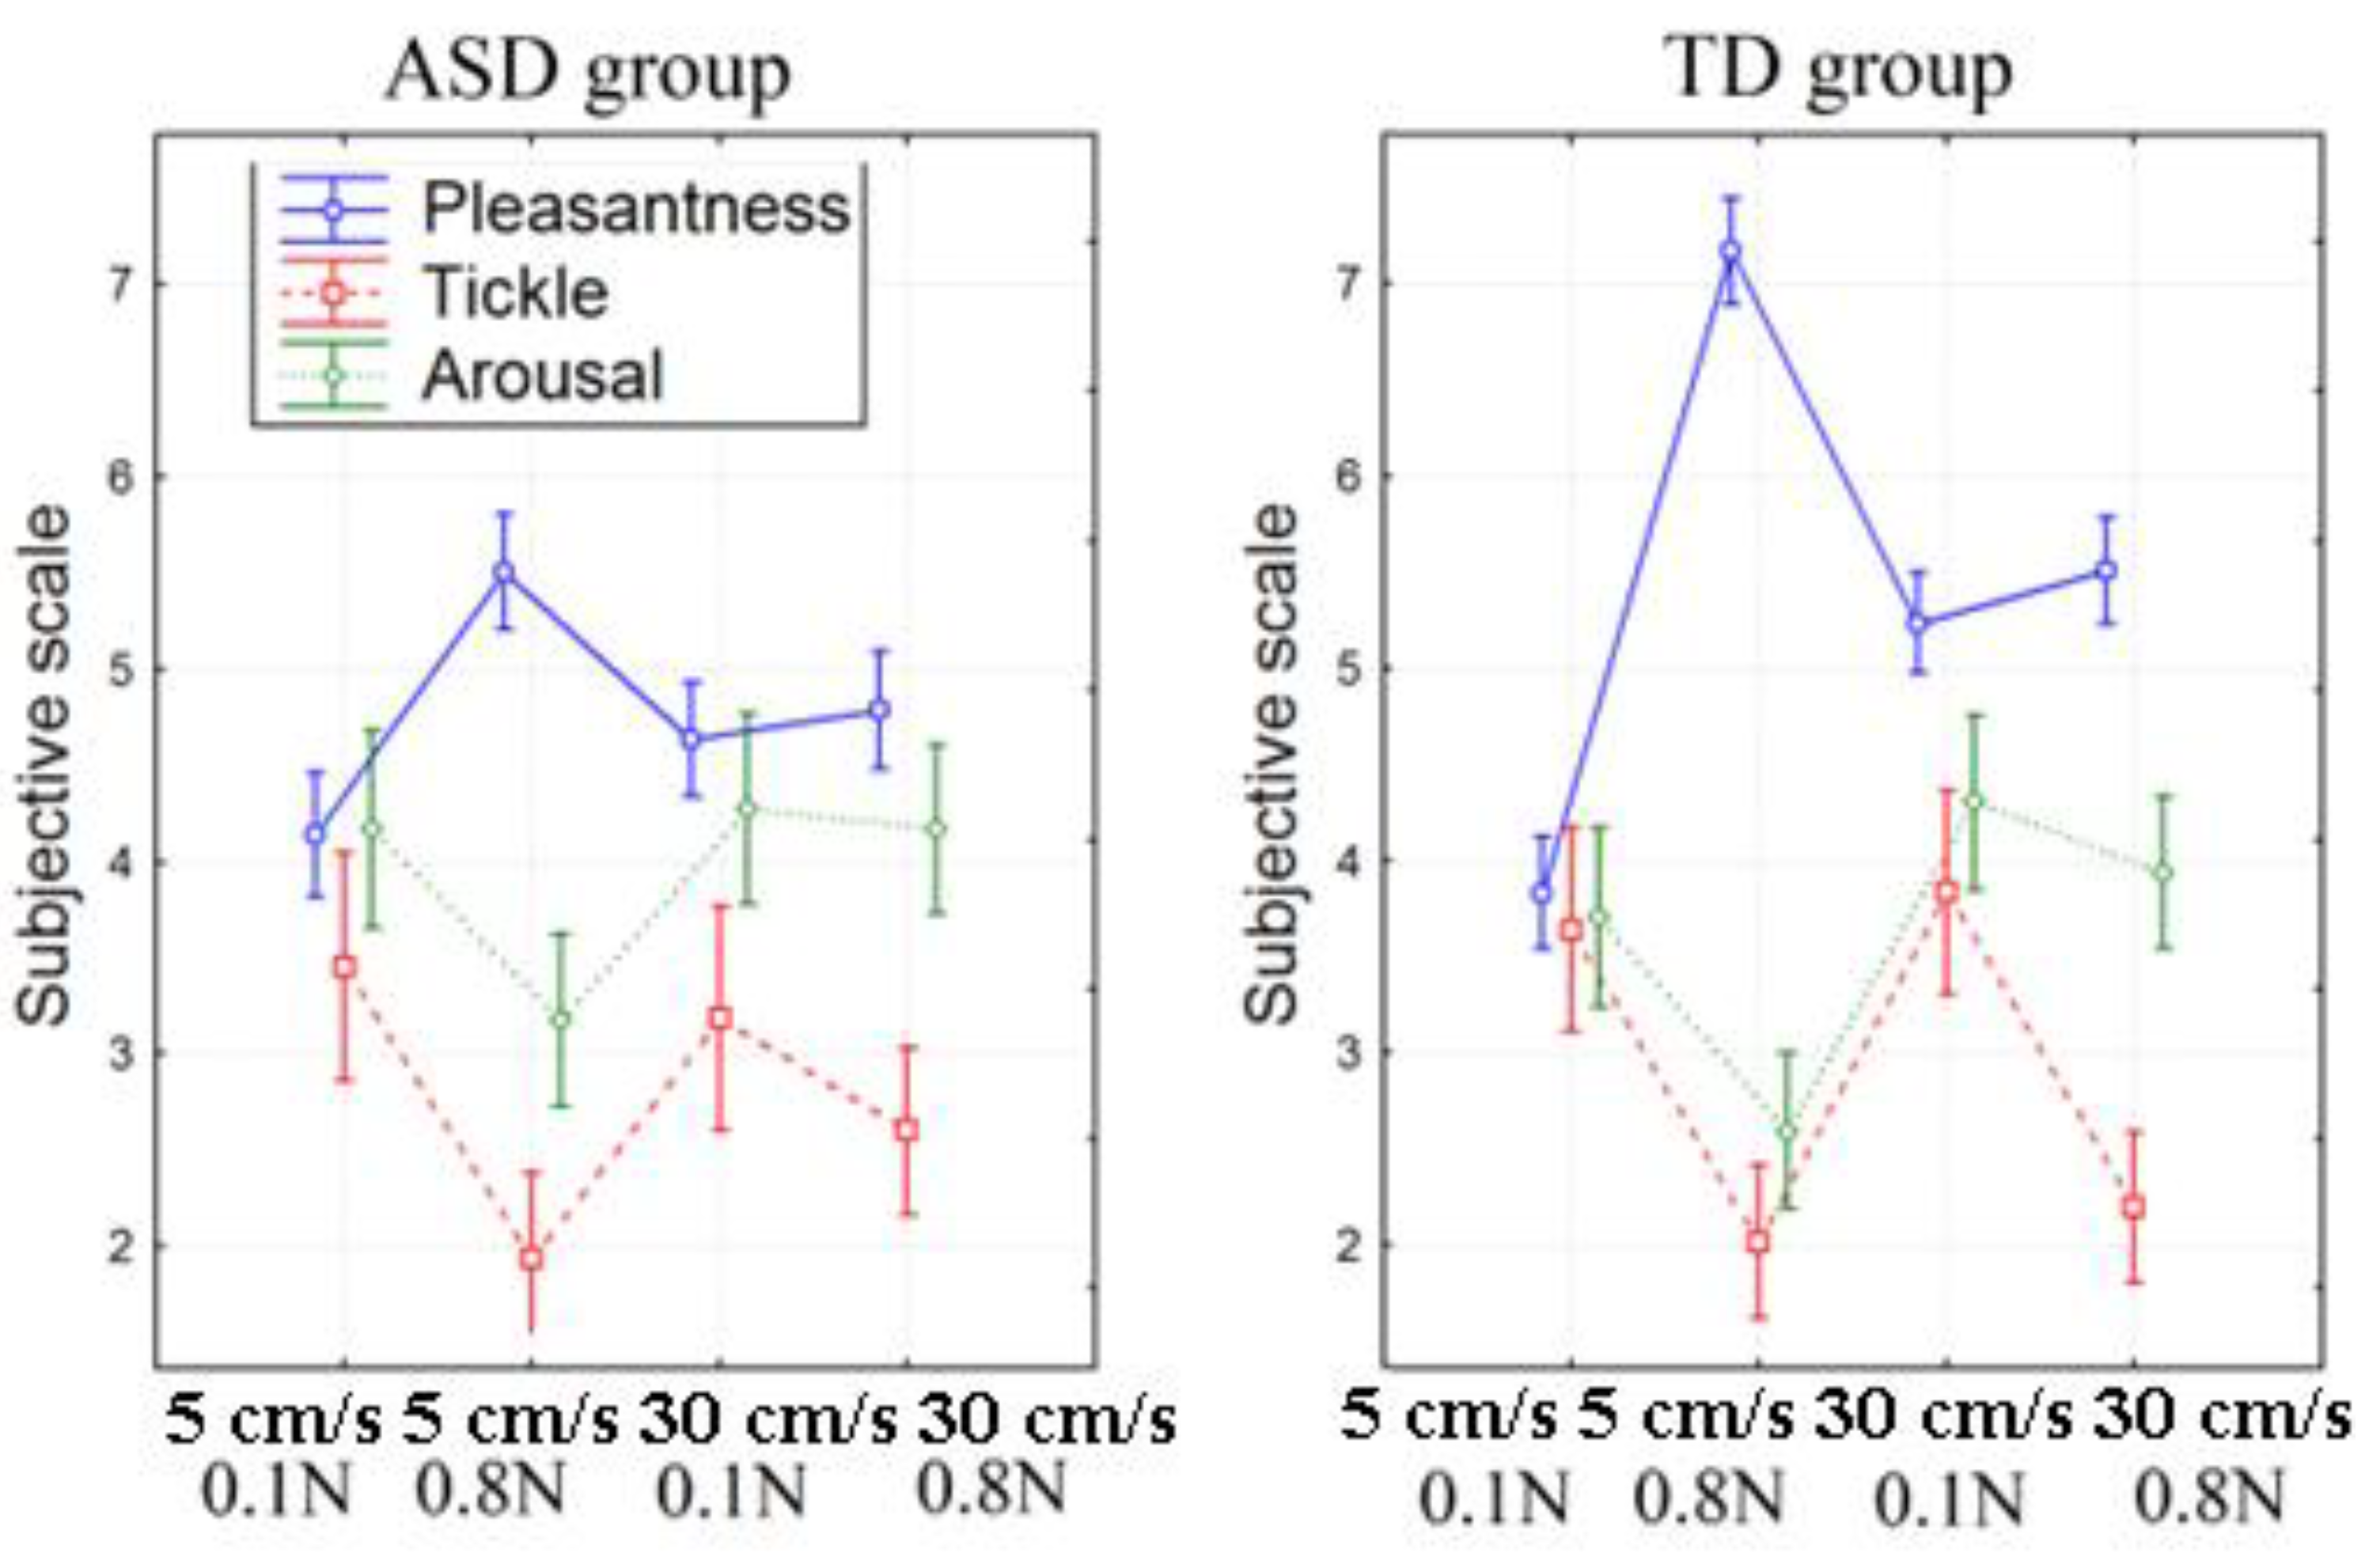
2.1. Subjective Assessment of Stimuli
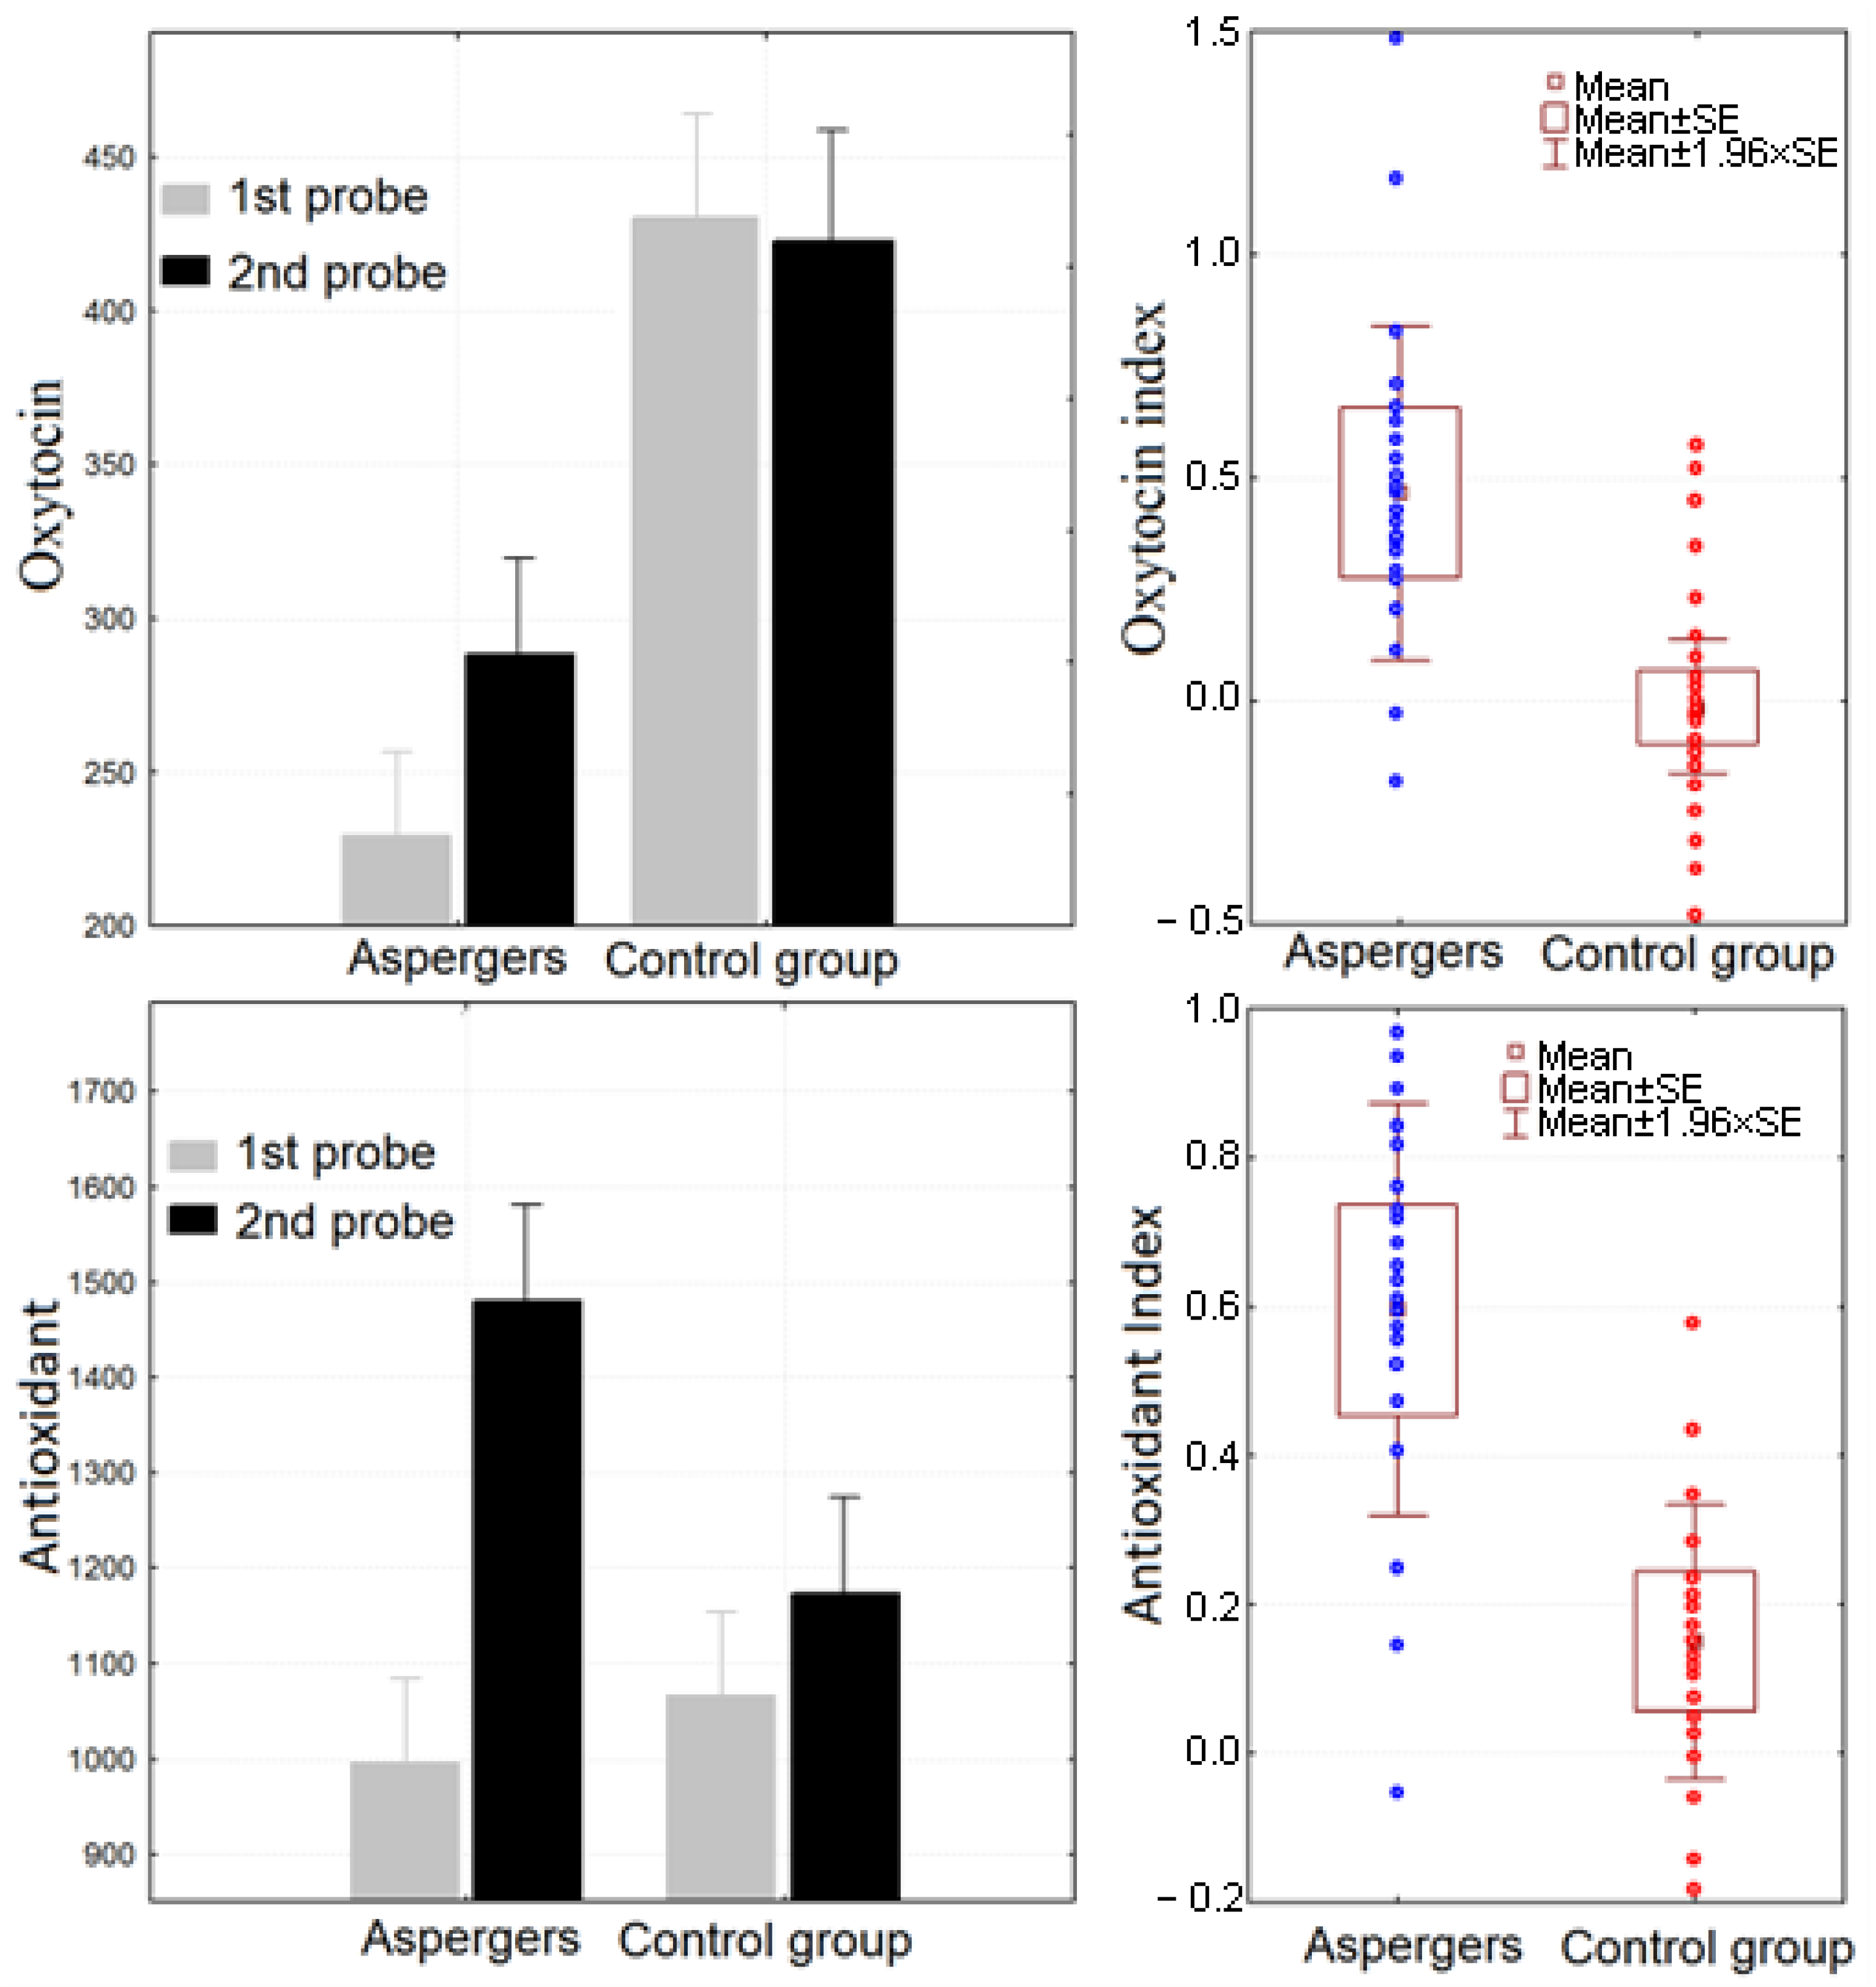
2.2. Salivary Oxytocin and Antioxidant Levels
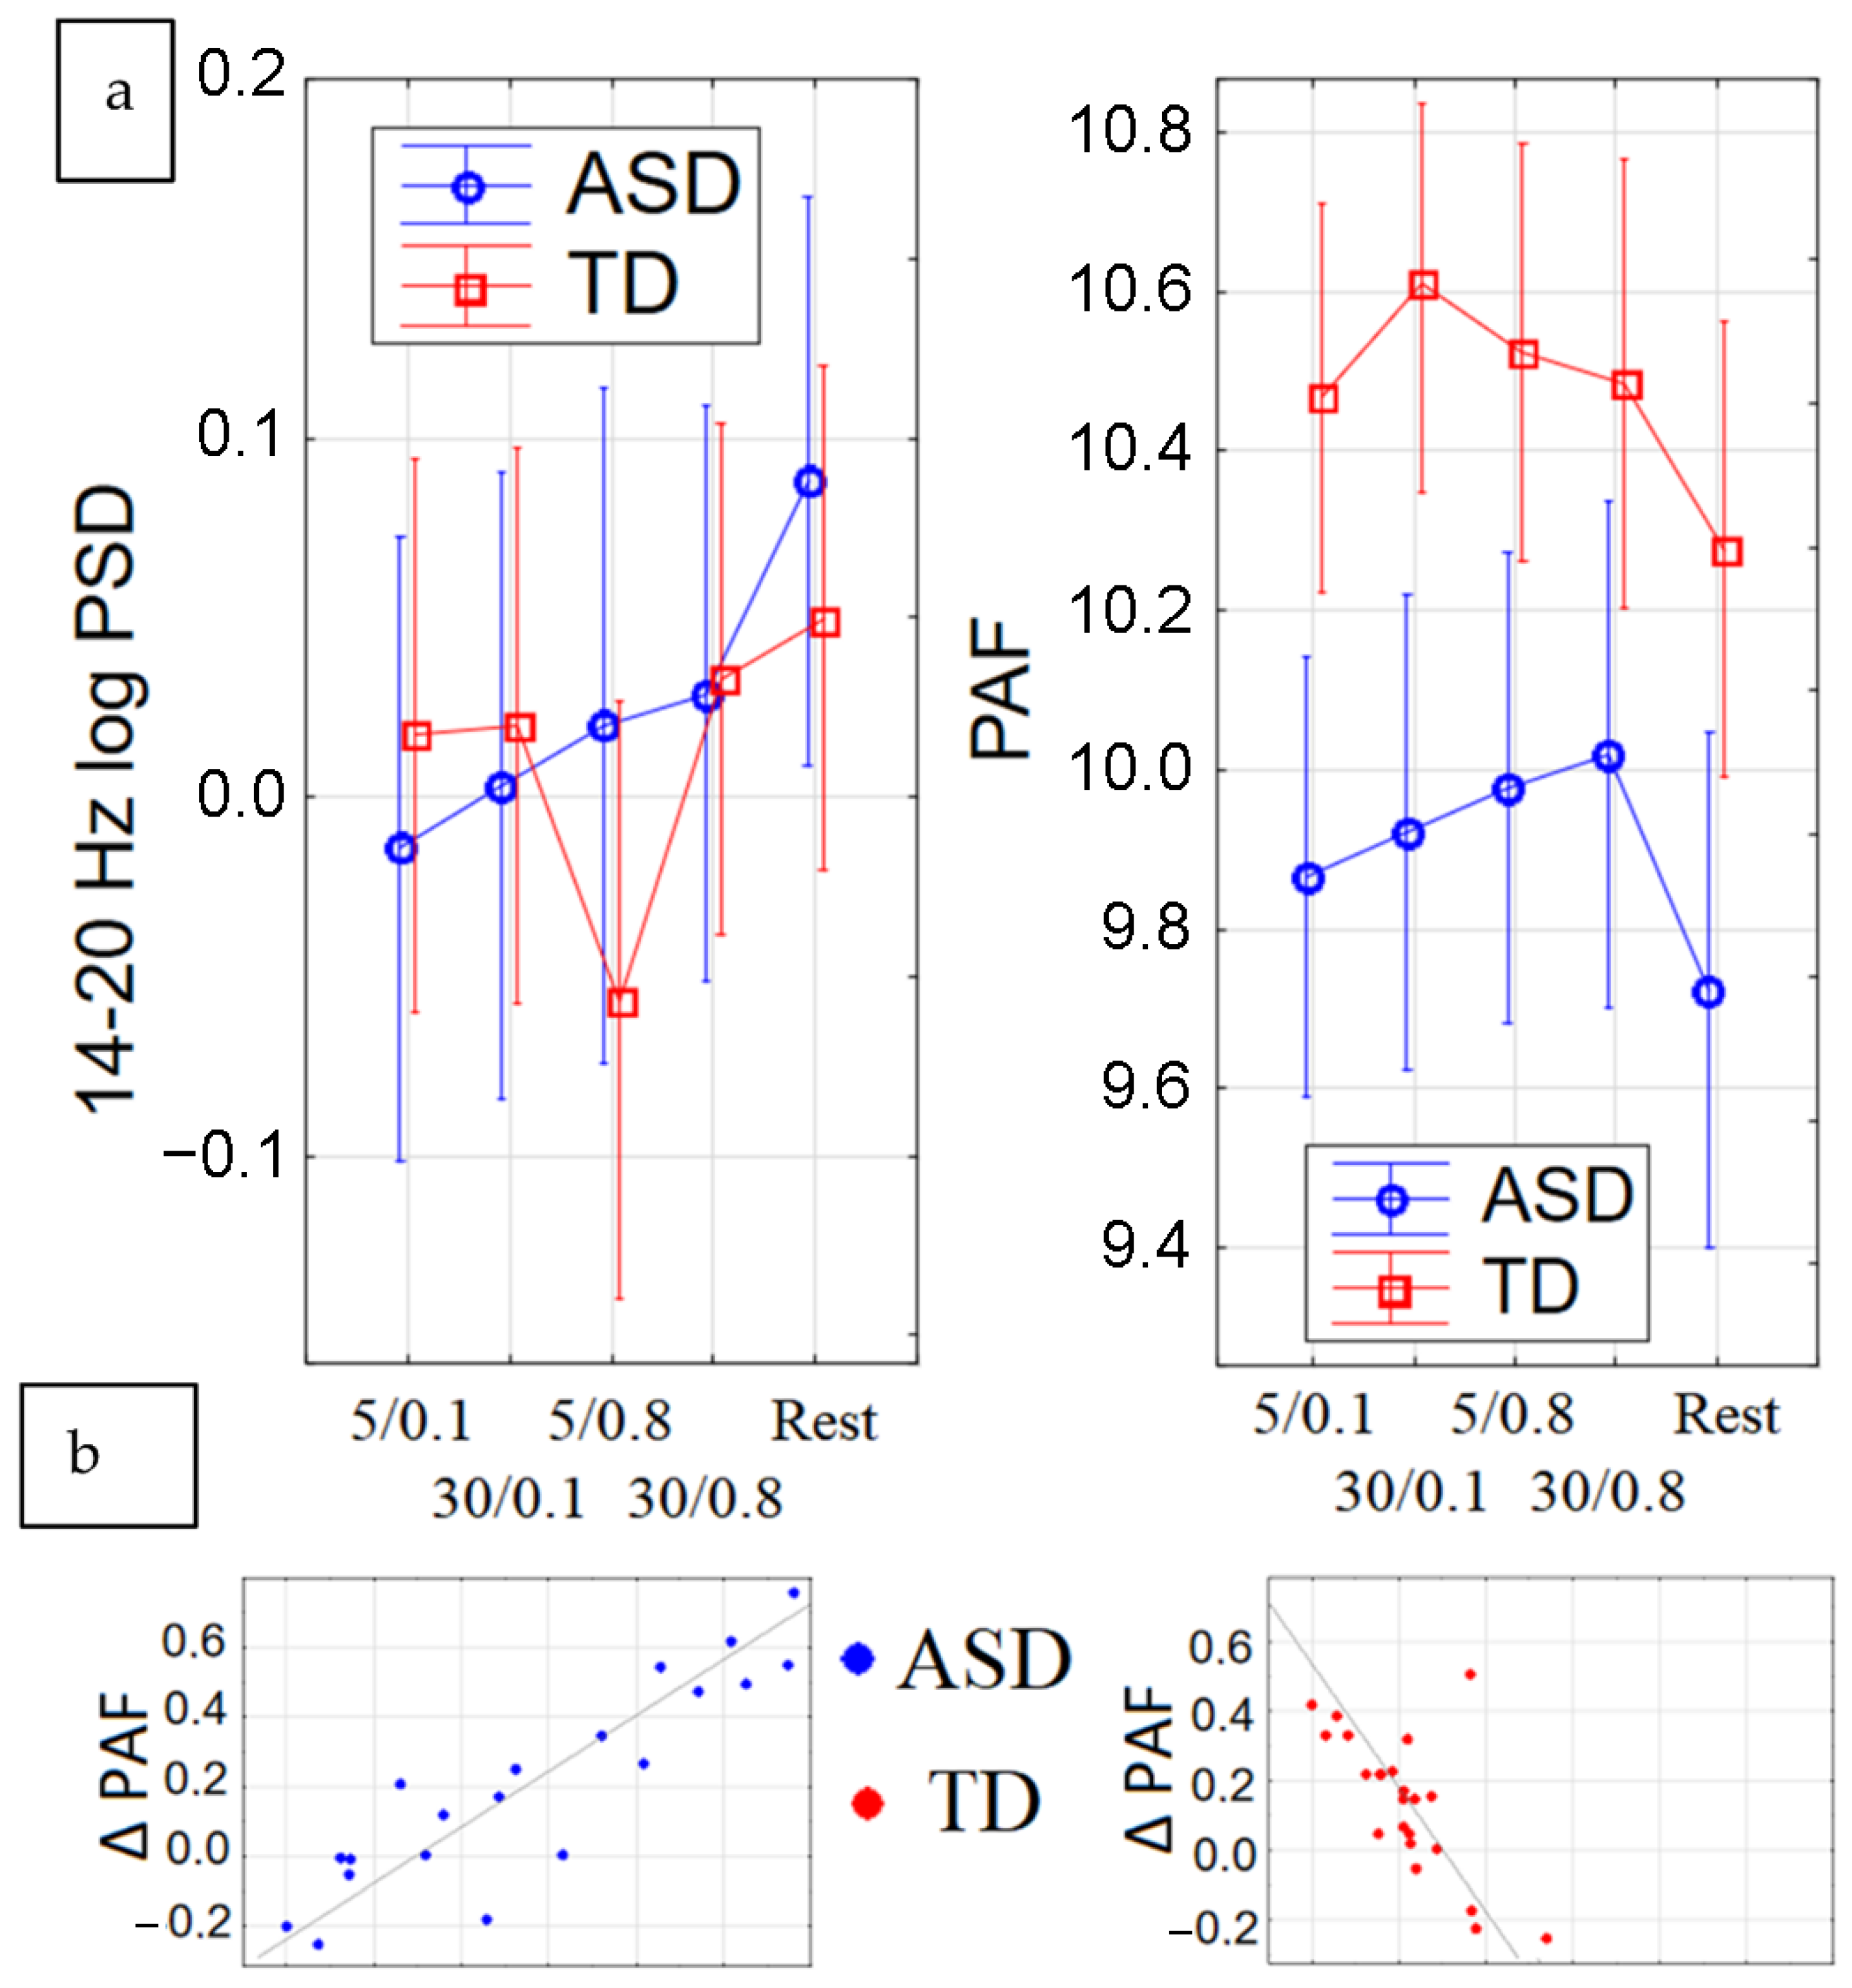
2.3. Electroencephalographic Findings
2.3.1. Peak Alpha Frequency (PAF)
2.3.2. Beta Power
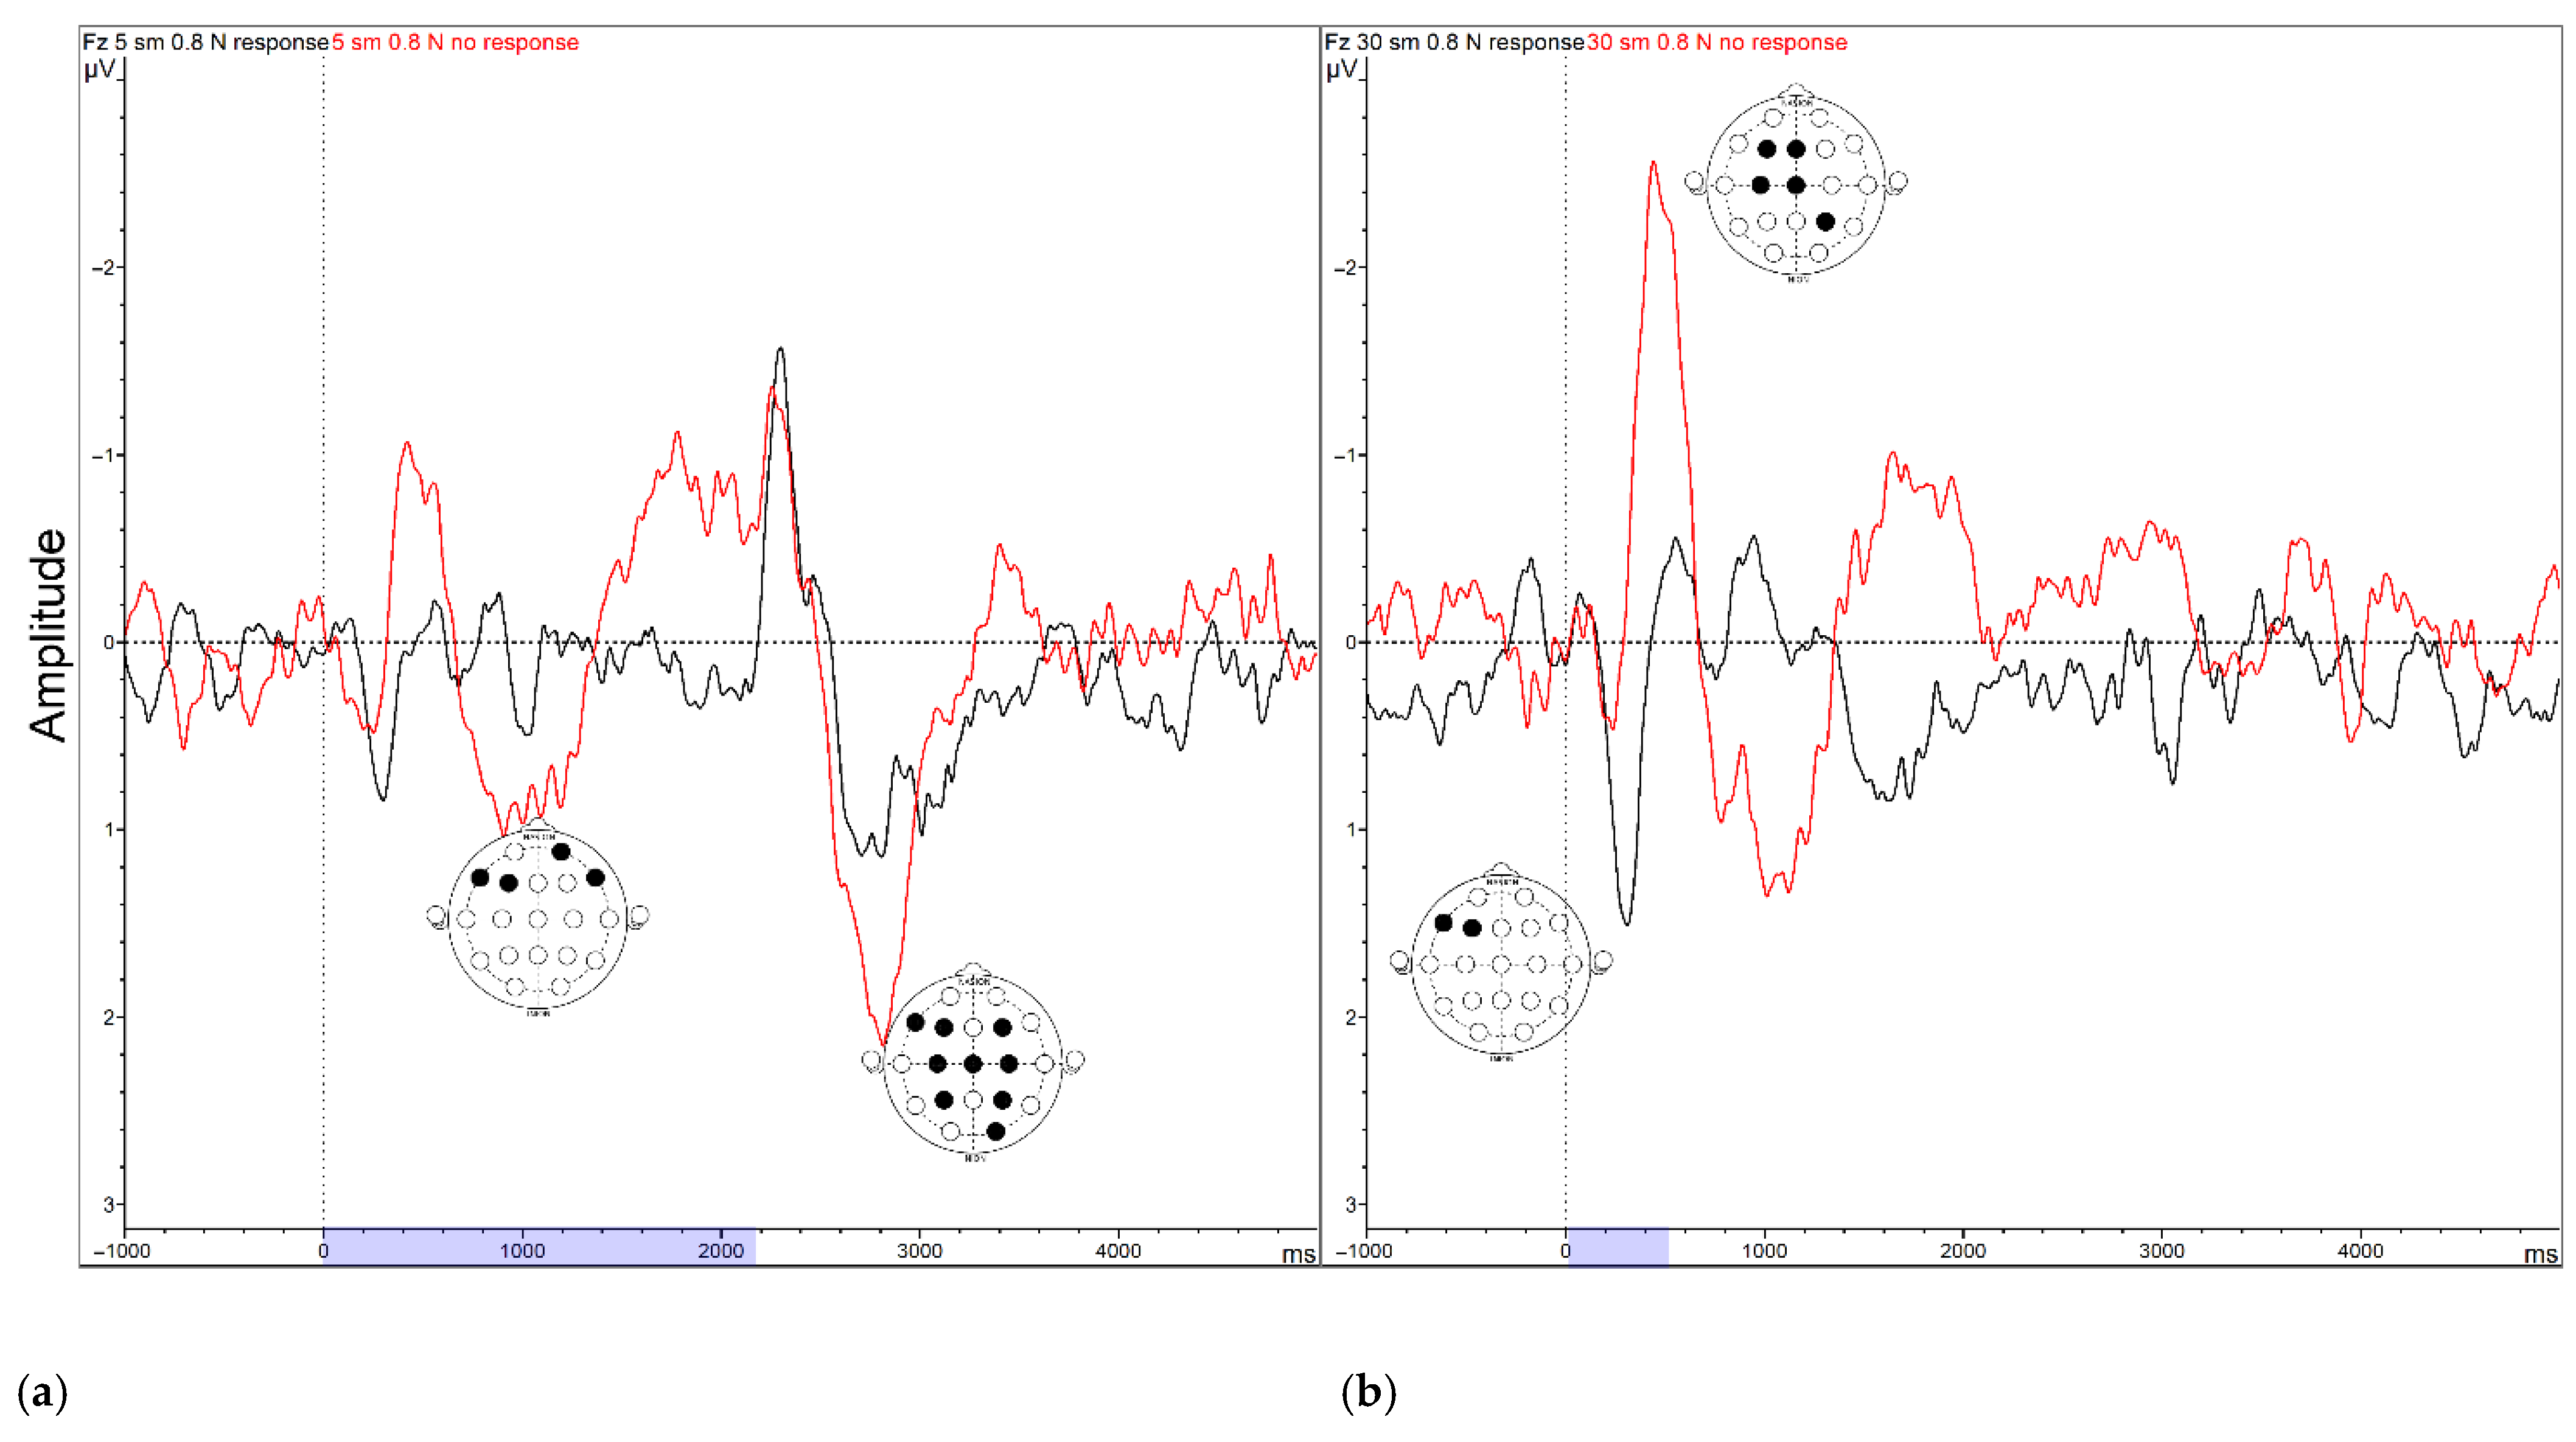
2.3.3. Event-Related Potentials (ERPs)
2.3.4. Resting-State EEG Dynamics
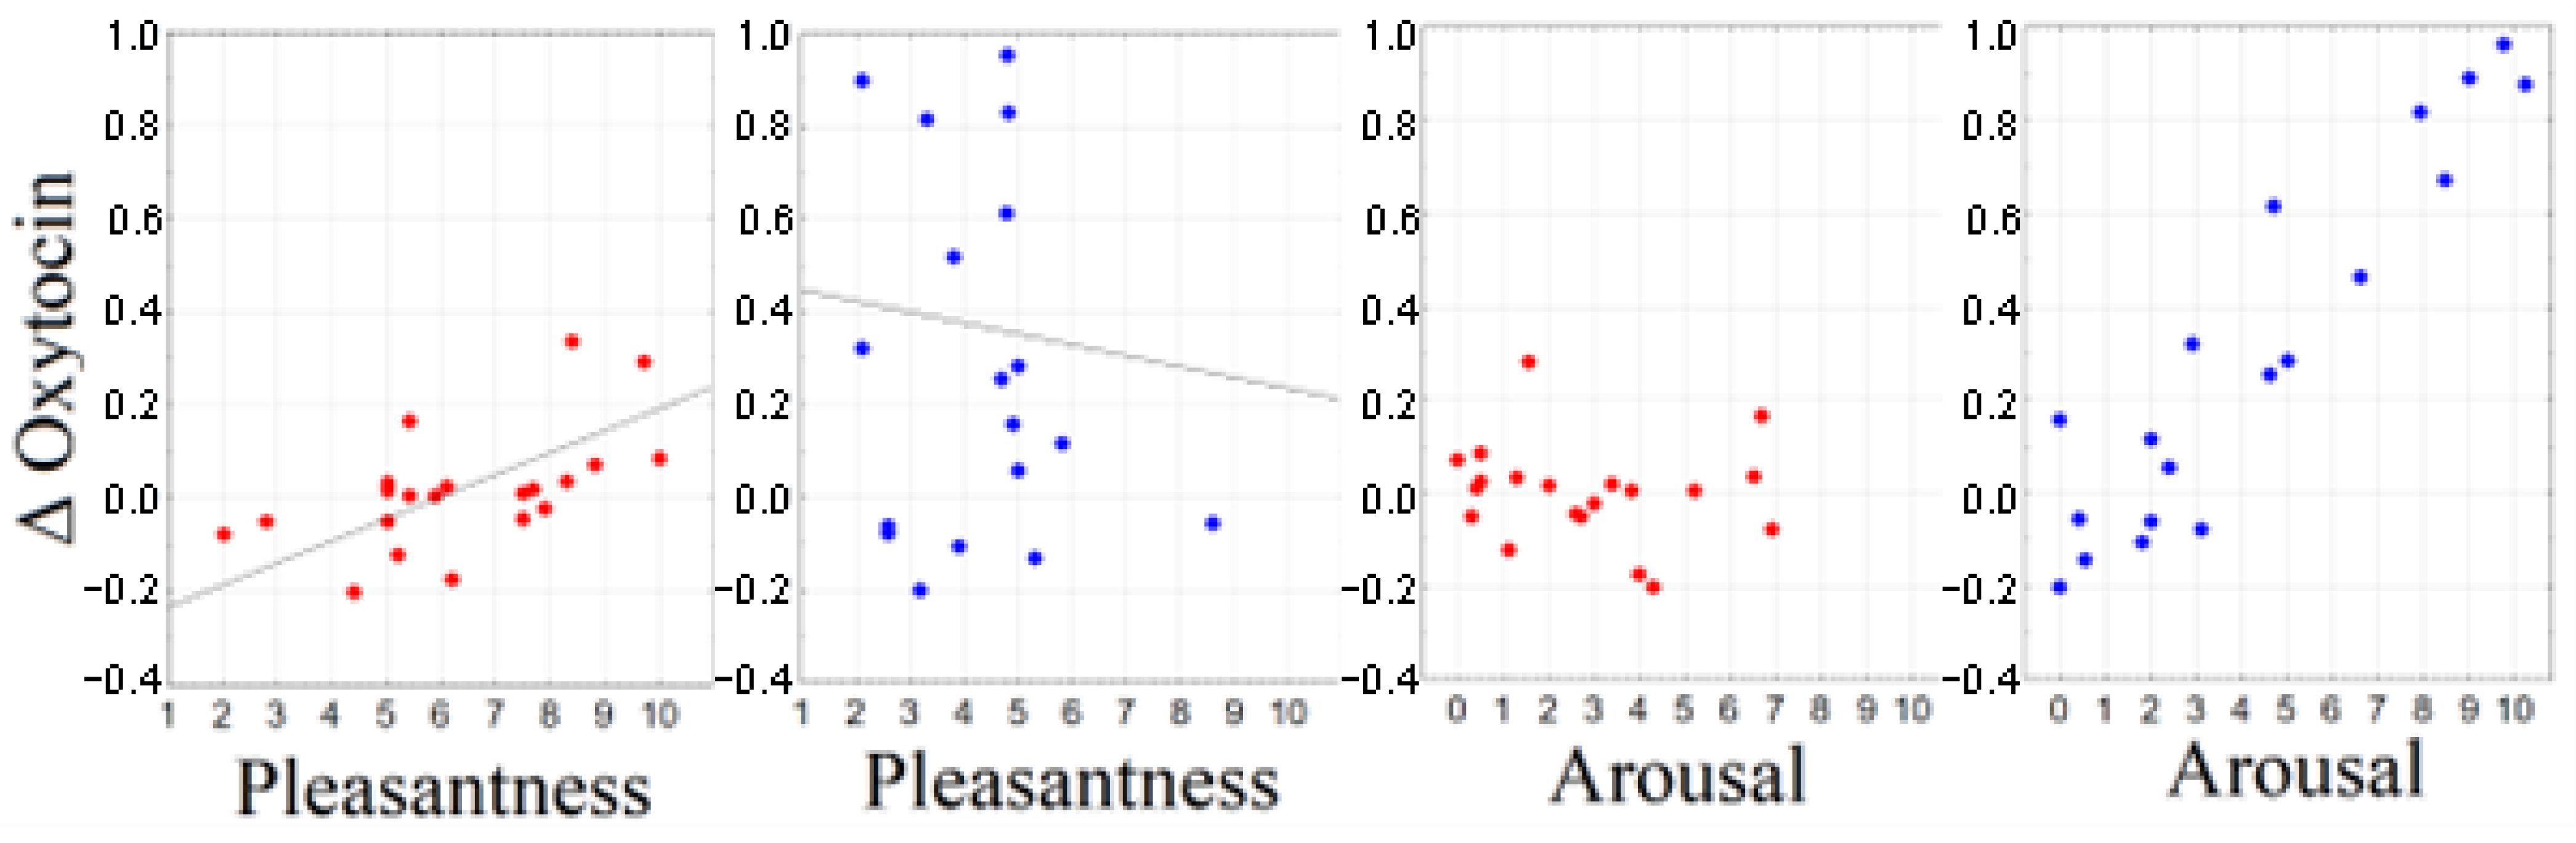
2.4. Correlation between Subjective Ratings and Biochemical Response
2.5. Correlation between Electrophysiological and Biochemical Response
3. Discussion
4. Materials and Methods
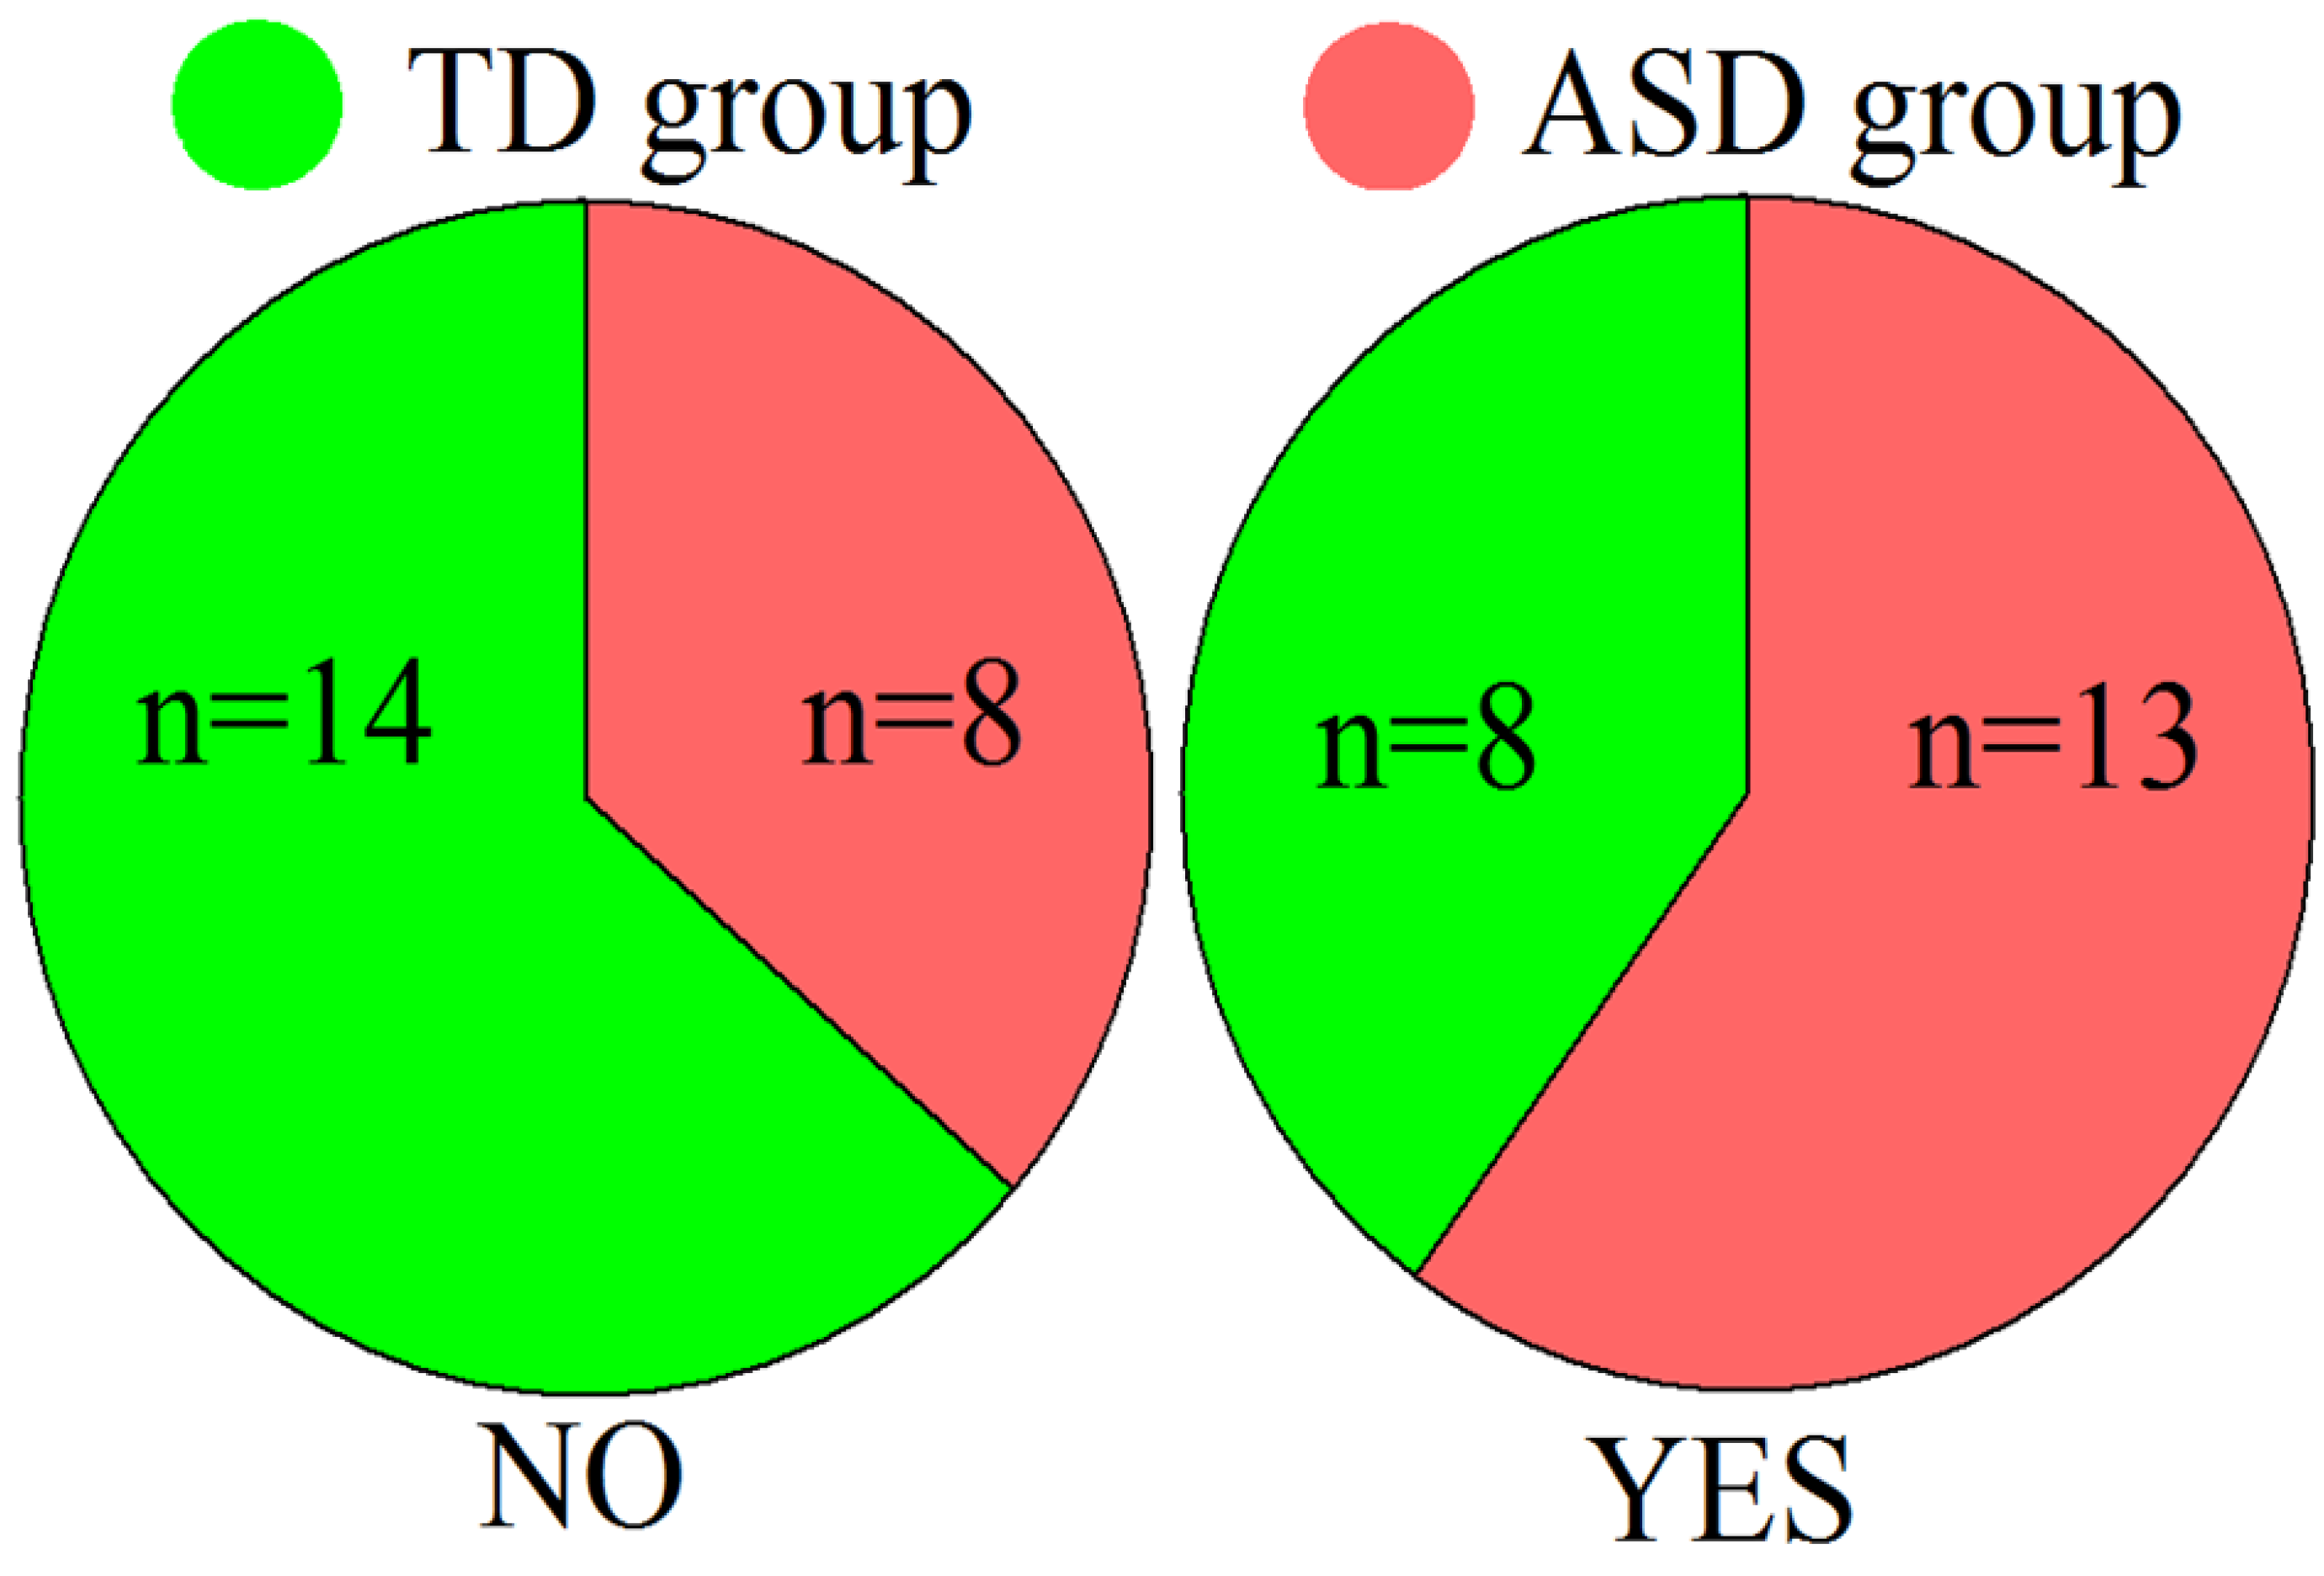
4.1. Participants
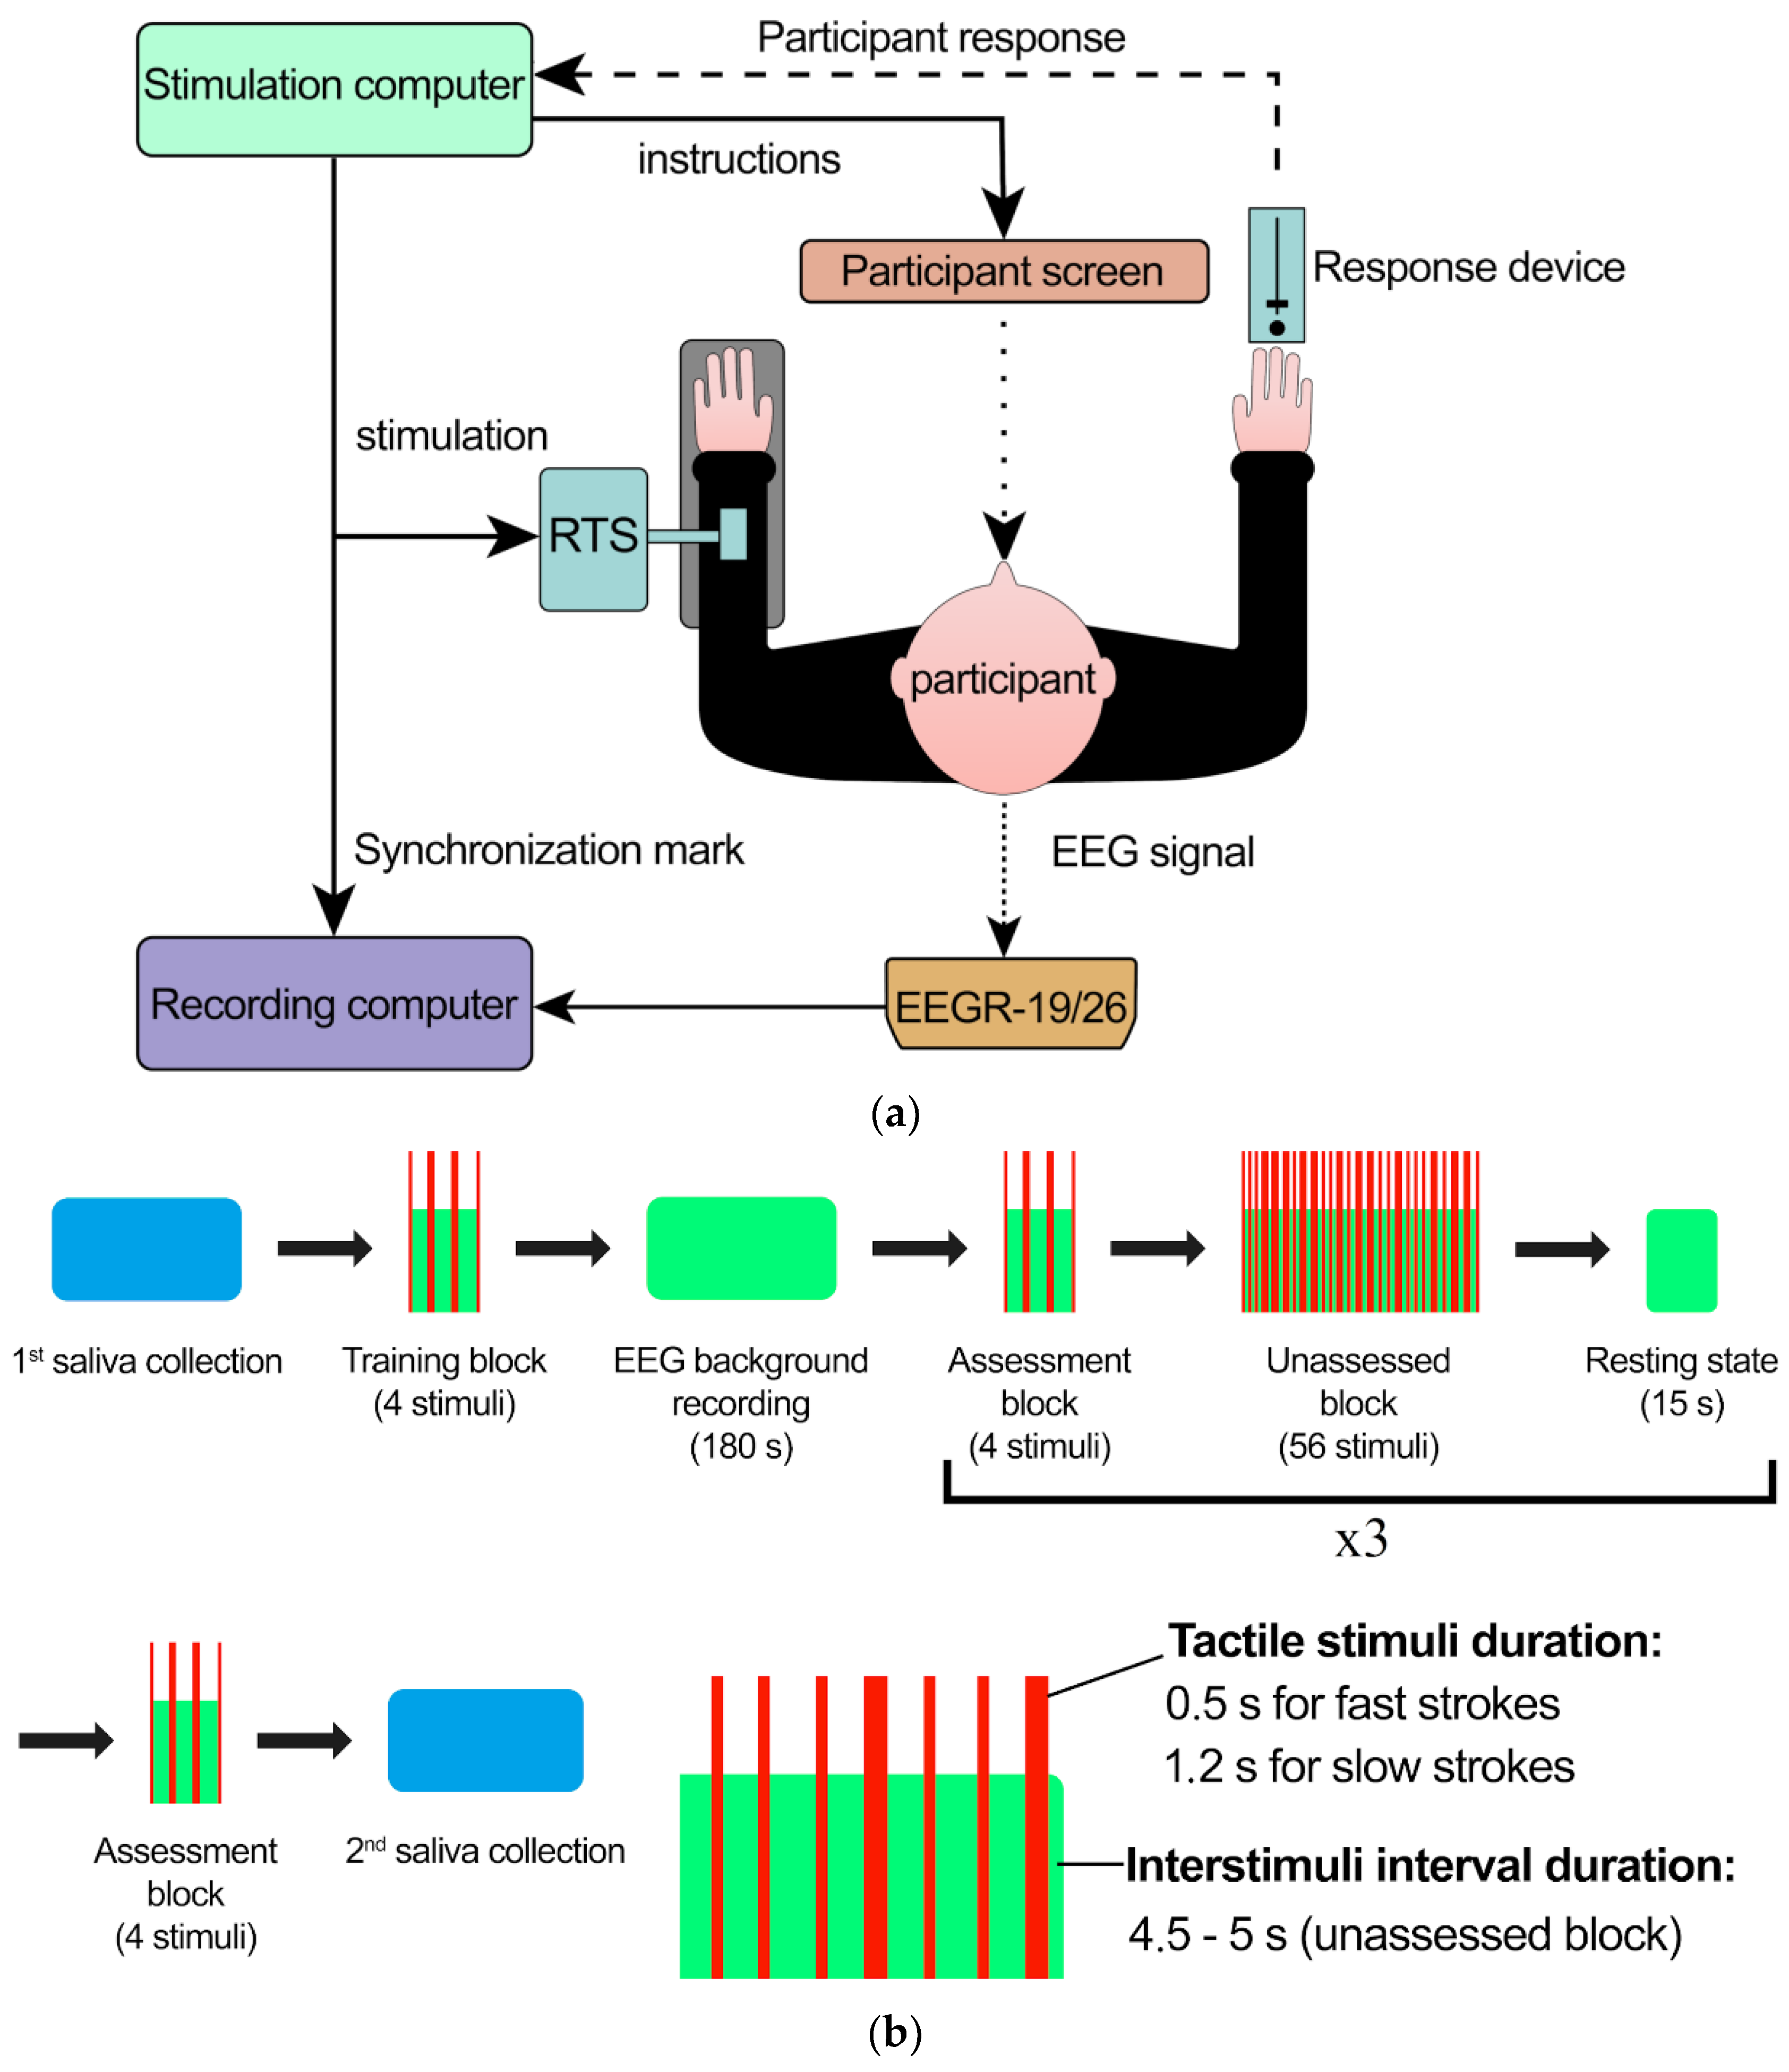
4.2. Stimulation and Data Acquisition
4.3. Stimuli Assessments
- -
- Pleasantness scale (unpleasant—pleasant).
- -
- Tickling scale (not tickling—very tickling).
- -
- Arousal scale (calming—excitement).
4.4. Saliva Collection
4.5. Salivary Oxytocin Assay
4.6. Salivary Antioxidant Capacity Assay
4.7. Salivary Indexes
- (1)
- Oxytocin index, OI = (oxytocin after experiment—oxytocin before experiment)/oxytocin after experiment;
- (2)
- Antioxidant capacity index, AI = (antioxidant capacity after experiment—antioxidant capacity after experiment before experiment)/antioxidant capacity after experiment after experiment.
4.8. EEG Recording and Preprocessing
4.9. EEG Analysis
4.10. ERP Analysis
4.11. Statistical Analysis
5. Conclusions
Limitations
Author Contributions
Funding
Institutional Review Board Statement
Informed Consent Statement
Data Availability Statement
Conflicts of Interest
References
- Geschwind, D.H. Advances in autism. Annu. Rev. Med. 2009, 60, 367–380. [Google Scholar] [CrossRef] [Green Version]
- Vasa, R.A.; Mostofsky, S.H.; Ewen, J.B. The Disrupted Connectivity Hypothesis of Autism Spectrum Disorders: Time for the Next Phase in Research. Biol. Psychiatry Cogn. Neurosci. Neuroimaging 2016, 1, 245–252. [Google Scholar] [CrossRef] [Green Version]
- Afif, I.Y.; Farkhan, M.; Kurdi, O.; Maula, M.I.; Ammarullah, M.I.; Setiyana, B.; Jamari, J.; Winarni, T.I. Effect of Short-Term Deep-Pressure Portable Seat on Behavioral and Biological Stress in Children with Autism Spectrum Disorders: A Pilot Study. Bioengineering 2022, 9, 48. [Google Scholar] [CrossRef] [PubMed]
- Zhao, F.; Zhang, H.; Wang, P.; Cui, W.; Xu, K.; Chen, D.; Hu, M.; Li, Z.; Geng, X.; Wei, S. Oxytocin and serotonin in the modulation of neural function: Neurobiological underpinnings of autism-related behavior. Front. Neurosci. 2022, 16, 919890. [Google Scholar] [CrossRef]
- Bernaerts, S.; Prinsen, J.; Berra, E.; Bosmans, G.; Steyaert, J.; Alaerts, K. Long-term oxytocin administration enhances the experience of attachment. Psychoneuroendocrinology 2017, 78, 1–9. [Google Scholar] [CrossRef] [Green Version]
- Modahl, C.; Green, L.; Fein, D.; Morris, M.; Waterhouse, L.; Feinstein, C.; Levin, H. Plasma oxytocin levels in autistic children. Biol. Psychiatry 1998, 43, 270–277. [Google Scholar] [CrossRef] [PubMed]
- Moerkerke, M.; Peeters, M.; de Vries, L.; Daniels, N.; Steyaert, J.; Alaerts, K.; Boets, B. Endogenous Oxytocin Levels in Autism-A Meta-Analysis. Brain Sci. 2021, 11, 1545. [Google Scholar] [CrossRef]
- Choe, K.Y.; Bethlehem, R.A.I.; Safrin, M.; Dong, H.; Salman, E.; Li, Y.; Grinevich, V.; Golshani, P.; DeNardo, L.A.; Penagarikano, O.; et al. Oxytocin normalizes altered circuit connectivity for social rescue of the Cntnap2 knockout mouse. Neuron 2022, 110, 795–808.e6. [Google Scholar] [CrossRef]
- Hornberg, H.; Perez-Garci, E.; Schreiner, D.; Hatstatt-Burkle, L.; Magara, F.; Baudouin, S.; Matter, A.; Nacro, K.; Pecho-Vrieseling, E.; Scheiffele, P. Rescue of oxytocin response and social behaviour in a mouse model of autism. Nature 2020, 584, 252–256. [Google Scholar] [CrossRef] [PubMed]
- Grace, S.A.; Rossell, S.L.; Heinrichs, M.; Kordsachia, C.; Labuschagne, I. Oxytocin and brain activity in humans: A systematic review and coordinate-based meta-analysis of functional MRI studies. Psychoneuroendocrinology 2018, 96, 6–24. [Google Scholar] [CrossRef]
- Watanabe, T.; Abe, O.; Kuwabara, H.; Yahata, N.; Takano, Y.; Iwashiro, N.; Natsubori, T.; Aoki, Y.; Takao, H.; Kawakubo, Y.; et al. Mitigation of sociocommunicational deficits of autism through oxytocin-induced recovery of medial prefrontal activity: A randomized trial. JAMA Psychiatry 2014, 71, 166–175. [Google Scholar] [CrossRef] [Green Version]
- Alaerts, K.; Steyaert, J.; Vanaudenaerde, B.; Wenderoth, N.; Bernaerts, S. Changes in endogenous oxytocin levels after intranasal oxytocin treatment in adult men with autism: An exploratory study with long-term follow-up. Eur. Neuropsychopharmacol. 2021, 43, 147–152. [Google Scholar] [CrossRef]
- Sikich, L.; Kolevzon, A.; King, B.H.; McDougle, C.J.; Sanders, K.B.; Kim, S.J.; Spanos, M.; Chandrasekhar, T.; Trelles, M.D.P.; Rockhill, C.M.; et al. Intranasal Oxytocin in Children and Adolescents with Autism Spectrum Disorder. N. Engl. J. Med. 2021, 385, 1462–1473. [Google Scholar] [CrossRef]
- Hosseini, S.A.; Molla, M. Asperger Syndrome; StatPearls: Treasure Island, FL, USA, 2023. [Google Scholar]
- Di Napoli, A.; Warrier, V.; Baron-Cohen, S.; Chakrabarti, B. Genetic variation in the oxytocin receptor (OXTR) gene is associated with Asperger Syndrome. Mol. Autism 2014, 5, 48. [Google Scholar] [CrossRef] [PubMed] [Green Version]
- Hollander, E.; Novotny, S.; Hanratty, M.; Yaffe, R.; DeCaria, C.M.; Aronowitz, B.R.; Mosovich, S. Oxytocin infusion reduces repetitive behaviors in adults with autistic and Asperger’s disorders. Neuropsychopharmacology 2003, 28, 193–198. [Google Scholar] [CrossRef] [PubMed]
- Domes, G.; Kumbier, E.; Heinrichs, M.; Herpertz, S.C. Oxytocin promotes facial emotion recognition and amygdala reactivity in adults with asperger syndrome. Neuropsychopharmacology 2014, 39, 698–706. [Google Scholar] [CrossRef] [Green Version]
- Guliaeva, N.V.; Levshina, I.P.; Levina, O.L.; Plekhanova, L.G. Corrective action of an antioxidant in chronic emotional-pain stress in rats. Biull. Eksp. Biol. Med. 1984, 98, 645–647. [Google Scholar] [PubMed]
- Lukash, A.I.; Zaika, V.G.; Miliutina, N.P.; Kucherenko, A.O. Intensity of free radical process and antioxidant enzymes activity in human saliva and plasma under emotional stress. Vopr. Med. Khim 1999, 45, 507–513. [Google Scholar]
- Proskurnina, E.V.; Sokolova, S.V.; Portnova, G.V. Touch-induced emotional comfort results in an increase in the salivary antioxidant potential: A correlational study. Psychophysiology 2021, 58, e13854. [Google Scholar] [CrossRef]
- Ancelin, M.L.; Christen, Y.; Ritchie, K. Is antioxidant therapy a viable alternative for mild cognitive impairment? Examination of the evidence. Dement. Geriatr. Cogn. Disord. 2007, 24, 1–19. [Google Scholar] [CrossRef] [Green Version]
- Head, E. Oxidative damage and cognitive dysfunction: Antioxidant treatments to promote healthy brain aging. Neurochem. Res. 2009, 34, 670–678. [Google Scholar] [CrossRef] [Green Version]
- Crichton, G.E.; Bryan, J.; Murphy, K.J. Dietary antioxidants, cognitive function and dementia--a systematic review. Plant Foods Hum. Nutr. 2013, 68, 279–292. [Google Scholar] [CrossRef]
- Rafnsson, S.B.; Dilis, V.; Trichopoulou, A. Antioxidant nutrients and age-related cognitive decline: A systematic review of population-based cohort studies. Eur. J. Nutr. 2013, 52, 1553–1567. [Google Scholar] [CrossRef] [PubMed]
- Cammisuli, D.M.; Franzoni, F.; Scarfo, G.; Fusi, J.; Gesi, M.; Bonuccelli, U.; Daniele, S.; Martini, C.; Castelnuovo, G. What Does the Brain Have to Keep Working at Its Best? Resilience Mechanisms Such as Antioxidants and Brain/Cognitive Reserve for Counteracting Alzheimer’s Disease Degeneration. Biology 2022, 11, 650. [Google Scholar] [CrossRef] [PubMed]
- Zhou, F.; Xie, X.; Zhang, H.; Liu, T. Effect of antioxidant intake patterns on risks of dementia and cognitive decline. Eur. Geriatr. Med. 2023, 14, 9–17. [Google Scholar] [CrossRef] [PubMed]
- Nantachai, G.; Vasupanrajit, A.; Tunvirachaisakul, C.; Solmi, M.; Maes, M. Oxidative stress and antioxidant defenses in mild cognitive impairment: A systematic review and meta-analysis. Ageing Res. Rev. 2022, 79, 101639. [Google Scholar] [CrossRef]
- Rai, K.; Hegde, A.M.; Jose, N. Salivary antioxidants and oral health in children with autism. Arch. Oral Biol. 2012, 57, 1116–1120. [Google Scholar] [CrossRef]
- Manivasagam, T.; Arunadevi, S.; Essa, M.M.; SaravanaBabu, C.; Borah, A.; Thenmozhi, A.J.; Qoronfleh, M.W. Role of Oxidative Stress and Antioxidants in Autism. Adv. Neurobiol. 2020, 24, 193–206. [Google Scholar] [CrossRef]
- Imataka, G.; Yui, K.; Shiko, Y.; Kawasaki, Y.; Sasaki, H.; Shiroki, R.; Yoshihara, S. Urinary and Plasma Antioxidants in Behavioral Symptoms of Individuals With Autism Spectrum Disorder. Front. Psychiatry 2021, 12, 684445. [Google Scholar] [CrossRef]
- Morimoto, M.; Hashimoto, T.; Tsuda, Y.; Suenaga, M.; Nakamura, T.; Katoh, S. Study on oxidative stress and inflammatory/antioxidant substance levels in autism spectrum disorder. J. Chin. Med. Assoc. 2023, 86, 489–493. [Google Scholar] [CrossRef]
- Liu, Y.; Yang, Z.; Du, Y.; Shi, S.; Cheng, Y. Antioxidant interventions in autism spectrum disorders: A meta-analysis. Prog. Neuropsychopharmacol. Biol. Psychiatry 2022, 113, 110476. [Google Scholar] [CrossRef] [PubMed]
- Pangrazzi, L.; Balasco, L.; Bozzi, Y. Natural Antioxidants: A Novel Therapeutic Approach to Autism Spectrum Disorders? Antioxidants 2020, 9, 186. [Google Scholar] [CrossRef] [PubMed]
- Castejon, A.M.; Spaw, J.A.; Rozenfeld, I.; Sheinberg, N.; Kabot, S.; Shaw, A.; Hardigan, P.; Faillace, R.; Packer, E.E. Improving Antioxidant Capacity in Children With Autism: A Randomized, Double-Blind Controlled Study With Cysteine-Rich Whey Protein. Front. Psychiatry 2021, 12, 669089. [Google Scholar] [CrossRef]
- Main, P.A.; Angley, M.T.; O’Doherty, C.E.; Thomas, P.; Fenech, M. The potential role of the antioxidant and detoxification properties of glutathione in autism spectrum disorders: A systematic review and meta-analysis. Nutr. Metab. 2012, 9, 35. [Google Scholar] [CrossRef] [Green Version]
- Gu, F.; Chauhan, V.; Chauhan, A. Impaired synthesis and antioxidant defense of glutathione in the cerebellum of autistic subjects: Alterations in the activities and protein expression of glutathione-related enzymes. Free Radic. Biol. Med. 2013, 65, 488–496. [Google Scholar] [CrossRef]
- Parellada, M.; Moreno, C.; Mac-Dowell, K.; Leza, J.C.; Giraldez, M.; Bailon, C.; Castro, C.; Miranda-Azpiazu, P.; Fraguas, D.; Arango, C. Plasma antioxidant capacity is reduced in Asperger syndrome. J. Psychiatr. Res. 2012, 46, 394–401. [Google Scholar] [CrossRef]
- Colombi, C.; Fish, A.; Ghaziuddin, M. Utility of the ADOS-2 in children with psychiatric disorders. Eur. Child. Adolesc. Psychiatry 2020, 29, 989–992. [Google Scholar] [CrossRef]
- Portnova, G.V.; Ivanova, O.; Proskurnina, E.V. Effects of EEG examination and ABA-therapy on resting-state EEG in children with low-functioning autism. AIMS Neurosci. 2020, 7, 153–167. [Google Scholar] [CrossRef] [PubMed]
- Al-Shargie, F.; Kiguchi, M.; Badruddin, N.; Dass, S.C.; Hani, A.F.; Tang, T.B. Mental stress assessment using simultaneous measurement of EEG and fNIRS. Biomed. Opt. Express 2016, 7, 3882–3898. [Google Scholar] [CrossRef] [Green Version]
- Kozlov, A.I.; Kozlova, M.A. Cortisol as a marker of stress. Fiziol. Cheloveka 2014, 40, 123–136. [Google Scholar] [CrossRef]
- Bates, R.; Salsberry, P.; Ford, J. Measuring Stress in Young Children Using Hair Cortisol: The State of the Science. Biol. Res. Nurs. 2017, 19, 499–510. [Google Scholar] [CrossRef]
- Afif, I.Y.; Manik, A.R.; Munthe, K.; Maula, M.I.; Ammarullah, M.I.; Jamari, J.; Winarni, T.I. Physiological effect of deep pressure in reducing anxiety of children with ASD during traveling: A public transportation setting. Bioengineering 2022, 9, 157. [Google Scholar] [CrossRef]
- Yonkman, J.; Lawler, B.; Talty, J.; O’Neil, J.; Bull, M. Safely Transporting Children with Autism Spectrum Disorder: Evaluation and Intervention. Am. J. Occup. Ther. 2013, 67, 711–716. [Google Scholar] [CrossRef] [PubMed] [Green Version]
- Markram, K.; Markram, H. The Intense World Theory—A Unifying Theory of the Neurobiology of Autism. Front. Hum. Neurosci. 2010, 4, 224. [Google Scholar] [CrossRef] [Green Version]
- Pellicano, E.; Burr, D. When the World Becomes “Too Real”: A Bayesian Explanation of Autistic Perception. Trends Cogn. Sci. 2012, 16, 504–510. [Google Scholar] [CrossRef] [PubMed]
- McGlone, F.; Wessberg, J.; Olausson, H. Discriminative and Affective Touch: Sensing and Feeling. Neuron 2014, 82, 737–755. [Google Scholar] [CrossRef] [PubMed] [Green Version]
- Mazefsky, C.A.; Herrington, J.; Siegel, M.; Scarpa, A.; Maddox, B.B.; Scahill, L.; White, S.W. The role of emotion regulation in autism spectrum disorder. J. Am. Acad. Child. Adolesc. Psychiatry 2013, 52, 679–688. [Google Scholar] [CrossRef] [PubMed] [Green Version]
- Kamp-Becker, I.; Ghahreman, M.; Heinzel-Gutenbrunner, M.; Peters, M.; Remschmidt, H.; Becker, K. Evaluation of the revised algorithm of Autism Diagnostic Observation Schedule (ADOS) in the diagnostic investigation of high-functioning children and adolescents with autism spectrum disorders. Autism 2013, 17, 87–102. [Google Scholar] [CrossRef]
- Essick, G.K.; McGlone, F.; Dancer, C.; Fabricant, D.; Ragin, Y.; Phillips, N.; Jones, T.; Guest, S. Quantitative assessment of pleasant touch. Neurosci. Biobehav. Rev. 2010, 34, 192–203. [Google Scholar] [CrossRef]
- Varlamov, A.A.; Ivanova, M.A.; Skorokhodov, I.V.; Semirechenko, A.N.; Portnova, G.V. Features of EEG evoked potentials during the perception of fast and slow strokes: The response of the recognizing and emotional systems of mechanoreception. Zh. Vyssh. Nerv. Deiat. Im. I. P. Pavlova 2021, 71, 637–648. [Google Scholar]
- McGlone, F.; Vallbo, A.B.; Olausson, H.; Loken, L.; Wessberg, J. Discriminative touch and emotional touch. Can. J. Exp. Psychol. 2007, 61, 173–183. [Google Scholar] [CrossRef] [PubMed] [Green Version]
- Bishop-Fitzpatrick, L.; Mazefsky, C.A.; Minshew, N.J.; Eack, S.M. The relationship between stress and social functioning in adults with autism spectrum disorder and without intellectual disability. Autism Res. 2015, 8, 164–173. [Google Scholar] [CrossRef] [PubMed] [Green Version]
- John, S.; Jaeggi, A.V. Oxytocin levels tend to be lower in autistic children: A meta-analysis of 31 studies. Autism 2021, 25, 2152–2161. [Google Scholar] [CrossRef] [PubMed]
- Freeman, S.M.; Palumbo, M.C.; Lawrence, R.H.; Smith, A.L.; Goodman, M.M.; Bales, K.L. Effect of age and autism spectrum disorder on oxytocin receptor density in the human basal forebrain and midbrain. Transl. Psychiatry 2018, 8, 257. [Google Scholar] [CrossRef] [PubMed] [Green Version]
- Campbell, D.B.; Datta, D.; Jones, S.T.; Batey Lee, E.; Sutcliffe, J.S.; Hammock, E.A.; Levitt, P. Association of oxytocin receptor (OXTR) gene variants with multiple phenotype domains of autism spectrum disorder. J. Neurodev. Disord. 2011, 3, 101–112. [Google Scholar] [CrossRef] [Green Version]
- Green, J.J.; Hollander, E. Autism and oxytocin: New developments in translational approaches to therapeutics. Neurotherapeutics 2010, 7, 250–257. [Google Scholar] [CrossRef] [Green Version]
- Walker, S.C.; Trotter, P.D.; Swaney, W.T.; Marshall, A.; McGlone, F.P. C-tactile afferents: Cutaneous mediators of oxytocin release during affiliative tactile interactions? Neuropeptides 2017, 64, 27–38. [Google Scholar] [CrossRef] [Green Version]
- Yu, H.; Miao, W.; Ji, E.; Huang, S.; Jin, S.; Zhu, X.; Liu, M.Z.; Sun, Y.G.; Xu, F.; Yu, X. Social touch-like tactile stimulation activates a tachykinin 1-oxytocin pathway to promote social interactions. Neuron 2022, 110, 1051–1067.e7. [Google Scholar] [CrossRef]
- Olff, M.; Frijling, J.L.; Kubzansky, L.D.; Bradley, B.; Ellenbogen, M.A.; Cardoso, C.; Bartz, J.A.; Yee, J.R.; van Zuiden, M. The role of oxytocin in social bonding, stress regulation and mental health: An update on the moderating effects of context and interindividual differences. Psychoneuroendocrinology 2013, 38, 1883–1894. [Google Scholar] [CrossRef] [Green Version]
- Ooishi, Y.; Mukai, H.; Watanabe, K.; Kawato, S.; Kashino, M. Increase in salivary oxytocin and decrease in salivary cortisol after listening to relaxing slow-tempo and exciting fast-tempo music. PLoS ONE 2017, 12, e0189075. [Google Scholar] [CrossRef] [Green Version]
- Parkitny, L.; Carter, C.S.; Peckins, M.K.; Hon, D.A.; Saturn, S.; Nazarloo, H.P.; Hurlbut, W.; Knutson, B.; Crane, S.; Harris, X.; et al. Longitudinal tracking of human plasma oxytocin suggests complex responses to moral elevation. Compr. Psychoneuroendocrinol. 2022, 9, 100105. [Google Scholar] [CrossRef]
- Williams, J.D.; Gruzelier, J.H. Differentiation of hypnosis and relaxation by analysis of narrow band theta and alpha frequencies. Int. J. Clin. Exp. Hypn. 2001, 49, 185–206. [Google Scholar] [CrossRef] [PubMed]
- Marshall, M.S.; Bentler, P.M. The effects of deep physical relaxation and low-frequency-alpha brainwaves on alpha subjective reports. Psychophysiology 1976, 13, 505–516. [Google Scholar] [CrossRef] [PubMed]
- Portnova, G.V.; Proskurnina, E.V.; Sokolova, S.V.; Skorokhodov, I.V.; Varlamov, A.A. Perceived pleasantness of gentle touch in healthy individuals is related to salivary oxytocin response and EEG markers of arousal. Exp. Brain Res. 2020, 238, 2257–2268. [Google Scholar] [CrossRef] [PubMed]
- McIntyre, S.; Hauser, S.C.; Kusztor, A.; Boehme, R.; Moungou, A.; Isager, P.M.; Homman, L.; Novembre, G.; Nagi, S.S.; Israr, A.; et al. The Language of Social Touch Is Intuitive and Quantifiable. Psychol. Sci. 2022, 33, 1477–1494. [Google Scholar] [CrossRef] [PubMed]
- Liljencrantz, J.; Olausson, H. Tactile C fibers and their contributions to pleasant sensations and to tactile allodynia. Front. Behav. Neurosci. 2014, 8, 37. [Google Scholar] [CrossRef] [Green Version]
- Liebe, S.; Hoerzer, G.M.; Logothetis, N.K.; Rainer, G. Theta coupling between V4 and prefrontal cortex predicts visual short-term memory performance. Nat. Neurosci. 2012, 15, 456–462. [Google Scholar] [CrossRef] [Green Version]
- Lisman, J.E.; Jensen, O. The theta-gamma neural code. Neuron 2013, 77, 1002–1016. [Google Scholar] [CrossRef] [Green Version]
- Snipes, S.; Krugliakova, E.; Meier, E.; Huber, R. The Theta Paradox: 4-8 Hz EEG Oscillations Reflect Both Sleep Pressure and Cognitive Control. J. Neurosci. 2022, 42, 8569–8586. [Google Scholar] [CrossRef]
- Pantoni, L.; Marzi, C.; Poggesi, A.; Giorgio, A.; De Stefano, N.; Mascalchi, M.; Inzitari, D.; Salvadori, E.; Diciotti, S. Fractal dimension of cerebral white matter: A consistent feature for prediction of the cognitive performance in patients with small vessel disease and mild cognitive impairment. Neuroimage Clin. 2019, 24, 101990. [Google Scholar] [CrossRef]
- Shcherbakova, O.; Gorbunov, I.; Golovanova, I.; Kholodnaya, M. The Neural Efficiency Hypothesis: Further Evidence from the EEG-Study of Conceptual Thinking. Int. J. Psychophysiol. Off. J. Int. Organ. Psychophysiol. 2014, 94, 218. [Google Scholar] [CrossRef]
- Shcherbakova, O.; Golovanova, I.; Gorbunov, I. EEG fractal dimension as a marker of cognitive success: Evidence from conceptual thinking tasks. Int. J. Psychophysiol. Off. J. Int. Organ. Psychophysiol. 2016, 108, 99. [Google Scholar] [CrossRef]
- Enriquez-Geppert, S.; Barcelo, F. Multisubject Decomposition of Event-related Positivities in Cognitive Control: Tackling Age-related Changes in Reactive Control. Brain Topogr. 2018, 31, 17–34. [Google Scholar] [CrossRef] [Green Version]
- Li, F.; Chen, B.; Li, H.; Zhang, T.; Wang, F.; Jiang, Y.; Li, P.; Ma, T.; Zhang, R.; Tian, Y.; et al. The Time-Varying Networks in P300: A Task-Evoked EEG Study. IEEE Trans. Neural Syst. Rehabil. Eng. 2016, 24, 725–733. [Google Scholar] [CrossRef] [PubMed]
- Abootalebi, V.; Moradi, M.H.; Khalilzadeh, M.A. A new approach for EEG feature extraction in P300-based lie detection. Comput. Methods Programs Biomed. 2009, 94, 48–57. [Google Scholar] [CrossRef] [PubMed]


| Asperger’s | Control Group | ||||||||
|---|---|---|---|---|---|---|---|---|---|
| Stimuli (sm/s-N) | Mean | Std. Dv. | t | p | Mean | Std. Dv. | t | p | |
| Pleasantness (1–9) | 5–0.1 | 4.14 | 1.61 | −2.63 | 0.017 | 3.84 | 1.14 | −8.74 | 0.000 |
| 5–0.8 | 5.51 | 1.13 | 7.17 | 1.39 | |||||
| 5–0.1 | 4.14 | 1.61 | −0.99 | 0.335 | 3.84 | 1.14 | −3.00 | 0.007 | |
| 30–0.1 | 4.63 | 1.04 | 5.24 | 1.39 | |||||
| 5–0.1 | 4.14 | 1.61 | −1.24 | 0.231 | 3.84 | 1.14 | −3.87 | 0.001 | |
| 30–0.8 | 4.79 | 1.34 | 5.51 | 1.24 | |||||
| 5–0.8 | 5.51 | 1.13 | 2.61 | 0.018 | 7.17 | 1.39 | 4.97 | 0.000 | |
| 30–0.1 | 4.63 | 1.04 | 5.24 | 1.39 | |||||
| 5–0.8 | 5.51 | 1.13 | 2.88 | 0.010 | 7.17 | 1.39 | 4.49 | 0.000 | |
| 30–0.8 | 4.79 | 1.34 | 5.51 | 1.24 | |||||
| 30–0.8 | 4.79 | 1.34 | 0.57 | 0.576 | 5.51 | 1.24 | 1.59 | 0.126 | |
| 30–0.1 | 4.63 | 1.04 | 5.24 | 1.39 | |||||
| Tickle (1–9) | 5–0.1 | 3.84 | 1.14 | 4.32 | 0.000 | 3.64 | 2.55 | 3.28 | 0.004 |
| 5–0.8 | 7.17 | 1.39 | 2.02 | 1.94 | |||||
| 5–0.1 | 3.84 | 1.14 | 1.75 | 0.098 | 3.64 | 2.55 | −0.61 | 0.551 | |
| 30–0.1 | 5.24 | 1.39 | 3.84 | 2.46 | |||||
| 5–0.1 | 3.84 | 1.14 | 2.63 | 0.018 | 3.64 | 2.55 | 3.41 | 0.003 | |
| 30–0.8 | 5.51 | 1.24 | 2.21 | 1.68 | |||||
| 5–0.8 | 1.94 | 1.77 | −3.35 | 0.004 | 2.02 | 1.94 | −3.75 | 0.001 | |
| 30–0.1 | 3.19 | 2.49 | 3.84 | 2.46 | |||||
| 5–0.8 | 1.94 | 1.77 | −2.07 | 0.054 | 2.02 | 1.94 | −0.70 | 0.493 | |
| 30–0.8 | 2.60 | 2.00 | 2.21 | 1.68 | |||||
| 30-0.1 | 3.19 | 2.49 | 1.64 | 0.120 | 3.84 | 2.46 | 4.51 | 0.000 | |
| 30–0.8 | 2.60 | 2.00 | 2.21 | 1.68 | |||||
| Arousal (1–9) | 5–0.1 | 4.17 | 2.16 | 2.59 | 0.019 | 3.71 | 2.22 | 2.74 | 0.012 |
| 5–0.8 | 3.17 | 2.13 | 2.60 | 1.67 | |||||
| 5–0.1 | 4.17 | 2.16 | −0.54 | 0.597 | 3.71 | 2.22 | −3.10 | 0.005 | |
| 30–0.1 | 4.27 | 2.06 | 4.31 | 2.16 | |||||
| 5–0.1 | 4.17 | 2.16 | 0.00 | 1.000 | 3.71 | 2.22 | −0.78 | 0.443 | |
| 30–0.8 | 4.17 | 1.74 | 3.94 | 1.96 | |||||
| 5–0.8 | 3.17 | 2.13 | −2.87 | 0.011 | 2.60 | 1.67 | −4.76 | 0.000 | |
| 30–0.8 | 4.27 | 2.06 | 4.31 | 2.16 | |||||
| 5–0.8 | 3.17 | 2.13 | −3.35 | 0.004 | 2.60 | 1.67 | −3.55 | 0.002 | |
| 30–0.8 | 4.17 | 1.74 | 3.94 | 1.96 | |||||
| 30–0.1 | 4.27 | 2.06 | 0.51 | 0.620 | 4.31 | 2.16 | 1.96 | 0.063 | |
| 30–0.8 | 4.17 | 1.74 | 3.94 | 1.96 | |||||
| Saliva Parameter | N | Mean | Lower Quartile | Upper Quartile | Std. Dev. | |
|---|---|---|---|---|---|---|
| ASD Group | ||||||
| Antioxidant | First probe | 21 | 988.3 | 626.3 | 1312.7 | 477.2 |
| Second probe | 21 | 1479.0 | 796.3 | 1786.8 | 787.9 | |
| AI | 21 | 0.6 | 0.2 | 0.9 | 0.6 | |
| Oxytocin | First probe | 21 | 229.4 | 96.8 | 354.9 | 162.9 |
| Second probe | 21 | 288.2 | 149.9 | 396.4 | 170.6 | |
| OI | 21 | 0.467 | −0.059 | 0.615 | 0.809 | |
| TD Group | ||||||
| Antioxidant | First probe | 23 | 1047.8 | 707.51 | 1251.70 | 445.57 |
| Second probe | 23 | 1169.3 | 727.80 | 1494.29 | 490.77 | |
| AI | 23 | 0.2 | −0.04 | 0.22 | 0.42 | |
| Oxytocin | First probe | 23 | 430.2 | 331.11 | 534.67 | 138.47 |
| Second probe | 23 | 422.5 | 323.47 | 548.39 | 143.22 | |
| OI | 23 | −0.017 | −0.034 | 0.030 | 0.097 | |
| Intergroup Differences | EEG Features | Resting State | Block 1 | Block 2 | Block 3 |
| PSD 4–8 Hz | 1 | 0.0717 | 0.0006 | 0.0000 | |
| FD | 0.0972 | 0.9539 | 1 | 0.4578 | |
| intragroup differences between time blocks: PSD 4–8 Hz | |||||
| Group | “rest-b1” | “rest-b2” | “rest-b3” | “b1−b2” | “b2−b3” |
| Yes | 1 | 0.0009 | 0.0000 | 0.0027 | 0.0000 |
| No | 0.1474 | 0.5568 | 0.0717 | 1 | 1 |
| intragroup differences between time blocks: FD | |||||
| Group | “rest-b1” | “rest-b2” | “rest-b3” | “b1−b2” | “b2−b3” |
| Yes | 0.8978 | 0.0005 | 0.0000 | 0.1304 | 0.0000 |
| No | 1 | 1 | 1 | 1 | 1 |
| Group | N | Gender | Age | AQ | TEAQ | ||
|---|---|---|---|---|---|---|---|
| TD | F | 14 | Mean | 27.7 | 17.8 | 133.3 | |
| 23 | |||||||
| M | 9 | SD | 7.9 | 4.3 | 21.9 | ||
| ASD | F | 13 | Mean | 28.6 | 38.6 | 96.6 | |
| 21 | |||||||
| M | 8 | SD | 9.22 | 5.0 | 16.5 | ||
| Yes | F | 14 | Mean | 27.3 | 31.7 | 112.7 | |
| 21 * | |||||||
| M | 7 | SD | 7.3 | 5.8 | 26.4 | ||
| No | F | 14 | Mean | 28.4 | 27.5 | 116.8 | |
| 22 * | |||||||
| M | 8 | SD | 8.5 | 5.8 | 22.9 | ||
Disclaimer/Publisher’s Note: The statements, opinions and data contained in all publications are solely those of the individual author(s) and contributor(s) and not of MDPI and/or the editor(s). MDPI and/or the editor(s) disclaim responsibility for any injury to people or property resulting from any ideas, methods, instructions or products referred to in the content. |
© 2023 by the authors. Licensee MDPI, Basel, Switzerland. This article is an open access article distributed under the terms and conditions of the Creative Commons Attribution (CC BY) license (https://creativecommons.org/licenses/by/4.0/).
Share and Cite
Portnova, G.V.; Proskurnina, E.V.; Skorokhodov, I.V.; Sokolova, S.V.; Semirechenko, A.N.; Varlamov, A.A. Salivary Oxytocin and Antioxidative Response to Robotic Touch in Adults with Autism Spectrum Disorder. Int. J. Mol. Sci. 2023, 24, 12322. https://doi.org/10.3390/ijms241512322
Portnova GV, Proskurnina EV, Skorokhodov IV, Sokolova SV, Semirechenko AN, Varlamov AA. Salivary Oxytocin and Antioxidative Response to Robotic Touch in Adults with Autism Spectrum Disorder. International Journal of Molecular Sciences. 2023; 24(15):12322. https://doi.org/10.3390/ijms241512322
Chicago/Turabian StylePortnova, Galina V., Elena V. Proskurnina, Ivan V. Skorokhodov, Svetlana V. Sokolova, Alexey N. Semirechenko, and Anton A. Varlamov. 2023. "Salivary Oxytocin and Antioxidative Response to Robotic Touch in Adults with Autism Spectrum Disorder" International Journal of Molecular Sciences 24, no. 15: 12322. https://doi.org/10.3390/ijms241512322