

Novel Fluorescent Tetrahedral Zinc (II) Complexes Derived from 4-Phenyl-1-octyl-1H-imidazole Fused with Aryl-9H-Carbazole and Triarylamine Donor Units: Synthesis, Crystal Structures, and Photophysical Properties
 ,
,
Abstract
:
1. Introduction
2. Results and Discussion
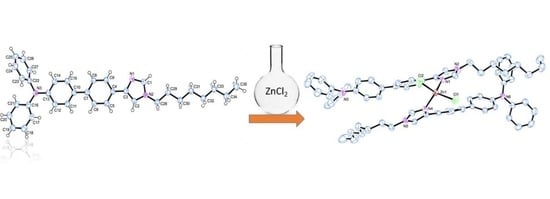
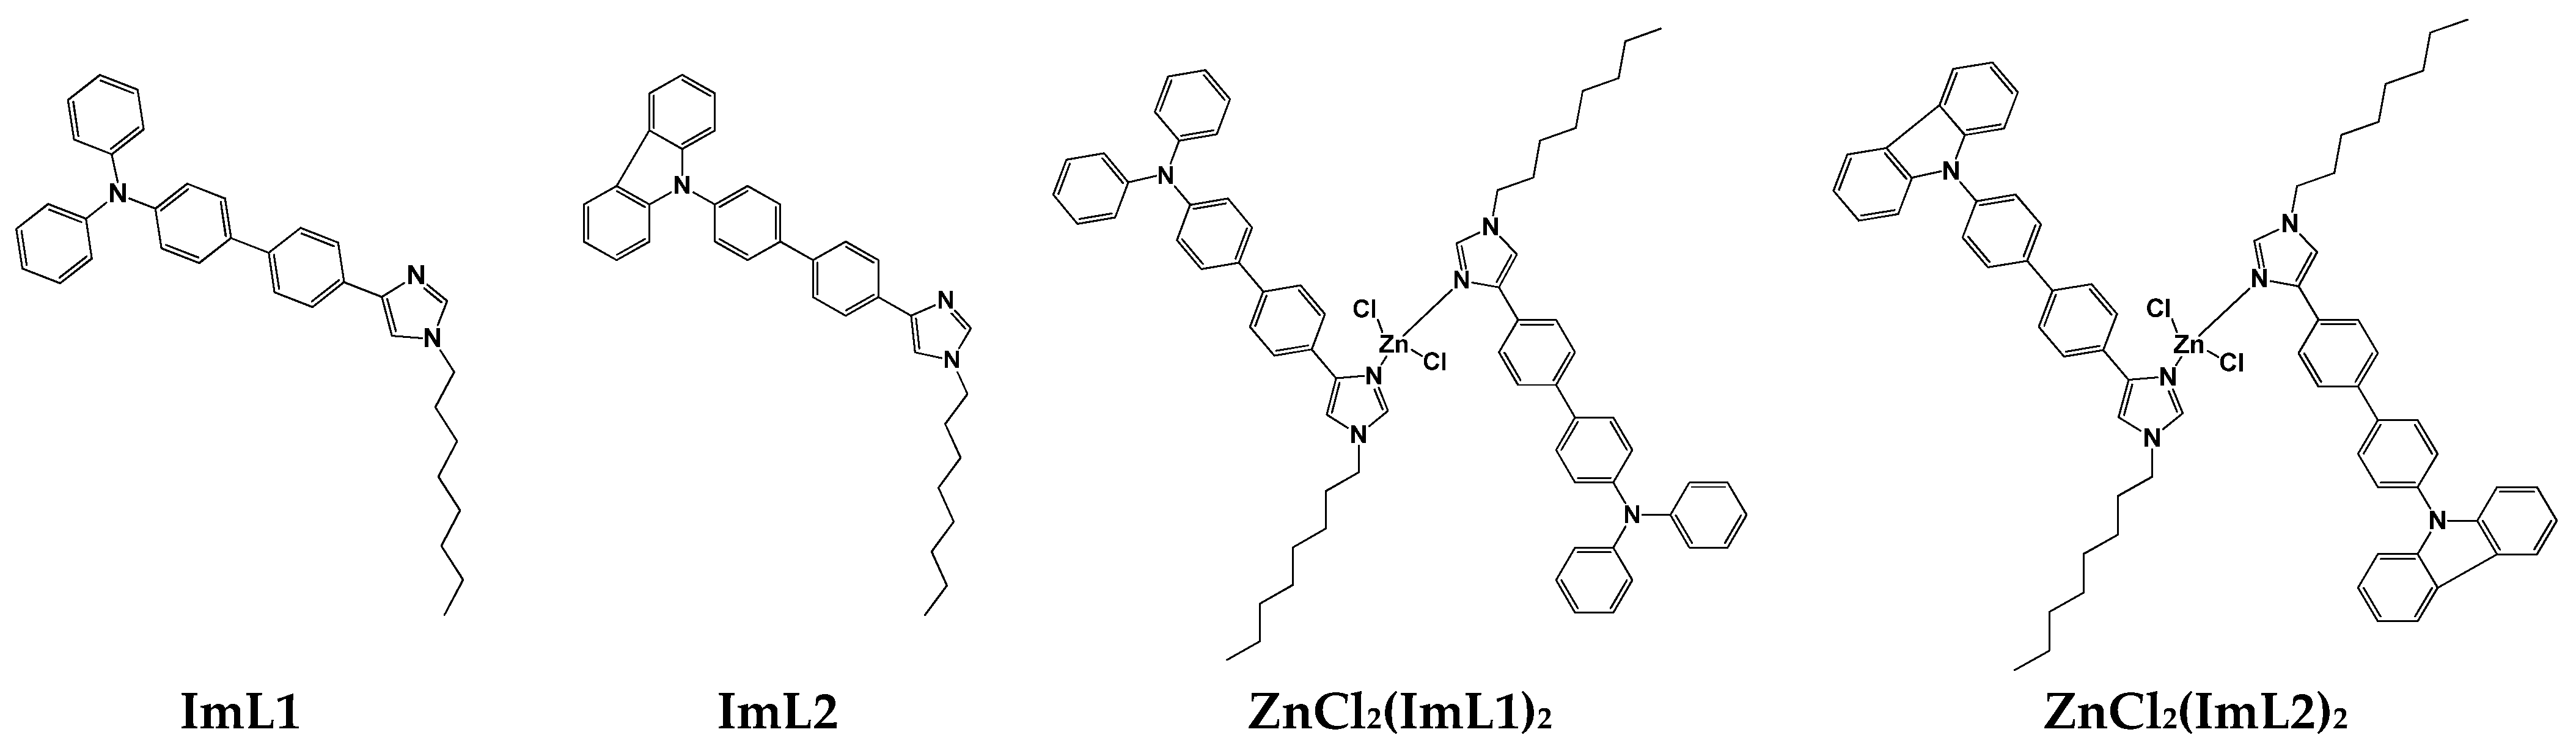
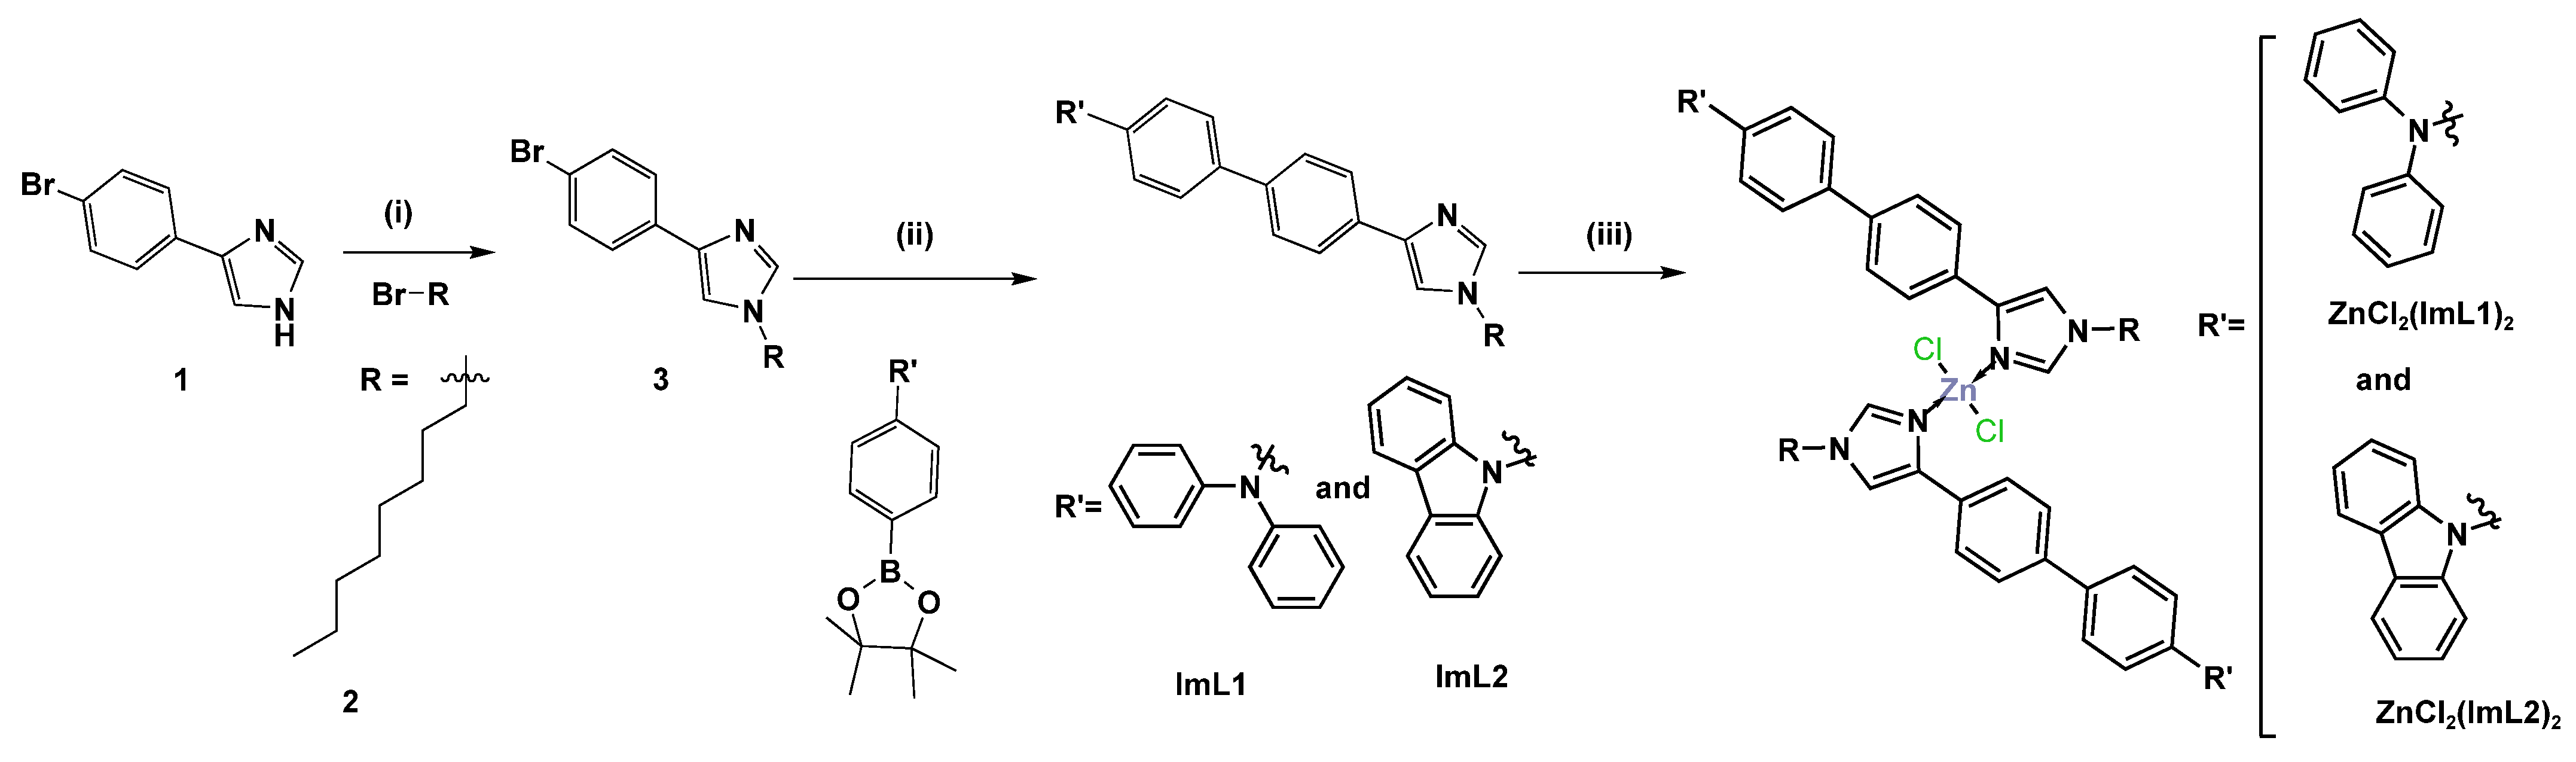
2.1. Synthesis of the Free Ligands and Their Corresponding Zn(II) Complexes
2.2. NMR Characterization of the Free Ligands ImL1 and ImL2 as Well as and Their Corresponding Zn(II) Complexes ZnCl2(ImL)2
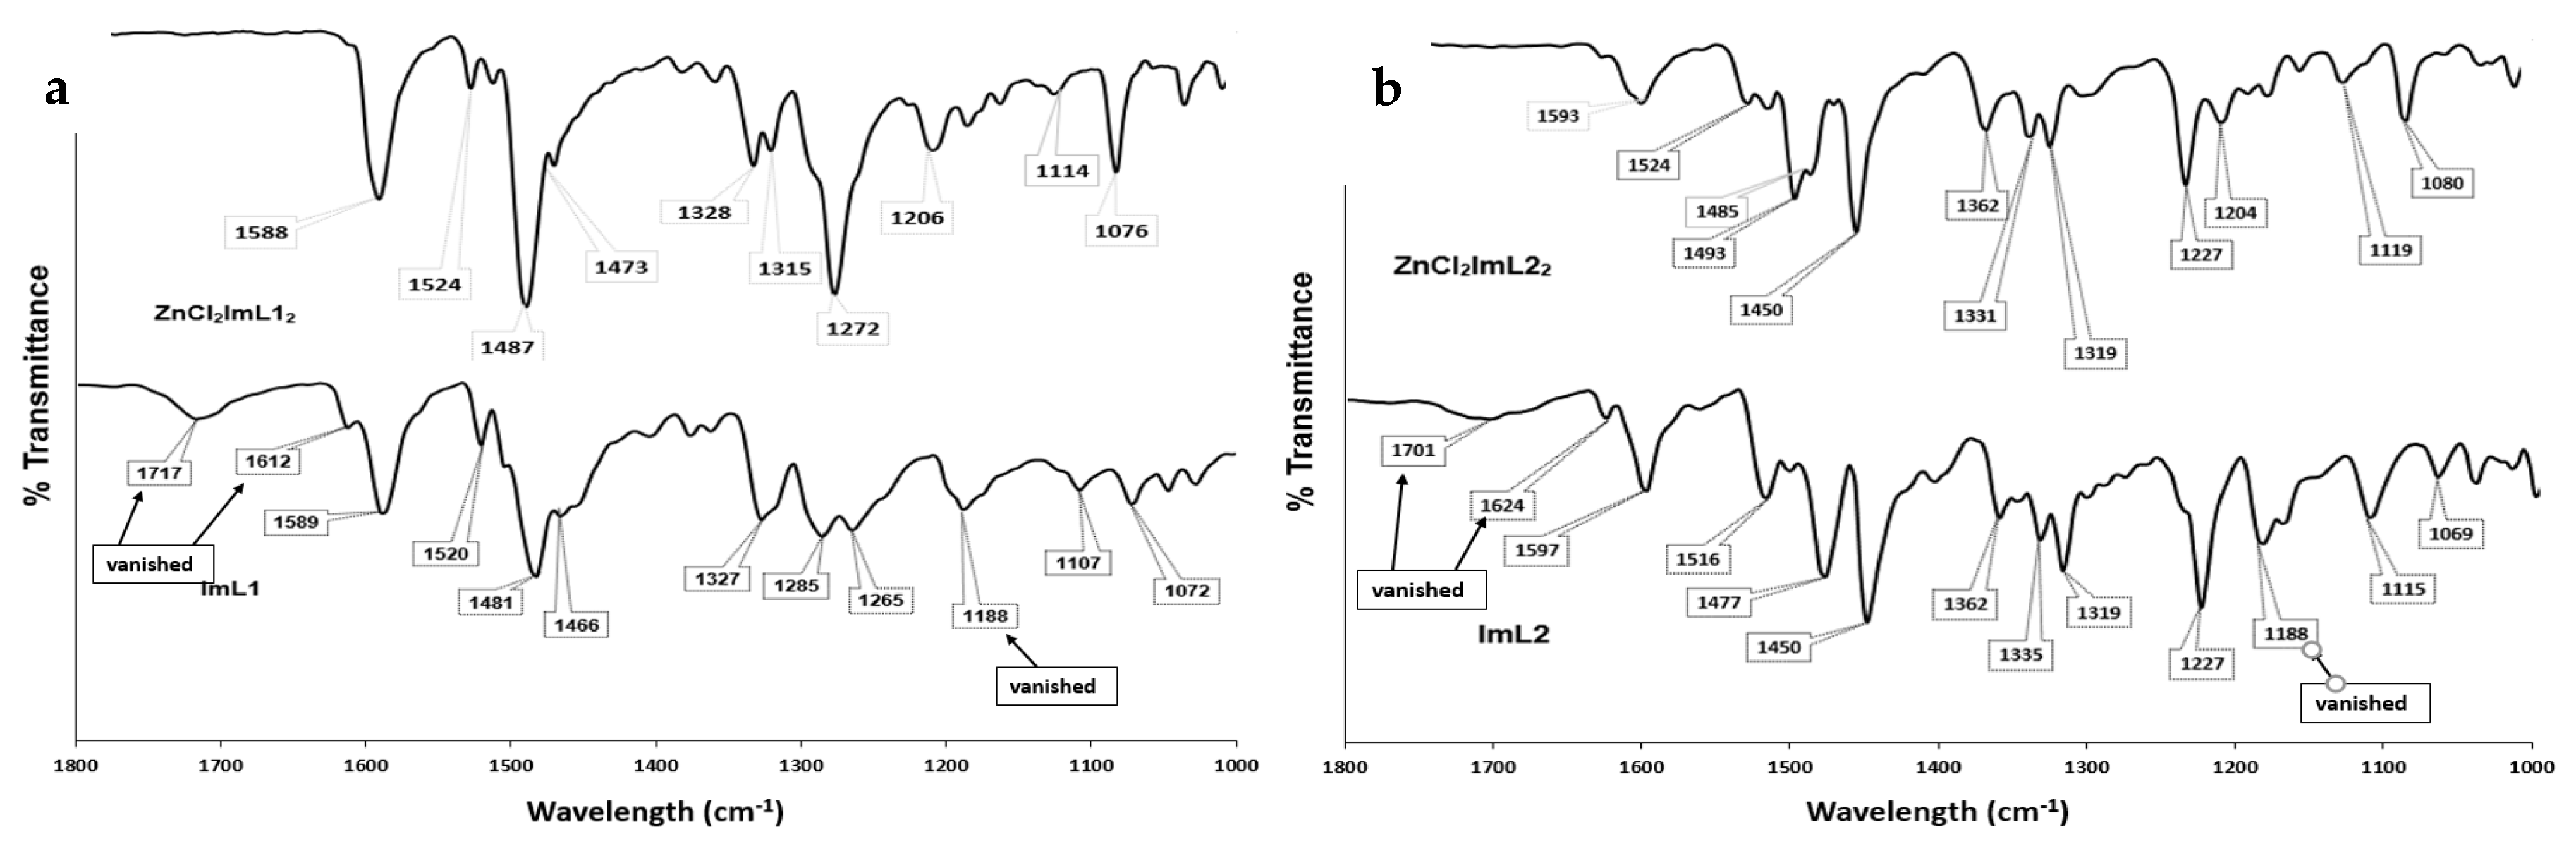
2.3. Fourier Transform Infrared Spectroscopy (FT-IR) Characterization of the Free Ligands ImL1 and ImL2 as Well as and Their Corresponding Zn(II) Complexes ZnCl2(ImL)2
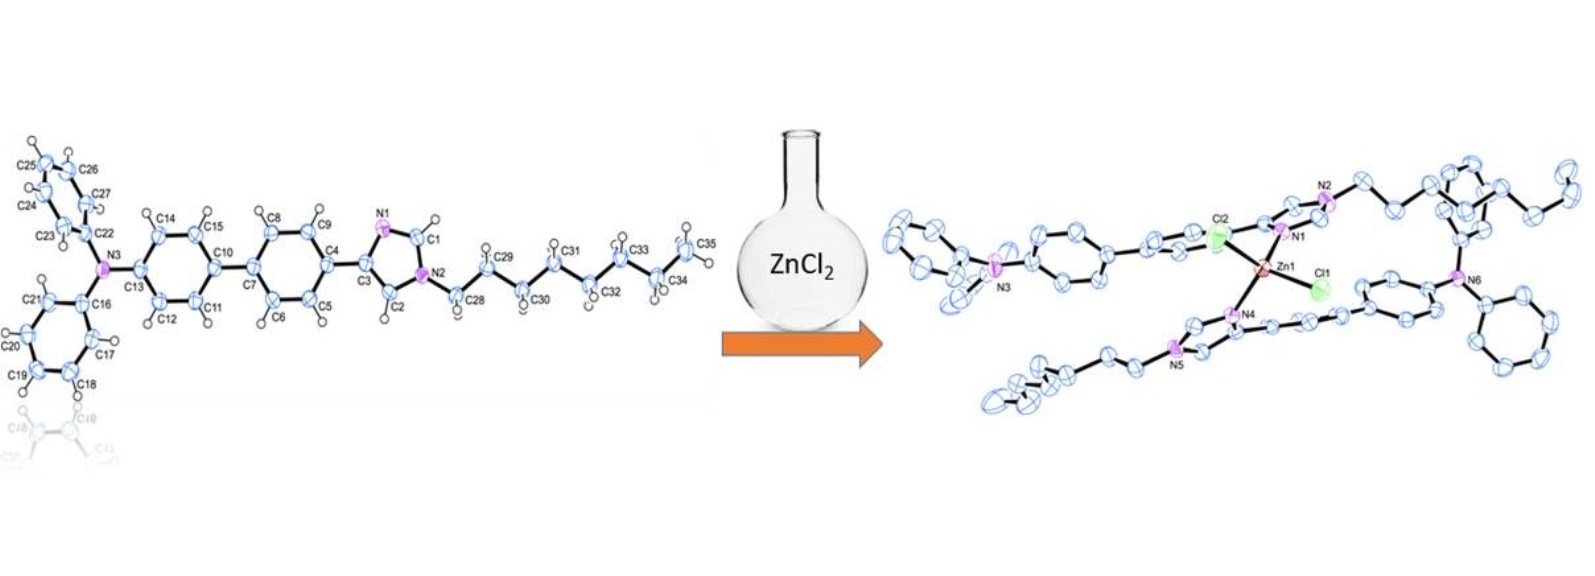
2.4. Structural Characterization by Single Crystal X-ray Diffraction of the Free Ligands ImL1 and ImL2 as Well as and the Corresponding Zn (II) Complex ZnCl2(ImL1)2
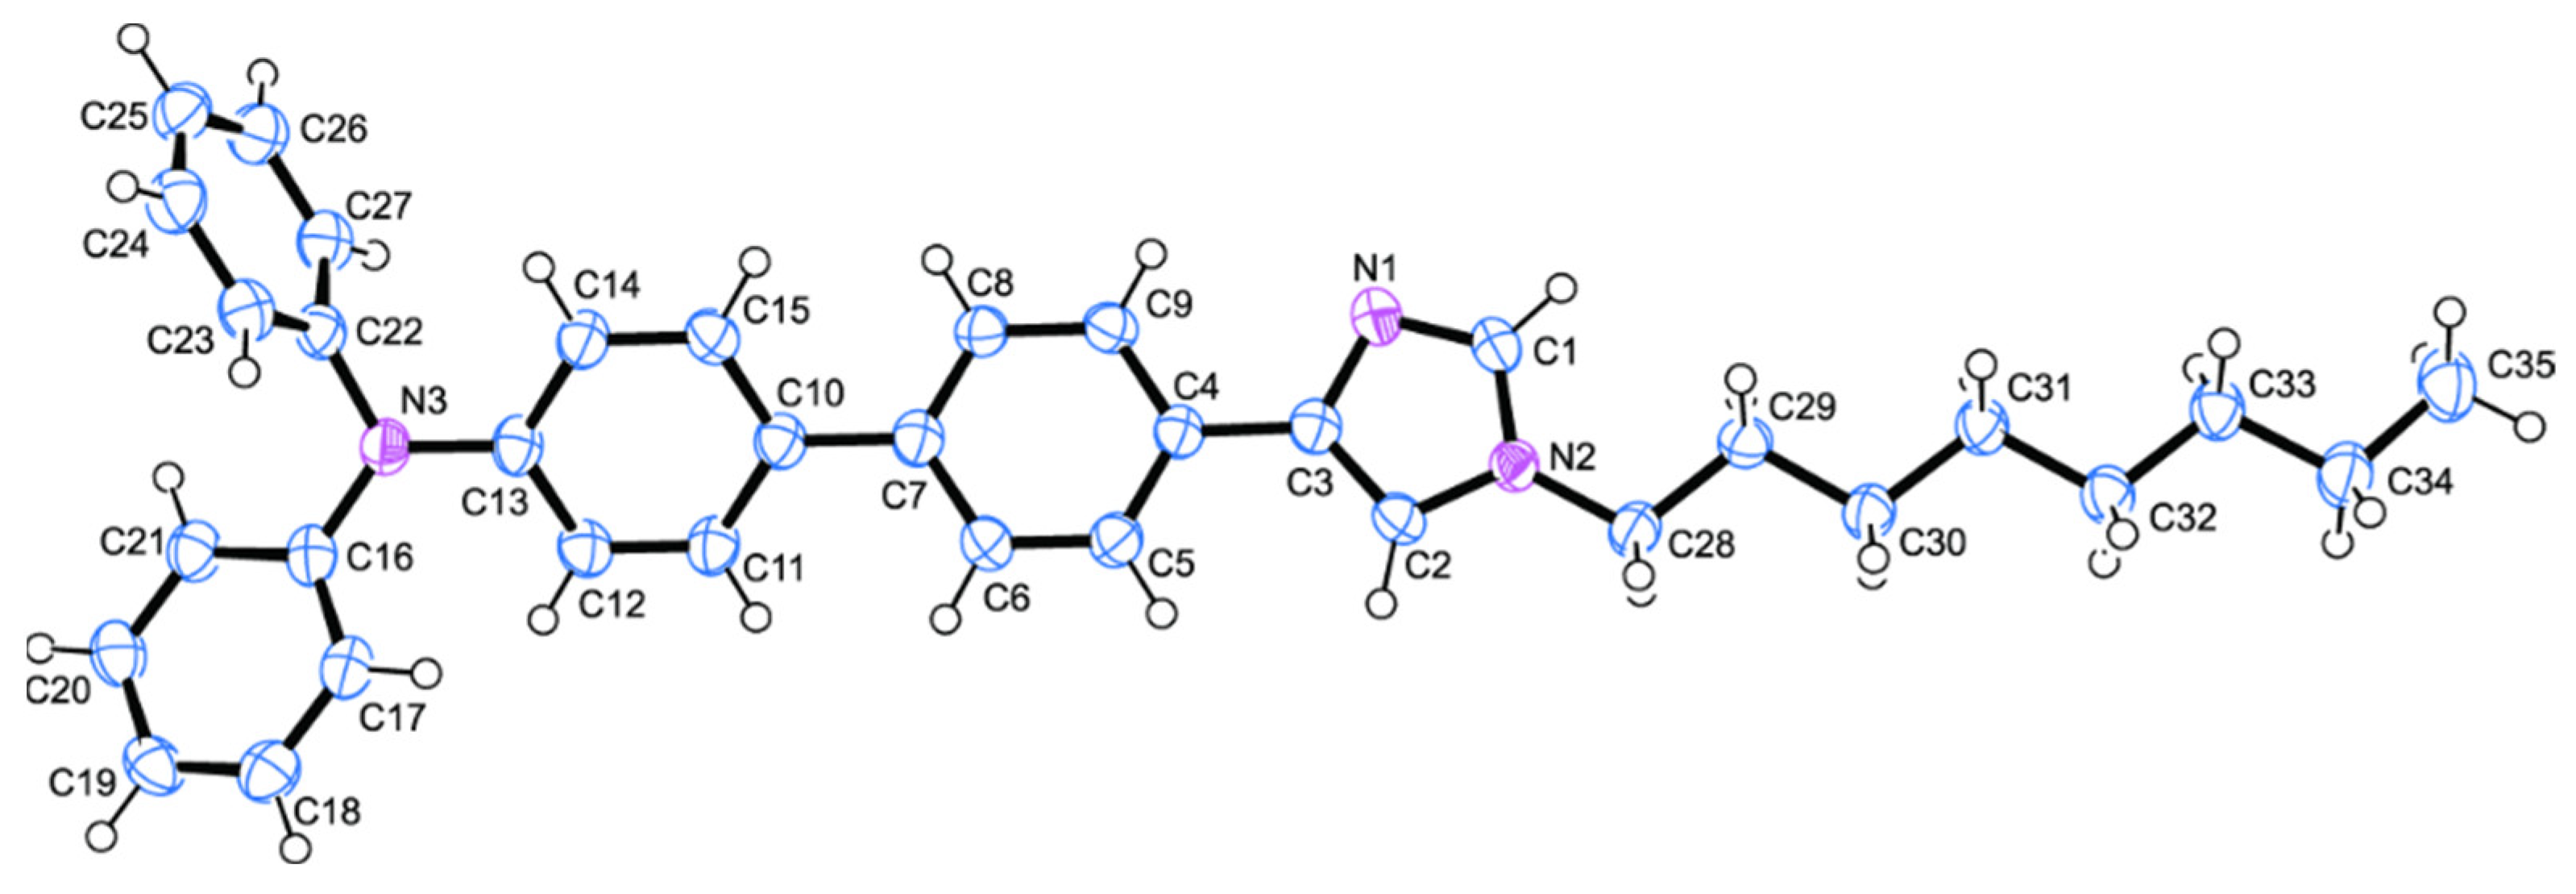
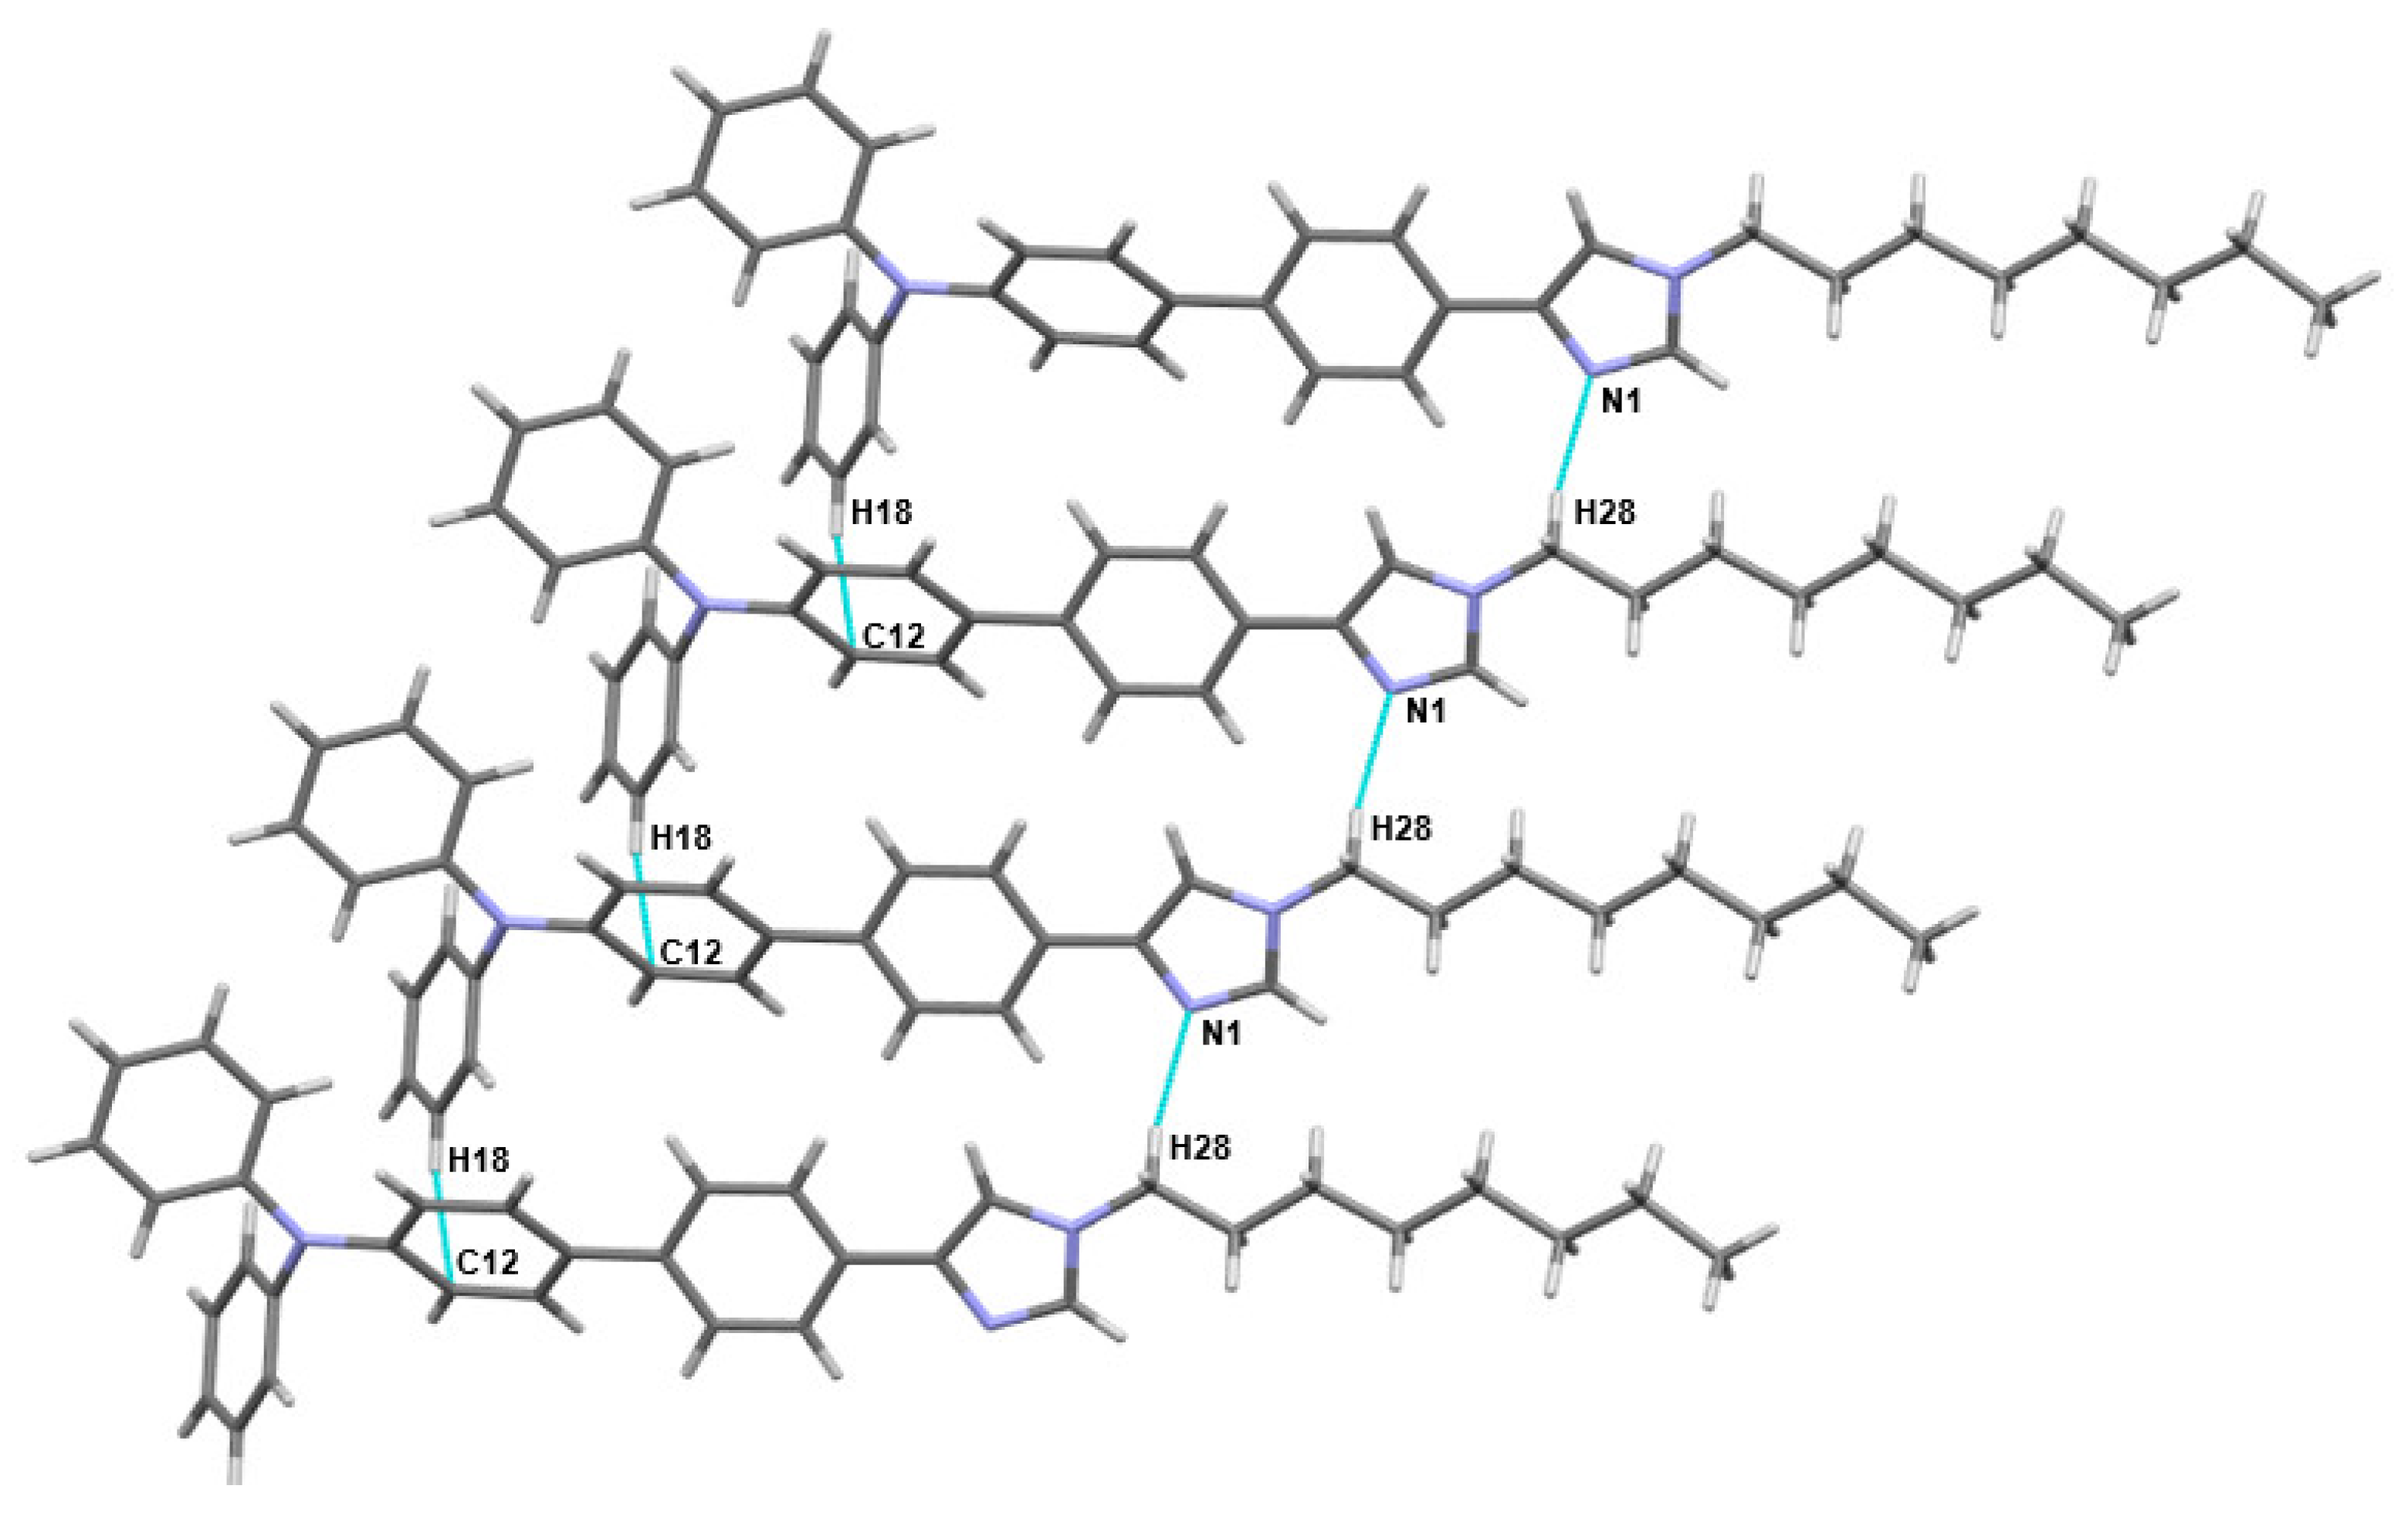
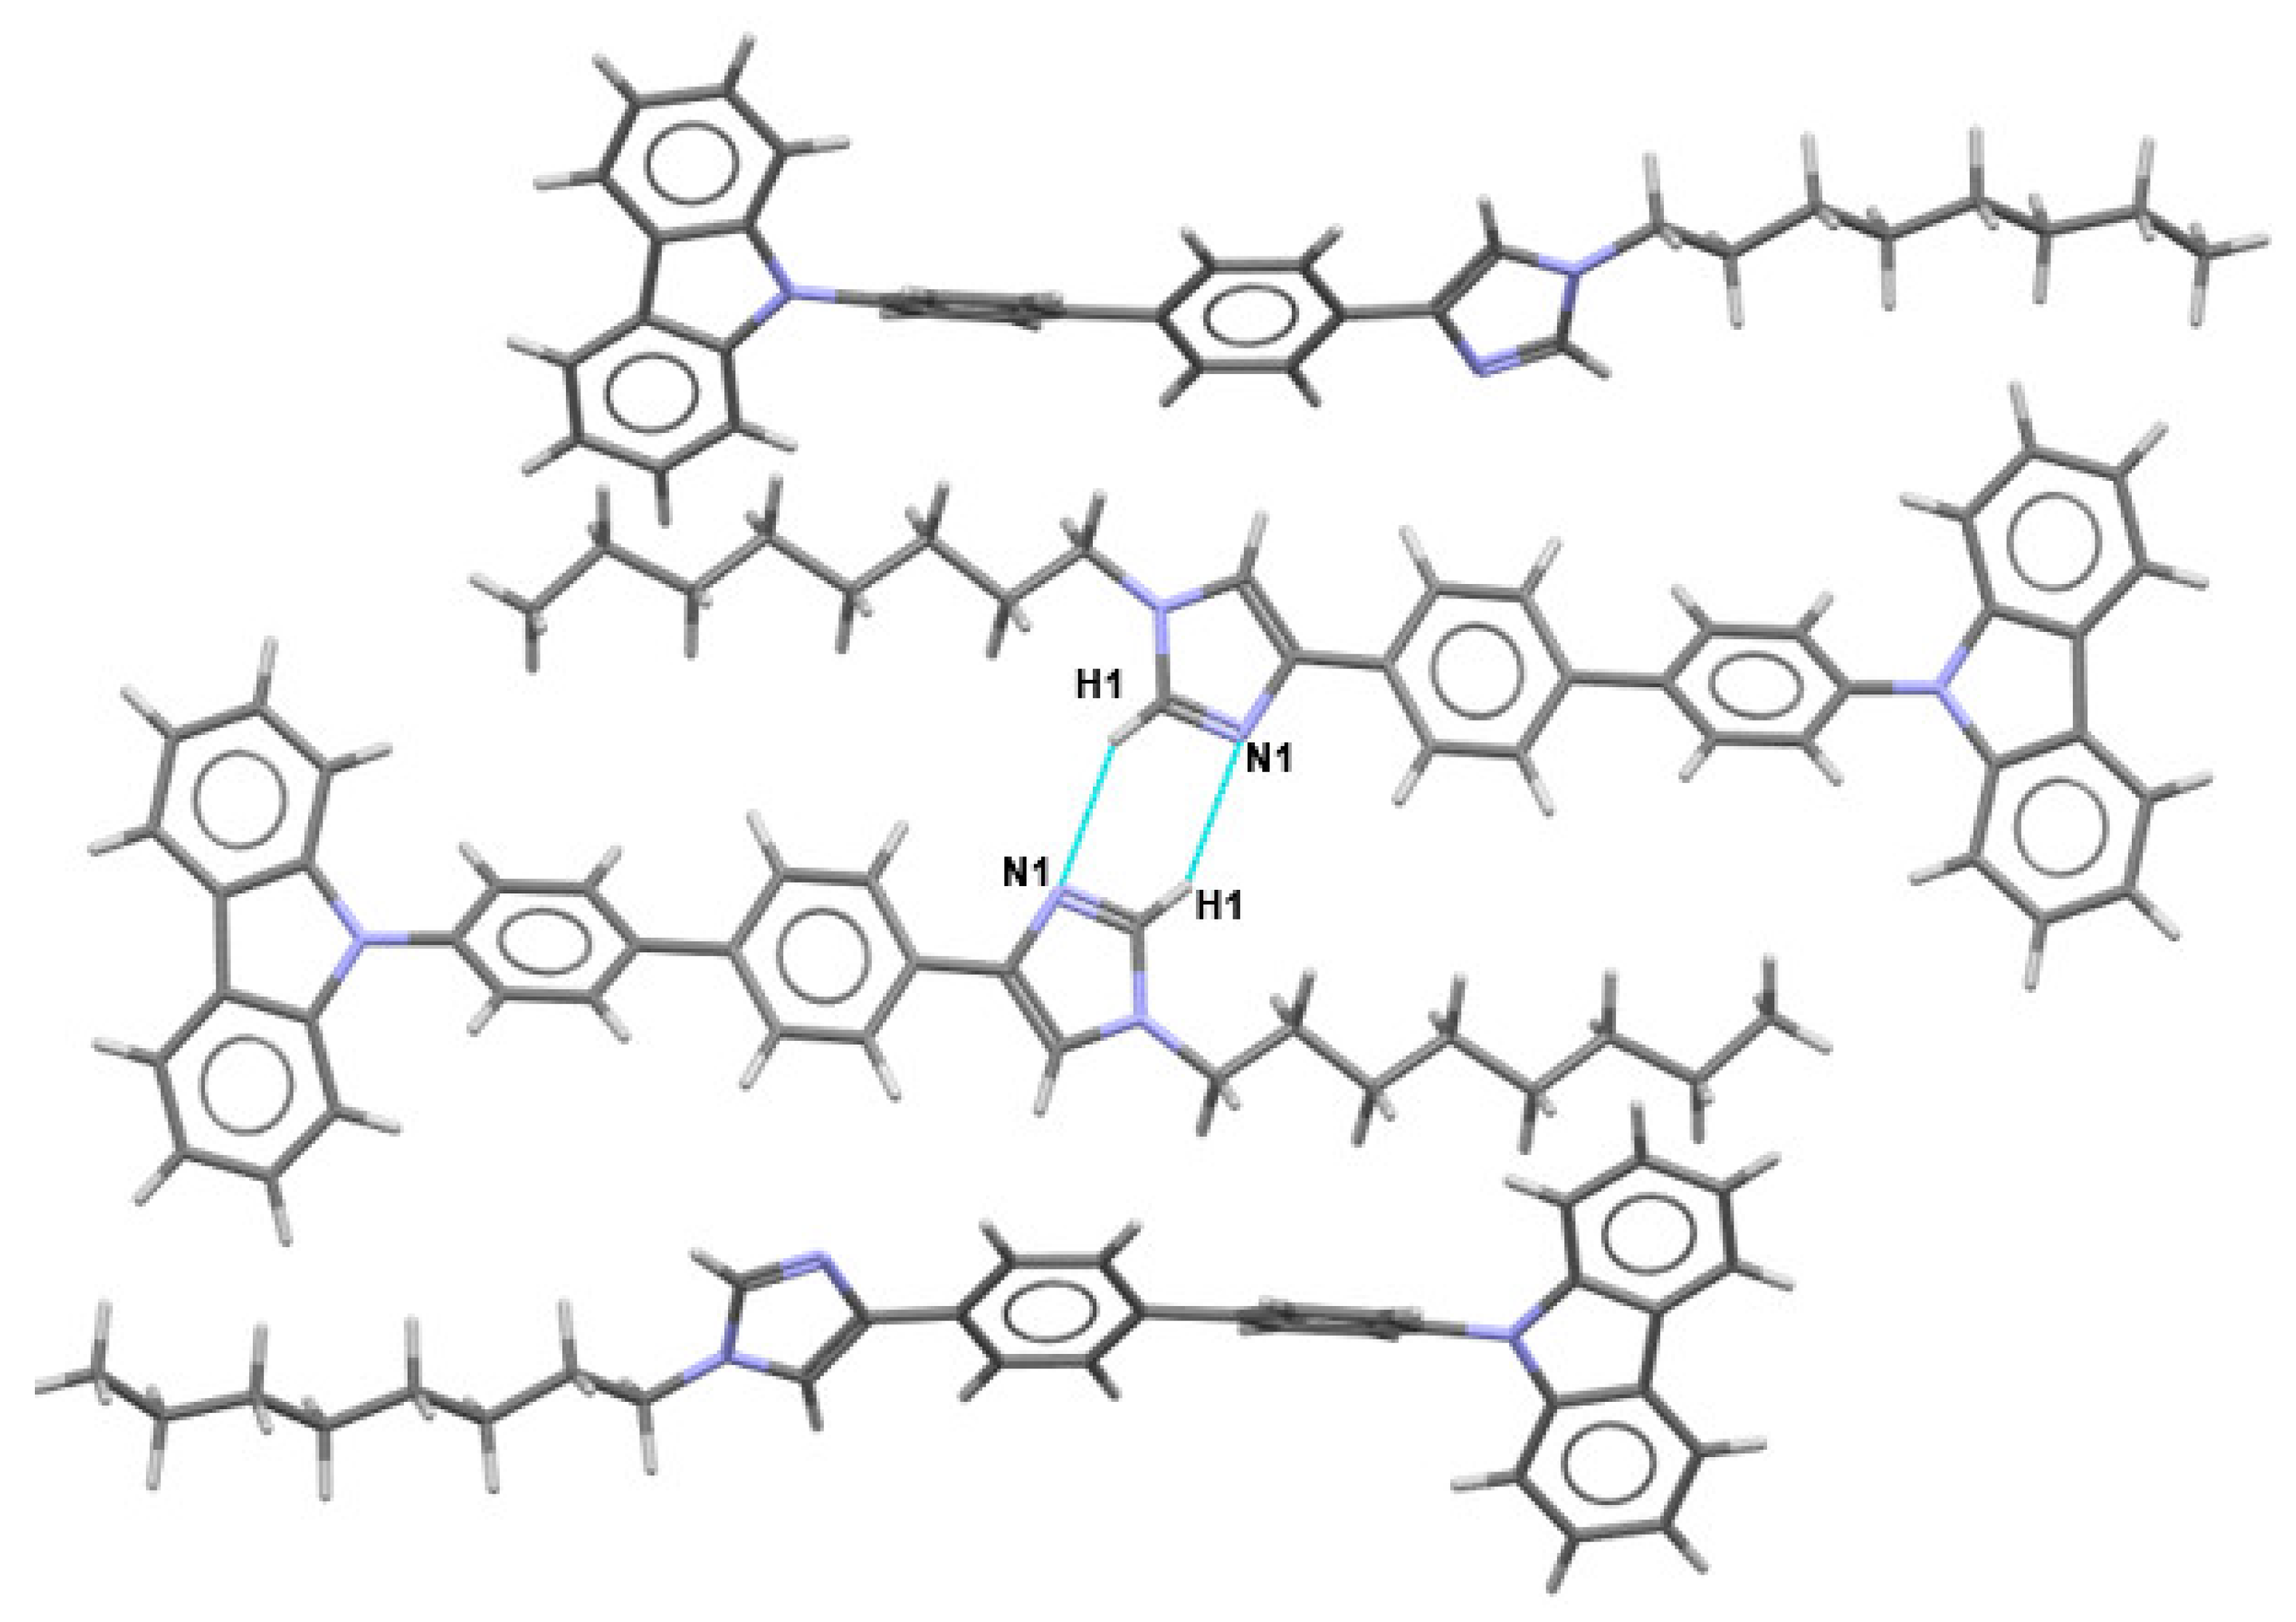
2.4.1. Description of the X-ray Crystal Structures the Free Ligands ImL1 and ImL2
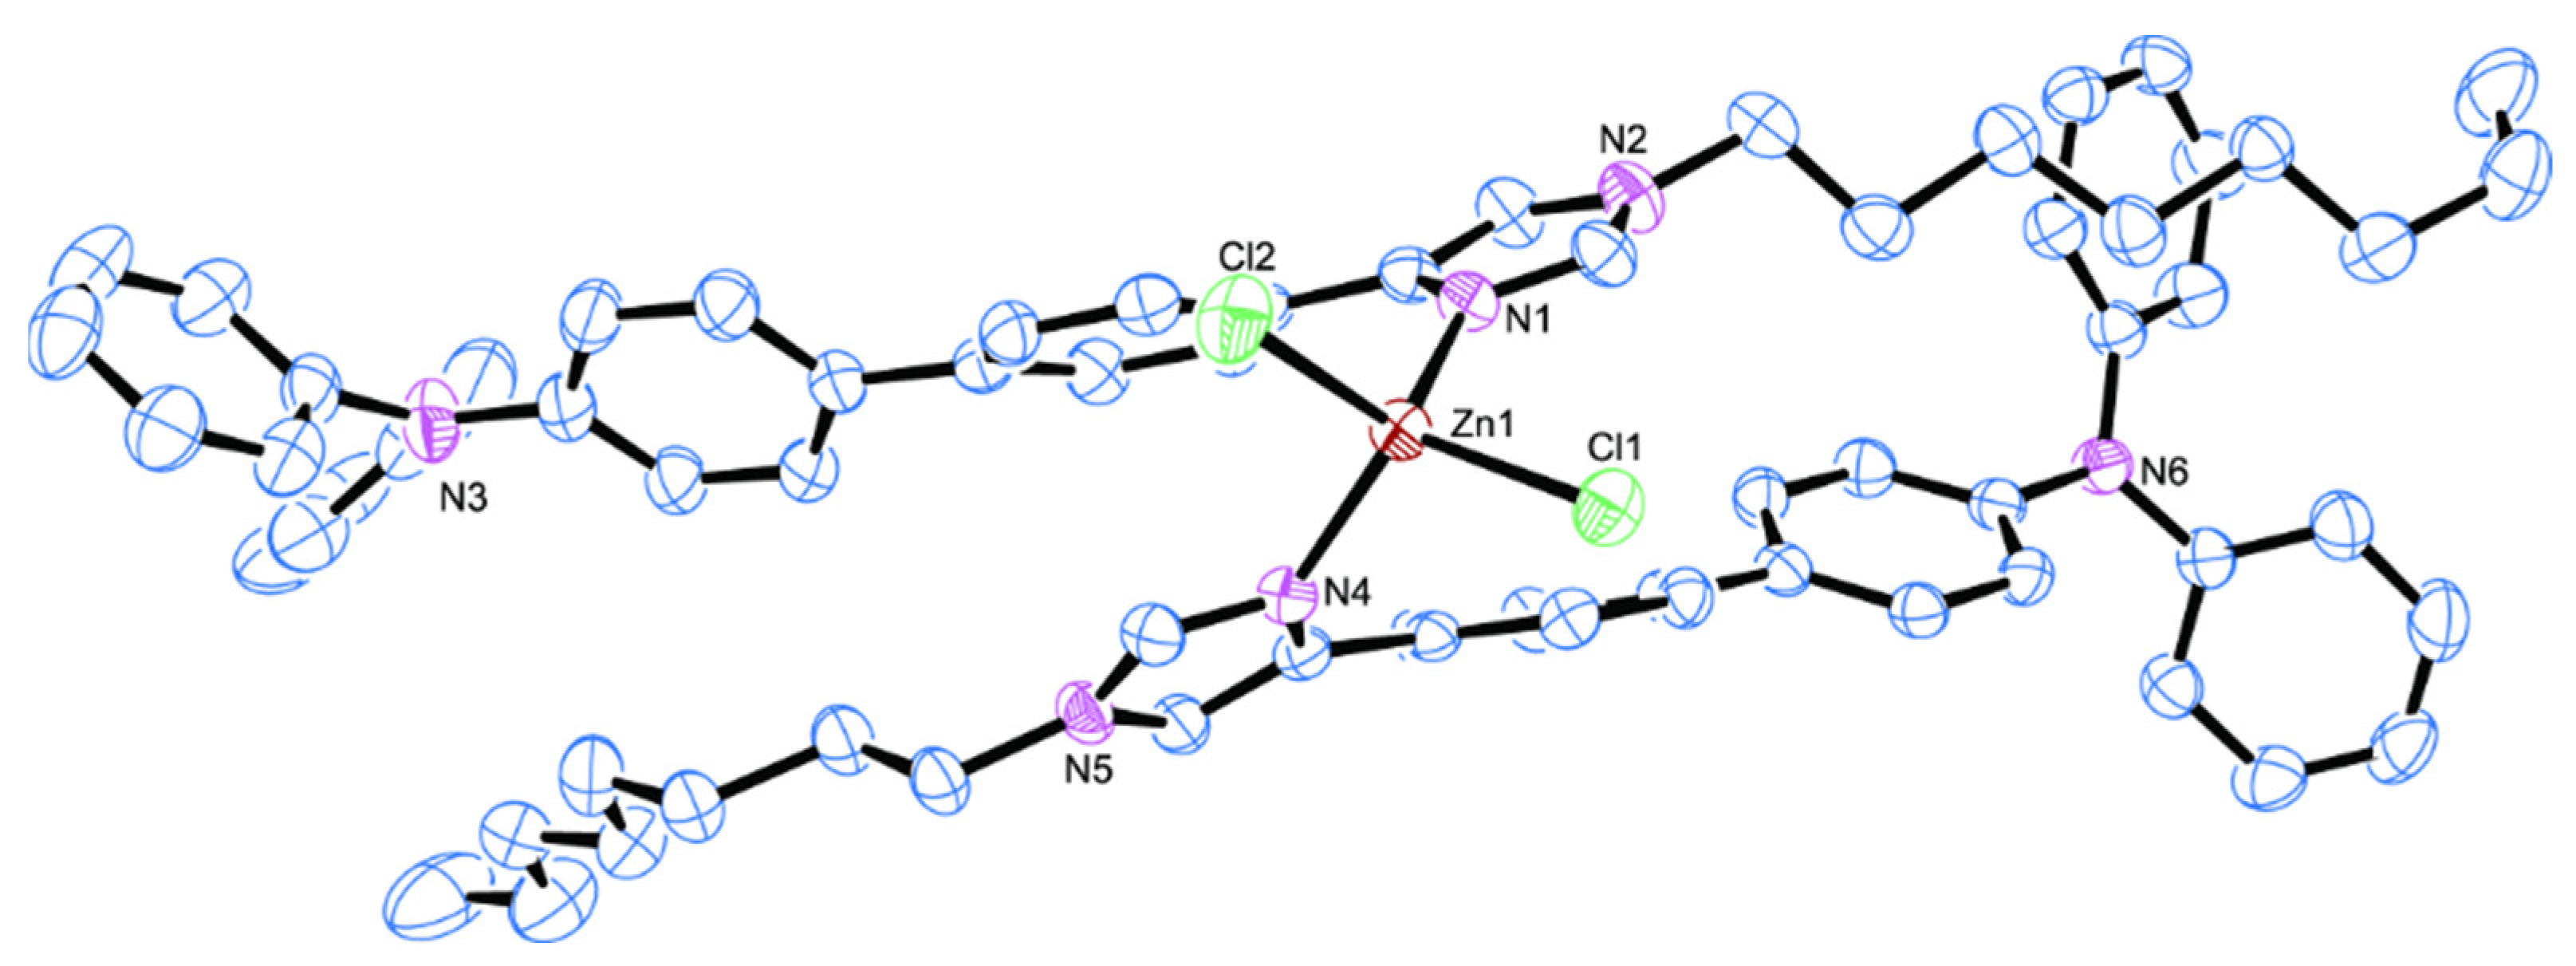
2.4.2. Description of the X-ray Crystal Structure of Crystal ZnCl2(ImL1)2 Complex
2.5. Photophysical Studies
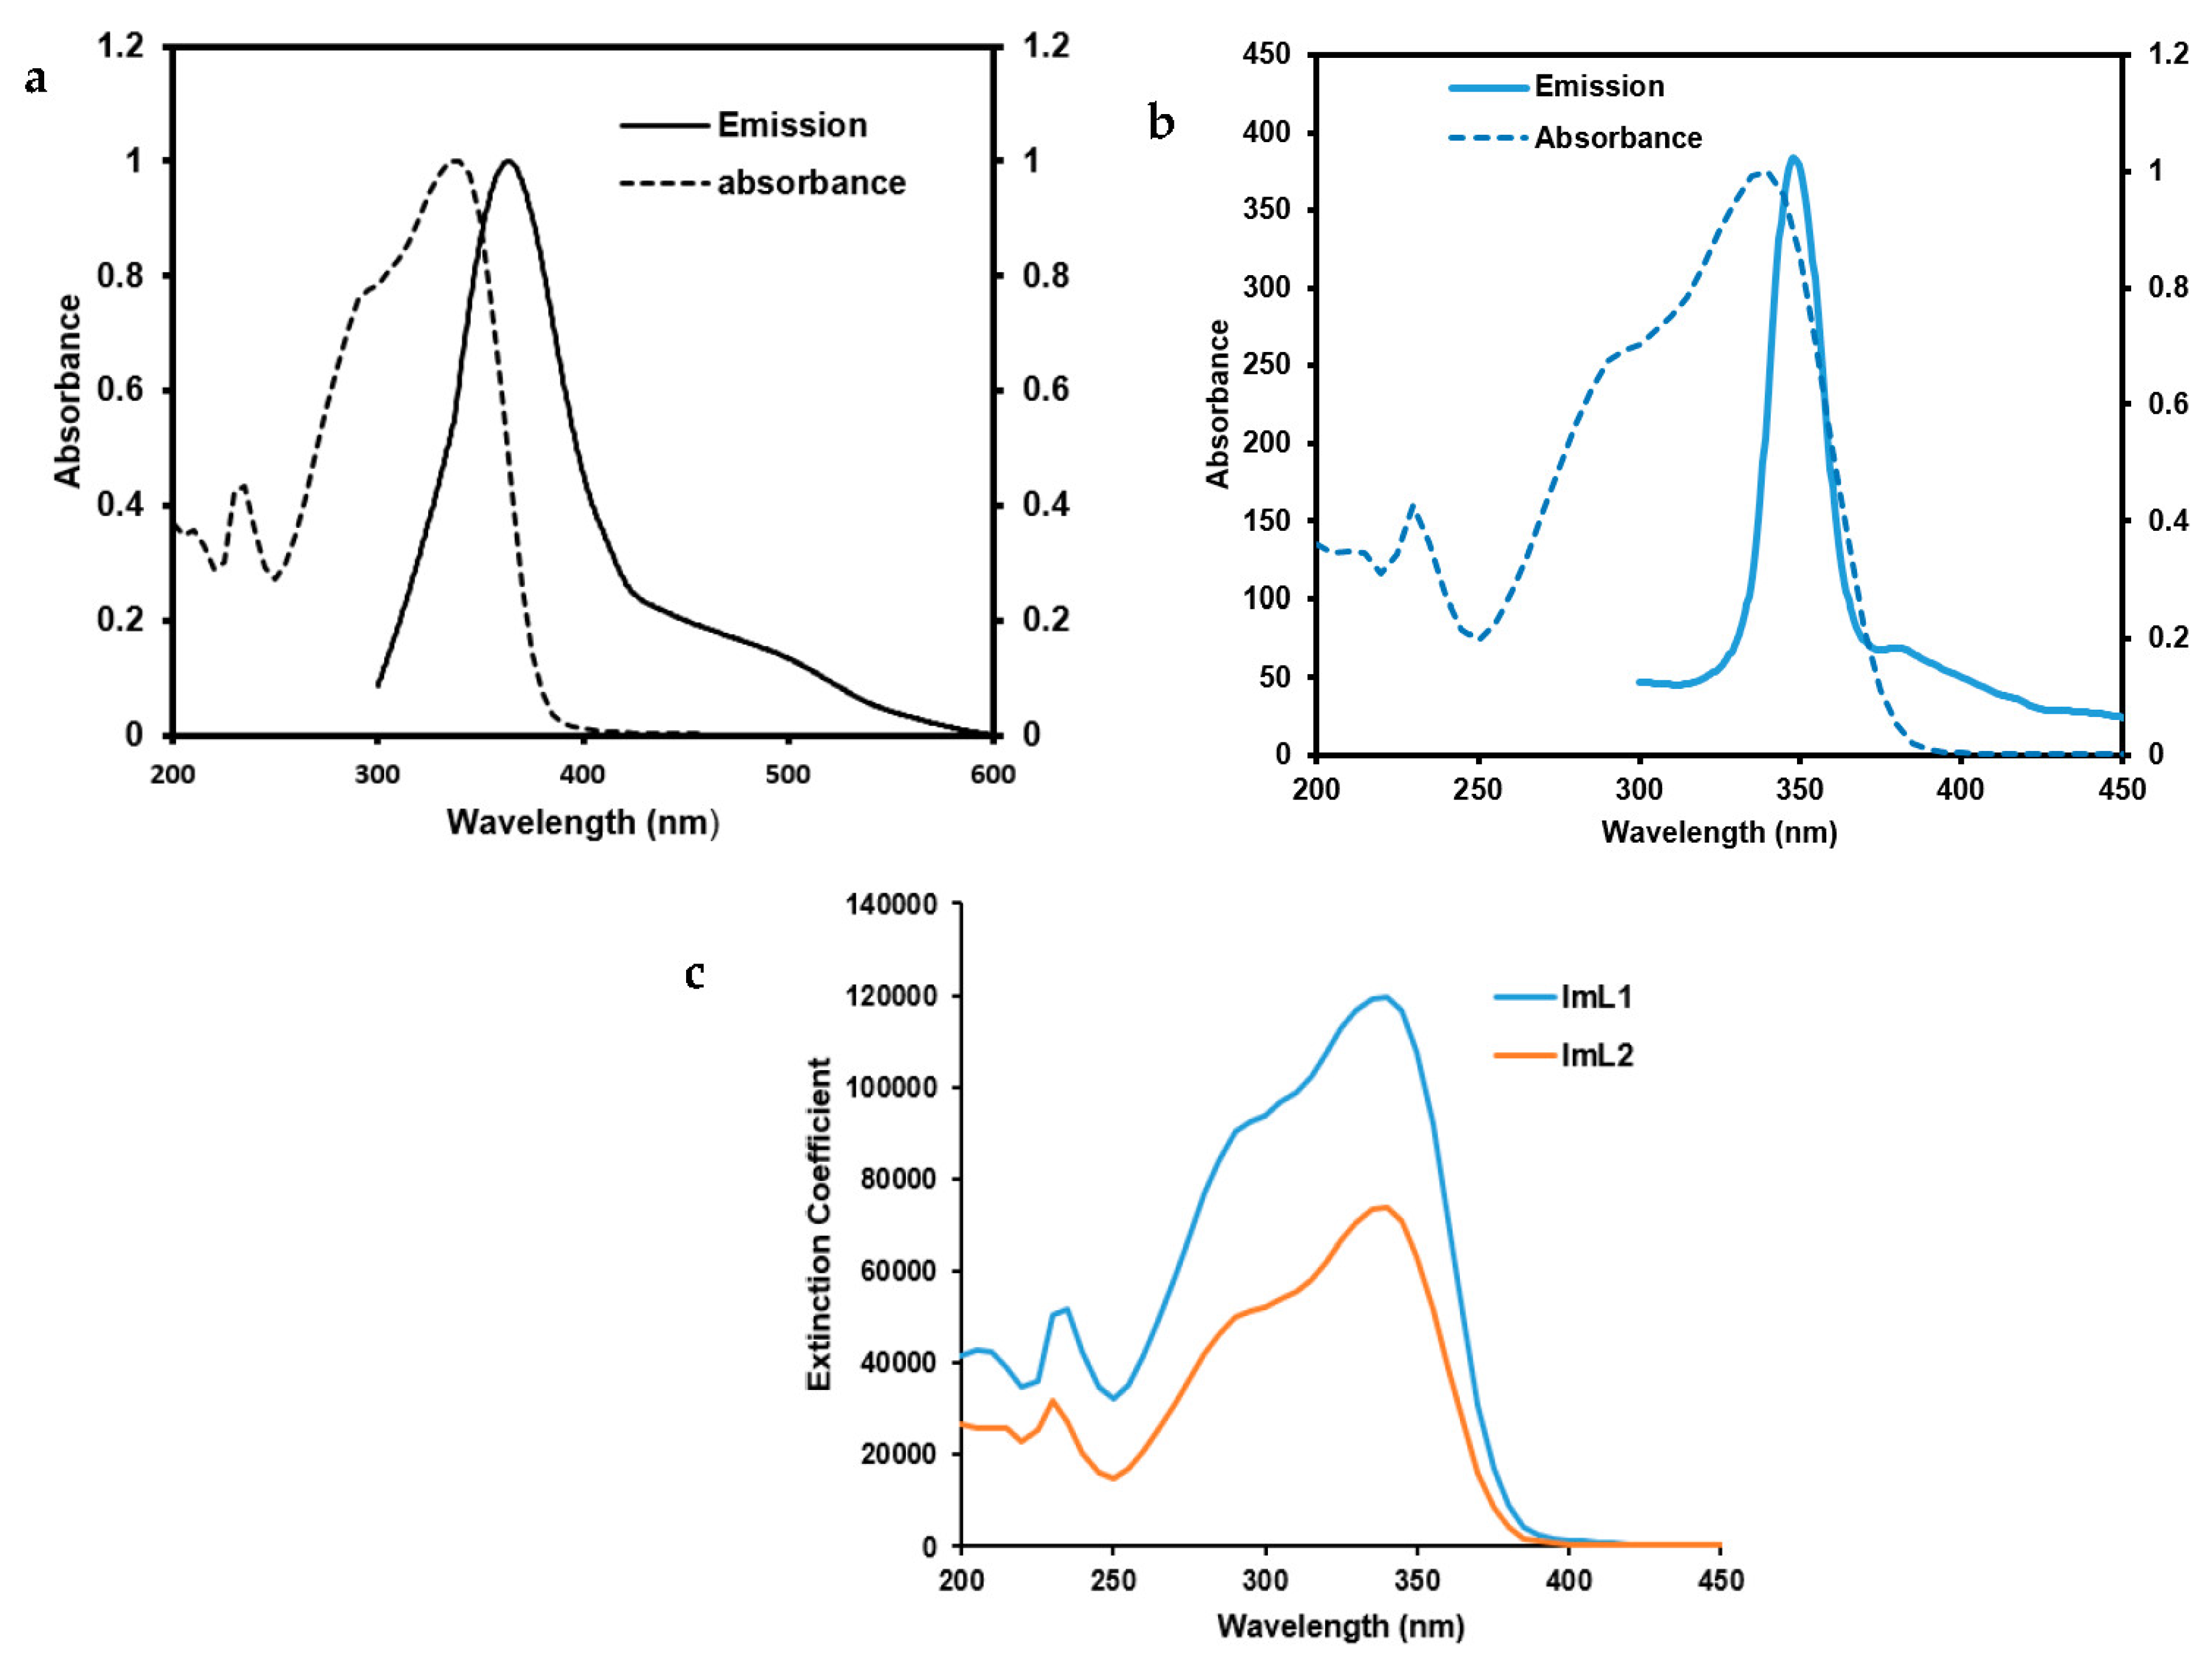
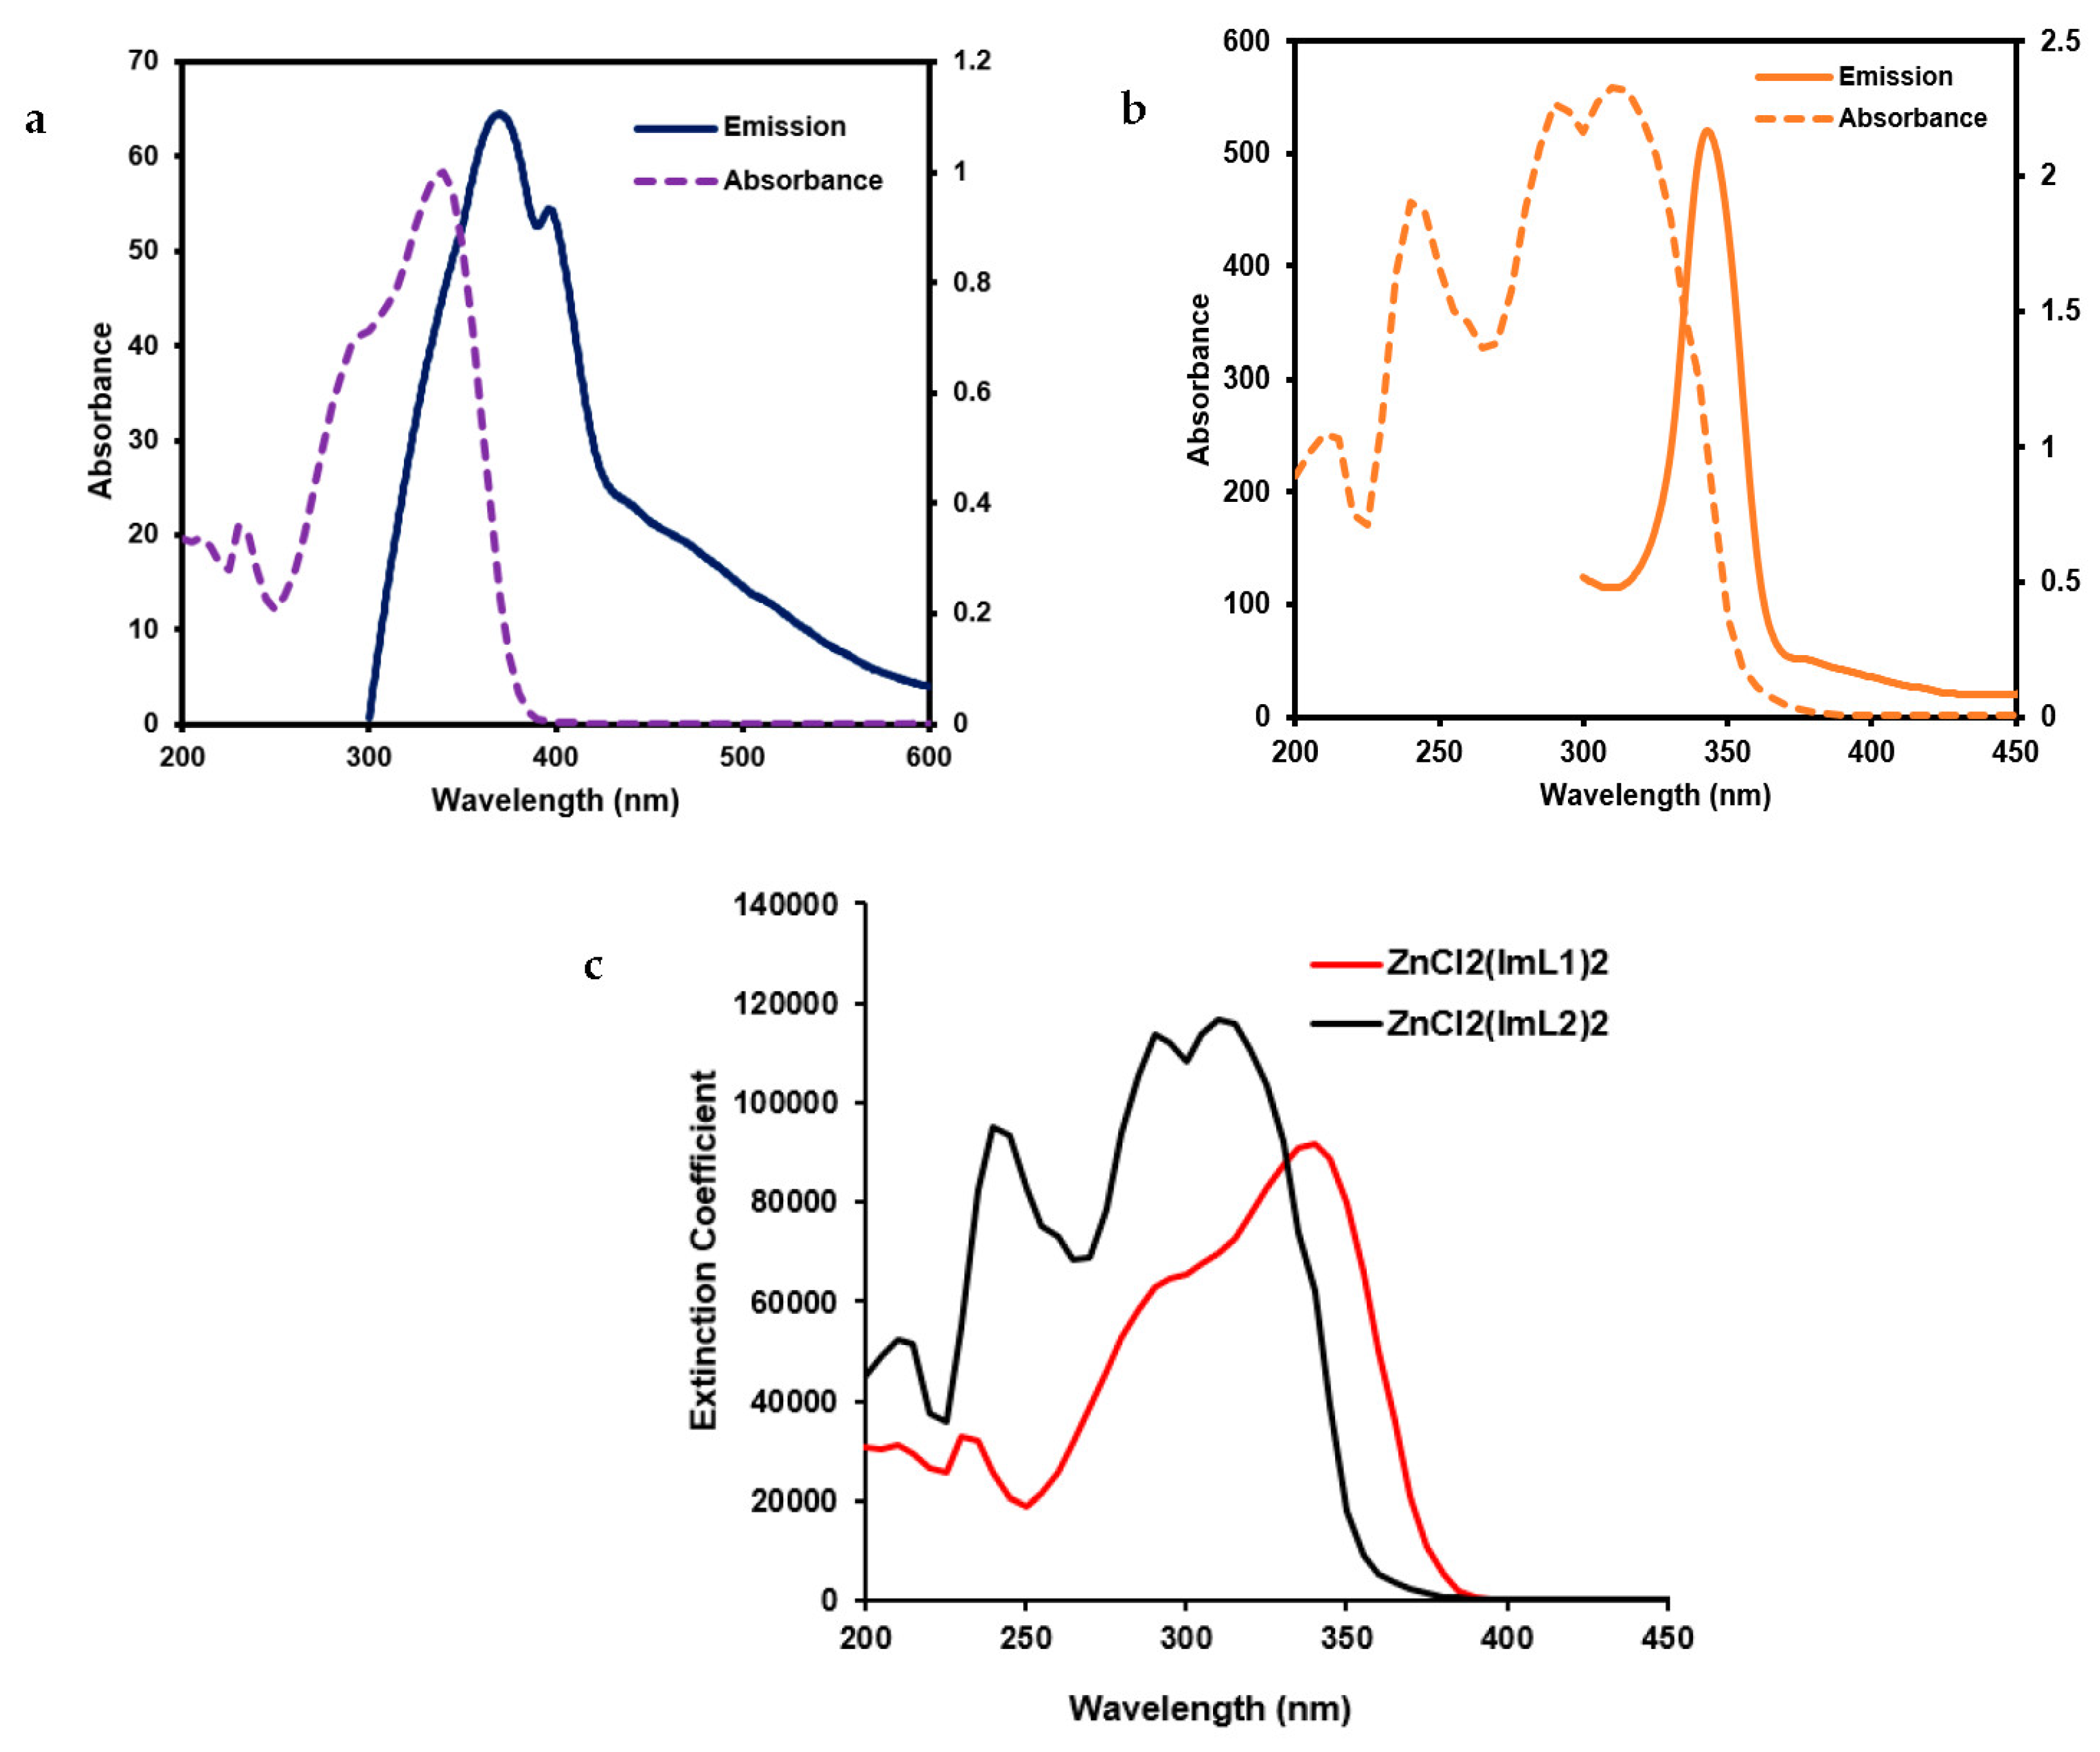
UV-Visible Absorption Studies of the Free Ligands ImL1 and ImL2 as and Their Corresponding Zn (II) Complexes ZnCl2(ImL1)2
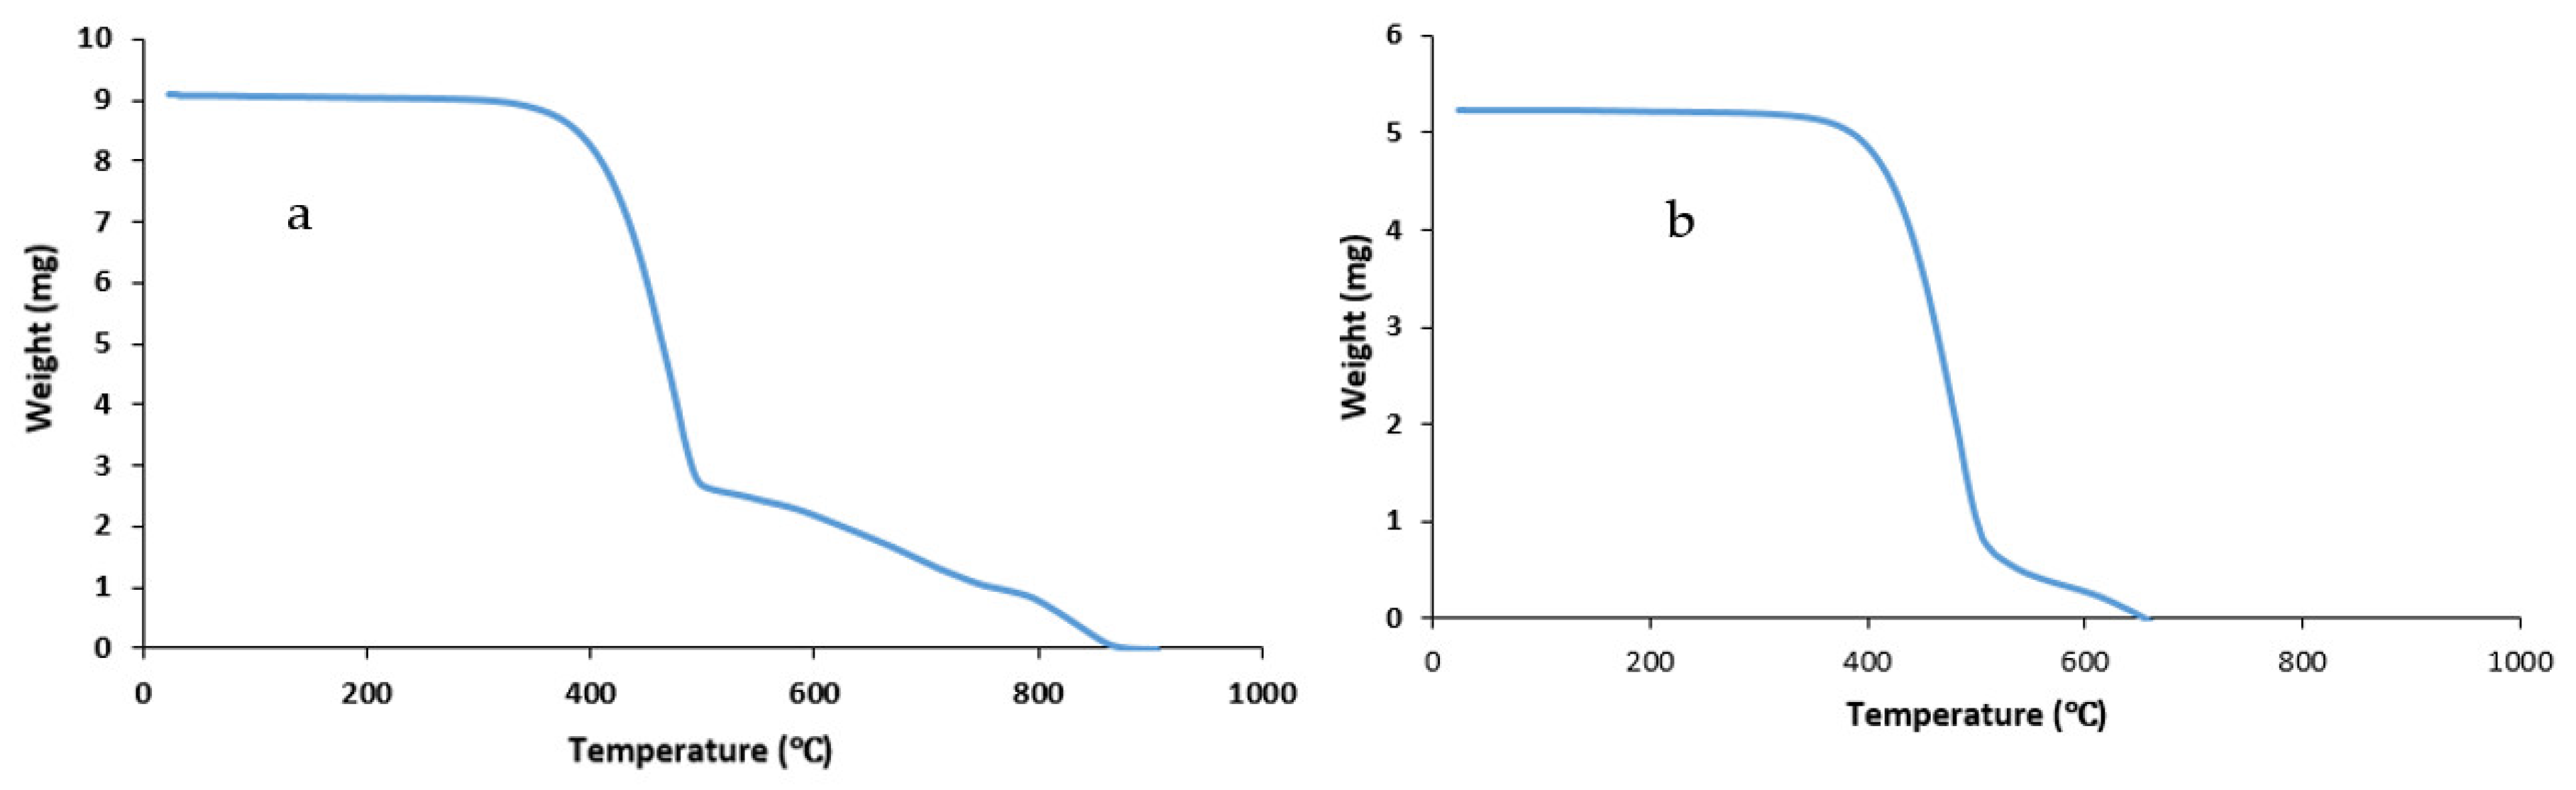
2.6. Thermal Stability Studies
3. Materials and Methods
3.1. General Methods
3.2. Synthesis of the Free Ligands
3.2.1. Synthesis of 4-(4-Bromophenyl)-1-Octyl-1H-Imidazole 3
3.2.2. Synthesis of 4′-(1-Octyl-1H-Imidazol-4-yl)-N,N-Diphenyl-[1,1′-Biphenyl]-4-yl)-4-Amine ImL1
3.2.3. Synthesis of 9-(4′-(1-Octyl-1H-Imidazol-4-yl)-[1,1′-Biphenyl]-4-yl)-9H-Carbazole ImL2
3.3. Preparation Zinc Complexes
3.3.1. Synthesis of ZnCl2(ImL1)2 Complex
3.3.2. Synthesis of ZnCl2(ImL2)2 Complex
4. Conclusions
Supplementary Materials
Author Contributions
Funding
Institutional Review Board Statement
Informed Consent Statement
Data Availability Statement
Acknowledgments
Conflicts of Interest
References
- Krucaite, G.; Grigalevicius, S. A review on low-molar-mass carbazole-based derivatives for organic light-emitting diodes. Synth. Met. 2019, 247, 90–108. [Google Scholar] [CrossRef]
- Kempegowda, R.M.; Malavalli, M.K.; Malimath, G.H.; Naik, L.; Manjappa, K.B. Synthesis and photophysical properties of multi-functional bisimidazolyl phenol zinc (II) complex: Application in OLED, anti-Counterfeiting, and latent fingerprint detection. Chem. Sel. 2021, 6, 3033–3039. [Google Scholar] [CrossRef]
- Kim, J.; Koh, C.W.; Uddin, M.A.; Ryu, K.Y.; Jang, S.R.; Woo, H.Y.; Lim, B.; Kim, K. Improving the photostability of small-molecule-based organic photovoltaics by providing a charge percolation pathway of crystalline conjugated polymer. Polymers 2020, 12, 2598. [Google Scholar] [CrossRef]
- Roncali, J.; Leriche, P.; Blanchard, P. Molecular materials for organic photovoltaics: Small is beautiful. Adv. Mater. 2014, 26, 3821–3838. [Google Scholar] [CrossRef] [PubMed] [Green Version]
- Zou, S.-J.; Shen, Y.; Xie, F.; Chen, J.-D.; Li, Y.; Tang, J.-X. Recent advances in organic light-emitting diodes: Toward smart lighting and displays. Chem. Front. 2020, 4, 788–820. [Google Scholar] [CrossRef]
- Chakraborty, P.; Adhikary, J.; Samanta, S.; Majumder, I.; Massera, C.; Escudero, D.; Ghosh, S.; Bauza, A.; Frontera, A.; Das, D. Influence of para substituents in controlling photophysical behavior and different non-covalent weak interactions in zinc complexes of a phenol-based “end-off” compartmental ligand. Dalton Trans. 2015, 44, 20032–20044. [Google Scholar] [CrossRef]
- Dong, Y.-W.; Fan, R.-Q.; Wang, X.-M.; Wang, P.; Zhang, H.-J.; Wei, L.-G.; Chen, W.; Yang, Y.-L. (E)-N-(pyridine-2-ylmethylene)arylamine as an assembling ligand for Zn (II)/Cd (II) Complexes: Aryl substitution and anion effects on the dimensionality and luminescence properties of the supramolecular metal-organic frameworks. Growth Des. 2016, 16, 3366–3378. [Google Scholar] [CrossRef]
- Minei, P.; Fanizza, E.; Rodrıguez, A.M.; Munoz-Garcıa, A.B.; Cimino, P.; Pavone, M.; Pucci, A. Cost-effective solar concentrators based on the red fluorescent Zn (II)-salicylaldiminato complex. RSC Adv. 2016, 6, 17474–17482. [Google Scholar] [CrossRef] [Green Version]
- Volpi, G.; Priola, E.; Garino, C.; Daolio, A.; Rabezzana, R.; Benzi, P.; Giordanaa, A.; Dianaa, E.; Gobetto, R. Blue fluorescent zinc (II) complexes based on tunable imidazo[1,5-a]pyridines. Inorg. Chim. Acta 2020, 509, 119662. [Google Scholar] [CrossRef]
- Fudulu, A.; Olar, R.; Maxim, C.; Scăeţeanu, G.V.; Bleotu, C.; Matei, L.; Chifiriuc, M.C.; Badea, M. New cobalt (II) complexes with imidazole derivatives: Antimicrobial efficiency against planktonic and adherent microbes and in vitro cytotoxicity features. Molecules 2020, 26, 55. [Google Scholar] [CrossRef] [PubMed]
- Gałczyńska, K.; Ciepluch, K.; Madej, Ł.; Madej, Ł.; Kurdziel, K.; Maciejewska, B.; Drulis-Kawa, Z.; Arabski, M.; Węgierek-Ciuk, A.; Lankof, A. Selective cytotoxicity and antifungal properties of copper (II) and cobalt (II) complexes with imidazole-4-acetate anion or 1-allylimidazole. Sci. Rep. 2019, 9, 9777. [Google Scholar] [CrossRef] [PubMed] [Green Version]
- Bete, S.C.; Würtele, C.; Otte, M. A bio-inspired imidazole-functionalised copper cage complex. Chem. Commun. 2019, 55, 4427–4430. [Google Scholar] [CrossRef] [Green Version]
- An, Y.; Li, X.-F.; Zhang, Y.-L.; Yin, Y.-S.; Sun, J.-J.; Tong, S.-F.; Yang, H.; Yang, S.-P. Structure regulation of nickel (II) complexes with imidazole-tripodal ligand by altering the counteranions and the reaction conditions. Chem. Commun. 2013, 38, 39–142. [Google Scholar] [CrossRef]
- Ye, S.; Zhuang, S.; Pan, B.; Guo, R.; Wang, L. Imidazole derivatives for efficient organic light-emitting diodes. Inf. Disp. 2020, 21, 173–196. [Google Scholar] [CrossRef]
- Bezvikonnyi, O.; Bernard, R.S.; Andruleviciene, V.; Volyniuk, D.; Keruckiee, R.; Vaiciulaityte, K.; Labanauskas, L.; Grazulevicius, J.V. Derivatives of imidazole and carbazole as bifunctional materials for organic light-emitting diodes. Materials 2022, 15, 8495. [Google Scholar] [CrossRef] [PubMed]
- Yu, P.; Xiao, X. Non-doped deep-blue OLEDs based on carbazole-π-imidazole derivative. Materials 2021, 14, 2349. [Google Scholar] [CrossRef]
- Tagare, J.; Hong, W.P. Recent progress in imidazole based efficient near ultraviolet/blue hybridized local charge transfer (HLCT) characteristic fluorophores for organic light-emitting diodes. Mater. Chem. C 2022, 10, 16173–16217. [Google Scholar] [CrossRef]
- Liu, Y.; Man, X.; Bai, Q.; Liu, H.; Liu, P.; Fu, Y.; Hu, D.; Lu, P.; Ma, Y. Highly Efficient Blue Organic Light-Emitting Diode Based on a Pyrene[4,5-d]Imidazole-Pyrene Molecule. CCS Chem. 2021, 3, 545–558. [Google Scholar] [CrossRef]
- Chen, W.-C.; Zhu, Z.-L.; Lee, C.-S. Organic light-emitting diodes based on imidazole semiconductors. Opt. Mater. 2018, 6, 1800258. [Google Scholar] [CrossRef]
- Labulo, A.H.; Omondi, B.; Nyamori, V.O. Synthesis, crystal structures, and electrochemical properties of ferrocenyl imidazole derivatives. Heliyon 2019, 5, e02580. [Google Scholar] [CrossRef] [Green Version]
- Hariharan, A.; Kumar, S.; Alagar, M.; Dinakaran, K.; Subramanian, K. Synthesis, photophysical, and electrochemical properties of polyimides of tetraaryl imidazole. Polym. Bull. 2018, 75, 93–107. [Google Scholar] [CrossRef]
- Bai, W.; Hu, Z.; Lu, Y.; Xiao, G.; Zhao, H.; Zhub, J.; Liu, Z. Solubility, thermal, and photoluminescence properties of triphenyl imidazole-containing polyimides. RSC Adv. 2021, 11, 23802–23814. [Google Scholar] [CrossRef] [PubMed]
- Eseola, A.O.; Li, W.; Sun, W.-H.; Zhang, M.; Xiao, L.; Woods, J.A.O. Luminescent properties of some imidazole and oxazole based heterocycles: Synthesis, structure, and substituent effects. Dyes Pigments 2011, 88, 262–273. [Google Scholar] [CrossRef]
- Rashamuse, T.J.; Mohlala, R.L.; Coyanis, E.M.; Magwa, N.P. A review: Blue fluorescent Zinc (II) complexes for OLEDs—A last five-year recap. Molecules 2023, 28, 5272. [Google Scholar] [CrossRef]
- Haas, K.L.; Franz, K.J. Application of metal coordination chemistry to explore and manipulate cell biology. Chem. Rev. 2009, 109, 4921–4960. [Google Scholar] [CrossRef] [PubMed] [Green Version]
- Yam, V.W.-W.; Au, V.K.M.; Leung, S.Y.-L. Light-Emitting self-assembled materials based on d8 and d10 transition metal complexes. Chem. Rev. 2015, 115, 7589–7728. [Google Scholar] [CrossRef] [PubMed]
- Gusev, A.N.; Kiskin, M.A.; Braga, E.V.; Chapran, M.; Wiosna-Salyga, G.; Baryshnikov, G.V.; Minaeva, V.A.; Minaev, B.F.; Ivaniuk, K.; Stakhira, P.; et al. A novel zinc complex with an ethylenediamine Schiff base for high-luminance blue fluorescent OLED applications. Phys. Chem. C 2019, 123, 11850–11859. [Google Scholar] [CrossRef]
- Solanki, J.D.; Siddiqui, I.; Gautam, P.; Gupta, V.K.; Jou, J.-H.; Surat, K.R. Blue fluorescent zinc (II) complexes bearing Schiff base ligand for solution-processed organic light-emitting diodes with CIEy ≤ 0.09. Opt. Mater. 2022, 134, 113222. [Google Scholar] [CrossRef]
- Gusev, A.N.; Kiskin, M.A.; Braga, E.V.; Kryukova, M.A.; Baryshnikov, G.V.; Karaush-Karmazin, N.N.; Minaeva, V.A.; Minaev, B.F.; Ivaniuk, K.; Stakhira, P.; et al. Schiff base zinc (II) complexes as promising emitters for blue organic light-emitting diodes. ACS Appl. Electron. Mater. 2021, 3, 3436–3444. [Google Scholar] [CrossRef]
- Xu, B.; Sheibani, E.; Liu, P.; Zhang, J.; Tian, H.; Vlachopoulos, N.; Boschloo, G.; Kloo, L.; Hagfeldt, A.; Sun, L. Carbazole-based hole-transport materials for efficient solid-state dye-sensitized solar cells and perovskite solar cells. Adv. Mater. 2014, 26, 6629–6634. [Google Scholar] [CrossRef]
- Magaldi, D.; Ulfa, M.; Péralta, S.; Goubard, F.; Pauporté, S.; Bui, T.-T. Carbazole-based material: Synthesis, characterization, and application as hole transporting material in perovskite solar cells. J. Mater. Sci. Mater. Electron. 2021, 32, 12856–12861. [Google Scholar] [CrossRef]
- Tiazkis, R.; Paek, S.; Daskeviciene, M.; Malinauskas, T.; Saliba, M.; Nekrasovas, J.; Jankauskas, V.; Ahmad, S.; Getautis, V.; Nazeeruddin, M.K. Methoxydiphenylamine-substituted fluorene derivatives as hole transporting materials: Role of molecular interaction on device photovoltaic performance. Sci. Rep. 2017, 7, 150. [Google Scholar] [CrossRef] [PubMed]
- Magomedov, A.; Paek, S.; Gratia, P.; Kasparavicius, E.; Daskeviciene, M.; Kamarauskas, E.; Gruodis, A.; Jankauskas, V.; Kantminiene, K.; Cho, K.T.; et al. Diphenylamine-substituted carbazole-based hole transporting materials for perovskite solar cells: Influence of isomeric derivatives. Funct. Mater. 2018, 28, 1704351. [Google Scholar] [CrossRef]
- Cias, P.; Slugovc, C.; Gescheidt, G. Hole transport in triphenylamine based OLED devices: From theoretical modeling to properties prediction. Phys. Chem. A 2011, 115, 14519–14525. [Google Scholar] [CrossRef] [PubMed]
- Rezaei, F.; Mohajeri, A. Molecular designing of triphenylamine-based hole-transporting materials for perovskite solar cells. Sol. Energy 2021, 221, 536–544. [Google Scholar] [CrossRef]
- Yen, Y.-S.; Ni, J.-S.; Lin, T.-Y.; Hung, W.-I.; Lin, J.T.; Yeh, M.-C.P. Imidazole-based sensitizers containing double anchors for dye-sensitized solar cells. J. Org. Chem. 2015, 33, 7367–7377. [Google Scholar] [CrossRef]
- Allen, J.D.W.; Adlema, K.; Heeney, M. The synthesis and application of novel benzodithiophene based reactive mesogens with negative wavelength dispersion birefringence. Mater. Chem. C 2021, 9, 17419–17426. [Google Scholar] [CrossRef]
- Quick, A.; Williams, D.J. The crystal structure of the complex salt imidazole imidazolium Perchlorate. Can. J. Chem. 1979, 54, 2465. [Google Scholar] [CrossRef]
- Nimmermark, A.; Öhrström, L.; Reedijk, J. Metal-ligand bond lengths and strengths: Are they correlated? A detailed CSD analysis. Z. Kristallogr. 2013, 228, 311–317. [Google Scholar] [CrossRef] [Green Version]
- Mroué, K.H.; Power, W.P. High-Field Solid-State 67Zn NMR Spectroscopy of Several Zinc−Amino Acid Complexes. Phys. Chem. 2010, A114, 324–335. [Google Scholar] [CrossRef]
- Musie, G.T.; Li, X.; Powell, D.R. Dichlorobis(1-methylimidazole)zinc(II). Acta Crystallogr. 2004, E60, m471–m472. [Google Scholar] [CrossRef]
- Hobbollahi, E.; Veselkova, B.; List, M.; Redhammer, G.; Monkowius, U. Synthesis, crystal structures, and blue emission of zinc (II) halide complexes of 1-alkyl-imidazole and (−)-nicotine. Naturforsch. B Chem. Sci. 2016, 71, 1269–1277. [Google Scholar] [CrossRef]
- Świderski, G.; Wilczewska, A.Z.; Świsłocka, R.; Lewandowski, W. Spectroscopic (IR, Raman, UV-Vis) study and thermal analysis of 3d-metal complexes with 4-imidazolecarboxylic acid. J. Therm. Anal. Calorim. 2018, 134, 513–525. [Google Scholar] [CrossRef] [Green Version]
- Bernarducci, E.; Bharadwqj, P.K.; Krogh-Jespersen, K.; Potenza, J.A.; Schugar, H.J. Electronic structure of alkylated imidazoles and electronic spectra of tetrakis(imidazole)copper(II) complexes Molecular structure of tetrakis(1,4,5-trimethylimidazole)copper(II) diperchlorate. J. Am. Chem. Soc. 1983, 105, 3860–3866. [Google Scholar] [CrossRef]
- Chen, C.; Yuan, Y.; Wu, G.F.; Wei, H.X.; Ye, J.; Chen, M.; Lu, F.; Tong, Q.X.; Wong, F.L.; Lee, C.S. Molecular modification on bisphenanthroimidazole derivative for deep-blue organic electroluminescent material with ambipolar property and high performance. Org. Electron. 2015, 17, 159. [Google Scholar] [CrossRef]
- Ramírez, C.L.; Mangione, M.I.; Bertolotti, S.G.; Arbeloa, E.M.; Parise, A.R. A photophysical and spectroelectrochemical study on N-phenyl-carbazoles and their oxidized species. Photochem. Photobiol. A Chem. 2018, 365, 199–207. [Google Scholar] [CrossRef] [Green Version]
- Bonesi, S.M.; Erra-Balsells, R. Electron spectroscopy of carbazole and N- and C-substituted carbazoles in homogeneous media and in solid matrix. J. Lumin. 2001, 93, 51–74. [Google Scholar] [CrossRef]
- Tang, S.; Zhang, J. Rational design of organic asymmetric donors D1–A–D2 possessing broad absorption regions and suitable frontier molecular orbitals to match typical acceptors toward solar cells. Phys. Chem. A 2011, 115, 5184–5191. [Google Scholar] [CrossRef]
- Huang, J.; Zhou, N.; Shao, X.; Xun, F.; Zhang, J.; Lin, H. Triphenylamine-styryl-anthracene derivative without thermal fluorescence quenching property for spectrally stable organic/inorganic hybrid light-emitting diodes with no UV residue. Dyes Pigments 2021, 196, 109778. [Google Scholar] [CrossRef]
- Sahoo, P.R.; Kumar, A.; Kumar, A.; Kumar, S. Experimental and computational investigation of polymorphism in methyl 3-hydroxy-4-(piperidin-1-ylmethyl)-2-naphthoate. J. Mol. Struct. 2020, 1219, 128619. [Google Scholar] [CrossRef]
- Gusev, A.N.; Shul’gin, V.F.; Braga, E.V.; Nemec, I.; Minaev, B.F.; Baryshnikov, G.V.; Trávníček, Z.; Ågren, H.; Eremenko, I.L.; Lyssenko, K.A.; et al. Synthesis and photophysical properties of Zn(II) Schiff base complexes possessing strong solvent-dependent solid-state fluorescence. Polyhedron 2018, 155, 202–208. [Google Scholar] [CrossRef]
- Bruker, APEX-3, SAINT+, Version 6.02 (Includes XPREP and SADABS); Bruker AXS Inc.: Madison, WI, USA, 2016.
- Farrugia, L.J. WinGX and ORTEP for Windows: An update. Appl. Crystallogr. 2012, 45, 849–854. [Google Scholar] [CrossRef]
- Sheldrick, G.M. SHELXT-integrated space-group and crystal-structure determination. Acta Cryst. C 2015, 71, 3–8. [Google Scholar] [CrossRef] [PubMed] [Green Version]
- Spek, A.L. Structure validation in chemical crystallography. Acta Cryst. D 2009, 65, 148–155. [Google Scholar] [CrossRef] [PubMed] [Green Version]
- Hasabeldaim, E.H.H.; Swart, H.C.; Kroon, R.E. Luminescence and stability of Tb doped CaF2 nanoparticles. RSC Adv. 2023, 13, 5353–5366. [Google Scholar] [CrossRef] [PubMed]


| ImL1 | ZnCl2(ImL1)2 | ImL2 | ZnCl2(ImL2)2 |
|---|---|---|---|
| 3121w 1 3063w 3032w 2920sh 2 2851sh | 3117w 3060w 3033w 2931sh 2852sh | 3109w 3055w 2924sh 2855sh | 3125w 3044w 2920sh 2851w |
| 1717sh 1612sho 3 1589s 4 1520sho 1481sh 1466sho 1327m 1285m 1265m 1188m 1107w 1072w 941sh | 1588s 1524w 1487s 1473sho 1328sh 1315sho 1272s 1206sh 1076sh 975sh | 1701sh 1624sho 1597sh 1520sh 1516sh 1477s 1450s 1362sho 1335sho 1319sh 1227s 1188sh 1115sh 1069sh 941sh | 1593sh 1524sho 1493sh 1450sh 1362sh 1362sh 1319sh 1227s 1245sh 1119w 1080sh 976sh |
| Ligand ImL1 | Ligand ImL2 | ZnCl2(ImL1)2 Complex | |
|---|---|---|---|
| Empirical Formula | C35H37N3 | C35H35N3 | C70H74Cl2N6Zn |
| Fw/g/mol | 499.67 | 497.66 | 1135.62 |
| T/K | 173(2) | 173(2) | 173(2) |
| Wavelength/Å | 0.71073 | 0.17073 | 0.17073 |
| Crystal size/mm3 | 0.283 × 0.173 × 0.116 | 0.343 × 0.105 × 0.038 | 0.343 × 0.173 × 0.080 |
| Crystal system | Triclinic | Monoclinic | Monoclinic |
| Space group | P-1 | P 21/c | C2 |
| a/Å | 6.0762(8) | 18.4314(13) | 15.126(4) |
| b/Å | 8.7675(12) | 9.1307(7) | 8.9495(19) |
| c/Å | 25.828(3) | 16.3253(10) | 44.620(11) |
| α/° | 81.639(5) | 90 | 90 |
| β/° | 84.848(6) | 101.904(3) | 98.154 |
| γ/° | 86.516(5) | 90 | 90 |
| V/Å [3] | 1354.2(3) | 2688.3(3) | 5979(2) |
| Z | 2 | 4 | 4 |
| Dc/g·cm−3 | 1.225 | 1.230 | 1.262 |
| F(000) | 536 | 1064 | 2400 |
| Theta range for data collection | 2.351 to 25.249° | 2.259 to 25.500°. | 2.306 to 27.999° |
| Completeness to theta = 25.242° | 99.5% | 100.0% | 99.8% |
| Refinement method | Full-matrix least square on F2 | Full-matrix least square on F2 | Full-matrix least square on F2 |
| Data/restraints/parameters | 5029/0/344 | 4999/0/344 | 14,393/1/714 |
| Reflections collected | 22,301 | 110,205 | 110,278 |
| Goodness-of-fit on F2 | 1.083 | 1.077 | 1.045 |
| Independent reflections | 5029 [R(int) = 0.0631] | 4999 [R(int) = 0.1232] | 14,393 [R(int) = 0.0557] |
| R1, wR2 (I > 2σ(I)) | R1 = 0.0809, wR2 = 0.2122 | R1 = 0.0411, wR2 = 0.0941 | R1 = 0.0365, wR2 = 0.0843 |
| R1, wR2 (all data) | R1 = 0.0992, wR2 = 0.2244 | R1 = 0.0685, wR2 = 0.1129 | R1 = 0.0414, wR2 = 0.0866 |
| Large diff. and hole/e.Å−3 | 0.296 and −0.272 | 0.161 and −0.170 | 0.430 and −0.247 |
| Ligand ImL1 | |||
|---|---|---|---|
| Bond Lengths [Å] | Bond Angles [°] | ||
| C(1)-N(1) | 1.328(4) | N(1)-C(1)-N(2) | 112.6(3) |
| C(1)-N(2) | 1.337(4) | N(1)-C(3)-C(4) | 120.9(3 |
| C(2)-N(2) | 1.368(4) | C(2)-C(3)-C(4) | 129.3(3) |
| C(3)-N(1) | 1.384(4) | C(1)-N(1)-C(3) | 104.3(3) |
| C(13)-N(3) | 1.418(4) | C(1)-N(2)-C(2) | 106.9(3) |
| C(16)-N(3) | 1.414(4) | C(1)-N(2)-C(28) | 127.0(3) |
| C(22)-N(3) | 1.434(4 | C(2)-N(2)-C(28) | 126.1(3) |
| C(28)-N(2) | 1.471(4) | C(16)-N(3)-C(13) | 124.7(3) |
| - | - | C(16)-N(3)-C(22) | 116.6(3) |
| - | - | C(13)-N(3)-C(22) | 118.5(3) |
| LigandImL2 | |||
| Bond lengths [Å] | Bond angles [°] | ||
| C(1)-N(1) | 1.318(2) | N(1)-C(1)-N(2) | 112.44(15) |
| C(1)-N(2) | 1.357(2) | N(1)-C(3)-C(4) | 121.39(15) |
| C(2)-N(2) | 1.369(2) | C(2)-C(3)-C(4) | 129.40(15) |
| C(3)-N(1) | 1.386(2) | C(1)-N(1)-C(3) | 105.19(14) |
| C(13)-N(3) | 1.420(2) | C(1)-N(2)-C(2) | 106.25(14) |
| C(16)-N(3) | 1.396(2) | C(1)-N(2)-C(28) | 127.62(14) |
| C(27)-N(3) | 1.398(2) | C(2)-N(2)-C(28) | 126.09(14) |
| C(28)-N(2) | 1.467(2) | C(16)-N(3)-C(13) | 124.71(14) |
| C(16)-N(3)-C(27) | 108.04(13) | ||
| C(13)-N(3)-C(27) | 127.25(14) | ||
| Bond Lengths [Å] | Bond Angles [°] | ||
|---|---|---|---|
| C(1)-N(1) | 1.318(4) | N(1)-C(1)-N(2) | 111.6(3) |
| C(1)-N(2) | 1.336(4) | N(4)-C(36)-N(5) | 111.6(2) |
| C(2)-N(2) | 1.371(4) | C(38)-C(37)-N(5) | 106.5(2) |
| C(3)-N(1) | 1.389(4) | C(37)-C(38)-N(4) | 108.6(2) |
| C(36)-N(4) | 1.319(3) | C(1)-N(1)-C(3) | 105.6(2) |
| C(36)-N(5) | 1.327(4) | C(1)-N(1)-Zn(1) | 120.21(19) |
| C(37)-N(5) | 1.377(4 | C(3)-N(1)-Zn(1) | 132.68(19) |
| C(38)-N(4) | 1.386(3) | C(1)-N(2)-C(2) | 107.2(2) |
| N(1)-Zn(1) | 2.029(2) | C(1)-N(2)-C(28) | 126.5(3) |
| N(4)-Zn(1) | 2.030(2) | C(2)-N(2)-C(28) | 126.2(3) |
| Zn(1)-Cl(1) | 2.2274(8) | C(13)-N(3)-C(16) | 122.2(3) |
| Zn(1)-Cl(2) | 2.2453(8) | C(13)-N(3)-C(22) | 120.0(3) |
| - | - | C(16)-N(3)-C(22) | 117.1(3) |
| - | - | C(36)-N(4)-C(38) | 105.9(2) |
| - | - | C(36)-N(4)-Zn(1) | 120.34(19) |
| - | - | C(38)-N(4)-Zn(1) | 131.11(18) |
| - | - | C(36)-N(5)-C(37) | 107.4(2) |
| - | - | C(36)-N(5)-C(63) | 126.4(2) |
| - | - | C(37)-N(5)-C(63) | 126.1(2) |
| - | - | C(51)-N(6)-C(48) | 119.1(2) |
| - | - | C(51)-N(6)-C(57) | 121.0(2) |
| - | - | C(48)-N(6)-C(57) | 118.2(2) |
| - | - | N(1)-Zn(1)-N(4) | 104.43(9) |
| - | - | N(1)-Zn(1)-Cl(1) | 107.24(7) |
| - | - | N(4)-Zn(1)-Cl(1) | 113.76(7) |
| - | - | N(1)-Zn(1)-Cl(2) | 114.91(7) |
| - | - | N(4)-Zn(1)-Cl(2) | 105.77(7) |
| - | - | Cl(1)-Zn(1)-Cl(2) | 110.74(3) |
| Compounds | UV-Vis Absorption λmax, nm | Molar Extinction Coeffecient (ε = M−1cm−1) | PL Solid | PL in Ethanol Solution | ||||
|---|---|---|---|---|---|---|---|---|
| Λmax 1 (nm) (Excitation) | λmax (nm) (Emission) | Decays Lifetime τ 3 [ns] 4 | CIE coordinates (x,y) | λmax (nm) (Emission) | CIE Coordinates (x,y) | |||
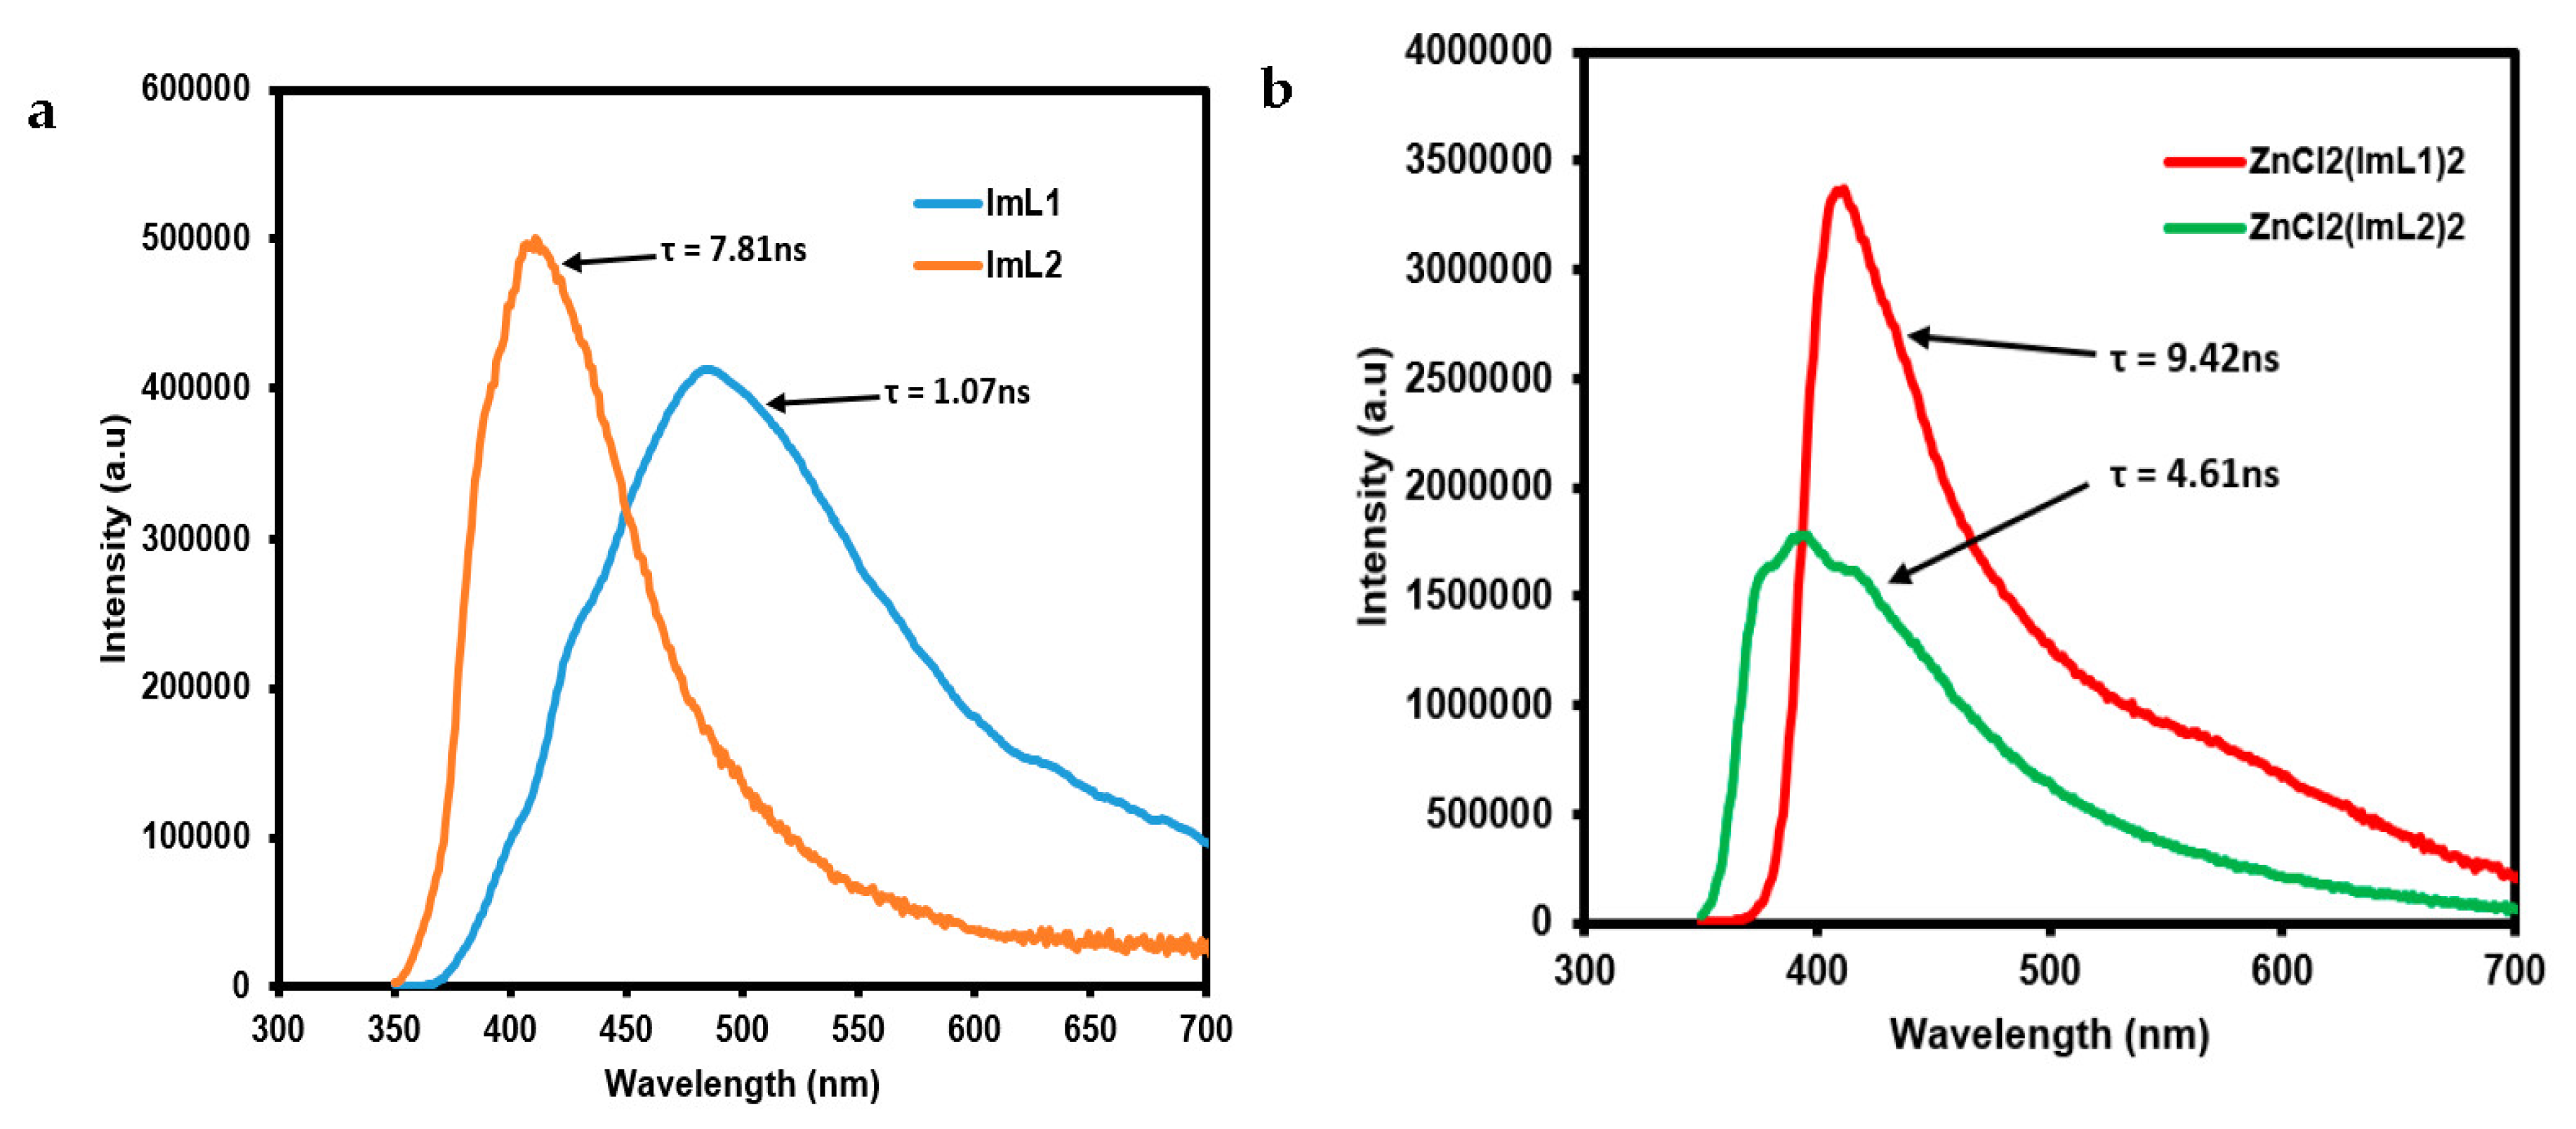
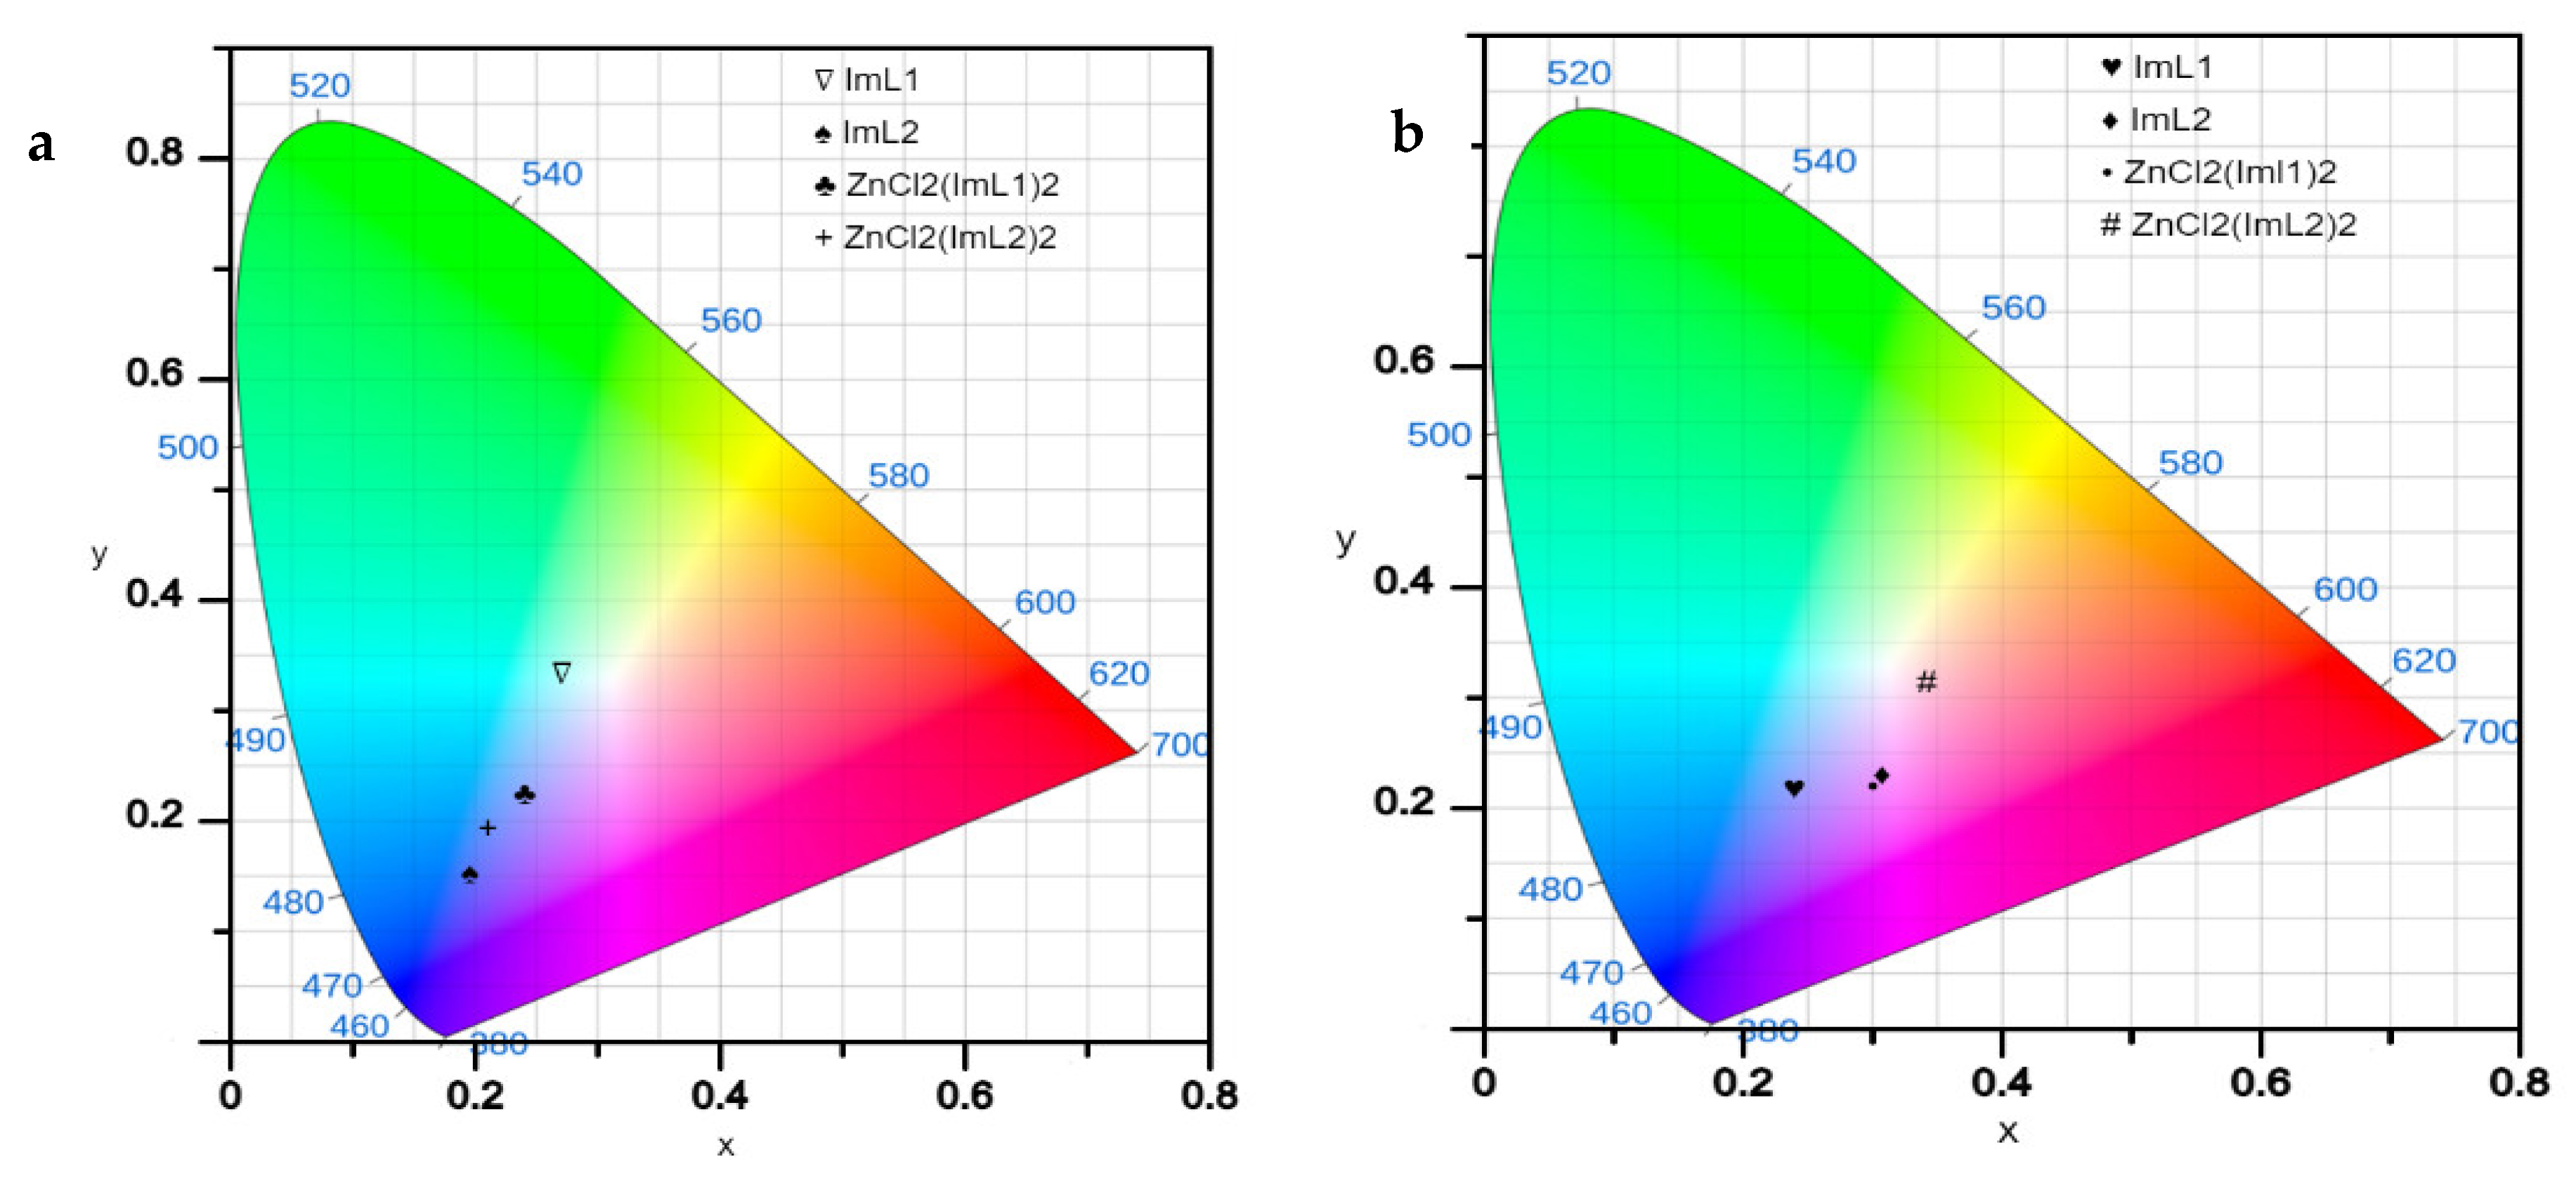
| ImL1 | 210sh 2 230 295sh 340 | 42,400 50,530 92,645 119,415 | 300 | 488 | 1.07 | 0.27, 0.333 | 366 | 0.239. 0.216 |
| ImL2 | 215sh 230 295sh 340 | 25,655 31,660 51,390 73,975 | 300 | 411 | 7.81 | 0.196, 0.152 | 350 | 0.308, 0.23 |
| ZnCl2(ImL1)2 | 210sh 235sh 295 335 | 31,005 31,910 64,610 91,685 | 300 | 410 | 9.42 | 0.239, 0.224 | 372, 399 | 0.303, 0.219 |
| ZnCl2(ImL2)2 | 210 240 260sh 290 315 | 52,480 95,160 72,905 113,490 115,805 | 300 | 395 | 4.61 | 0.21, 0.193 | 345 | 0.342, 03.31 |
Disclaimer/Publisher’s Note: The statements, opinions and data contained in all publications are solely those of the individual author(s) and contributor(s) and not of MDPI and/or the editor(s). MDPI and/or the editor(s) disclaim responsibility for any injury to people or property resulting from any ideas, methods, instructions or products referred to in the content. |
© 2023 by the authors. Licensee MDPI, Basel, Switzerland. This article is an open access article distributed under the terms and conditions of the Creative Commons Attribution (CC BY) license (https://creativecommons.org/licenses/by/4.0/).
Share and Cite
Rashamuse, T.J.; Coyanis, E.M.; Erasmus, R.; Magwa, N.P. Novel Fluorescent Tetrahedral Zinc (II) Complexes Derived from 4-Phenyl-1-octyl-1H-imidazole Fused with Aryl-9H-Carbazole and Triarylamine Donor Units: Synthesis, Crystal Structures, and Photophysical Properties. Int. J. Mol. Sci. 2023, 24, 12260. https://doi.org/10.3390/ijms241512260
Rashamuse TJ, Coyanis EM, Erasmus R, Magwa NP. Novel Fluorescent Tetrahedral Zinc (II) Complexes Derived from 4-Phenyl-1-octyl-1H-imidazole Fused with Aryl-9H-Carbazole and Triarylamine Donor Units: Synthesis, Crystal Structures, and Photophysical Properties. International Journal of Molecular Sciences. 2023; 24(15):12260. https://doi.org/10.3390/ijms241512260
Chicago/Turabian StyleRashamuse, Thompho Jason, Elena Mabel Coyanis, Rudolph Erasmus, and Nomampondo Penelope Magwa. 2023. "Novel Fluorescent Tetrahedral Zinc (II) Complexes Derived from 4-Phenyl-1-octyl-1H-imidazole Fused with Aryl-9H-Carbazole and Triarylamine Donor Units: Synthesis, Crystal Structures, and Photophysical Properties" International Journal of Molecular Sciences 24, no. 15: 12260. https://doi.org/10.3390/ijms241512260