
Adlercreutzia equolifaciens Is an Anti-Inflammatory Commensal Bacterium with Decreased Abundance in Gut Microbiota of Patients with Metabolic Liver Disease
 , , , ,
  and
and 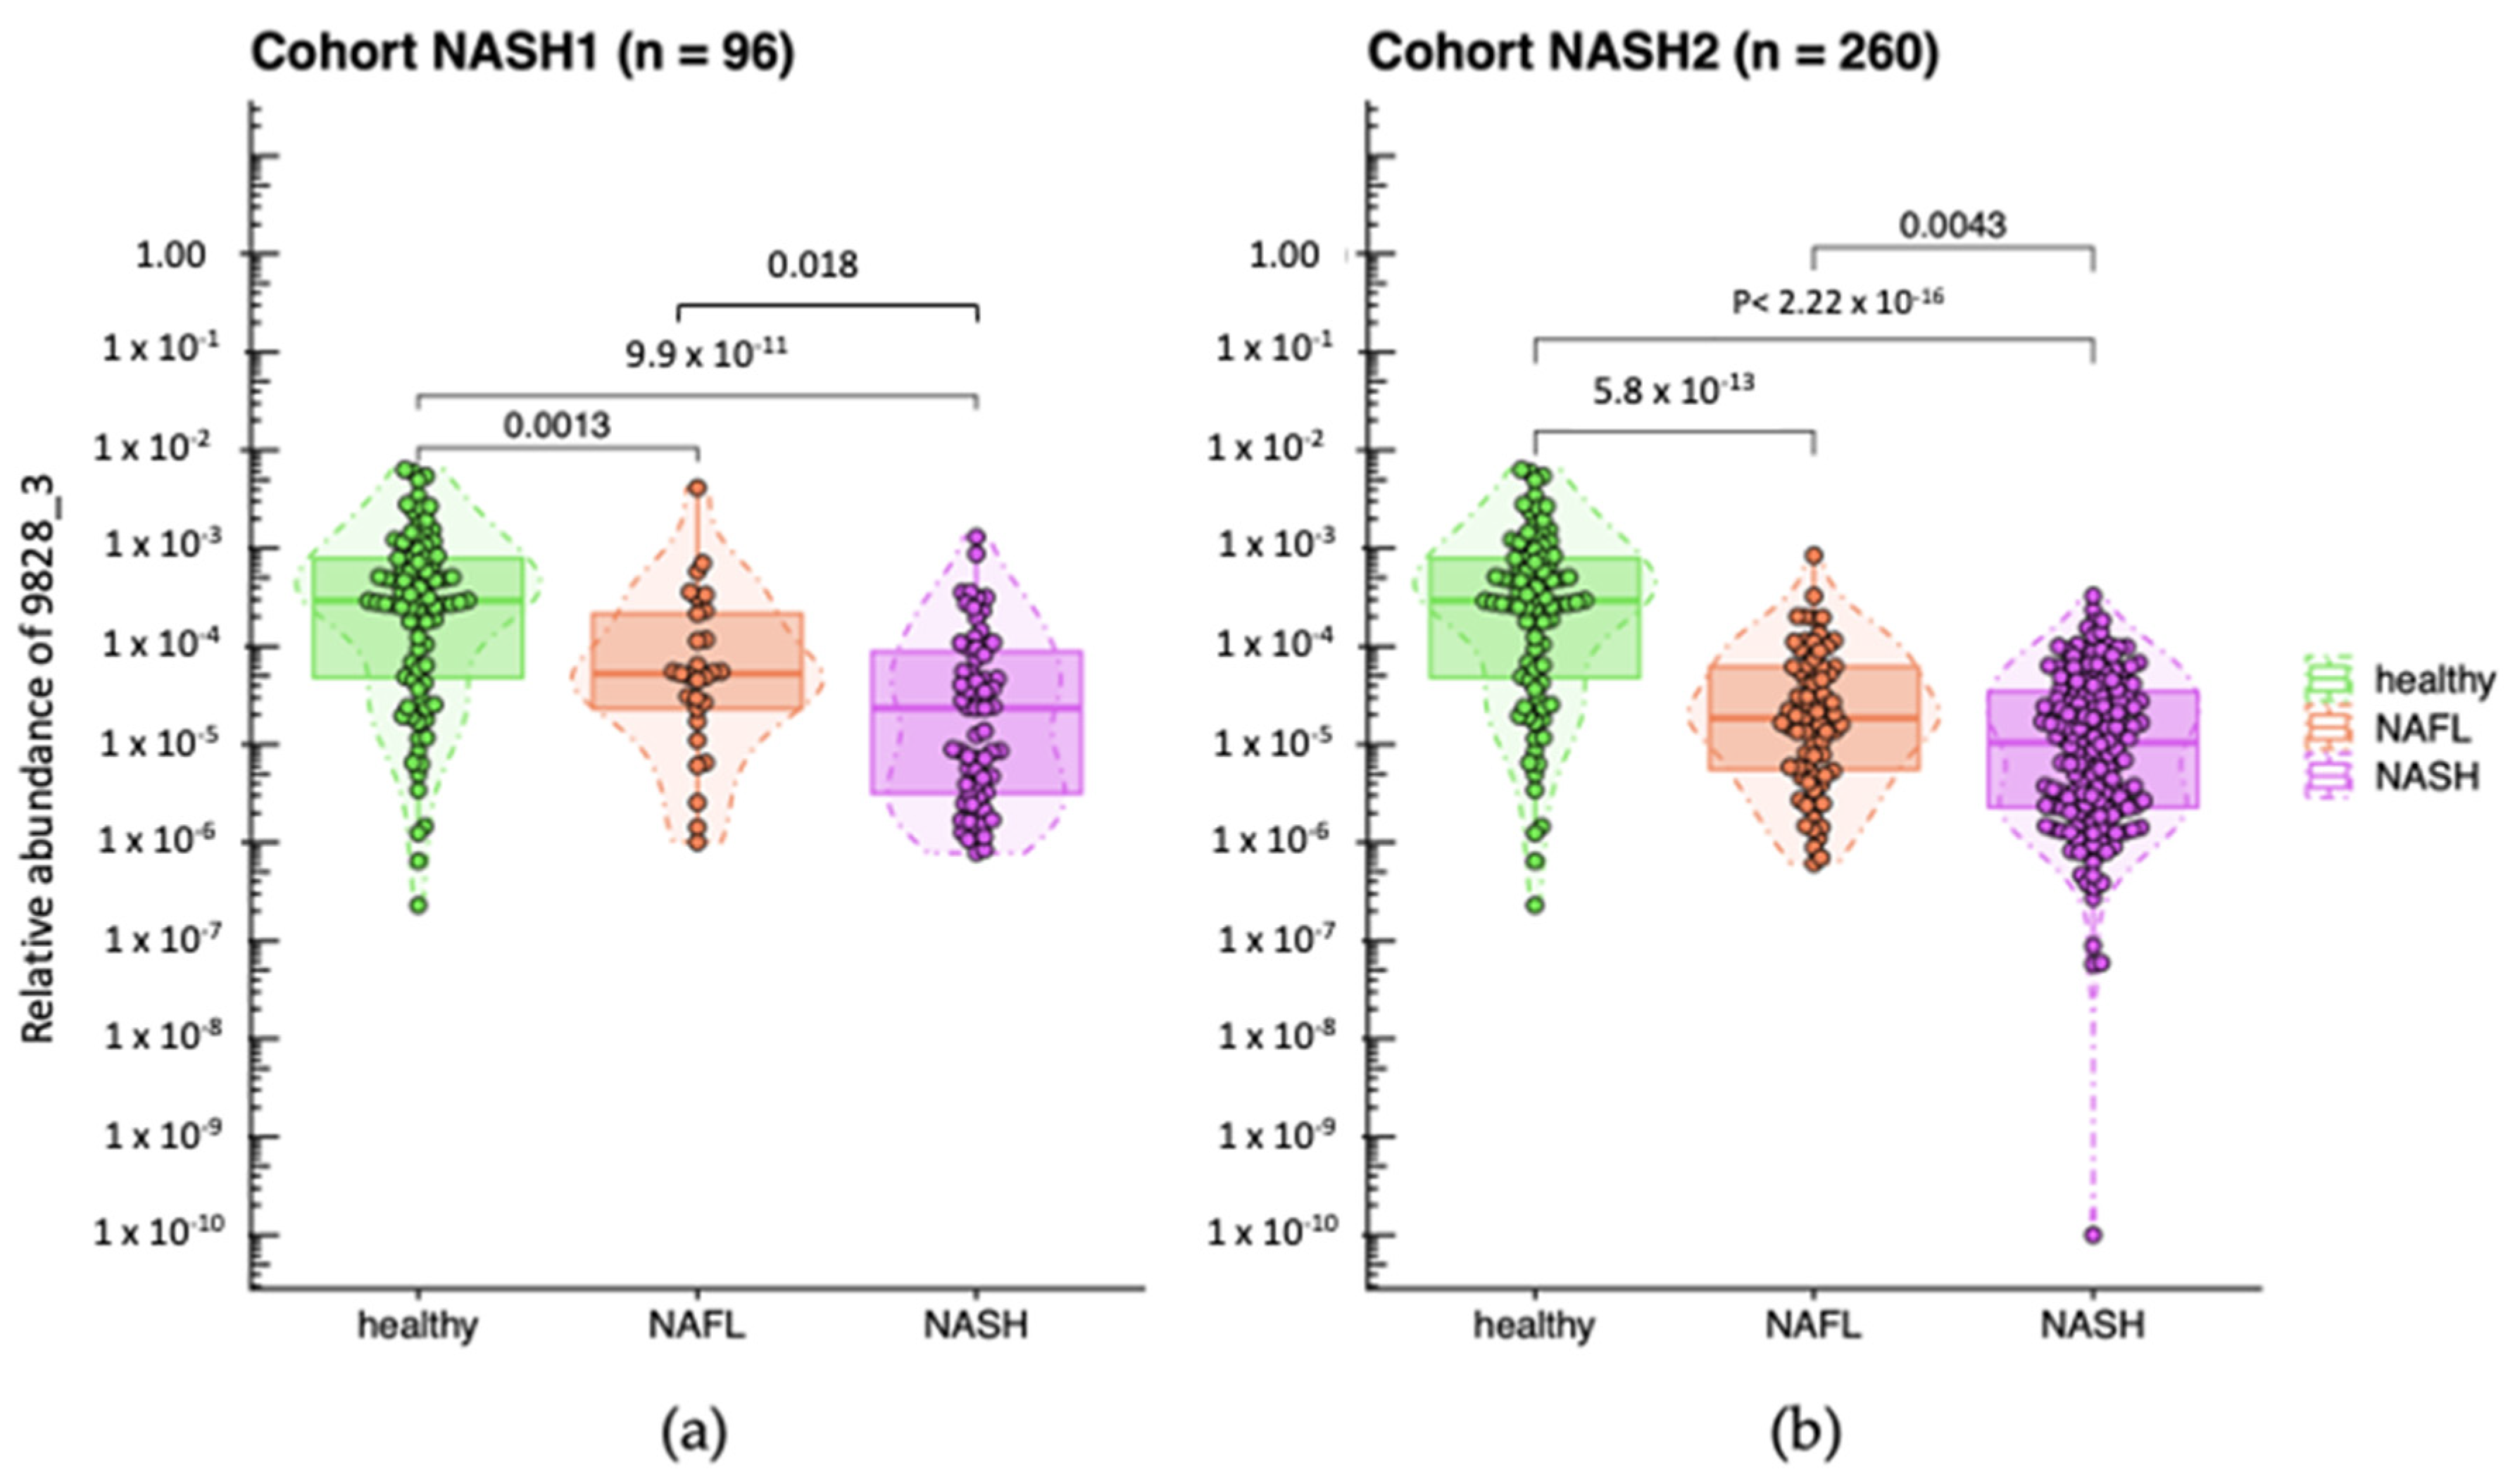
Abstract
:1. Introduction
2. Results
2.1. Decreased Abundance of A. equolifaciens in Microbiome of Liver Disease Patients NASH1 and NASH2
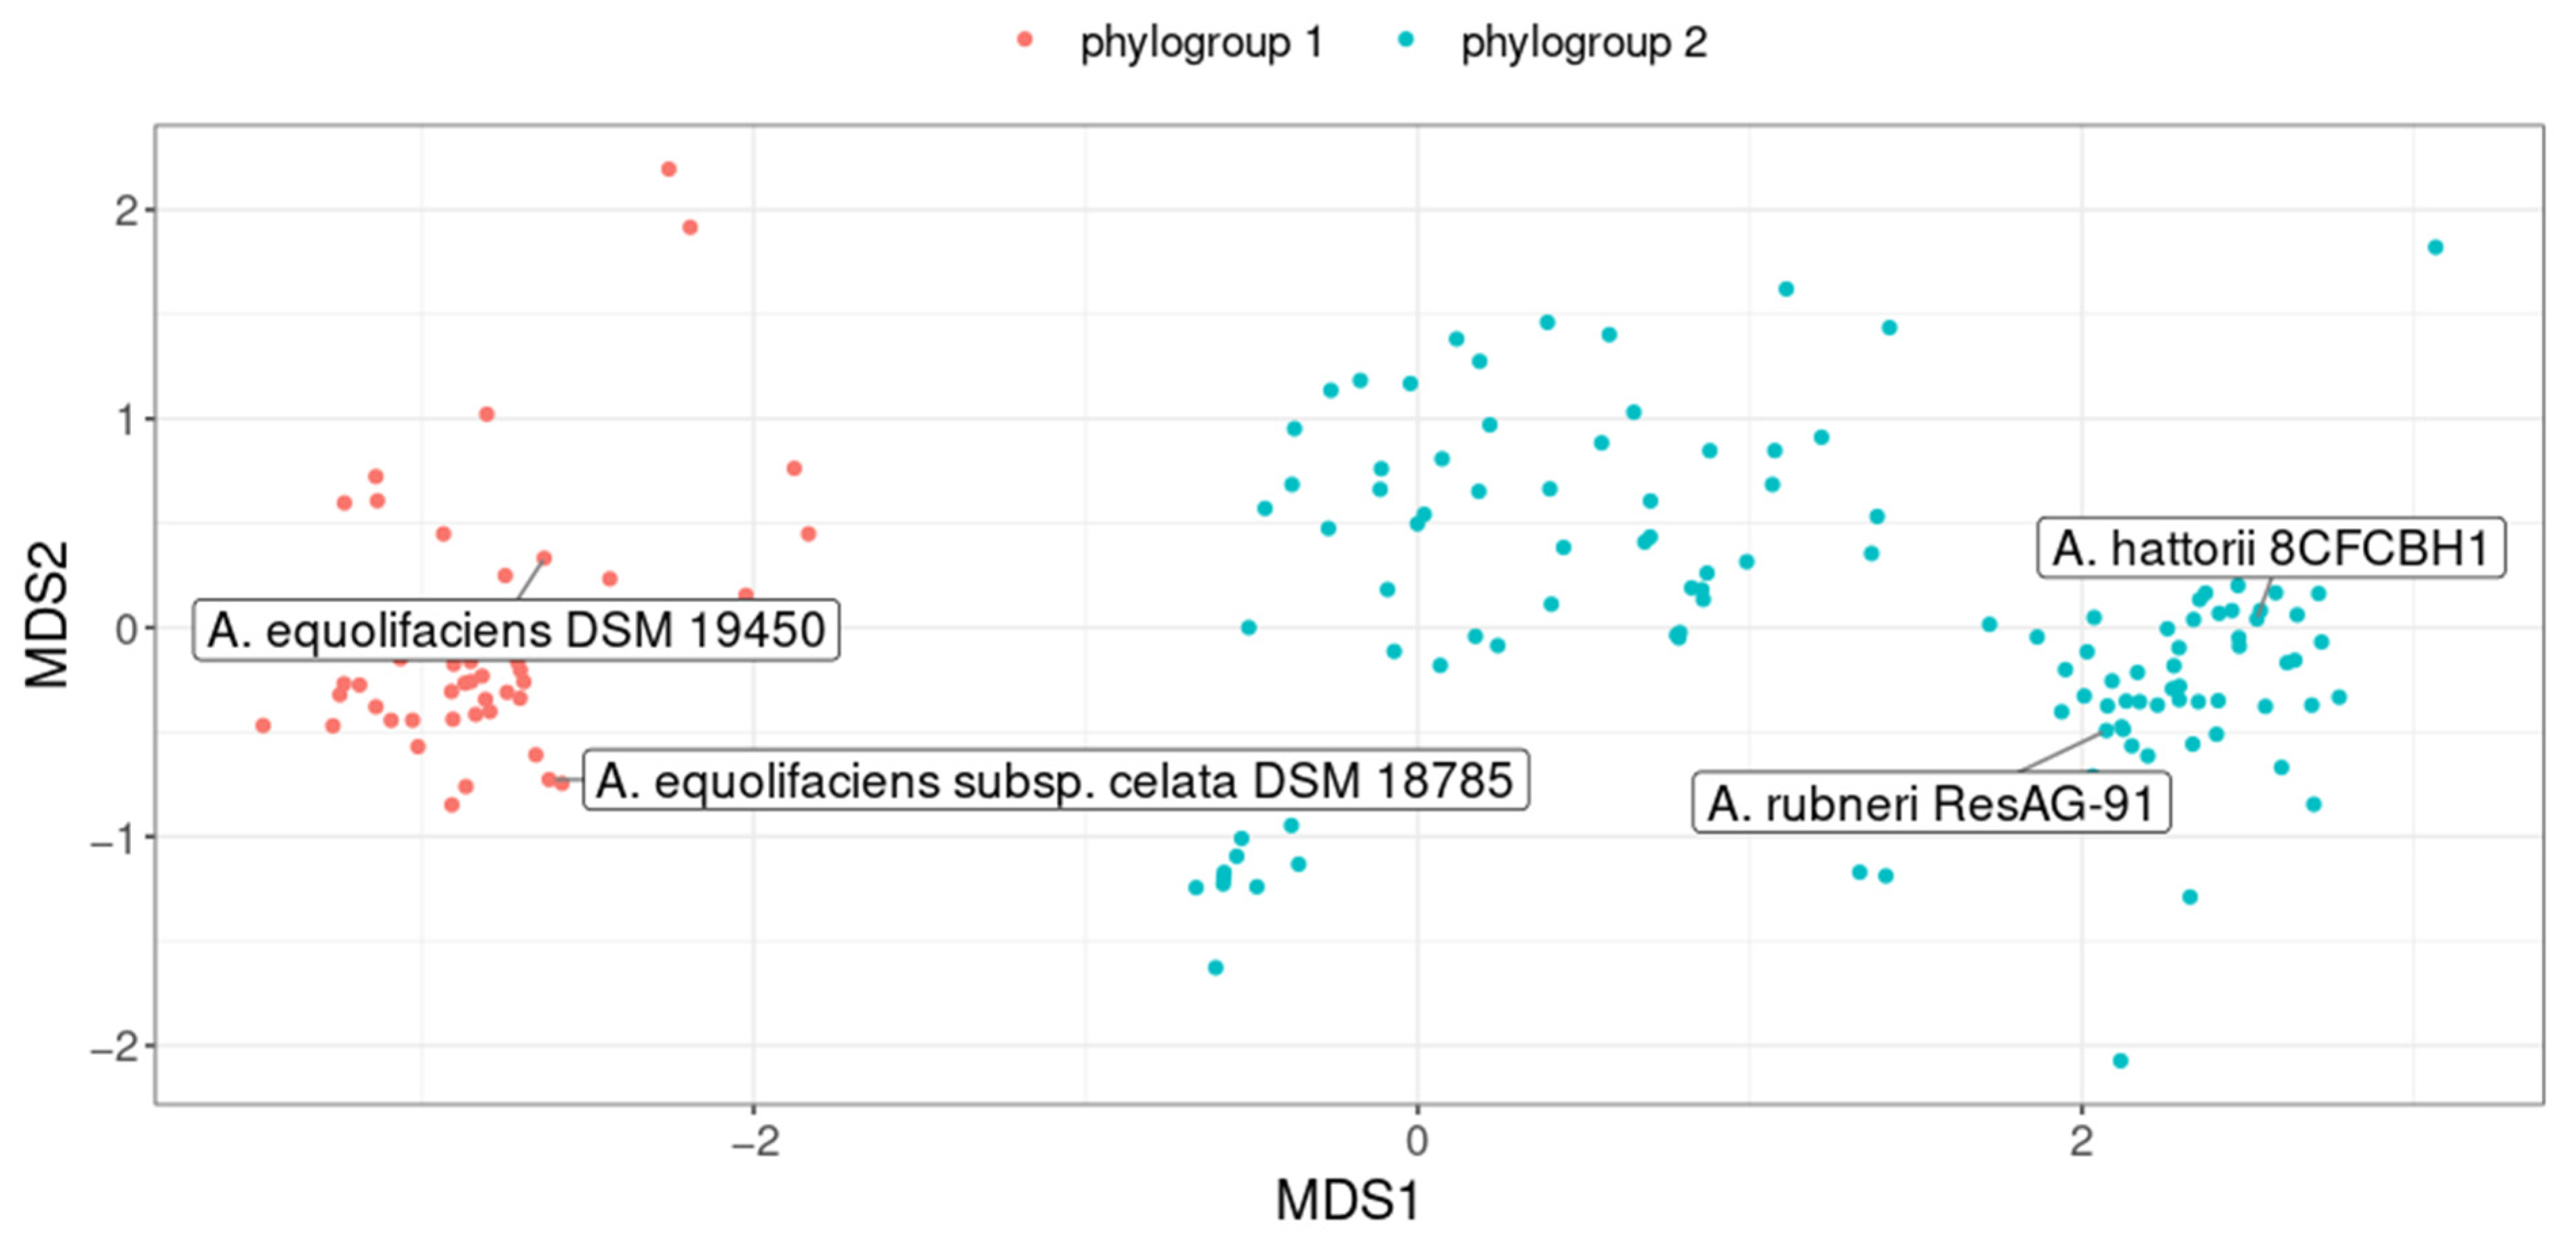
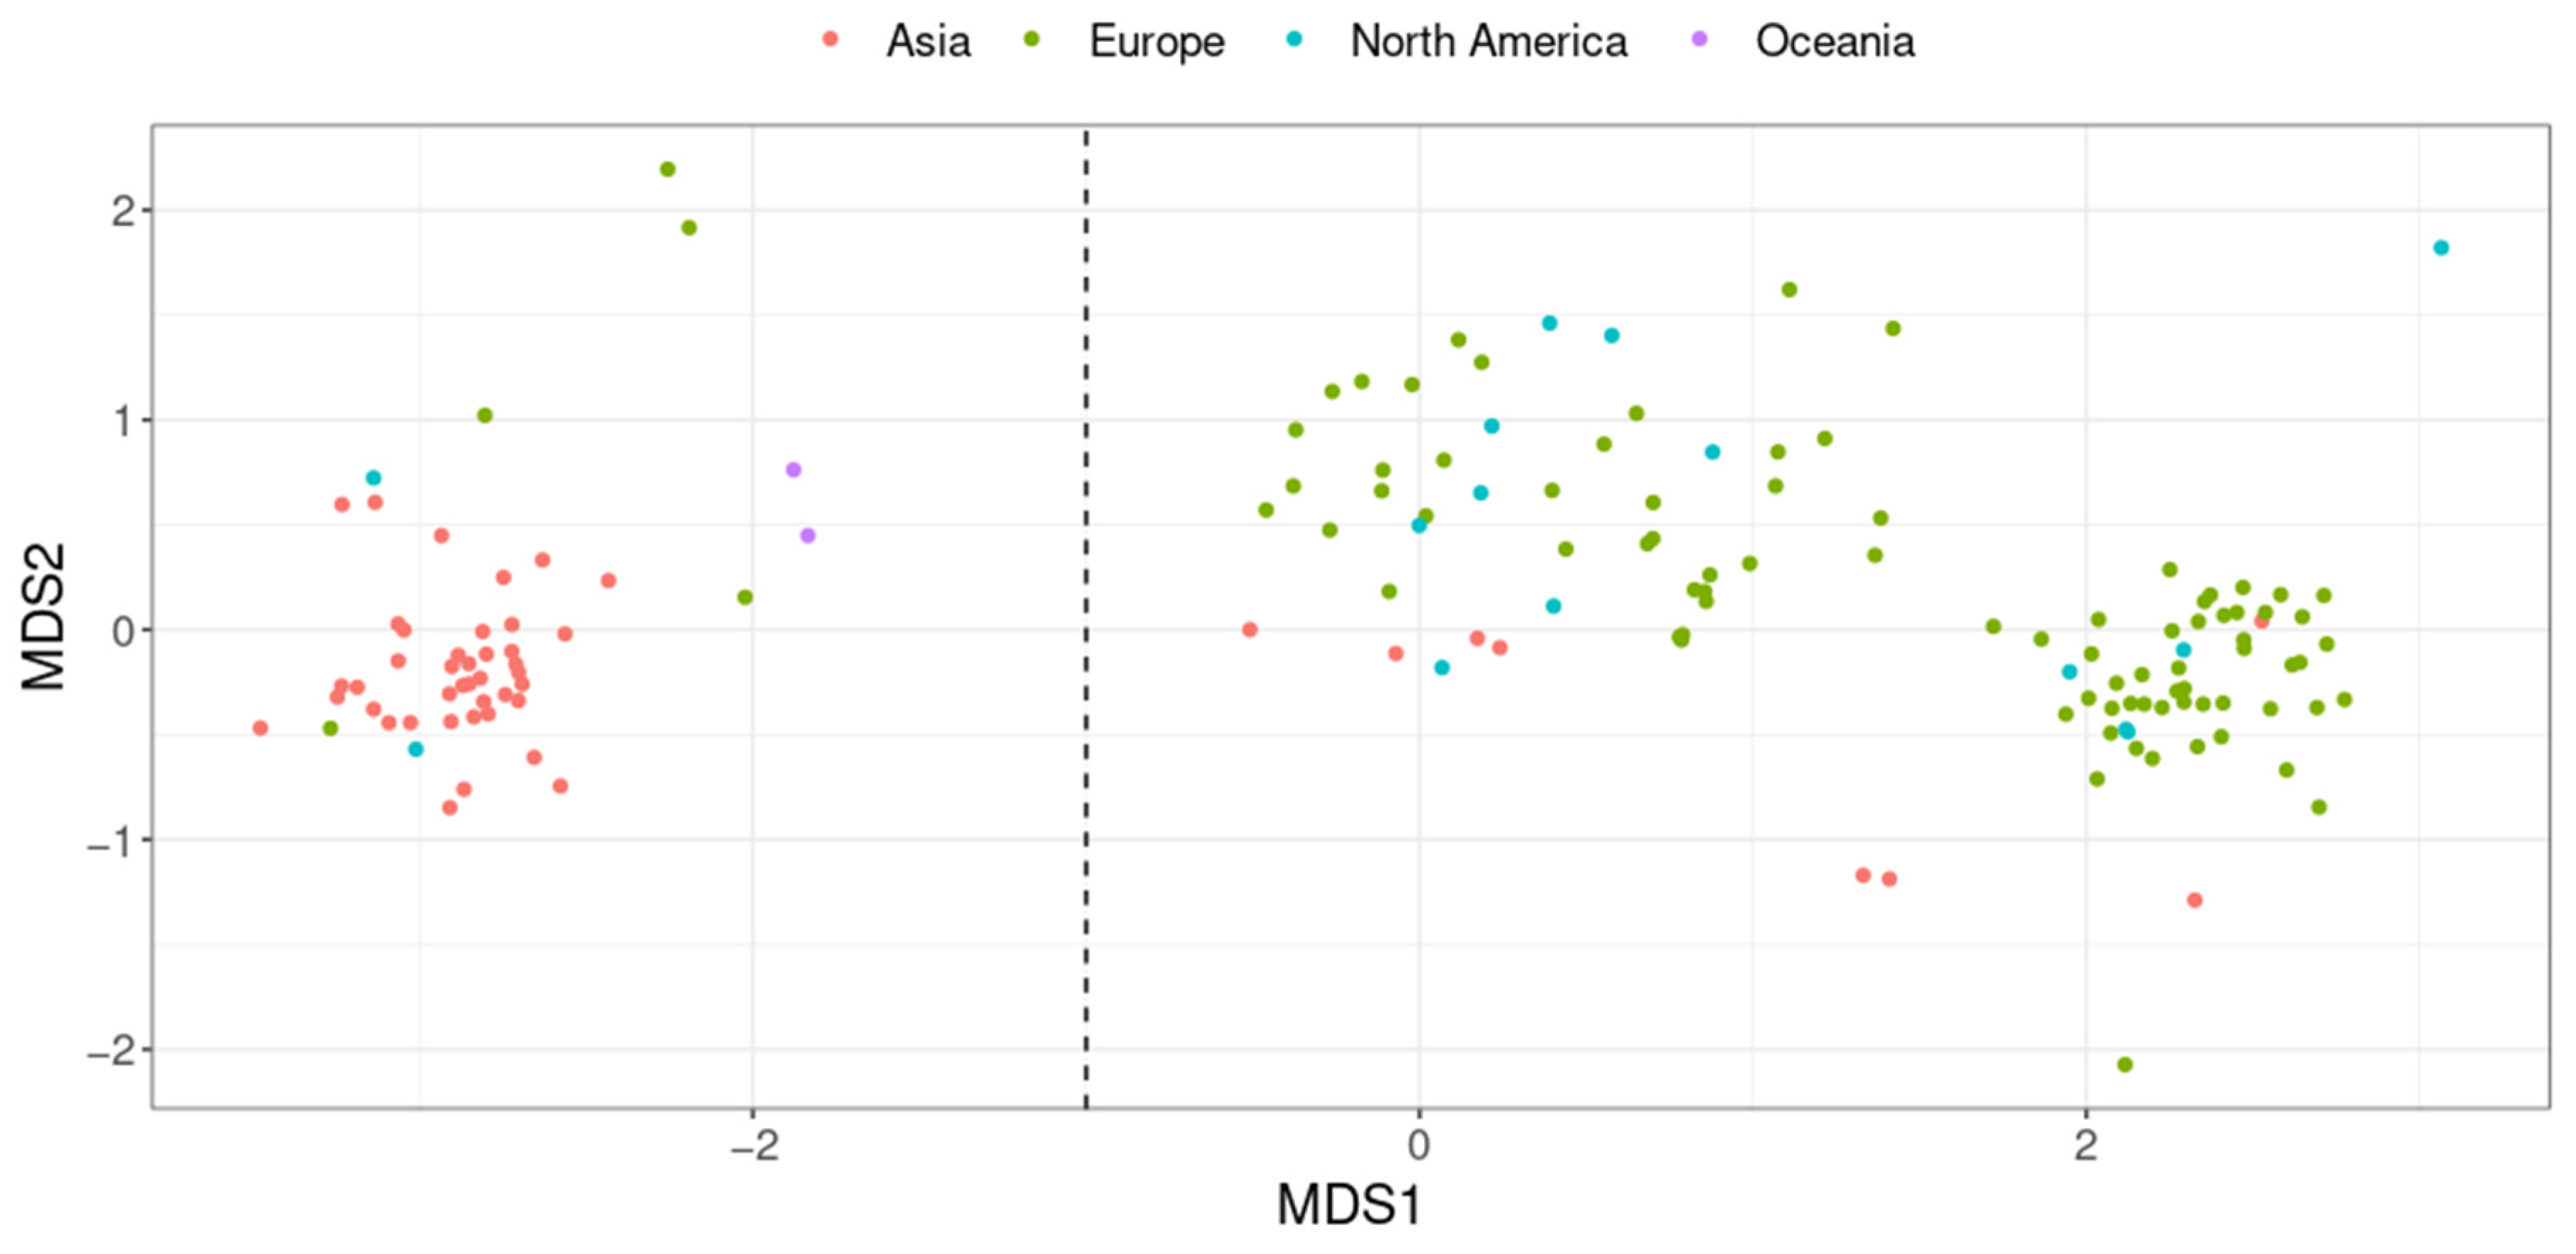
2.2. A. equolifaciens Encompasses Two Distinct Genomospecies with Strong Associations with Geography
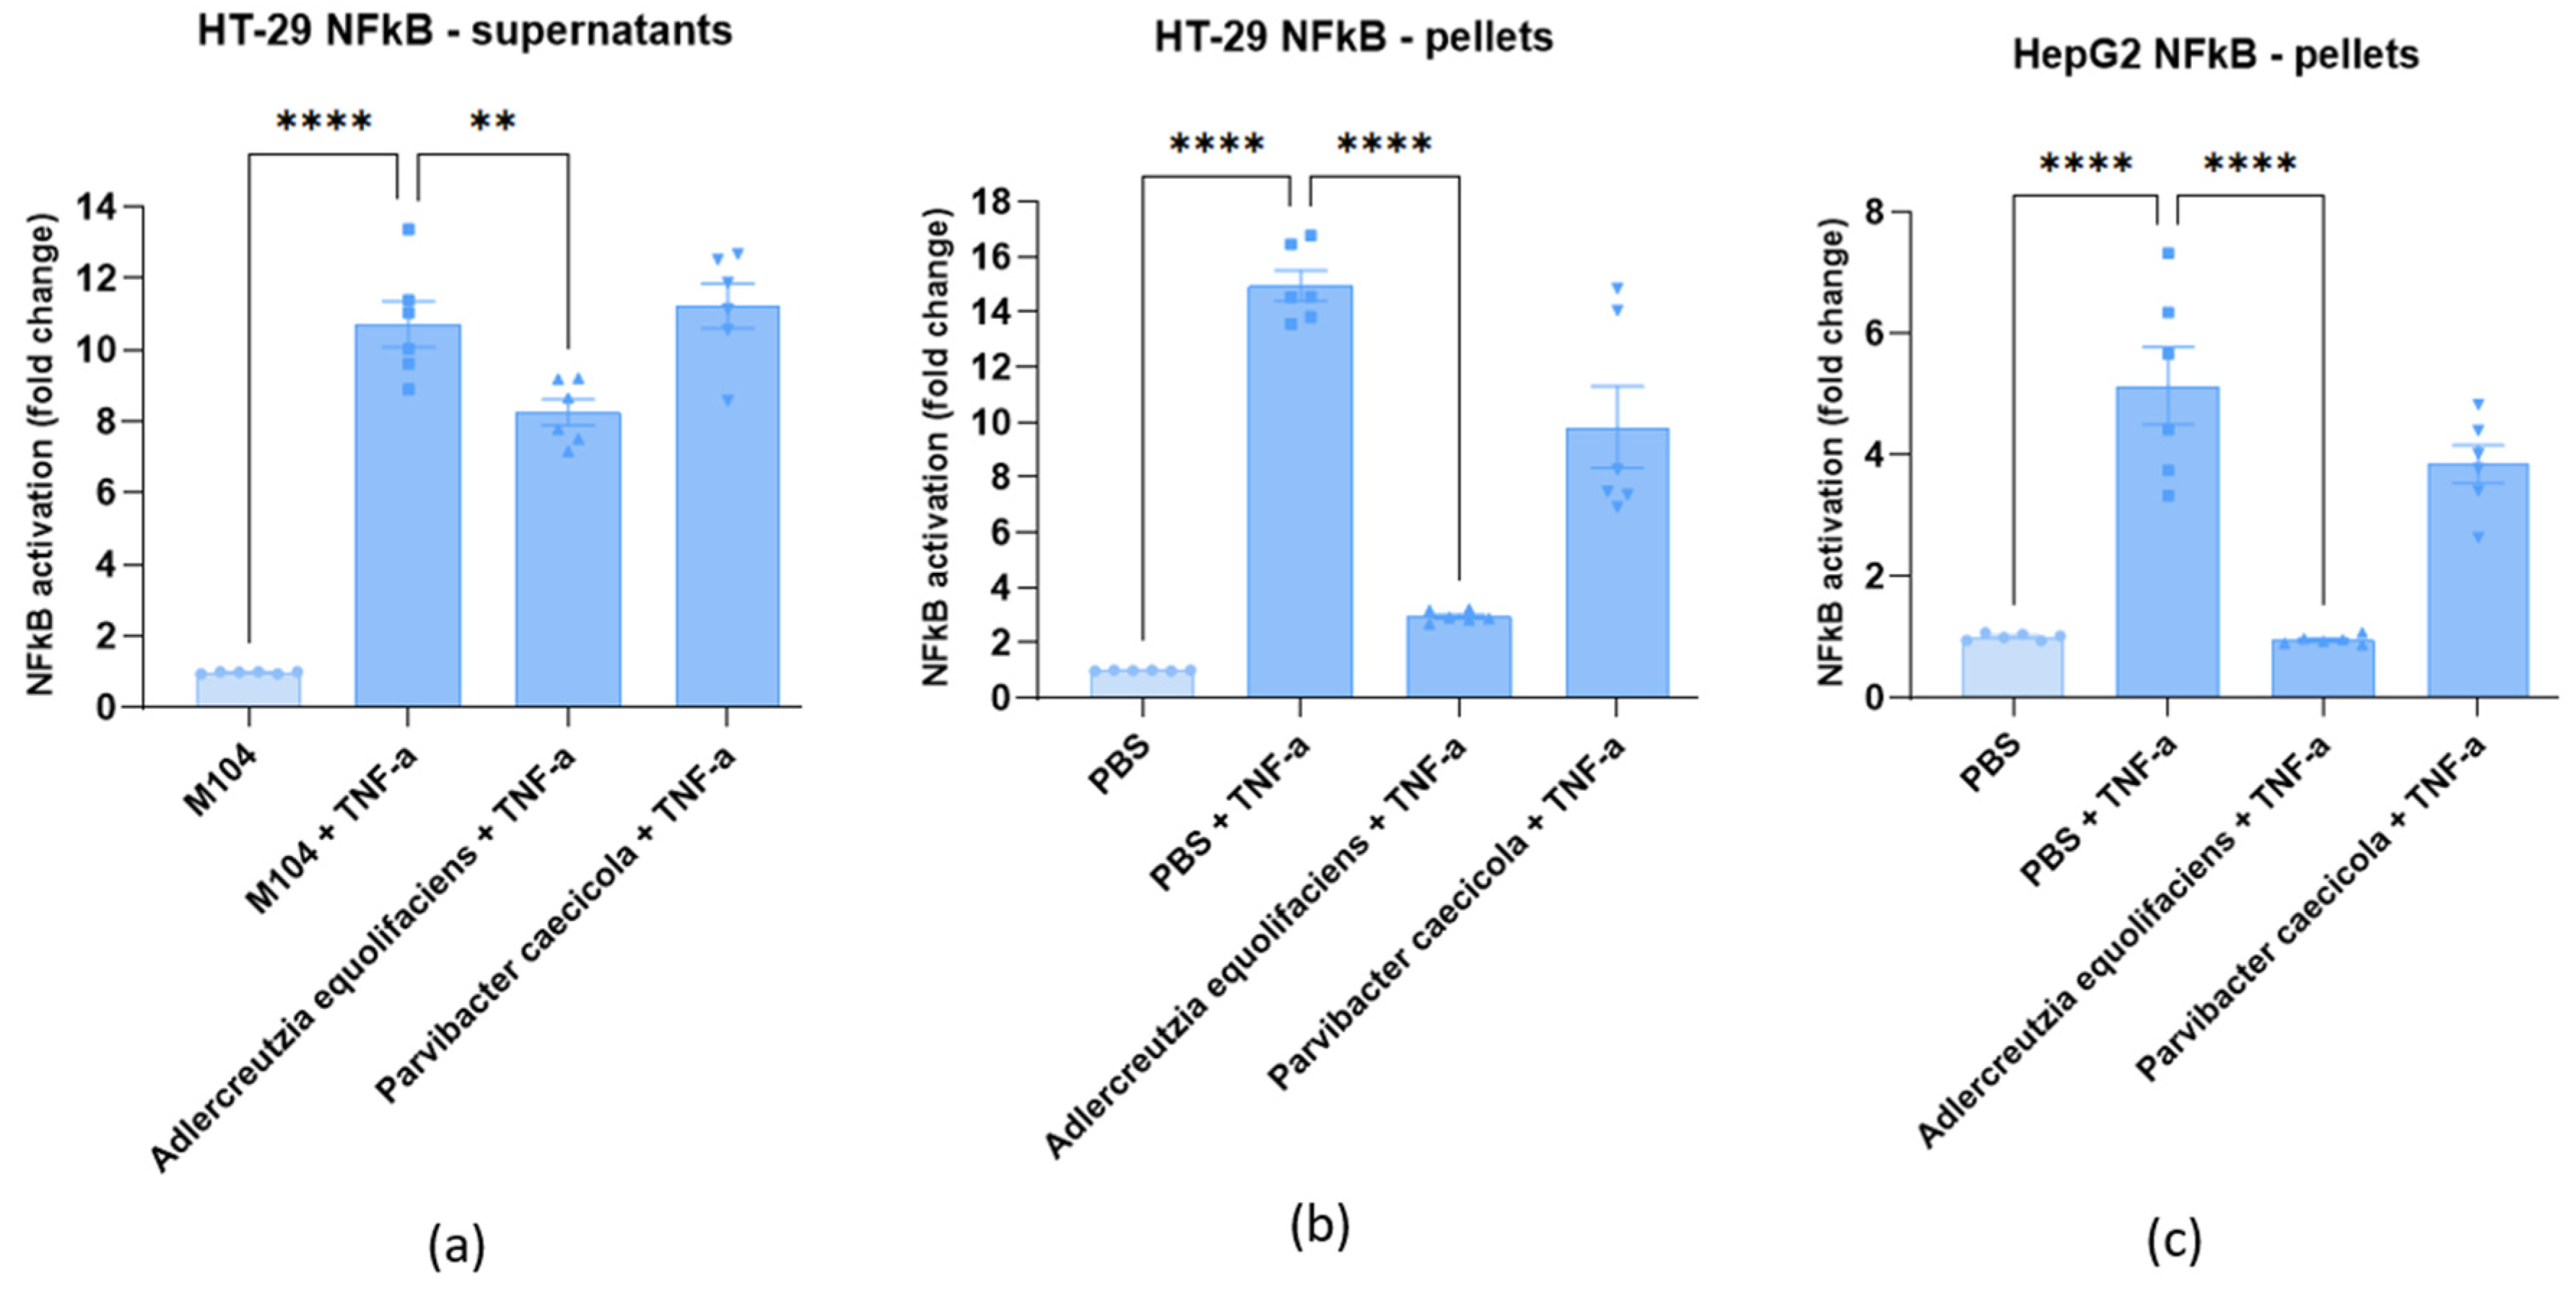
2.3. A. equolifaciens Displays Anti-Inflammatory Properties In Vitro
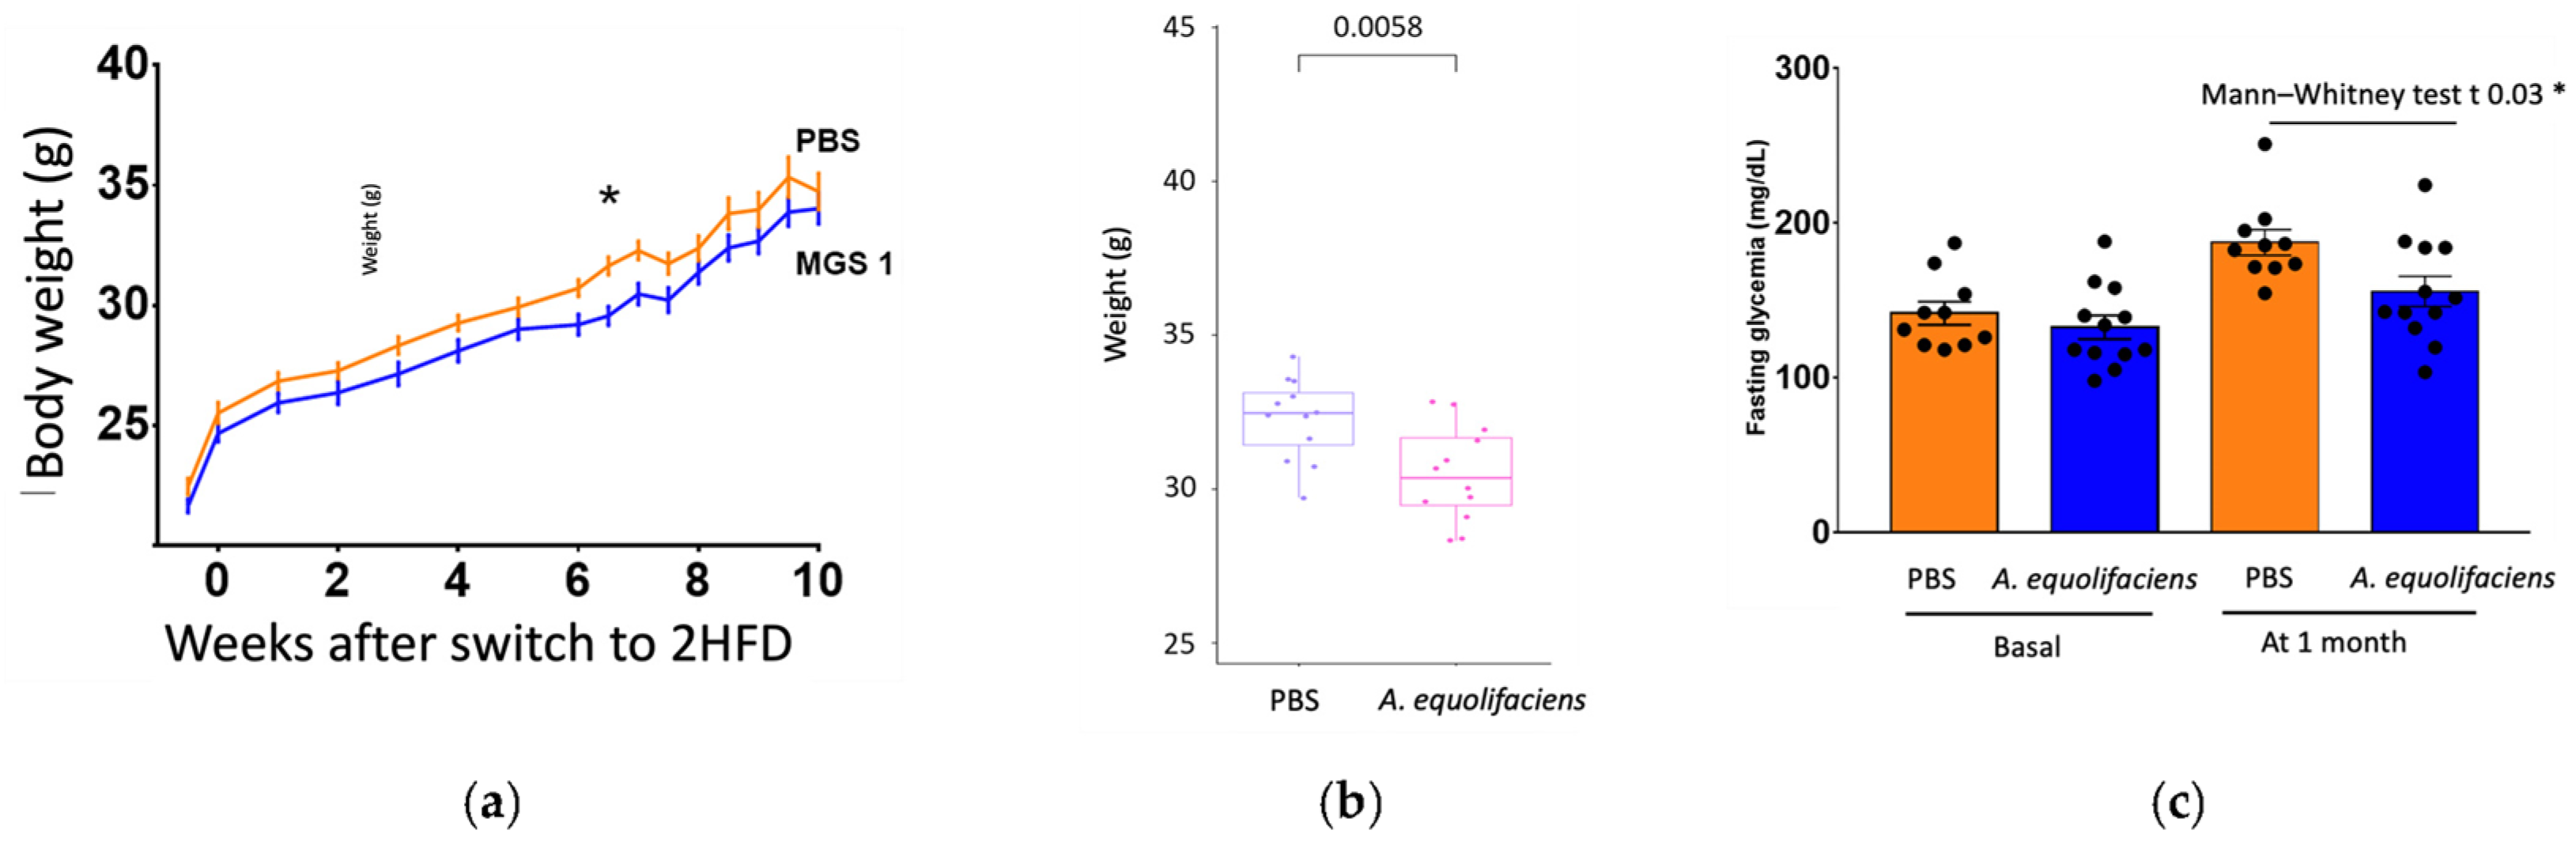
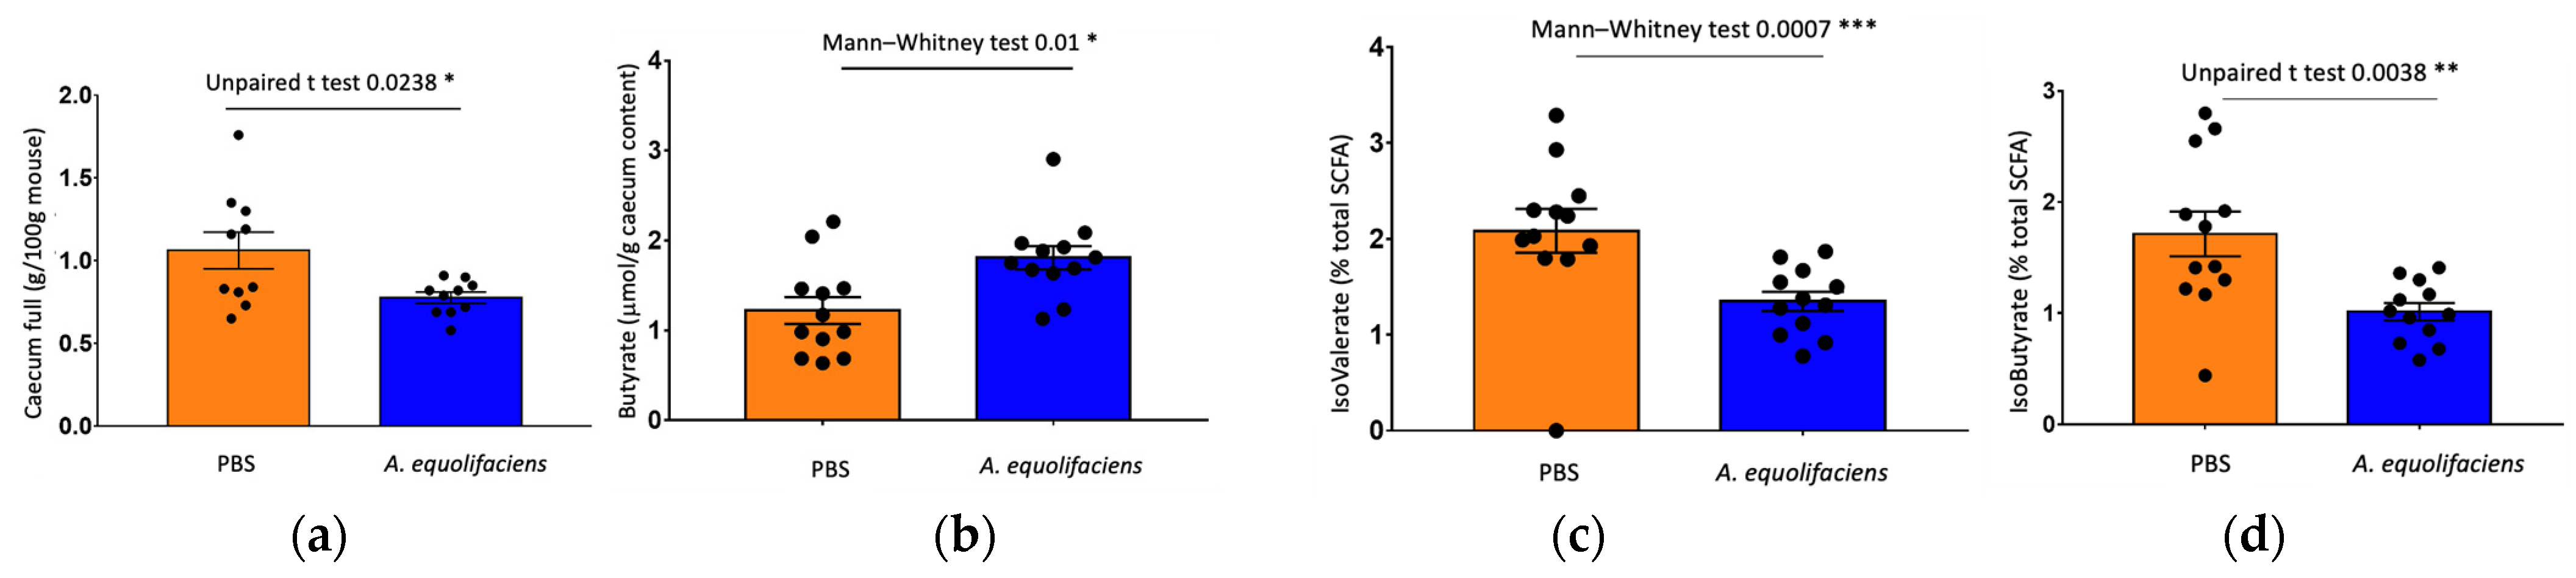
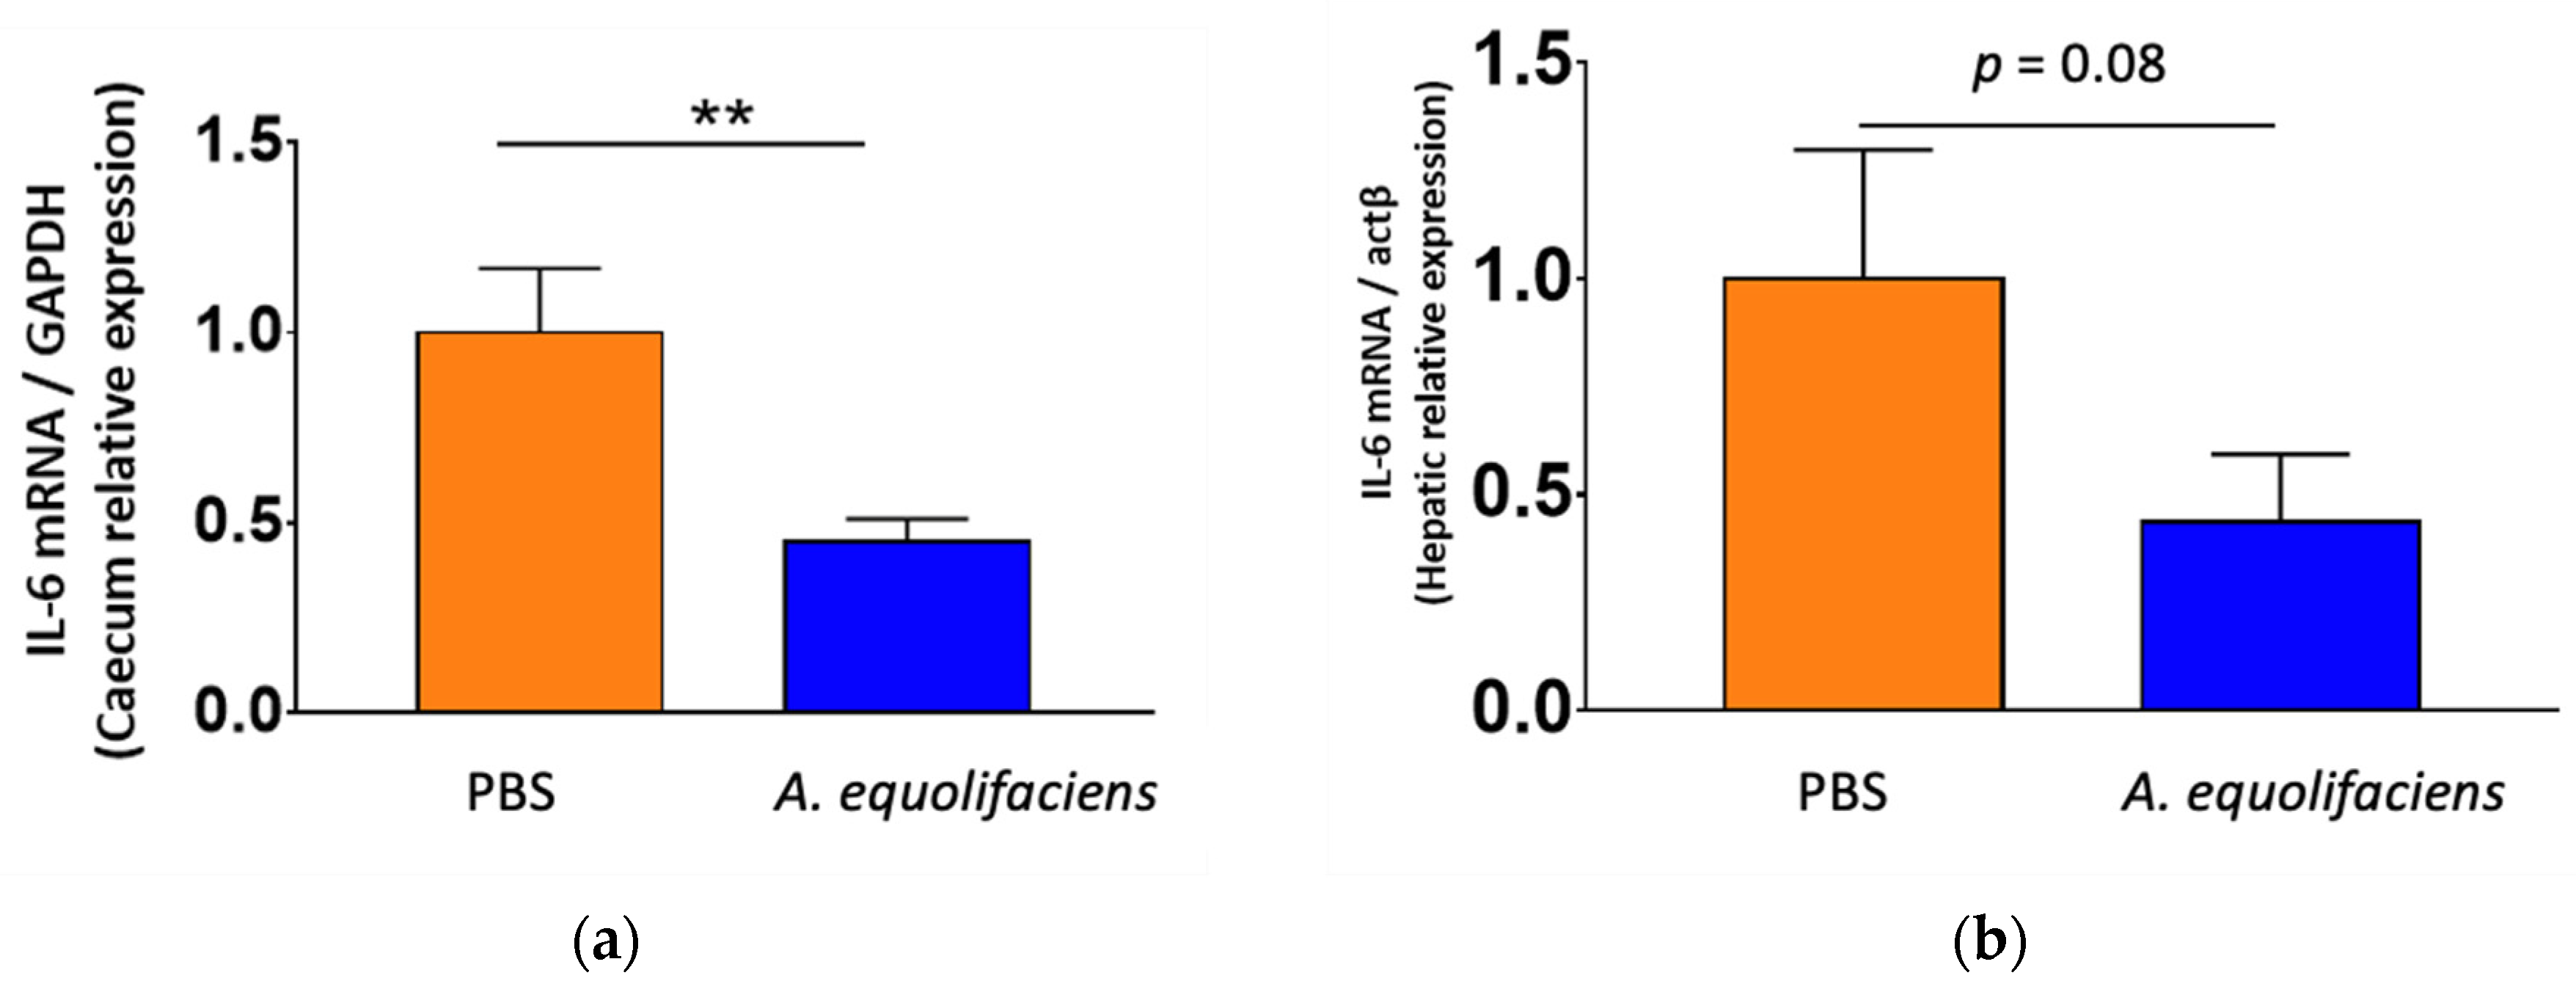
2.4. A. equolifaciens Displays Anti-Inflammatory Effect In Vivo and Impacts Mice Metabolism
3. Discussion
3.1. Decreased Abundance of A. equolifaciens in the Microbiome of NAFLD/NASH Patients
3.2. A. equolifaciens Presence in Human Gut
3.3. A. equolifaciens Presents Anti-Inflammatory Properties
4. Materials and Methods
4.1. Metagenome-Wide Association Study
4.1.1. Study Population NASH1 Cohort
4.1.2. Study Population NASH2 Cohort
4.1.3. Reference Healthy Volunteer Populations Spanish MetaHIT
4.1.4. Analysis of MGS in NASH1, NASH2, and Healthy Cohort (MetaHit)
4.1.5. Data Availability
4.1.6. Sequencing Data Preprocessing
4.1.7. Gene Coverage Table Generation
4.1.8. Species-Level Taxonomic Profiling
4.1.9. Statistical Analysis
4.2. Population Genomics
4.2.1. Data Availability
4.2.2. Bioinformatics and Biostatistics
4.3. In Vitro Experiments
4.3.1. Cell Culture and Reagents
4.3.2. Commensal Strains and Preparation of Conditioned Media
4.3.3. Analyses of NF-κB Activation
4.3.4. Statistical Analysis
4.4. Animal Experiments
4.4.1. Clinical Cohort for Stool Selection
4.4.2. Preparation and Preservation of Fecal Transplants
4.4.3. Animal Experimentation
4.4.4. Preparation of A. equolifaciens for Gavage
4.4.5. 16S rRNA Sequencing Analysis
4.4.6. Short-Chain Fatty Acids Quantification of Cecal Contents
4.4.7. Plasma Assays
4.4.8. Real-Time Quantitative Polymerase Chain Reaction (qPCR)
4.4.9. Oral Glucose Tolerance Test (OGTT)
4.4.10. Statistical Analysis
5. Patents
Supplementary Materials
Author Contributions
Funding
Institutional Review Board Statement
Informed Consent Statement
Data Availability Statement
Acknowledgments
Conflicts of Interest
References
- Younossi, Z.M.; Golabi, P.; Paik, J.M.; Henry, A.; Van Dongen, C.; Henry, L. The global epidemiology of nonalcoholic fatty liver disease (NAFLD) and nonalcoholic steatohepatitis (NASH): A systematic review. Hepatology 2023, 77, 1335–1347. [Google Scholar] [CrossRef]
- Le, M.H.; Le, D.M.; Baez, T.C.; Wu, Y.; Ito, T.; Lee, E.Y.; Lee, K.; Stave, C.D.; Henry, L.; Barnett, S.D.; et al. Global incidence of non-alcoholic fatty liver disease: A systematic review and meta-analysis of 63 studies and 1,201,807 persons. J. Hepatol. 2023, in press. [Google Scholar] [CrossRef]
- Ratziu, V.; Francque, S.; Sanyal, A. Breakthroughs in therapies for NASH and remaining challenges. J. Hepatol. 2022, 76, 1263–1278. [Google Scholar] [CrossRef] [PubMed]
- Schnabl, B.; Brenner, D.A. Interactions Between the Intestinal Microbiome and Liver Diseases. Gastroenterology 2014, 146, 1513–1524. [Google Scholar] [CrossRef] [Green Version]
- Wree, A.; Broderick, L.; Canbay, A.; Hoffman, H.M.; Feldstein, A.E. From NAFLD to NASH to cirrhosis—New insights into disease mechanisms. Nat. Rev. Gastroenterol. Hepatol. 2013, 10, 627–636. [Google Scholar] [CrossRef] [PubMed]
- Moschen, A.R.; Kaser, S.; Tilg, H. Non-alcoholic steatohepatitis: A microbiota-driven disease. Trends Endocrinol. Metab. 2013, 24, 537–545. [Google Scholar] [CrossRef] [PubMed]
- Safari, Z.; Gérard, P. The links between the gut microbiome and non-alcoholic fatty liver disease (NAFLD). Cell. Mol. Life Sci. 2019, 76, 1541–1558. [Google Scholar] [CrossRef]
- Demir, M.; Lang, S.; Martin, A.; Farowski, F.; Wisplinghoff, H.; Vehreschild, M.J.; Krawczyk, M.; Nowag, A.; Scholz, C.-J.; Kretzschmar, A.; et al. Phenotyping non-alcoholic fatty liver disease by the gut microbiota: Ready for prime time? J. Gastroenterol. Hepatol. 2020, 35, 1969–1977. [Google Scholar] [CrossRef] [Green Version]
- Boursier, J.; Mueller, O.; Barret, M.; Machado, M.; Fizanne, L.; Araujo-Perez, F.; Guy, C.D.; Seed, P.C.; Rawls, J.F.; David, L.A.; et al. The severity of nonalcoholic fatty liver disease is associated with gut dysbiosis and shift in the metabolic function of the gut microbiota. Hepatology 2016, 63, 764–775. [Google Scholar] [CrossRef]
- Loomba, R.; Seguritan, V.; Li, W.; Long, T.; Klitgord, N.; Bhatt, A.; Dulai, P.S.; Caussy, C.; Bettencourt, R.; Highlander, S.K.; et al. Gut Microbiome-Based Metagenomic Signature for Non-invasive Detection of Advanced Fibrosis in Human Nonalcoholic Fatty Liver Disease. Cell Metab. 2017, 25, 1054–1062. [Google Scholar] [CrossRef]
- Fei, N.; Bruneau, A.; Zhang, Z.; Wang, R.; Wang, J.; Rabot, S.; Gérard, P.; Zhao, L. Endotoxin Producers Overgrowing in Human Gut Microbiota as the Causative Agents for Nonalcoholic Fatty Liver Disease. mBio 2020, 11, e03263-19. [Google Scholar] [CrossRef] [Green Version]
- Bäckhed, F.; Ding, H.; Wang, T.; Hooper, L.V.; Koh, G.Y.; Nagy, A.; Semenkovich, C.F.; Gordon, J.I. The Gut Microbiota as an Environmental Factor That Regulates Fat Storage. Proc. Natl. Acad. Sci. USA 2004, 101, 15718–15723. [Google Scholar] [CrossRef]
- Bäckhed, F.; Manchester, J.K.; Semenkovich, C.F.; Gordon, J.I. Mechanisms underlying the resistance to diet-induced obesity in germ-free mice. Proc. Natl. Acad. Sci. USA 2007, 104, 979–984. [Google Scholar] [CrossRef] [PubMed]
- Meijnikman, A.S.; Davids, M.; Herrema, H.; Aydin, O.; Tremaroli, V.; Rios-Morales, M.; Levels, H.; Bruin, S.; de Brauw, M.; Verheij, J.; et al. Microbiome-derived ethanol in nonalcoholic fatty liver disease. Nat. Med. 2022, 28, 2100–2106. [Google Scholar] [CrossRef] [PubMed]
- Yuan, J.; Chen, C.; Cui, J.; Lu, J.; Yan, C.; Wei, X.; Zhao, X.; Li, N.; Li, S.; Xue, G.; et al. Fatty Liver Disease Caused by High-Alcohol-Producing Klebsiella pneumoniae. Cell Metab. 2019, 30, 675–688.e7. [Google Scholar] [CrossRef]
- Zhu, L.; Baker, S.S.; Gill, C.; Liu, W.; Alkhouri, R.; Baker, R.D.; Gill, S.R. Characterization of gut microbiomes in nonalcoholic steatohepatitis (NASH) patients: A connection between endogenous alcohol and NASH. Hepatology 2013, 57, 601–609. [Google Scholar] [CrossRef] [PubMed]
- Spencer, M.D.; Hamp, T.J.; Reid, R.W.; Fischer, L.M.; Zeisel, S.H.; Fodor, A.A. Association Between Composition of the Human Gastrointestinal Microbiome and Development of Fatty Liver With Choline Deficiency. Gastroenterology 2011, 140, 976–986. [Google Scholar] [CrossRef] [Green Version]
- Dumas, M.-E.; Barton, R.H.; Toye, A.; Cloarec, O.; Blancher, C.; Rothwell, A.; Fearnside, J.; Tatoud, R.; Blanc, V.; Lindon, J.C.; et al. Metabolic profiling reveals a contribution of gut microbiota to fatty liver phenotype in insulin-resistant mice. Proc. Natl. Acad. Sci. USA 2006, 103, 12511–12516. [Google Scholar] [CrossRef]
- Cani, P.D.; Osto, M.; Geurts, L.; Everard, A. Involvement of gut microbiota in the development of low-grade inflammation and type 2 diabetes associated with obesity. Gut Microbes 2012, 3, 279–288. [Google Scholar] [CrossRef] [Green Version]
- Wong, V.W.-S.; Chitturi, S.; Wong, G.L.-H.; Yu, J.; Chan, H.L.-Y.; Farrell, G.C. Pathogenesis and novel treatment options for non-alcoholic steatohepatitis. Lancet Gastroenterol. Hepatol. 2016, 1, 56–67. [Google Scholar] [CrossRef]
- Sayin, S.I.; Wahlström, A.; Felin, J.; Jäntti, S.; Marschall, H.-U.; Bamberg, K.; Angelin, B.; Hyötyläinen, T.; Orešič, M.; Bäckhed, F. Gut Microbiota Regulates Bile Acid Metabolism by Reducing the Levels of Tauro-beta-muricholic Acid, a Naturally Occurring FXR Antagonist. Cell Metab. 2013, 17, 225–235. [Google Scholar] [CrossRef] [PubMed] [Green Version]
- Caussy, C.; Hsu, C.; Lo, M.; Liu, A.; Bettencourt, R.; Ajmera, V.H.; Bassirian, S.; Hooker, J.; Sy, E.; Richards, L.; et al. Link between gut-microbiome derived metabolite and shared gene-effects with hepatic steatosis and fibrosis in NAFLD. Hepatology 2018, 68, 918–932. [Google Scholar] [CrossRef] [PubMed]
- Hoyles, L.; Fernández-Real, J.-M.; Federici, M.; Serino, M.; Abbott, J.; Charpentier, J.; Heymes, C.; Luque, J.L.; Anthony, E.; Barton, R.H.; et al. Publisher Correction: Molecular phenomics and metagenomics of hepatic steatosis in non-diabetic obese women. Nat. Med. 2018, 24, 1628. [Google Scholar] [CrossRef]
- Bajaj, J.S.; Kassam, Z.; Fagan, A.; Gavis, E.A.; Liu, E.; Cox, I.J.; Kheradman, R.; Heuman, D.; Wang, J.; Gurry, T.; et al. Fecal microbiota transplant from a rational stool donor improves hepatic encephalopathy: A randomized clinical trial. Hepatology 2017, 66, 1727–1738. [Google Scholar] [CrossRef]
- Henao-Mejia, J.; Elinav, E.; Jin, C.; Hao, L.; Mehal, W.Z.; Strowig, T.; Thaiss, C.A.; Kau, A.L.; Eisenbarth, S.C.; Jurczak, M.J.; et al. Inflammasome-mediated dysbiosis regulates progression of NAFLD and obesity. Nature 2012, 482, 179–185. [Google Scholar] [CrossRef] [Green Version]
- De Minicis, S.; Rychlicki, C.; Agostinelli, L.; Saccomanno, S.; Candelaresi, C.; Trozzi, L.; Mingarelli, E.; Facinelli, B.; Magi, G.; Palmieri, C.; et al. Dysbiosis contributes to fibrogenesis in the course of chronic liver injury in mice. Hepatology 2014, 59, 1738–1749. [Google Scholar] [CrossRef] [PubMed]
- Le Roy, T.; Llopis, M.; Lepage, P.; Bruneau, A.; Rabot, S.; Bevilacqua, C.; Martin, P.; Philippe, C.; Walker, F.; Bado, A.; et al. Intestinal microbiota determines development of non-alcoholic fatty liver disease in mice. Gut 2012, 62, 1787–1794. [Google Scholar] [CrossRef]
- Burz, S.D.; Monnoye, M.; Philippe, C.; Farin, W.; Ratziu, V.; Strozzi, F.; Paillarse, J.-M.; Chêne, L.; Blottière, H.M.; Gérard, P. Fecal Microbiota Transplant from Human to Mice Gives Insights into the Role of the Gut Microbiota in Non-Alcoholic Fatty Liver Disease (NAFLD). Microorganisms 2021, 9, 199. [Google Scholar] [CrossRef]
- Maruo, T.; Sakamoto, M.; Ito, C.; Toda, T.; Benno, Y. Adlercreutzia equolifaciens gen. nov., sp. nov., an equol-producing bacterium isolated from human faeces, and emended description of the genus Eggerthella. Int. J. Syst. Evol. Microbiol. 2008, 58, 1221–1227. [Google Scholar] [CrossRef] [PubMed]
- Qin, N.; Yang, F.; Li, A.; Prifti, E.; Chen, Y.; Shao, L.; Guo, J.; Le Chatelier, E.; Yao, J.; Wu, L.; et al. Alterations of the human gut microbiome in liver cirrhosis. Nature 2014, 513, 59–64. [Google Scholar] [CrossRef]
- Solé, C.; Guilly, S.; Da Silva, K.; Llopis, M.; Le-Chatelier, E.; Huelin, P.; Carol, M.; Moreira, R.; Fabrellas, N.; De Prada, G.; et al. Alterations in Gut Microbiome in Cirrhosis as Assessed by Quantitative Metagenomics: Relationship With Acute-on-Chronic Liver Failure and Prognosis. Gastroenterology 2021, 160, 206–218.e13. [Google Scholar] [CrossRef] [PubMed]
- Jain, C.; Rodriguez-R, L.M.; Phillippy, A.M.; Konstantinidis, K.T.; Aluru, S. High throughput ANI analysis of 90K prokaryotic genomes reveals clear species boundaries. Nat. Commun. 2018, 9, 5114. [Google Scholar] [CrossRef] [PubMed] [Green Version]
- Stoll, D.A.; Danylec, N.; Soukup, S.T.; Hetzer, B.; Kulling, S.E.; Huch, M. Adlercreutzia rubneri sp. nov., a resveratrol-metabolizing bacterium isolated from human faeces and emended description of the genus Adlercreutzia. Int. J. Syst. Evol. Microbiol. 2021, 71, 004987. [Google Scholar] [CrossRef] [PubMed]
- Sakamoto, M.; Ikeyama, N.; Yuki, M.; Murakami, T.; Mori, H.; Iino, T.; Ohkuma, M. Adlercreutzia hattorii sp. nov., an equol non-producing bacterium isolated from human faeces. Int. J. Syst. Evol. Microbiol. 2021, 71, 005121. [Google Scholar] [CrossRef]
- Sokol, H.; Pigneur, B.; Watterlot, L.; Lakhdari, O.; Bermúdez-Humaran, L.G.; Gratadoux, J.-J.; Blugeon, S.; Bridonneau, C.; Furet, J.-P.; Corthier, G.; et al. Faecalibacterium prausnitzii is an anti-inflammatory commensal bacterium identified by gut microbiota analysis of Crohn disease patients. Proc. Natl. Acad. Sci. USA 2008, 105, 16731–16736. [Google Scholar] [CrossRef]
- Cani, P.D.; Depommier, C.; Derrien, M.; Everard, A.; de Vos, W.M. Akkermansia muciniphila: Paradigm for next-generation beneficial microorganisms. Nat. Rev. Gastroenterol. Hepatol. 2022, 19, 625–637. [Google Scholar] [CrossRef]
- Mazier, W.; Le Corf, K.; Martinez, C.; Tudela, H.; Kissi, D.; Kropp, C.; Coubard, C.; Soto, M.; Elustondo, F.; Rawadi, G.; et al. A New Strain of Christensenella minuta as a Potential Biotherapy for Obesity and Associated Metabolic Diseases. Cells 2021, 10, 823. [Google Scholar] [CrossRef]
- Galipeau, H.J.; Caminero, A.; Turpin, W.; Bermudez-Brito, M.; Santiago, A.; Libertucci, J.; Constante, M.; Garay, J.A.R.; Rueda, G.; Armstrong, S.; et al. Novel Fecal Biomarkers That Precede Clinical Diagnosis of Ulcerative Colitis. Gastroenterology 2021, 160, 1532–1545. [Google Scholar] [CrossRef]
- Van de Guchte, M.; Mondot, S.; Doré, J. Dynamic Properties of the Intestinal Ecosystem Call for Combination Therapies, Targeting Inflammation and Microbiota, in Ulcerative Colitis. Gastroenterology 2021, 161, 1969–1981.e12. [Google Scholar] [CrossRef]
- Franzosa, E.A.; Sirota-Madi, A.; Avila-Pacheco, J.; Fornelos, N.; Haiser, H.J.; Reinker, S.; Vatanen, T.; Hall, A.B.; Mallick, H.; McIver, L.J.; et al. Gut microbiome structure and metabolic activity in inflammatory bowel disease. Nat. Microbiol. 2019, 4, 293–305. [Google Scholar] [CrossRef]
- Nouioui, I.; Carro, L.; García-López, M.; Meier-Kolthoff, J.P.; Woyke, T.; Kyrpides, N.C.; Pukall, R.; Klenk, H.-P.; Goodfellow, M.; Göker, M. Genome-Based Taxonomic Classification of the Phylum Actinobacteria. Front. Microbiol. 2018, 9, 2007. [Google Scholar] [CrossRef] [Green Version]
- Minamida, K.; Ota, K.; Nishimukai, M.; Tanaka, M.; Abe, A.; Sone, T.; Tomita, F.; Hara, H.; Asano, K. Asaccharobacter celatus gen. nov., sp. nov., isolated from rat caecum. Int. J. Syst. Evol. Microbiol. 2008, 58, 1238–1240. [Google Scholar] [CrossRef] [PubMed]
- Jensen, S.N.; Cady, N.M.; Shahi, S.K.; Peterson, S.R.; Gupta, A.; Gibson-Corley, K.N.; Mangalam, A.K. Isoflavone diet ameliorates experimental autoimmune encephalomyelitis through modulation of gut bacteria depleted in patients with multiple sclerosis. Sci. Adv. 2021, 7, eabd4595. [Google Scholar] [CrossRef] [PubMed]
- Lenoir, M.; Martín, R.; Torres-Maravilla, E.; Chadi, S.; González-Dávila, P.; Sokol, H.; Langella, P.; Chain, F.; Bermúdez-Humarán, L.G. Butyrate mediates anti-inflammatory effects of Faecalibacterium prausnitzii in intestinal epithelial cells through Dact3. Gut Microbes 2020, 12, e1826748. [Google Scholar] [CrossRef] [PubMed]
- Nielsen, H.B.; Almeida, M.; Juncker, A.S.; Rasmussen, S.; Li, J.; Sunagawa, S.; Plichta, D.R.; Gautier, L.; Pedersen, A.G.; Le Chatelier, E.; et al. Identification and assembly of genomes and genetic elements in complex metagenomic samples without using reference genomes. Nat. Biotechnol. 2014, 32, 822–828. [Google Scholar] [CrossRef]
- Qin, J.; Li, R.; Raes, J.; Arumugam, M.; Burgdorf, K.S.; Manichanh, C.; Nielsen, T.; Pons, N.; Levenez, F.; Yamada, T.; et al. A human gut microbial gene catalogue established by metagenomic sequencing. Nature 2010, 464, 59–65. [Google Scholar] [CrossRef] [Green Version]
- Le Chatelier, E.; Nielsen, T.; Qin, J.; Prifti, E.; Hildebrand, F.; Falony, G.; Almeida, M.; Arumugam, M.; Batto, J.M.; Kennedy, S.; et al. Richness of human gut microbiome correlates with metabolic markers. Nature 2013, 500, 541–546. [Google Scholar] [CrossRef]
- Chen, S.; Zhou, Y.; Chen, Y.; Gu, J. fastp: An ultra-fast all-in-one FASTQ preprocessor. Bioinformatics 2018, 34, i884–i890. [Google Scholar] [CrossRef]
- Langmead, B.; Salzberg, S.L. Fast gapped-read alignment with Bowtie 2. Nat. Methods 2012, 9, 357–359. [Google Scholar] [CrossRef] [Green Version]
- Wen, C.; Zheng, Z.; Shao, T.; Liu, L.; Xie, Z.; Le Chatelier, E.; He, Z.; Zhong, W.; Fan, Y.; Zhang, L.; et al. Quantitative metagenomics reveals unique gut microbiome biomarkers in ankylosing spondylitis. Genome Biol. 2017, 18, 214. [Google Scholar] [CrossRef] [Green Version]
- Li, J.; Jia, H.; Cai, X.; Zhong, H.; Feng, Q.; Sunagawa, S.; Arumugam, M.; Kultima, J.R.; Prifti, E.; Nielsen, T.; et al. An integrated catalog of reference genes in the human gut microbiome. Nat. Biotechnol. 2014, 32, 834–841. [Google Scholar] [CrossRef] [PubMed]
- Oñate, F.P.; Le Chatelier, E.; Almeida, M.; Cervino, A.C.L.; Gauthier, F.; Magoulès, F.; Ehrlich, S.D.; Pichaud, M. MSPminer: Abundance-based reconstitution of microbial pan-genomes from shotgun metagenomic data. Bioinformatics 2018, 35, 1544–1552. [Google Scholar] [CrossRef] [PubMed] [Green Version]
- Plaza Onate, F.; Pons, N.; Gauthier, F.; Almeida, M.; Ehrlich, S.D.; Le Chatelier, E. Updated Metagenomic Species Pan-genomes (MSPs) of the human gastrointestinal microbiota. Recherche Data Gouv 2021, V5. [Google Scholar] [CrossRef]
- Chklovski, A.; Parks, D.H.; Woodcroft, B.; Tyson, G. CheckM2: A rapid, scalable and accurate tool for assessing microbial genome quality using machine learning. bioRxiv 2022. [Google Scholar] [CrossRef] [PubMed]
- Almeida, A.; Nayfach, S.; Boland, M.; Strozzi, F.; Beracochea, M.; Shi, Z.J.; Pollard, K.S.; Sakharova, E.; Parks, D.H.; Hugenholtz, P.; et al. A unified catalog of 204,938 reference genomes from the human gut microbiome. Nat. Biotechnol. 2020, 39, 105–114. [Google Scholar] [CrossRef] [PubMed]
- Kim, C.Y.; Lee, M.; Yang, S.; Kim, K.; Yong, D.; Kim, H.R.; Lee, I. Human reference gut microbiome catalog including newly assembled genomes from under-represented Asian metagenomes. Genome Med. 2021, 13, 134. [Google Scholar] [CrossRef] [PubMed]
- Plaza Oñate, F.; Gitton-Quent, O.; Almeida, M.; Le Chatelier, E. MIMIC2: Murine Intestinal Microbiota Integrated Catalog v2. Recherche Data Gouv 2021, V4. [Google Scholar] [CrossRef]
- Dixon, P. VEGAN, a package of R functions for community ecology. J. Veg. Sci. 2003, 14, 927–930. [Google Scholar] [CrossRef]
- Gertz, E.M.; Yu, Y.-K.; Agarwala, R.; Schäffer, A.A.; Altschul, S.F. Composition-based statistics and translated nucleotide searches: Improving the TBLASTN module of BLAST. BMC Biol. 2006, 4, 41. [Google Scholar] [CrossRef]
- Lakhdari, O.; Cultrone, A.; Tap, J.; Gloux, K.; Bernard, F.; Ehrlich, S.D.; Lefèvre, F.; Doré, J.; Blottière, H.M. Functional Metagenomics: A High Throughput Screening Method to Decipher Microbiota-Driven NF-κB Modulation in the Human Gut. PLoS ONE 2010, 5, e13092. [Google Scholar] [CrossRef]
- Hungate, R.E. The anaerobic mesophilic cellulolytic bacteria. Bacteriol. Rev. 1950, 14, 1–49. [Google Scholar] [CrossRef]
- Burz, S.D.; Abraham, A.-L.; Fonseca, F.; David, O.; Chapron, A.; Béguet-Crespel, F.; Cénard, S.; Le Roux, K.; Patrascu, O.; Levenez, F.; et al. A Guide for Ex Vivo Handling and Storage of Stool Samples Intended for Fecal Microbiota Transplantation. Sci. Rep. 2019, 9, 8897. [Google Scholar] [CrossRef] [Green Version]
- Zhang, X.; Grosfeld, A.; Williams, E.; Vasiliauskas, D.; Barretto, S.; Smith, L.; Mariadassou, M.; Philippe, C.; Devime, F.; Melchior, C.; et al. Fructose malabsorption induces cholecystokinin expression in the ileum and cecum by changing microbiota composition and metabolism. FASEB J. 2019, 33, 7126–7142. [Google Scholar] [CrossRef]
- Furet, J.-P.; Firmesse, O.; Gourmelon, M.; Bridonneau, C.; Tap, J.; Mondot, S.; Doré, J.; Corthier, G. Comparative assessment of human and farm animal faecal microbiota using real-time quantitative PCR. FEMS Microbiol. Ecol. 2009, 68, 351–362. [Google Scholar] [CrossRef] [Green Version]
- Kozich, J.J.; Westcott, S.L.; Baxter, N.T.; Highlander, S.K.; Schloss, P.D. Development of a dual-index sequencing strategy and curation pipeline for analyzing amplicon sequence data on the MiSeq Illumina sequencing platform. Appl. Environ. Microbiol. 2013, 79, 5112–5120. [Google Scholar] [CrossRef] [Green Version]
- Escudié, F.; Auer, L.; Bernard, M.; Mariadassou, M.; Cauquil, L.; Vidal, K.; Maman, S.; Hernandez-Raquet, G.; Combes, S.; Pascal, G. FROGS: Find, Rapidly, OTUs with Galaxy Solution. Bioinformatics 2018, 34, 1287–1294. [Google Scholar] [CrossRef] [PubMed] [Green Version]
- Bokulich, N.A.; Subramanian, S.; Faith, J.J.; Gevers, D.; Gordon, J.I.; Knight, R.; Mills, D.A.; Caporaso, J.G. Quality-filtering vastly improves diversity estimates from Illumina amplicon sequencing. Nat. Methods 2013, 10, 57–59. [Google Scholar] [CrossRef] [PubMed]
- Safari, Z.; Bruneau, A.; Monnoye, M.; Mariadassou, M.; Philippe, C.; Zatloukal, K.; Gérard, P. Murine Genetic Background Overcomes Gut Microbiota Changes to Explain Metabolic Response to High-Fat Diet. Nutrients 2020, 12, 287. [Google Scholar] [CrossRef] [PubMed] [Green Version]
- Lécuyer, E.; Le Roy, T.; Gestin, A.; Lacombe, A.; Philippe, C.; Ponnaiah, M.; Huré, J.-B.; Fradet, M.; Ichou, F.; Boudebbouze, S.; et al. Tolerogenic Dendritic Cells Shape a Transmissible Gut Microbiota That Protects From Metabolic Diseases. Diabetes 2021, 70, 2067–2080. [Google Scholar] [CrossRef]


Disclaimer/Publisher’s Note: The statements, opinions and data contained in all publications are solely those of the individual author(s) and contributor(s) and not of MDPI and/or the editor(s). MDPI and/or the editor(s) disclaim responsibility for any injury to people or property resulting from any ideas, methods, instructions or products referred to in the content. |
© 2023 by the authors. Licensee MDPI, Basel, Switzerland. This article is an open access article distributed under the terms and conditions of the Creative Commons Attribution (CC BY) license (https://creativecommons.org/licenses/by/4.0/).
Share and Cite
Oñate, F.P.; Chamignon, C.; Burz, S.D.; Lapaque, N.; Monnoye, M.; Philippe, C.; Bredel, M.; Chêne, L.; Farin, W.; Paillarse, J.-M.; et al. Adlercreutzia equolifaciens Is an Anti-Inflammatory Commensal Bacterium with Decreased Abundance in Gut Microbiota of Patients with Metabolic Liver Disease. Int. J. Mol. Sci. 2023, 24, 12232. https://doi.org/10.3390/ijms241512232
Oñate FP, Chamignon C, Burz SD, Lapaque N, Monnoye M, Philippe C, Bredel M, Chêne L, Farin W, Paillarse J-M, et al. Adlercreutzia equolifaciens Is an Anti-Inflammatory Commensal Bacterium with Decreased Abundance in Gut Microbiota of Patients with Metabolic Liver Disease. International Journal of Molecular Sciences. 2023; 24(15):12232. https://doi.org/10.3390/ijms241512232
Chicago/Turabian StyleOñate, Florian Plaza, Célia Chamignon, Sebastian D. Burz, Nicolas Lapaque, Magali Monnoye, Catherine Philippe, Maxime Bredel, Laurent Chêne, William Farin, Jean-Michel Paillarse, and et al. 2023. "Adlercreutzia equolifaciens Is an Anti-Inflammatory Commensal Bacterium with Decreased Abundance in Gut Microbiota of Patients with Metabolic Liver Disease" International Journal of Molecular Sciences 24, no. 15: 12232. https://doi.org/10.3390/ijms241512232