
Genome-Wide DNA Methylation and Transcriptome Integration Associates DNA Methylation Changes with Bovine Subclinical Mastitis Caused by Staphylococcus chromogenes
 ,
,  , , , and
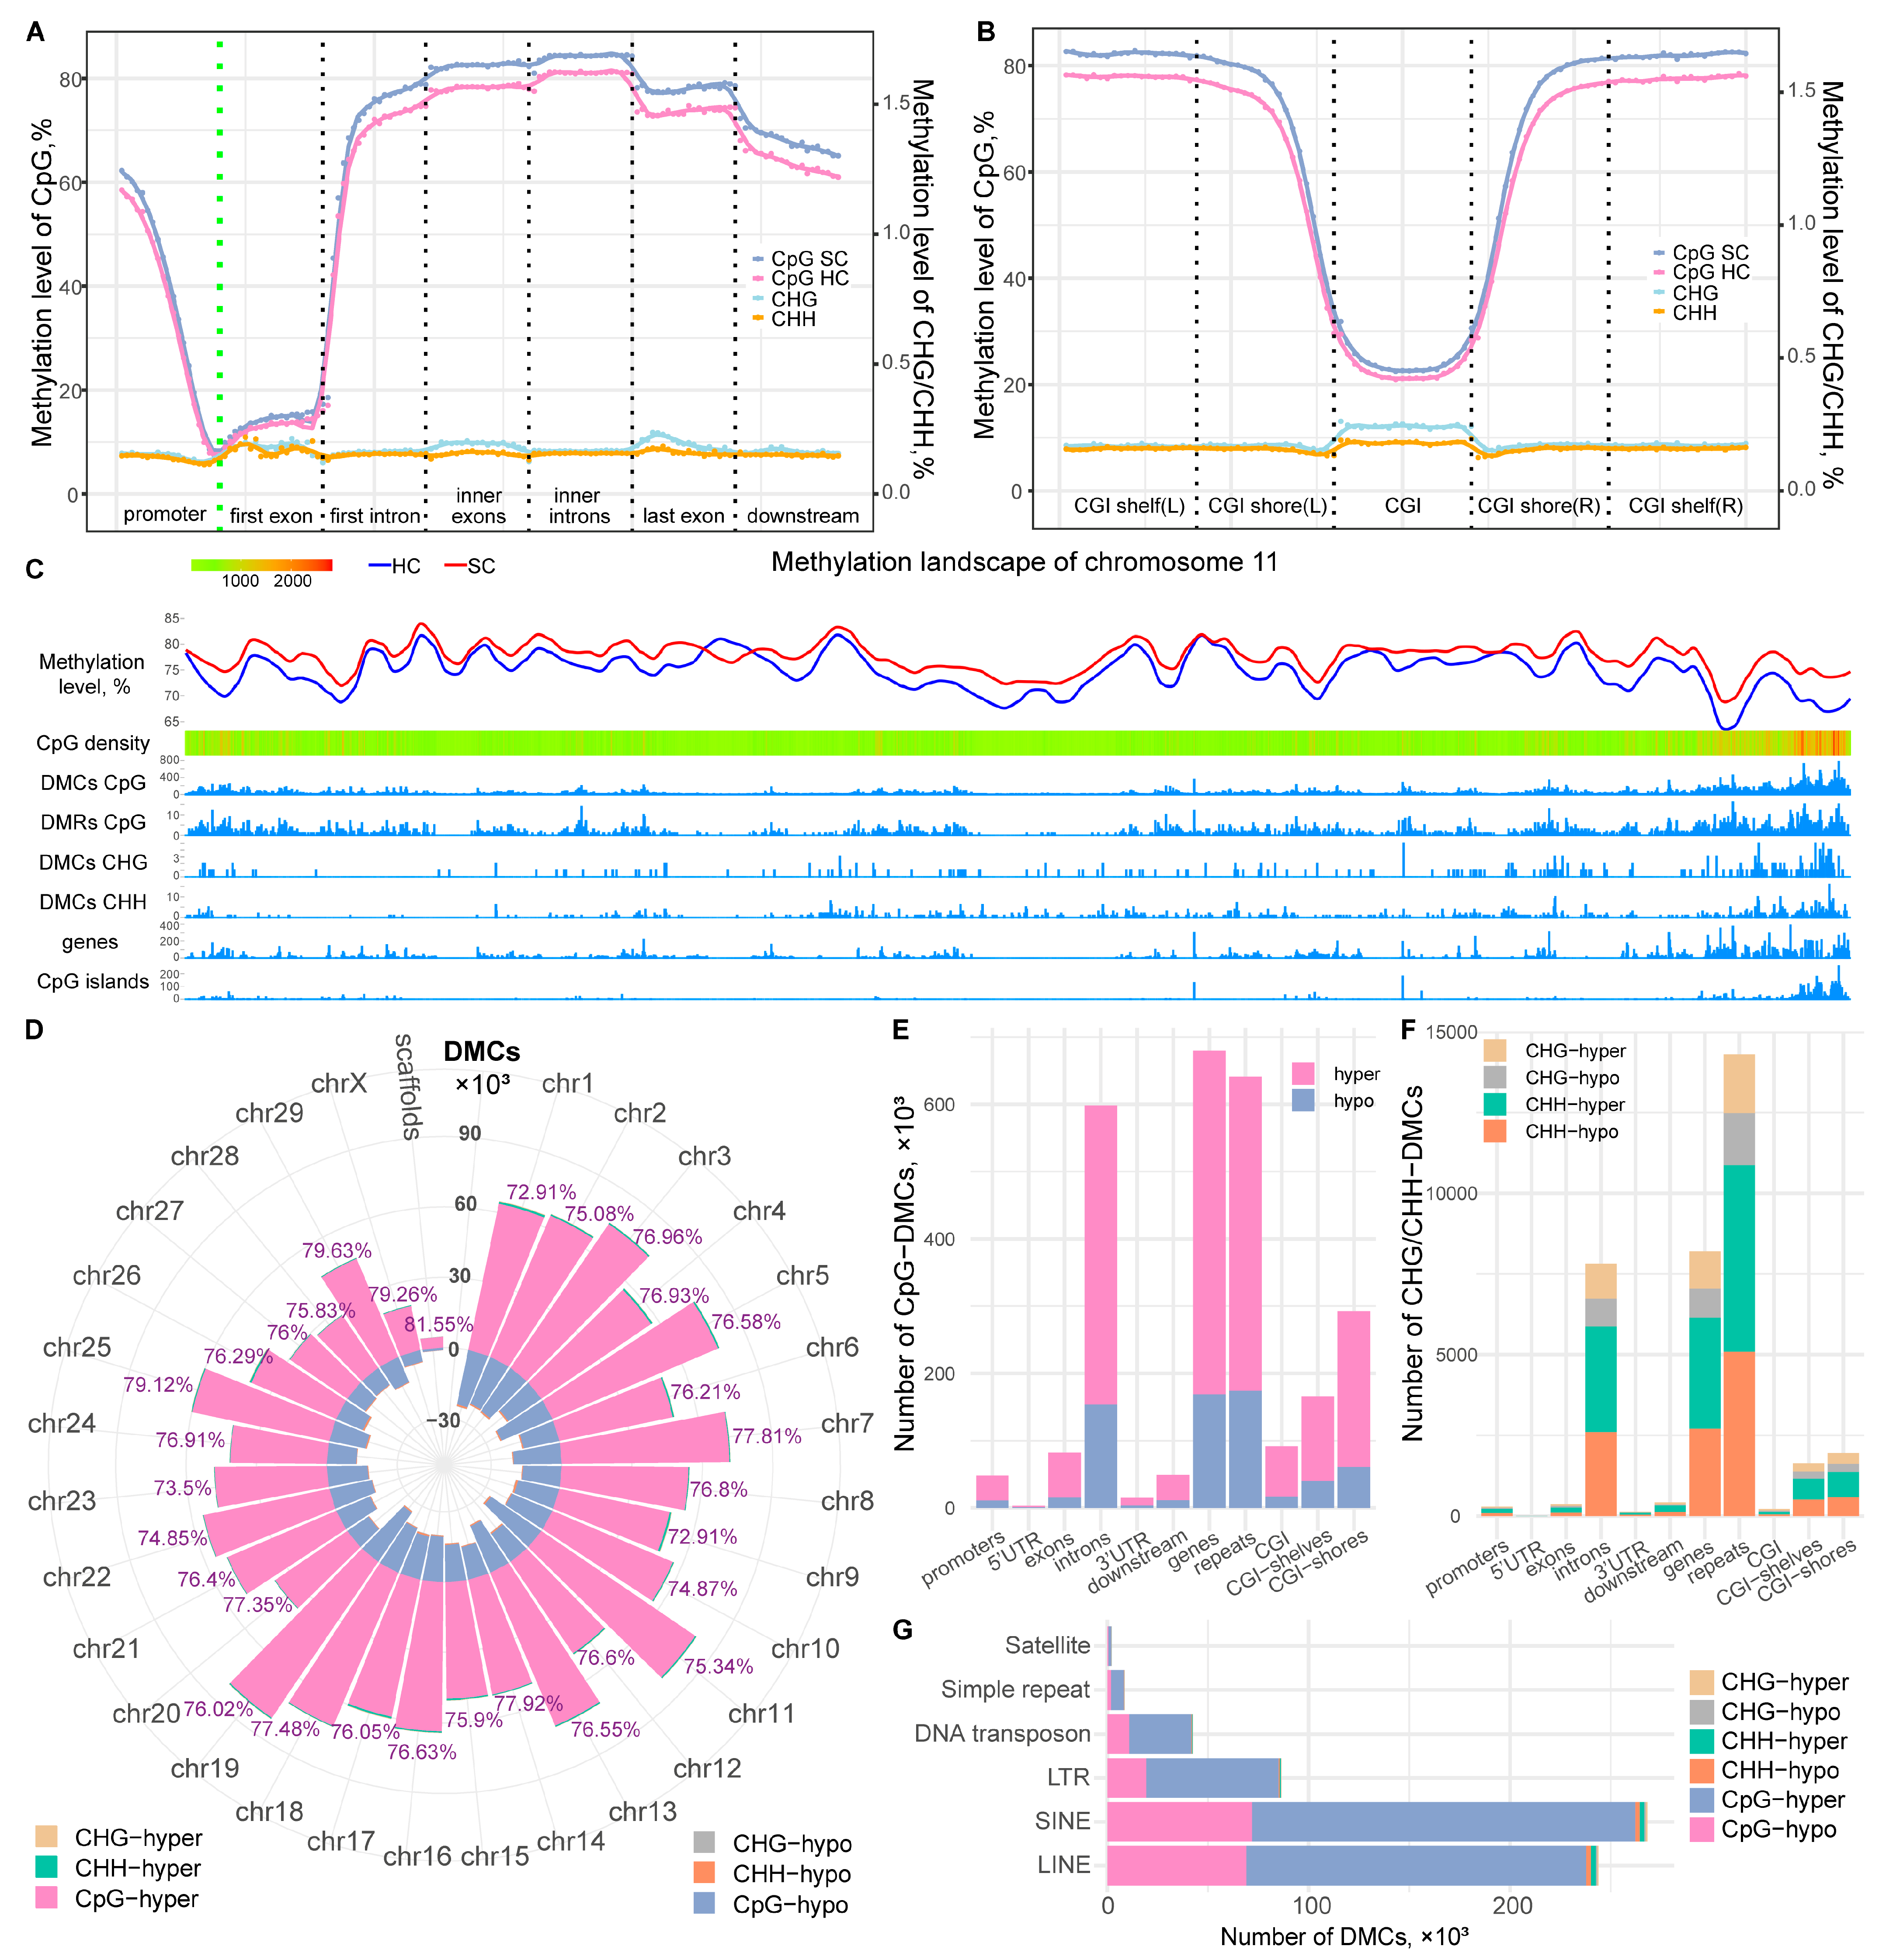
Abstract
:1. Introduction
2. Results
2.1. Methylome Profiling Revealed Abundant DNA Methylation Alterations during SC Subclinical Mastitis
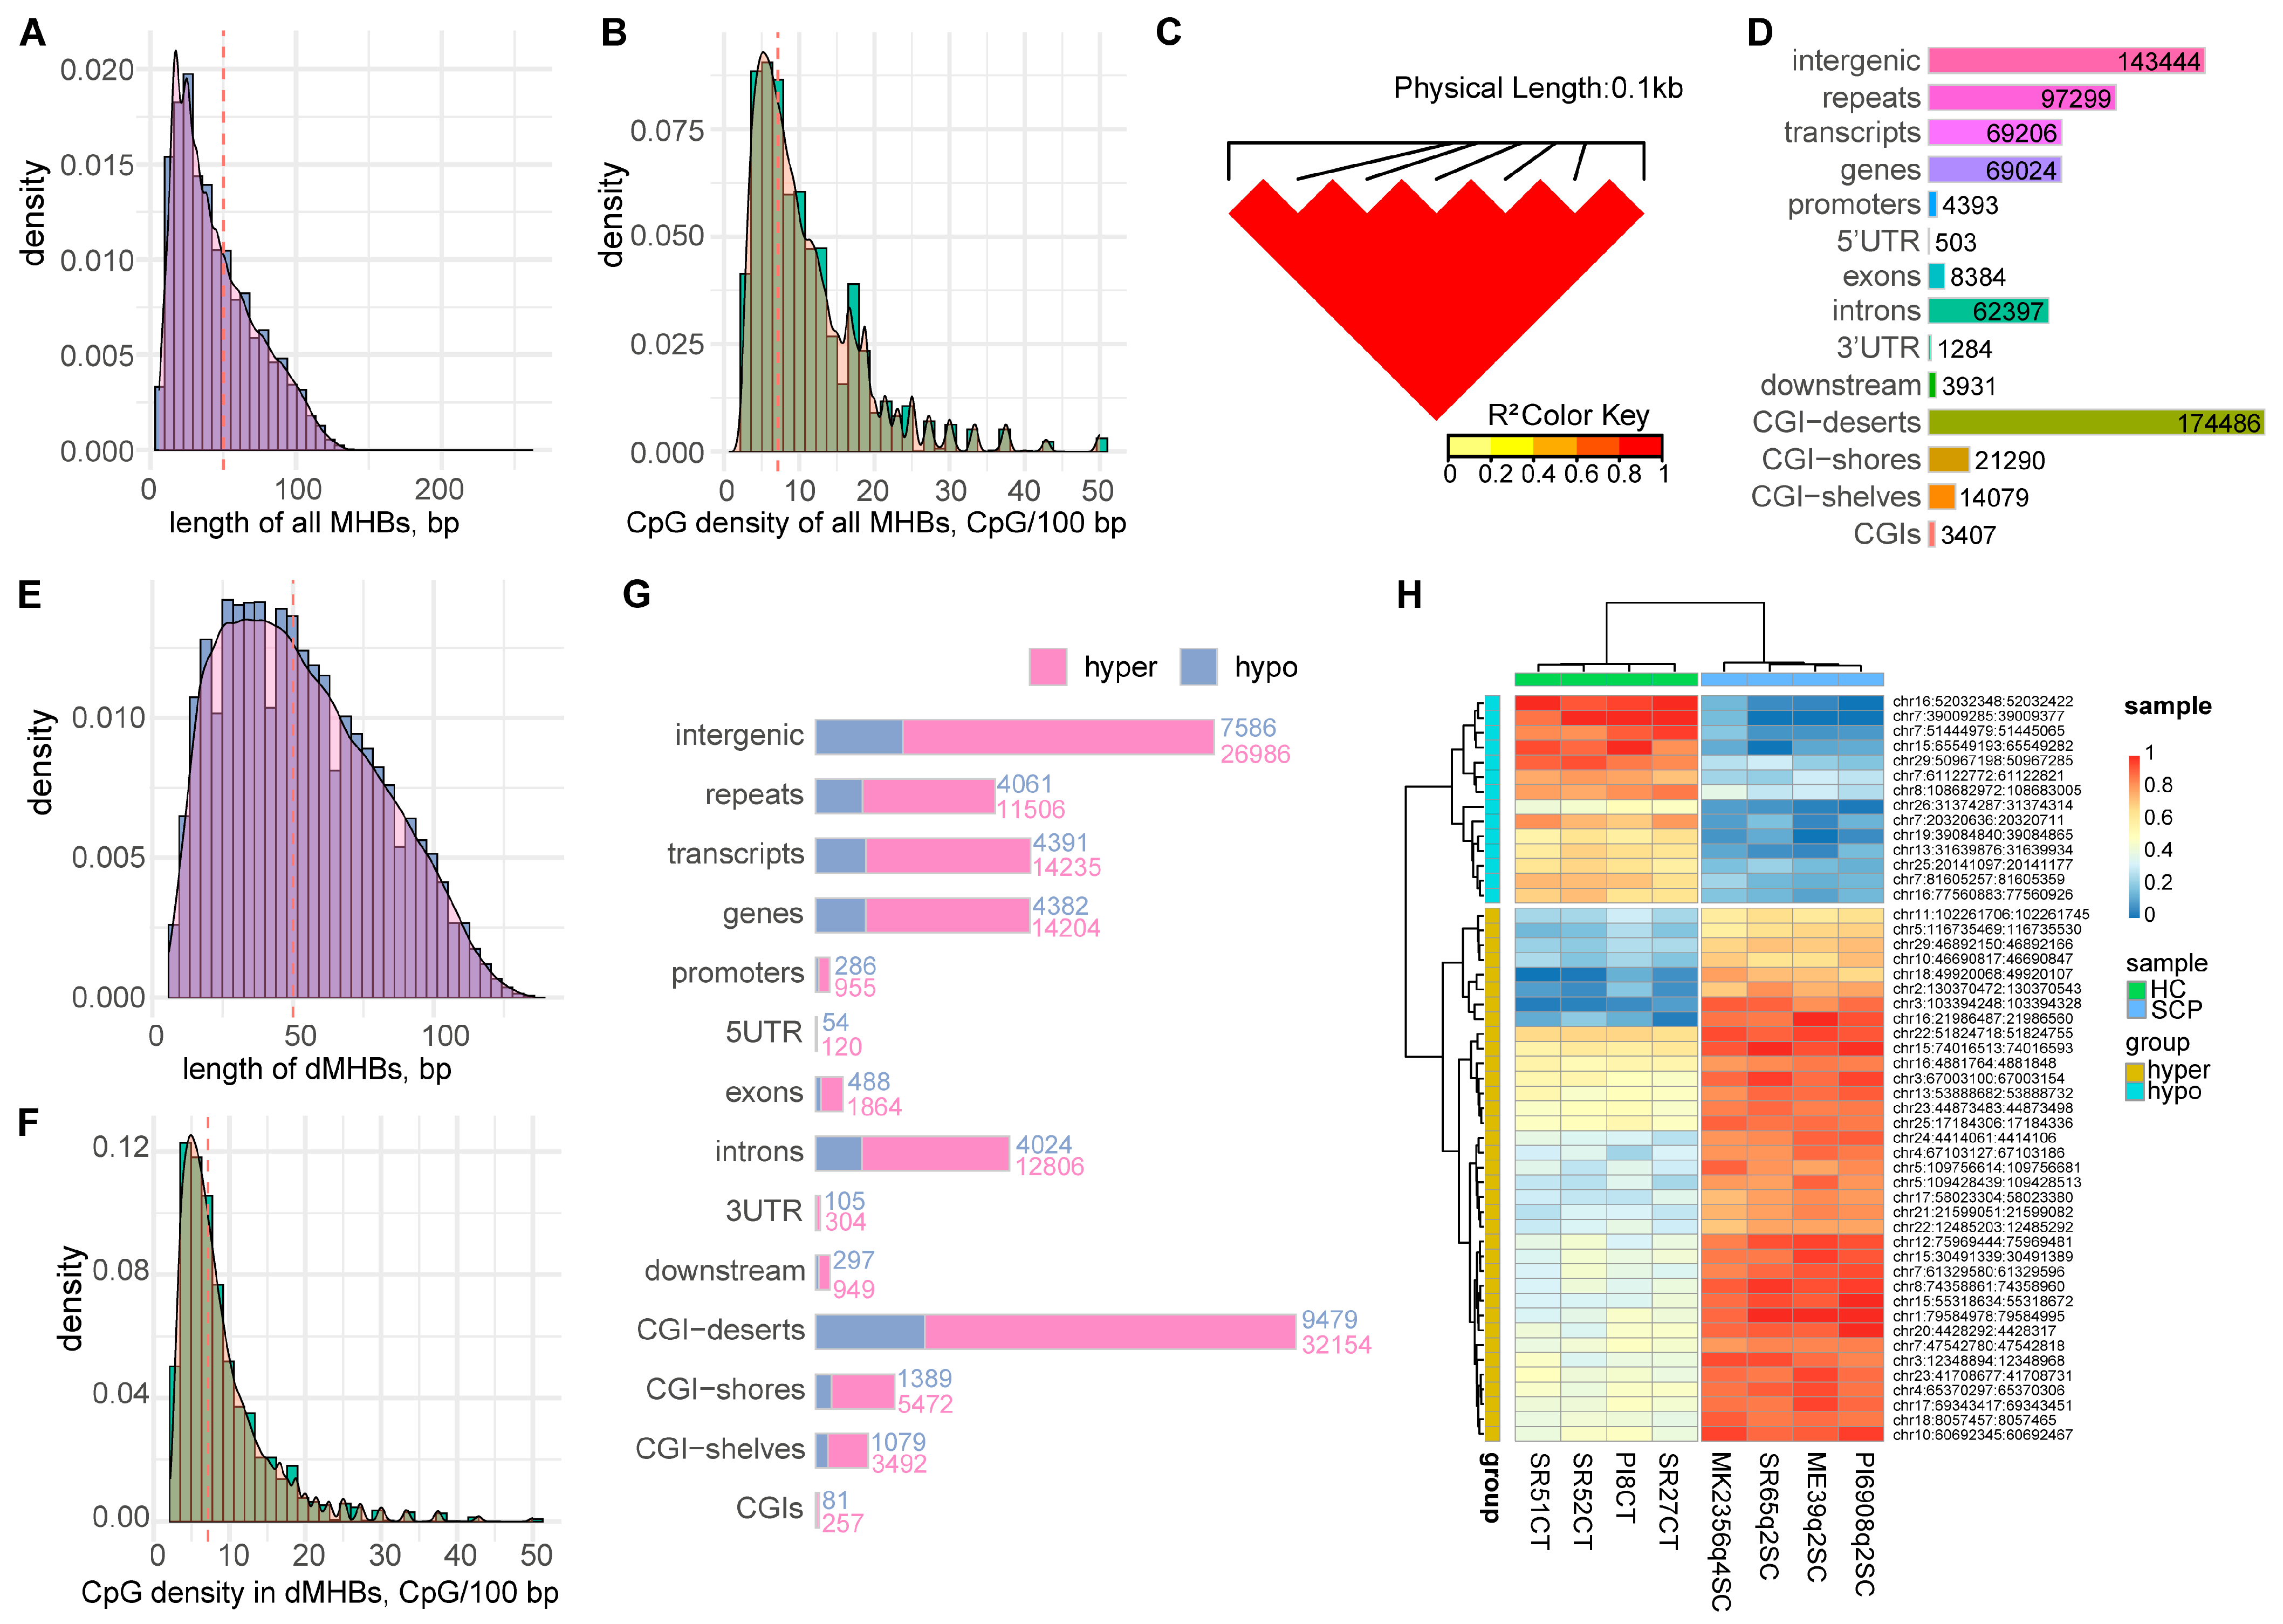
2.2. Identification of Methylation Haplotype Blocks
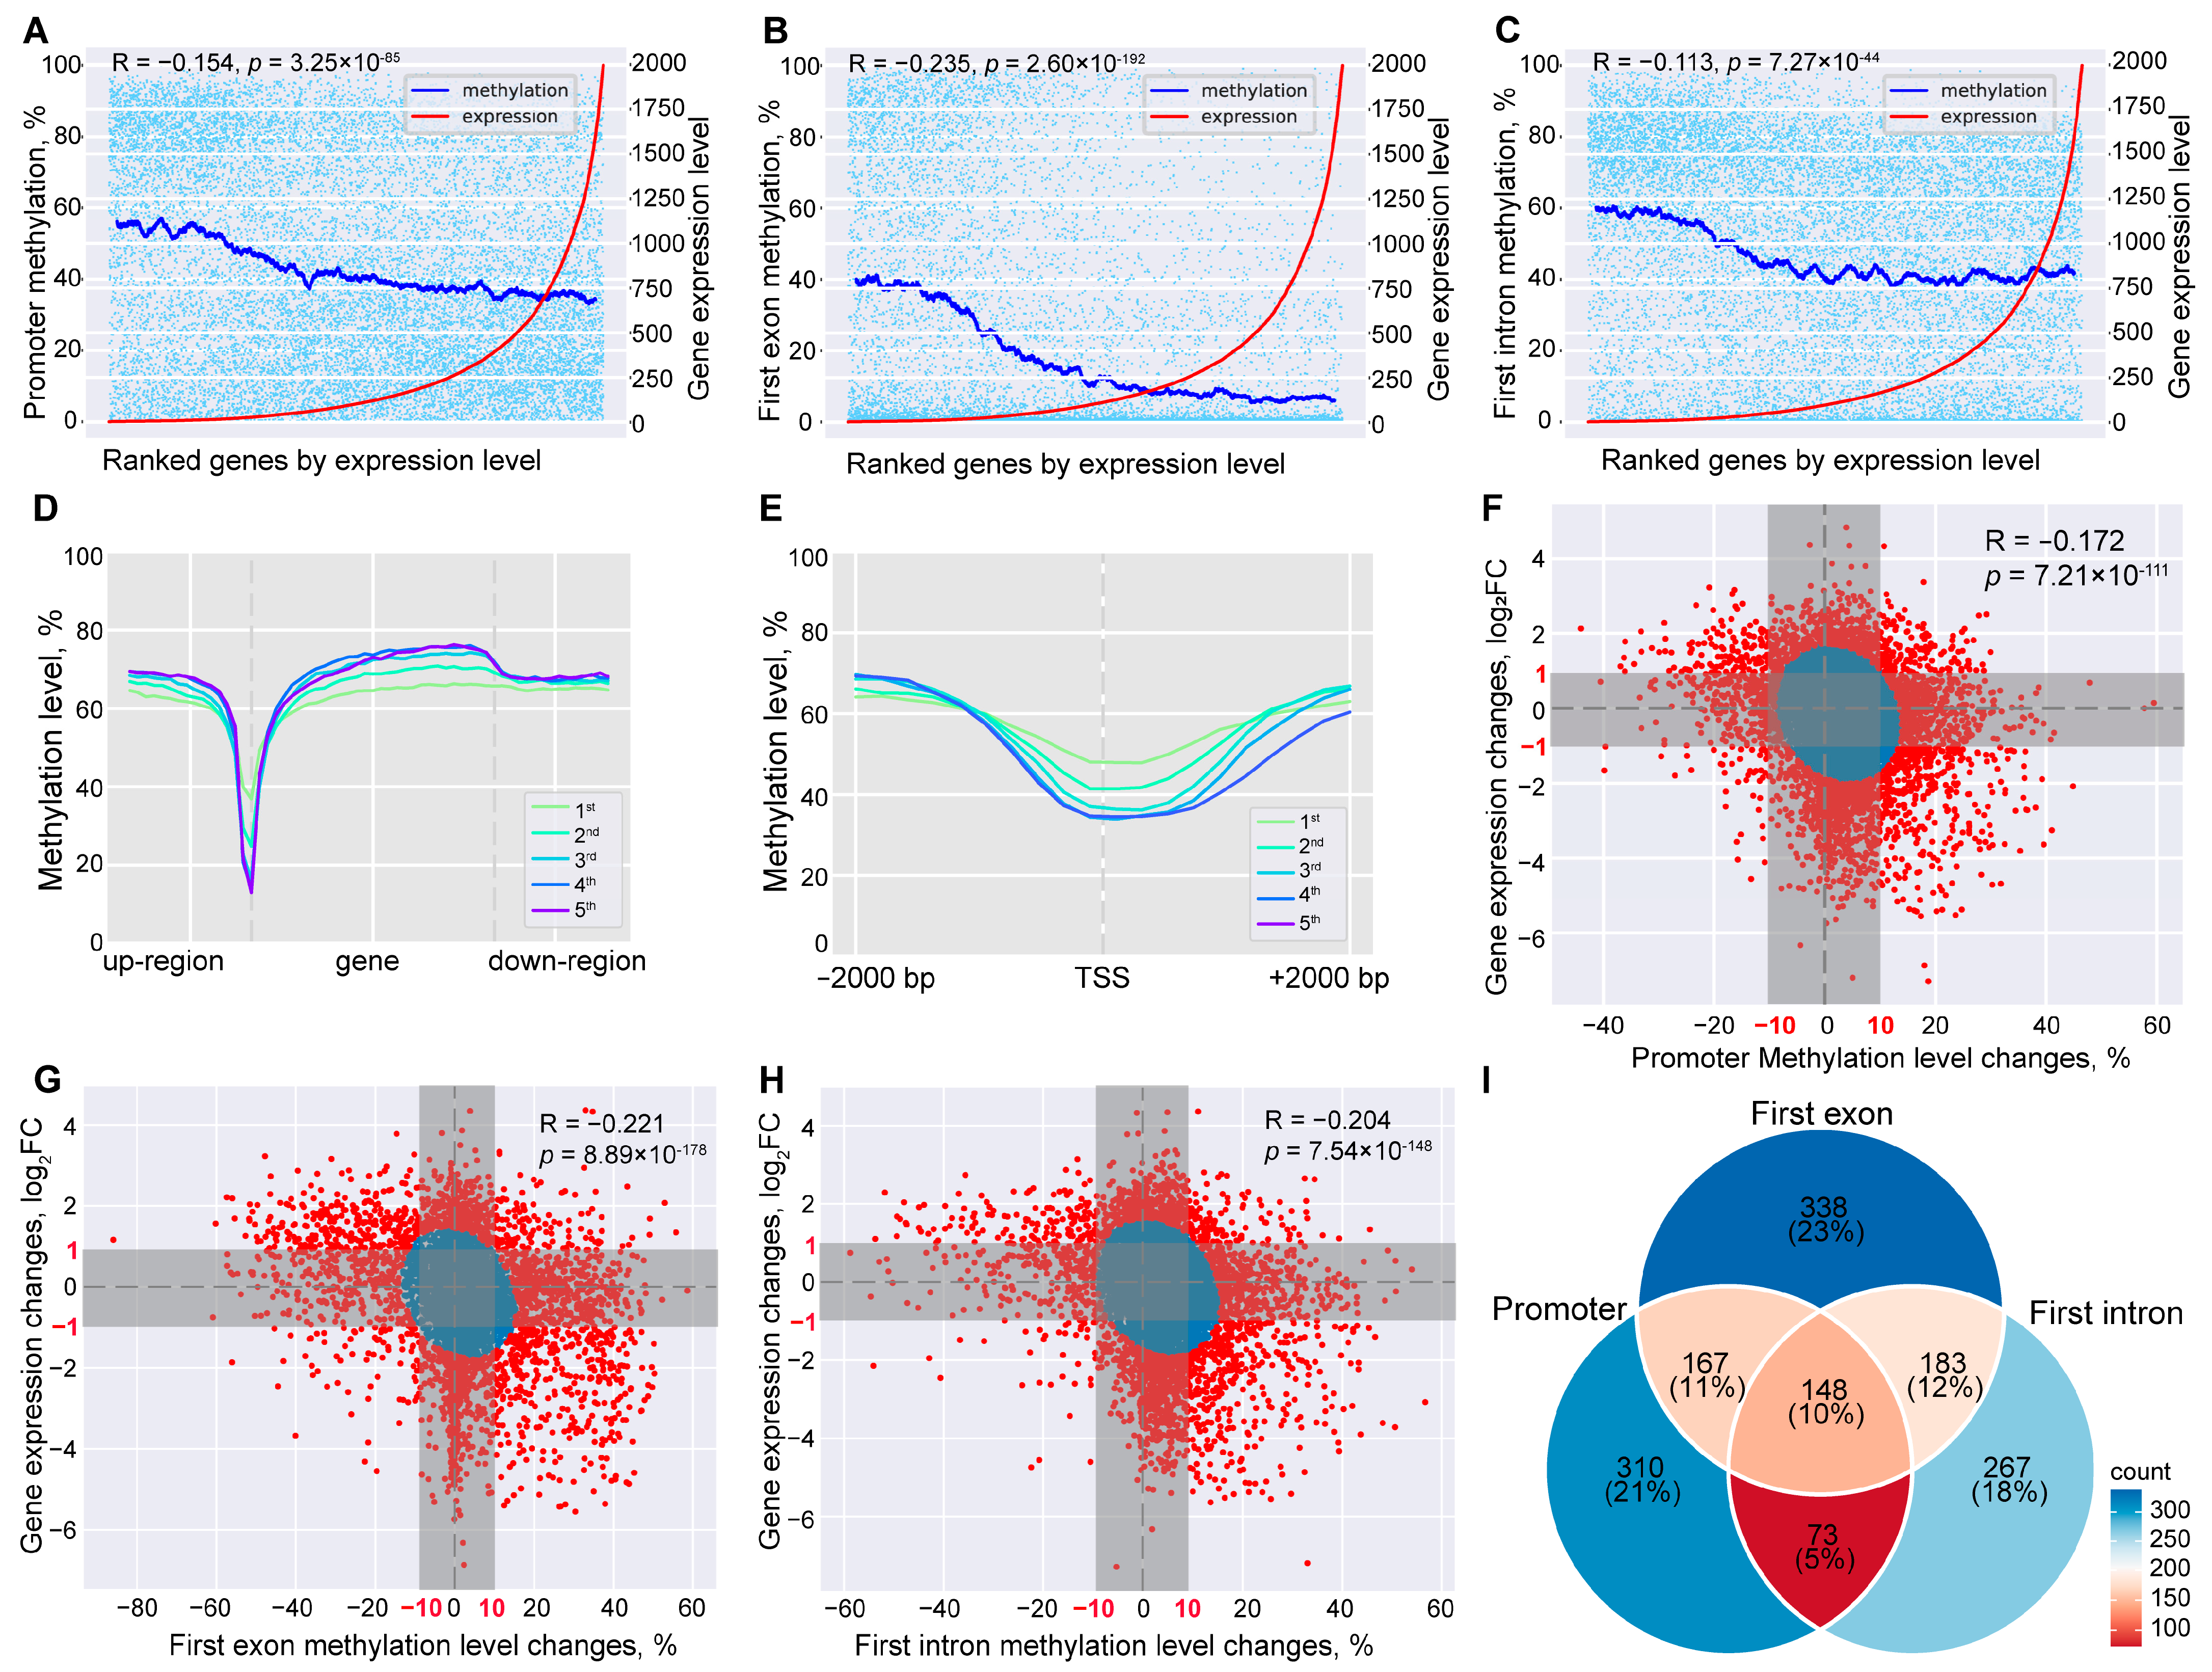
2.3. Global Methylome and Transcriptome Integration Indicates Negative Correlation
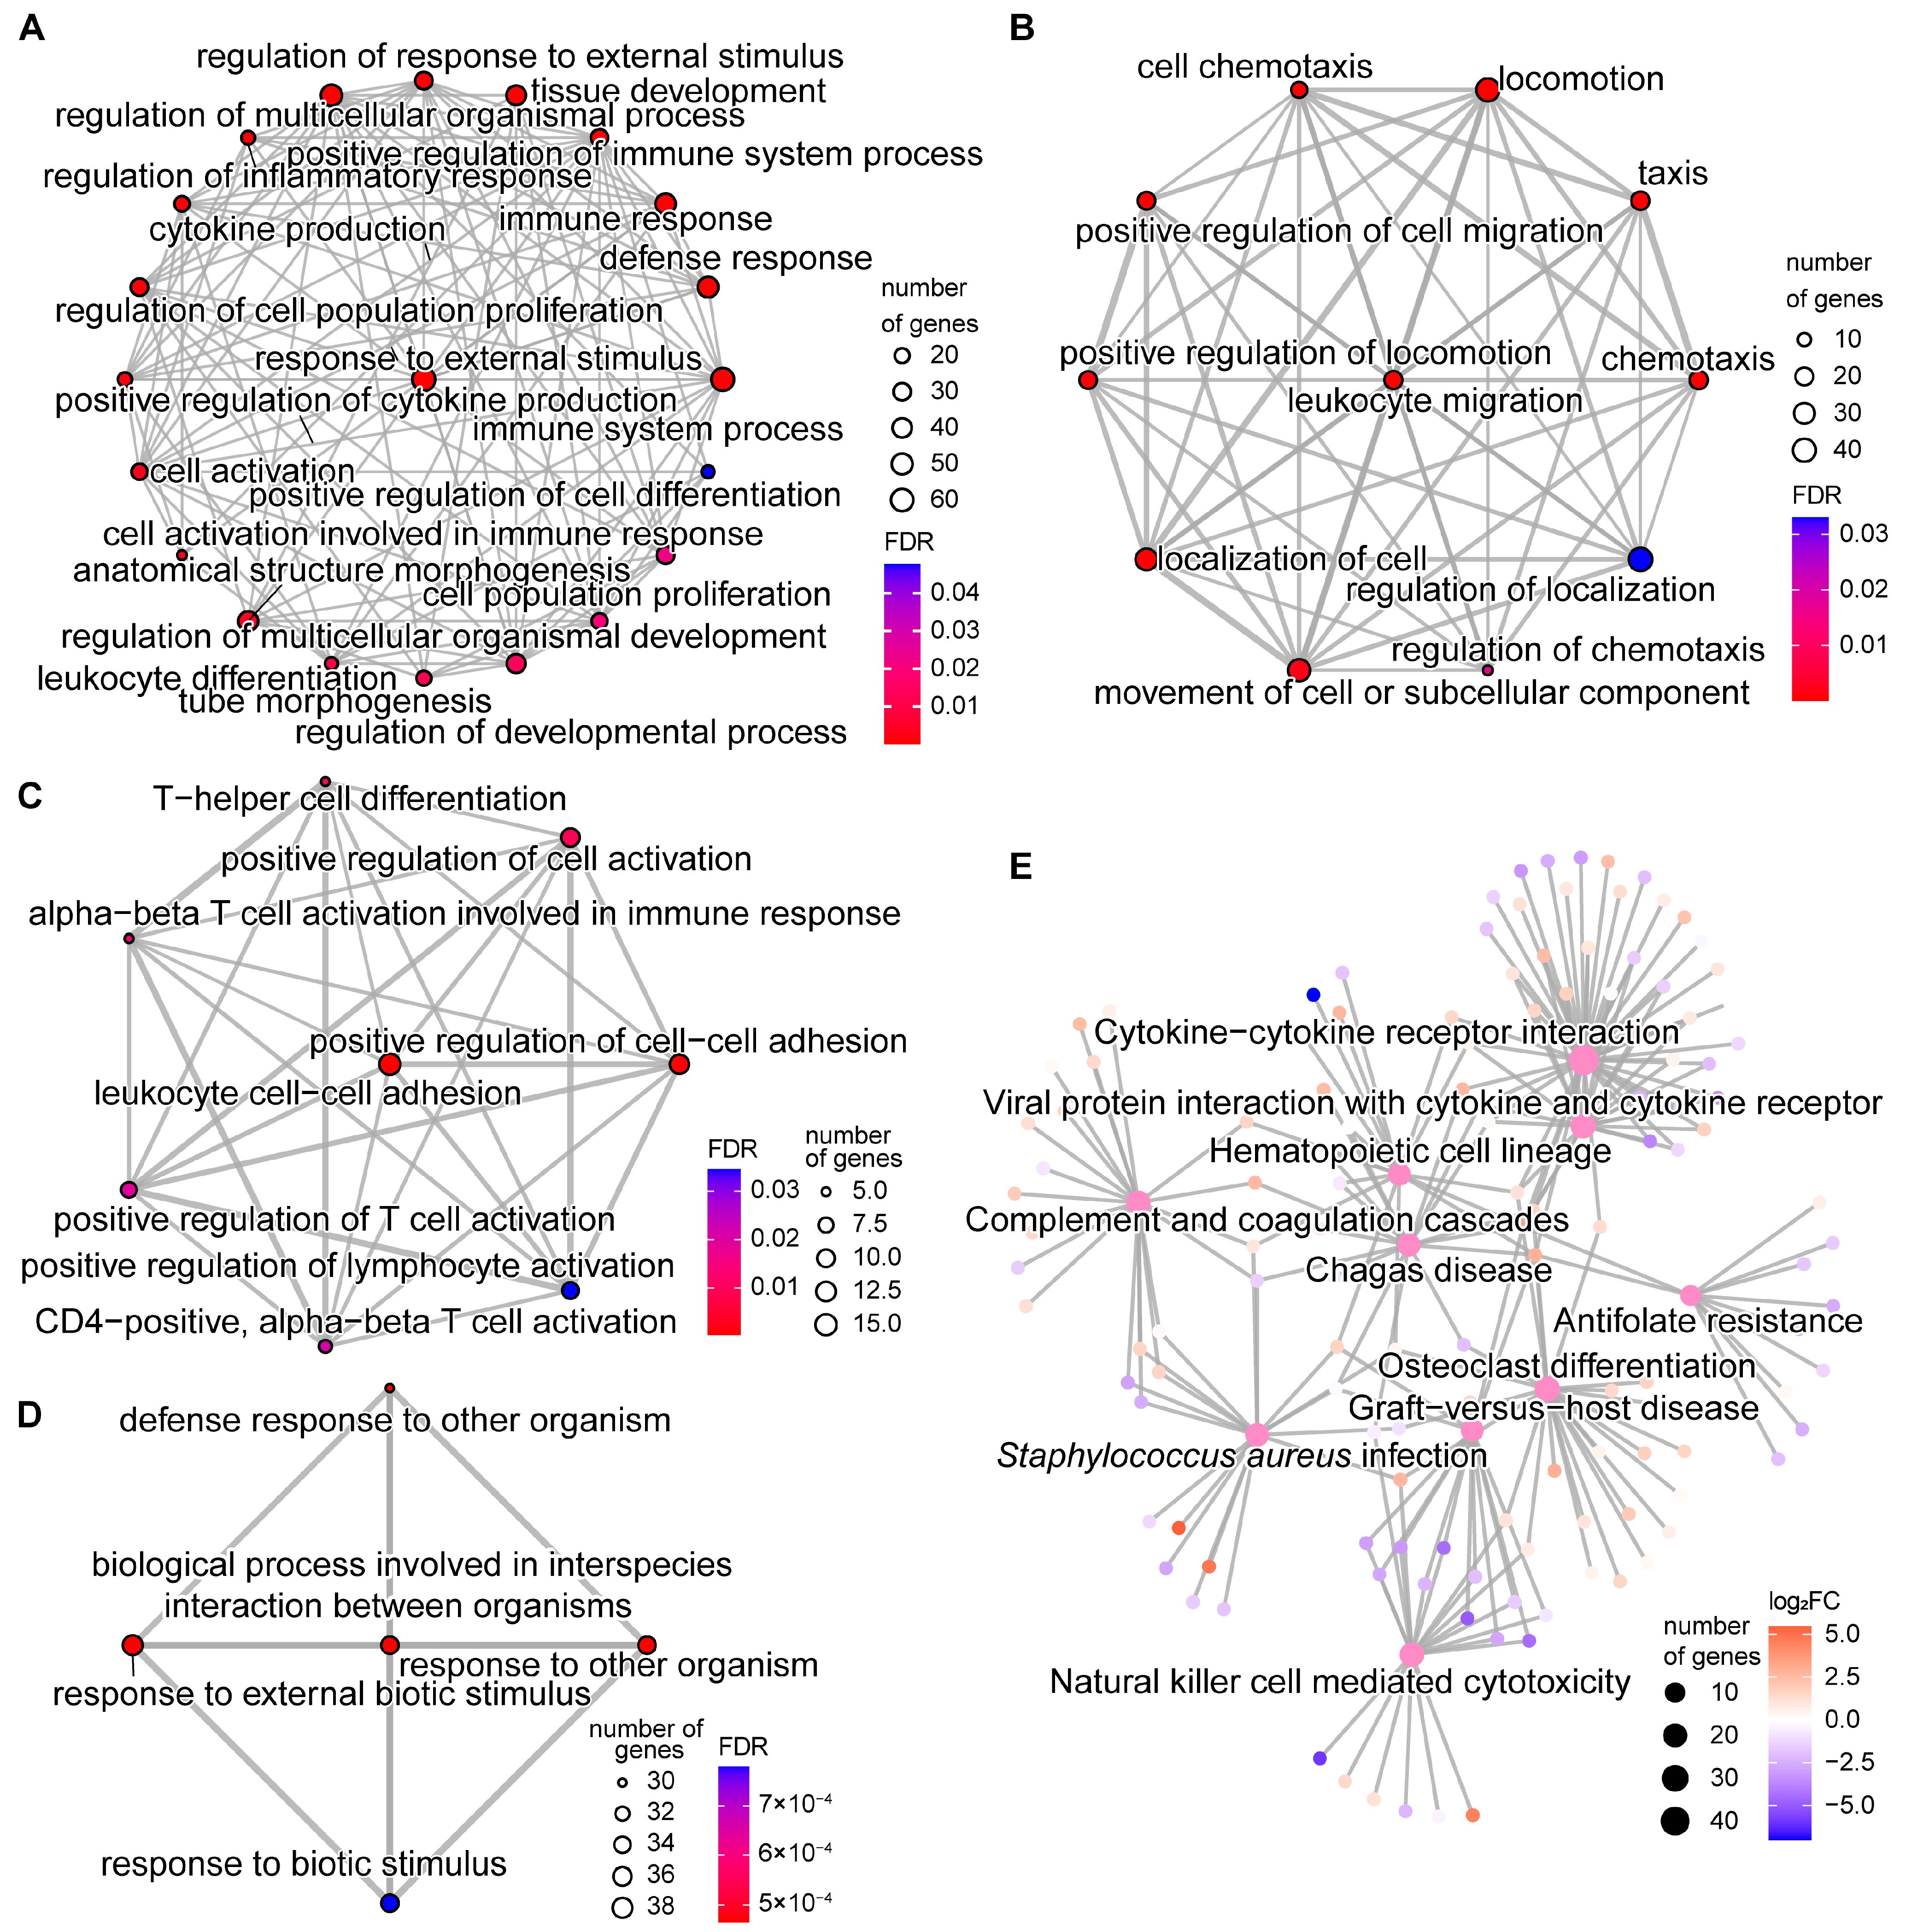
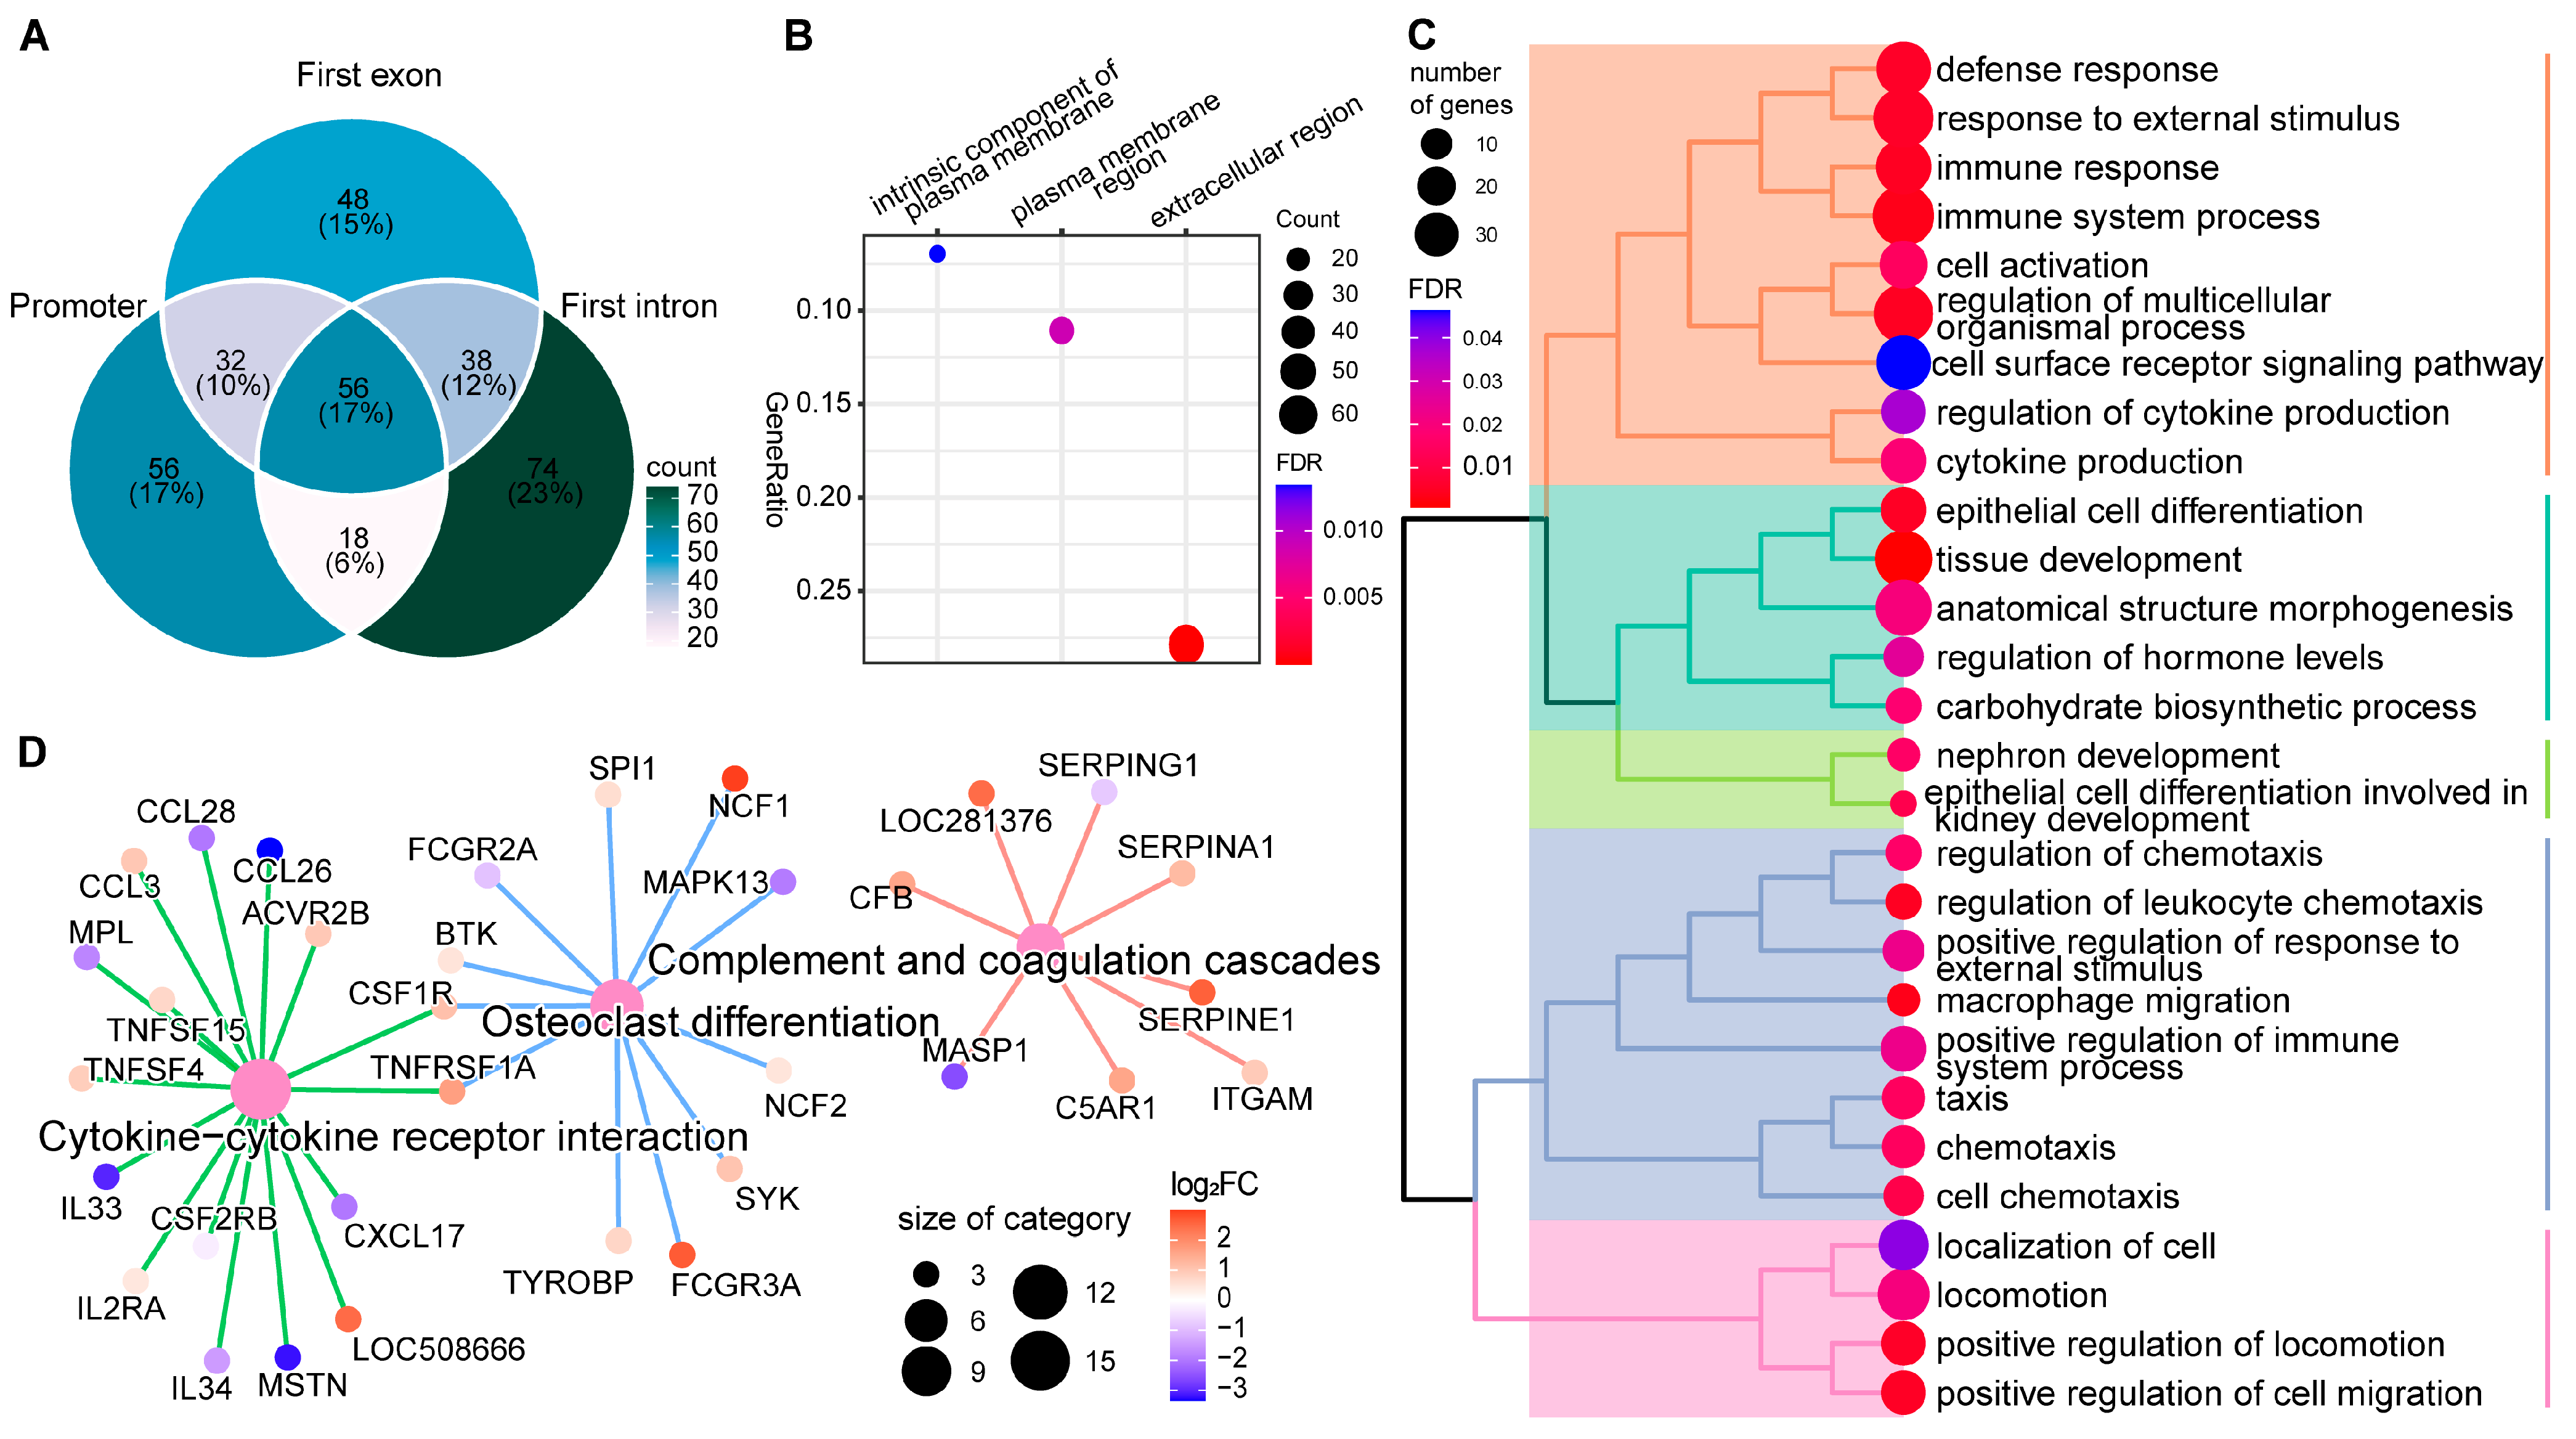
2.4. DNA Methylation Alterations’ Implication in the Regulation of Host Responses to SC Subclinical Mastitis
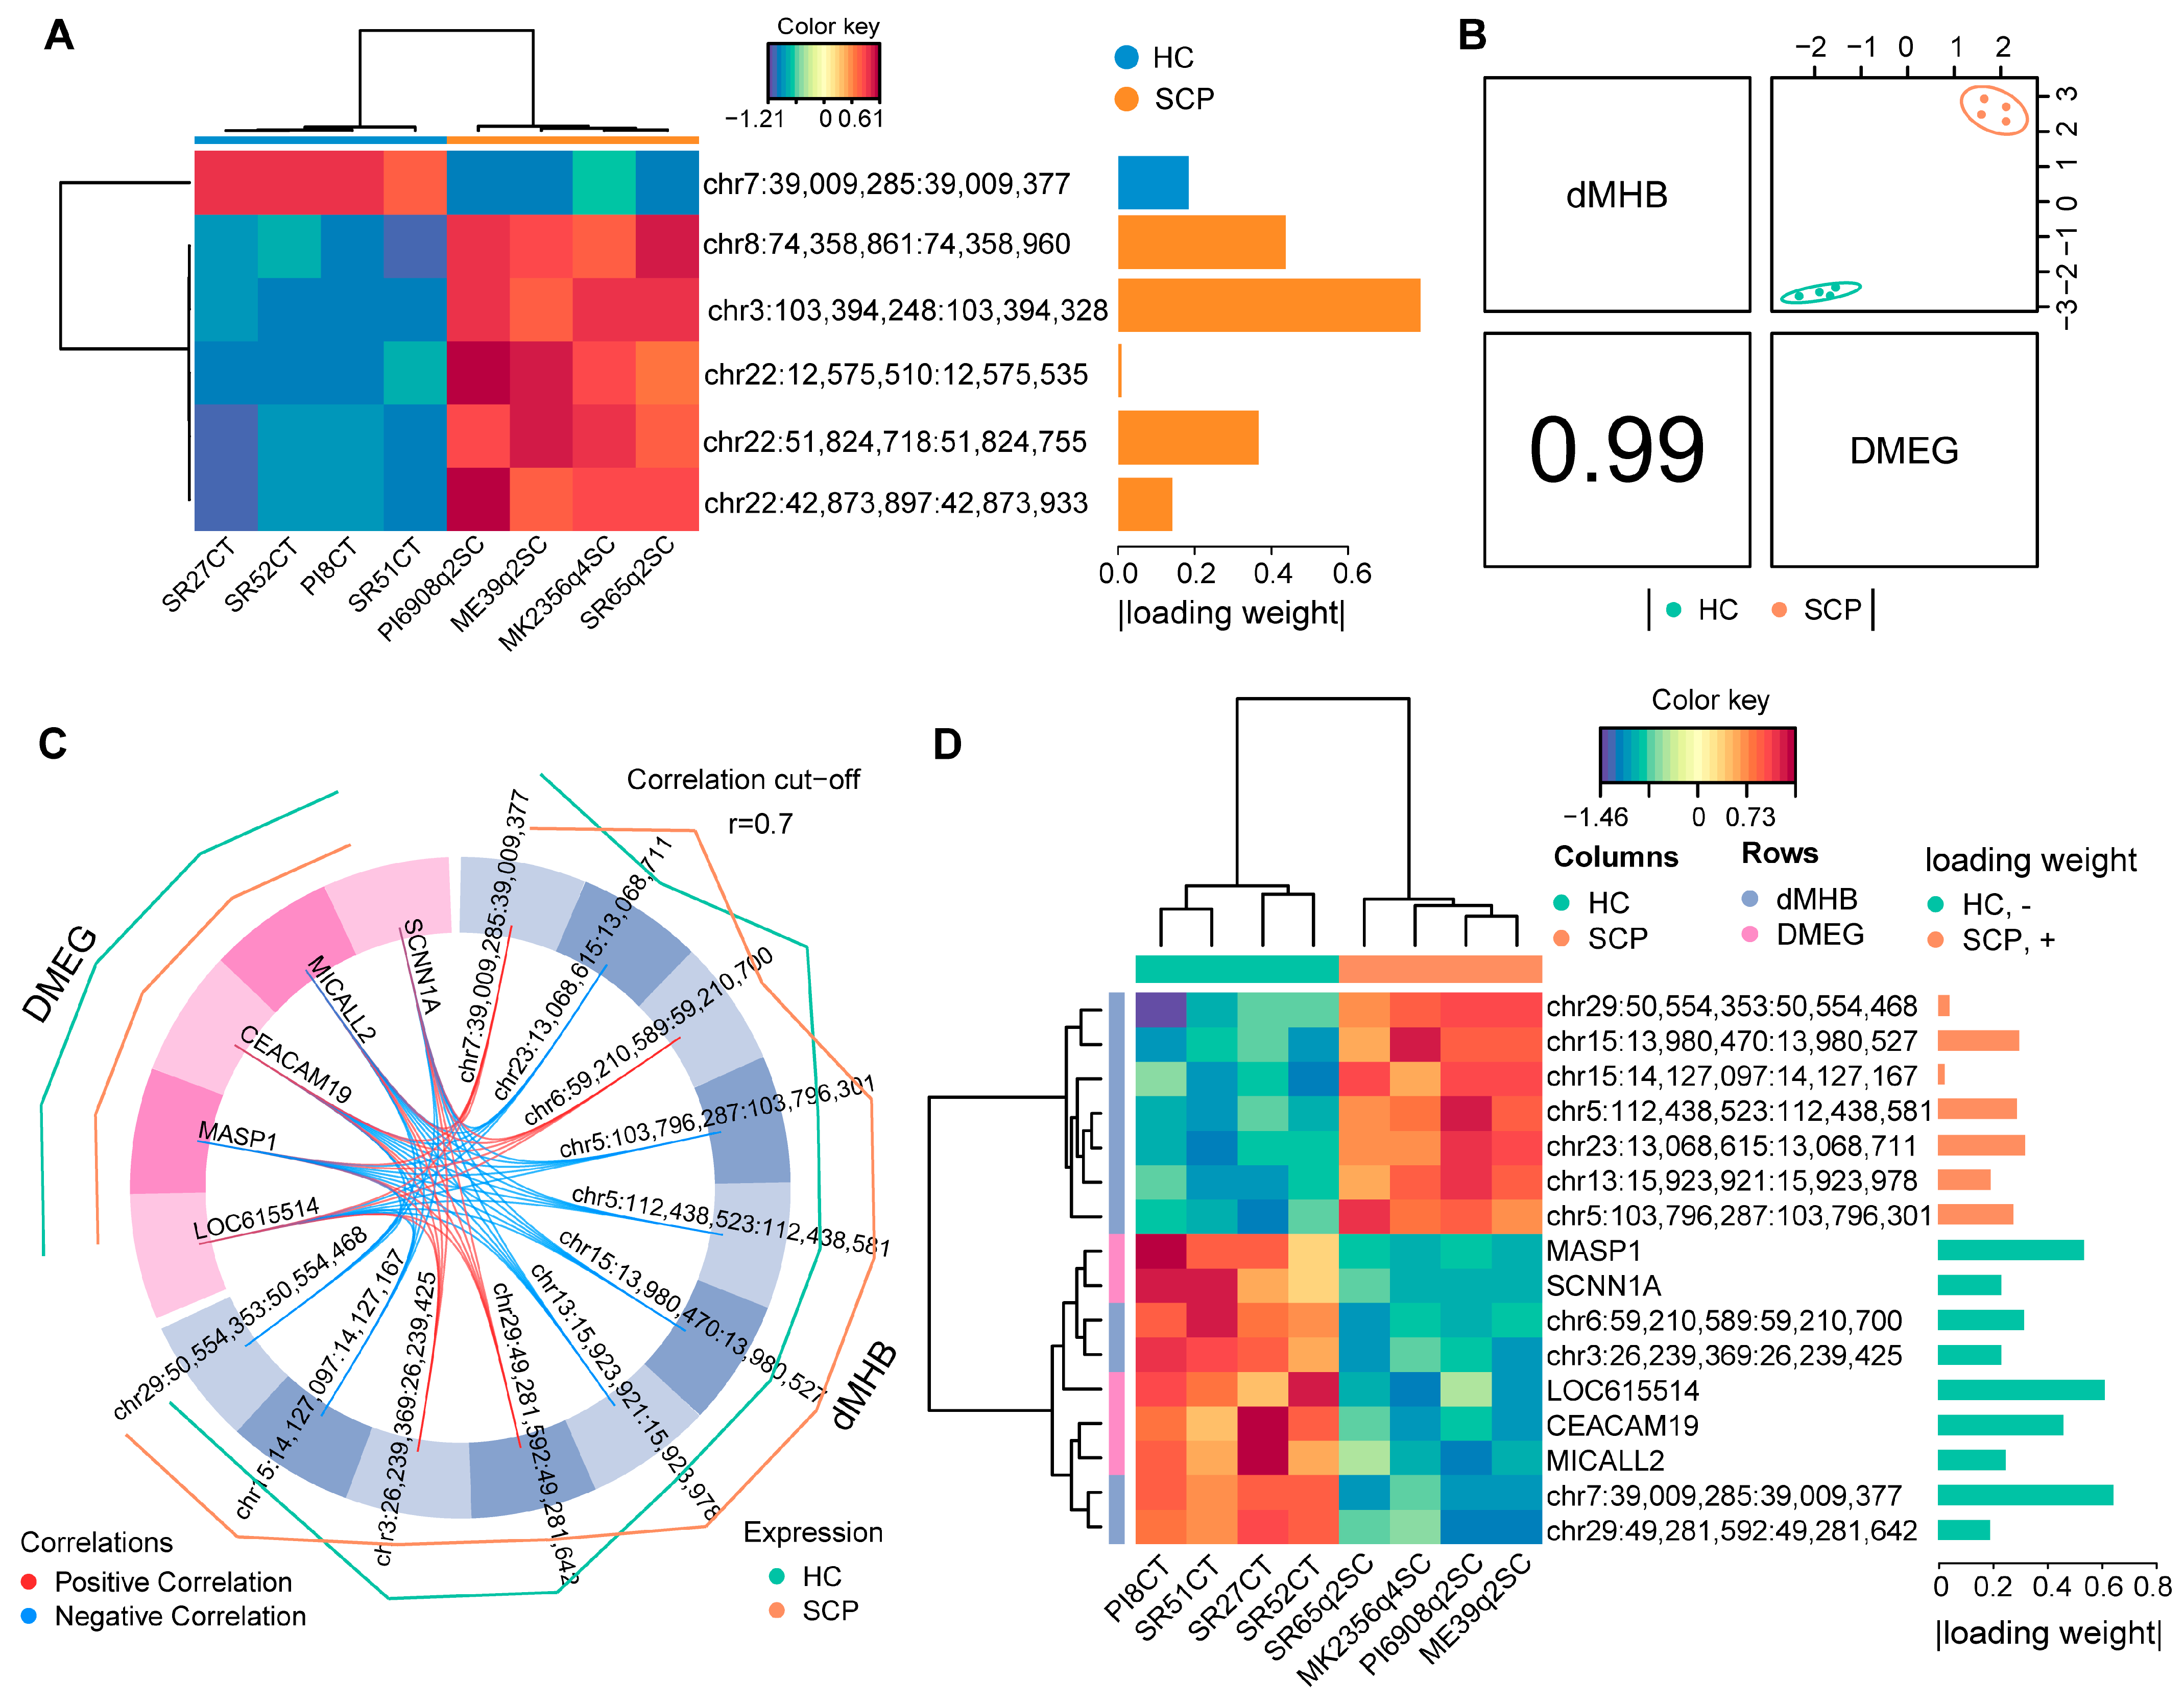
2.5. Identification of Candidate Discriminant Signatures Related to SC Subclinical Mastitis
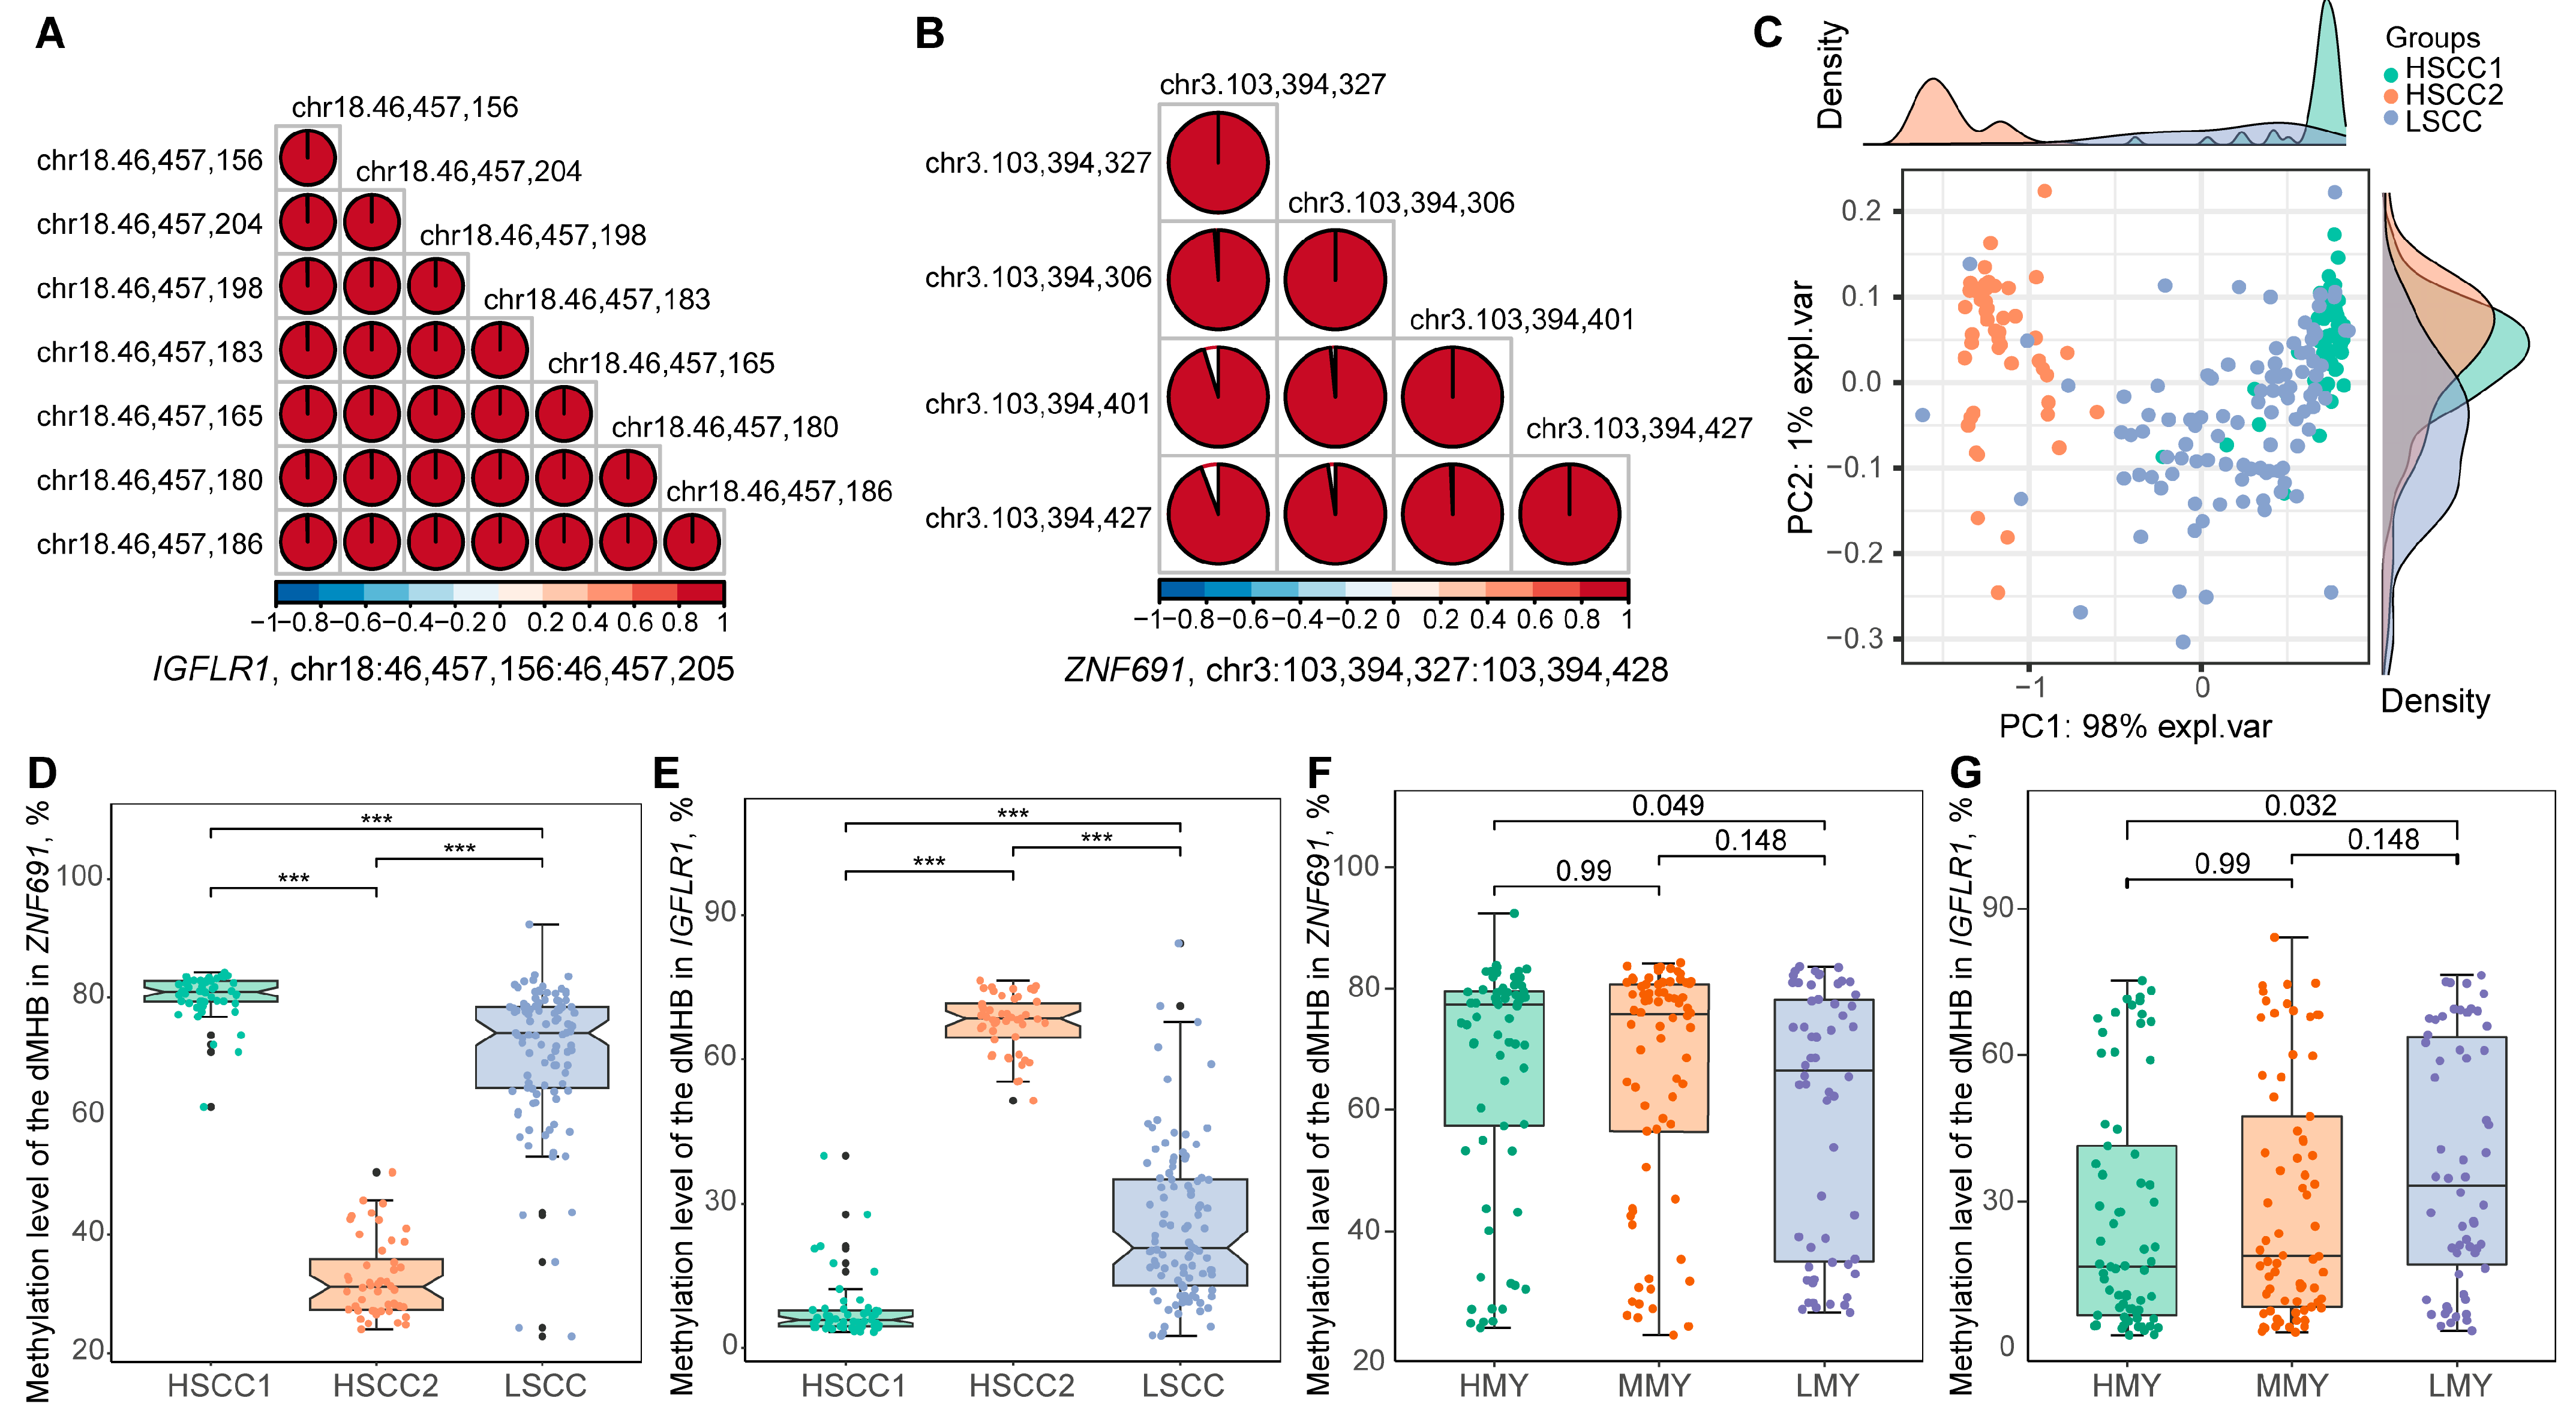
2.6. Two dMHBs Show Significant Associations with Mammary Gland Health and Milk Production in a Larger Sample Size
3. Discussion
4. Materials and Methods
4.1. Animals and Samples
4.2. DNA and RNA Isolation from Milk Somatic Cells
4.3. Whole Genome-Wide DNA Methylation Sequencing and Data Processing
4.4. Identification and Comparison of Methylation Haplotype Blocks
4.5. RNA Sequencing and Raw Data Processing
4.6. Methylome and Transcriptome Data Integration
4.7. Identification of Important Signatures for SC Subclinical Mastitis
4.8. Functional Analyses
4.9. Validation of Candidate Discriminant dMHB Signatures
Supplementary Materials
Author Contributions
Funding
Institutional Review Board Statement
Informed Consent Statement
Data Availability Statement
Acknowledgments
Conflicts of Interest
References
- Pyörälä, S.; Taponen, S. Coagulase-negative staphylococci—Emerging mastitis pathogens. Vet. Microbiol. 2009, 134, 3–8. [Google Scholar] [CrossRef] [PubMed] [Green Version]
- Idamokoro, E.M. Coagulase-negative staphylococci as an evolving mastitis causing organism in cows: A review. F1000Research 2022, 11, 824. [Google Scholar] [CrossRef]
- Condas, L.A.; De Buck, J.; Nobrega, D.B.; Carson, D.A.; Naushad, S.; De Vliegher, S.; Zadoks, R.N.; Middleton, J.R.; Dufour, S.; Kastelic, J.P. Prevalence of non-aureus staphylococci species causing intramammary infections in Canadian dairy herds. J. Dairy Sci. 2017, 100, 5592–5612. [Google Scholar] [CrossRef] [Green Version]
- Tremblay, Y.D.; Lamarche, D.; Chever, P.; Haine, D.; Messier, S.; Jacques, M. Characterization of the ability of coagulase-negative staphylococci isolated from the milk of Canadian farms to form biofilms. J. Dairy Sci. 2013, 96, 234–246. [Google Scholar] [CrossRef] [Green Version]
- Fry, P.; Middleton, J.; Dufour, S.; Perry, J.; Scholl, D.; Dohoo, I. Association of coagulase-negative staphylococcal species, mammary quarter milk somatic cell count, and persistence of intramammary infection in dairy cattle. J. Dairy Sci. 2014, 97, 4876–4885. [Google Scholar] [CrossRef] [PubMed] [Green Version]
- De Los Santos, R.; González-Revello, Á.; Majul, L.; Umpiérrez, A.; Aldrovandi, A.; Gil, A.; Hirigoyen, D.; Zunino, P. Subclinical bovine mastitis associated with Staphylococcus spp. in eleven Uruguayan dairy farms. J. Infect. Dev. Ctries. 2022, 16, 630–637. [Google Scholar] [CrossRef]
- Waller, K.P.; Aspán, A.; Nyman, A.; Persson, Y.; Andersson, U.G. CNS species and antimicrobial resistance in clinical and subclinical bovine mastitis. Vet. Microbiol. 2011, 152, 112–116. [Google Scholar] [CrossRef] [PubMed] [Green Version]
- Thorberg, B.-M.; Danielsson-Tham, M.-L.; Emanuelson, U.; Waller, K.P. Bovine subclinical mastitis caused by different types of coagulase-negative staphylococci. J. Dairy Sci. 2009, 92, 4962–4970. [Google Scholar] [CrossRef] [Green Version]
- Verhoeff, J.; Van de Geer, D.; Hagens, F. Effects of a mastitis control programme on the incidence of clinical mastitis. Vet. Q. 1981, 3, 158–208. [Google Scholar] [CrossRef]
- Timms, L.; Schultz, L. Dynamics and significance of coagulase-negative staphylococcal intramammary infections. J. Dairy Sci. 1987, 70, 2648–2657. [Google Scholar] [CrossRef]
- Simojoki, H.; Orro, T.; Taponen, S.; Pyörälä, S. Host response in bovine mastitis experimentally induced with Staphylococcus chromogenes. Vet. Microbiol. 2009, 134, 95–99. [Google Scholar] [CrossRef] [PubMed] [Green Version]
- Lasagno, M.; Ortiz, M.; Vissio, C.; Yaciuk, R.; Bonetto, C.; Pellegrino, M.; Bogni, C.; Odierno, L.; Raspanti, C. Pathogenesis and inflammatory response in experimental caprine mastitis due to Staphylococcus chromogenes. Microb. Pathog. 2018, 116, 146–152. [Google Scholar] [CrossRef] [PubMed]
- Salaberry, S.R.S.; Saidenberg, A.B.S.; Zuniga, E.; Melville, P.A.; Santos, F.G.B.; Guimarães, E.C.; Gregori, F.; Benites, N.R. Virulence factors genes of Staphylococcus spp. isolated from caprine subclinical mastitis. Microb. Pathog. 2015, 85, 35–39. [Google Scholar] [CrossRef]
- Kim, S.-J.; Moon, D.C.; Park, S.-C.; Kang, H.Y.; Na, S.H.; Lim, S.-K. Antimicrobial resistance and genetic characterization of coagulase-negative staphylococci from bovine mastitis milk samples in Korea. J. Dairy Sci. 2019, 102, 11439–11448. [Google Scholar] [CrossRef] [PubMed]
- Chajęcka-Wierzchowska, W.; Zadernowska, A.; Gajewska, J.S. epidermidis strains from artisanal cheese made from unpasteurized milk in Poland-Genetic characterization of antimicrobial resistance and virulence determinants. Int. J. Food Microbiol. 2019, 294, 55–59. [Google Scholar] [CrossRef]
- Dorneles, E.M.; Fonseca, M.D.; Abreu, J.A.; Lage, A.P.; Brito, M.A.; Pereira, C.R.; Brandão, H.M.; Guimarães, A.S.; Heinemann, M.B. Genetic diversity and antimicrobial resistance in Staphylococcus aureus and coagulase-negative Staphylococcus isolates from bovine mastitis in Minas Gerais, Brazil. Microbiologyopen 2019, 8, e00736. [Google Scholar] [CrossRef] [PubMed] [Green Version]
- Ibeagha-Awemu, E.M.; Yu, Y. Consequence of epigenetic processes on animal health and productivity: Is additional level of regulation of relevance? Anim. Front. 2021, 11, 7–18. [Google Scholar] [CrossRef]
- Wang, M.; Ibeagha-Awemu, E.M. Impacts of epigenetic processes on the health and productivity of livestock. Front. Genet. 2021, 11, 613636. [Google Scholar] [CrossRef]
- Ibeagha-Awemu, E.M.; Khatib, H. Epigenetics of Livestock Health, Production, and Breeding. In Handbook of Epigenetics: The New Molecular and Medical Genetics, 3rd ed.; Tollefsbol, T.O., Ed.; Academic Press: Cambridge, MA, USA, 2023; Volume 29, pp. 569–610. [Google Scholar] [CrossRef]
- Law, P.-P.; Holland, M.L. DNA methylation at the crossroads of gene and environment interactions. Essays Biochem. 2019, 63, 717–726. [Google Scholar] [CrossRef]
- Greenberg, M.V.; Bourc’his, D. The diverse roles of DNA methylation in mammalian development and disease. Nat. Rev. Mol. Cell Biol. 2019, 20, 590–607. [Google Scholar] [CrossRef]
- Chen, J.; Wu, Y.; Sun, Y.; Dong, X.; Wang, Z.; Zhang, Z.; Xiao, Y.; Dong, G. Bacterial lipopolysaccharide induced alterations of genome-wide DNA methylation and promoter methylation of lactation-related genes in bovine mammary epithelial cells. Toxins 2019, 11, 298. [Google Scholar] [CrossRef] [PubMed] [Green Version]
- Nayan, V.; Singh, K.; Iquebal, M.A.; Jaiswal, S.; Bhardwaj, A.; Singh, C.; Bhatia, T.; Kumar, S.; Singh, R.; Swaroop, M. Genome-wide DNA methylation and its effect on gene expression during subclinical mastitis in water buffalo. Front. Genet. 2022, 13, 297. [Google Scholar] [CrossRef] [PubMed]
- Usman, T.; Yu, Y.; Wang, Y. CD4 promoter hyper methylation is associated with lower gene expression in clinical mastitis cows and vice versa in the healthy controls. J. Anim. Sci. 2016, 94, 38. [Google Scholar] [CrossRef]
- Semik-Gurgul, E.; Ząbek, T.; Kawecka-Grochocka, E.; Zalewska, M.; Kościuczuk, E.; Bagnicka, E. Epigenetic states of genes controlling immune responsiveness in bovine chronic mastitis. Ann. Anim. Sci. 2022, 22, 575–581. [Google Scholar] [CrossRef]
- Dong, Y.; An, D.; Wang, J.; Liu, H.; Zhang, Q.; Zhao, J.; Lu, W. Effect of DNA methylation on LPS-induced expression of tumour necrosis factor alpha (TNF-α) in bovine mammary epithelial cells. Indian J. Anim. Res. 2021, 55, 1079–1084. [Google Scholar] [CrossRef]
- Wu, Y.; Chen, J.; Sun, Y.; Dong, X.; Wang, Z.; Chen, J.; Dong, G. PGN and LTA from Staphylococcus aureus induced inflammation and decreased lactation through regulating DNA methylation and histone H3 acetylation in bovine mammary epithelial cells. Toxins 2020, 12, 238. [Google Scholar] [CrossRef] [PubMed] [Green Version]
- Di Pasquale, P.; Caterino, M.; Di Somma, A.; Squillace, M.; Rossi, E.; Landini, P.; Iebba, V.; Schippa, S.; Papa, R.; Selan, L. Exposure of E. coli to DNA-methylating agents impairs biofilm formation and invasion of eukaryotic cells via down regulation of the N-acetylneuraminate lyase NanA. Front. Microbiol. 2016, 7, 147. [Google Scholar] [CrossRef]
- Militello, K.T.; Mandarano, A.H.; Varechtchouk, O.; Simon, R.D. Cytosine DNA methylation influences drug resistance in Escherichia coli through increased sugE expression. FEMS Microbiol. Lett. 2014, 350, 100–106. [Google Scholar] [CrossRef]
- Korotetskiy, I.S.; Jumagaziyeva, A.B.; Shilov, S.V.; Kuznetsova, T.V.; Suldina, N.A.; Kenesheva, S.T.; Ilin, A.I.; Joubert, M.; Taukobong, S.; Reva, O.N. Transcriptomics and methylomics study on the effect of iodine-containing drug FS-1 on Escherichia coli ATCC BAA-196. Future Microbiol. 2021, 16, 1063–1085. [Google Scholar] [CrossRef]
- Nye, T.M.; Fernandez, N.L.; Simmons, L.A. A positive perspective on DNA methylation: Regulatory functions of DNA methylation outside of host defense in Gram-positive bacteria. Crit. Rev. Biochem. Mol. Biol. 2020, 55, 576–591. [Google Scholar] [CrossRef]
- Casadesús, J. Bacterial DNA methylation and methylomes. In DNA Methyltransferases-Role and Function; Albert, J., Jurkowska, R.Z., Eds.; Springer: Cham, Switzerland, 2016; Volume 945, pp. 35–61. [Google Scholar] [CrossRef]
- Ząbek, T.; Semik-Gurgul, E.; Ropka-Molik, K.; Szmatoła, T.; Kawecka-Grochocka, E.; Zalewska, M.; Kościuczuk, E.; Wnuk, M.; Bagnicka, E. Locus-specific interrelations between gene expression and DNA methylation patterns in bovine mammary gland infected by coagulase-positive and coagulase-negative staphylococci. J. Dairy Sci. 2020, 103, 10689–10695. [Google Scholar] [CrossRef]
- Zhou, Y.; Liu, S.; Hu, Y.; Fang, L.; Gao, Y.; Xia, H.; Schroeder, S.G.; Rosen, B.D.; Connor, E.E.; Li, C.-J. Comparative whole genome DNA methylation profiling across cattle tissues reveals global and tissue-specific methylation patterns. BMC Biol. 2020, 18, 85. [Google Scholar] [CrossRef]
- Rohart, F.; Gautier, B.; Singh, A.; Lê Cao, K.-A. mixOmics: An R package for ‘omics feature selection and multiple data integration. PLoS Comp. Biol. 2017, 13, e1005752. [Google Scholar] [CrossRef] [Green Version]
- Singer, B.D. A practical guide to the measurement and analysis of DNA methylation. Am. J. Respir. Cell Mol. 2019, 61, 417–428. [Google Scholar] [CrossRef] [PubMed]
- Liu, S.; Fang, L.; Zhou, Y.; Santos, D.J.; Xiang, R.; Daetwyler, H.D.; Chamberlain, A.J.; Cole, J.B.; Li, C.-j.; Yu, Y. Analyses of inter-individual variations of sperm DNA methylation and their potential implications in cattle. BMC Genom. 2019, 20, 888. [Google Scholar] [CrossRef] [PubMed] [Green Version]
- Guo, S.; Diep, D.; Plongthongkum, N.; Fung, H.-L.; Zhang, K.; Zhang, K. Identification of methylation haplotype blocks aids in deconvolution of heterogeneous tissue samples and tumor tissue-of-origin mapping from plasma DNA. Nat. Genet. 2017, 49, 635–642. [Google Scholar] [CrossRef]
- Gao, F.; Liang, H.; Lu, H.; Wang, J.; Xia, M.; Yuan, Z.; Yao, Y.; Wang, T.; Tan, X.; Laurence, A. Global analysis of DNA methylation in hepatocellular carcinoma by a liquid hybridization capture-based bisulfite sequencing approach. Clin. Epigenetics 2015, 7, 86. [Google Scholar] [CrossRef] [Green Version]
- Moser, D.A.; Mueller, S.; Hummel, E.M.; Limberg, A.; Dieckmann, L.; Frach, L.; Pakusch, J.; Flasbeck, V.; Bruene, M.; Beygo, J. Targeted bisulfite sequencing: A novel tool for the assessment of DNA methylation with high sensitivity and increased coverage. Psychoneuroendocrinology 2020, 120, 104784. [Google Scholar] [CrossRef] [PubMed]
- Wang, M.; Bissonnette, N.; Laterrière, M.; Dudemaine, P.-L.; Gagné, D.; Roy, J.-P.; Zhao, X.; Sirard, M.-A.; Ibeagha-Awemu, E.M. Methylome and transcriptome data integration reveals potential roles of DNA methylation and candidate biomarkers of cow Streptococcus uberis subclinical mastitis. J. Anim. Sci. Biotechnol. 2022, 12, 136. [Google Scholar] [CrossRef] [PubMed]
- Wang, M.; Liang, Y.; Ibeagha-Awemu, E.M.; Li, M.; Zhang, H.; Chen, Z.; Sun, Y.; Karrow, N.A.; Yang, Z.; Mao, Y. Genome-wide DNA methylation analysis of mammary gland tissues from Chinese Holstein cows with Staphylococcus aureus induced mastitis. Front. Genet. 2020, 11, 1295. [Google Scholar] [CrossRef]
- Chang, G.; Petzl, W.; Vanselow, J.; Günther, J.; Shen, X.; Seyfert, H.-M. Epigenetic mechanisms contribute to enhanced expression of immune response genes in the liver of cows after experimentally induced Escherichia coli mastitis. Vet. J. 2015, 203, 339–341. [Google Scholar] [CrossRef] [PubMed]
- Ju, Z.; Jiang, Q.; Wang, J.; Wang, X.; Yang, C.; Sun, Y.; Zhang, Y.; Wang, C.; Gao, Y.; Wei, X. Genome-wide methylation and transcriptome of blood neutrophils reveal the roles of DNA methylation in affecting transcription of protein-coding genes and miRNAs in E. coli-infected mastitis cows. BMC Genom. 2020, 21, 102. [Google Scholar] [CrossRef] [PubMed] [Green Version]
- Song, M.; He, Y.; Zhou, H.; Zhang, Y.; Li, X.; Yu, Y. Combined analysis of DNA methylome and transcriptome reveal novel candidate genes with susceptibility to bovine Staphylococcus aureus subclinical mastitis. Sci. Rep. 2016, 6, 29390. [Google Scholar] [CrossRef] [Green Version]
- Wang, M.; Bissonnette, N.; Laterrière, M.; Dudemaine, P.-L.; Gagné, D.; Roy, J.-P.; Sirard, M.-A.; Ibeagha-Awemu, E.M. Genome wide DNA methylation haplotype block signatures of milk somatic cells responding to S. aureus subclinical mastitis and association with production and health traits. BMC Biol. 2023; under review. [Google Scholar]
- Taponen, S.; Pyörälä, S. Coagulase-negative staphylococci as cause of bovine mastitis—Not so different from Staphylococcus aureus? Vet. Microbiol. 2009, 134, 29–36. [Google Scholar] [CrossRef] [PubMed]
- Cheng, W.N.; Han, S.G. Bovine mastitis: Risk factors, therapeutic strategies, and alternative treatments—A review. Asian-australas. J. Anim. Sci. 2020, 33, 1699. [Google Scholar] [CrossRef]
- Dean, W.; Lucifero, D.; Santos, F. DNA methylation in mammalian development and disease. Birth Defects Res. 2005, 75, 98–111. [Google Scholar] [CrossRef]
- Deaton, A.M.; Bird, A. CpG islands and the regulation of transcription. Genes Dev. 2011, 25, 1010–1022. [Google Scholar] [CrossRef] [Green Version]
- Blake, L.E.; Roux, J.; Hernando-Herraez, I.; Banovich, N.E.; Perez, R.G.; Hsiao, C.J.; Eres, I.; Cuevas, C.; Marques-Bonet, T.; Gilad, Y. A comparison of gene expression and DNA methylation patterns across tissues and species. Genome Res. 2020, 30, 250–262. [Google Scholar] [CrossRef] [Green Version]
- Brenet, F.; Moh, M.; Funk, P.; Feierstein, E.; Viale, A.J.; Socci, N.D.; Scandura, J.M. DNA methylation of the first exon is tightly linked to transcriptional silencing. PLoS ONE 2011, 6, e14524. [Google Scholar] [CrossRef]
- Anastasiadi, D.; Esteve-Codina, A.; Piferrer, F. Consistent inverse correlation between DNA methylation of the first intron and gene expression across tissues and species. Epigenetics Chromatin 2018, 11, 37. [Google Scholar] [CrossRef]
- Shayevitch, R.; Askayo, D.; Keydar, I.; Ast, G. The importance of DNA methylation of exons on alternative splicing. RNA 2018, 24, 1351–1362. [Google Scholar] [CrossRef] [PubMed] [Green Version]
- Morales-Nebreda, L.; McLafferty, F.S.; Singer, B.D. DNA methylation as a transcriptional regulator of the immune system. Transl. Res. 2019, 204, 1–18. [Google Scholar] [CrossRef] [PubMed]
- Sordillo, L.M. Mammary Gland Immunobiology and Resistance to Mastitis. Vet. Clin. N. Am.-Food Anim. Pract. 2018, 34, 507–523. [Google Scholar] [CrossRef] [PubMed]
- Wilson, G.J.; Tuffs, S.W.; Wee, B.A.; Seo, K.S.; Park, N.; Connelley, T.; Guinane, C.M.; Morrison, W.I.; Fitzgerald, J.R. Bovine Staphylococcus aureus superantigens stimulate the entire T cell repertoire of cattle. Infect. Immun. 2018, 86, e00505-18. [Google Scholar] [CrossRef] [PubMed] [Green Version]
- Bröker, B.M.; Mrochen, D.; Péton, V. The T cell response to Staphylococcus aureus. Pathogens 2016, 5, 31. [Google Scholar] [CrossRef] [Green Version]
- Wang, M.; Bissonnette, N.; Laterrière, M.; Dudemaine, P.-L.; Gagné, D.; Roy, J.-P.; Sirard, M.-A.; Ibeagha-Awemu, E.M. Gene co-expression in response to Staphylococcus aureus infection reveals networks of genes with specific functions during bovine subclinical mastitis. J. Dairy Sci. 2023; accepted. [Google Scholar] [CrossRef]
- Liu, X.; Chen, F.; Li, W. Elevated expression of DOK3 indicates high suppressive immune cell infiltration and unfavorable prognosis of gliomas. Int. Immunopharmacol. 2020, 83, 106400. [Google Scholar] [CrossRef]
- Hu, X.; Li, S.; Fu, Y.; Zhang, N. Targeting gut microbiota as a possible therapy for mastitis. Eur. J. Clin. Microbiol. Infect. Dis. 2019, 38, 1409–1423. [Google Scholar] [CrossRef]
- Kosciuczuk, E.M.; Lisowski, P.; Jarczak, J.; Majewska, A.; Rzewuska, M.; Zwierzchowski, L.; Bagnicka, E. Transcriptome profiling of Staphylococci-infected cow mammary gland parenchyma. BMC Vet. Res. 2017, 13, 161. [Google Scholar] [CrossRef]
- Lopreiato, V.; Minuti, A.; Morittu, V.; Britti, D.; Piccioli-Cappelli, F.; Loor, J.; Trevisi, E. Inflammation, migration, and cell-cell interaction-related gene network expression in leukocytes is enhanced in Simmental compared with Holstein dairy cows after calving. J. Dairy Sci. 2020, 103, 1908–1913. [Google Scholar] [CrossRef]
- Jing, H.; Chen, Y.; Liang, W.; Chen, M.; Qiu, C.; Guo, M.-y. Effects of selenium on MAC-T cells in bovine mastitis: Transcriptome analysis of Exosomal mRNA interactions. Biol. Trace Elem. Res. 2021, 199, 2904–2912. [Google Scholar] [CrossRef] [PubMed]
- Yan, L.; Yang, Y.; Ma, X.; Wei, L.; Wan, X.; Zhang, Z.; Ding, J.; Peng, J.; Liu, G.; Gou, H. Effect of Two Different Drug-Resistant Staphylococcus aureus Strains on the Physiological Properties of MAC-T Cells and Their Transcriptome Analysis. Front. Vet. Sci 2022, 9, 818928. [Google Scholar] [CrossRef] [PubMed]
- Zheng, J.; Watson, A.D.; Kerr, D.E. Genome-wide expression analysis of lipopolysaccharide-induced mastitis in a mouse model. Infect. Immun. 2006, 74, 1907–1915. [Google Scholar] [CrossRef] [Green Version]
- Dou, J.; Cánovas, A.; Brito, L.F.; Yu, Y.; Schenkel, F.S.; Wang, Y. Comprehensive RNA-Seq Profiling Reveals Temporal and Tissue-Specific Changes in Gene Expression in Sprague–Dawley Rats as Response to Heat Stress Challenges. Front. Genet. 2021, 12, 651979. [Google Scholar] [CrossRef] [PubMed]
- Vaisvila, R.; Ponnaluri, V.C.; Sun, Z.; Langhorst, B.W.; Saleh, L.; Guan, S.; Dai, N.; Campbell, M.A.; Sexton, B.S.; Marks, K. EM-seq: Detection of DNA methylation at single base resolution from picograms of DNA. BioRxiv 2020, 884692. [Google Scholar] [CrossRef] [Green Version]
- Benjamini, Y.; Hochberg, Y. Controlling the false discovery rate: A practical and powerful approach to multiple testing. J. R. Stat. Soc. Series B Methodol. 1995, 57, 289–300. [Google Scholar] [CrossRef]
- Teng, C.-S.; Wu, B.-H.; Yen, M.-R.; Chen, P.-Y. MethGET: Web-based bioinformatics software for correlating genome-wide DNA methylation and gene expression. BMC Genom. 2020, 21, 375. [Google Scholar] [CrossRef]


Disclaimer/Publisher’s Note: The statements, opinions and data contained in all publications are solely those of the individual author(s) and contributor(s) and not of MDPI and/or the editor(s). MDPI and/or the editor(s) disclaim responsibility for any injury to people or property resulting from any ideas, methods, instructions or products referred to in the content. |
© 2023 Jean-Philippe Roy, Marc-André Sirard and His Majesty the King in Right of Canada, as represented by the Minister of Agriculture and Agri-Food Canada for the contribution of Mengqi Wang, Nathalie Bissonnette, Mario Laterrière, David Gagné, Pier-Luc Dudemaine and Eveline M. Ibeagha-Awemu. Licensee MDPI, Basel, Switzerland. This article is an open access article distributed under the terms and conditions of the Creative Commons Attribution (CC BY) license (https://creativecommons.org/licenses/by/4.0/).
Share and Cite
Wang, M.; Bissonnette, N.; Laterrière, M.; Gagné, D.; Dudemaine, P.-L.; Roy, J.-P.; Sirard, M.-A.; Ibeagha-Awemu, E.M. Genome-Wide DNA Methylation and Transcriptome Integration Associates DNA Methylation Changes with Bovine Subclinical Mastitis Caused by Staphylococcus chromogenes. Int. J. Mol. Sci. 2023, 24, 10369. https://doi.org/10.3390/ijms241210369
Wang M, Bissonnette N, Laterrière M, Gagné D, Dudemaine P-L, Roy J-P, Sirard M-A, Ibeagha-Awemu EM. Genome-Wide DNA Methylation and Transcriptome Integration Associates DNA Methylation Changes with Bovine Subclinical Mastitis Caused by Staphylococcus chromogenes. International Journal of Molecular Sciences. 2023; 24(12):10369. https://doi.org/10.3390/ijms241210369
Chicago/Turabian StyleWang, Mengqi, Nathalie Bissonnette, Mario Laterrière, David Gagné, Pier-Luc Dudemaine, Jean-Philippe Roy, Marc-André Sirard, and Eveline M. Ibeagha-Awemu. 2023. "Genome-Wide DNA Methylation and Transcriptome Integration Associates DNA Methylation Changes with Bovine Subclinical Mastitis Caused by Staphylococcus chromogenes" International Journal of Molecular Sciences 24, no. 12: 10369. https://doi.org/10.3390/ijms241210369