

Lipidome Analysis of Oropharyngeal Tumor Tissues Using Nanosecond Infrared Laser (NIRL) Tissue Sampling and Subsequent Mass Spectrometry
 , , , ,
  , , and
Abstract
:1. Introduction
2. Results
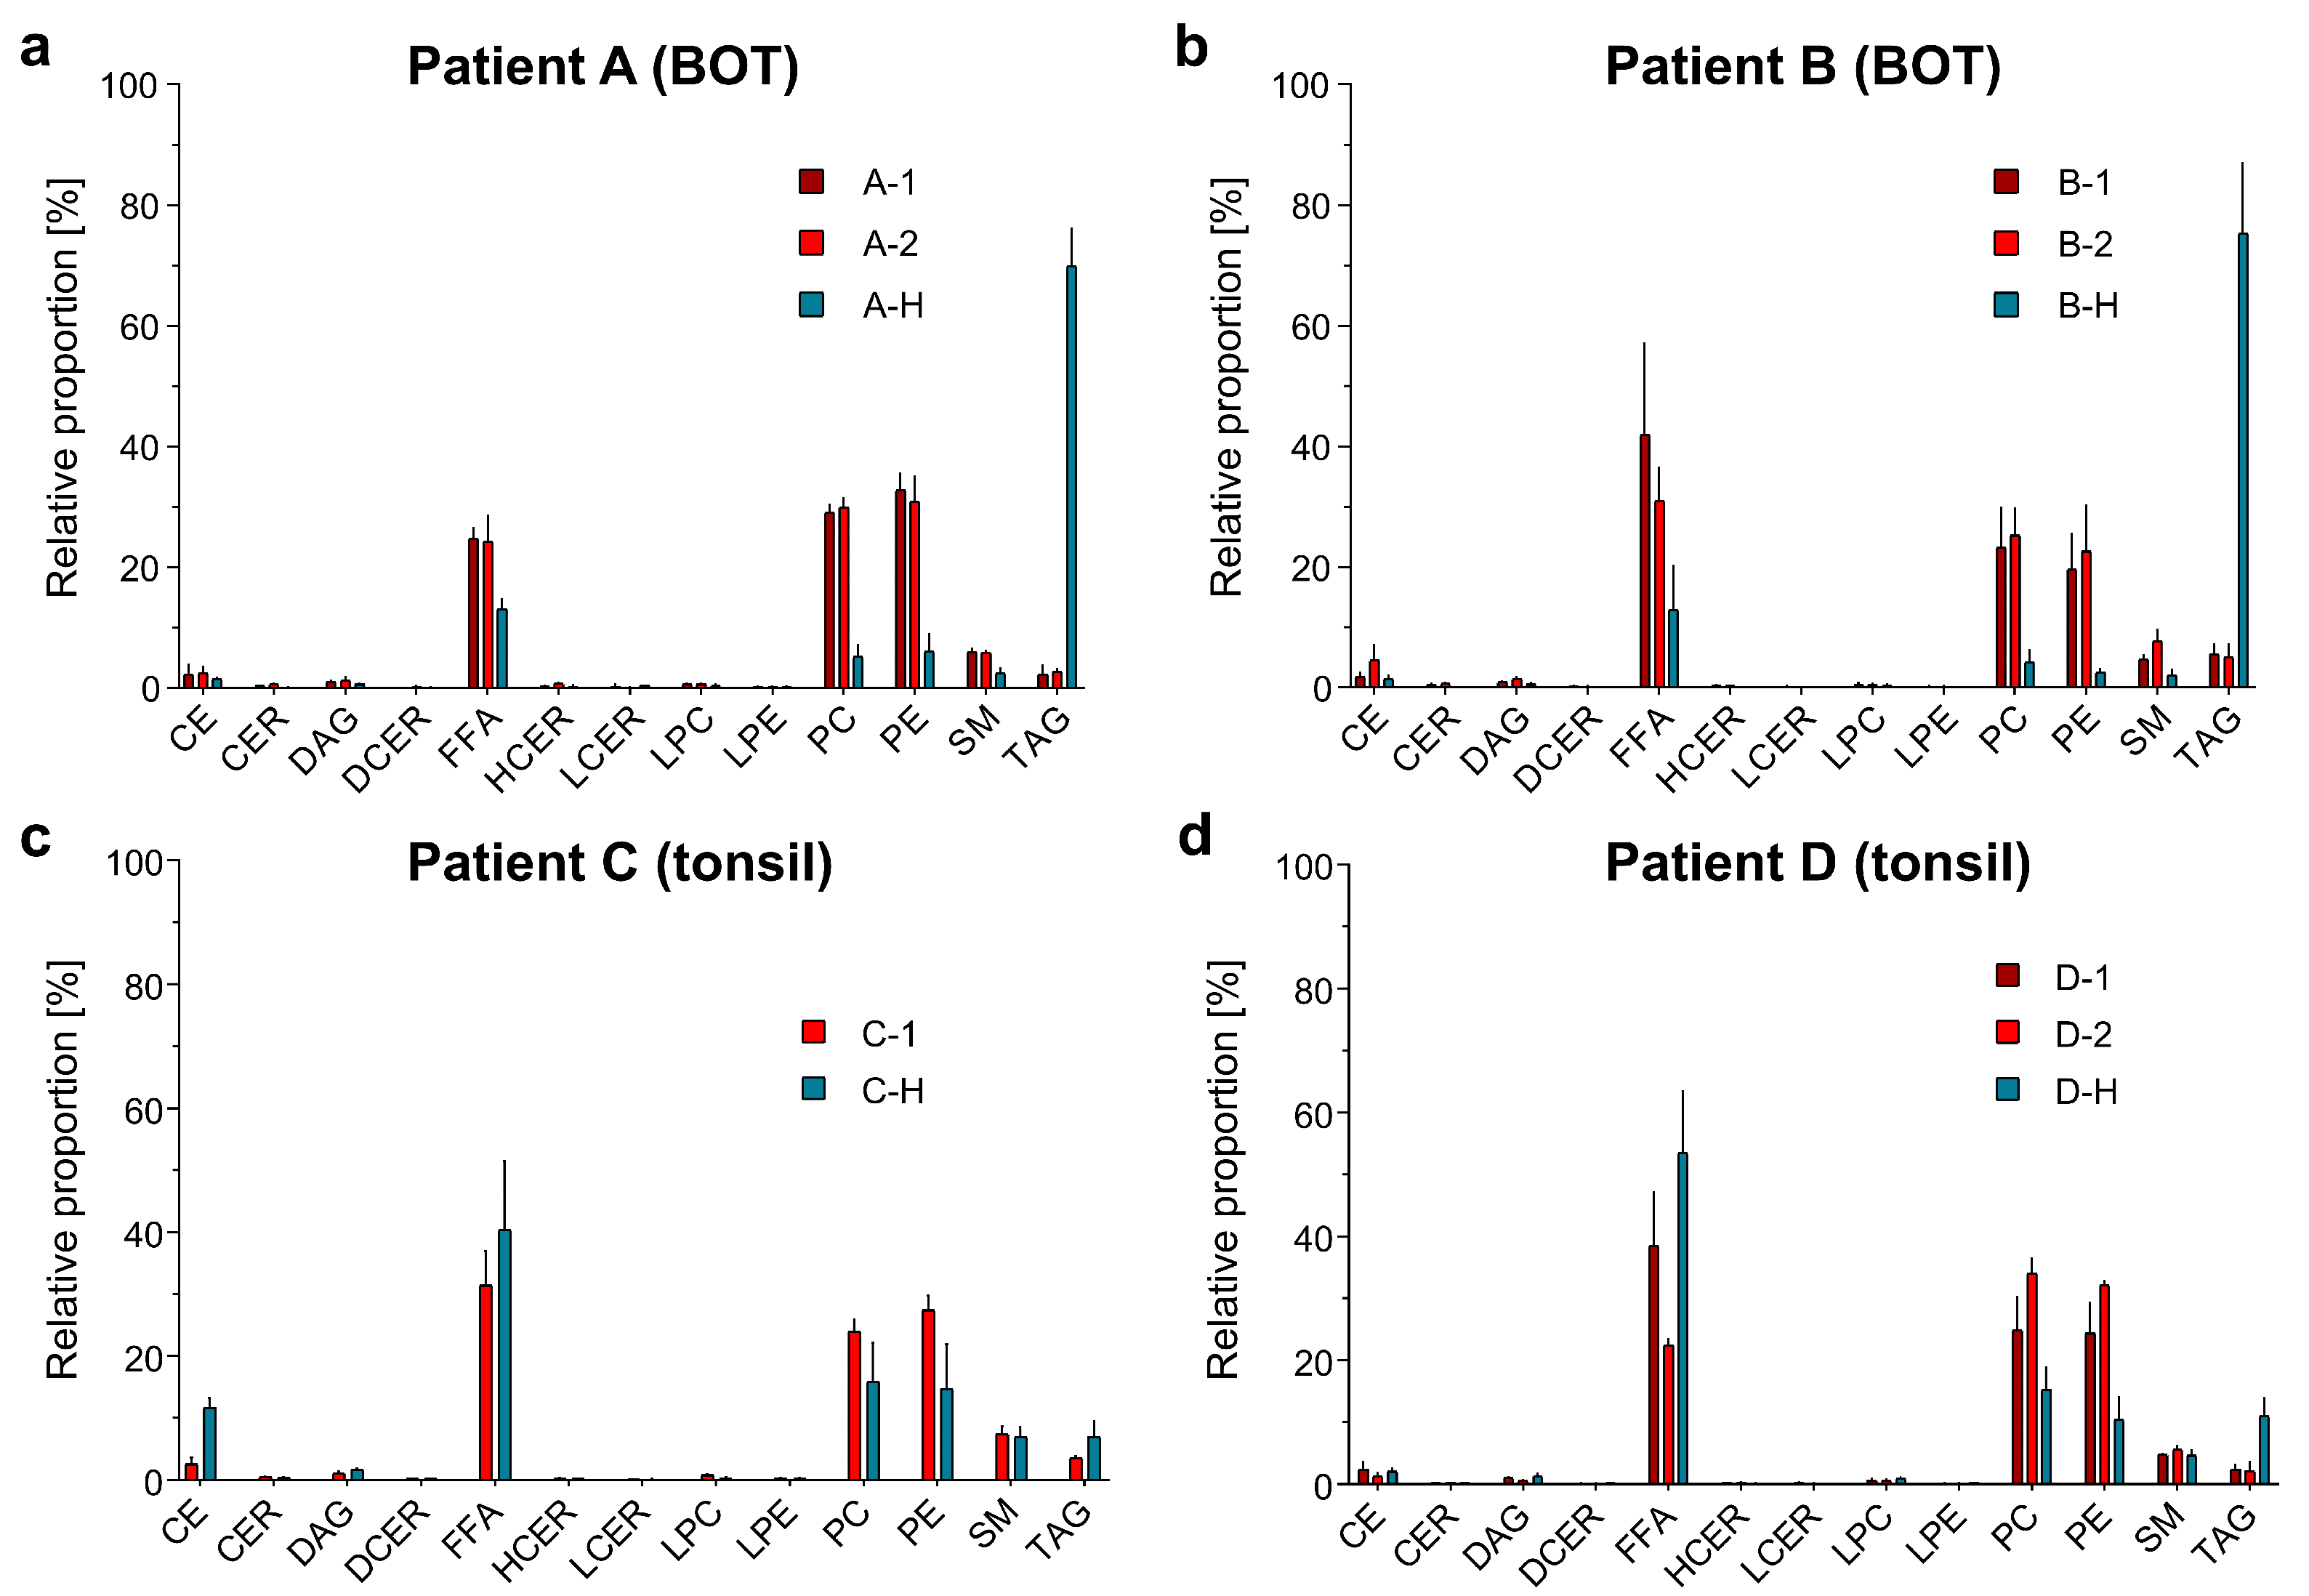
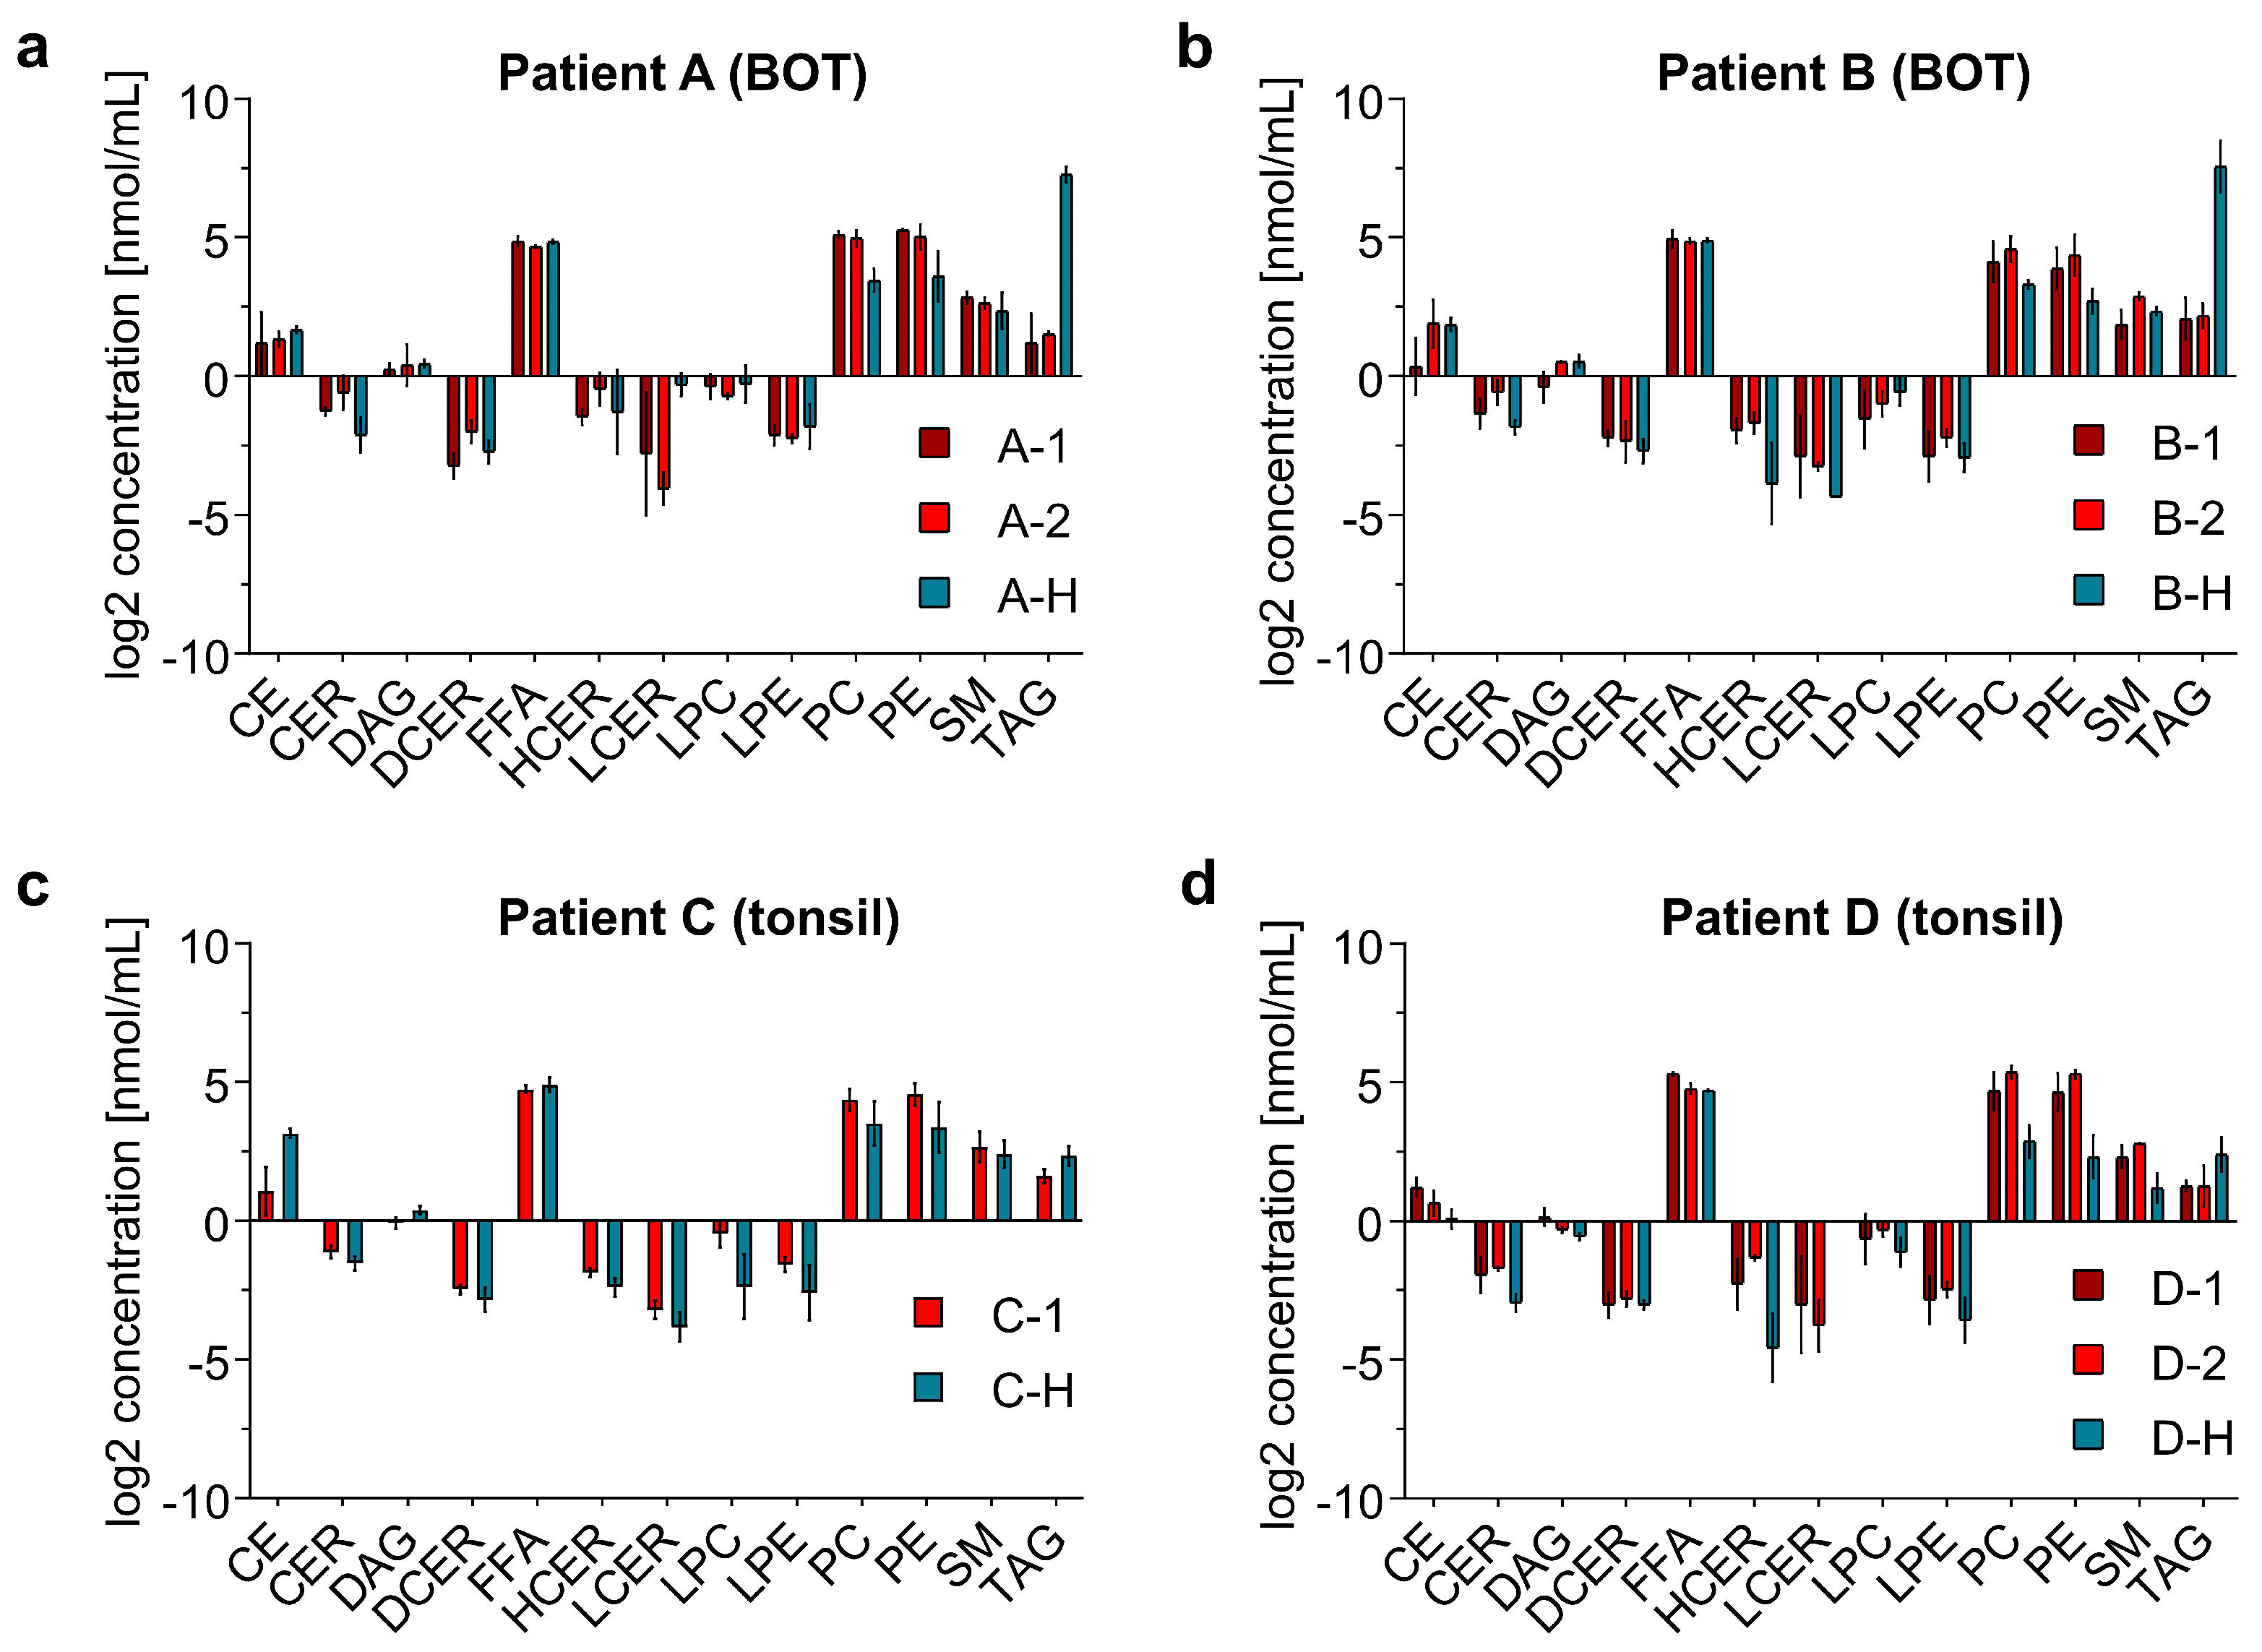
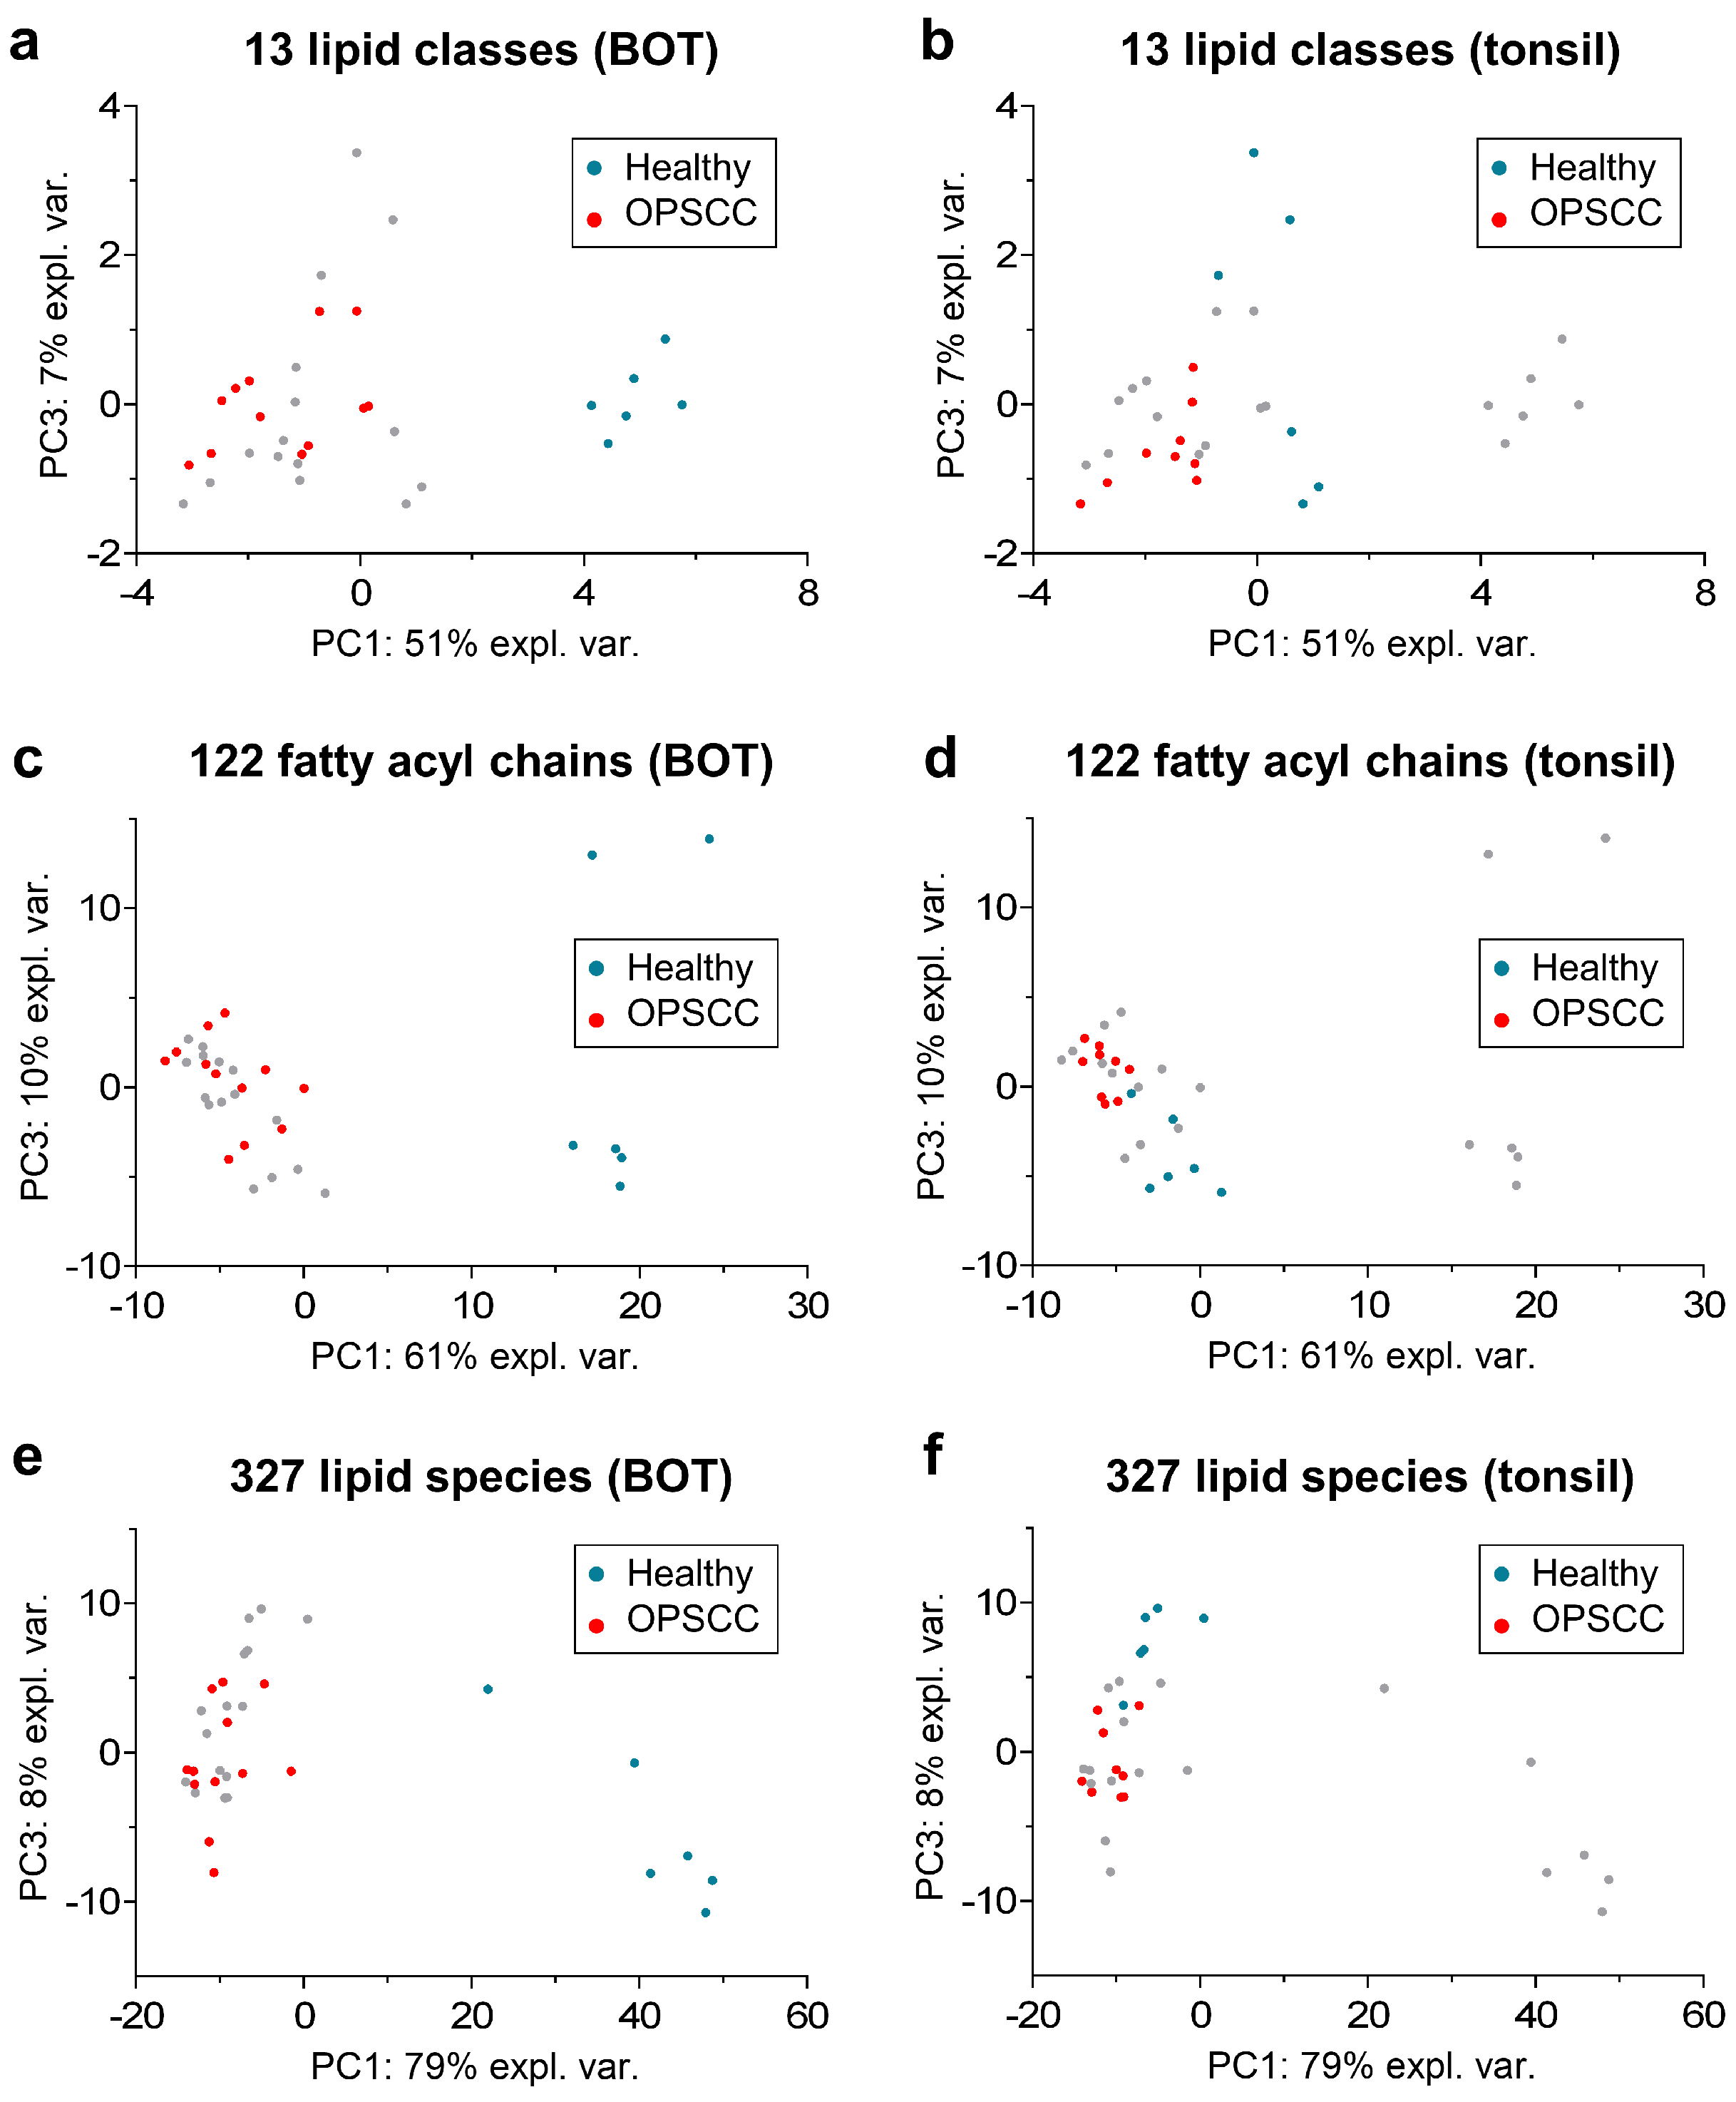
2.1. Distribution of the Identified Lipid Classes
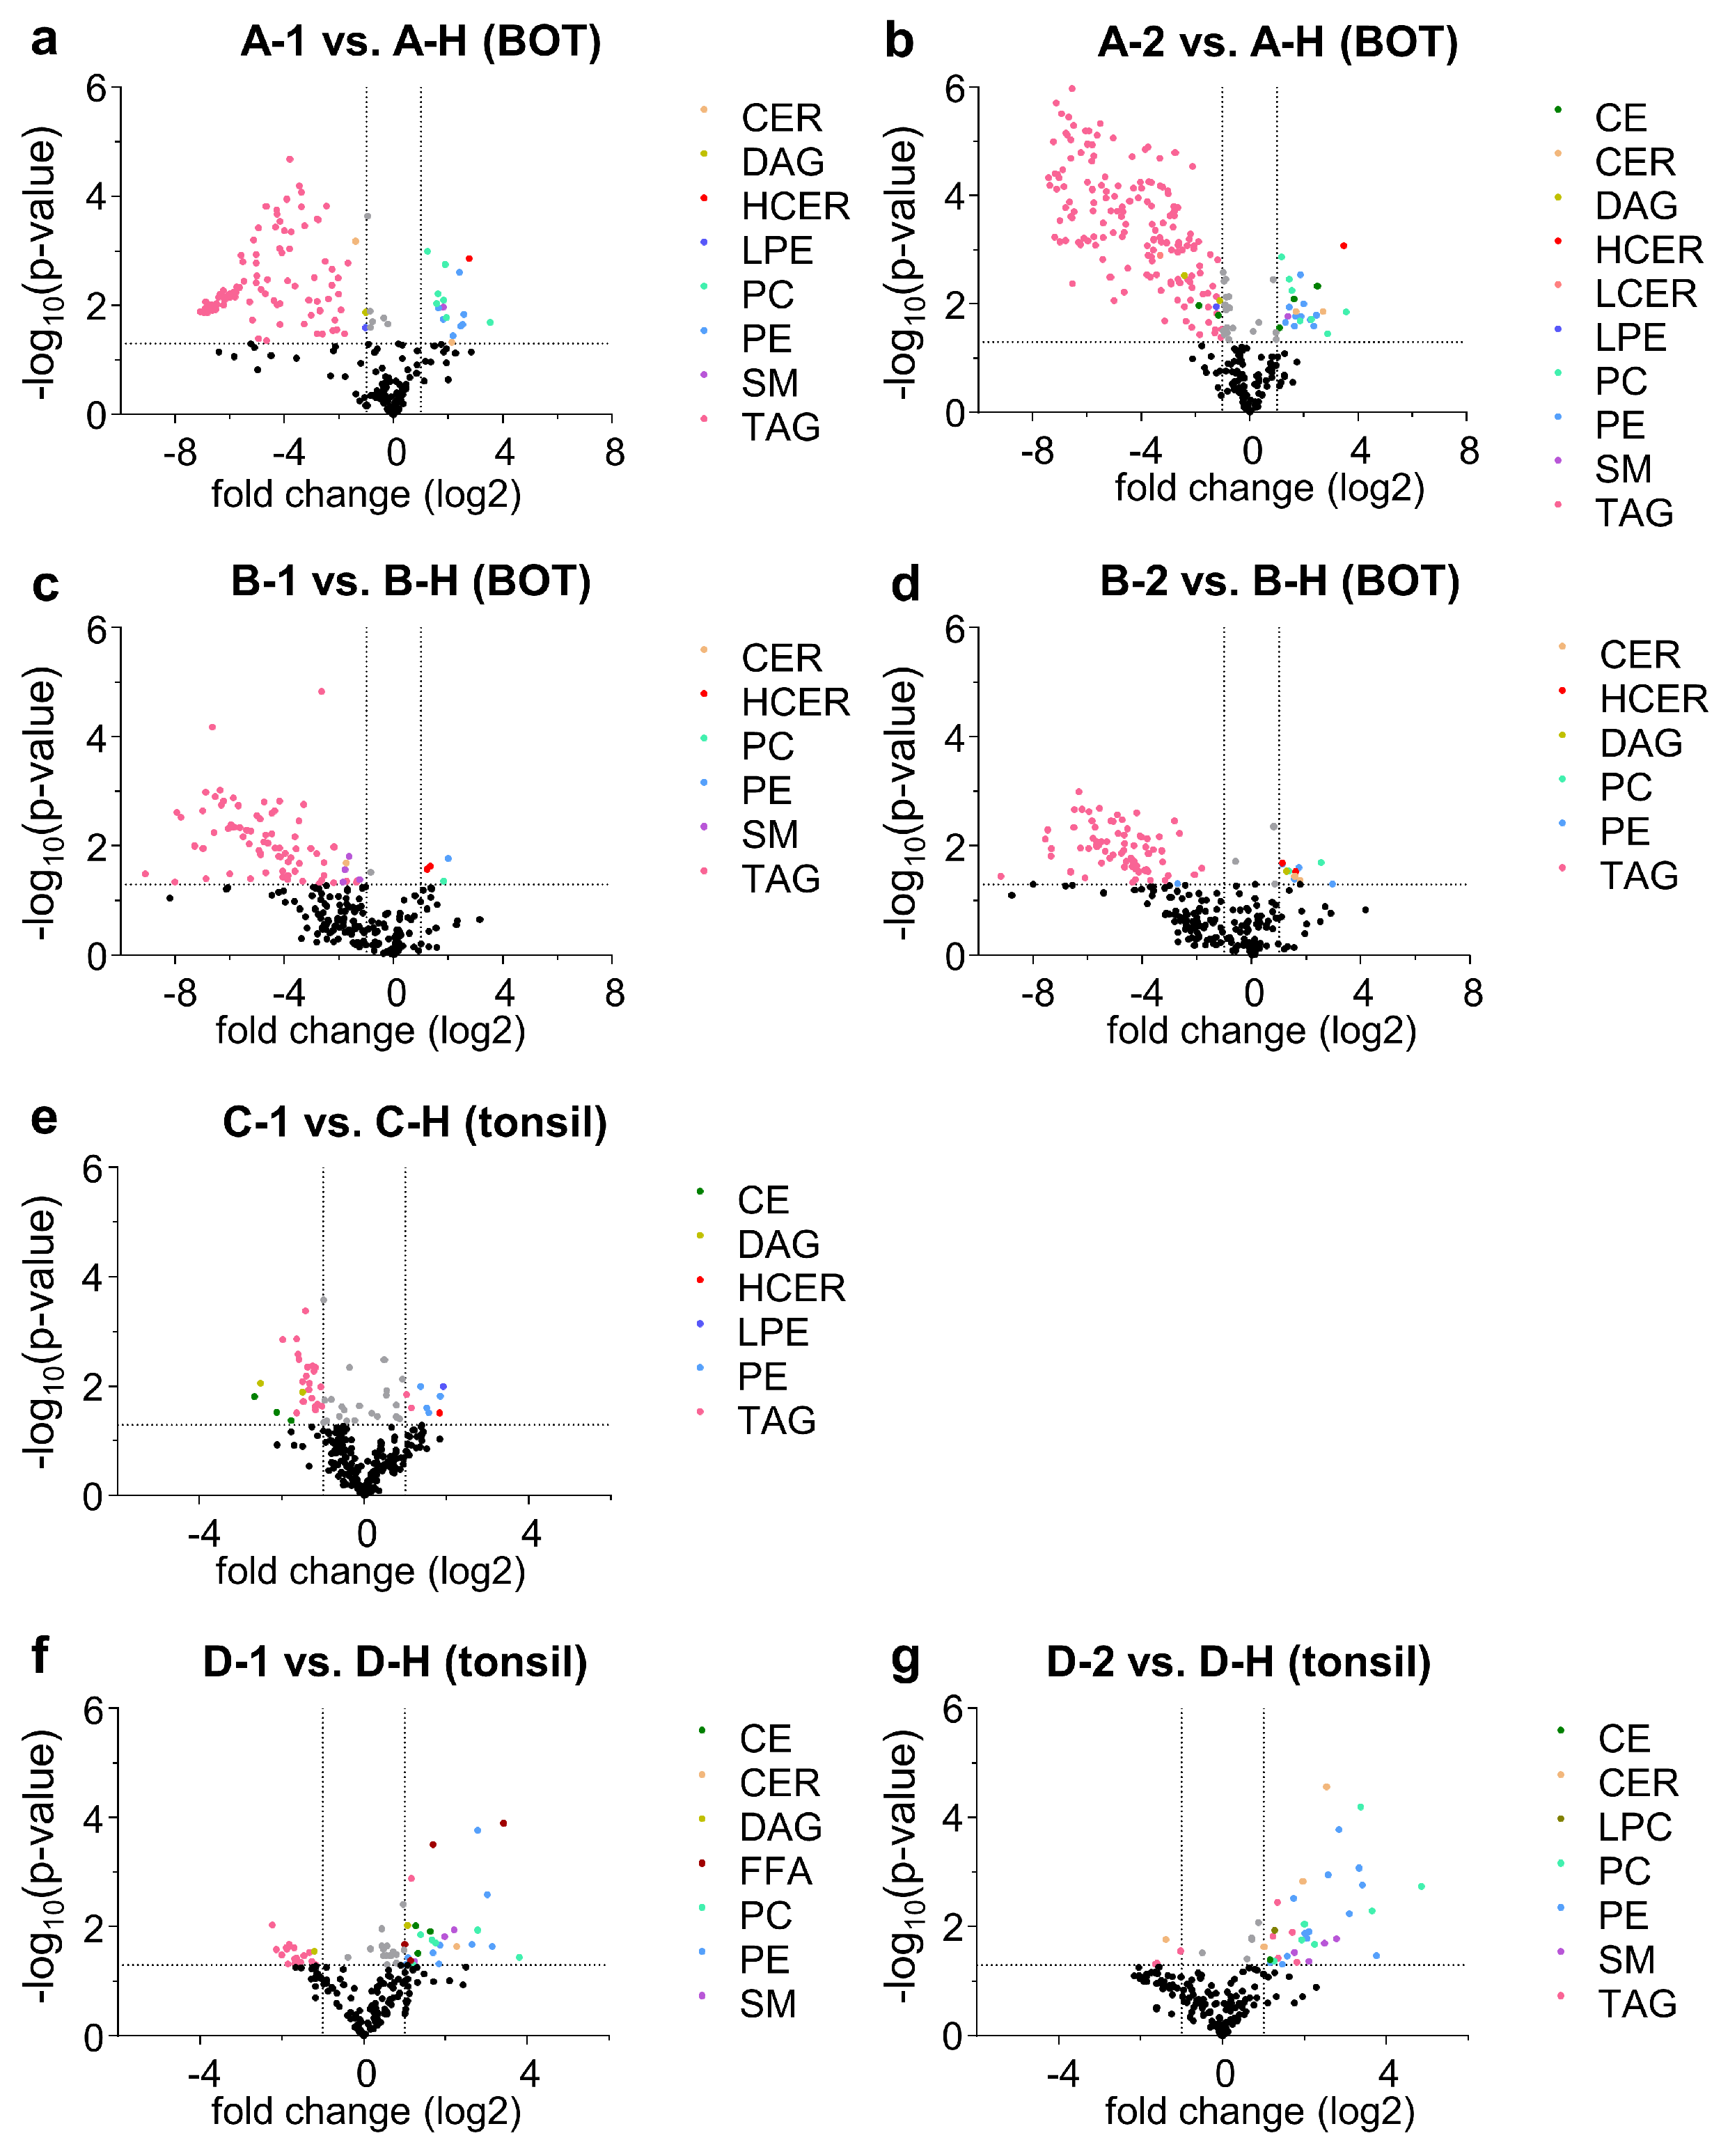
2.2. Differentiation between Healthy Tissue and Tumor Tissue
3. Discussion
4. Methods
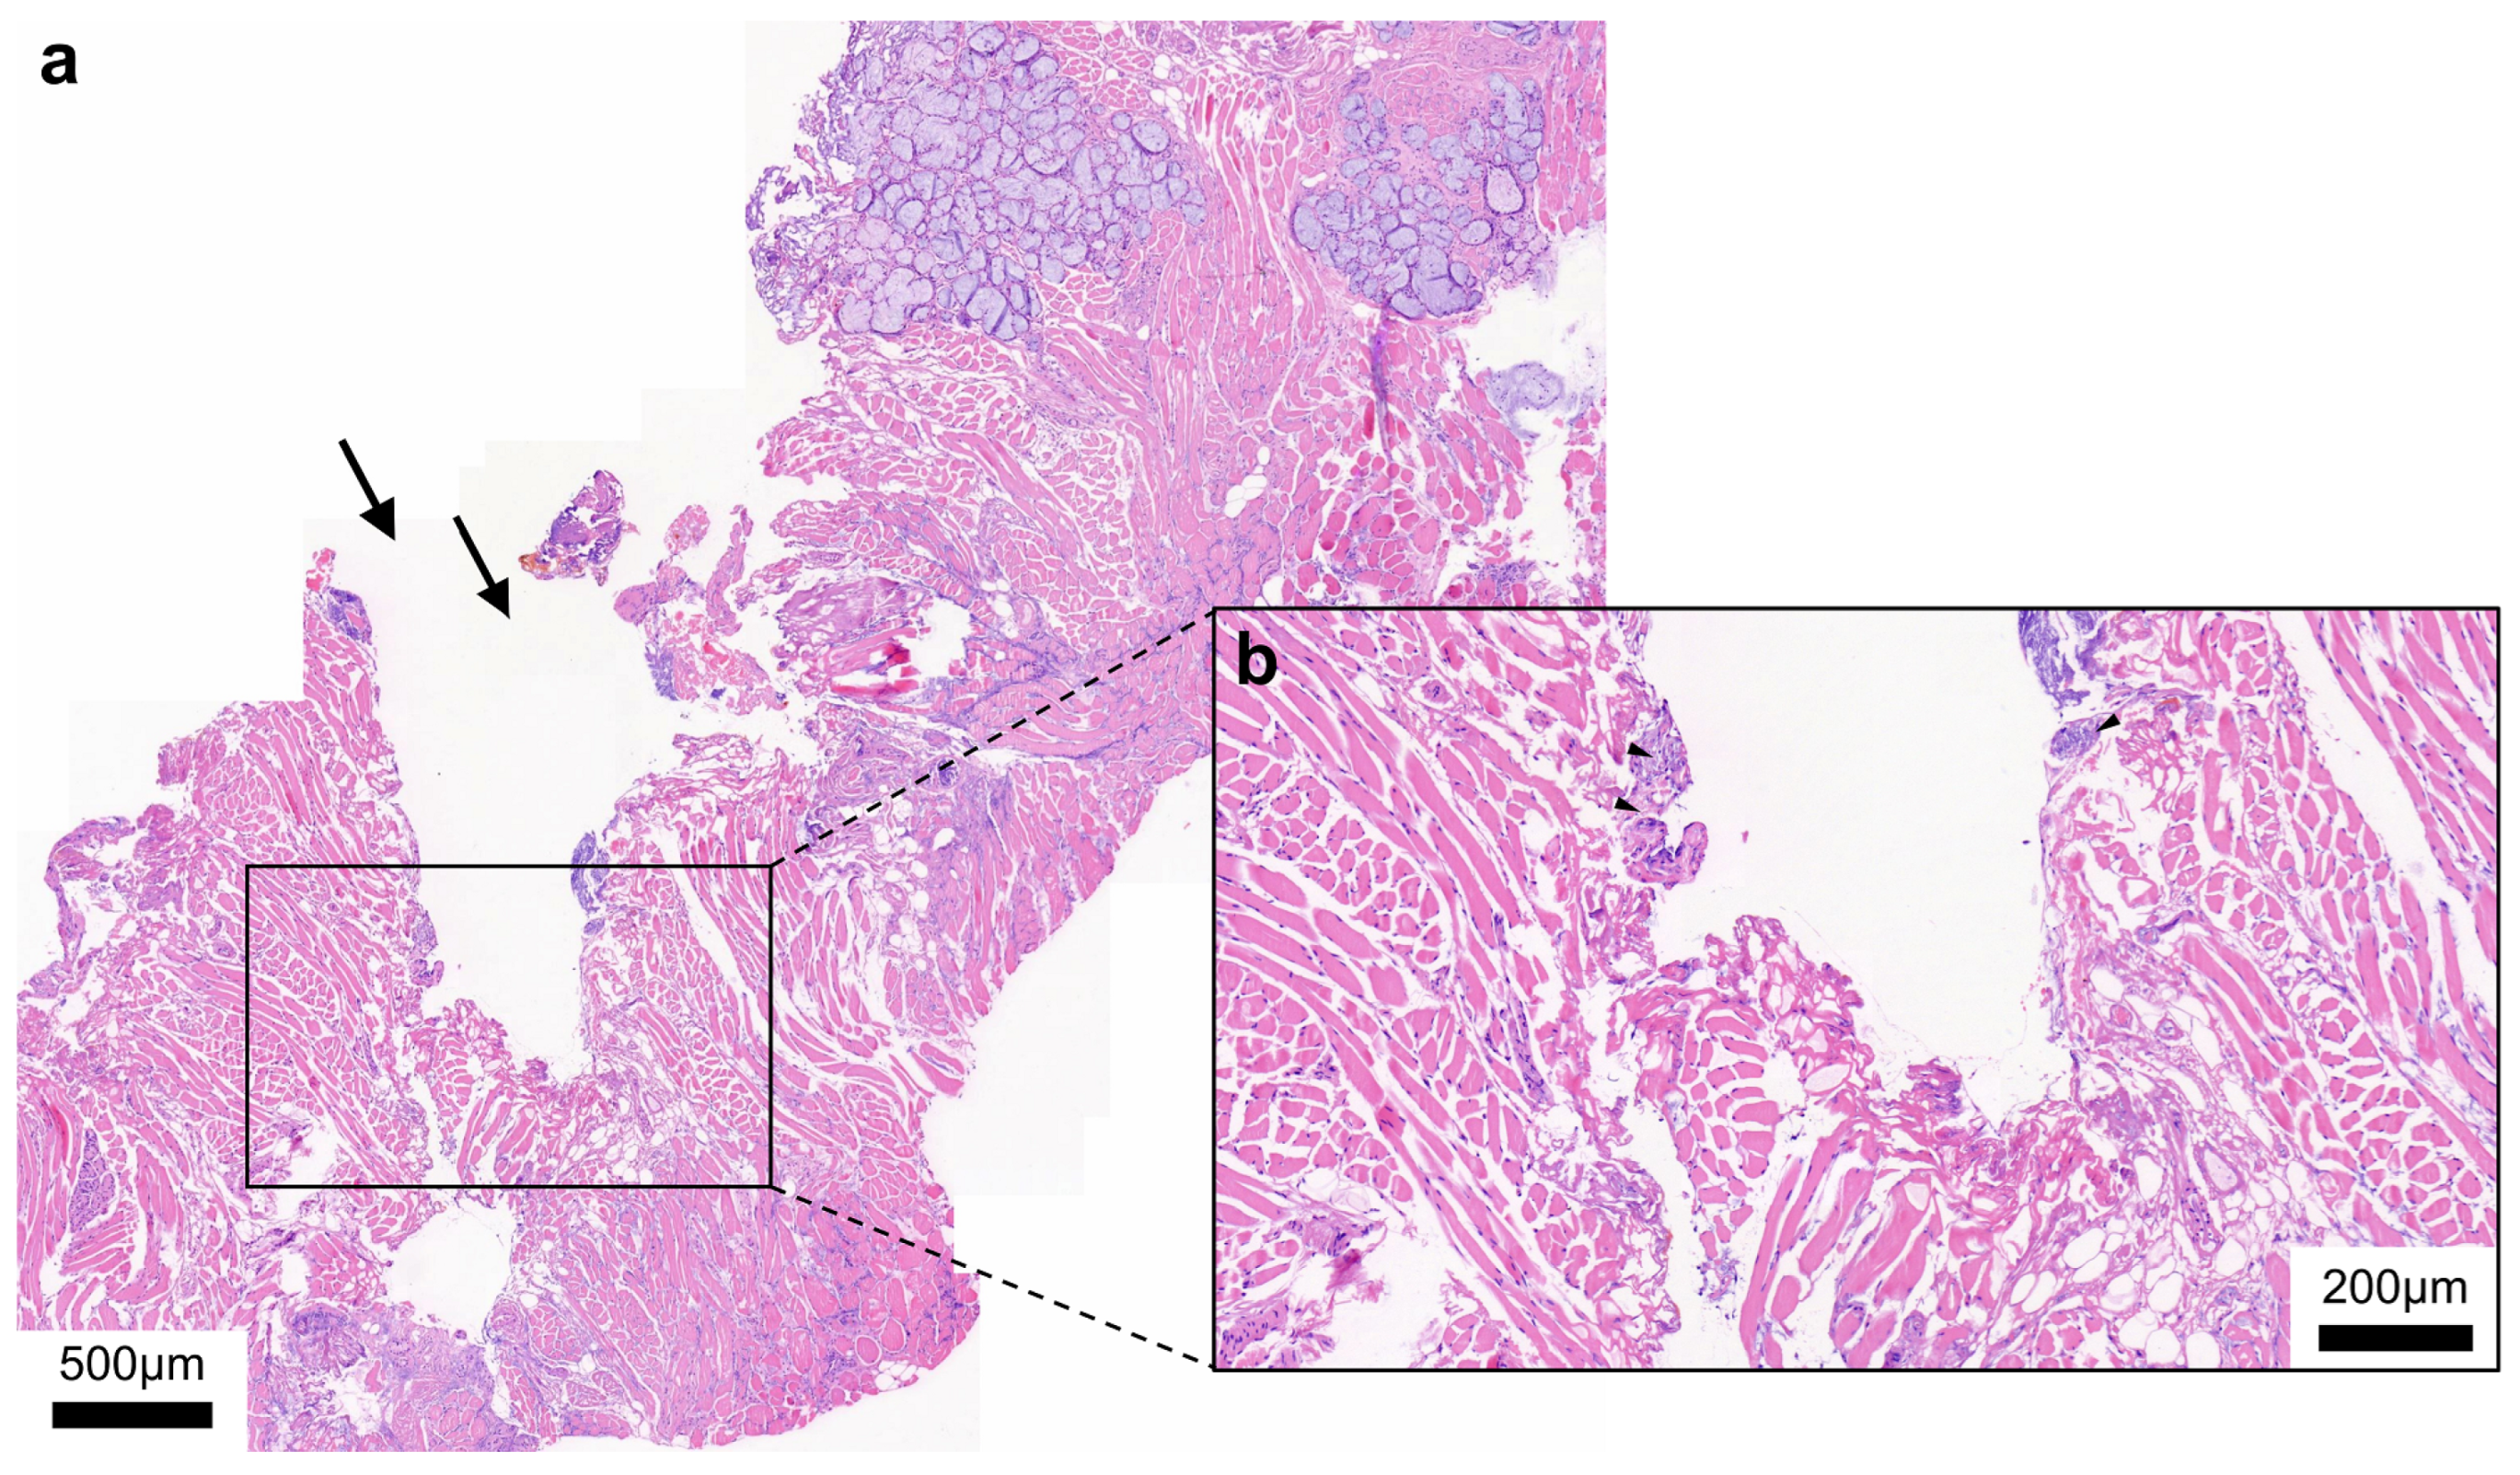
4.1. Samples
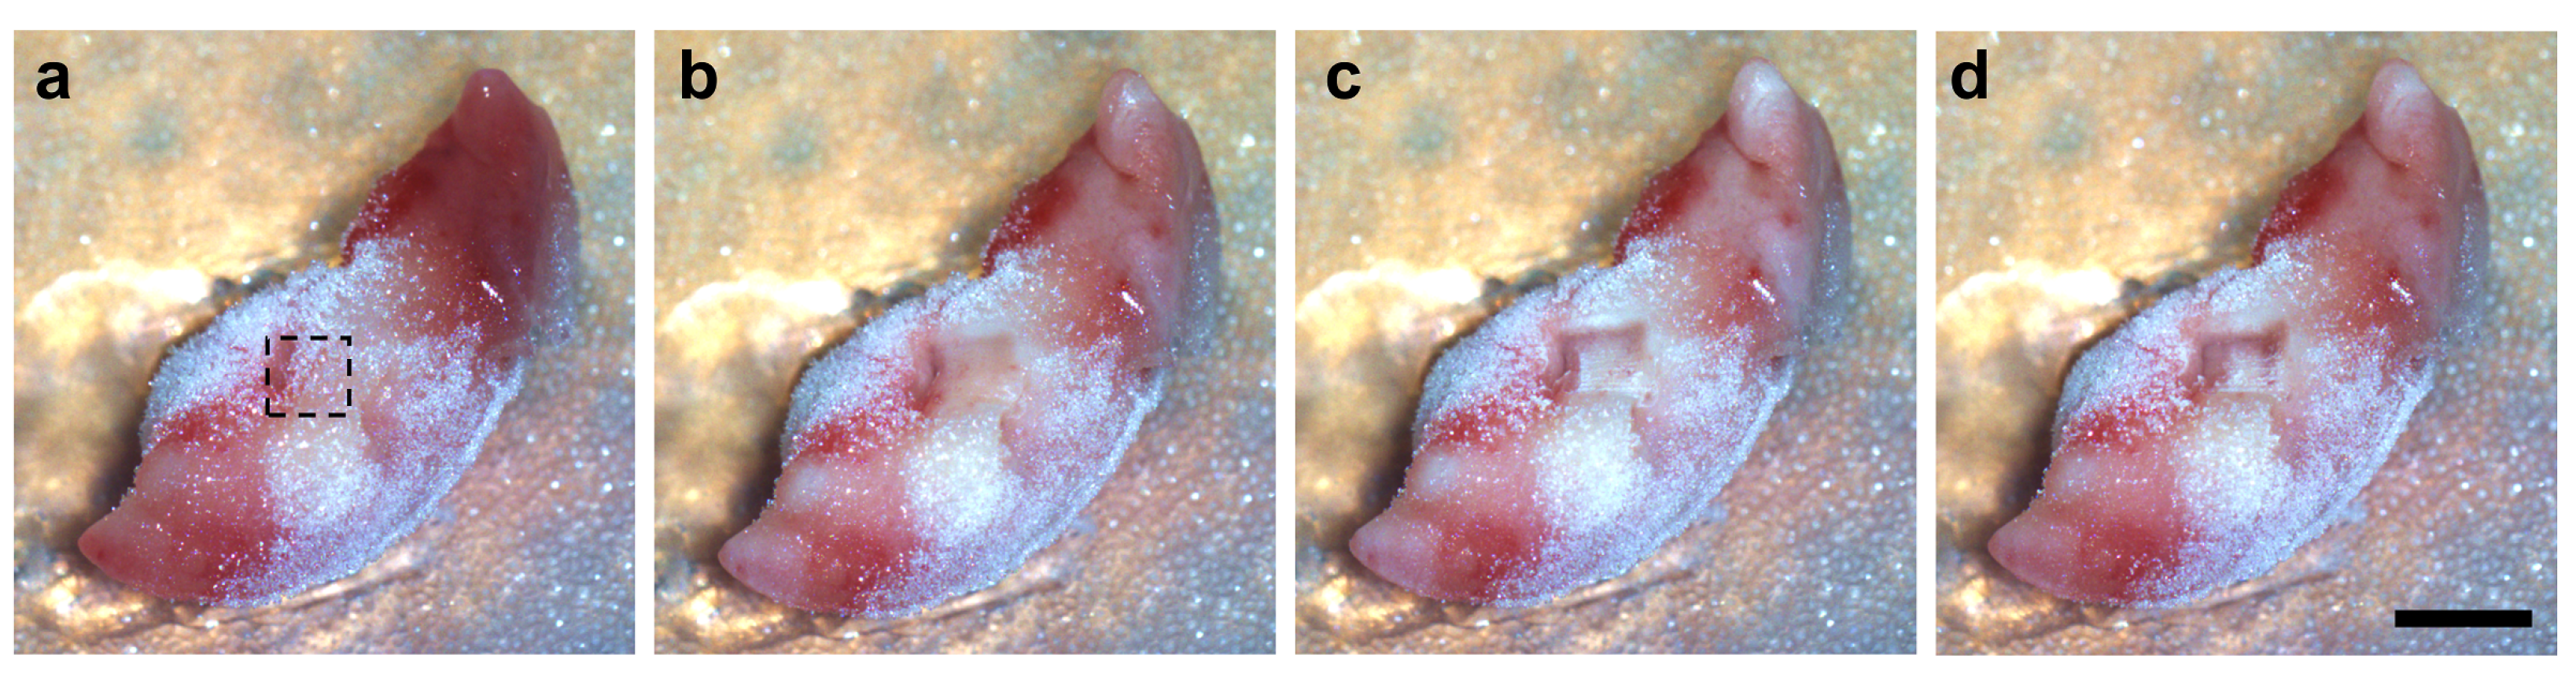
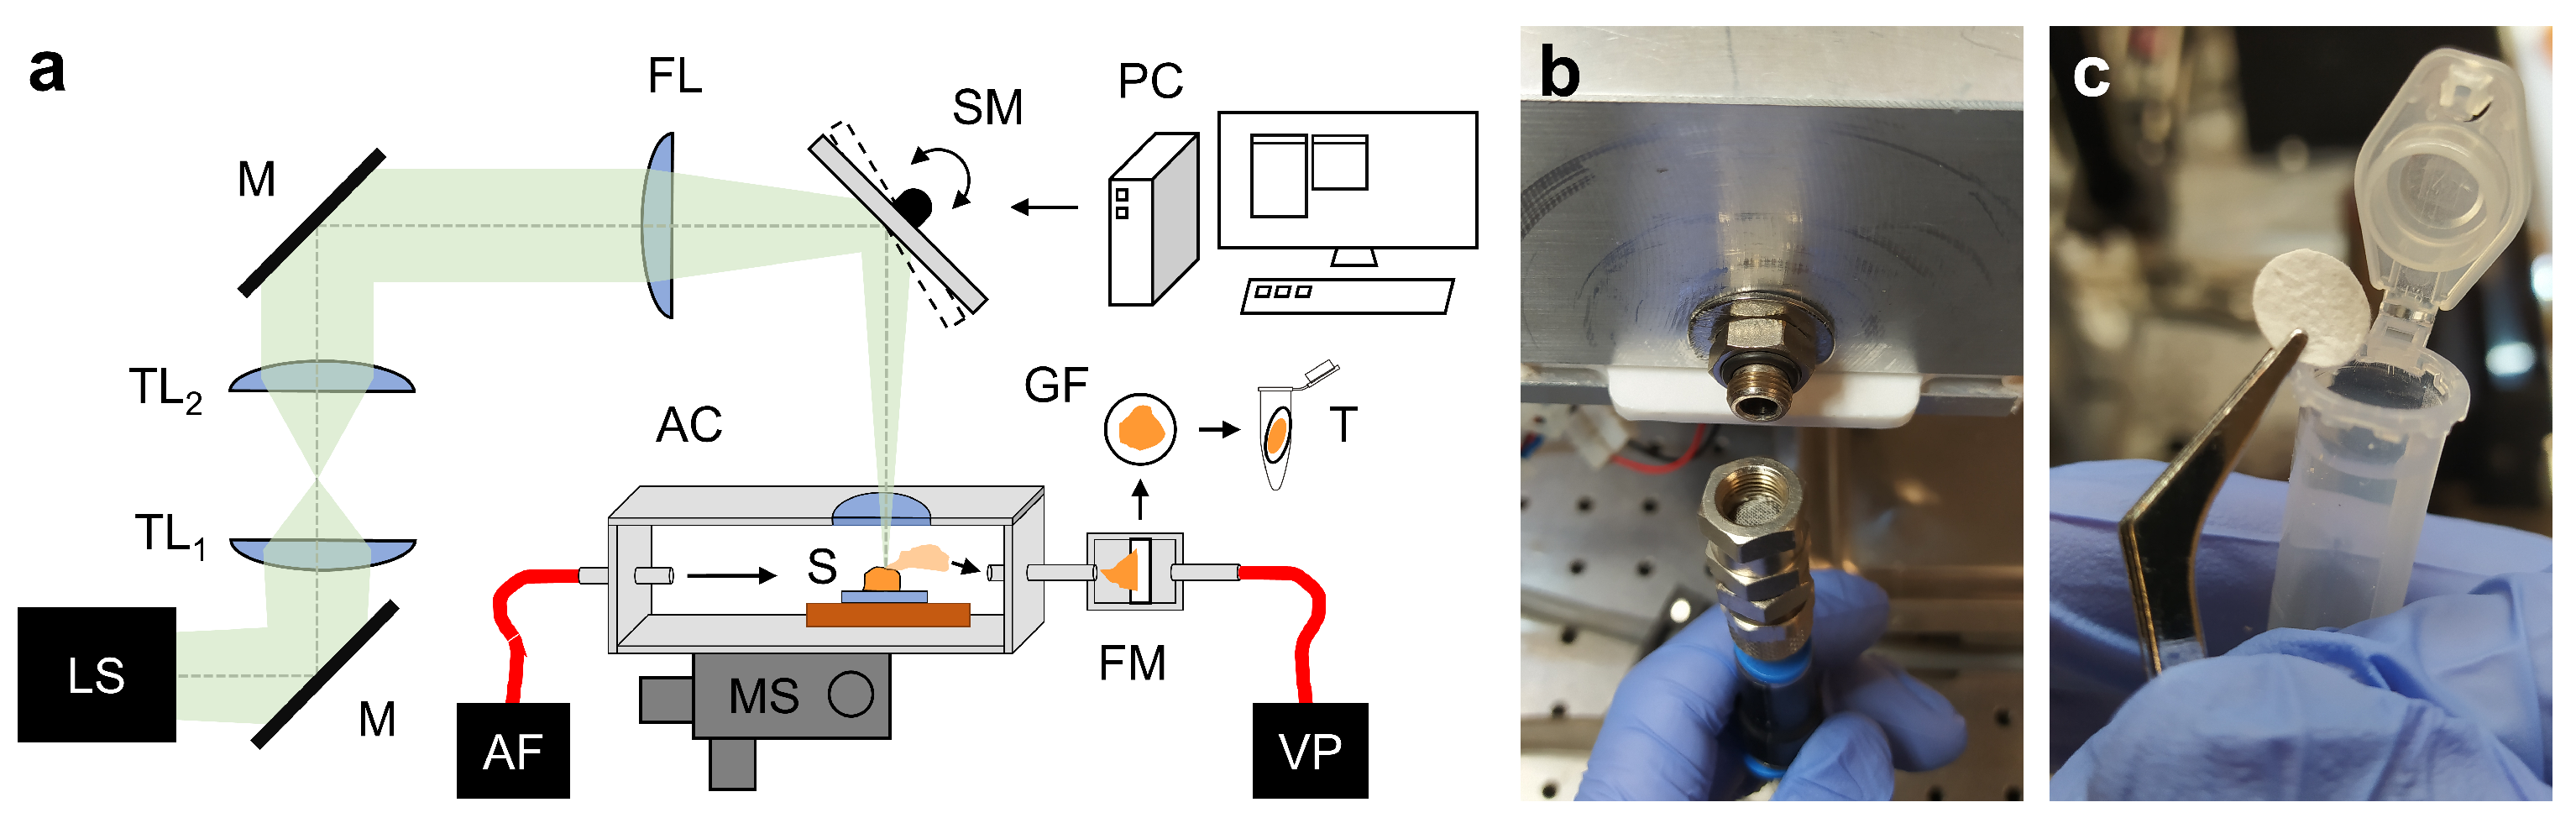
4.2. Ablation Setup
4.3. Laser Parameters and Tissue Sampling
4.4. Extraction of Lipids from the Tissue Aerosol Condensates
4.5. Lipidomic Analysis
4.6. Data Analysis and Visualization
5. Conclusions
Supplementary Materials
Author Contributions
Funding
Institutional Review Board Statement
Informed Consent Statement
Data Availability Statement
Acknowledgments
Conflicts of Interest
References
- Sung, H.; Ferlay, J.; Siegel, R.L.; Laversanne, M.; Soerjomataram, I.; Jemal, A.; Bray, F. Global Cancer Statistics 2020: GLOBOCAN Estimates of Incidence and Mortality Worldwide for 36 Cancers in 185 Countries. CA Cancer J. Clin. 2021, 71, 209–249. [Google Scholar] [CrossRef] [PubMed]
- Pytynia, K.B.; Dahlstrom, K.R.; Sturgis, E.M. Epidemiology of HPV-associated oropharyngeal cancer. Oral Oncol. 2014, 50, 380–386. [Google Scholar] [CrossRef] [PubMed]
- Mody, M.D.; Rocco, J.W.; Yom, S.S.; Haddad, R.I.; Saba, N.F. Head and neck cancer. Lancet 2021, 398, 2289–2299. [Google Scholar] [CrossRef] [PubMed]
- Lechner, M.; Liu, J.; Masterson, L.; Fenton, T.R. HPV-associated oropharyngeal cancer: Epidemiology, molecular biology and clinical management. Nat. Rev. Clin. Oncol. 2022, 19, 306–327. [Google Scholar] [CrossRef]
- Bozec, A.; Culié, D.; Poissonnet, G.; Dassonville, O. Current role of primary surgical treatment in patients with head and neck squamous cell carcinoma. Curr. Opin. Oncol. 2019, 31, 138–145. [Google Scholar] [CrossRef]
- Johnson, D.E.; Burtness, B.; Leemans, C.R.; Lui, V.W.Y.; Bauman, J.E.; Grandis, J.R. Head and neck squamous cell carcinoma. Nat. Rev. Dis. Prim. 2020, 6, 92. [Google Scholar] [CrossRef]
- Santos, C.R.; Schulze, A. Lipid metabolism in cancer. FEBS J. 2012, 279, 2610–2623. [Google Scholar] [CrossRef]
- Beloribi-Djefaflia, S.; Vasseur, S.; Guillaumond, F. Lipid metabolic reprogramming in cancer cells. Oncogenesis 2016, 5, e189. [Google Scholar] [CrossRef]
- Vasseur, S.; Guillaumond, F. Lipids in cancer: A global view of the contribution of lipid pathways to metastatic formation and treatment resistance. Oncogenesis 2022, 11, 46. [Google Scholar] [CrossRef]
- Butler, L.M.; Perone, Y.; Dehairs, J.; Lupien, L.E.; de Laat, V.; Talebi, A.; Loda, M.; Kinlaw, W.B.; Swinnen, J.V. Lipids and cancer: Emerging roles in pathogenesis, diagnosis and therapeutic intervention. Adv. Drug Deliv. Rev. 2020, 159, 245–293. [Google Scholar] [CrossRef]
- Snaebjornsson, M.T.; Janaki-Raman, S.; Schulze, A. Greasing the Wheels of the Cancer Machine: The Role of Lipid Metabolism in Cancer. Cell Metab. 2020, 31, 62–76. [Google Scholar] [CrossRef]
- Ogrinc, N.; Attencourt, C.; Colin, E.; Boudahi, A.; Tebbakha, R.; Salzet, M.; Testelin, S.; Dakpé, S.; Fournier, I. Mass Spectrometry-Based Differentiation of Oral Tongue Squamous Cell Carcinoma and Nontumor Regions With the SpiderMass Technology. Front. Oral Health 2022, 3, 827360. [Google Scholar] [CrossRef]
- Dickinson, A.; Saraswat, M.; Joenväärä, S.; Agarwal, R.; Jyllikoski, D.; Wilkman, T.; Mäkitie, A.; Silén, S. Mass spectrometry-based lipidomics of oral squamous cell carcinoma tissue reveals aberrant cholesterol and glycerophospholipid—A Pilot study. Transl. Oncol. 2020, 13, 100807. [Google Scholar] [CrossRef]
- Yu, B.; Wang, J. Lipidomics Identified Lyso-Phosphatidylcholine and Phosphatidylethanolamine as Potential Biomarkers for Diagnosis of Laryngeal Cancer. Front. Oncol. 2021, 11, 646779. [Google Scholar] [CrossRef]
- Perrotti, F.; Rosa, C.; Cicalini, I.; Sacchetta, P.; Del Boccio, P.; Genovesi, D.; Pieragostino, D. Advances in Lipidomics for Cancer Biomarkers Discovery. Int. J. Mol. Sci. 2016, 17, 1992. [Google Scholar] [CrossRef]
- Pan, M.; Qin, C.; Han, X. Lipid Metabolism and Lipidomics Applications in Cancer Research. In Advances in Experimental Medicine and Biology; Springer: Singapore, 2021; pp. 1–24. [Google Scholar] [CrossRef]
- Baddour, H.M.; Magliocca, K.R.; Chen, A.Y. The importance of margins in head and neck cancer. J. Surg. Oncol. 2016, 113, 248–255. [Google Scholar] [CrossRef]
- Ringash, J. Survivorship and Quality of Life in Head and Neck Cancer. J. Clin. Oncol. 2015, 33, 3322–3327. [Google Scholar] [CrossRef]
- Bozzetti, F.; Bonfanti, G.; Bufalino, R.; Menotti, V.; Persano, S.; Andreola, S.; Doci, R.; Gennari, L. Adequacy of margins of resection in gastrectomy for cancer. Ann. Surg. 1982, 196, 685–690. [Google Scholar] [CrossRef]
- Shin, D.; Park, S.S. Clinical importance and surgical decision-making regarding proximal resection margin for gastric cancer. World J. Gastrointest. Oncol. 2013, 5, 4–11. [Google Scholar] [CrossRef]
- Heiss, N.; Rousson, V.; Ifticene-Treboux, A.; Lehr, H.A.; Delaloye, J.F. Risk factors for positive resection margins of breast cancer tumorectomy specimen following breast-conserving surgery. Horm. Mol. Biol. Clin. Investig. 2017, 32. [Google Scholar] [CrossRef]
- Sakr, R.; Poulet, B.; Kaufman, G.; Nos, C.; Clough, K. Clear margins for invasive lobular carcinoma: A surgical challenge. Eur. J. Surg. Oncol. EJSO 2011, 37, 350–356. [Google Scholar] [CrossRef] [PubMed]
- DiNardo, L.J.; Lin, J.; Karageorge, L.S.; Powers, C.N. Accuracy, Utility, and Cost of Frozen Section Margins in Head and Neck Cancer Surgery. Laryngoscope 2000, 110, 1773–1776. [Google Scholar] [CrossRef] [PubMed]
- Ribeiro, N.; Godden, D.; Wilson, G.; Butterworth, D.; Woodwards, R. Do frozen sections help achieve adequate surgical margins in the resection of oral carcinoma? Int. J. Oral Maxillofac. Surg. 2003, 32, 152–158. [Google Scholar] [CrossRef] [PubMed]
- Du, E.; Ow, T.J.; Lo, Y.T.; Gersten, A.; Schiff, B.A.; Tassler, A.B.; Smith, R.V. Refining the utility and role of Frozen section in head and neck squamous cell carcinoma resection. Laryngoscope 2016, 126, 1768–1775. [Google Scholar] [CrossRef] [PubMed]
- Layfield, E.M.; Schmidt, R.L.; Esebua, M.; Layfield, L.J. Frozen Section Evaluation of Margin Status in Primary Squamous Cell Carcinomas of the Head and Neck: A Correlation Study of Frozen Section and Final Diagnoses. Head Neck Pathol. 2018, 12, 175–180. [Google Scholar] [CrossRef]
- Black, C.; Marotti, J.; Zarovnaya, E.; Paydarfar, J. Critical evaluation of frozen section margins in head and neck cancer resections. Cancer 2006, 107, 2792–2800. [Google Scholar] [CrossRef]
- Desciak, E.B.; Maloney, M.E. Artifacts in Frozen Section Preparation. Dermatol. Surg. 2000, 26, 500–504. [Google Scholar] [CrossRef]
- Novis, D.A.; Zarbo, R.J. Interinstitutional comparison of frozen section turnaround time. A College of American Pathologists Q-Probes study of 32868 frozen sections in 700 hospitals. Arch. Pathol. Lab. Med. 1997, 121, 559–567. [Google Scholar]
- Phelps, D.L.; Balog, J.; Gildea, L.F.; Bodai, Z.; Savage, A.; El-Bahrawy, M.A.; Speller, A.V.; Rosini, F.; Kudo, H.; McKenzie, J.S.; et al. The surgical intelligent knife distinguishes normal, borderline and malignant gynaecological tissues using rapid evaporative ionisation mass spectrometry (REIMS). Br. J. Cancer 2018, 118, 1349–1358. [Google Scholar] [CrossRef]
- Woolman, M.; Tata, A.; Dara, D.; Meens, J.; D’Arcangelo, E.; Perez, C.J.; Saiyara Prova, S.; Bluemke, E.; Ginsberg, H.J.; Ifa, D.; et al. Rapid determination of the tumour stroma ratio in squamous cell carcinomas with desorption electrospray ionization mass spectrometry (DESI-MS): A proof-of-concept demonstration. Analyst 2017, 142, 3250–3260. [Google Scholar] [CrossRef]
- Fatou, B.; Saudemont, P.; Leblanc, E.; Vinatier, D.; Mesdag, V.; Wisztorski, M.; Focsa, C.; Salzet, M.; Ziskind, M.; Fournier, I. In vivo Real-Time Mass Spectrometry for Guided Surgery Application. Sci. Rep. 2016, 6, 25919. [Google Scholar] [CrossRef]
- Zhang, J.; Rector, J.; Lin, J.Q.; Young, J.H.; Sans, M.; Katta, N.; Giese, N.; Yu, W.; Nagi, C.; Suliburk, J.; et al. Nondestructive tissue analysis for ex vivo and in vivo cancer diagnosis using a handheld mass spectrometry system. Sci. Transl. Med. 2017, 9. [Google Scholar] [CrossRef]
- Woolman, M.; Qiu, J.; Kuzan-Fischer, C.M.; Ferry, I.; Dara, D.; Katz, L.; Daud, F.; Wu, M.; Ventura, M.; Bernards, N.; et al. In situ tissue pathology from spatially encoded mass spectrometry classifiers visualized in real time through augmented reality. Chem. Sci. 2020, 11, 8723–8735. [Google Scholar] [CrossRef]
- Saudemont, P.; Quanico, J.; Robin, Y.M.; Baud, A.; Balog, J.; Fatou, B.; Tierny, D.; Pascal, Q.; Minier, K.; Pottier, M.; et al. Real-Time Molecular Diagnosis of Tumors Using Water-Assisted Laser Desorption/Ionization Mass Spectrometry Technology. Cancer Cell 2018, 34, 840–851.e4. [Google Scholar] [CrossRef]
- Ogrinc, N.; Saudemont, P.; Balog, J.; Robin, Y.M.; Gimeno, J.P.; Pascal, Q.; Tierny, D.; Takats, Z.; Salzet, M.; Fournier, I. Water-assisted laser desorption/ionization mass spectrometry for minimally invasive in vivo and real-time surface analysis using SpiderMass. Nat. Protoc. 2019, 14, 3162–3182. [Google Scholar] [CrossRef]
- Böttcher, A.; Kucher, S.; Knecht, R.; Jowett, N.; Krötz, P.; Reimer, R.; Schumacher, U.; Anders, S.; Münscher, A.; Dalchow, C.V.; et al. Reduction of thermocoagulative injury via use of a picosecond infrared laser (PIRL) in laryngeal tissues. Eur. Arch. Otorhinolaryngol. 2015, 272, 941–948. [Google Scholar] [CrossRef]
- Cowan, M.L.; Bruner, B.D.; Huse, N.; Dwyer, J.R.; Chugh, B.; Nibbering, E.T.J.; Elsaesser, T.; Miller, R.J.D. Ultrafast memory loss and energy redistribution in the hydrogen bond network of liquid H2O. Nature 2005, 434, 199–202. [Google Scholar] [CrossRef]
- Franjic, K.; Miller, R.J.D. Vibrationally excited ultrafast thermodynamic phase transitions at the water/air interface. Phys. Chem. Chem. Phys. 2010, 12, 5225. [Google Scholar] [CrossRef]
- Wurlitzer, M.; Hessling, E.; Rinas, K.; Fuh, M.; Petersen, H.; Ricklefs, F.; Lamszus, K.; Regelsberger, J.; Maier, S.; Kruber, S.; et al. Mass Spectrometric Lipid Profiles of Picosecond Infrared Laser-Generated Tissue Aerosols Discriminate Different Brain Tissues. Lasers Surg. Med. 2020, 52, 228–234. [Google Scholar] [CrossRef]
- Woolman, M.; Ferry, I.; Kuzan-Fischer, C.M.; Wu, M.; Zou, J.; Kiyota, T.; Isik, S.; Dara, D.; Aman, A.; Das, S.; et al. Rapid determination of medulloblastoma subgroup affiliation with mass spectrometry using a handheld picosecond infrared laser desorption probe. Chem. Sci. 2017, 8, 6508–6519. [Google Scholar] [CrossRef]
- Zou, J.; Talbot, F.; Tata, A.; Ermini, L.; Franjic, K.; Ventura, M.; Zheng, J.; Ginsberg, H.; Post, M.; Ifa, D.R.; et al. Ambient Mass Spectrometry Imaging with Picosecond Infrared Laser Ablation Electrospray Ionization (PIR-LAESI). Anal. Chem. 2015, 87, 12071–12079. [Google Scholar] [CrossRef] [PubMed]
- Dreisewerd, K.; Draude, F.; Kruppe, S.; Rohlfing, A.; Berkenkamp, S.; Pohlentz, G. Molecular Analysis of Native Tissue and Whole Oils by Infrared Laser Mass Spectrometry. Anal. Chem. 2007, 79, 4514–4520. [Google Scholar] [CrossRef] [PubMed]
- Voß, H.; Moritz, M.; Pelczar, P.; Gagliani, N.; Huber, S.; Nippert, V.; Schlüter, H.; Hahn, J. Tissue Sampling and Homogenization with NIRL Enables Spatially Resolved Cell Layer Specific Proteomic Analysis of the Murine Intestine. Int. J. Mol. Sci. 2022, 23, 6132. [Google Scholar] [CrossRef] [PubMed]
- Hahn, J.; Moritz, M.; Voß, H.; Pelczar, P.; Huber, S.; Schlüter, H. Tissue Sampling and Homogenization in the Sub-Microliter Scale with a Nanosecond Infrared Laser (NIRL) for Mass Spectrometric Proteomics. Int. J. Mol. Sci. 2021, 22, 10833. [Google Scholar] [CrossRef]
- Ogrinc, N.; Caux, P.D.; Robin, Y.M.; Bouchaert, E.; Fatou, B.; Ziskind, M.; Focsa, C.; Bertin, D.; Tierny, D.; Takats, Z.; et al. Direct Water-Assisted Laser Desorption/Ionization Mass Spectrometry Lipidomic Analysis and Classification of Formalin-Fixed Paraffin-Embedded Sarcoma Tissues without Dewaxing. Clin. Chem. 2021, 67, 1513–1523. [Google Scholar] [CrossRef]
- Vos, D.; Bowman, A.; Heeren, R.; Balluff, B.; Ellis, S. Class-specific depletion of lipid ion signals in tissues upon formalin fixation. Int. J. Mass Spectrom. 2019, 446, 116212. [Google Scholar] [CrossRef]
- Gaudin, M.; Panchal, M.; Ayciriex, S.; Werner, E.; Brunelle, A.; Touboul, D.; Boursier-Neyret, C.; Auzeil, N.; Walther, B.; Duyckaerts, C.; et al. Ultra performance liquid chromatography—Mass spectrometry studies of formalin-induced alterations of human brain lipidome. J. Mass Spectrom. 2014, 49, 1035–1042. [Google Scholar] [CrossRef]
- Li, J.; Ren, S.; Piao, H.l.; Wang, F.; Yin, P.; Xu, C.; Lu, X.; Ye, G.; Shao, Y.; Yan, M.; et al. Integration of lipidomics and transcriptomics unravels aberrant lipid metabolism and defines cholesteryl oleate as potential biomarker of prostate cancer. Sci. Rep. 2016, 6, 20984. [Google Scholar] [CrossRef]
- Hung, C.Y.; Yeh, T.S.; Tsai, C.K.; Wu, R.C.; Lai, Y.C.; Chiang, M.H.; Lu, K.Y.; Lin, C.N.; Cheng, M.L.; Lin, G. Glycerophospholipids pathways and chromosomal instability in gastric cancer: Global lipidomics analysis. World J. Gastrointest. Oncol. 2019, 11, 181–194. [Google Scholar] [CrossRef]
- Katz, L.; Woolman, M.; Tata, A.; Zarrine-Afsar, A. Potential impact of tissue molecular heterogeneity on ambient mass spectrometry profiles: A note of caution in choosing the right disease model. Anal. Bioanal. Chem. 2021, 413, 2655–2664. [Google Scholar] [CrossRef]
- Katz, L.; Tata, A.; Woolman, M.; Zarrine-Afsar, A. Lipid Profiling in Cancer Diagnosis with Hand-Held Ambient Mass Spectrometry Probes: Addressing the Late-Stage Performance Concerns. Metabolites 2021, 11, 660. [Google Scholar] [CrossRef]
- Donnarumma, F.; Murray, K.K. Laser ablation sample transfer for localized LC-MS/MS proteomic analysis of tissue. J. Mass Spectrom. 2016, 51, 261–268. [Google Scholar] [CrossRef]
- Pettit, M.E.; Donnarumma, F.; Murray, K.K.; Solouki, T. Infrared laser ablation sampling coupled with data independent high resolution UPLC-IM-MS/MS for tissue analysis. Anal. Chim. Acta 2018, 1034, 102–109. [Google Scholar] [CrossRef]
- Wang, Y.; Yutuc, E.; Griffiths, W.J. Standardizing and increasing the utility of lipidomics: A look to the next decade. Expert Rev. Proteom. 2020, 17, 699–717. [Google Scholar] [CrossRef]
- Schluter, M.; Fuh, M.M.; Maier, S.; Otte, C.; Kiani, P.; Hansen, N.O.; Dwayne Miller, R.J.; Schluter, H.; Schlaefer, A. Towards OCT-Navigated Tissue Ablation with a Picosecond Infrared Laser (PIRL) and Mass-Spectrometric Analysis. In Proceedings of the 2019 41st Annual International Conference of the IEEE Engineering in Medicine and Biology Society (EMBC), Berlin, Germany, 23–27 July 2019; pp. 158–161. [Google Scholar] [CrossRef]
- Krutilin, A.; Maier, S.; Schuster, R.; Kruber, S.; Kwiatkowski, M.; Robertson, W.D.; Hansen, N.O.; Miller, R.J.D.; Schlüter, H. Sampling of Tissues with Laser Ablation for Proteomics: Comparison of Picosecond Infrared Laser and Microsecond Infrared Laser. J. Proteome Res. 2019, 18, 1451–1457. [Google Scholar] [CrossRef]
- Schneider, B.B.; Covey, T.R.; Coy, S.L.; Krylov, E.V.; Nazarov, E.G. Planar differential mobility spectrometer as a pre-filter for atmospheric pressure ionization mass spectrometry. Int. J. Mass Spectrom. 2010, 298, 45–54. [Google Scholar] [CrossRef]
- Lintonen, T.P.I.; Baker, P.R.S.; Suoniemi, M.; Ubhi, B.K.; Koistinen, K.M.; Duchoslav, E.; Campbell, J.L.; Ekroos, K. Differential Mobility Spectrometry-Driven Shotgun Lipidomics. Anal. Chem. 2014, 86, 9662–9669. [Google Scholar] [CrossRef]


| Number of Patients (n) | 4 |
|---|---|
| Sex, (n (%)) | |
| male | 3 (75%) |
| female | 1 (25%) |
| Mean age at surgery (years) | 63 |
| Age range (years) | 51–69 |
| OPSCC | |
| of the tonsils (n (%)) | 2 (50%) |
| of the base of the tongue (n (%)) | 2 (50%) |
| Patient Number | Age | Gender | Tumor Location | Alcohol Consumption | Tobacco Consumption | OPSCC Samples per Patient | p16/HPV Status |
|---|---|---|---|---|---|---|---|
| A | 69 | M | BOT | Yes | No | 2 | +/+ |
| B | 64 | F | BOT | No | Yes | 2 | +/+ |
| C | 66 | M | Tonsil | Yes | No | 1 | +/+ |
| D | 51 | M | Tonsil | Yes | Yes | 2 | +/+ |
| Patient | OPSCC Location | OPSCC Samples | Healthy Mucosa Samples |
|---|---|---|---|
| A | BOT | A-1 | A-H |
| A-2 | |||
| B | BOT | B-1 | B-H |
| B-2 | |||
| C | Tonsil | C-1 | C-H |
| D | Tonsil | D-1 | D-H |
| D-2 |
| BOT | Tonsil | ||||||
|---|---|---|---|---|---|---|---|
| Patient A | Patient B | Patient C | Patient D | ||||
| Samples tested | A-1 vs. A-H | A-2 vs. A-H | B-1 vs. B-H | B-2 vs. B-H | C-1 vs. C-H | D-1 vs. D-H | D-2 vs. D-H |
| ↓ in OPSCC | 103 | 162 | 78 | 74 | 26 | 20 | 4 |
| ↑ in OPSCC | 17 | 24 | 4 | 11 | 8 | 28 | 34 |
Disclaimer/Publisher’s Note: The statements, opinions and data contained in all publications are solely those of the individual author(s) and contributor(s) and not of MDPI and/or the editor(s). MDPI and/or the editor(s) disclaim responsibility for any injury to people or property resulting from any ideas, methods, instructions or products referred to in the content. |
© 2023 by the authors. Licensee MDPI, Basel, Switzerland. This article is an open access article distributed under the terms and conditions of the Creative Commons Attribution (CC BY) license (https://creativecommons.org/licenses/by/4.0/).
Share and Cite
Stadlhofer, R.; Moritz, M.; Fuh, M.M.; Heeren, J.; Zech, H.; Clauditz, T.S.; Schlüter, H.; Betz, C.S.; Eggert, D.; Böttcher, A.; et al. Lipidome Analysis of Oropharyngeal Tumor Tissues Using Nanosecond Infrared Laser (NIRL) Tissue Sampling and Subsequent Mass Spectrometry. Int. J. Mol. Sci. 2023, 24, 7820. https://doi.org/10.3390/ijms24097820
Stadlhofer R, Moritz M, Fuh MM, Heeren J, Zech H, Clauditz TS, Schlüter H, Betz CS, Eggert D, Böttcher A, et al. Lipidome Analysis of Oropharyngeal Tumor Tissues Using Nanosecond Infrared Laser (NIRL) Tissue Sampling and Subsequent Mass Spectrometry. International Journal of Molecular Sciences. 2023; 24(9):7820. https://doi.org/10.3390/ijms24097820
Chicago/Turabian StyleStadlhofer, Rupert, Manuela Moritz, Marceline M. Fuh, Jörg Heeren, Henrike Zech, Till S. Clauditz, Hartmut Schlüter, Christian S. Betz, Dennis Eggert, Arne Böttcher, and et al. 2023. "Lipidome Analysis of Oropharyngeal Tumor Tissues Using Nanosecond Infrared Laser (NIRL) Tissue Sampling and Subsequent Mass Spectrometry" International Journal of Molecular Sciences 24, no. 9: 7820. https://doi.org/10.3390/ijms24097820