
Prenatal Exposure to Metabolism-Disrupting Chemicals, Cord Blood Transcriptome Perturbations, and Birth Weight in a Belgian Birth Cohort
 , , ,
, , ,
Abstract
:1. Introduction
2. Results
2.1. Population Characteristics
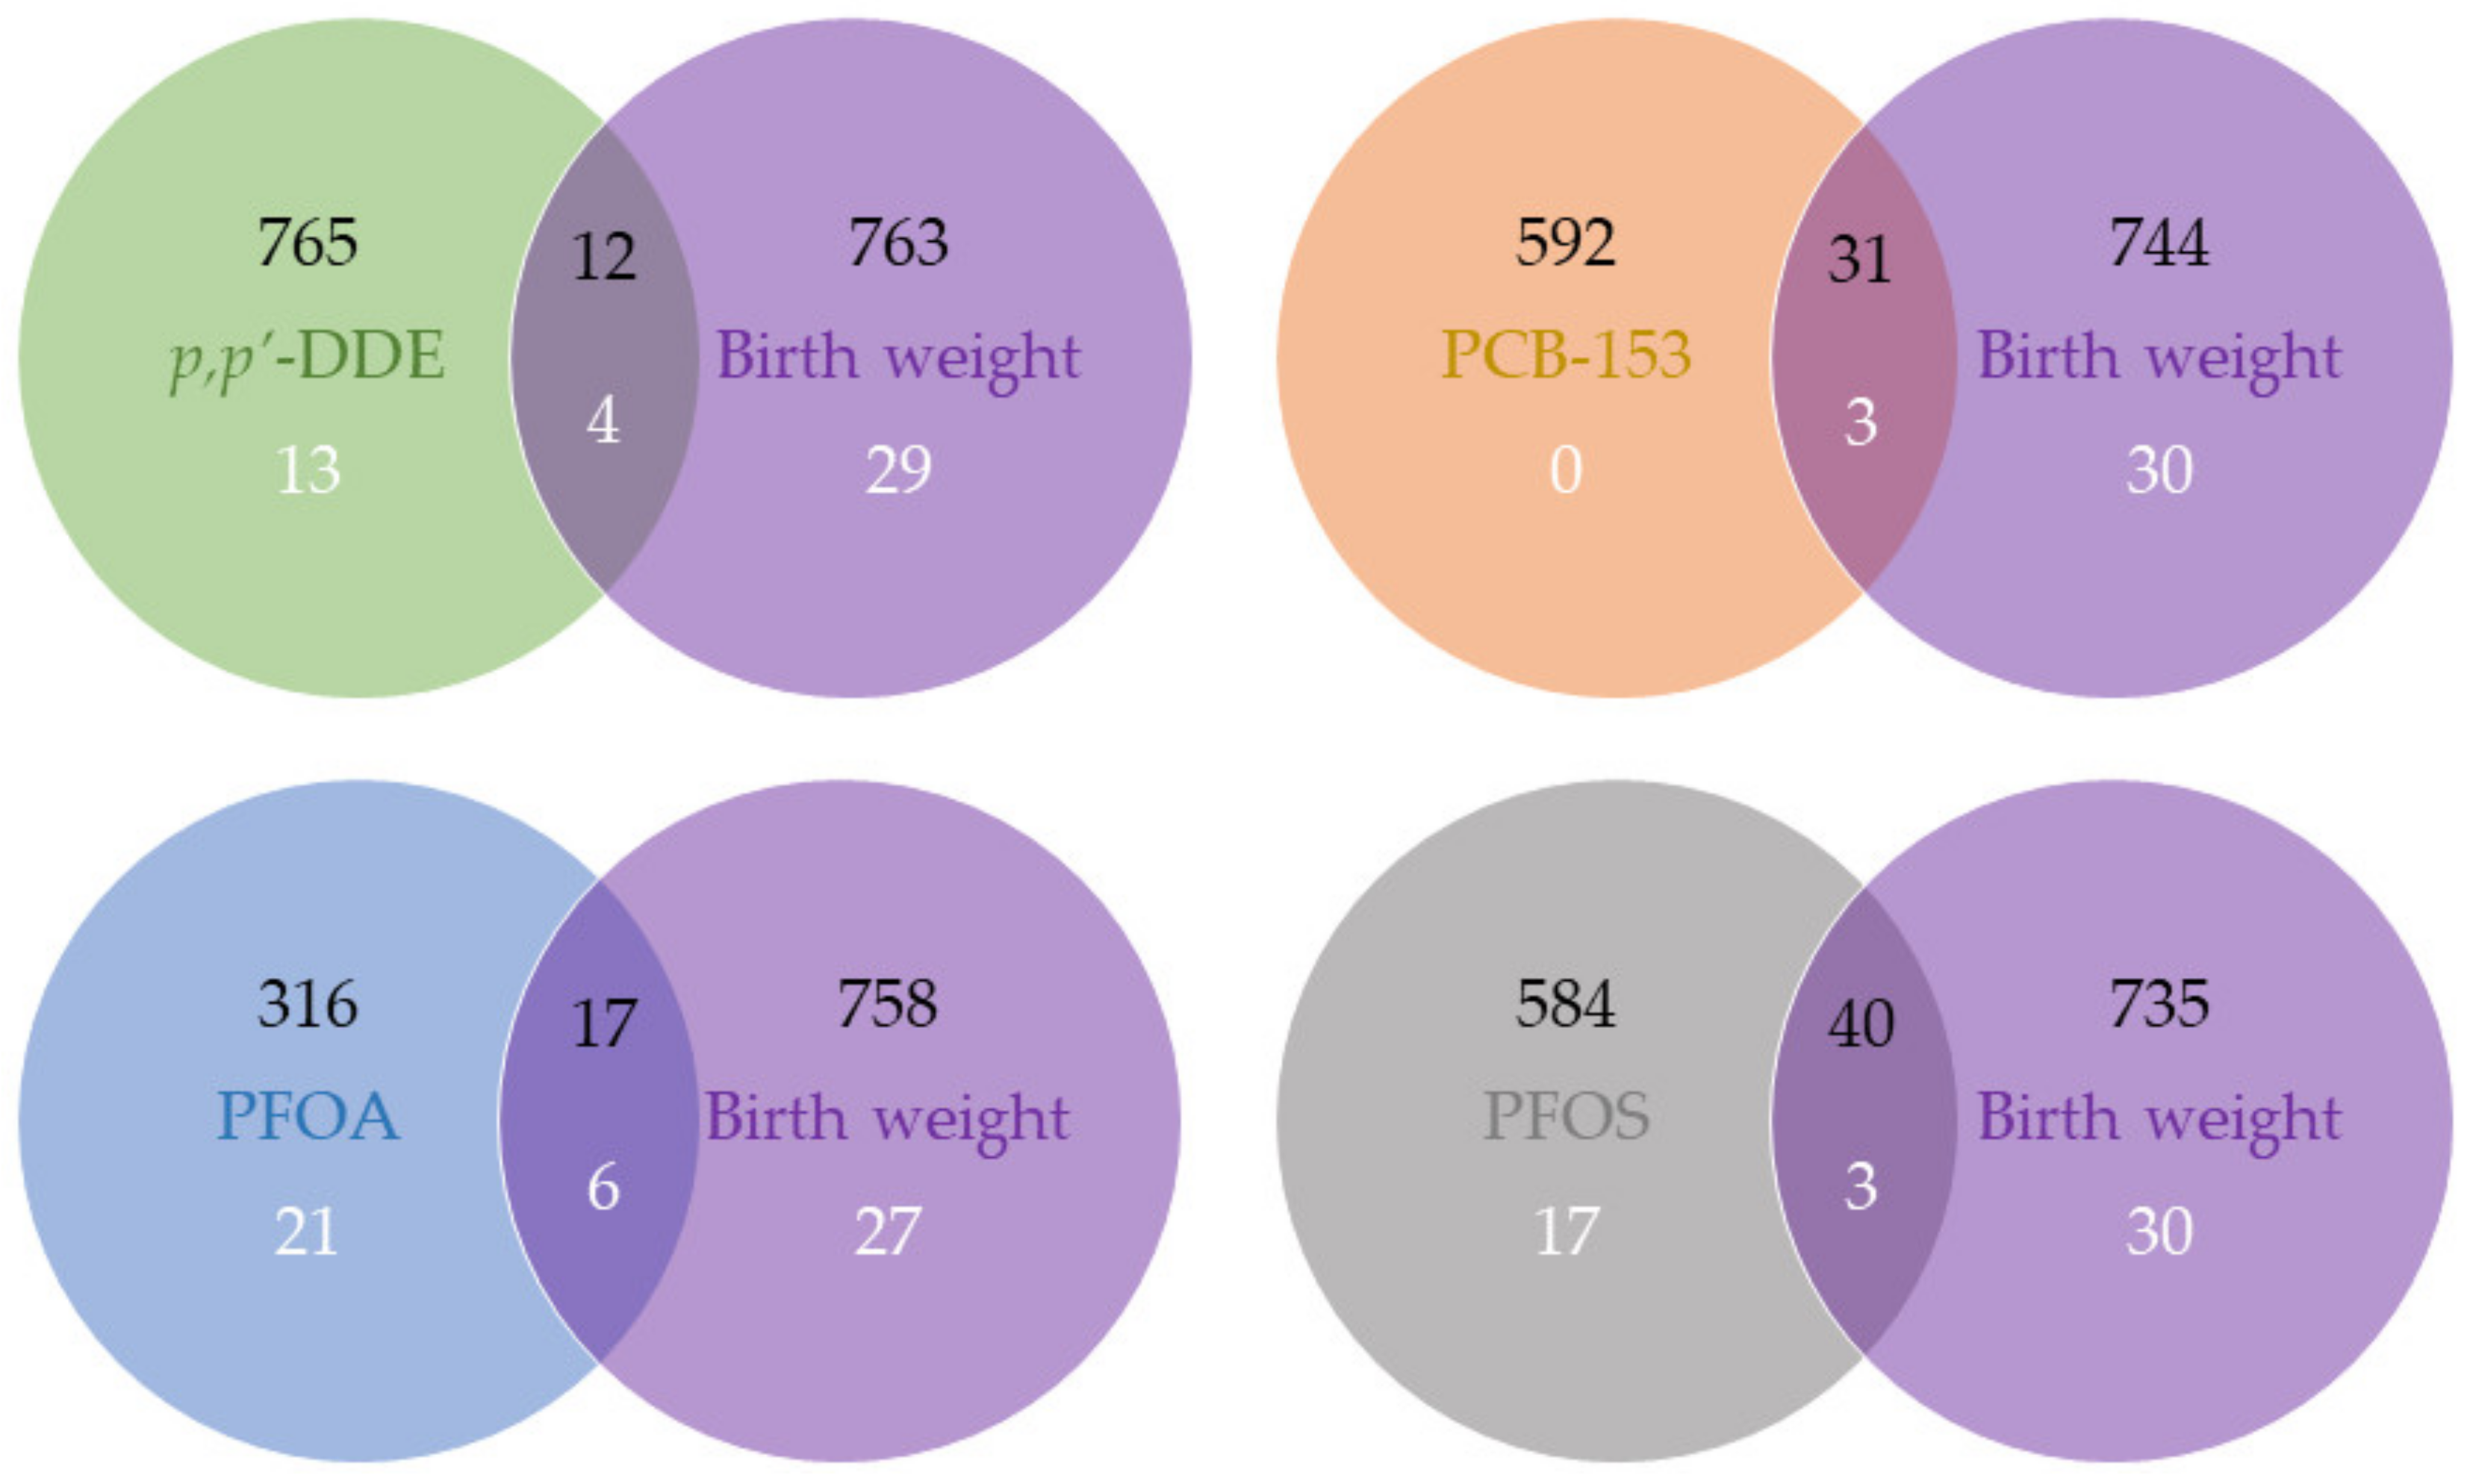
2.2. Gene Expression Associated with MDCs and Birth Weight
2.3. Pathways Associated with MDCs and Birth Weight
3. Discussion
4. Materials and Methods
4.1. Study Population
4.2. Exposure Assessment
4.3. Transcriptome Profiling and Processing
4.4. Outcome Assessment and Covariates
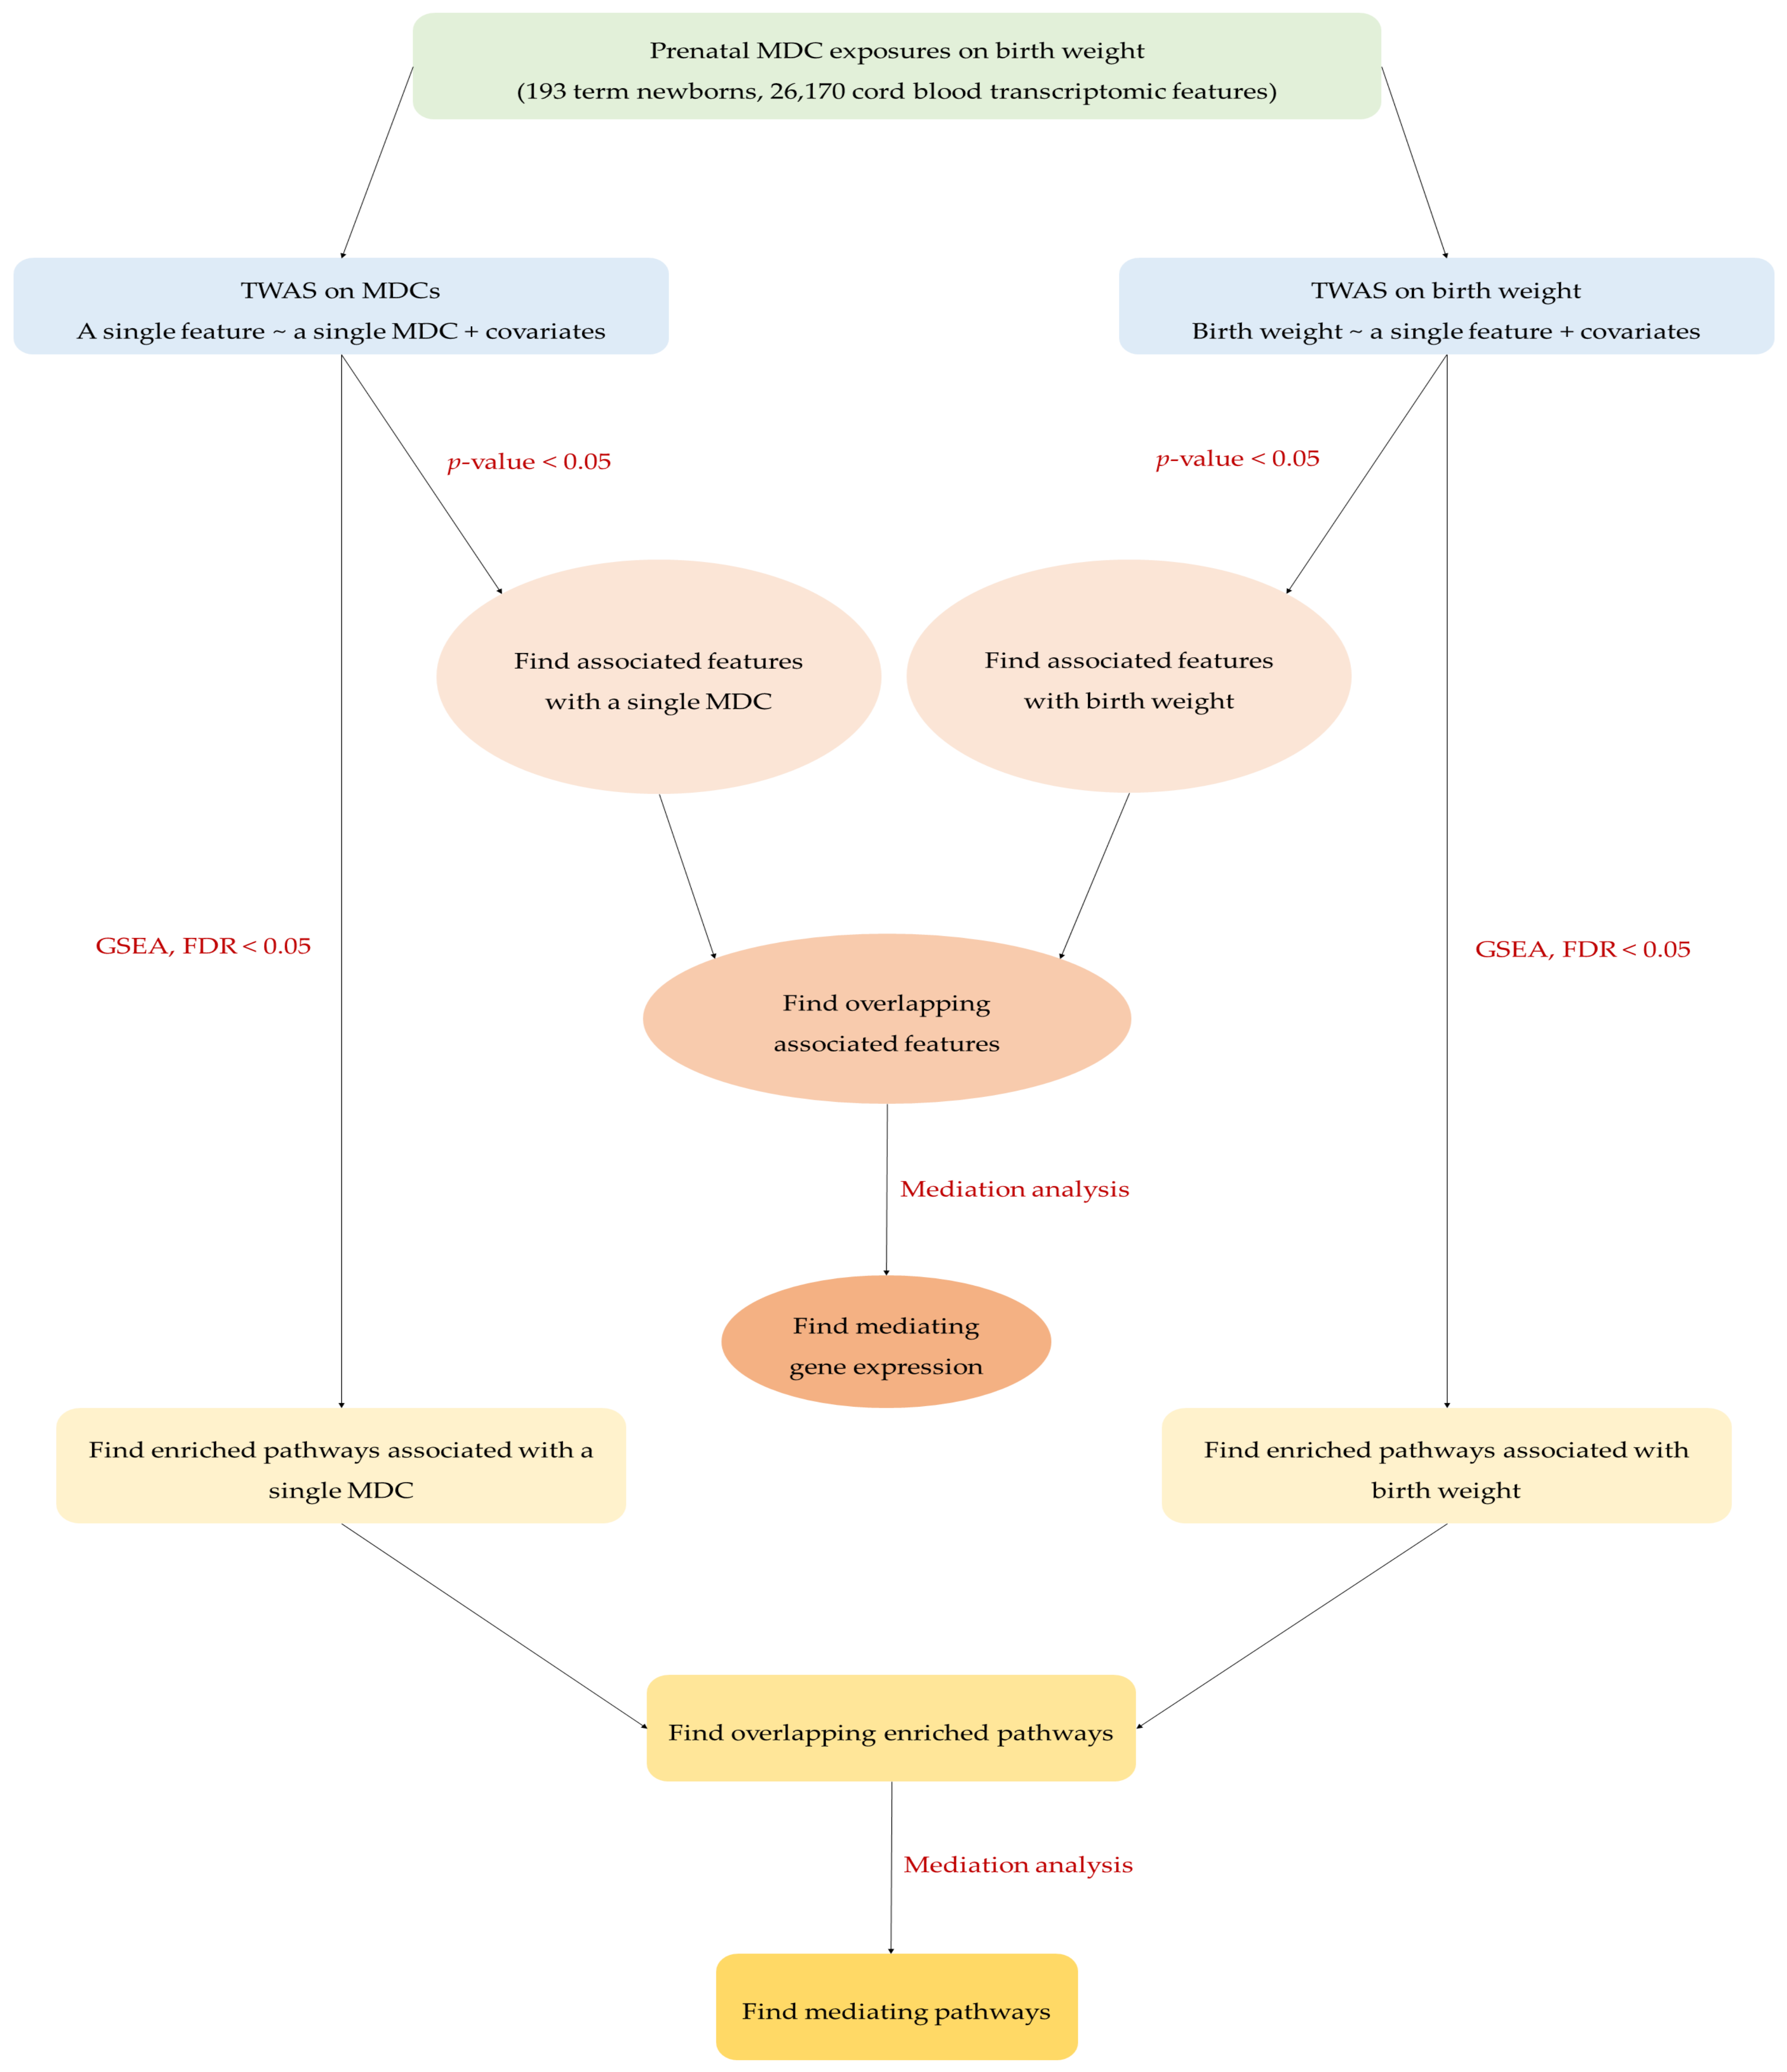
4.5. TWAS
4.6. Enrichment Pathway Analysis
4.7. Mediation Analysis
4.8. Sensitivity Analysis
5. Conclusions
Supplementary Materials
Author Contributions
Funding
Institutional Review Board Statement
Informed Consent Statement
Data Availability Statement
Acknowledgments
Conflicts of Interest
References
- Heindel, J.J.; Blumberg, B.; Cave, M.; Machtinger, R.; Mantovani, A.; Mendez, M.A.; Nadal, A.; Palanza, P.; Panzica, G.; Sargis, R.; et al. Metabolism Disrupting Chemicals and Metabolic Disorders. Reprod. Toxicol. 2017, 68, 3–33. [Google Scholar] [CrossRef] [PubMed]
- Heindel, J.J.; vom Saal, F.S. Role of Nutrition and Environmental Endocrine Disrupting Chemicals during the Perinatal Period on the Aetiology of Obesity. Mol. Cell. Endocrinol. 2009, 304, 90–96. [Google Scholar] [CrossRef]
- Perlroth, N.H.; Branco, C.W.C. Current Knowledge of Environmental Exposure in Children during the Sensitive Developmental Periods. J. Pediatr. 2017, 93, 17–27. [Google Scholar] [CrossRef] [PubMed]
- Binkin, N.J.; Yip, R.; Fleshood, L.; Trowbridge, F.L. Birth Weight and Childhood Growth. Pediatrics 1988, 82, 828–834. [Google Scholar] [CrossRef] [PubMed]
- Knop, M.R.; Geng, T.T.; Gorny, A.W.; Ding, R.; Li, C.; Ley, S.H.; Huang, T. Birth Weight and Risk of Type 2 Diabetes Mellitus, Cardiovascular Disease, and Hypertension in Adults: A Meta-Analysis of 7,646,267 Participants From 135 Studies. J. Am. Heart Assoc. 2018, 7, e008870. [Google Scholar] [CrossRef] [PubMed]
- Qiao, Y.; Ma, J.; Wang, Y.; Li, W.; Katzmarzyk, P.T.; Chaput, J.-P.; Fogelholm, M.; Johnson, W.D.; Kuriyan, R.; Kurpad, A.; et al. Birth Weight and Childhood Obesity: A 12-Country Study. Int. J. Obes. Suppl. 2015, 5 (Suppl. S2), S74–S79. [Google Scholar] [CrossRef]
- Casas, M.; Nieuwenhuijsen, M.; Martínez, D.; Ballester, F.; Basagaña, X.; Basterrechea, M.; Chatzi, L.; Chevrier, C.; Eggesbø, M.; Fernandez, M.F.; et al. Prenatal Exposure to PCB-153, p,p’-DDE and Birth Outcomes in 9000 Mother-Child Pairs: Exposure-Response Relationship and Effect Modifiers. Environ. Int. 2015, 74, 23–31. [Google Scholar] [CrossRef]
- Govarts, E.; Nieuwenhuijsen, M.; Schoeters, G.; Ballester, F.; Bloemen, K.; de Boer, M.; Chevrier, C.; EggesbØ, M.; Guxens, M.; Krämer, U.; et al. Birth Weight and Prenatal Exposure to Polychlorinated Biphenyls (PCBs) and Dichlorodiphenyldichloroethylene (DDE): A Meta-Analysis within 12 European Birth Cohorts. Environ. Health Perspect. 2012, 120, 162–170. [Google Scholar] [CrossRef]
- Dzierlenga, M.W.; Crawford, L.; Longnecker, M.P. Birth Weight and Perfluorooctane Sulfonic Acid: A Random-Effects Meta-Regression Analysis. Environ. Epidemiol. 2020, 4, e095. [Google Scholar] [CrossRef]
- Steenland, K.; Barry, V.; Savitz, D. Serum Perfluorooctanoic Acid and Birthweight: An Updated Meta-Analysis with Bias Analysis. Epidemiology 2018, 29, 765–776. [Google Scholar] [CrossRef]
- Messerlian, C.; Martinez, R.M.; Hauser, R.; Baccarelli, A.A. ‘Omics’ and Endocrine Disrupting Chemicals—New Paths Forward. Nat. Rev. Endocrinol. 2017, 13, 740–748. [Google Scholar] [CrossRef] [PubMed]
- Kim, S.; Hollinger, H.; Radke, E.G. ‘Omics in Environmental Epidemiological Studies of Chemical Exposures: A Systematic Evidence Map. Environ. Int. 2022, 164, 107243. [Google Scholar] [CrossRef] [PubMed]
- Peng, S.; Yan, L.; Zhang, J.; Wang, Z.; Tian, M.; Shen, H. An Integrated Metabonomics and Transcriptomics Approach to Understanding Metabolic Pathway Disturbance Induced by Perfluorooctanoic Acid. J. Pharm. Biomed. Anal. 2013, 86, 56–64. [Google Scholar] [CrossRef] [PubMed]
- Espín-Pérez, A.; Hebels, D.G.A.J.; Kiviranta, H.; Rantakokko, P.; Georgiadis, P.; Botsivali, M.; Bergdahl, I.A.; Palli, D.; Späth, F.; Johansson, A.; et al. Identification of Sex-Specific Transcriptome Responses to Polychlorinated Biphenyls (PCBs). Sci. Rep. 2019, 9, 746. [Google Scholar] [CrossRef] [PubMed]
- Remy, S.; Govarts, E.; Wens, B.; De Boever, P.; Den Hond, E.; Croes, K.; Sioen, I.; Baeyens, W.; van Larebeke, N.; Koppe, J.; et al. Metabolic Targets of Endocrine Disrupting Chemicals Assessed by Cord Blood Transcriptome Profiling. Reprod. Toxicol. 2016, 65, 307–320. [Google Scholar] [CrossRef]
- Alfano, R.; Chadeau-Hyam, M.; Ghantous, A.; Keski-Rahkonen, P.; Chatzi, L.; Perez, A.E.; Herceg, Z.; Kogevinas, M.; de Kok, T.M.; Nawrot, T.S.; et al. A Multi-Omic Analysis of Birthweight in Newborn Cord Blood Reveals New Underlying Mechanisms Related to Cholesterol Metabolism. Metabolism 2020, 110, 154292. [Google Scholar] [CrossRef]
- Cox, B.; Tsamou, M.; Vrijens, K.; Neven, K.Y.; Winckelmans, E.; De Kok, T.M.; Plusquin, M.; Nawrot, T.S. A Co-Expression Analysis of the Placental Transcriptome in Association with Maternal Pre-Pregnancy BMI and Newborn Birth Weight. Front. Genet. 2019, 10, 354. [Google Scholar] [CrossRef]
- Gillberg, L.; Perfilyev, A.; Brøns, C.; Thomasen, M.; Grunnet, L.G.; Volkov, P.; Rosqvist, F.; Iggman, D.; Dahlman, I.; Risérus, U.; et al. Adipose Tissue Transcriptomics and Epigenomics in Low Birthweight Men and Controls: Role of High-Fat Overfeeding. Diabetologia 2016, 59, 799–812. [Google Scholar] [CrossRef]
- Peng, S.; Deyssenroth, M.A.; Di Narzo, A.F.; Cheng, H.; Zhang, Z.; Lambertini, L.; Rusualepp, A.; Kovacic, J.C.; Bjorkegren, J.L.M.; Marsit, C.J.; et al. Genetic Regulation of the Placental Transcriptome Underlies Birth Weight and Risk of Childhood Obesity. PLOS Genet. 2018, 14, e1007799. [Google Scholar] [CrossRef]
- Uhlén, M.; Fagerberg, L.; Hallström, B.M.; Lindskog, C.; Oksvold, P.; Mardinoglu, A.; Sivertsson, Å.; Kampf, C.; Sjöstedt, E.; Asplund, A.; et al. Tissue-Based Map of the Human Proteome. Science 2015, 347, 1260419. [Google Scholar] [CrossRef]
- Stelzer, G.; Rosen, N.; Plaschkes, I.; Zimmerman, S.; Twik, M.; Fishilevich, S.; Stein, T.I.; Nudel, R.; Lieder, I.; Mazor, Y.; et al. The GeneCards Suite: From Gene Data Mining to Disease Genome Sequence Analyses. Curr. Protoc. Bioinform. 2016, 54, 1.30.1–1.30.33. [Google Scholar] [CrossRef] [PubMed]
- Kanehisa, M.; Goto, S. KEGG: Kyoto Encyclopedia of Genes and Genomes. Nucleic Acids Res. 2000, 28, 27–30. [Google Scholar] [CrossRef] [PubMed]
- Zhao, H.; Zhang, F.; Sun, D.; Wang, X.; Zhang, X.; Zhang, J.; Yan, F.; Huang, C.; Xie, H.; Lin, C.; et al. Branched-Chain Amino Acids Exacerbate Obesity-Related Hepatic Glucose and Lipid Metabolic Disorders via Attenuating Akt2 Signaling. Diabetes 2020, 69, 1164–1177. [Google Scholar] [CrossRef] [PubMed]
- Vanweert, F.; Schrauwen, P.; Phielix, E. Role of Branched-Chain Amino Acid Metabolism in the Pathogenesis of Obesity and Type 2 Diabetes-Related Metabolic Disturbances BCAA Metabolism in Type 2 Diabetes. Nutr. Diabetes 2022, 12, 35. [Google Scholar] [CrossRef]
- Lei, M.Z.; Li, X.X.; Zhang, Y.; Li, J.T.; Zhang, F.; Wang, Y.P.; Yin, M.; Qu, J.; Lei, Q.Y. Acetylation Promotes BCAT2 Degradation to Suppress BCAA Catabolism and Pancreatic Cancer Growth. Signal Transduct. Target. Ther. 2020, 5, 70. [Google Scholar] [CrossRef]
- Navarrete, R.; Leal, F.; Vega, A.I.; Morais-López, A.; Garcia-Silva, M.T.; Martín-Hernández, E.; Quijada-Fraile, P.; Bergua, A.; Vives, I.; García-Jiménez, I.; et al. Value of Genetic Analysis for Confirming Inborn Errors of Metabolism Detected through the Spanish Neonatal Screening Program. Eur. J. Hum. Genet. 2019, 27, 556–562. [Google Scholar] [CrossRef]
- Yonke, J.A.; Seymour, K.A.; El-Kadi, S.W. Leucine Supplementation Does Not Enhance Translation Initiation of Low Birth-Weight Neonatal Pigs Despite Greater Sestrin2 Expression in Skeletal Muscle. FASEB J. 2020, 34, 1. [Google Scholar] [CrossRef]
- Gürke, J.; Hirche, F.; Thieme, R.; Haucke, E.; Schindler, M.; Stangl, G.I.; Fischer, B.; Santos, A.N. Maternal Diabetes Leads to Adaptation in Embryonic Amino Acid Metabolism during Early Pregnancy. PLoS ONE 2015, 10, e0127465. [Google Scholar] [CrossRef]
- Vockley, J.; Ensenauer, R. Isovaleric Acidemia: New Aspects of Genetic and Phenotypic Heterogeneity. Am. J. Med. Genet. Part C Semin. Med. Genet. 2006, 142C, 95–103. [Google Scholar] [CrossRef]
- Grünert, S.C.; Wendel, U.; Lindner, M.; Leichsenring, M.; Schwab, K.O.; Vockley, J.; Lehnert, W.; Ensenauer, R. Clinical and Neurocognitive Outcome in Symptomatic Isovaleric Acidemia. Orphanet J. Rare Dis. 2012, 7, 9. [Google Scholar] [CrossRef]
- Gutiérrez-Aguilar, M.; Baines, C.P. Physiological and Pathological Roles of Mitochondrial SLC25 Carriers. Biochem. J. 2013, 454, 371–386. [Google Scholar] [CrossRef]
- Derakhshan, A.; Peeters, R.P.; Taylor, P.N.; Bliddal, S.; Carty, D.M.; Meems, M.; Vaidya, B.; Chen, L.; Knight, B.A.; Ghafoor, F.; et al. Association of Maternal Thyroid Function with Birth Weight: A Systematic Review and Individual-Participant Data Meta-Analysis. Lancet Diabetes Endocrinol. 2020, 8, 501–510. [Google Scholar] [CrossRef] [PubMed]
- Andersen, S.L.; Olsen, J.; Wu, C.S.; Laurberg, P. Low Birth Weight in Children Born to Mothers with Hyperthyroidism and High Birth Weight in Hypothyroidism, Whereas Preterm Birth Is Common in Both Conditions: A Danish National Hospital Register Study. Eur. Thyroid. J. 2013, 2, 135–144. [Google Scholar] [CrossRef] [PubMed]
- Cheng, X.; Klaassen, C.D. Perfluorocarboxylic Acids Induce Cytochrome P450 Enzymes in Mouse Liver through Activation of PPAR-α and CAR Transcription Factors. Toxicol. Sci. 2008, 106, 29–36. [Google Scholar] [CrossRef] [PubMed]
- Safe, S.H. Polychlorinated Biphenyls (PCBs): Environmental Impact, Biochemical and Toxic Responses, and Implications for Risk Assessment. Crit. Rev. Toxicol. 1994, 24, 87–149. [Google Scholar] [CrossRef]
- Lee, H.; Sung, E.J.; Seo, S.; Min, E.K.; Lee, J.Y.; Shim, I.; Kim, P.; Kim, T.Y.; Lee, S.; Kim, K.T. Integrated Multi-Omics Analysis Reveals the Underlying Molecular Mechanism for Developmental Neurotoxicity of Perfluorooctanesulfonic Acid in Zebrafish. Environ. Int. 2021, 157, 106802. [Google Scholar] [CrossRef]
- Alderete, T.L.; Jin, R.; Walker, D.I.; Valvi, D.; Chen, Z.; Jones, D.P.; Peng, C.; Gilliland, F.D.; Berhane, K.; Conti, D.V.; et al. Perfluoroalkyl Substances, Metabolomic Profiling, and Alterations in Glucose Homeostasis among Overweight and Obese Hispanic Children: A Proof-of-Concept Analysis. Environ. Int. 2019, 126, 445–453. [Google Scholar] [CrossRef]
- Conway, B.; Innes, K.E.; Long, D. Perfluoroalkyl Substances and Beta Cell Deficient Diabetes. J. Diabetes Complicat. 2016, 30, 993–998. [Google Scholar] [CrossRef]
- McGlinchey, A.; Sinioja, T.; Lamichhane, S.; Sen, P.; Bodin, J.; Siljander, H.; Dickens, A.M.; Geng, D.; Carlsson, C.; Duberg, D.; et al. Prenatal Exposure to Perfluoroalkyl Substances Modulates Neonatal Serum Phospholipids, Increasing Risk of Type 1 Diabetes. Environ. Int. 2020, 143, 105935. [Google Scholar] [CrossRef]
- Hansen, N.S.; Hjort, L.; Broholm, C.; Gillberg, L.; Schrölkamp, M.; Schultz, H.S.; Mortensen, B.; Jørgensen, S.W.; Friedrichsen, M.; Wojtaszewski, J.F.P.; et al. Metabolic and Transcriptional Changes in Cultured Muscle Stem Cells from Low Birth Weight Subjects. J. Clin. Endocrinol. Metab. 2016, 101, 2254–2264. [Google Scholar] [CrossRef]
- Brøns, C.; Jacobsen, S.; Nilsson, E.; Rönn, T.; Jensen, C.B.; Storgaard, H.; Poulsen, P.; Groop, L.; Ling, C.; Astrup, A.; et al. Deoxyribonucleic Acid Methylation and Gene Expression of PPARGC1A in Human Muscle Is Influenced by High-Fat Overfeeding in a Birth-Weight-Dependent Manner. J. Clin. Endocrinol. Metab. 2010, 95, 3048–3056. [Google Scholar] [CrossRef] [PubMed]
- Newton, K.P.; Feldman, H.S.; Chambers, C.D.; Wilson, L.; Behling, C.; Clark, J.M.; Molleston, J.P.; Chalasani, N.; Sanyal, A.J.; Fishbein, M.H.; et al. Low and High Birth Weights Are Risk Factors for Nonalcoholic Fatty Liver Disease in Children. J. Pediatr. 2017, 187, 141–146.e1. [Google Scholar] [CrossRef] [PubMed]
- Amadou, C.; Nabi, O.; Serfaty, L.; Lacombe, K.; Boursier, J.; Mathurin, P.; Ribet, C.; de Ledinghen, V.; Zins, M.; Charles, M.A. Association between Birth Weight, Preterm Birth, and Nonalcoholic Fatty Liver Disease in a Community-Based Cohort. Hepatology 2022, 76, 1438–1451. [Google Scholar] [CrossRef] [PubMed]
- Terstappen, F.; Tol, A.J.C.; Gremmels, H.; Wever, K.E.; Paauw, N.D.; Joles, J.A.; van der Beek, E.M.; Lely, A.T. Prenatal Amino Acid Supplementation to Improve Fetal Growth: A Systematic Review and Meta-Analysis. Nutrients 2020, 12, 2535. [Google Scholar] [CrossRef] [PubMed]
- Ren, X.; Vilhjálmsdóttir, B.L.; Rohde, J.F.; Walker, K.C.; Runstedt, S.E.; Lauritzen, L.; Heitmann, B.L.; Specht, I.O. Systematic Literature Review and Meta-Analysis of the Relationship Between Polyunsaturated and Trans Fatty Acids During Pregnancy and Offspring Weight Development. Front. Nutr. 2021, 8, 625596. [Google Scholar] [CrossRef]
- Lee, E.; Kim, H.; Kim, H.; Ha, E.H.; Chang, N. Association of Maternal Omega-6 Fatty Acid Intake with Infant Birth Outcomes: Korean Mothers and Children’s Environmental Health (MOCEH). Nutr. J. 2018, 17, 47. [Google Scholar] [CrossRef]
- Meher, A.; Randhir, K.; Mehendale, S.; Wagh, G.; Joshi, S. Maternal Fatty Acids and Their Association with Birth Outcome: A Prospective Study. PLoS ONE 2016, 11, e0147359. [Google Scholar] [CrossRef]
- Van Eijsden, M.; Hornstra, G.; Van Der Wal, M.F.; Vrijkotte, T.G.M.; Bonsel, G.J. Maternal N-3, n-6, and Trans Fatty Acid Profile Early in Pregnancy and Term Birth Weight: A Prospective Cohort Study. Am. J. Clin. Nutr. 2008, 87, 887–895. [Google Scholar] [CrossRef]
- Van Larebeke, N.; Fucic, A. Chapter 5: Sex-Specific Actions of Endocrine Disruptors. In Challenges in Endocrine Disruptor Toxicology and Risk Assessment; Royal Society of Chemistry: London, UK, 2020; pp. 121–154. [Google Scholar] [CrossRef]
- Wolff, M.S.; Engel, S.; Berkowitz, G.; Teitelbaum, S.; Siskind, J.; Barr, D.B.; Wetmur, J. Prenatal Pesticide and PCB Exposures and Birth Outcomes. Pediatr. Res. 2007, 61, 243–250. [Google Scholar] [CrossRef]
- Wikström, S.; Lin, P.I.; Lindh, C.H.; Shu, H.; Bornehag, C.G. Maternal Serum Levels of Perfluoroalkyl Substances in Early Pregnancy and Offspring Birth Weight. Pediatr. Res. 2020, 87, 1093–1099. [Google Scholar] [CrossRef]
- Schoeters, G.; Den Hond, E.; Colles, A.; Loots, I.; Morrens, B.; Keune, H.; Bruckers, L.; Nawrot, T.; Sioen, I.; De Coster, S.; et al. Concept of the Flemish Human Biomonitoring Programme. Int. J. Hyg. Environ. Health 2012, 215, 102–108. [Google Scholar] [CrossRef] [PubMed]
- Wilcox, A.J.; Weinberg, C.R.; Basso, O. On the Pitfalls of Adjusting for Gestational Age at Birth. Am. J. Epidemiol. 2011, 174, 1062–1068. [Google Scholar] [CrossRef] [PubMed]
- Lubin, J.H.; Colt, J.S.; Camann, D.; Davis, S.; Cerhan, J.R.; Severson, R.K.; Bernstein, L.; Hartge, P. Epidemiologic Evaluation of Measurement Data in the Presence of Detection Limits. Environ. Health Perspect. 2004, 112, 1691–1696. [Google Scholar] [CrossRef] [PubMed]
- Midasch, O.; Drexler, H.; Hart, N.; Beckmann, M.W.; Angerer, J. Transplacental Exposure of Neonates to Perfluorooctanesulfonate and Perfluorooctanoate: A Pilot Study. Int. Arch. Occup. Environ. Health 2007, 80, 643–648. [Google Scholar] [CrossRef]
- Covaci, A.; Voorspoels, S. Optimization of the Determination of Polybrominated Diphenyl Ethers in Human Serum Using Solid-Phase Extraction and Gas Chromatography-Electron Capture Negative Ionization Mass Spectrometry. J. Chromatogr. B Anal. Technol. Biomed. Life Sci. 2005, 827, 216–223. [Google Scholar] [CrossRef]
- Ottenbros, I.; Govarts, E.; Lebret, E.; Vermeulen, R.; Schoeters, G.; Vlaanderen, J. Network Analysis to Identify Communities Among Multiple Exposure Biomarkers Measured at Birth in Three Flemish General Population Samples. Front. Public Health 2021, 9, 590038. [Google Scholar] [CrossRef]
- Remy, S.; Govarts, E.; Bruckers, L.; Paulussen, M.; Wens, B.; Den Hond, E.; Nelen, V.; Baeyens, W.; Van Larebeke, N.; Loots, I.; et al. Expression of the SFLT1 Gene in Cord Blood Cells Is Associated to Maternal Arsenic Exposure and Decreased Birth Weight. PLoS ONE 2014, 9, e92677. [Google Scholar] [CrossRef]
- Espín-Pérez, A.; Portier, C.; Chadeau-Hyam, M.; van Veldhoven, K.; Kleinjans, J.C.S.; de Kok, T.M.C.M. Comparison of Statistical Methods and the Use of Quality Control Samples for Batch Effect Correction in Human Transcriptome Data. PLoS ONE 2018, 13, e0202947. [Google Scholar] [CrossRef]
- Johnson, W.E.; Li, C.; Rabinovic, A. Adjusting Batch Effects in Microarray Expression Data Using Empirical Bayes Methods. Biostatistics 2007, 8, 118–127. [Google Scholar] [CrossRef]
- Liberzon, A.; Subramanian, A.; Pinchback, R.; Thorvaldsdóttir, H.; Tamayo, P.; Mesirov, J.P. Molecular Signatures Database (MSigDB) 3.0. Bioinformatics 2011, 27, 1739–1740. [Google Scholar] [CrossRef]
- van Buuren, S.; Groothuis-Oudshoorn, K. Mice: Multivariate Imputation by Chained Equations in R. J. Stat. Softw. 2011, 45, 1–67. [Google Scholar] [CrossRef]
- Benjamini, Y.; Hochberg, Y. Controlling the False Discovery Rate: A Practical and Powerful Approach to Multiple Testing. J. R. Stat. Soc. Ser. B 1995, 57, 289–300. [Google Scholar] [CrossRef]
- Liao, Y.; Wang, J.; Jaehnig, E.J.; Shi, Z.; Zhang, B. WebGestalt 2019: Gene Set Analysis Toolkit with Revamped UIs and APIs. Nucleic Acids Res. 2019, 47, W199–W205. [Google Scholar] [CrossRef] [PubMed]
- Subramanian, A.; Tamayo, P.; Mootha, V.K.; Mukherjee, S.; Ebert, B.L.; Gillette, M.A.; Paulovich, A.; Pomeroy, S.L.; Golub, T.R.; Lander, E.S.; et al. Gene Set Enrichment Analysis: A Knowledge-Based Approach for Interpreting Genome-Wide Expression Profiles. Proc. Natl. Acad. Sci. USA 2005, 102, 15545–15550. [Google Scholar] [CrossRef] [PubMed]
- Drizik, E.; Corbett, S.; Zheng, Y.; Vermeulen, R.; Dai, Y.; Hu, W.; Ren, D.; Duan, H.; Niu, Y.; Xu, J.; et al. Transcriptomic Changes in The Nasal Epithelium Associated with Diesel Engine Exhaust Exposure. Environ. Int. 2020, 137, 105506. [Google Scholar] [CrossRef] [PubMed]
- Winckelmans, E.; Vrijens, K.; Tsamou, M.; Janssen, B.G.; Saenen, N.D.; Roels, H.A.; Kleinjans, J.; Lefebvre, W.; Vanpoucke, C.; De Kok, T.M.; et al. Newborn Sex-Specific Transcriptome Signatures and Gestational Exposure to Fine Particles: Findings from the ENVIRONAGE Birth Cohort. Environ. Health 2017, 16, 52. [Google Scholar] [CrossRef]
- Reimand, J.; Isserlin, R.; Voisin, V.; Kucera, M.; Tannus-Lopes, C.; Rostamianfar, A.; Wadi, L.; Meyer, M.; Wong, J.; Xu, C.; et al. Pathway Enrichment Analysis and Visualization of Omics Data Using g:Profiler, GSEA, Cytoscape and EnrichmentMap. Nat. Protoc. 2019, 14, 482–517. [Google Scholar] [CrossRef]
- Chadeau-Hyam, M.; Athersuch, T.J.; Keun, H.C.; De Iorio, M.; Ebbels, T.M.D.; Jenab, M.; Sacerdote, C.; Bruce, S.J.; Holmes, E.; Vineis, P. Meeting-in-the-Middle Using Metabolic Profiling—A Strategy for the Identification of Intermediate Biomarkers in Cohort Studies. Biomarkers 2011, 16, 83–88. [Google Scholar] [CrossRef]
- Tingley, D.; Yamamoto, H.T.; Hirose, K.; Keele, L.; Princeton, K.I. Mediation: R Package for Causal Mediation Analysis. J. Stat. Softw. 2014, 59, v059. [Google Scholar] [CrossRef]
- Carmeli, C.; Kutalik, Z.; Mishra, P.P.; Porcu, E.; Delpierre, C.; Delaneau, O.; Kelly-Irving, M.; Bochud, M.; Dhayat, N.A.; Ponte, B.; et al. Gene Regulation Contributes to Explain the Impact of Early Life Socioeconomic Disadvantage on Adult Inflammatory Levels in Two Cohort Studies. Sci. Rep. 2021, 11, 3100. [Google Scholar] [CrossRef]
- Dagnino, S.; Bodinier, B.; Guida, F.; Smith-Byrne, K.; Petrovic, D.; Whitaker, M.D.; Nøst, T.H.; Agnoli, C.; Palli, D.; Sacerdote, C.; et al. Prospective Identification of Elevated Circulating CDCP1 in Patients Years before Onset of Lung Cancer. Cancer Res. 2021, 81, 3738–3748. [Google Scholar] [CrossRef] [PubMed]
- Stünkel, W.; Pan, H.; Chew, S.B.; Tng, E.; Tan, J.H.; Chen, L.; Joseph, R.; Cheong, C.Y.; Ong, M.L.; Lee, Y.S.; et al. Transcriptome Changes Affecting Hedgehog and Cytokine Signalling in the Umbilical Cord: Implications for Disease Risk. PLoS ONE 2012, 7, e39744. [Google Scholar] [CrossRef] [PubMed]
- Kleinbrink, E.L.; Gomez-Lopez, N.; Ju, D.; Done, B.; Goustin, A.S.; Tarca, A.L.; Romero, R.; Lipovich, L. Gestational Age Dependence of the Maternal Circulating Long Non-Coding RNA Transcriptome During Normal Pregnancy Highlights Antisense and Pseudogene Transcripts. Front. Genet. 2021, 12, 760849. [Google Scholar] [CrossRef] [PubMed]
- Street, M.E.; Bernasconi, S. Endocrine-Disrupting Chemicals in Human Fetal Growth. Int. J. Mol. Sci. 2020, 21, 1430. [Google Scholar] [CrossRef] [PubMed]
- R Core Team. R: The R Project for Statistical Computing. Available online: https://www.r-project.org/index.html (accessed on 19 August 2021).


| Characteristics | |
|---|---|
| [n (%) or Median (P25–P75)] | |
| Mother | |
| Education | |
| Low | 19 (10) |
| Median | 58 (30) |
| High | 114 (59) |
| Missing | 2 (1) |
| Parity | |
| 0 | 74 (38) |
| 1 | 64 (33) |
| ≥2 | 54 (28) |
| Missing | 1 (1) |
| Smoking during pregnancy | |
| Non-smoking | 164 (85) |
| Smoking | 24 (12) |
| Missing | 5 (3) |
| Age at delivery (years) | |
| <27 | 35 (18) |
| 27 < 30 | 49 (25) |
| 30 < 33 | 57 (30) |
| ≥33 | 52 (27) |
| Pre-pregnancy BMI (kg/m2) | |
| <18.5 | 12 (6) |
| 18.5 < 25 | 137 (71) |
| 25 < 30 | 28 (15) |
| 30 | 14 (7) |
| Missing | 2 (1) |
| Child | |
| Sex, n (%) | |
| Boy | 96 (50) |
| Girl | 97 (50) |
| Gestational age (weeks) | 40.0 (39.0–40.0) |
| Missing | 3 (2) |
| Birth weight (g) | 3540 (3200–3775) |
| <2500 | 3 (2) |
| ≥2500 | 190 (98) |
| FDR < 0.05 | FDR < 0.20 | p-Value < 0.01 | p-Value < 0.05 | |
|---|---|---|---|---|
| p,p’-DDE | 0 | 0 | 138 | 777 |
| PCB-153 | 0 | 0 | 75 | 623 |
| PFOA | 0 | 0 | 23 | 333 |
| PFOS | 0 | 0 | 79 | 624 |
| Birth weight | 0 | 0 | 162 | 775 |
| p,p’-DDE | ||||
|---|---|---|---|---|
| ProbeID | GeneSymbol | GeneTitle | ACME (95% CI, g) | FDR |
| A_32_P223173 | MYO5BP2 | myosin VB pseudogene 2 | 15.56 (1.89, 34.40) | 0.08 |
| A_23_P154522 | MTA3 | metastasis associated 1 family member 3 | 12.81 (−5.75, 41.79) | 0.22 |
| A_24_P303524 | MICALL2 | MICAL like 2 | 11.37 (−0.16, 28.40) | 0.08 |
| A_23_P46369 | RAB13 | RAB13, member RAS oncogene family | 11.17 (−0.10, 28.29) | 0.08 |
| A_23_P435002 | SRFBP1 | serum response factor binding protein 1 | 10.95 (−0.66, 28.67) | 0.08 |
| A_23_P90163 | BCAT2 | branched chain amino acid transaminase 2 | −9.89 (−28.87, 1.29) | 0.14 |
| A_23_P356694 | DEFB123 | defensin beta 123 | −13.10 (−34.55, 0.80) | 0.10 |
| A_32_P226186 | KIAA1549 | KIAA1549 | −13.30 (−34.77, −0.28) | 0.08 |
| A_32_P126375 | NHS | NHS actin remodeling regulator | −13.52 (−33.89, 0.20) | 0.08 |
| A_23_P101240 | VSIG10L | V-set and immunoglobulin domain containing 10 like | −13.91 (−34.95, −0.17) | 0.08 |
| A_23_P70566 | FKBPL | FKBP prolyl isomerase like | −15.87 (−36.64, −2.04) | 0.08 |
| A_24_P33014 | DACT3 | disheveled binding antagonist of beta catenin 3 | −18.48 (−49.89, 0.22) | 0.08 |
| PCB-153 | ||||
| ProbeID | GeneSymbol | GeneTitle | ACME (95% CI, g) | FDR |
| A_23_P213458 | BTF3 | basic transcription factor 3 | 19.21 (1.21, 45.76) | 0.18 |
| A_23_P129322 | IVD | isovaleryl-CoA dehydrogenase | 15.87 (−3.19, 47.22) | 0.18 |
| A_24_P816777 | UBL7-DT | UBL7 divergent transcript | 14.79 (−1.48, 39.40) | 0.18 |
| A_24_P941051 | CSTF2T | cleavage stimulation factor subunit 2 tau variant | 14.20 (−1.75, 39.92) | 0.18 |
| A_24_P383080 | SRRT | serrate, RNA effector molecule | 14.07 (−1.18, 37.84) | 0.18 |
| A_23_P1043 | INAVA | innate immunity activator | 14.06 (−2.30, 41.12) | 0.18 |
| A_24_P2093 | XAB2 | XPA binding protein 2 | 13.86 (−4.94, 41.67) | 0.21 |
| A_23_P170352 | MRPL12 | mitochondrial ribosomal protein L12 | 13.57 (−2.58, 36.47) | 0.18 |
| A_23_P101972 | CAPN13 | calpain 13 | 12.90 (−0.90, 33.91) | 0.18 |
| A_23_P208167 | FPR3 | formyl peptide receptor 3 | −14.25 (−40.03, 2.80) | 0.18 |
| A_23_P66311 | DNASE1 | deoxyribonuclease 1 | −14.86 (−68.16, 20.26) | 0.47 |
| A_32_P174365 | SATB2 | SATB homeobox 2 | −15.07 (−46.51, 3.80) | 0.20 |
| A_24_P42001 | IGSF3P2 | pseudogene similar to part of immunoglobulin superfamily 3 | −15.29 (−45.26, 2.47) | 0.18 |
| A_23_P45864 | TNR | tenascin R | −15.51 (−52.01, 7.40) | 0.27 |
| A_23_P156697 | ABHD16A | abhydrolase domain containing 16A, phospholipase | −15.71 (−55.54, 10.26) | 0.30 |
| A_32_P109777 | PHBP9 | prohibitin pseudogene 9 | −15.74 (−70.68, 20.32) | 0.43 |
| A_23_P218584 | BCL11A | BAF chromatin remodeling complex subunit BCL11A | −16.11 (−47.21, 2.36) | 0.18 |
| A_24_P934800 | ERI2 | ERI1 exoribonuclease family member 2 | −17.04 (−65.34, 13.98) | 0.35 |
| A_24_P609323 | ZNF213-AS1 | ZNF213 antisense RNA 1 (head to head) | −17.27 (−61.75, 9.59) | 0.30 |
| A_23_P125147 | RAB28 | RAB28, member RAS oncogene family | −17.49 (−44.99, 1.40) | 0.18 |
| A_23_P68922 | MICALL1 | MICAL like 1 | −18.85 (−58.74, 4.03) | 0.21 |
| A_23_P210400 | KCNQ2 | potassium voltage-gated channel subfamily Q 2 | −20.10 (−49.17, −0.69) | 0.18 |
| A_24_P186497 | GTF2IRD2 | GTF2I repeat domain containing 2 | −20.28 (−65.43, 7.02) | 0.22 |
| A_23_P323196 | MDS2 | myelodysplastic syndrome 2 translocation associated | −20.80 (−59.81, 4.88) | 0.18 |
| A_23_P343808 | SOS1 | SOS Ras/Rac guanine nucleotide exchange factor 1 | −21.46 (−60.91, 1.96) | 0.18 |
| A_32_P74075 | SLC25A16 | solute carrier family 25 member 16 | −23.23 (−59.66, 0.62) | 0.18 |
| A_23_P16275 | TSKS | testis specific serine kinase substrate | −23.31 (−61.08, 1.28) | 0.18 |
| A_23_P88466 | NPAP1 | nuclear pore associated protein 1 | −24.11 (−65.66, 1.64) | 0.18 |
| A_24_P33014 | DACT3 | disheveled binding antagonist of beta catenin 3 | −25.38 (−75.74, 2.97) | 0.18 |
| A_32_P149640 | EPHA5 | EPH receptor A5 | −25.63 (−59.68, −1.67) | 0.18 |
| A_23_P49539 | BAHCC1 | BAH domain and coiled-coil containing 1 | −27.18 (−73.81, 2.40) | 0.18 |
| PFOA | ||||
| ProbeID | GeneSymbol | GeneTitle | ACME (95% CI, g) | FDR |
| A_23_P426511 | ZGRF1 | zinc finger GRF-type containing 1 | 27.81 (−11.07, 80.77) | 0.17 |
| A_24_P173754 | C1orf21 | chromosome 1 open reading frame 21 | 25.95 (−2.29, 65.53) | 0.12 |
| A_23_P149668 | KIF14 | kinesin family member 14 | 25.64 (1.21, 59.18) | 0.11 |
| A_23_P35977 | PDZD3 | PDZ domain containing 3 | 25.23 (0.14, 65.29) | 0.11 |
| A_23_P19723 | BMP5 | bone morphogenetic protein 5 | 24.29 (−6.57, 70.05) | 0.14 |
| A_24_P383080 | SRRT | serrate, RNA effector molecule | 22.77 (1.52, 51.40) | 0.11 |
| A_23_P133956 | KIFC1 | kinesin family member C1 | 22.25 (1.91, 52.27) | 0.11 |
| A_23_P128956 | ZFYVE1 | zinc finger FYVE-type containing 1 | 21.97 (0.10, 53.12) | 0.11 |
| A_23_P258377 | ERC1 | ELKS/RAB6-interacting/CAST family member 1 | 20.90 (−1.37, 53.51) | 0.11 |
| A_32_P148199 | VPS54 | VPS54 subunit of GARP complex | 19.84 (−1.28, 52.35) | 0.11 |
| A_23_P329962 | SUN3 | Sad1 and UNC84 domain containing 3 | 19.80 (−12.34, 67.49) | 0.21 |
| A_23_P357229 | HAS3 | hyaluronan synthase 3 | 19.47 (0.69, 48.19) | 0.11 |
| A_23_P332413 | SLFN13 | schlafen family member 13 | 18.66 (−3.99, 50.40) | 0.13 |
| A_23_P94840 | DYNLRB2 | dynein light chain roadblock-type 2 | −19.33 (−53.39, 0.29) | 0.11 |
| A_23_P147255 | PCBP3 | poly(rC) binding protein 3 | −22.98 (−56.91, 0.65) | 0.11 |
| A_32_P208076 | ITGA2 | integrin subunit alpha 2 | −25.58 (−61.58, −2.19) | 0.11 |
| A_23_P89030 | C16orf95 | chromosome 16 open reading frame 95 | −28.31 (−65.10, −3.43) | 0.11 |
| PFOS | ||||
| ProbeID | GeneSymbol | GeneTitle | ACME (95% CI, g) | FDR |
| A_23_P4007 | FXR2 | FMR1 autosomal homolog 2 | 22.03 (2.59, 48.02) | 0.17 |
| A_24_P919279 | ZNF790 | zinc finger protein 790 | 21.33 (−0.11, 57.21) | 0.17 |
| A_23_P143514 | SSR4P1 | signal sequence receptor subunit 4 pseudogene 1 | 21.11 (−9.85, 65.02) | 0.23 |
| A_23_P214727 | GPR63 | G protein-coupled receptor 63 | 19.46 (−1.99, 55.15) | 0.17 |
| A_24_P325046 | ZCCHC7 | zinc finger CCHC-type containing 7 | 19.25 (−9.60, 62.98) | 0.23 |
| A_23_P158349 | RABL3 | RAB, member of RAS oncogene family like 3 | 19.08 (−0.78, 47.62) | 0.17 |
| A_32_P148199 | VPS54 | VPS54 subunit of GARP complex | 18.42 (1.01, 40.65) | 0.17 |
| A_23_P426511 | ZGRF1 | zinc finger GRF-type containing 1 | 18.30 (−14.27, 71.54) | 0.30 |
| A_24_P922808 | DESI2 | desumoylating isopeptidase 2 | 18.16 (−5.59, 56.98) | 0.18 |
| A_23_P78302 | NFE2L1 | nuclear factor, erythroid 2 like 1 | 17.83 (−11.92, 63.48) | 0.29 |
| A_24_P98086 | GNA12 | G protein subunit alpha 12 | 17.07 (3.13, 39.02) | 0.17 |
| A_23_P54088 | OR4K17 | olfactory receptor family 4 subfamily K member 17 | 16.96 (−2.58, 49.08) | 0.17 |
| A_23_P325661 | ZNF134 | zinc finger protein 134 | 16.46 (−2.12, 41.68) | 0.17 |
| A_23_P381945 | KRT7 | keratin 7 | 15.68 (−0.88, 39.02) | 0.17 |
| A_23_P427136 | TSSK1B | testis specific serine kinase 1B | 15.64 (−4.65, 50.75) | 0.22 |
| A_23_P154522 | MTA3 | metastasis associated 1 family member 3 | 15.31 (−8.64, 57.31) | 0.29 |
| A_24_P344295 | RNF167 | ring finger protein 167 | 15.04 (−2.19, 39.49) | 0.17 |
| A_23_P9209 | NIPSNAP3B | nipsnap homolog 3B | 14.56 (−12.47, 55.74) | 0.29 |
| A_23_P135787 | GOLGB1 | golgin B1 | 14.37 (−8.34, 51.15) | 0.27 |
| A_24_P416301 | FOXK2 | forkhead box K2 | 13.92 (−23.25, 71.77) | 0.47 |
| A_24_P145629 | SERINC2 | serine incorporator 2 | 13.90 (−7.15, 46.81) | 0.23 |
| A_23_P306755 | CRYAA | crystallin alpha A | 13.80 (−1.50, 39.97) | 0.17 |
| A_24_P169688 | MICB | MHC class I polypeptide-related sequence B | 13.50 (1.03, 29.72) | 0.17 |
| A_23_P39454 | ZNF556 | zinc finger protein 556 | 13.44 (−3.22, 42.61) | 0.21 |
| A_32_P134968 | SPTB | spectrin beta, erythrocytic | 13.43 (−0.03, 36.34) | 0.17 |
| A_32_P165116 | DNAAF10 | dynein axonemal assembly factor 10 | 13.04 (−1.58, 34.74) | 0.17 |
| A_24_P323425 | DZANK1 | double zinc ribbon and ankyrin repeat domains 1 | 12.97 (−10.07, 49.64) | 0.29 |
| A_24_P173754 | C1orf21 | chromosome 1 open reading frame 21 | 12.58 (−2.55, 34.36) | 0.17 |
| A_23_P332413 | SLFN13 | schlafen family member 13 | 12.36 (−2.49, 32.56) | 0.17 |
| A_23_P170352 | MRPL12 | mitochondrial ribosomal protein L12 | 12.05 (−0.41, 31.74) | 0.17 |
| A_24_P77941 | VPS50 | VPS50 subunit of EARP/GARPII complex | −11.16 (−32.04, 1.69) | 0.17 |
| A_24_P384119 | IGHV3OR16-13 | immunoglobulin heavy variable 3/OR16-13 (non-functional) | −11.35 (−31.93, 0.65) | 0.17 |
| A_23_P500010 | KLK12 | kallikrein related peptidase 12 | −12.04 (−34.86, 1.61) | 0.17 |
| A_23_P210400 | KCNQ2 | potassium voltage-gated channel subfamily Q member 2 | −12.25 (−34.90, 1.95) | 0.17 |
| A_24_P114255 | MBOAT2 | membrane bound O-acyltransferase domain containing 2 | −12.54 (−34.35, 0.66) | 0.17 |
| A_24_P77219 | ARID1A | AT-rich interaction domain 1A | −12.58 (−36.30, 1.68) | 0.17 |
| A_24_P161604 | RPL21P120 | ribosomal protein L21 pseudogene 120 | −13.40 (−36.42, −0.43) | 0.17 |
| A_24_P919084 | SLC22A16 | solute carrier family 22 member 16 | −14.34 (−36.44, −1.04) | 0.17 |
| A_23_P94840 | DYNLRB2 | dynein light chain roadblock-type 2 | −17.57 (−41.44, −1.73) | 0.17 |
| A_24_P299663 | ZBTB18 | zinc finger and BTB domain containing 18 | −21.07 (−44.19, −4.27) | 0.17 |
| p,p’-DDE | |||||
|---|---|---|---|---|---|
| Pathway | Category | Gene Size | Variance by PC1 (%) | ACME (95% CI, g) | FDR |
| Olfactory transduction | OS (Sensory system) | 143 | 40 | −2.21 (−12.41, 3.39) | 0.64 |
| Taste transduction | OS (Sensory system) | 59 | 39 | −1.49 (−10.67, 3.65) | 0.64 |
| Ribosome | GIP (Translation) | 126 | 49 | −5.16 (−18.73, 4.64) | 0.64 |
| RNA transport | GIP (Translation) | 149 | 38 | −1.75 (−11.13, 3.53) | 0.64 |
| PCB-153 | |||||
| Pathway | Category | Gene Size | Variance by PC1 (%) | ACME (95% CI, g) | FDR |
| Ribosome | GIP (Translation) | 126 | 49 | −1.10 (−12.15, 8.90) | 0.85 |
| Fanconi anemia pathway | GIP (Replication and repair) | 46 | 45 | 2.80 (−9.06, 17.83) | 0.85 |
| Mismatch repair | GIP (Replication and repair) | 22 | 56 | 3.42 (−8.67, 18.67) | 0.85 |
| PFOA | |||||
| Pathway | Category | Gene Size | Variance by PC1 (%) | ACME (95% CI, g) | FDR |
| Olfactory transduction | OS (Sensory system) | 143 | 40 | 3.11 (−9.18, 19.74) | 0.78 |
| NLRI | EIP (Signaling molecules and interaction) | 219 | 34 | 2.99 (−8.60, 18.53) | 0.78 |
| Spliceosome | GIP (Transcription) | 124 | 53 | 2.89 (−9.81, 19.16) | 0.78 |
| Proteasome | GIP (Folding, sorting and degradation) | 43 | 57 | 2.57 (−10.08, 18.81) | 0.78 |
| Autophagy | CP (Transport and catabolism) | 31 | 37 | 1.76 (−9.39, 17.44) | 0.78 |
| PPIER | GIP (Folding, sorting and degradation) | 156 | 41 | 2.92 (−8.66, 19.27) | 0.78 |
| PFOS | |||||
| Pathway | Category | Gene Size | Variance by PC1 (%) | ACME (95% CI, g) | FDR |
| Spliceosome | GIP (Transcription) | 124 | 53 | 2.44 (−5.78, 13.78) | 0.71 |
| Fanconi anemia pathway | GIP (Replication and repair) | 46 | 45 | 1.97 (−7.21, 13.64) | 0.71 |
| Mismatch repair | GIP (Replication and repair) | 22 | 56 | 2.63 (−6.69, 14.38) | 0.71 |
Disclaimer/Publisher’s Note: The statements, opinions and data contained in all publications are solely those of the individual author(s) and contributor(s) and not of MDPI and/or the editor(s). MDPI and/or the editor(s) disclaim responsibility for any injury to people or property resulting from any ideas, methods, instructions or products referred to in the content. |
© 2023 by the authors. Licensee MDPI, Basel, Switzerland. This article is an open access article distributed under the terms and conditions of the Creative Commons Attribution (CC BY) license (https://creativecommons.org/licenses/by/4.0/).
Share and Cite
Cai, A.; Portengen, L.; Ertaylan, G.; Legler, J.; Vermeulen, R.; Lenters, V.; Remy, S. Prenatal Exposure to Metabolism-Disrupting Chemicals, Cord Blood Transcriptome Perturbations, and Birth Weight in a Belgian Birth Cohort. Int. J. Mol. Sci. 2023, 24, 7607. https://doi.org/10.3390/ijms24087607
Cai A, Portengen L, Ertaylan G, Legler J, Vermeulen R, Lenters V, Remy S. Prenatal Exposure to Metabolism-Disrupting Chemicals, Cord Blood Transcriptome Perturbations, and Birth Weight in a Belgian Birth Cohort. International Journal of Molecular Sciences. 2023; 24(8):7607. https://doi.org/10.3390/ijms24087607
Chicago/Turabian StyleCai, Anran, Lützen Portengen, Gökhan Ertaylan, Juliette Legler, Roel Vermeulen, Virissa Lenters, and Sylvie Remy. 2023. "Prenatal Exposure to Metabolism-Disrupting Chemicals, Cord Blood Transcriptome Perturbations, and Birth Weight in a Belgian Birth Cohort" International Journal of Molecular Sciences 24, no. 8: 7607. https://doi.org/10.3390/ijms24087607