
Leukocyte Telomere Length Predicts Severe Disability in Relapsing-Remitting Multiple Sclerosis and Correlates with Mitochondrial DNA Copy Number
 , , and
Abstract
:1. Introduction
2. Results
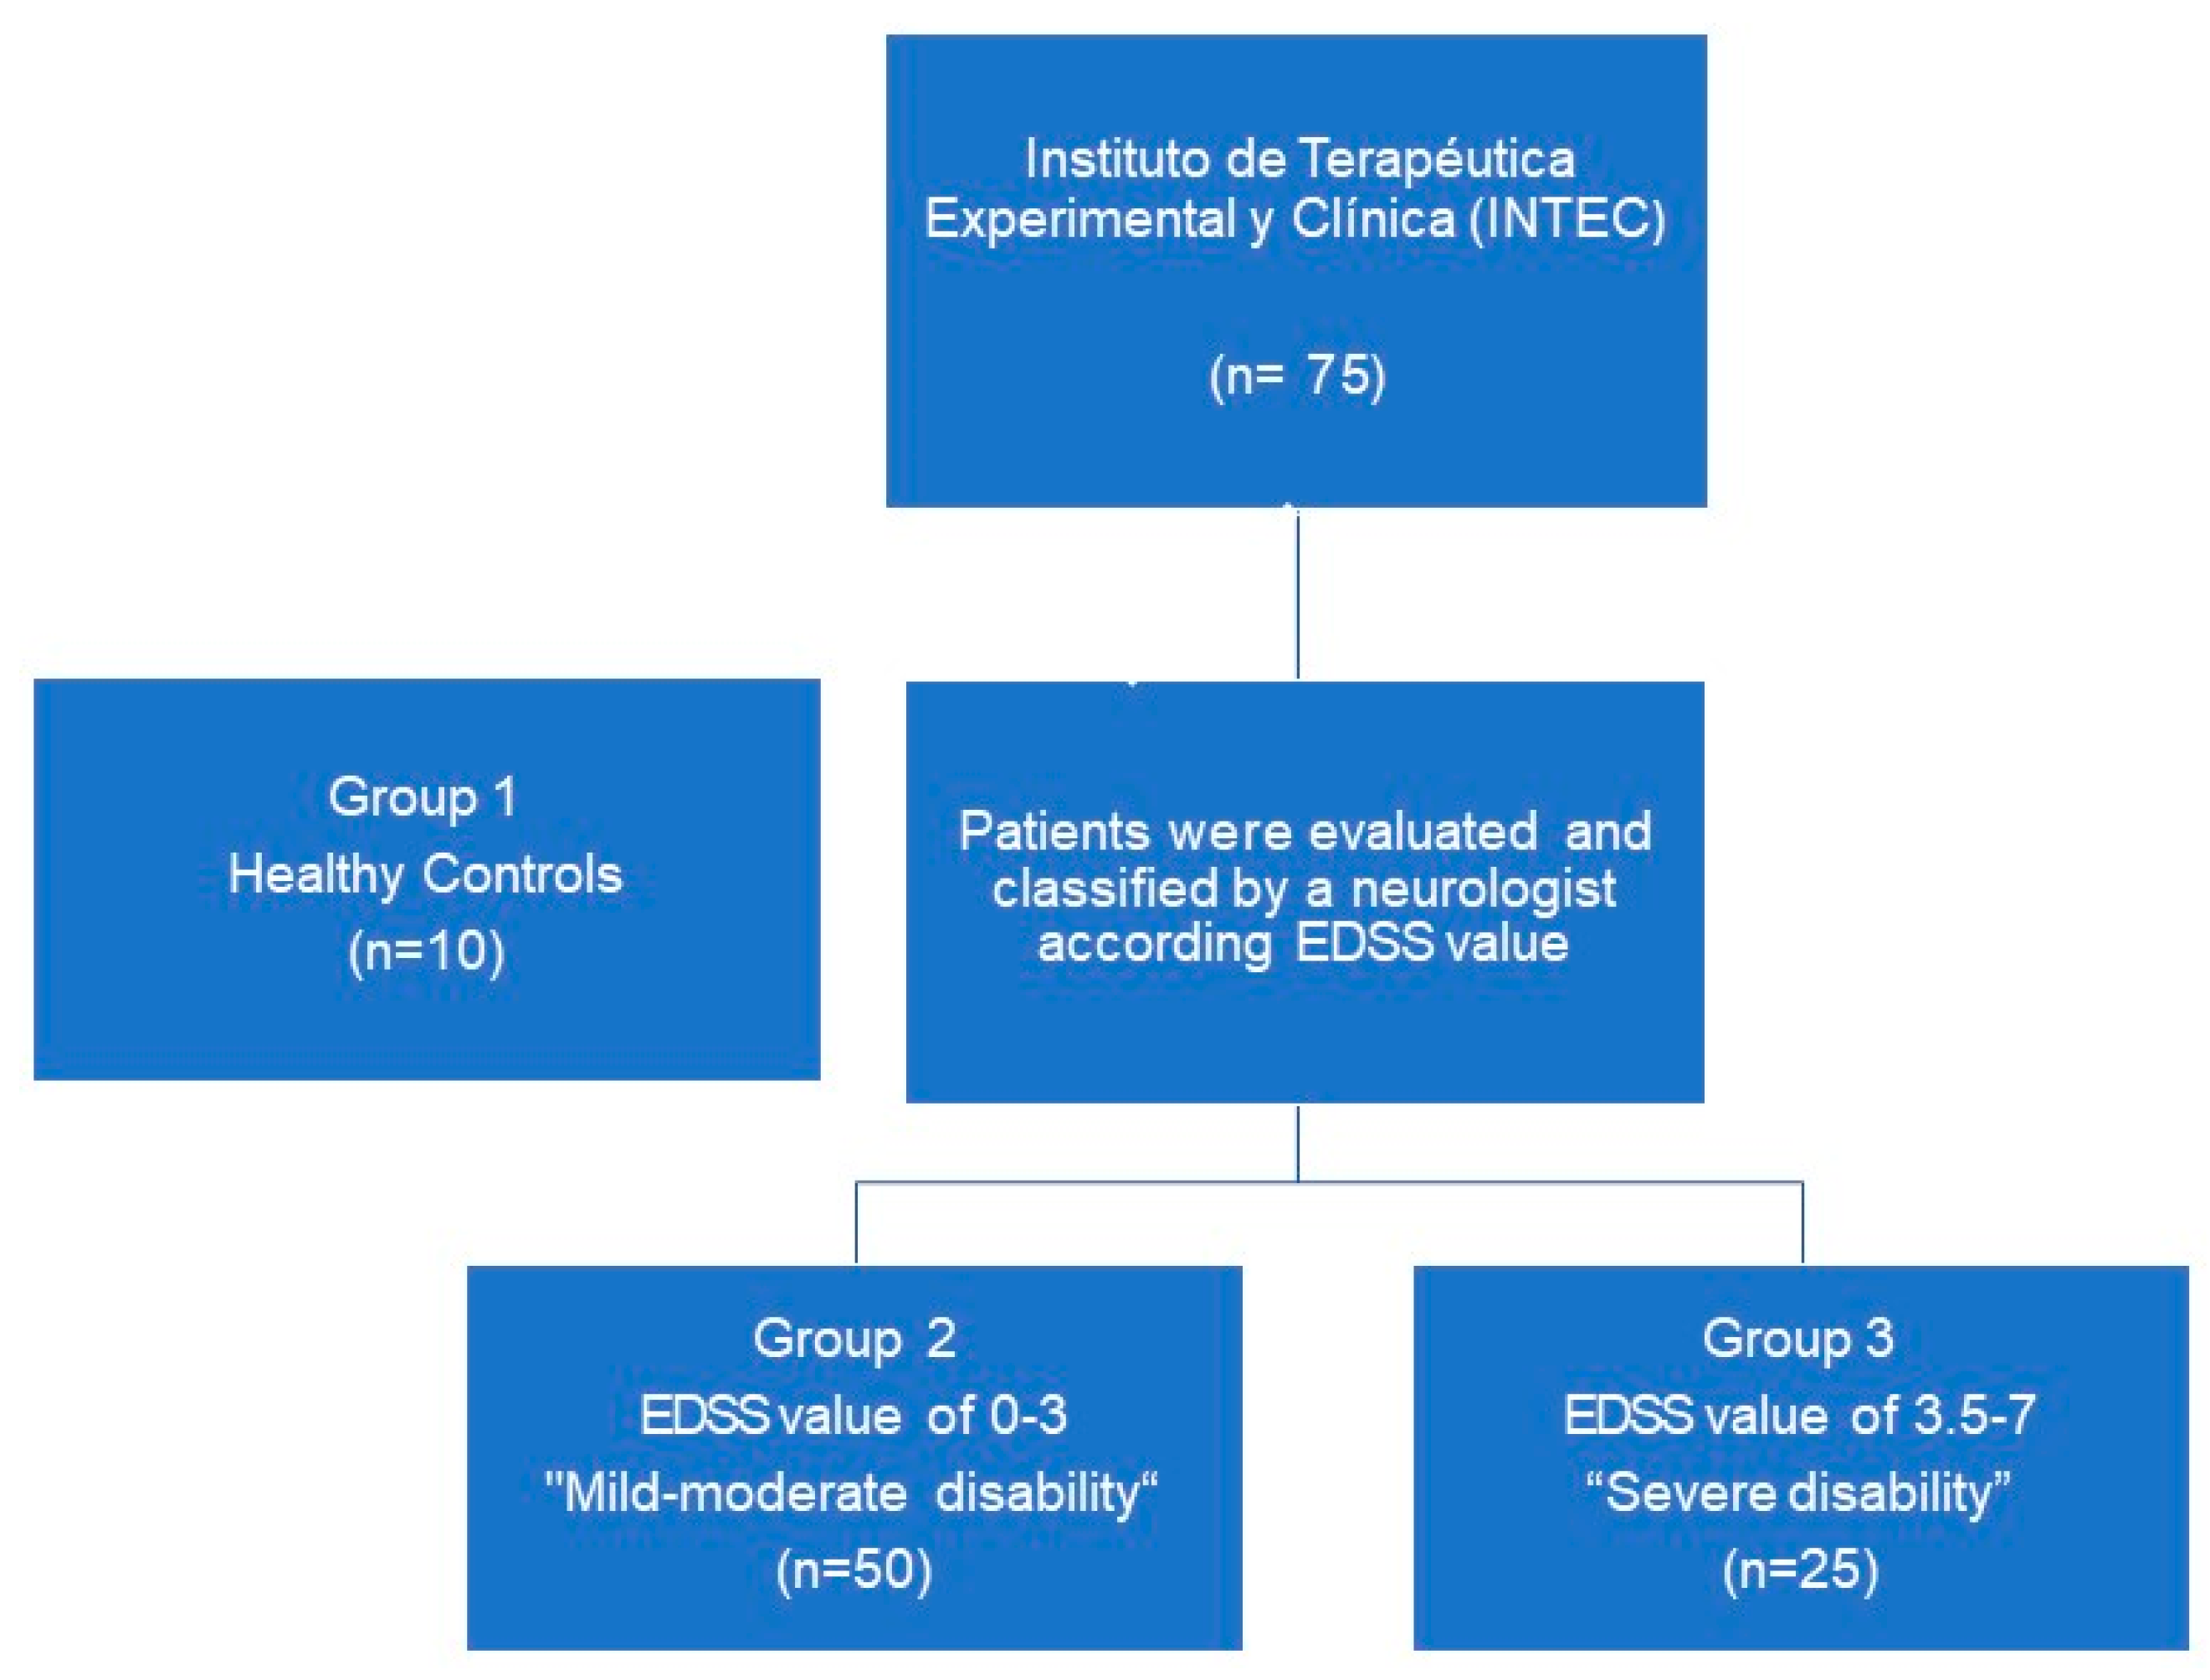
2.1. Patients
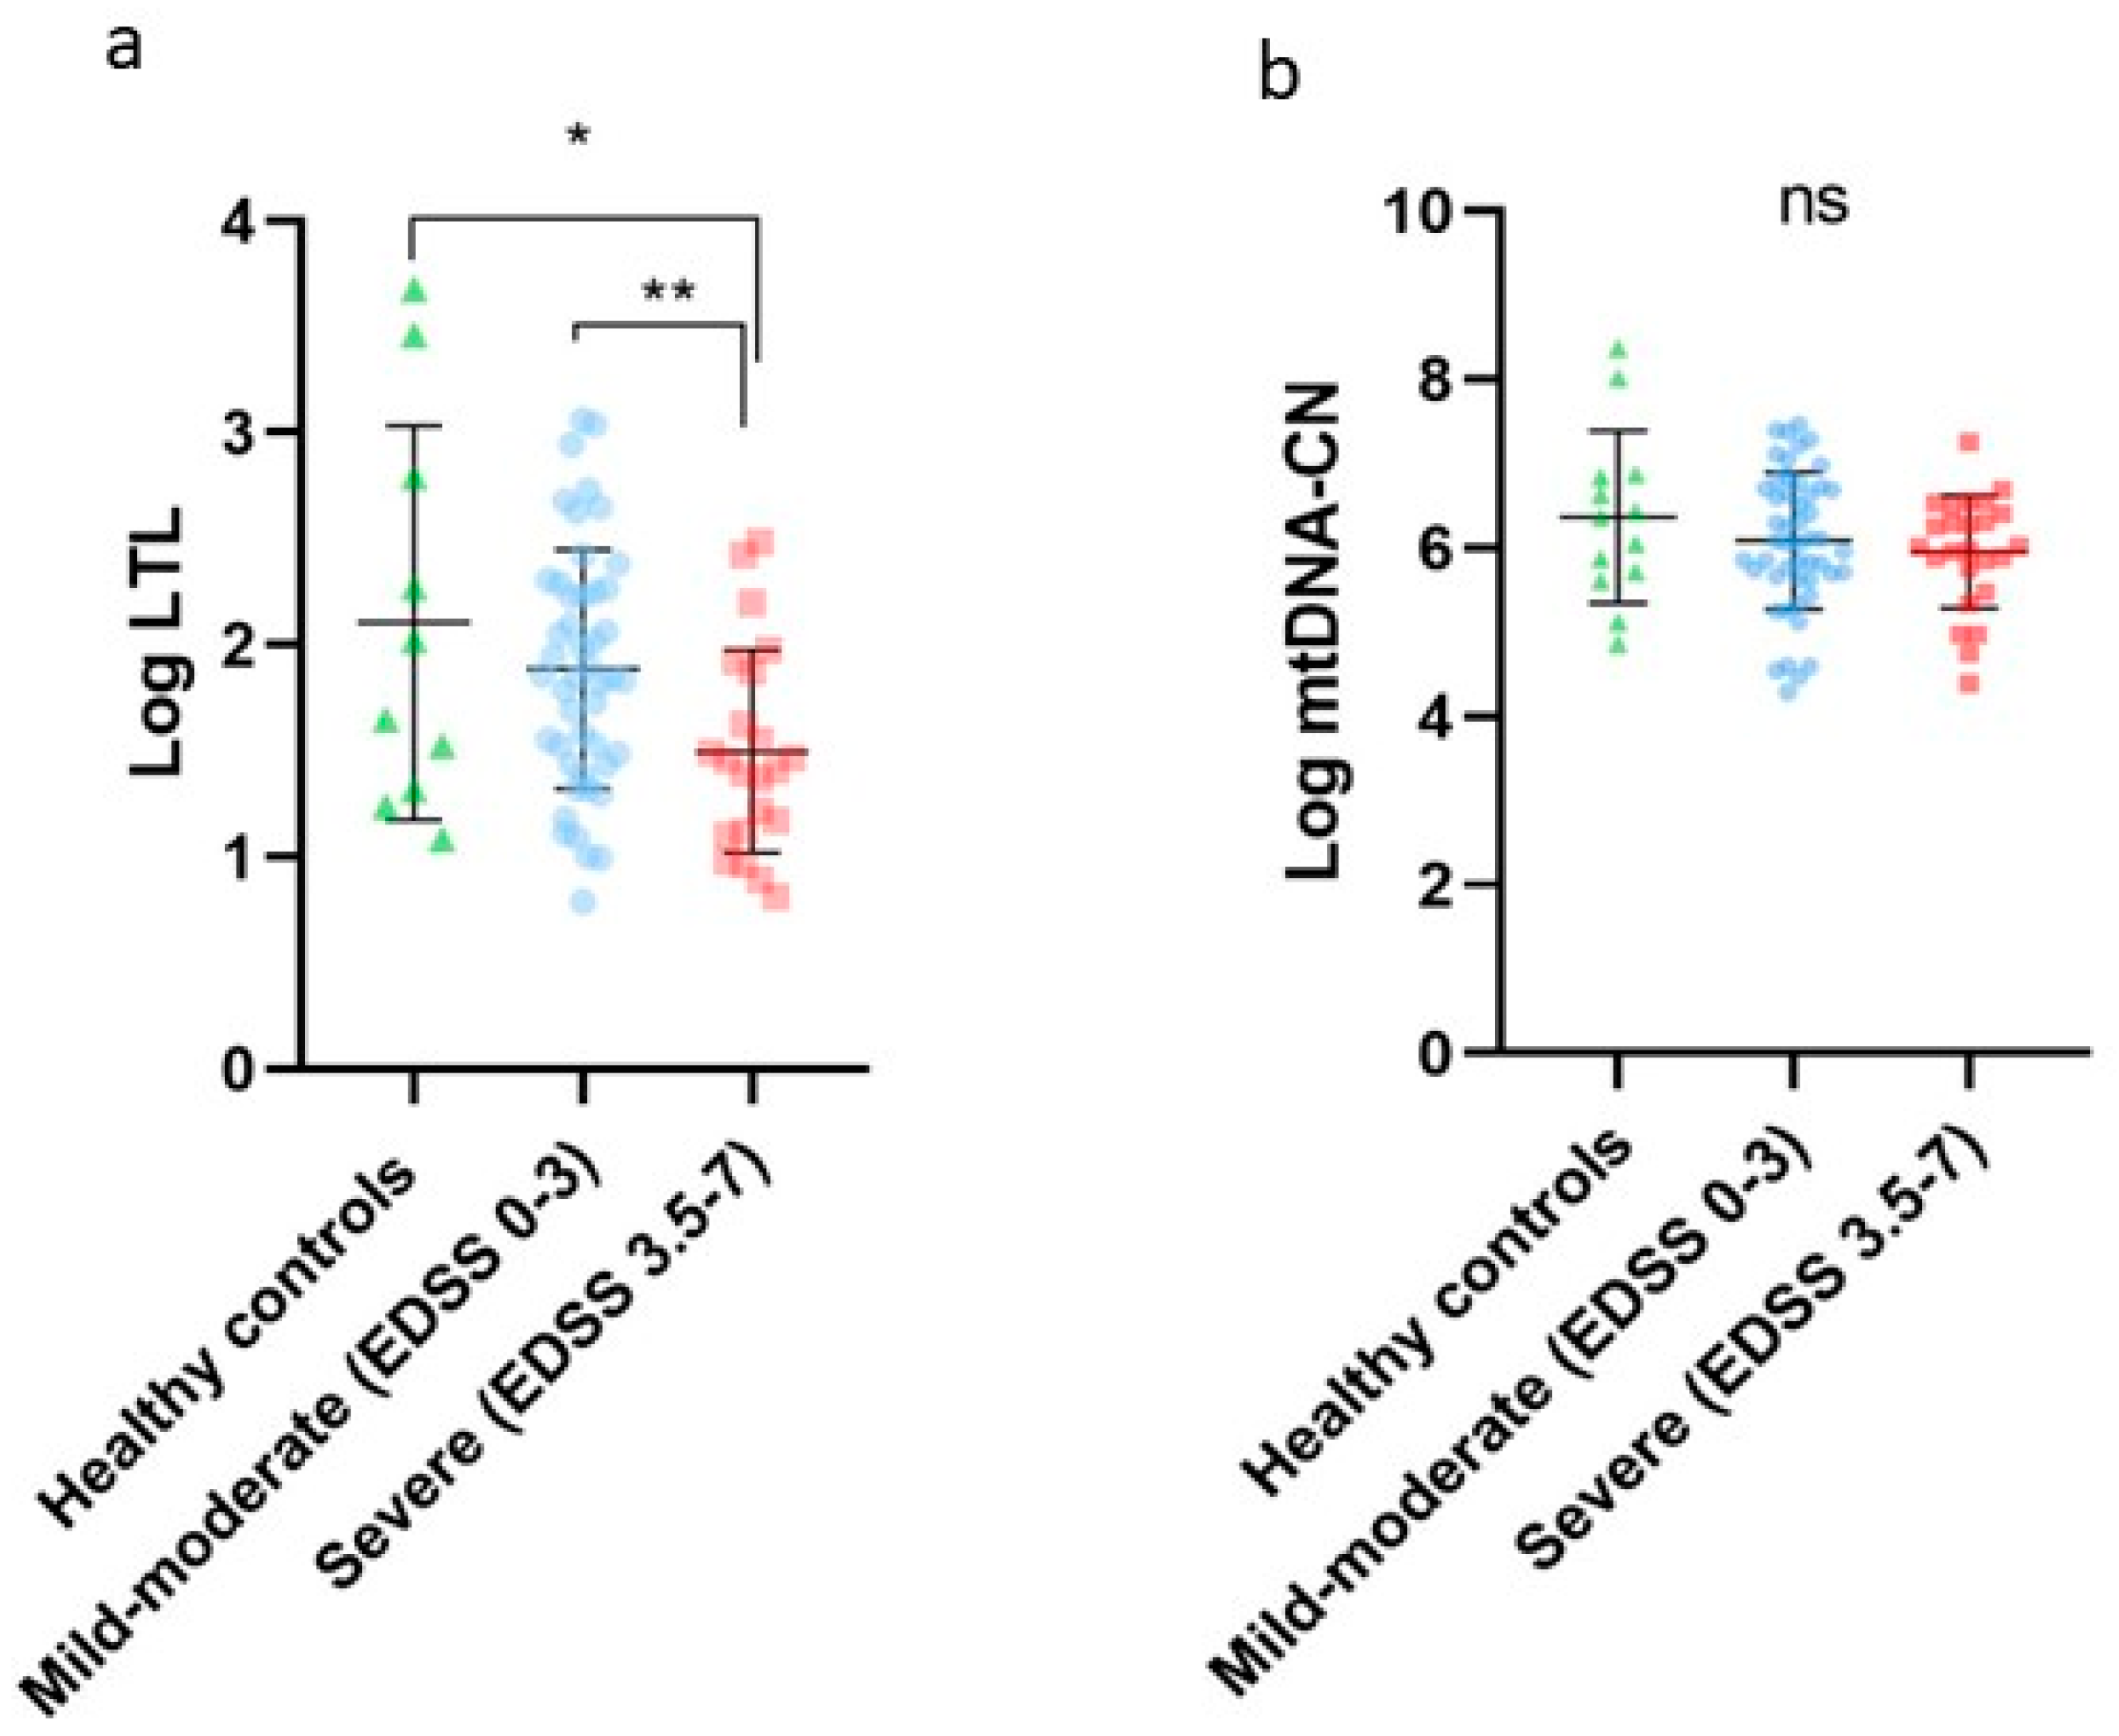
2.2. LTL and mtDNA-CN in Healthy Controls, Mild-Moderate Disability, and Severe Disability
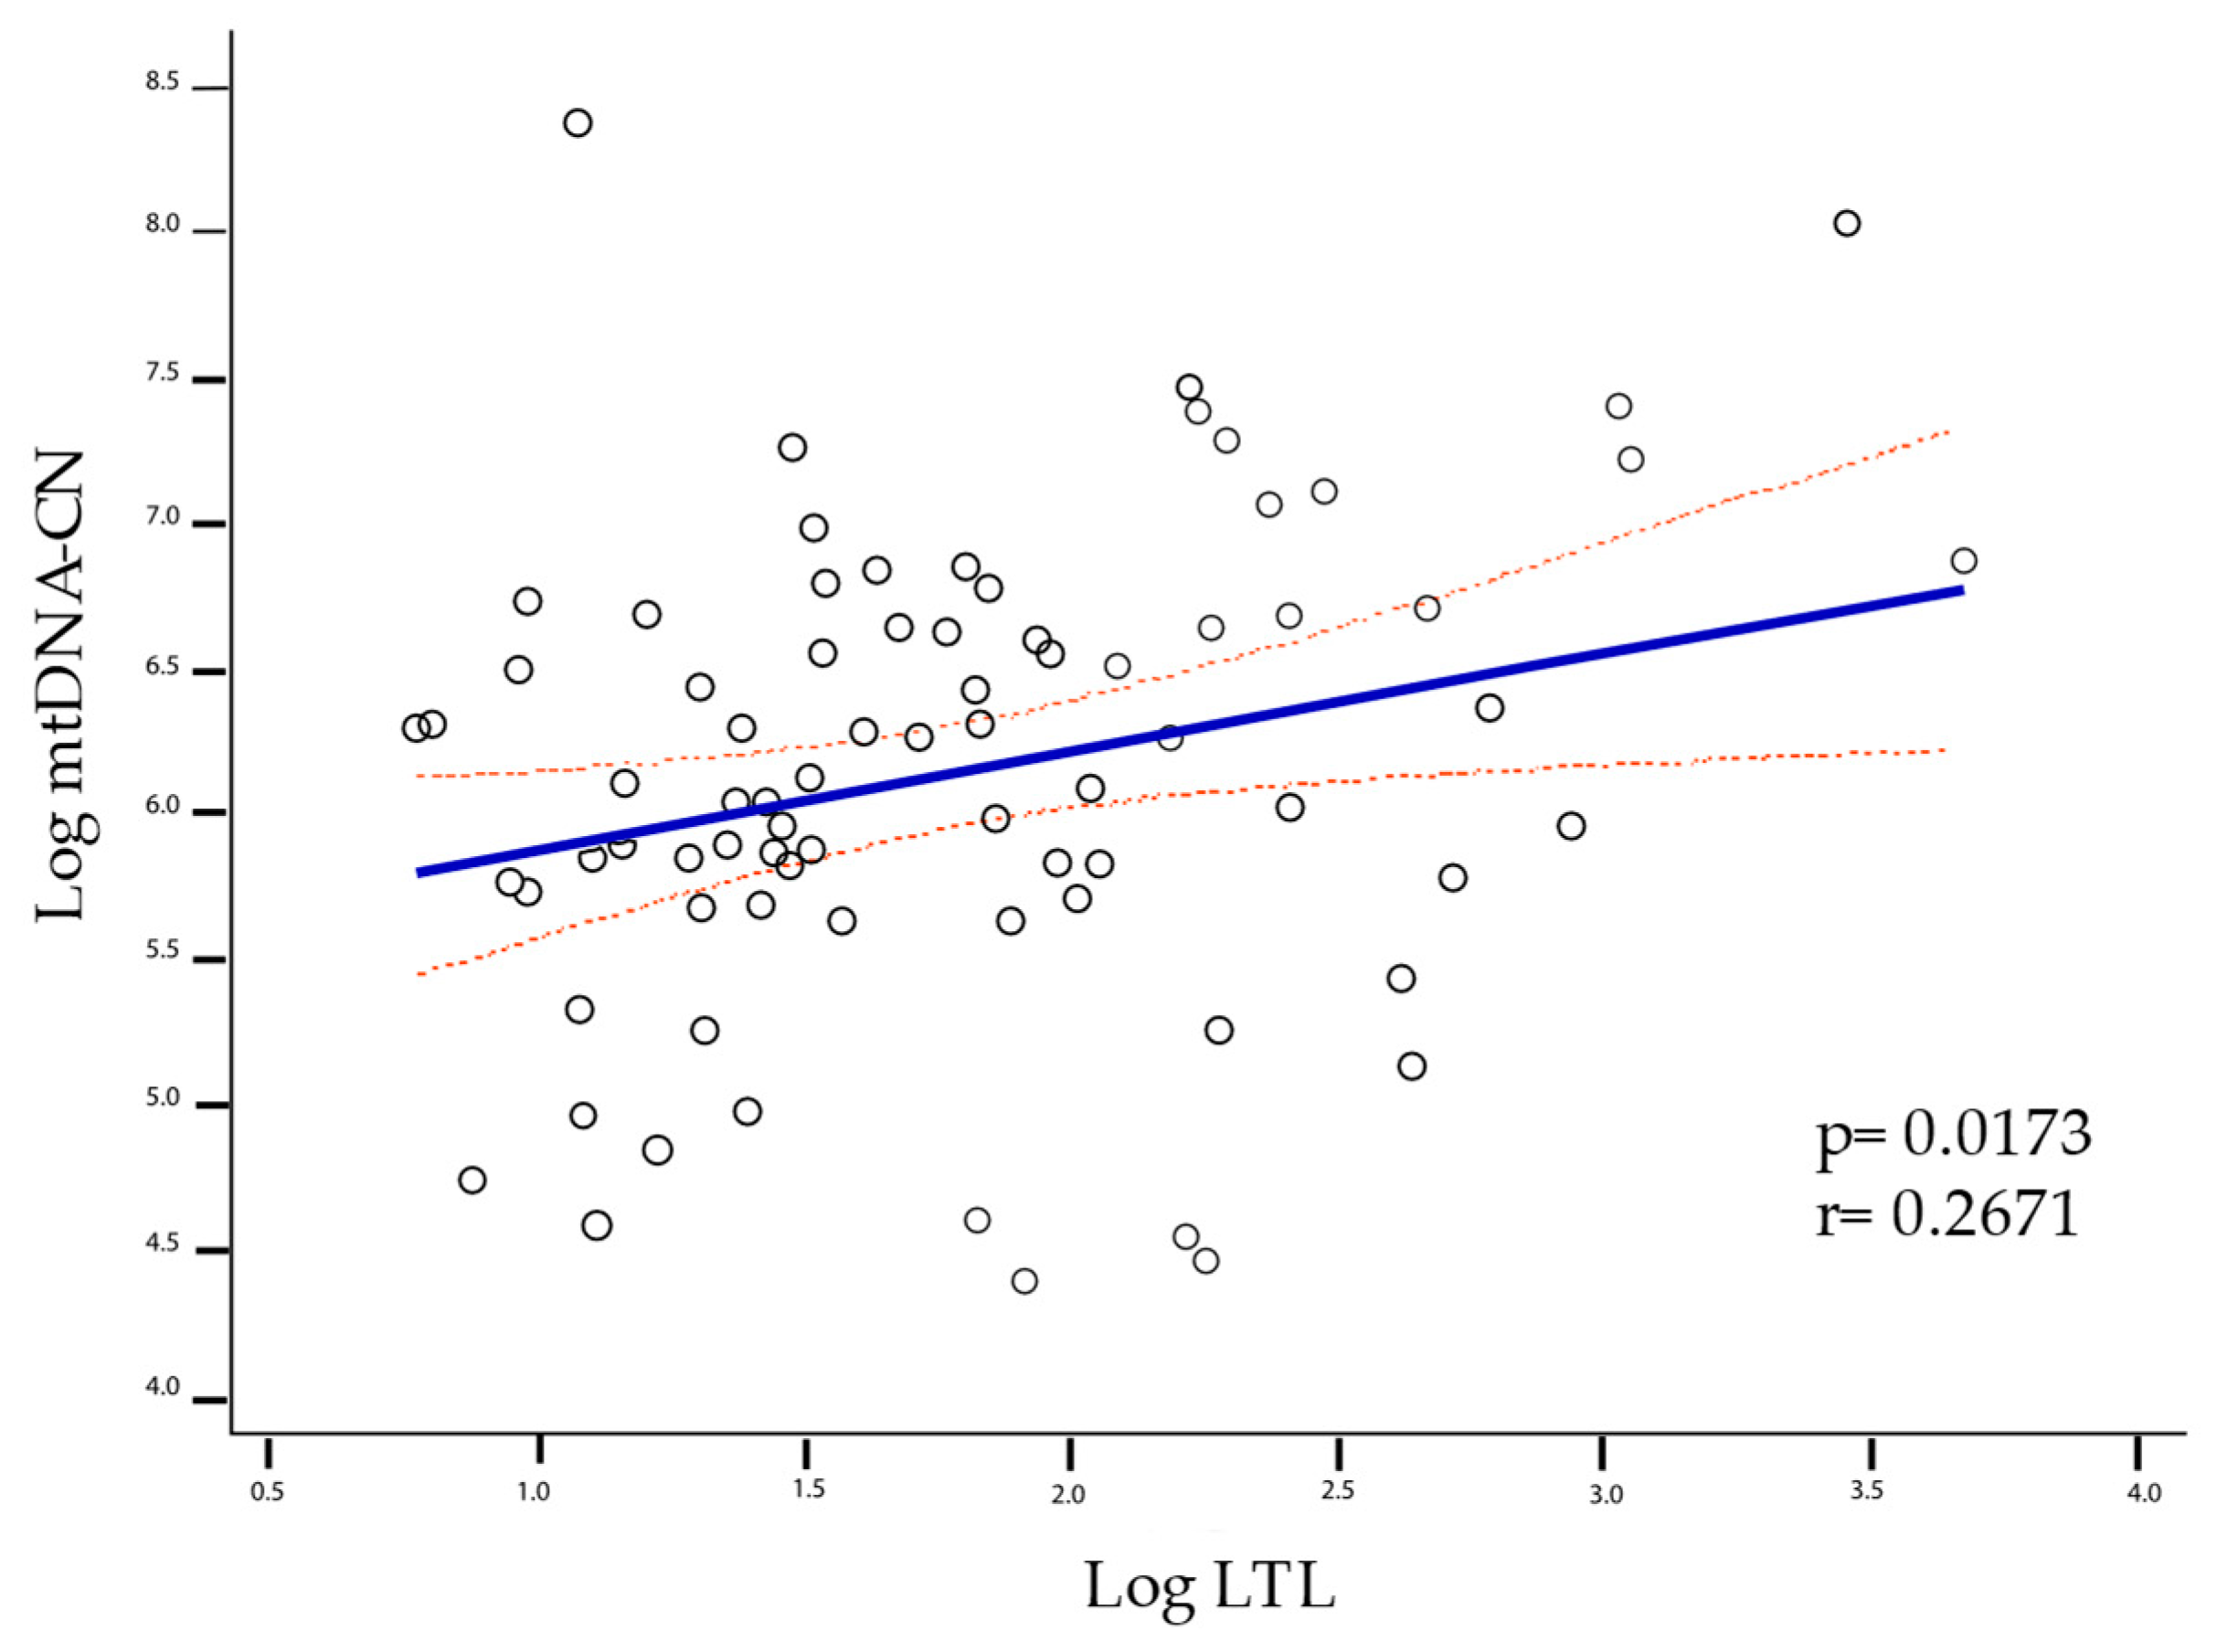
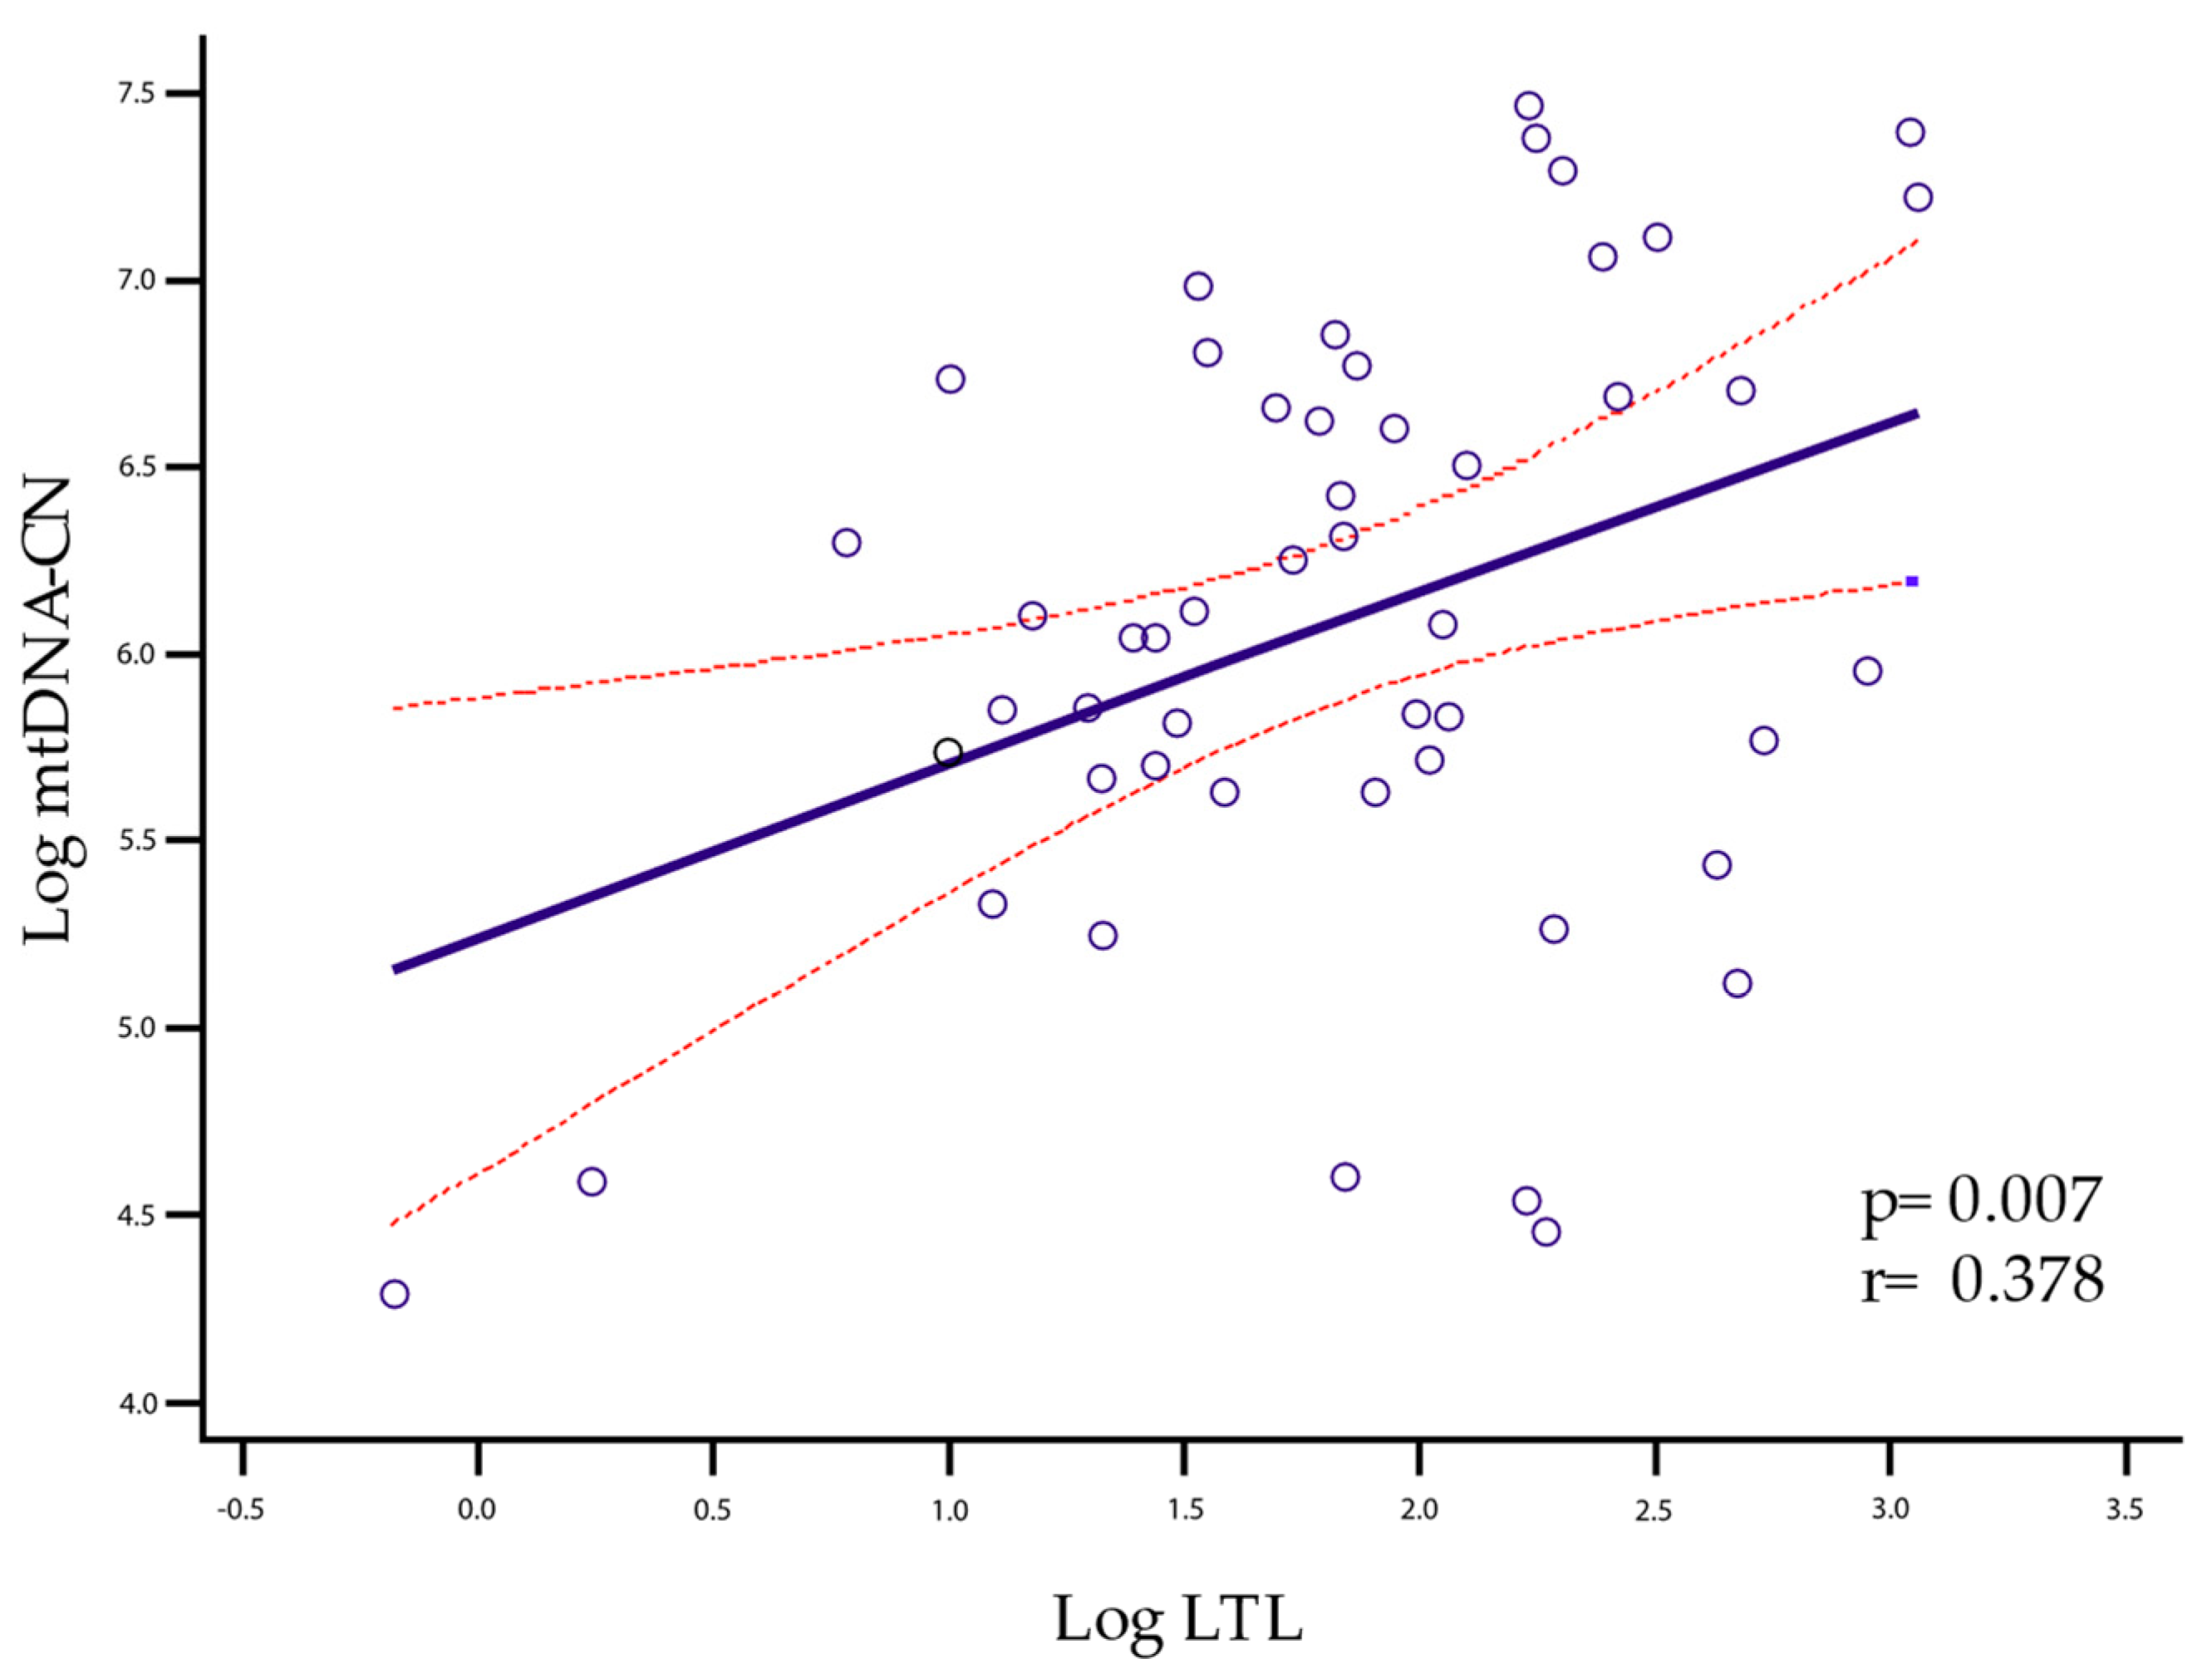
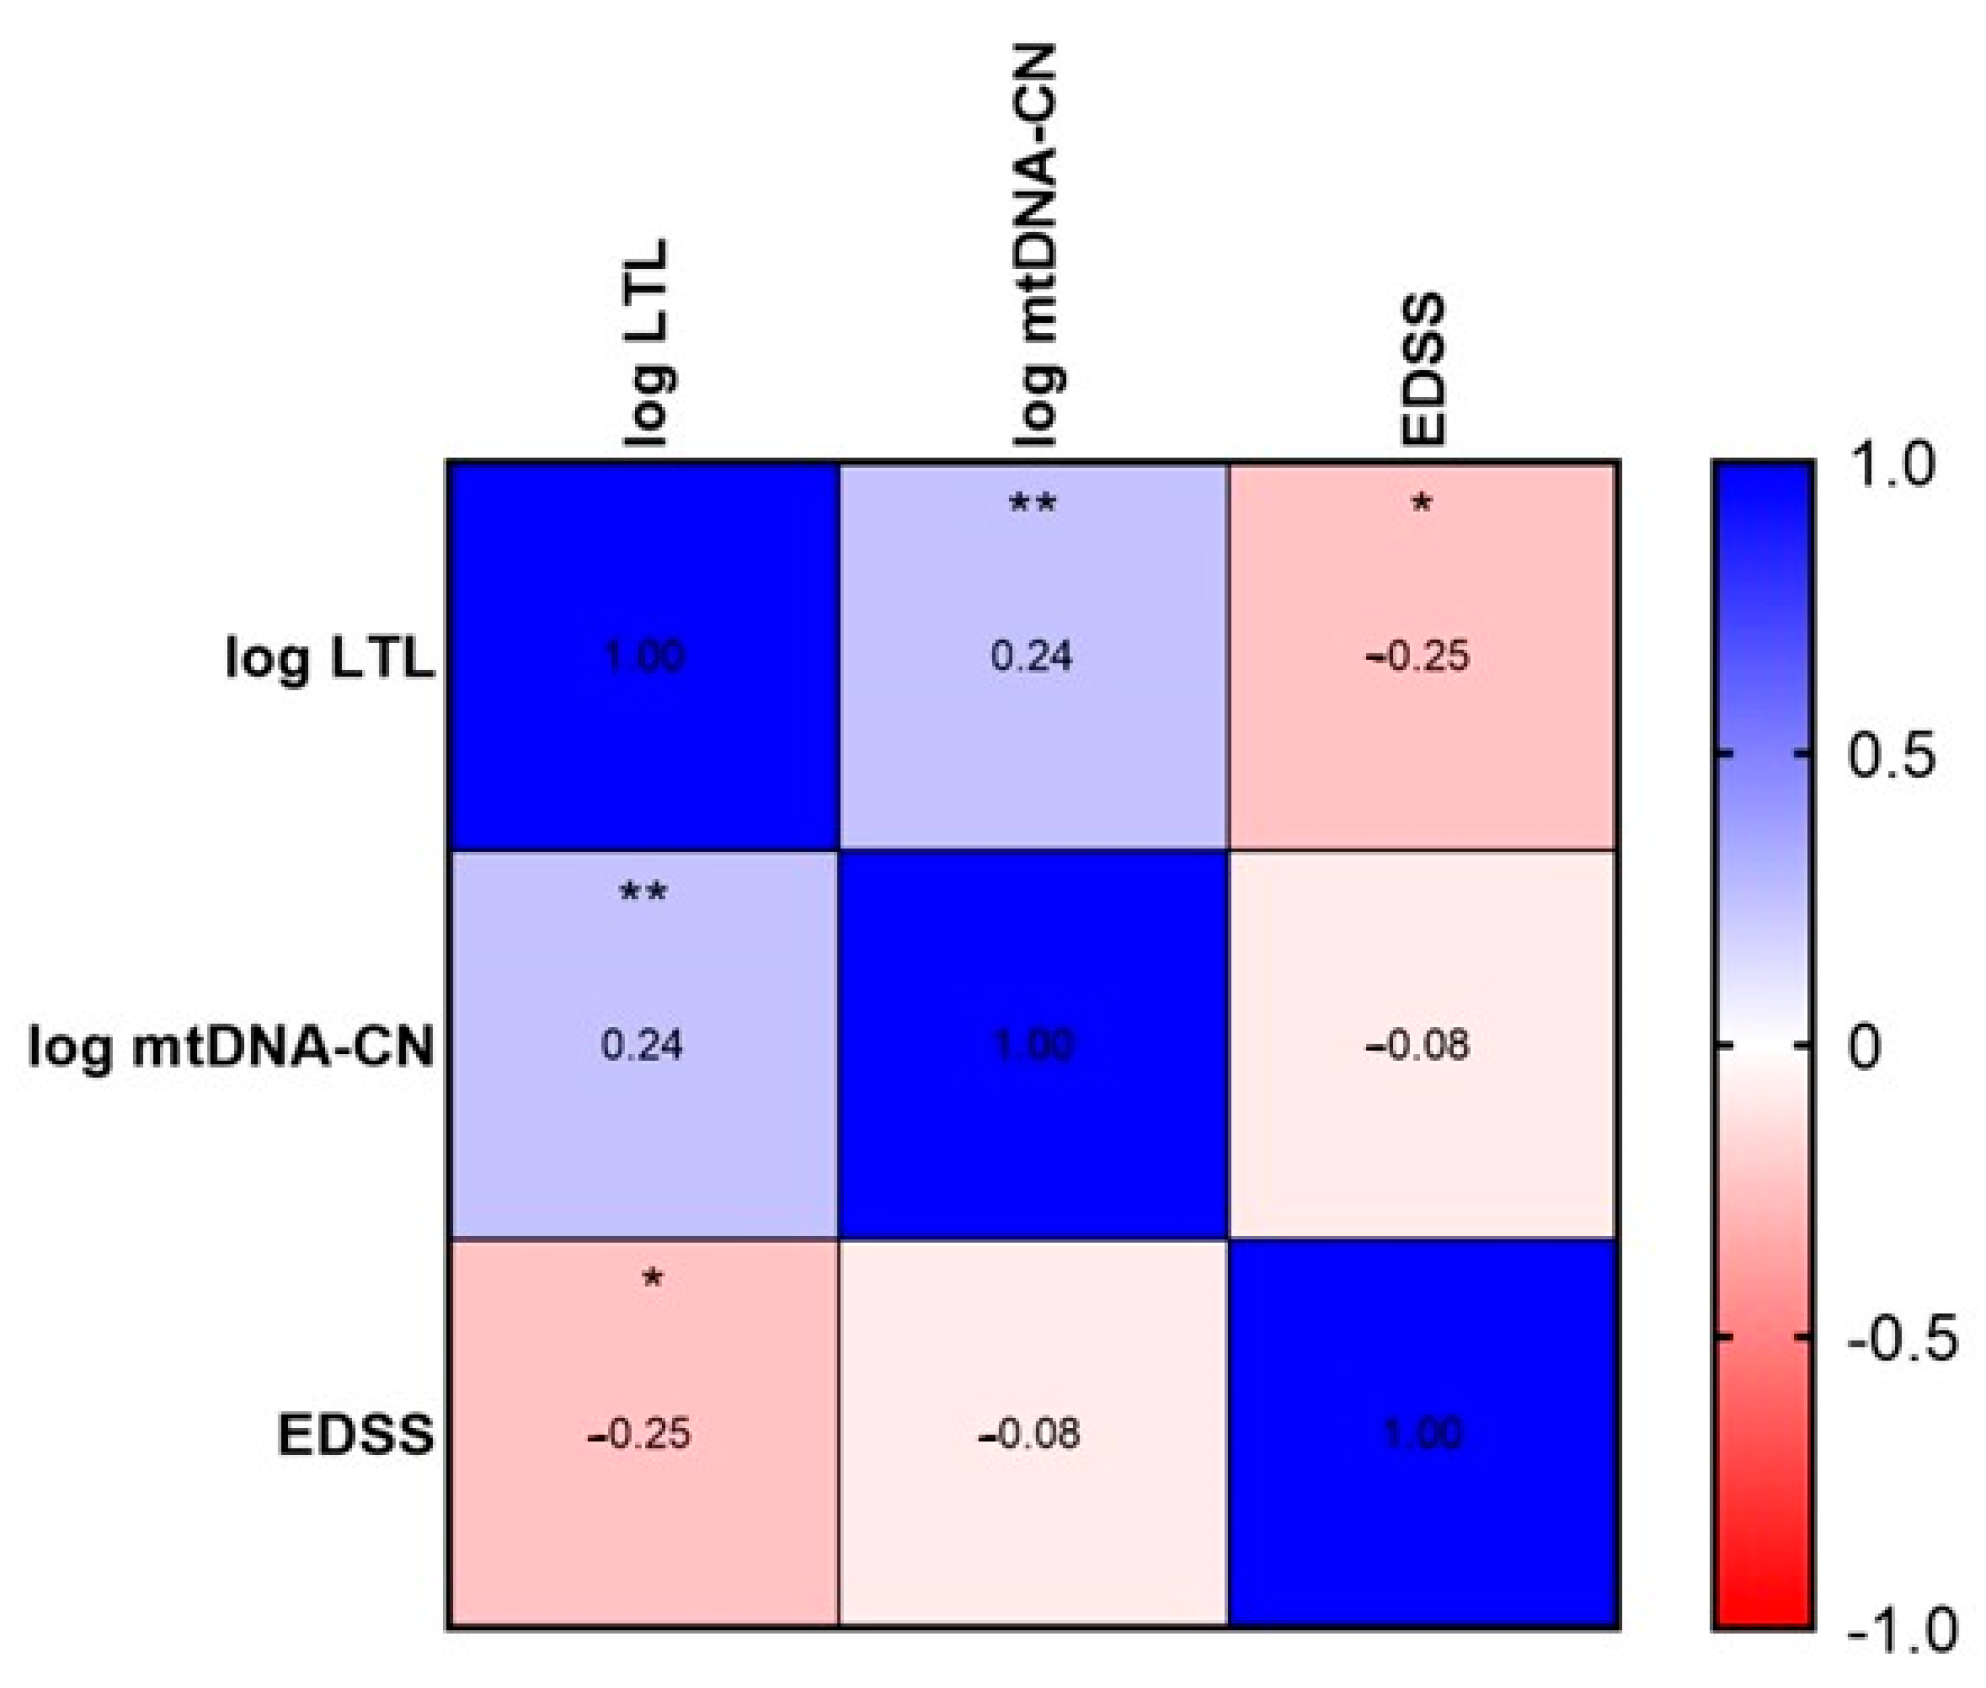
2.3. LTL and mtDNA-CN Correlation
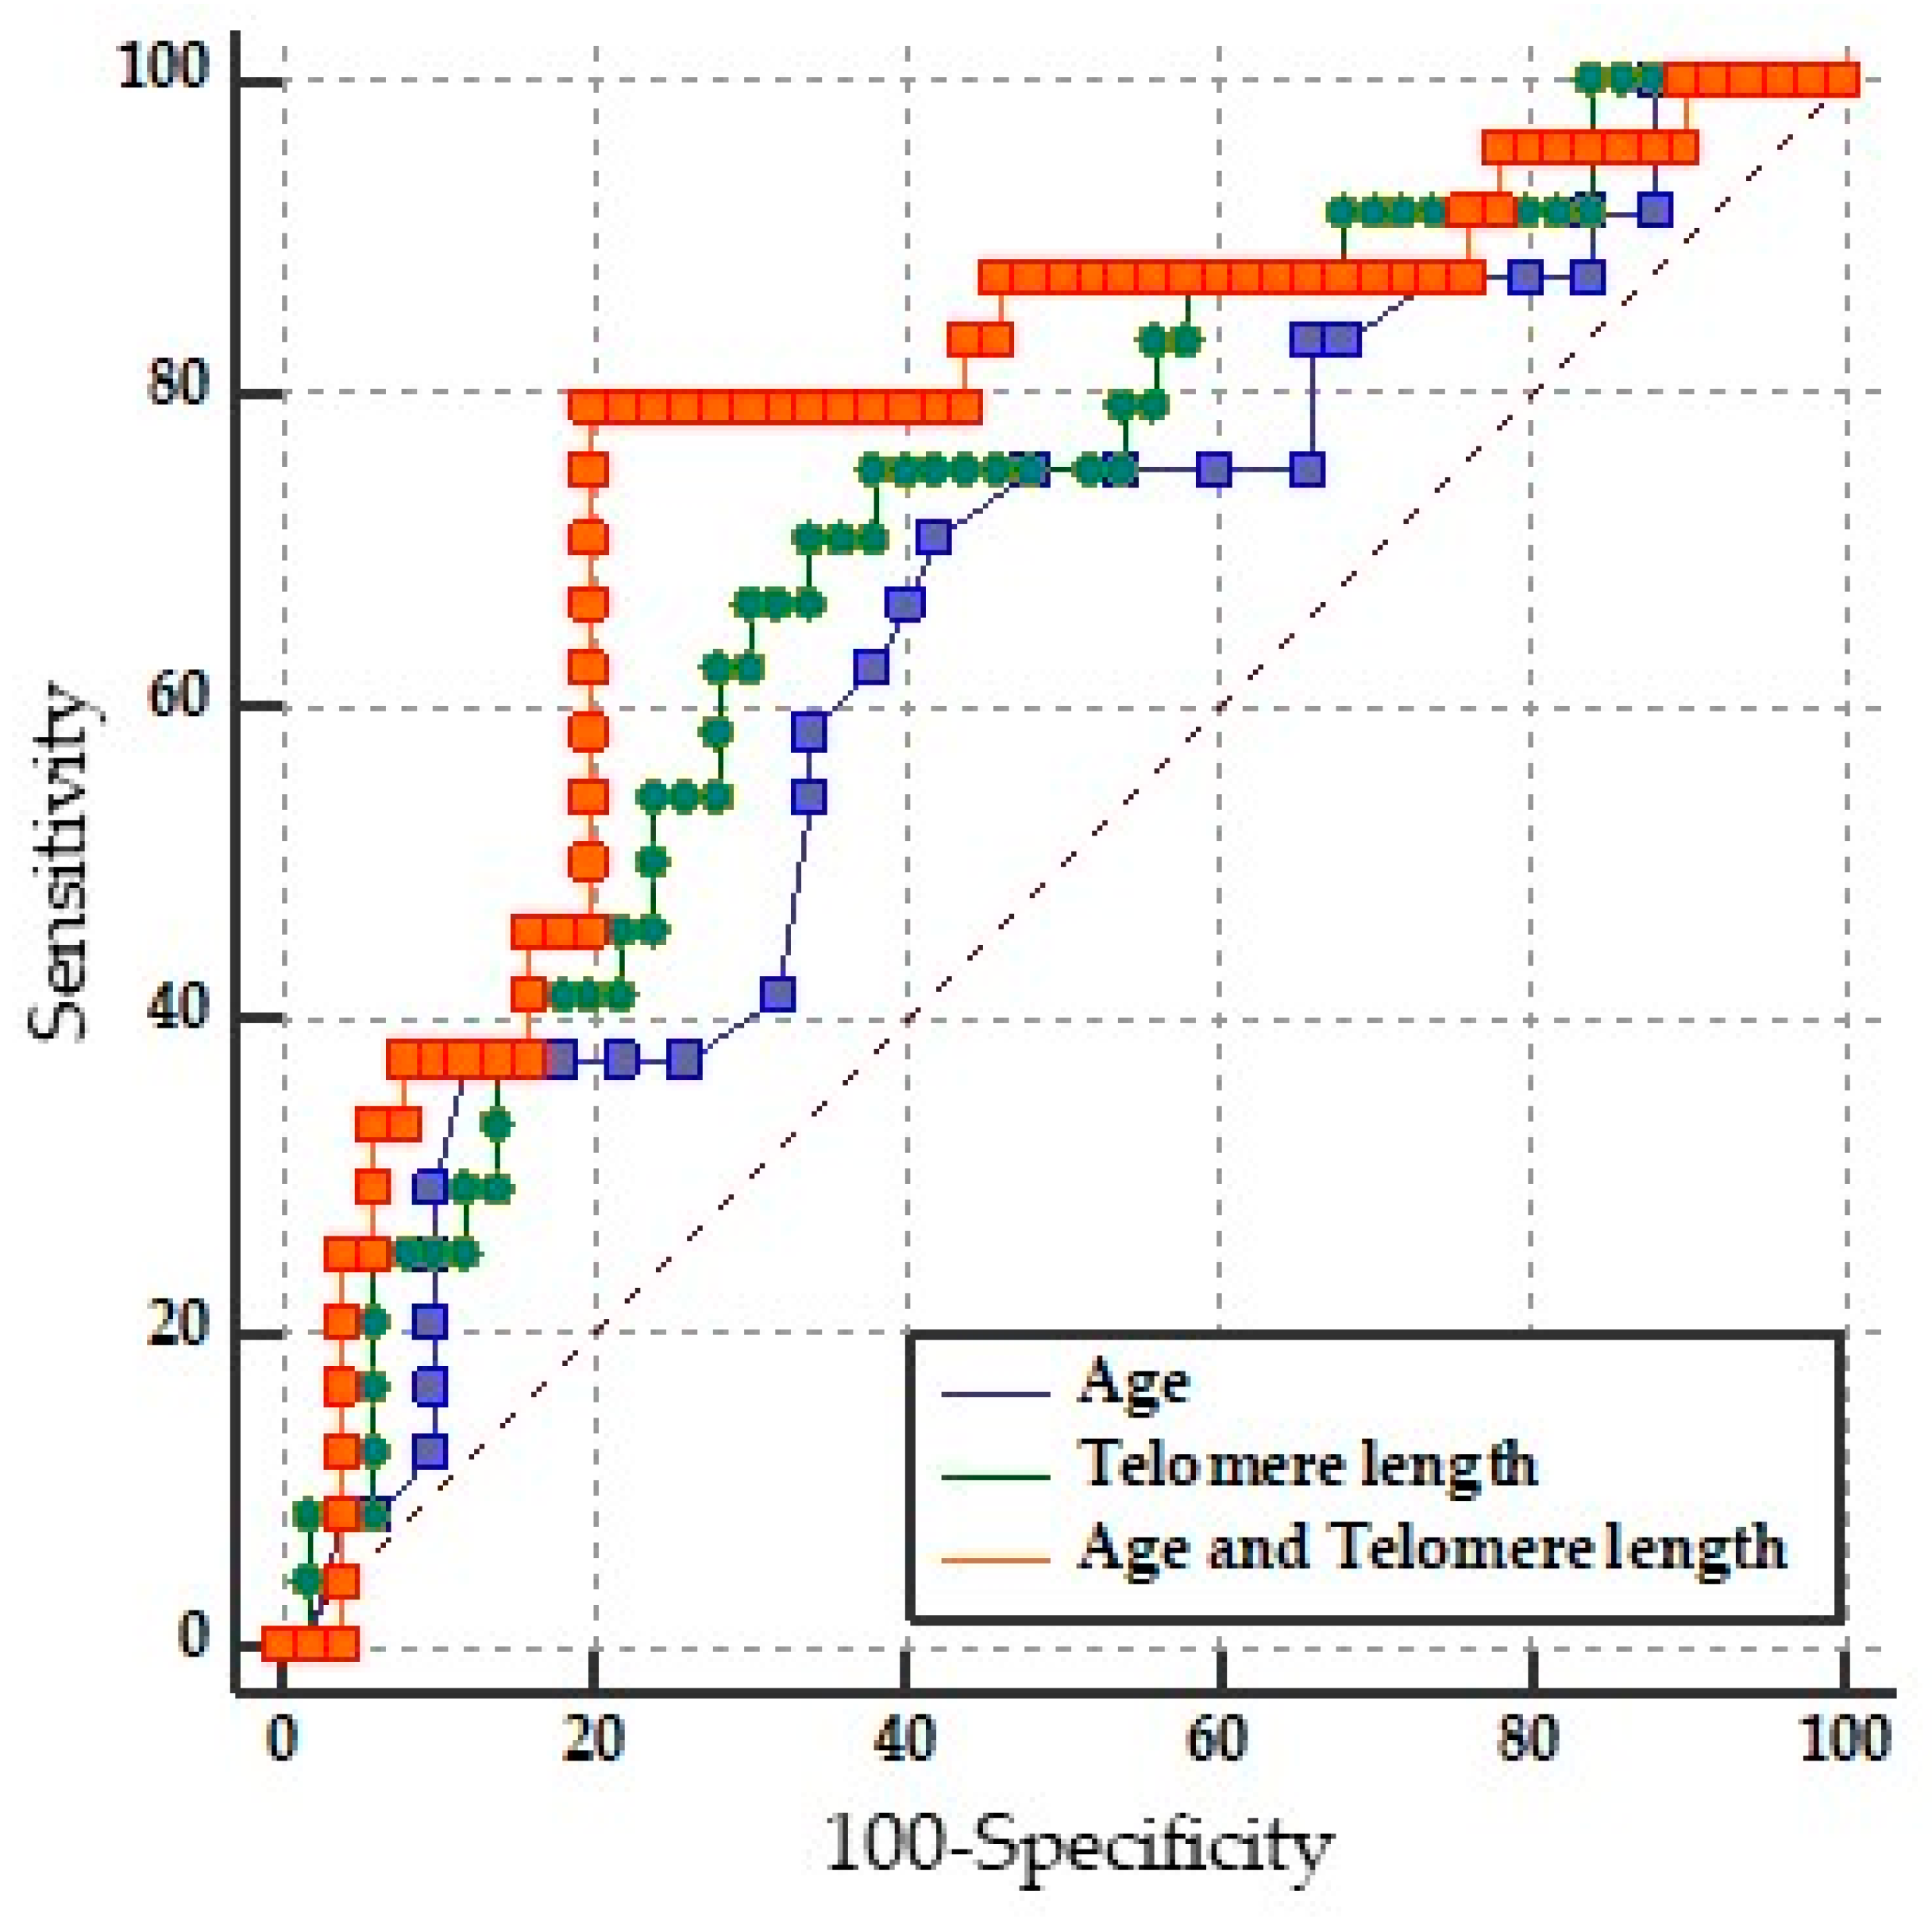
2.4. Prediction of Disability by LTL
2.5. Binary Logistic Regression Model of LTL and Age
3. Discussion
4. Materials and Methods
4.1. Study Design and Patient Selection
4.2. Absolute Quantification of Leukocyte Telomere Length (LTL) and Copy Number of mtDNA-CN
4.3. Statistical Analysis
5. Conclusions
Author Contributions
Funding
Institutional Review Board Statement
Informed Consent Statement
Data Availability Statement
Acknowledgments
Conflicts of Interest
References
- Goodin, D.S. The causal cascade to multiple sclerosis: A model for MS pathogenesis. PLoS ONE 2009, 4, 4565. [Google Scholar] [CrossRef] [PubMed]
- Goodin, D.S. Chapter 11—The epidemiology of multiple sclerosis: Insights to disease pathogenesis. In Multiple Sclerosis and Related Disorders; Goodin, D.S., Ed.; Elsevier: Amsterdam, The Netherlands, 2014; Volume 122, pp. 231–266. ISBN 0072-9752. [Google Scholar]
- Goodin, D.S. The epidemiology of multiple sclerosis: Insights to a causal cascade. Handb. Clin. Neurol. 2016, 138, 173–206. [Google Scholar] [CrossRef] [PubMed]
- Walton, C.; King, R.; Rechtman, L.; Kaye, W.; Leray, E.; Marrie, R.A.; Robertson, N.; Rocca, N.L.; Uitdehaag, B.; van der Mei, I.; et al. Rising prevalence of multiple sclerosis worldwide: Insights from the Atlas of MS, third edition. Mult. Scler. J. 2020, 26, 1816–1821. [Google Scholar] [CrossRef] [PubMed]
- Reich, D.S.; Lucchinetti, C.F.; Calabresi, P.A. Multiple Sclerosis. N. Engl. J. Med. 2018, 378, 169–180. [Google Scholar] [CrossRef]
- Confavreux, C.; Vukusic, S. Natural history of multiple sclerosis: A unifying concept. Brain 2006, 129, 606–616. [Google Scholar] [CrossRef] [Green Version]
- Macías Islas, M.Á.; Ciampi, E. Assessment and Impact of Cognitive Impairment in Multiple Sclerosis: An Overview. Biomedicines 2019, 7, 22. [Google Scholar] [CrossRef] [Green Version]
- Cadavid, D.; Tang, Y.; O’Neill, G. Responsiveness of the Expanded Disability Status Scale (EDSS) to disease progression and therapeutic intervention in progressive forms of multiple sclerosis. Rev. Neurol. 2010, 51, 321–329. [Google Scholar]
- Kurtzke, J.F. Rating neurologic impairment in multiple sclerosis: An expanded disability status scale (EDSS). Neurology 1983, 33, 1444–1452. [Google Scholar] [CrossRef] [Green Version]
- Kurtzke, J.F. On the origin of EDSS. Mult. Scler. Relat. Disord. 2015, 4, 95–103. [Google Scholar] [CrossRef]
- Şen, S. Neurostatus and EDSS Calculation with Cases. Noro Psikiyatr. Ars. 2018, 55, S80–S83. [Google Scholar] [CrossRef]
- Lublin, F.D.; Reingold, S.C.; Cohen, J.A.; Cutter, G.R.; Sørensen, P.S.; Thompson, A.J.; Wolinsky, J.S.; Balcer, L.J.; Banwell, B.; Barkhof, F.; et al. Defining the clinical course of multiple sclerosis: The 2013 revisions. Neurology 2014, 83, 278–286. [Google Scholar] [CrossRef] [PubMed]
- Musella, A.; Gentile, A.; Rizzo, F.R.; De Vito, F.; Fresegna, D.; Bullitta, S.; Vanni, V.; Guadalupi, L.; Bassi, M.S.; Buttari, F.; et al. Interplay between age and neuroinflammation in multiple sclerosis: Effects on motor and cognitive functions. Front. Aging Neurosci. 2018, 10, 238. [Google Scholar] [CrossRef] [PubMed] [Green Version]
- Patergnani, S.; Fossati, V.; Bonora, M.; Giorgi, C.; Marchi, S.; Missiroli, S.; Rusielewicz, T.; Wieckowski, M.R.; Pinton, P. Mitochondria in Multiple Sclerosis: Molecular Mechanisms of Pathogenesis. Int. Rev. Cell Mol. Biol. 2017, 328, 49–103. [Google Scholar] [CrossRef] [PubMed]
- Saretzki, G. Telomeres, Telomerase and Ageing. Subcell. Biochem. 2018, 90, 221–308. [Google Scholar] [CrossRef] [PubMed]
- Moyzis, R.K.; Buckingham, J.M.; Cram, L.S.; Dani, M.; Deaven, L.L.; Jones, M.D.; Meyne, J.; Ratliff, R.L.; Wu, J.R. A highly conserved repetitive DNA sequence, (TTAGGG)n, present at the telomeres of human chromosomes. Proc. Natl. Acad. Sci. USA 1988, 85, 6622–6626. [Google Scholar] [CrossRef] [Green Version]
- Bühring, J.; Hecker, M.; Fitzner, B.; Zettl, U.K. Systematic review of studies on telomere length in patients with multiple sclerosis. Aging Dis. 2021, 12, 1272–1286. [Google Scholar] [CrossRef]
- Ma, Y.; Wang, M.; Chen, X.; Ruan, W.; Yao, J.; Lian, X. Telomere length and multiple sclerosis: A Mendelian randomization study. Int. J. Neurosci. 2022, 13, 1–5. [Google Scholar] [CrossRef]
- Shu, M.-J.; Li, J.; Zhu, Y.-C. Genetically predicted telomere length and multiple sclerosis. Mult. Scler. Relat. Disord. 2022, 60, 103731. [Google Scholar] [CrossRef]
- Montpetit, A.; Alhareeri, A.; Montpetit, M.; Starkweather, A.; Elmore, L.; Filler, K.; Mohanraj, L.; Burton, C.; Menzies, V.; Lyon, D.; et al. Telomere Length A Review of Methods for Measurement. Nurs. Res. 2014, 63, 289–299. [Google Scholar] [CrossRef] [Green Version]
- Mao, P.; Reddy, P.H. Is multiple sclerosis a mitochondrial disease? Biochim. Biophys. Acta. Mol. Basis Dis. 2010, 1802, 66. [Google Scholar] [CrossRef]
- Al-Kafaji, G.; Bakheit, H.F.; Alharbi, M.A.; Farahat, A.A.; Jailani, M.; Ebrahin, B.H.; Bakhiet, M. Mitochondrial DNA Copy Number in Peripheral Blood as a Potential Non-invasive Biomarker for Multiple Sclerosis. Neuromol. Med. 2020, 22, 304–313. [Google Scholar] [CrossRef] [PubMed]
- Lowes, H.; Pyle, A.; Duddy, M.; Hudson, G. Cell-free mitochondrial DNA in progressive multiple sclerosis. Mitochondrion 2019, 46, 307–312. [Google Scholar] [CrossRef] [PubMed]
- Silva-Zolezzi, I.; Hidalgo-Miranda, A.; Estrada-Gil, J.; Fernandez-Lopez, J.C.; Uribe-Figueroa, L.; Contreras, A.; Balam-Ortiz, E.; del Bosque-Plata, L.; Velazquez-Fernandez, D.; Lara, C.; et al. Analysis of genomic diversity in Mexican Mestizo populations to develop genomic medicine in Mexico. Proc. Natl. Acad. Sci. USA 2009, 106, 8611–8616. [Google Scholar] [CrossRef] [PubMed] [Green Version]
- Velázquez-Quintana, M.; Macías-Islas, M.A.; Rivera-Olmos, V.L.-Z.J. Esclerosis Múltiple en México. Un estudio Multicéntrico. Rev. Neurol. 2003, 36, 1019–1022. [Google Scholar] [CrossRef] [PubMed]
- Anitha, A.; Thanseem, I.; Vasu, M.M.; Viswambharan, V.; Poovathinal, S.A. Telomeres in neurological disorders. Adv. Clin. Chem. 2019, 90, 81–132. [Google Scholar] [CrossRef] [PubMed]
- Wang, S.; Madu, C.O.; Lu, Y. Telomere and Its Role in Diseases. Oncomedicine 2019, 4, 1–9. [Google Scholar] [CrossRef] [Green Version]
- Zheng, Q.; Huang, J.; Wang, G. Mitochondria, Telomeres and Telomerase Subunits. Front. Cell Dev. Biol. 2019, 7, 274. [Google Scholar] [CrossRef] [Green Version]
- Lezi, E.; Swerdlow, R.H. Mitochondria in Neurodegeneration. Adv. Exp. Med. Biol. 2012, 942, 269. [Google Scholar] [CrossRef] [Green Version]
- Scalfari, A.; Neuhaus, A.; Daumer, M.; Ebers, G.C.; Muraro, P.A. Age and disability accumulation in multiple sclerosis. Neurology 2011, 77, 1246–1252. [Google Scholar] [CrossRef] [Green Version]
- Sanai, S.A.; Saini, V.; Benedict, R.H.B.; Zivadinov, R.; Teter, B.E.; Ramanathan, M.; Weinstock-Guttman, B. Aging and multiple sclerosis. Mult. Scler. 2016, 22, 717–725. [Google Scholar] [CrossRef] [Green Version]
- Hjelmborg, J.B.; Dalgård, C.; Möller, S.; Steenstrup, T.; Kimura, M.; Christensen, K.; Kyvik, K.O.; Aviv, A. The heritability of leucocyte telomere length dynamics. J. Med. Genet. 2015, 52, 297–302. [Google Scholar] [CrossRef] [PubMed]
- Broer, L.; Codd, V.; Nyholt, D.R.; Deelen, J.; Mangino, M.; Willemsen, G.; Albrecht, E.; Amin, N.; Beekman, M.; De Geus, E.J.C.; et al. Meta-analysis of telomere length in 19 713 subjects reveals high heritability, stronger maternal inheritance and a paternal age effect. Eur. J. Hum. Genet. 2013, 21, 1163. [Google Scholar] [CrossRef] [PubMed] [Green Version]
- Kordinas, V.; Ioannidis, A.; Chatzipanagiotou, S. The Telomere/Telomerase System in Chronic Inflammatory Diseases. Cause or Effect? Genes 2016, 7, 60. [Google Scholar] [CrossRef] [PubMed] [Green Version]
- Kim, J.H.; Kim, H.K.; Ko, J.H.; Bang, H.; Lee, D.C. The Relationship between Leukocyte Mitochondrial DNA Copy Number and Telomere Length in Community-Dwelling Elderly Women. PLoS ONE 2013, 8, e67227. [Google Scholar] [CrossRef] [Green Version]
- Passos, J.F.; Saretzki, G.; Ahmed, S.; Nelson, G.; Richter, T.; Peters, H.; Wappler, I.; Birket, M.J.; Harold, G.; Schaeuble, K.; et al. Mitochondrial dysfunction accounts for the stochastic heterogeneity in telomere-dependent senescence. PLoS Biol. 2007, 5, 1138–1151. [Google Scholar] [CrossRef] [Green Version]
- Kwapisz, M.; Morillon, A. Subtelomeric Transcription and its Regulation. J. Mol. Biol. 2020, 432, 4199–4219. [Google Scholar] [CrossRef]
- Pertusa, M.; García-Matas, S.; Rodríguez-Farré, E.; Sanfeliu, C.; Cristòfol, R. Astrocytes aged in vitro show a decreased neuroprotective capacity. J. Neurochem. 2007, 101, 794–805. [Google Scholar] [CrossRef] [Green Version]
- Mansour, H.; Chamberlain, C.G.; Weible, M.W.; Hughes, S.; Chu, Y.; Chan-Ling, T. Aging-related changes in astrocytes in the rat retina: Imbalance between cell proliferation and cell death reduces astrocyte availability. Aging Cell 2008, 7, 526–540. [Google Scholar] [CrossRef]
- Al-Mashhadi, S.; Simpson, J.E.; Heath, P.R.; Dickman, M.; Forster, G.; Matthews, F.E.; Brayne, C.; Ince, P.G.; Wharton, S.B. Oxidative Glial Cell Damage Associated with White Matter Lesions in the Aging Human Brain. Brain Pathol. 2015, 25, 565–574. [Google Scholar] [CrossRef] [Green Version]
- Jurk, D.; Wang, C.; Miwa, S.; Maddick, M.; Korolchuk, V.; Tsolou, A.; Gonos, E.S.; Thrasivoulou, C.; Jill Saffrey, M.; Cameron, K.; et al. Postmitotic neurons develop a p21-dependent senescence-like phenotype driven by a DNA damage response. Aging Cell 2012, 11, 996–1004. [Google Scholar] [CrossRef] [Green Version]
- Martínez-Cué, C.; Rueda, N. Cellular Senescence in Neurodegenerative Diseases. Front. Cell. Neurosci. 2020, 14, 16. [Google Scholar] [CrossRef] [PubMed]
- Gray, V.; Arnett, P. Aging with multiple sclerosis: Cognitive, emotional and neuropathological considerations. Neurodegener. Dis. Manag. 2014, 4, 187–194. [Google Scholar] [CrossRef] [PubMed]
- Miner, A.E.; Graves, J.S. What telomeres teach us about MS. Mult. Scler. Relat. Disord. 2021, 54, 103084. [Google Scholar] [CrossRef] [PubMed]
- Leray, E.; Yaouanq, J.; Le Page, E.; Coustans, M.; Laplaud, D.; Oger, J.; Edan, G. Evidence for a two-stage disability progression in multiple sclerosis. Brain 2010, 133, 1900–1913. [Google Scholar] [CrossRef] [Green Version]
- Cree, B.A.C.; Reich, D.E.; Khan, O.; De Jager, P.L.; Nakashima, I.; Takahashi, T.; Bar-Or, A.; Tong, C.; Hauser, S.L.; Oksenberg, J.R. Modification of Multiple Sclerosis Phenotypes by African Ancestry at HLA. Arch. Neurol. 2009, 66, 226–233. [Google Scholar] [CrossRef] [Green Version]
- Krysko, K.M.; Henry, R.G.; Cree, B.A.C.; Lin, J.; University of California, S.F.M.-E.T.; Caillier, S.; Santaniello, A.; Zhao, C.; Gomez, R.; Bevan, C.; et al. Telomere Length Is Associated with Disability Progression in Multiple Sclerosis. Ann. Neurol. 2019, 86, 671–682. [Google Scholar] [CrossRef]
- Ghione, E.; Bergsland, N.; Dwyer, M.G.; Hagemeier, J.; Jakimovski, D.; Paunkoski, I.; Ramasamy, D.P.; Carl, E.; Hojnacki, D.; Kolb, C.; et al. Aging and Brain Atrophy in Multiple Sclerosis. J. Neuroimaging 2019, 29, 527–535. [Google Scholar] [CrossRef]
- Thompson, A.J.; Banwell, B.L.; Barkhof, F.; Carroll, W.M.; Coetzee, T.; Comi, G.; Correale, J.; Fazekas, F.; Filippi, M.; Freedman, M.S.; et al. Diagnosis of multiple sclerosis: 2017 revisions of the McDonald criteria. Lancet Neurol. 2018, 17, 162–173. [Google Scholar] [CrossRef]
- Miller, S.A.; Dykes, D.D.; Polesky, H.F. A simple salting out procedure for extracting DNA from human nucleated cells. Nucleic Acids Res. 1988, 16, 1215. [Google Scholar] [CrossRef] [Green Version]
- O’Callaghan, N.J.; Fenech, M. A quantitative PCR method for measuring absolute telomere length. Biol. Proced. Online 2011, 13, 3. [Google Scholar] [CrossRef] [Green Version]
- Hagman, M.; Fristrup, B.; Michelin, R.; Krustrup, P.; Asghar, M. Football and team handball training postpone cellular aging in women. Sci. Rep. 2021, 11, 11733. [Google Scholar] [CrossRef] [PubMed]


| Characteristic | Mild-Moderate Disability EDSS 0–3 (n = 50) | Severe Disability EDSS 3.5–7 (n = 25) | p-Value |
|---|---|---|---|
| Female | 33 (66%) | 17 (68%) | NS |
| Male | 17 (34%) | 8 (32%) | NS |
| Age | 37.7 ± 11.4 | 43.0 ± 11.1 | NS |
| Years since diagnosis | 7.78 ± 5.12 | 10.2 ± 6.99 | |
| EDSS ‡ | 1.91 ± 0.88 | 4.9 ± 1.11 | * 0.00001 |
| Progression rate | 0.51 ± 0.63 | 0.99 ± 1.09 | * 0.00145 |
| Treatment: | |||
| Glatiramer Acetate | 19 (38%) | 9 (36%) | NS |
| Rituximab | 4 (8%) | 3 (12%) | |
| Interferon β | 14 (28%) | 5 (2%) | |
| Fingolimod | 5 (10%) | 2 (8%) | |
| Azathioprine | 0 | 3 (12%) | |
| Natalizumab | 1 (2%) | 1 (4%) | |
| Dimethyl fumarate | 3 (6%) | 1 (4%) | |
| None | 4 (8%) | 1 (4%) |
| Variable | Odds Ratio | 95% CI | p-Value |
|---|---|---|---|
| LTL * | 0.3458 | 0.1384 to 0.8641 | * p = 0.0230 |
| mtDNA-CN | 1.0723 | 0.4792 to 2.3994 | p = 0.8651 |
| Age | 1.0205 | 0.9686 to 1.0753 | p = 0.4457 |
| Sex (female) | 1.0687 | 0.3369 to 3.3899 | p = 0.9102 |
| Years since diagnosis | 1.0702 | 0.9698 to 1.1810 | p = 0.1771 |
| Variable | AUC | 95% CI | p-Value |
|---|---|---|---|
| Age | 0.635 | 0.516 to 0.743 | * p = 0.0488 |
| LTL | 0.702 | 0.584 to 0.803 | * p = 0.0018 |
| LTL and Age | 0.762 | 0.649 to 0.854 | * p = 0.0001 |
| Pairwise comparison of ROC curves | |||
| Age vs. Age + LTL | 0.0122 to 0.231 | * p = 0.0294 | |
| LTL vs. Age + LTL | −0.0210 to 0.143 | p = 0.1452 | |
| Age vs. LTL | −0.113 to 0.235 | p = 0.4925 |
Disclaimer/Publisher’s Note: The statements, opinions and data contained in all publications are solely those of the individual author(s) and contributor(s) and not of MDPI and/or the editor(s). MDPI and/or the editor(s) disclaim responsibility for any injury to people or property resulting from any ideas, methods, instructions or products referred to in the content. |
© 2023 by the authors. Licensee MDPI, Basel, Switzerland. This article is an open access article distributed under the terms and conditions of the Creative Commons Attribution (CC BY) license (https://creativecommons.org/licenses/by/4.0/).
Share and Cite
López-Armas, G.d.C.; Ramos-Márquez, M.E.; Navarro-Meza, M.; Macías-Islas, M.Á.; Saldaña-Cruz, A.M.; Zepeda-Moreno, A.; Siller-López, F.; Cruz-Ramos, J.A. Leukocyte Telomere Length Predicts Severe Disability in Relapsing-Remitting Multiple Sclerosis and Correlates with Mitochondrial DNA Copy Number. Int. J. Mol. Sci. 2023, 24, 916. https://doi.org/10.3390/ijms24020916
López-Armas GdC, Ramos-Márquez ME, Navarro-Meza M, Macías-Islas MÁ, Saldaña-Cruz AM, Zepeda-Moreno A, Siller-López F, Cruz-Ramos JA. Leukocyte Telomere Length Predicts Severe Disability in Relapsing-Remitting Multiple Sclerosis and Correlates with Mitochondrial DNA Copy Number. International Journal of Molecular Sciences. 2023; 24(2):916. https://doi.org/10.3390/ijms24020916
Chicago/Turabian StyleLópez-Armas, Gabriela del Carmen, Martha Eloisa Ramos-Márquez, Mónica Navarro-Meza, Miguel Ángel Macías-Islas, Ana Miriam Saldaña-Cruz, Abraham Zepeda-Moreno, Fernando Siller-López, and José Alfonso Cruz-Ramos. 2023. "Leukocyte Telomere Length Predicts Severe Disability in Relapsing-Remitting Multiple Sclerosis and Correlates with Mitochondrial DNA Copy Number" International Journal of Molecular Sciences 24, no. 2: 916. https://doi.org/10.3390/ijms24020916